Article

Effect of Effective Pressure on the Permeability of Rocks Based on Well Testing Results

by
Evgenii Vasilevich Kozhevnikov
*,
Mikhail Sergeevich Turbakov
,
Evgenii Pavlovich Riabokon
and
Vladimir Valerevich Poplygin
Department of Oil and Gas Technologies, Perm National Research Polytechnic University, Perm 614990, Russia
*
Author to whom correspondence should be addressed.
Energies 2021, 14(8), 2306; https://doi.org/10.3390/en14082306
Submission received: 22 March 2021 / Revised: 7 April 2021 / Accepted: 16 April 2021 / Published: 19 April 2021
(This article belongs to the Section L: Energy Sources)

Abstract

:
During the development of oil and gas fields, the permeability of the reservoirs decreases due to a decrease in reservoir pressure and an increase in effective pressure, as a result of which significant reserves of oil and gas remain in the reservoir. To predict the rate of decrease in oil production rates during field development and to respond quickly, it is necessary to know the law of permeability decrease with an increase in effective pressure. Existing methods for describing the change in the permeability of rocks were analyzed in the paper. Numerical analysis of the results of core studies from previously published papers and the results of field well testing on the examples of the north Perm region oil fields showed that in both cases, regardless of the type of rock and the type of reservoir, the change in permeability can be described by the same equations (exponential and power-law). Obtained equations can be used to predict changes in the permeability of terrigenous reservoirs of the north Perm region oil fields. At the same time, according to the results of well testing, an intensive decrease in permeability is observed with an increase in effective pressure. Analysis of the nature of permeability changes using the Two-Part Hooke’s Model showed that significant irreversible deformations are currently taking place in the formations of the oil fields under consideration. Predicting the change in permeability from effective pressure can allow to optimize the development of oil deposits.

1. Introduction

Permeability is the ability of a medium to pass a liquid or gas through itself in the presence of a pressure drop. Permeable media can be both natural rocks and various manufactory materials. If the permeability of manufactured materials is mainly due to their characteristics and can be set during manufacture [1], then in the case of natural materials, such as rocks, their properties are determined not only by their composition, but also by the condition of their occurrence [2]. Permeable can be both clastic sedimentary deposits and hard rocks in which there are cracks. The permeability of clastic rocks is of greater scientific interest, since it can have an impact in all spheres of human activity [3,4]. Depending on the composition, clastic rocks are: terrigenous, consisting of sandstones, siltstones, mudstones and clays; carbonate, represented mainly by organogenic deposits of limestone and dolomite. Clastic rocks in the initial period of sedimentation are mainly represented by loose media (for example, sandstone, shell rock) with initial-primary porosity and permeability, which are mainly determined by the particle size. In the process of sedimentation, as loose rocks burial, the pressure of the overlying layers increases, the processes of compaction, compression, shear, dissolution, etc. take place. These processes ultimately affect porosity and permeability. Numerous studies have established that for all types of rocks, their permeability and porosity decrease as their depth increases [2,5,6,7,8].
In addition, the change in porosity and permeability of rocks also depends not only on the depth of occurrence, but also on the pressure of the fluid that saturates the rock. For example, at work [9] it is shown that with an increase in the depth of occurrence of terrigenous rocks over 3000 m in conditions of compression without drainage, an anomalous increase in the porosity of rocks occurs. This is due to a decrease in effective pressure and an increase in pore pressure relative to lithostatic (confining) pressure. The use of the term effective pressure was proposed in the work Terzaghi [10]. Later in the works [11,12] it was clarified that the dependence of changes in permeability and porosity described the effective pressure law (EPL):
P e f f = P c n k P f
where: Peff—effective pressure; Pc—lithostatic (confining) pressure; nk—effective stress ratio; Pf—pore fluid pressure.
Later in numerous works [13,14,15,16,17,18,19,20,21,22,23,24,25,26] it was found that the coefficient nk in Equation (1) is not constant and also depends on pressure. The complexity of the determination and the variability of the coefficient nk under various conditions leads to the fact that in most experimental works the effective pressure is the difference of Pc and Pf.
The authors of a large number of scientific works have obtained a large number of methods for determining the change in the permeability of rocks depending on the change in effective pressure, however, most of these methods are based on laboratory studies of rock samples. In some cases, the study of core samples can have significant drawbacks, for example, in the oil industry, the disadvantages of using core material are: (1) increased cost of drilling, since core samples must be extracted from great depths; (2) the limited amount of core material is also associated with the cost of drilling and the technical capabilities of drilling equipment; (3) the selected core samples reflect only a small part of the formation and do not take into account the presence of large cracks in the formation, its heterogeneity; (4) during core sampling, a violation of its natural state occurs, as a result of the removal of natural stresses, which indicates that the core can no longer reflect the actual properties of the formation. However, despite all the disadvantages, this method is widely used to determine the change in reservoir permeability during production.
To assess how the formation behaves as a whole with a decrease in reservoir pressure, it is also possible to use the data on the change in permeability obtained from the results of well testing. The mathematical model presented in [27] and based on pressure build-up curves makes it possible to predict the change in the permeability during the hydrocarbon production. The authors in [28,29,30,31,32,33] also study the nature of changes in fluid filtration in a reservoir as a result of changes in effective pressure and permeability and its relationship with the results of pressure build-ups. In these works, the same approach was used, although the method used is universal but it does not take into account the reservoir properties, the values of the coefficients in the equations are individual for each rock and, possibly, depend on its properties, therefore, additional research is needed in order for this method to be used for predicting permeability of formations with different properties.
In this regard, the purpose of this work is to analyze the existing methods for predicting permeability. And also the establishment of the influence of the parameters of productive formations on the nature of changes in permeability from effective pressure For this, the following was done: in the Section 2 of this article, an analysis of the methods for predicting changes in permeability from effective pressure is given; in the Section 3, based on data from the literature, an analysis of the applicability of existing methods for predicting changes in permeability is carried out; the Section 4 presents the results of studies of changes in permeability based on the results of field well tests on the example of the north Perm region oil fields. The influence of the initial permeability on the nature of changes in the permeability of oil formations is shown.

2. Methods for Determining the Change in the Permeability

Depending on the type of pore space, liquids or gases can be filtered through rocks through pores or cracks. In view of the significant difference in the forces arising during the flow of fluid through pores or cracks, the change in their geometric dimensions due to compression under the action of effective pressure can occur in different ways. Therefore, in this paper prediction techniques reviewed by types of permeable media—for porous and fractured.

2.1. Porous Rocks

A significant number of works [34,35,36,37,38,39,40,41,42,43,44,45,46,47,48,49,50,51,52,53,54,55,56,57,58,59,60,61,62,63,64] are devoted to the study of the changes in the reservoir properties due to effective pressure. The first attempt to describe the influence of the rock pressure on permeability was made in the middle of the 20th century. Based on the data of experimental studies, Tiller [65] established an empirical dependence of the mud cake permeability on the effective pressure:
k = A · P e f f m
where: k—permeability, A and m—effective pressure constants; Peff—effective pressure.
Dobrynin V.M. [11] derived an empirical equation based on the logarithmic relationship between the rock pressure Pc and the coefficient of pore compressibility Cp:
C p = C p m a x log P m a x P c log P m a x P m i n ;   P m a x > P c > P m i n C p = C p m a x ;   P c < P m i n
where: Cp:—pore compressibility; C p m a x —pore compressibility at low pressure ( P c < P m i n ), P m a x —the pressure at which the compressibility is 0, P m i n —pressure at which the compressibility does not change; Pc—lithostatic (confining) pressure. The change in permeability is found by the equation:
Δ k k o = a 1 + a 2 P c + a 3 P c l o g P c
where: ko—initial permeability; Δk—change in permeability; a1, a2, a3—these are constants obtained from P m i n ,   C p m a x   and   P m a x ; Pc—lithostatic (confining) pressure.
Based on the model of porous sandstone, as a medium consisting of same size spherical particles, Gangi [66] established the following dependence of permeability on effective pressure:
k P e f f = k o 1 C o P e f f + P i P o 2 3 4
where: ko—sandstone initial permeability at P = 0; Po = 0.7K, where K is the volumetric modulus of the rock grain; Peff—effective pressure; Pi—some initial pressure, taking into account the presence of cement between sandstone grains; Co—coefficient that takes into account the geometric sizes of pores and grains of rock:
C o = C 1 R r
where: R—radius of a rock particle; r—radius of the pores;
C 1 = 1 2 c o s θ 0 , 5
where: θ—half of the rock grains packing angle, for triangular packing θ = 30°.
Equation (5), proposed by Gangi, is in good agreement with experimental studies carried out by predecessors. However, despite its validity, it has a number of assumptions. The accuracy of predicting permeability is affected by the well sorting of particles that make up the medium, which in real conditions happens quite rarely. The influence of secondary porosity caused by the processes of dissolution of mineral grains or regeneration cement crystallization is not taken into account.
In [67], on the basis of experimental studies, an empirical dependence of the sandstone permeability on the effective pressure was obtained:
k = k o e x p a k e x p P e f f P * 1 1 + C o
where: ko—initial permeability; ak—constant; Peff—effective pressure; P*—decreasing constant, taken equal to 3000 psi; Co—an arbitrary constant taken equal to 3 · 10−6 psi−1.
The simplified exponential dependence of the porous media permeability on the effective pressure, established by the experimental studies [34,35,36,37,38,39,68,69], has the following form:
k = k o e γ P e f f 0 P o
where: ko—initial permeability; Peff0—initial effective pressure; Po—change in pore pressure; γ is a constant showing the permeability dependence on the pressure drop.
In [70], based on empirical data of low-permeability shales tests, Kwon et al. also obtained the equation they used earlier [66] to describe the change in fracture permeability:
k P e f f = k o 1 P e f f P 1 m 3
where: ko—permeability at effective pressure = 0; Peff—effective pressure; P1—effective modulus of elasticity, for shale is taken equal to 19.3 MPa; m—constant (0 < m < 1) characterizing the distribution function of roughness lengths.
In Equation (10), the fracture permeability is replaced by the permeability of the porous medium. Instead of the modulus of elasticity of the fracture roughness, the modulus of elasticity of the shale was used.
Based on experimental studies in [71], the dependence of the change in the permeability of porous mudstone on the effective pressure is presented as:
k = k o P e f f P e f f 0 n
where: ko—permeability at initial effective pressure Peff0; Peff—effective pressure; n—constant that takes into account the orientation of the core sample relative to the rock bedding plane.
In [72], experimental studies of the dependence of the permeability of sandstone and shale obtained from an exploration well of the Taiwan Chelungpu fault Drilling Project (TCDP) on various effective pressures were carried out. Tests results were analyzed by curve fitting with Equations (9) and (11). It was noticed that the use of the power law has a greater correlation in comparison with the exponential dependence.
In [73], the dependence of permeability on volumetric deformation caused by effective pressure was proposed:
k = k o 1 ε ν Φ o a
where: ko—initial rock permeability corresponding to initial porosity Φ o ; a—parameter describing the ratio of porosity and permeability; εν—volumetric deformation of the rock sample.
In work [74], tests of limestone samples were carried out with a change in the effective pressure from 2.5 to 57.5 MPa. According to the test program, the permeability was determined in the modes of increasing and decreasing of effective pressure. As a result of a series of tests carried out, it was found that when the load is removed (the effective pressure decreases), the permeability is not restored to its original values. The level of permeability restoration is largely influenced not by the number of loading/unloading cycles, but by the value of the maximum confining pressure in the cycle. The change in the permeability of limestone samples for the loading cycle is described by the dependence:
k P e f f k P e f f o = 3 2 e P e f f 4 P e f f o
where: k(Peff0) and k(Peff)—permeabilities corresponding to the initial effective pressure Peff0 and effective pressure Peff respectively.
In [17], the permeability of a water-saturated limestone sample under isotropic loading were determined. As a result of tests, an empirical dependence of the sample permeability on the effective pressure was obtained:
k = 3 , 37 · 10 17 · P e f f 0.65
where: Peff—effective pressure.

2.2. Fractured Rocks

Permeability of fractured rocks more depends on effective pressure than porous rocks, because change in permeability is due to the opening or closing of fractures [75].
In work [76] Jones presented an empirical dependence of the permeability of fractured carbonate rocks on the effective pressure:
k = A ( log P h P e f f ) 3
where: A—constant, Ph—fracture closure pressure at which the permeability is 0; Peff—effective pressure.
For fractured sandstone, based on experimental data, Nelson [77] presented his expression for the dependence of fracture permeability on effective pressure:
k f = A + B · P e f f n
where: kf—fracture permeability, A, B and n—constants; Peff—effective pressure.
Using the power dependence Sahimi later came to a similar equation [78]:
k f = A · P e f f b
where: A—coefficient; b—characterizing the intensity of the change in permeability; Peff—effective pressure.
A similar power law was used in [79,80] for the analytical description of the permeability dependence of fractured mudstone on the effective pressure. It is noted that this dependence can be used not only to describe changes in permeability, but also porosity.
The dependence of the horizontal fracture permeability kh on the effective pressure is presented by Snow [81]:
k h = k o + M w 2 S P e f f P e f f o
where: ko—horizontal fracture permeability at initial rock pressure Peff0, w—fracture width, S—distance between fractures, M—proportional modulus of fracture elasticity; Peff—effective pressure.
To establish the dependence of the fracture permeability kf on the effective pressure, Gangi [66] proposed a “board with nails” model:
k f P e f f = k o 1 P e f f P 1 m 3
where: ko—horizontal fracture permeability at pressure = 0; P1—effective modulus of crack roughness; Peff—effective pressure; m—constant (0 < m < 1) characterizing the distribution function of the roughness lengths.
A similar approach to using the “board with nails” model was used by various authors in a later work [22].
The change in the permeability of fractured granite according to experimental studies by Walsh and Brace [82] is described by the equation:
k = ( A · l o g ( P e f f ) + B ) 1 n
where: k—permeability of fractured granite; A, B and n (0 < n < 1/3)—constants obtained empirically; Peff—effective pressure.
This equation does not reveal the nature of the change in fracture permeability, but only interprets the data obtained in experimental studies. The advantage of this equation is that it can also be used to determine the change in pore permeability.
Another equation for the dependence of fracture permeability on effective pressure, derived by Walsh [83], takes into account the mechanical properties of rocks:
k f k o 1 2 h a o l n P e f f P e f f o 3
where: h—root-mean-square value of the crack roughness distribution; ao—crack half-openness; Peff—effective pressure; Peffo—initial effective pressure.
The dependence (21) of the permeability on the effective pressure was in agreement with the experimental data obtained later in [84]. It should be noted that this dependence implies fluid filtration only through a single crack.
For rocks with multiple fractures, Sigal [84] proposed to use the simplest model, which assumes that fractures are located in parallel, and the permeability of the rock is determined as:
k = 1 A i = 1 N k f i
where: A—area of the rock sector; N—number of cracks crossing the area A; kfi—permeability of individual fractures.
Transforming Equation (22) Sigal obtained the following equation:
k 1 A p i k o i 1 2 h a o l n P e f f P o 3
The resulting equation is rather complicated, therefore, in order to simplify it, it is assumed that, firstly: A(p) is a constant value for hard rocks; secondly: the value of h/a—depends on the properties of the rock and does not change from crack to crack. Thus, the equation is obtained:
k = A + B · l n P e f f
where: A and B are constants; Peff—effective pressure.
The resulting Equation (24) provides a high convergence of the calculated results with the experimental data published in [26,76] for hard rocks.
In [85], the results of experimental studies showed that the main decrease in the width of an artificial fracture and its permeability occurs with an increase in effective pressure from 0 to 0.6 MPa, with a further increase, the permeability depends less on the effective pressure. This means that rock permeability is more stress sensitive at low effective stress, and naturally fractured specimens should be used for tests.

2.3. Conclusions on the Methods for Determining the Change in Permeability

Analysis of the existing methods for determining the change in the rock’s permeability depending on the effective pressure showed that at the early times researchers attempted to describe the changes in permeability (on microlevel) by rock’s elastic and structure properties while significant assumptions were made, which eventually led to the use of some empirical coefficients in the equations. Later, in most cases, researchers used mainly empirical dependences obtained by curve fitting of the experimental results. The use of curve fitting analysis is in good agreement with the equations derived by earlier research works, in which much attention was paid to the elastic properties of rocks.
Depending on the type of void space—pore or fractured—the change in permeability from the effective pressure can occur in different ways and can be described by different equations. However, a review of previous research works has shown that the same equations can be used to predict the change in permeability both in porous and fractured media. The most widespread equations for describing the change in permeability from the effective pressure are exponential and power laws.

3. Changes in the Rocks Permeability Based on the Laboratory Studies

The results of laboratory studies of rocks’ permeability dependences on the effective pressure are reflected in numerous scientific works. The essence of the work is to carry out filtration tests of core samples at varying injection or confining pressures.
For the analysis, the results of laboratory studies, published in the earlier scientific papers, were used. The data from the literature were selected according to the following criteria: the procedure for conducting experimental studies should be fully described with an indication of the types of filtration tests during a loading or unloading cycle. For the analysis, the data were taken during the loading cycle (increasing the effective pressure). The work should indicate the place of origin of rock samples, with a description of their properties, reservoir type, permeability, depth, initial effective pressure. The research results should be presented in tabular or graphical form, if the results are given in absolute values, then the initial permeability and effective pressure are used to convert to relative values. Since it was established in Section 2 that universal equations can be used to describe the change in permeability regardless of the type of rock and permeability, data from different rocks with a wide range of permeability were analyzed. This made it possible to establish the dependence of the nature of the change in permeability on the initial permeability of rocks. Reviewed works present results of studies of various rocks: sandstone, shale, mudstone, limestone.
For a comparative assessment of the effect of changes in reservoir pressure on permeability, the study data were normalized—the permeability is given in dimensionless form: k/ko is the relative permeability, k is the permeability at the effective pressure Peff, ko is the permeability at the initial (minimum) effective pressure Peff0. Depending on the conditions of experimental studies in the reviewed works, the initial effective pressure was taken to be from 0.1 to 3 MPa.
Graphs of changes in the relative permeabilities of rocks are presented in Figure 1 and Figure 2, which show that the change in the relative permeability from the effective pressure for terrigenous rocks is approximately the same regardless of the type of rock, which is due to the same nature of filtration—through the pores. In carbonate rocks, there is a significant dispersion in the degree of the curves slope: for samples with cracks, a more intense decrease in permeability than for porous samples. This is due to the fact that fracture permeability is more sensitive to changes in confining pressure than the pore medium.
The shape of the curves in Figure 1 and Figure 2 can be explained on the basis of the Two-Part Hooke’s Model (TPHM), which is described in detail in [90]. The essence of the model is that the rock is represented in the form of two springs of different stiffness (Figure 3) Soft spring and Hard spring. Dividing the rock into two components that behave differently under loading allows to take into account the heterogeneity of the rock. The Soft part characterizes the presence of micropores and cracks, which are highly sensitive to the applied load in the initial period of loading and are capable of significant deformations up to collapse. The sensitivity of the formation to changes in effective pressure is determined by the steep slope of the permeability change curve (Figure 4). And the Hard part determines the rigidity of the rock skeleton, and provides a monotonic linear decrease in permeability with an increase in effective pressure. The transition of deformations of rocks from Soft to Hard state (Figure 4) is characterized by a certain value of effective pressure, the value of which is usually determined by the depth of natural bedding of the rock [89].
Figure 1 shows that most of the selected terrigenous rocks exhibit soft part properties, that is, there is a significant decrease in permeability with a small increase in effective pressure, it is also noticeable that the curves are characterized by flattening with an increase in effective pressure. At the same time, the curves of permeability of sandstone (TCDP) and Mudstone (Yingcheng) look monotonically decreasing starting from the value of the effective pressure of more than 30 MPa, which exceeds the effective pressure caused by the conditions of their natural occurrence. It is logical to assume that the boundary of the transition from Soft to Hard deformation should depend on the initial depth of bedding, however, using the example of Sandstone (Xuzhou), which also occurs at shallow depths, it can be seen that the change in its permeability from the effective pressure occurs significantly at the initial moment of loading. Thus, the transition value of the effective pressure, in addition to the depth of occurrence, is influenced by permeability.
On the example of carbonate rocks (Figure 2), there is a significant difference in the slope angles of the permeability change curves. The predominance of the number of monotonically decreasing curves corresponds to hard deformation, presumably due to the fact that dense rocks have fewer natural defects in contrast to terrigenous granular rocks; therefore, the extent of areas where soft deformations are observed is small [91].
Specimens with cracks are characterized by the presence of steeply dipping sections of the permeability curves, which is caused by a significant compaction of cracks with an increase in the effective pressure in the initial period of loading. However, it is not possible to unequivocally judge the effect of fractures on the nature of permeability changes due to the large scatter of data. Therefore, it is necessary to determine the influence of other parameters of rocks on the change in permeability.
By curve fitting analysis performed by the authors of this work based on the experimental data from previously published papers, it was found and confirmed that the change in the relative permeability of porous samples and samples with cracks from the effective pressure is equally well described by power law and exponential equations, that converges with predecessors’ results [91,92,93]:
k / k o = A · e γ P e f f
where: k/ko—normalized permeability; Peff—effective pressure; A—coefficient; γ—exponent.
k / k o = B · P e f f n
where: k/ko—normalized permeability; Peff—effective pressure; B—coefficient; n—exponent.
In exponential equations, the rate of change in permeability from the effective pressure is characterized by coefficient A and exponent γ, in power law equations—by coefficient B and exponent n. The values of the coefficients and exponents of equations (25) and (26) are presented in the table (Table 1). Analysis of the calculated values of the coefficients and exponents of power and exponential equations (Table 1) showed that regardless of the rock’s type, the coefficients and exponents of equations (25) and (26) decrease with increasing rock permeability (Figure 5). This indicates that more permeable rocks are less sensitive to changes in effective pressure. This is consistent with the results of studies pore compressibility [94], which states that larger pores have less compressibility. This is due to the fact that compressibility characterizes the relative change in the volume of the rock, while small pores collapse faster than larger ones. Although no clear equations were obtained from Figure 5, the graphs show a general tendency towards a decrease in the coefficients of the equations (25) and (26) from permeability, from this follows that low-permeability formations are more sensitive to changes in pore pressure during hydrocarbon production.
Based on the analysis of data from previously published papers, it was found that the dependences of changes in the permeability of porous and fractured rocks can be equally well described by exponential or power equations. The choice of the type of equation is carried out by fitting the experimental data. The coefficients and exponents of best fitted equations characterize the intensity of the change in permeability from effective pressure, and mainly depend only on the initial permeability. In spite of all their shortcomings and inaccuracies, laboratory methods of core research allow to visually obtain the dependence of the change in permeability on the effective pressure, and also allow changing the experimental conditions in a wide range, the values of reservoir and rock pressures can be controlled in a wide range, it is possible to change the properties of the fluid, and temperature conditions. However, to fully understand what is happening with the reservoir permeability in real conditions, it is necessary to conduct field well tests, which will be discussed in more detail in the next section.

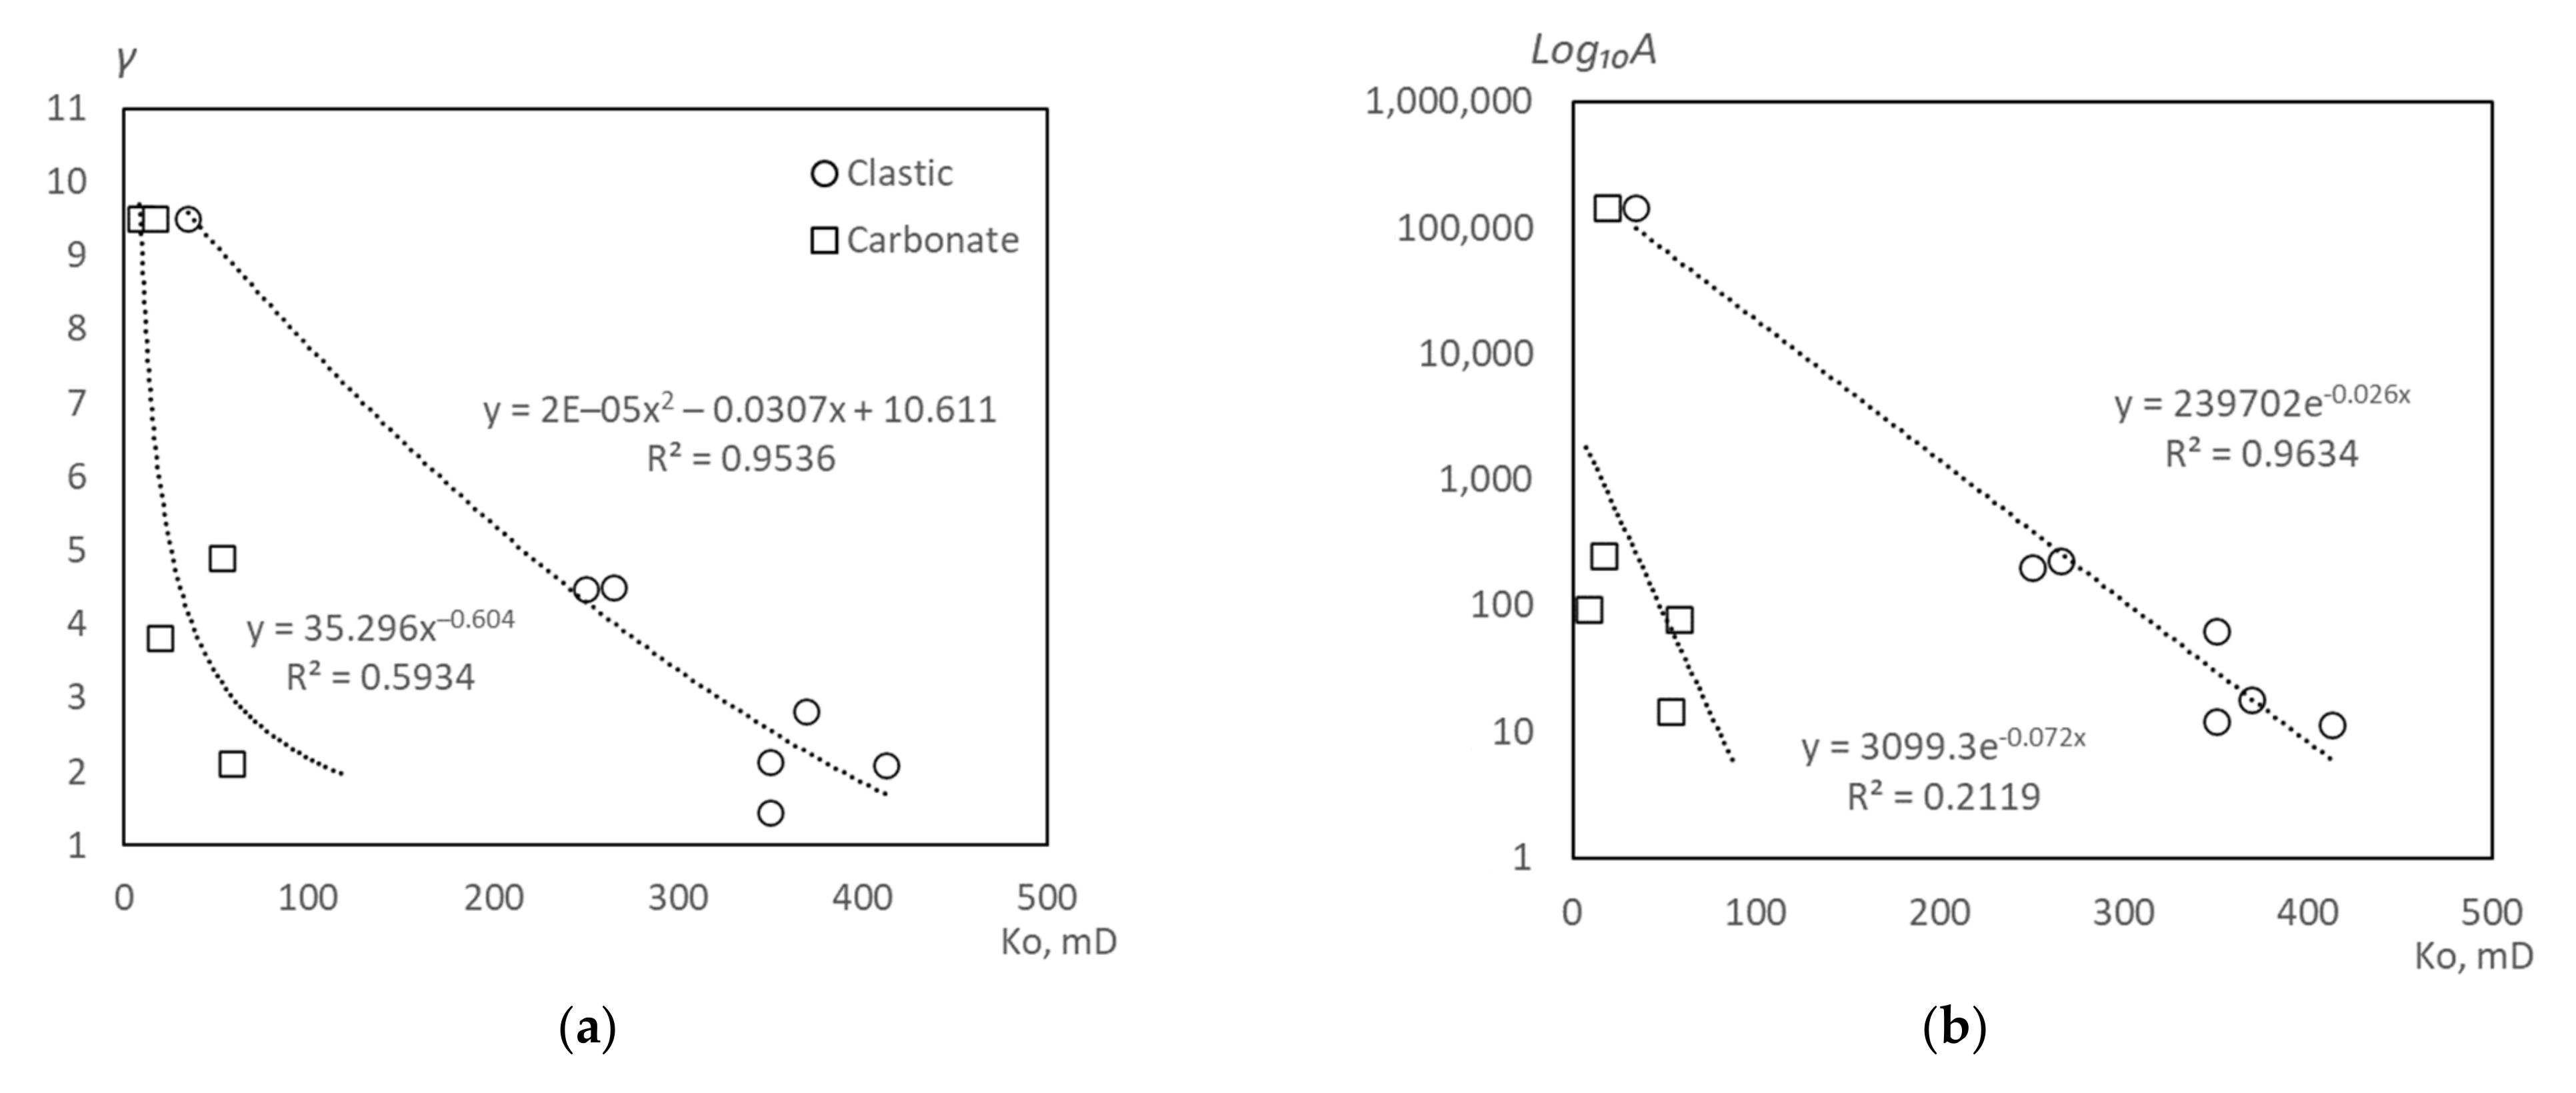
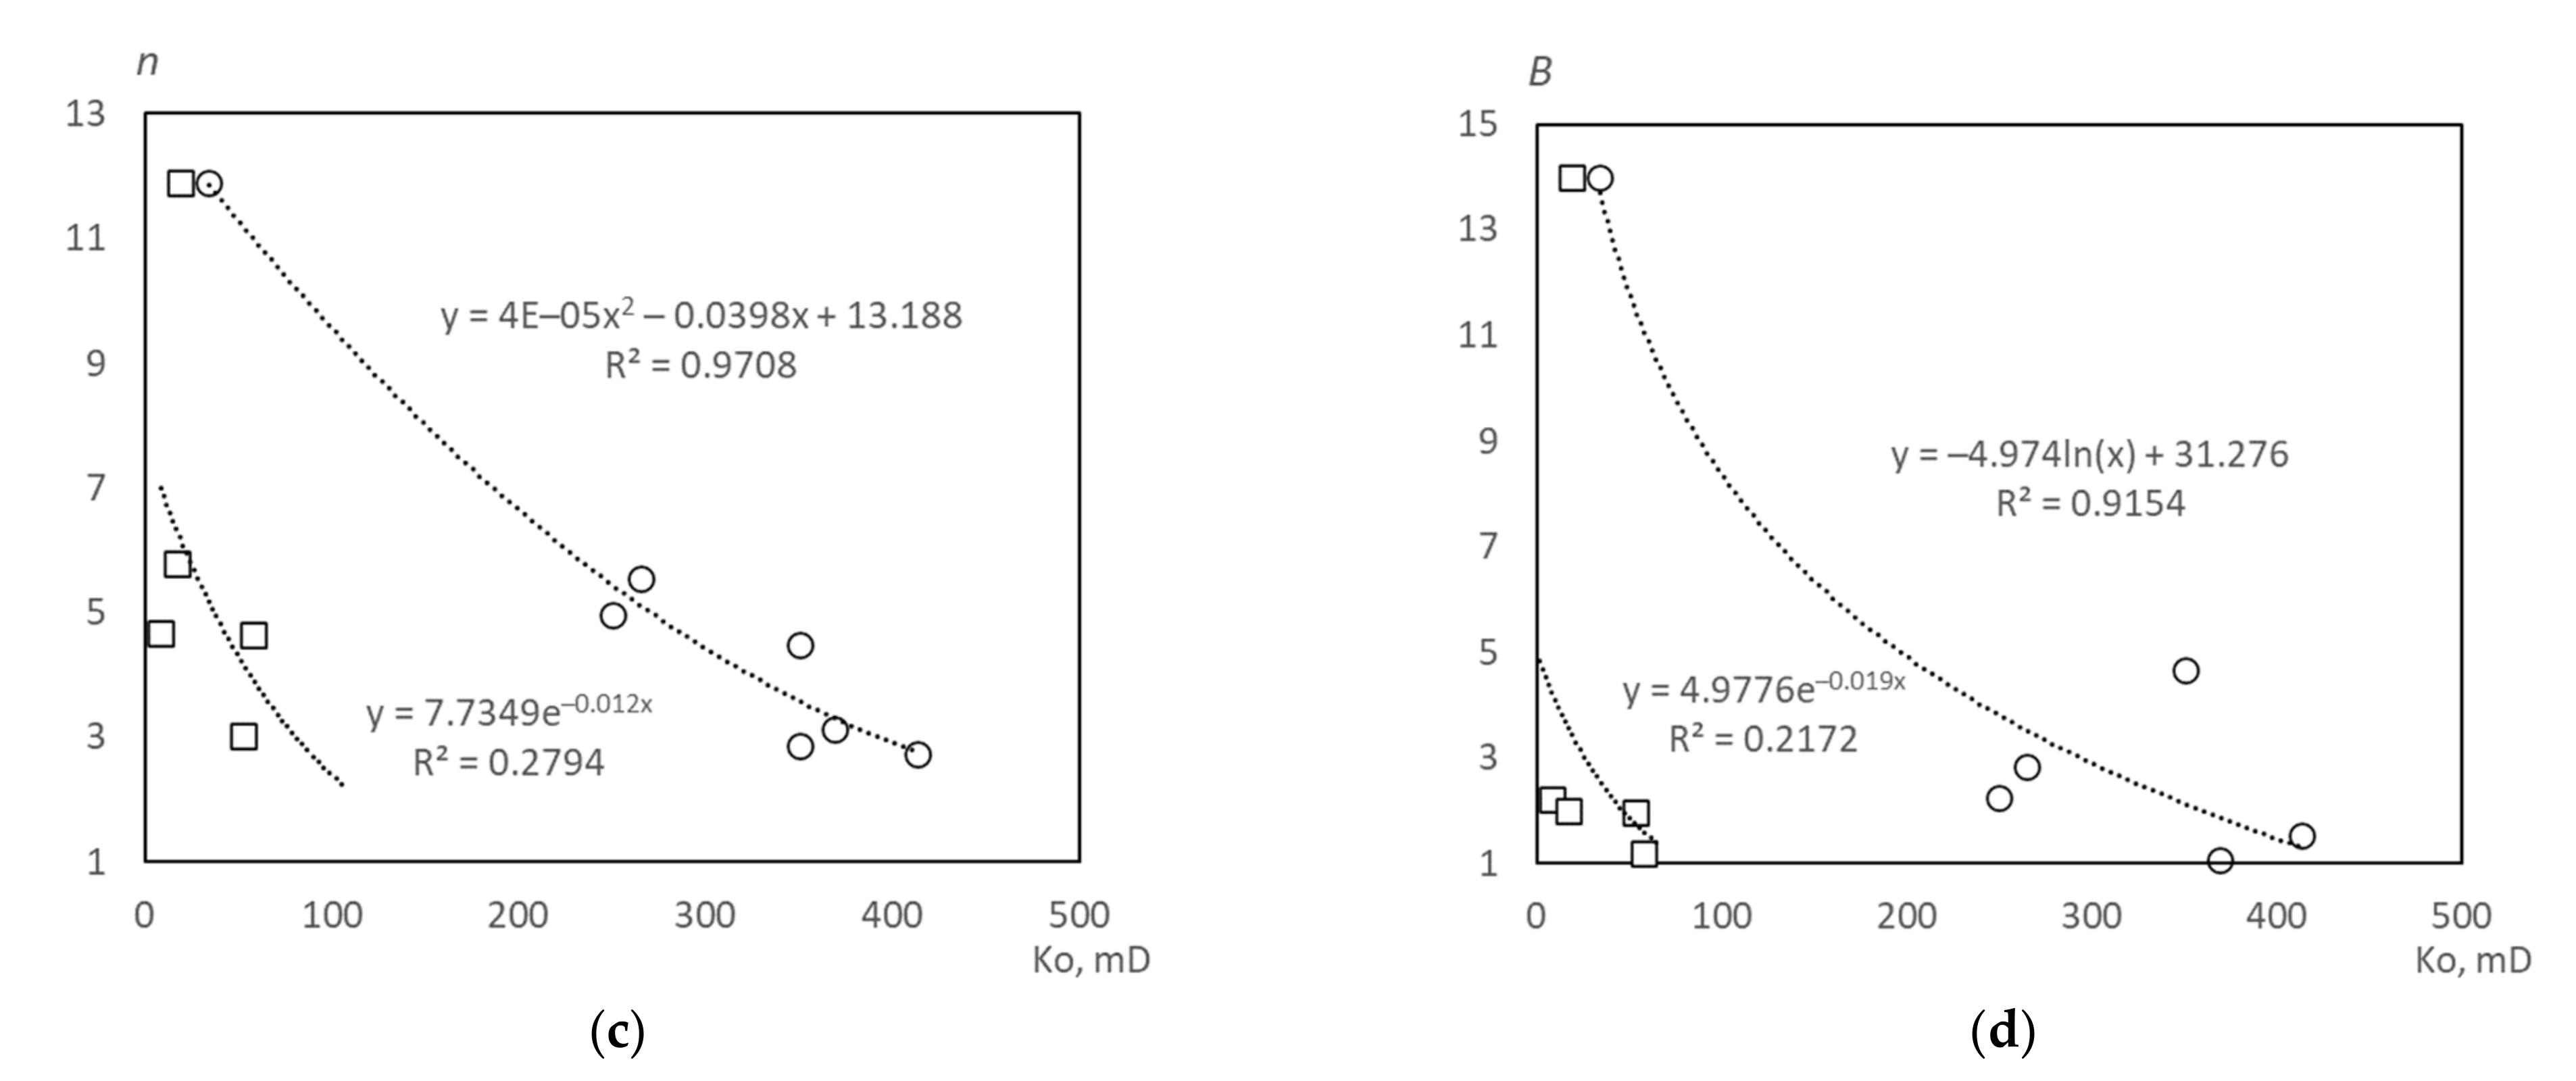
4. Changes in the Rocks Permeability Based on the Field Well Tests

For field development models, permeability values obtained in laboratory studies, as well as from well test data, are used. It is known that the permeability of reservoirs during development can change and depends on the effective pressure, therefore, for the reliability of forecasts of oil production, the curves of changes in permeability on the effective pressure can be used. Moreover, such curves are usually obtained in laboratory tests. Laboratory tests the influence of effective pressure on the permeability of rocks are characterized by the purity of the experiment and the exclusion of factors that can negatively affect the accuracy of the results. For filtration tests, a fluid of a certain composition is usually selected, and the core sample has uniform properties. In addition, when extracting rock samples from natural bedding conditions, the initial stress-strain state is disturbed and the core does not reflect the real properties of the formation. The results of laboratory studies do not show the general properties of the reservoir and only give an idea of the properties of one of the permeable interlayers; natural fracturing and uneven inflow are not taken into account. Also, the change in the permeability of the formation can be influenced by the degassing of oil and water penetration. In this regard, to determine the change in reservoir permeability on pressure, it is necessary to conduct research directly in the wells. In practice, field well tests are widely used to determine the reservoir properties and pressure [95].
To determine the change in the permeability of productive layers from changes in reservoir pressure, data from field well tests were used. The paper considers data from the north Perm region oil fields: Arkhangelskogo, Sibirskoe, Unvinskoe, Chashkinskoe, Yurchukskoe. These deposits are located close to each other and belong to the same geological structure—the Solikamsk depression, therefore the geological and physical characteristics of the reservoirs and fluids are approximately the same. In the fields under consideration, the main layers from which oil production is carried out are:
-
carbonate layers C1t and D3fm are represented by fine-crystalline limestones, partially dolomitized. Due to the blurring of boundaries, the C1t and D3fm layers are combined into one production reservoir. The depth of the layers top is ranging from 2030 to 2400 m, the porosity is ranging from 7.1 to 12%, the permeability is ranging from 0.009 to 0.08 μm2, the initial reservoir pressure is ranging from 20.9 to 25 MPa.
-
terrigenous layers C1bb are represented by interbedded uneven-grained sandstones, siltstones and mudstones. The depth of the layers top is ranging from 2030 to 2350 m, the porosity is ranging from 14 to 18%, the permeability is ranging from 0.239 to 0.522 μm2, the initial reservoir pressure is ranging from 19.8 to 24.4 MPa.
-
carbonate layers C2b are represented by fine-grained limestones, dolomitized areas, with stylolite seams. The depth of the layers top is ranging from 1734 to 2104 m, the porosity is ranging from 9.7 to 16%, the permeability is ranging from 0.017 to 0.111 μm2, the initial reservoir pressure is ranging from 19.8 to 24.4 MPa.
The main parameters used are:
Confining (lithostatic) pressure Pc is the pressure exerted on the reservoir due to the weight of the overlying rocks is found as:
P c = ρ g h
where: ρ —average density of the overlying rocks ≈ 2500 kg/m3, h—depth of the top of the productive layer.
Reservoir (pore) pressure—fluid pressure in the pores of the reservoir Pf.
Effective pressure (Peff)—difference between lithostatic pressure and formation pressure:
P e f f = P c P f
where: Peff—effective pressure; Pc—lithostatic (confining) pressure; Pf—pore fluid pressure.
For the analysis, we used the data of field well tests carried out immediately after drilling, in the initial period and after some time of production well operation. Pressure build-up tests were used as the field well test method for the formation permeability and pressure determining. The essence of the pressure build-up tests is to monitor the growth of bottomhole pressure after a well shut-in. The use of this method is due to several reasons: in spite of the fact that the wells are new, however, due to the geological features in some wells, the reservoir energy is not enough for natural flowing, which makes it difficult to use steady-state flow tests; the use of pressure build-up allows to quickly assess the reservoir permeability and reservoir pressure in artificial lift wells with minimal nonproductive time, which is very important for an oil production company. Results of build-up tests were analyzed with help of Horner and Miller-Dyes-Hutchinson (MDH) methods in which the formation pressure and permeability are determined from the rate of bottomhole pressure growth [96,97,98,99]. When flowing a single-phase medium to the bottom of the well, the permeability reflects the phase permeability for this type of fluid.
After processing the historical and current well test data, the permeability was normalized in relation to the initial permeability—k/ko, where k is the permeability at the current effective pressure Peff, ko is the initial permeability determined at the beginning of well production time. On the basis of the received data curves of relative permeabilities on effective pressure are built, for comparison the curves are plotted on the same graph with data obtained from published papers (Figure 6). For comparison, we selected the results of tests on samples and wells with approximately the same permeability—in the range from 3 to 94 mD. We also used the data of laboratory tests of core samples from the Shershnevskoye field [87], which is geographically located in the same area as the considered field. The core of the Shershnevskoye field was taken from the carbonate formation C1t-D3fm.
Comparative analysis of the permeability on effective pressure showed that the decrease in permeability in reservoir conditions occurs more intensively (Figure 6). It can be seen from the graph that the permeability of oil reservoirs in real conditions decreases most intensively with a relatively small increase in effective pressure, for example: for a carbonate reservoir C1t-D3fm of the Siberian field, an increase in effective pressure by 2 MPa leads to a decrease in permeability by almost two times, in practice it is means that with a decrease in reservoir pressure by 2 MPa, the flow rate of the well, while all other things being equal, decreases by half. Therefore, reservoir pressure control in the fields must be constant and not allow to lower the reservoir pressure too low. Other factors can influence the permeability of rocks: the precipitation of paraffins, salts, a decrease in the phase permeability of oil due to the penetration of gas or water. However, these factors were excluded since the analysis was based on data gathered from wells that meet the following conditions:
(1)
Reservoir pressure near the well should not decrease below the oil gas saturation pressure during the period under consideration.
(2)
The well should produce the same fluid as in the initial period of the operation, the water cut should not exceed 5%.
(3)
No enhancing of oil recovery methods should be applied on the well during the period under consideration.
The analysis of the calculated coefficients (Table 2) and exponents of the fitted Equations (25) and (26) for field well tests was also carried out. Behavior of the coefficients and exponents (Figure 7), characterizing the intensity of permeability reduction on the initial permeability of rocks, correlates well with the results of the analysis of laboratory data from other researchers (Figure 5) and the conclusions of [85], which states that the larger pores have less compressibility. This is the same for both terrigenous and carbonate layers.
It was also found that the coefficients and exponents determined according to the field well test data (Table 2) significantly exceeded the indicators and coefficients of the equations for the curves constructed according to laboratory data (Table 1), which indicates a greater sensitivity of the reservoir permeability in real conditions to changes in effective pressure. Significant differences can be explained by the following reasons:
(1)
Determination of permeability using field well tests reflect the integral permeability of the formation, taking into account its zonal and layered heterogeneity. A decrease in reservoir pressure leads to the closure of fractures, disconnection of individual interlayers, as a result, the total permeability of the reservoir decreases sharply.
(2)
The selected core material, after being extracted from the well and natural stress relief, undergoes significant changes in the form of volumetric deformations and can no longer reflect the actual properties inherent in the original conditions of its bedding.
(3)
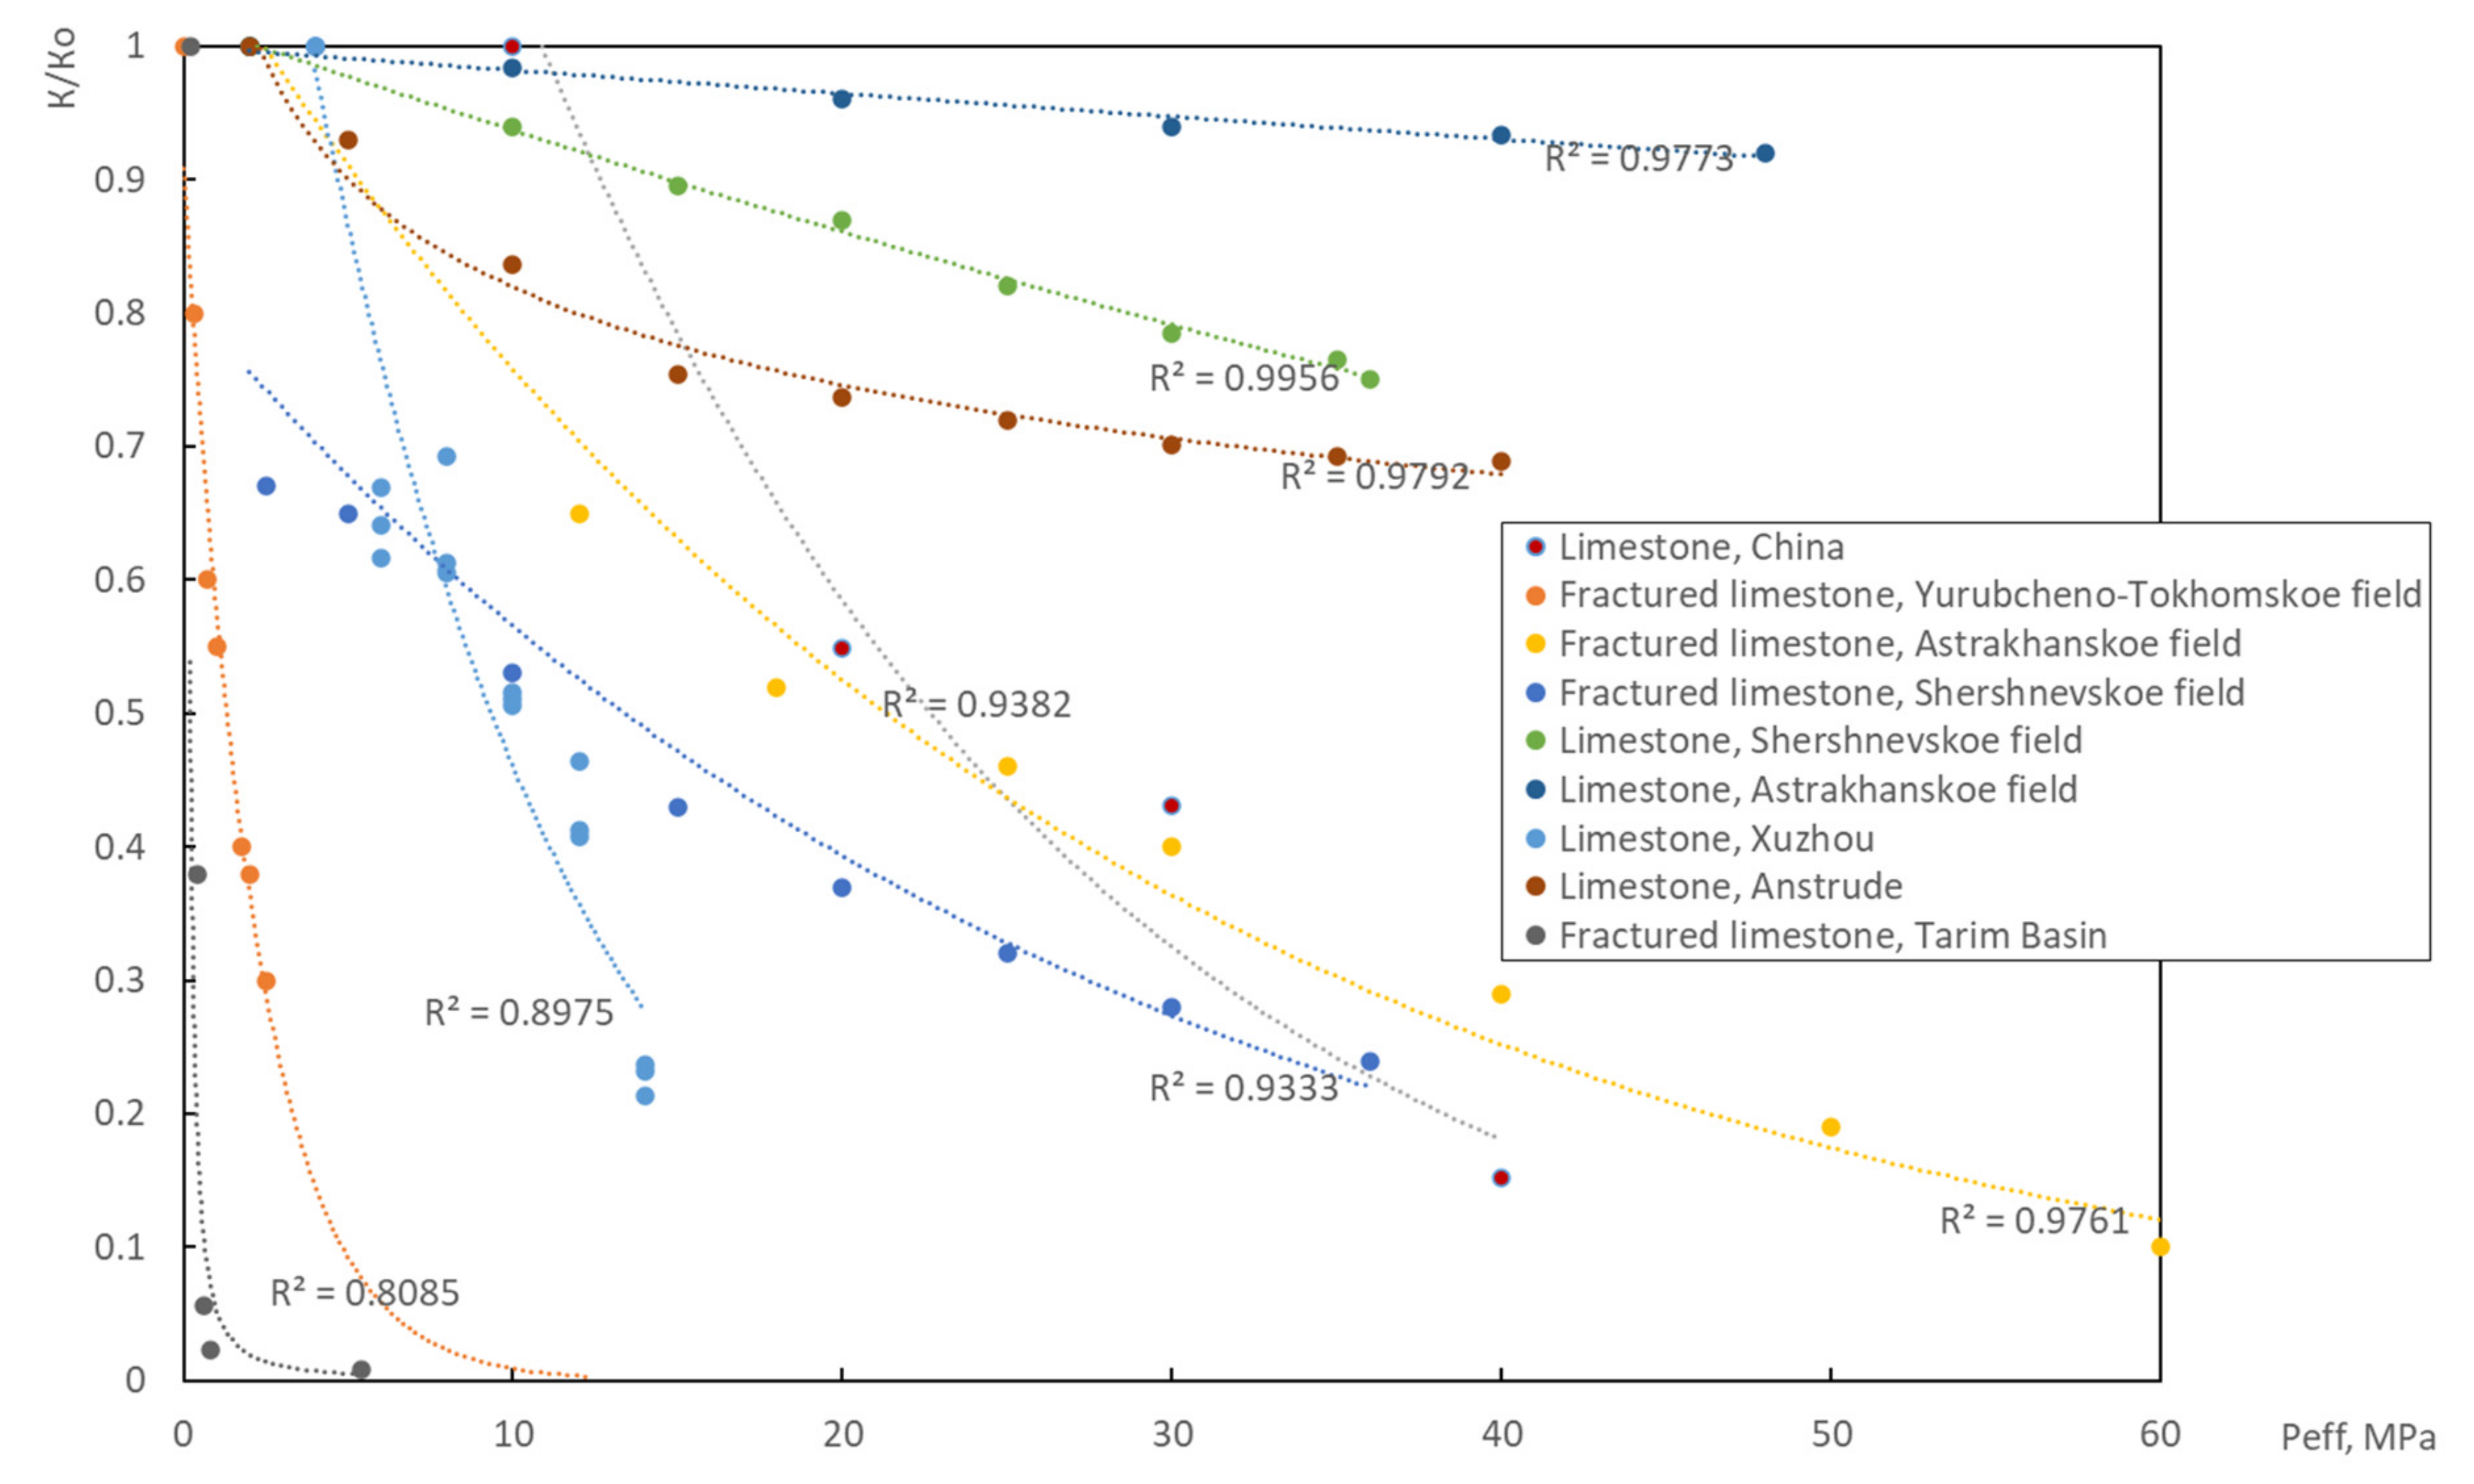
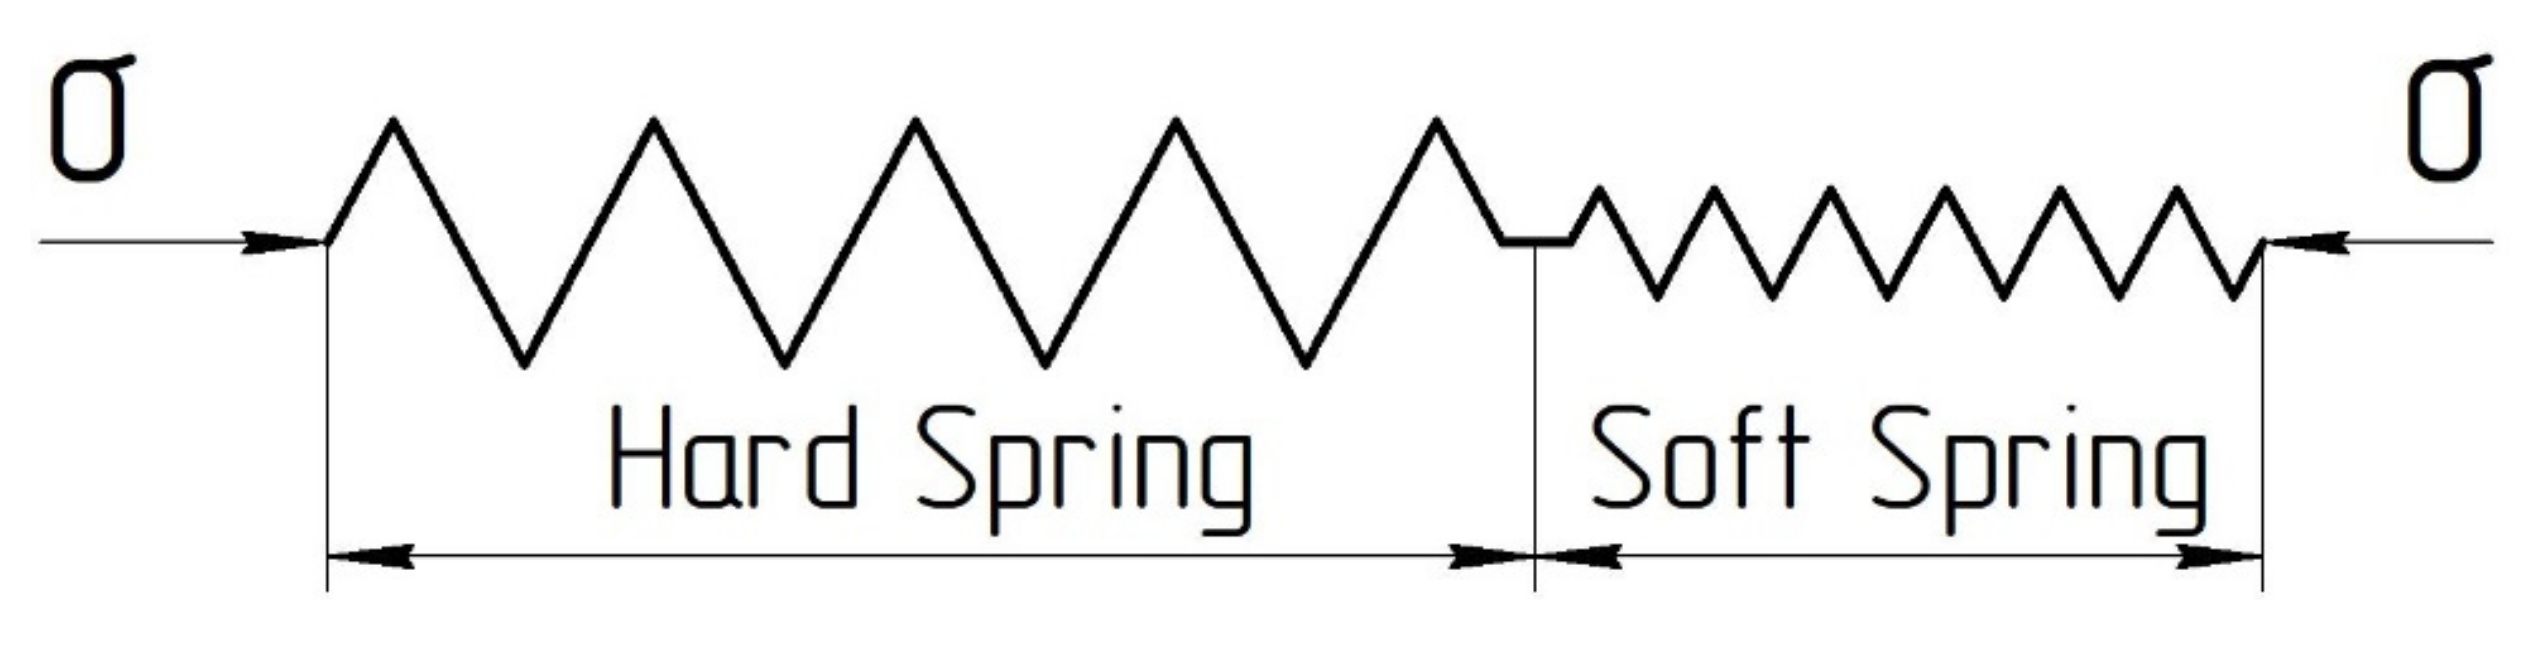
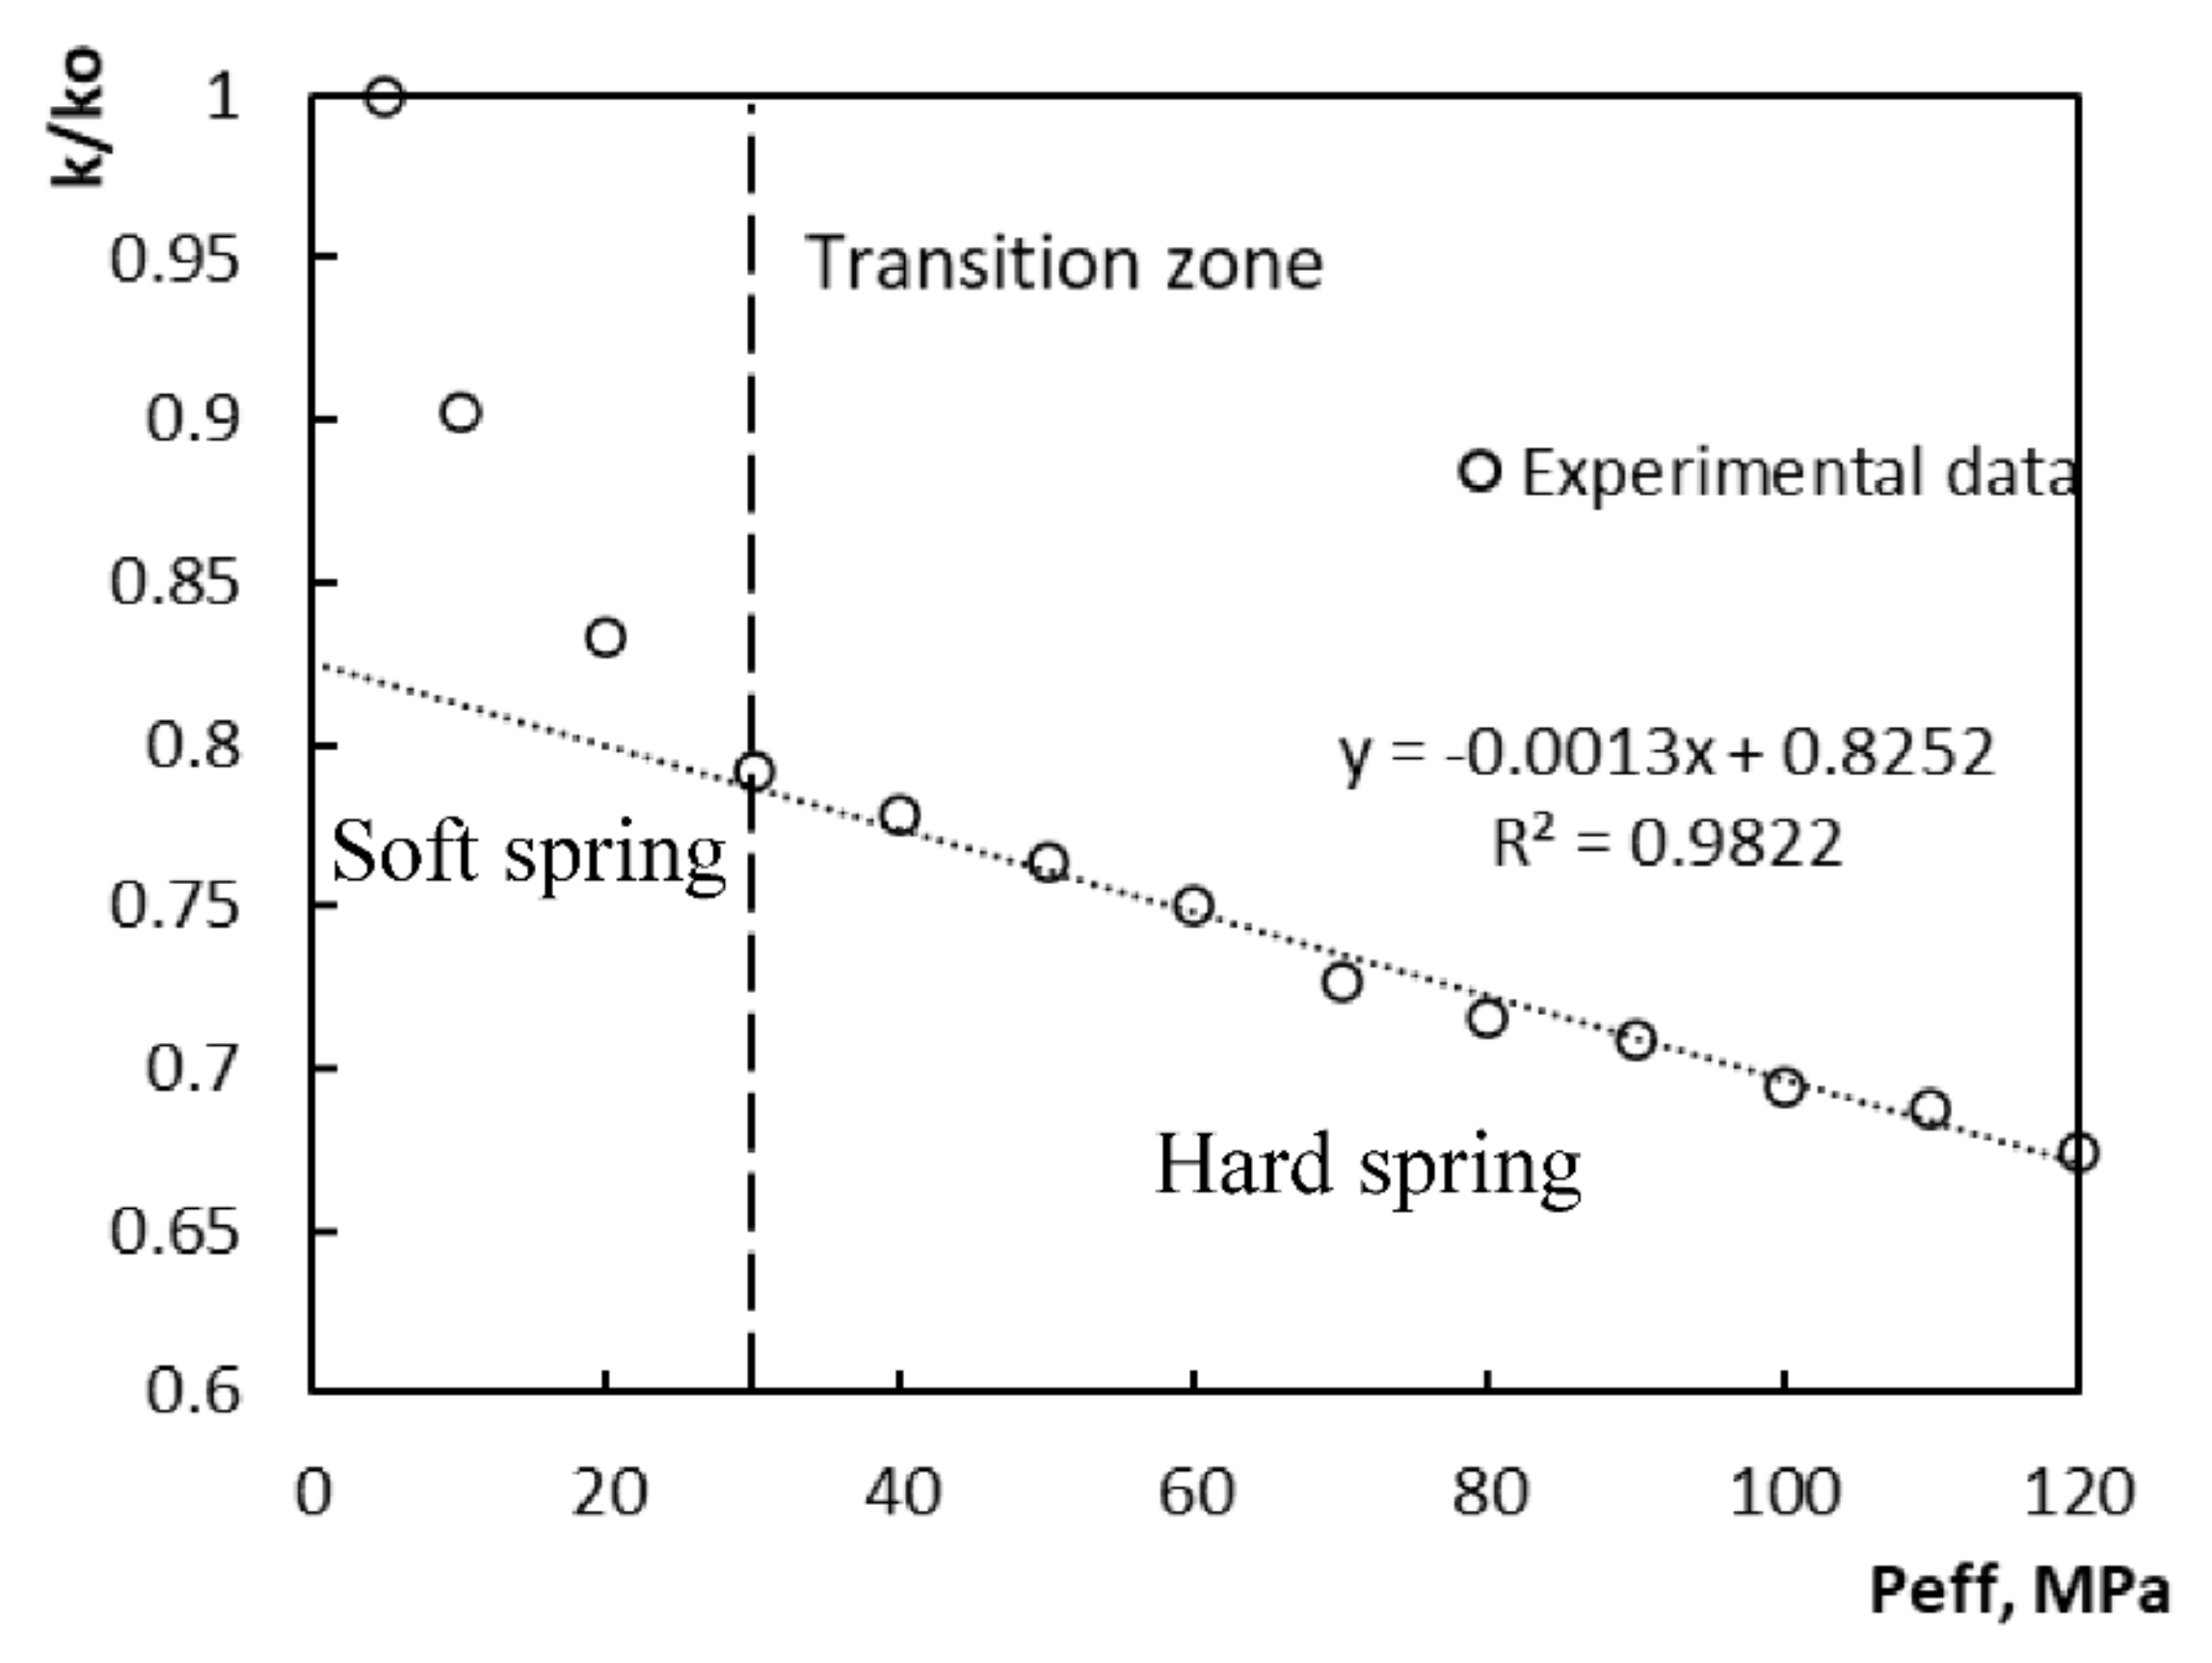
The Two-Part Hooke’s Model can also be used to illustrate this change in permeability. On the basis of this model, it can be concluded that significant irreversible deformations are currently taking place in the formations of the oil fields indicated in Figure 6, as evidenced by a critical decrease in permeability with an increase in effective pressure. This fact suggests that significant oil reserves can be permanently lost in the reservoir. In this regard, predicting changes in permeability is an urgent task.
As a result of the analysis of the coefficients and exponents from Table 2, equations were obtained that describe their relationship with the initial permeability of the terrigenous formation:
γ = 2 · 10 5 · k o 2 0.03 · k o + 10.61 ;             R 2 = 0.95
A = 239702 · exp 0.026 · k o ;             R 2 = 0.96
n = 4 · 10 5 · k o 2 0.04 · k o + 13.19 ;             R 2 = 0.97
B = 4.97 · ln k o + 31.27 ;             R 2 = 0.91
where: ko—initial permeability; A and B—coefficients; n and γ—exponents.
These equations can be used to determine the coefficients and exponents of equations (25) and (26), to predict changes in the permeability of reservoirs in the north Perm region oil fields. It should be noted that this method of predicting permeability changes is more preferable for terrigenous rocks, since equations (29)–(32) have large R2 coefficients—in the range from 0.91 to 0.97.
For carbonate reservoirs, the dependences of the coefficients and exponents of equations (25) and (26) on the initial permeability are described by equations with low R2 values, so their use is not recommended.
Prediction of changes in permeability from effective pressure can allow optimizing the development of oil deposits in the north Perm region oil fields. This work indicates the high importance of constant monitoring of reservoir pressure and the need to take urgent measures when it is reduced, which will help maintain oil production rates at new wells and sidetracks, and ultimately increase the overall oil recovery of the reservoir.

5. Conclusions

Analysis of the existing methods for predicting permeability shows that today, to predict the permeability of reservoirs, equations obtained on the basis of laboratory tests of rock samples and field well tests are used. Determination of the effect of effective pressure on rock permeability using core has drawbacks: (1) increased cost of drilling operations, since core samples must be extracted from great depths; (2) the limited amount of core material is also associated with the cost of drilling and the technical capabilities of drilling equipment; (3) the selected core samples reflect only a small part of the formation and do not take into account the presence of large cracks in the formation, its heterogeneity; (4) during core sampling, a violation of its natural state occurs, as a result of the removal of natural stresses, which indicates that the core can no longer reflect the actual properties of the formation. However, despite all the disadvantages, this method is widely used to determine the permeability of productive formations. Laboratory methods of core analysis allow changing the experimental conditions in a wide range, the values of pore and lithostatic pressures can be regulated in a wide range, it is possible to change the properties of the liquid, as well as the temperature conditions. However, to take into account the real change in the formation permeability, it is better to use the data obtained during well testing. Conducting direct tests on wells allows to take into account the individual characteristics of the formation around the well and reflects the actual conditions.
Based on curve fitting analysis of literature data on core tests of different rocks confirmed that for describing of changes in the permeability of fractured and porous rocks, exponential equations and a power law can be used. In exponential equations, the rate of change in permeability from the effective pressure is characterized by a coefficient A and exponent γ, and in power law equations—by a coefficient B and exponent n. Analysis of the calculated values of coefficients and exponents made it possible to establish the dependence of permeability on the initial permeability of rocks. Although no clear equations have been obtained, the graphs show a general tendency towards a decrease in the coefficients and exponents on permeability, from this follows that low-permeability formations are more sensitive to changes in pore pressure during hydrocarbon production.
To compare the results of laboratory studies of predecessors with real processes in oil reservoirs, data from well tests from the north Perm region oil fields were used. For the analysis, we used the data of field well tests carried out immediately after drilling, in the initial period and after some time of production well operation. Pressure build-up tests were used as the field well test method for the formation permeability and pressure determining. As a result of the analysis, it was found that the decrease in permeability in reservoir conditions occurs more intensively than was shown by previous works on the basis of laboratory tests. Analysis of the nature of permeability changes using the Two-Part Hooke’s Model showed that significant irreversible deformations are currently taking place in the formations of the oil fields under consideration, as evidenced by a critical decrease in permeability with an increase in effective pressure. Changes in reservoir permeability are best fitted by exponential and power law equations. Analysis of the equation’s coefficients and exponents demonstrated the sensitivity of low-permeability reservoirs to pressure changes and made it possible to obtain equations that can be used to predict changes in the permeability of terrigenous reservoirs of the north Perm region oil fields. Predicting the change in permeability from effective pressure can allow to optimize the development of oil deposits. This work indicates the high importance of constant monitoring of reservoir pressure and the need to take urgent measures when it is reduced, which will help maintain oil production rates at new wells and sidetracks, and ultimately increase the overall oil recovery of the reservoir.

Author Contributions

E.V.K. conceptualization; M.S.T. methodology; E.P.R. formal analysis, software, visualization; V.V.P. data curation, funding acquisition. All authors have read and agreed to the published version of the manuscript.

Funding

This research was funded by RUSSIAN SCIENCE FOUNDATION, Project No. 19-79-10034.

Institutional Review Board Statement

Not applicable.

Informed Consent Statement

Not applicable.

Data Availability Statement

Not applicable.

Conflicts of Interest

The authors are aware of the ethical responsibilities, and they declare that they have no conflict of interest.

Abbreviations

Peffeffective pressure
Peff0initial effective pressure
Pclithostatic (confining) pressure
Pfpore fluid pressure
nkeffective stress ratio
kpermeability
koinitial permeability
ρaverage density of the overlying rocks
hdepth of the top of the productive layer
Acoefficient of exponential equation
γexponent of exponential equation
Bcoefficient in power law equations
nexponent in power law equations

References

  1. Xiao, B.; Zhang, Y.; Wang, Y.; Jiang, G.; Liang, M.; Chen, X.; Long, G. A fractal model for kozeny–carman constant and dimensionless permeability of fibrous porous media with roughened surfaces. Fractals 2019, 27. [Google Scholar] [CrossRef]
  2. Ehrenberg, S.N.; Nadeau, P.H. Sandstone vs. carbonate petroleum reservoirs: A global perspective on porosity-depth and porosity-permeability relationships. AAPG Bull. 2005, 89, 435–445. [Google Scholar] [CrossRef] [Green Version]
  3. Xiao, B.; Zhang, X.; Wang, W.; Long, G.; Chen, H.; Kang, H.; Ren, W. A fractal model for water flow through unsaturated porous rocks. Fractals 2018, 26. [Google Scholar] [CrossRef] [Green Version]
  4. Xiao, B.; Fan, J.; Ding, F. Prediction of Relative Permeability of Unsaturated Porous Media Based on Fractal Theory and Monte Carlo Simulation. Energy Fuels 2012, 26, 6971–6978. [Google Scholar] [CrossRef]
  5. Anselmetti, F.S.; Luthi, S.; Eberli, G.P. Quantitative characterization of carbonate pore systems by digital image analysis. AAPG Bull. 1998, 82, 1815–1836. [Google Scholar]
  6. Bjørlykke, K.; Høeg, K. Effects of burial diagenesis on stresses, compaction and fluid flow in sedimentary basins. Mar. Pet. Geol. 1997, 14, 267–276. [Google Scholar] [CrossRef]
  7. Bjørlykke, K. Fluid flow in sedimentary basins. Sediment. Geol. 1993, 86, 137–158. [Google Scholar] [CrossRef]
  8. Woody, R.E.; Gregg, J.M.; Koederitz, L.F. Effect of texture on petrophysical properties of dolomite: Evidence from the Cambrian-Ordovician of southeastern Missouri. AAPG Bull. 1996, 80, 119–132. [Google Scholar]
  9. Bloch, S.; Lander, R.H.; Bonnell, L. Anomalously high porosity and permeability in deeply buried sandstone reservoirs: Origin and predictability. AAPG Bull. 2002, 86, 301–328. [Google Scholar]
  10. Terzaghi, K. Principles of soil mechanics. Eng. News-Rec. 1925, 95, 987–990. [Google Scholar]
  11. Dobrynin, V.M. Effect of Overburden Pressure on Some Properties of Sandstones. Soc. Pet. Eng. J. 1962, 2, 360–366. [Google Scholar] [CrossRef]
  12. Fatt, I. The Biot-Willis Elastic Coefficients for a Sandstone. J. Appl. Mech. 1959, 26, 296–297. [Google Scholar]
  13. Nur, A.; Byerlee, J.D. An exact effective stress law for elastic deformation of rock with fluids. J. Geophys. Res. Space Phys. 1971, 76, 6414–6419. [Google Scholar] [CrossRef]
  14. Warpinski, N.R.; Teufel, L.W. Determination of the Effective-Stress Law for Permeability and Deformation in Low-Permeability Rocks. SPE Form. Eval. 1992, 7, 123–131. [Google Scholar] [CrossRef]
  15. Li, M.; Xiao, W.-L.; Guo, X.; Zhang, L.-H.; Zheng, L.-L. Laboratory Study of the Effective Pressure Law for Permeability of the Low-Permeability Sandstones from the Tabamiao Area, Inner Mongolia. Chin. J. Geophys. 2009, 52, 1402–1413. [Google Scholar] [CrossRef]
  16. Li, M.; Bernabé, Y.; Xiao, W.-I.; Chen, Z.-Y.; Liu, Z.-Q. Effective pressure law for permeability of E-bei sandstones. J. Geophys. Res. Space Phys. 2009, 114. [Google Scholar] [CrossRef] [Green Version]
  17. Ghabezloo, S.; Sulem, J.; Guédon, S.; Martineau, F. Effective stress law for the permeability of a limestone. Int. J. Rock Mech. Min. Sci. 2009, 46, 297–306. [Google Scholar] [CrossRef] [Green Version]
  18. Bernabé, Y. Comparison of the effective pressure law for permeability and resistivity formation factor in Chelmsford granite. Pure Appl. Geophys. PAGEOPH 1988, 127, 607–625. [Google Scholar] [CrossRef]
  19. Bernabé, Y. The effective pressure law for permeability during pore pressure and confining pressure cycling of several crystalline rocks. J. Geophys. Res. Space Phys. 1987, 92, 649. [Google Scholar] [CrossRef]
  20. Bernabe, Y. The effective pressure law for permeability in Chelmsford granite and Barre granite. Int. J. Rock Mech. Min. Sci. Géoméch. Abstr. 1986, 23, 267–275. [Google Scholar] [CrossRef]
  21. Robin, P.-Y.F. Note on effective pressure. J. Geophys. Res. Space Phys. 1973, 78, 2434–2437. [Google Scholar] [CrossRef]
  22. Gangi, A.F.; Carlson, R.L. An asperity-deformation model for effective pressure. Tectonophysics 1996, 256, 241–251. [Google Scholar] [CrossRef]
  23. Coyner, K. Effects of Stress, Pore Pressure, and Pore Fluids on Bulk Strain, Velocity, and Permeability in Rocks. Ph.D. Thesis, Massachusetts Institute of Technology, Cambridge, MA, USA, 1984. [Google Scholar]
  24. Todd, T.; Simmons, G. Effect of pore pressure on the velocity of compressional waves in low-porosity rocks. J. Geophys. Res. Space Phys. 1972, 77, 3731–3743. [Google Scholar] [CrossRef]
  25. Li, Z.; Ripepi, N.; Chen, C. Comprehensive laboratory investigation of Klinkenberg Effect and its role on apparent permeability in various U.S. shale formations. In Proceedings of the 53rd US Rock Mechanics/Geomechanics Symposium, New York, NY, USA, 23–26 June 2019. [Google Scholar]
  26. Jones, F.O.; Owens, W.W. A Laboratory Study of Low-Permeability Gas Sands. J. Pet. Technol. 1980, 32, 1631–1640. [Google Scholar] [CrossRef]
  27. Ren, J.; Guo, P. A New Mathematical Model for Pressure Transient Analysis in Stress-Sensitive Reservoirs. Math. Probl. Eng. 2014, 2014, 485028. [Google Scholar] [CrossRef]
  28. Moradi, M.; Shamloo, A.; Asadbegi, M.; Dezfuli, A.D.; Asadbeigi, M. Three dimensional pressure transient behavior study in stress sensitive reservoirs. J. Pet. Sci. Eng. 2017, 152, 204–211. [Google Scholar] [CrossRef]
  29. Huang, Y.; Li, X.; Tan, X. Transient Pressure and Rate Decline Analysis for Horizontal Well in Stress-Sensitive Composite Reservoir. Math. Probl. Eng. 2018, 2018, 8672578. [Google Scholar] [CrossRef]
  30. Ren, J.; Guo, P. A general analytical method for transient flow rate with the stress-sensitive effect. J. Hydrol. 2018, 565, 262–275. [Google Scholar] [CrossRef]
  31. Bhullar, A.S.; Stewart, G.E.; Zimmerman, R.W. Perturbation Solution for One-Dimensional Flow to a Constant-Pressure Boundary in a Stress-Sensitive Reservoir. Transp. Porous Media 2021, 1–17. [Google Scholar] [CrossRef]
  32. Jiang, L.; Liu, J.; Liu, T.; Yang, D. Semi-analytical modeling of transient pressure behaviour for a fractured vertical well with hydraulic/natural fracture networks by considering stress-sensitive effect. J. Nat. Gas Sci. Eng. 2020, 82, 103477. [Google Scholar] [CrossRef]
  33. Kadeethum, T.; Salimzadeh, S.; Nick, H. Well productivity evaluation in deformable single-fracture media. Geothermics 2020, 87, 101839. [Google Scholar] [CrossRef]
  34. David, C.; Wong, T.-F.; Zhu, W.; Zhang, J. Laboratory measurement of compaction-induced permeability change in porous rocks: Implications for the generation and maintenance of pore pressure excess in the crust. Pure Appl. Geophys. PAGEOPH 1994, 143, 425–456. [Google Scholar] [CrossRef]
  35. Wong, T.-F.; Zhu, W. Brittle faulting and permeability evolution: Hydromechanical measurement, microstructural observation, and network modeling. In Washington DC American Geophysical Union Geophysical Monograph Series; AGU: Hoboken, NJ, USA, 1999; pp. 83–99. Available online: https://agupubs.onlinelibrary.wiley.com/doi/10.1029/GM113p0083 (accessed on 1 March 2021). [CrossRef]
  36. Zhang, Q.; Liu, J.; Xu, H.; Zeng, Y.; Wang, C.; Wang, L. Experimental Investigation on Permeability Evolution of Limestone Caprock under Coupled THM Processes. KSCE J. Civ. Eng. 2019, 23, 5090–5097. [Google Scholar] [CrossRef]
  37. Shi, L.; Zeng, Z.; Fang, Z.; Li, X. Investigation of the Effect of Confining Pressure on the Mechanics-Permeability Behavior of Mudstone under Triaxial Compression. Geofluids 2019, 2019, 1796380. [Google Scholar] [CrossRef] [Green Version]
  38. Bhandari, A.R.; Flemings, P.B.; Hofmann, R.; Polito, P.J. Stress-Dependent In Situ Gas Permeability in the Eagle Ford Shale. Transp. Porous Media 2018, 123, 1–20. [Google Scholar] [CrossRef]
  39. Ngwenya, B.T.; Elphick, S.C.; Kwon, O.; Main, I.G. Permeability evolution during progressive development of deformation bands in porous sandstones. J. Geophys. Res. Space Phys. 2003, 108. [Google Scholar] [CrossRef] [Green Version]
  40. Paterson, M.S. The equivalent channel model for permeability and resistivity in fluid-saturated rock-a re-appraisal. Mech. Mater. 1983, 2, 345–352. [Google Scholar] [CrossRef]
  41. Fischer, G.; Paterson, M. Chapter 9 Measurement of Permeability and Storage Capacity in Rocks during Deformation at High Temperature and Pressure. Int. Geophys. 1992, 51, 213–252. [Google Scholar]
  42. Simpson, G.; Guéguen, Y.; Schneider, F. Permeability enhancement due to microcrack dilatancy in the damage regime. J. Geophys. Res. Space Phys. 2001, 106, 3999–4016. [Google Scholar] [CrossRef]
  43. Vajdova, V.; Baud, P.; Wong, T.-F. Permeability evolution during localized deformation in Bentheim sandstone. J. Geophys. Res. Space Phys. 2004, 109. [Google Scholar] [CrossRef]
  44. Lion, M.; Skoczylas, F.; Ledésert, B. Determination of the main hydraulic and poro-elastic properties of a limestone from Bourgogne, France. Int. J. Rock Mech. Min. Sci. 2004, 41, 915–925. [Google Scholar] [CrossRef]
  45. Sulem, J.; Ouffroukh, H. Shear banding in drained and undrained triaxial tests on a saturated sandstone: Porosity and permeability evolution. Int. J. Rock Mech. Min. Sci. 2006, 43, 292–310. [Google Scholar] [CrossRef] [Green Version]
  46. Davy, C.A.; Skoczylas, F.; Barnichon, J.-D.; Lebon, P. Permeability of macro-cracked argillite under confinement: Gas and water testing. Phys. Chem. Earth Parts A/B/C 2007, 32, 667–680. [Google Scholar] [CrossRef]
  47. Watanabe, N.; Hirano, N.; Tsuchiya, N. Determination of aperture structure and fluid flow in a rock fracture by high-resolution numerical modeling on the basis of a flow-through experiment under confining pressure. Water Resour. Res. 2008, 44. [Google Scholar] [CrossRef]
  48. Connell, L.D.; Lu, M.; Pan, Z. An analytical coal permeability model for tri-axial strain and stress conditions. Int. J. Coal Geol. 2010, 84, 103–114. [Google Scholar] [CrossRef]
  49. Liu, W.; Li, Y.; Wang, B. Gas Permeability of Fractured Sandstone/Coal Samples under Variable Confining Pressure. Transp. Porous Media 2009, 83, 333–347. [Google Scholar] [CrossRef] [Green Version]
  50. Chen, H.-D.; Yuan-Ping, C.; Zhou, H.-X.; Li, W. Damage and Permeability Development in Coal during Unloading. Rock Mech. Rock Eng. 2013, 46, 1377–1390. [Google Scholar] [CrossRef]
  51. Alam, A.B.; Niioka, M.; Fujii, Y.; Fukuda, D.; Kodama, J.-I. Effects of confining pressure on the permeability of three rock types under compression. Int. J. Rock Mech. Min. Sci. 2014, 65, 49–61. [Google Scholar] [CrossRef] [Green Version]
  52. Heller, R.; Vermylen, J.; Zoback, M. Experimental investigation of matrix permeability of gas shales. AAPG Bull. 2014, 98, 975–995. [Google Scholar] [CrossRef]
  53. Bhandari, A.R.; Flemings, P.B.; Polito, P.J.; Cronin, M.B.; Bryant, S.L. Anisotropy and Stress Dependence of Permeability in the Barnett Shale. Transp. Porous Media 2015, 108, 393–411. [Google Scholar] [CrossRef]
  54. Ji, Y.; Hall, S.A.; Baud, P.; Wong, T.-F. Characterization of pore structure and strain localization in Majella limestone by X-ray computed tomography and digital image correlation. Geophys. J. Int. 2014, 200, 701–719. [Google Scholar] [CrossRef] [Green Version]
  55. Subramaniyan, S.; Quintal, B.; Madonna, C.; Saenger, E.H. Laboratory-based seismic attenuation in Fontainebleau sandstone: Evidence of squirt flow. J. Geophys. Res. Solid Earth 2015, 120, 7526–7535. [Google Scholar] [CrossRef]
  56. Yasuhara, H.; Kinoshita, N.; Ogata, S.; Cheon, D.-S.; Kishida, K. Coupled thermo-hydro-mechanical-chemical modeling by incorporating pressure solution for estimating the evolution of rock permeability. Int. J. Rock Mech. Min. Sci. 2016, 86, 104–114. [Google Scholar] [CrossRef] [Green Version]
  57. Huo, D.; Benson, S.M. Experimental Investigation of Stress-Dependency of Relative Permeability in Rock Fractures. Transp. Porous Media 2016, 113, 567–590. [Google Scholar] [CrossRef]
  58. Han, B.; Xie, S.Y.; Shao, J.F. Experimental Investigation on Mechanical Behavior and Permeability Evolution of a Porous Limestone under Compression. Rock Mech. Rock Eng. 2016, 49, 3425–3435. [Google Scholar] [CrossRef]
  59. Takeda, M.; Manaka, M. Effects of Confining Stress on the Semipermeability of Siliceous Mudstones: Implications for Identifying Geologic Membrane Behaviors of Argillaceous Formations. Geophys. Res. Lett. 2018, 45, 5427–5435. [Google Scholar] [CrossRef]
  60. Guzev, M.; Kozhevnikov, E.; Turbakov, M.; Riabokon, E.; Poplygin, V. Experimental Studies of the Influence of Dynamic Loading on the Elastic Properties of Sandstone. Energies 2020, 13, 6195. [Google Scholar] [CrossRef]
  61. Guzev, M.; Riabokon, E.; Turbakov, M.; Kozhevnikov, E.; Poplygin, V. Modelling of the Dynamic Young’s Modulus of a Sedimentary Rock Subjected to Nonstationary Loading. Energies 2020, 13, 6461. [Google Scholar] [CrossRef]
  62. Guzev, M.A.; Kozhevnikov, E.V.; Turbakov, M.S.; Riabokon, E.P.; Poplygin, V.V. Experimental Investigation of the Change of Elastic Moduli of Clastic Rocks under Nonlinear Loading. Int. J. Eng. 2021, 34, 750–755. [Google Scholar] [CrossRef]
  63. Poplygin, V.V.; Pavlovskaia, E.E. Investigation of the Influence of Pressures and Proppant Mass on the Well Parameters after Hydraulic Fracturing. Int. J. Eng. 2021, 34, 1066–1073. [Google Scholar]
  64. Riabokon, E.P.; Turbakov, M.S.; Kozhevnikov, E.V.; Poplygin, V.V.; Wiercigroch, M. Advanced Problems in Mechanics. In Proceedings of the XLVII International Summer School-Conference “Advanced Problems in Mechanics”, St. Petersburg, Russia, 24–29 June 2019; pp. 185–192. [Google Scholar] [CrossRef]
  65. Tiller, F.M. The Role of Porosity in Filtration, Part I: Numerical Methods for Constant Rate and Constant Pressure Filtration based on Kozeny’s Law. Chem. Eng. Prog. 1953, 49, 467–479. [Google Scholar]
  66. Gangi, A.F. Variation of whole and fractured porous rock permeability with confining pressure. Int. J. Rock Mech. Min. Sci. Géoméch. Abstr. 1978, 15, 249–257. [Google Scholar] [CrossRef]
  67. Jones, S.C. Two-Point Determinations of Permeability and PV vs. Net Confining Stress. SPE Form. Eval. 1988, 3, 235–241. [Google Scholar] [CrossRef]
  68. Rice, J.R. Chapter 20 Fault Stress States, Pore Pressure Distributions, and the Weakness of the San Andreas Fault. Int. Geophys. 1992, 51, 475–503. [Google Scholar] [CrossRef]
  69. Main, I.G.; Kwon, O.; Ngwenya, B.T.; Elphick, S.C. Fault sealing during deformation-band growth in porous sandstone. Geol. 2000, 28, 1131. [Google Scholar] [CrossRef]
  70. Kwon, O.; Kronenberg, A.K.; Gangi, A.F.; Johnson, B. Permeability of Wilcox shale and its effective pressure law. J. Geophys. Res. Space Phys. 2001, 106, 19339–19353. [Google Scholar] [CrossRef]
  71. Zhang, C.; Rothfuchs, T. Experimental study of the hydro-mechanical behaviour of the Callovo-Oxfordian argillite. Appl. Clay Sci. 2004, 26, 325–336. [Google Scholar] [CrossRef]
  72. Dong, J.-J.; Hsu, J.-Y.; Wu, W.-J.; Shimamoto, T.; Hung, J.-H.; Yeh, E.-C.; Wu, Y.-H.; Sone, H. Stress-dependence of the permeability and porosity of sandstone and shale from TCDP Hole-A. Int. J. Rock Mech. Min. Sci. 2010, 47, 1141–1157. [Google Scholar] [CrossRef]
  73. Yuan, S.; Harrison, J. Numerical modelling of progressive damage and associated fluid flow using a hydro-mechanical local degradation approach. Int. J. Rock Mech. Min. Sci. 2004, 41, 317–322. [Google Scholar] [CrossRef]
  74. Selvadurai, A.; Głowacki, A. Permeability Hysterisis of Limestone during Isotropic Compression. Ground Water 2007, 46, 113–119. [Google Scholar] [CrossRef]
  75. Witherspoon, P.A.; Gale, J.E. Mechanical and hydraulic properties of rocks related to induced seismicity. Eng. Geol. 1977, 11, 23–55. [Google Scholar] [CrossRef] [Green Version]
  76. Jones, F.O.J. A Laboratory Study of the Effects of Confining Pressure on Fracture Flow and Storage Capacity in Carbonate Rocks. J. Pet. Technol. 1975, 27, 21–27. [Google Scholar] [CrossRef]
  77. Nelson, R. Fracture Permeability in Porous Reservoirs: Experimental and Field Approach. Ph.D. Thesis, Texas A & M University, College Station, TX, USA, 1975. [Google Scholar]
  78. Sahimi, M. Flow and Transport in Porous Media and Fractured Rock; Wiley-VCH Verlag GmbH & Co. KGaA: Weinheim, Germany, 2011. [Google Scholar] [CrossRef]
  79. Ma, D.; Miao, X.X.; Chen, Z.Q.; Mao, X.B. Experimental Investigation of Seepage Properties of Fractured Rocks under Different Confining Pressures. Rock Mech. Rock Eng. 2012, 46, 1135–1144. [Google Scholar] [CrossRef]
  80. Wong, L.N.Y.; Li, D.; Liu, G. Experimental Studies on Permeability of Intact and Singly Jointed Meta-Sedimentary Rocks under Confining Pressure. Rock Mech. Rock Eng. 2013, 46, 107–121. [Google Scholar] [CrossRef]
  81. Snow, D.T. Fracture deformation and changes of permeability and storage upon changes of fluid pressure. Q. Colo. Sch. Mines 1968, 63, 201–244. [Google Scholar]
  82. Walsh, J.B.; Brace, W.F. The effect of pressure on porosity and the transport properties of rock. J. Geophys. Res. Space Phys. 1984, 89, 9425–9431. [Google Scholar] [CrossRef]
  83. Walsh, J. Effect of pore pressure and confining pressure on fracture permeability. Int. J. Rock Mech. Min. Sci. Géoméch. Abstr. 1981, 18, 429–435. [Google Scholar] [CrossRef]
  84. Sigal, R.F. The pressure dependence of permeability. Petrophysics SPWLA J. Form. Eval. Reserv. Descr. 2002, 43, 92–102. [Google Scholar]
  85. Dvorkin, J.; Nur, A. Dynamic poroelasticity: A unified model with the squirt and the Biot mechanisms. Geophysics 1993, 58, 524–533. [Google Scholar] [CrossRef]
  86. Yang, Y.; Liu, Z.; Sun, Z.; An, S.; Zhang, W.; Liu, P.; Yao, J.; Ma, J. Research on Stress Sensitivity of Fractured Carbonate Reservoirs Based on CT Technology. Energies 2017, 10, 1833. [Google Scholar] [CrossRef] [Green Version]
  87. Kashnikov, Y.A.; Popov, S.N.; Gladyshev, S.V. Hydrodynamic modeling of development of turnejsko-famensky object of shershnevsky oil field with account for geomechanical effect of fracture deformation. In Geology, Geophysics and Development of Oil and Gas Fields; JSC “VNIIOENG”: Moscow, Russia, 2009; pp. 50–56. [Google Scholar]
  88. Kashnikov, Y.A.; Ashikhmin, S.G.; Obsharov, P.A. Experimental studies of the effect of long-acting high effective stresses on the filtration-capacitive characteristics of monolithic samples and samples with fractures. In Geology, Geophysics and Development of Oil and Gas Fields; JSC “VNIIOENG”: Moscow, Russia, 2008; pp. 51–54. [Google Scholar]
  89. Ashikhmin, S.G.; Kashnikov, Y.A.; Yakimov, S.Y. Experimental and theoretical research of change of collectors’ fracture permeability of Yurubcheno-Tokhomsky field. In Geology, Geophysics and Development of Oil and Gas Fields; JSC “VNIIOENG”: Moscow, Russia, 2013; pp. 36–41. [Google Scholar]
  90. Liu, H.-H.; Rutqvist, J.; Berryman, J.G. On the relationship between stress and elastic strain for porous and fractured rock. Int. J. Rock Mech. Min. Sci. 2009, 46, 289–296. [Google Scholar] [CrossRef] [Green Version]
  91. Zheng, J.; Zheng, L.; Liu, H.-H.; Ju, Y. Relationships between permeability, porosity and effective stress for low-permeability sedimentary rock. Int. J. Rock Mech. Min. Sci. 2015, 78, 304–318. [Google Scholar] [CrossRef] [Green Version]
  92. Morrow, C.A.; Shi, L.Q.; Byerlee, J.D. Permeability of fault gouge under confining pressure and shear stress. J. Geophys. Res. Solid Earth 1984, 89, 3193–3200. [Google Scholar] [CrossRef]
  93. Shi, Y.; Wang, C.Y. Pore pressure generation in sedimentary basins: Overloading versus aquathermal. J. Geophys. Res. Solid Earth 1986, 91, 2153–2162. [Google Scholar] [CrossRef]
  94. Metwally, Y.M.; Sondergeld, C.H. Measuring low permeabilities of gas-sands and shales using a pressure transmission technique. Int. J. Rock Mech. Min. Sci. 2011, 48, 1135–1144. [Google Scholar] [CrossRef]
  95. Matthews, C.S.; Russell, D.G. Pressure Buildup and Flow Tests in Wells, Monograph Series, Society of Petroleum Engineers of AIME, Dallas (1967) 1. Available online: https://store.spe.org/Pressure-Buildup-and-Flow-Tests-in-Wells-P49.aspx (accessed on 1 March 2021).
  96. Mueller, T.D.; Witherspoon, P.A. Pressure Interference Effects within Reservoirs and Aquifers. J. Pet. Technol. 1965, 17, 471–474. [Google Scholar] [CrossRef]
  97. McKinley, R. Wellbore Transmissibility from Afterflow-Dominated Pressure Buildup Data. J. Pet. Technol. 1971, 23, 863–872. [Google Scholar] [CrossRef]
  98. Ramey, H.J., Jr.; Cobb, W.M. A General Buildup Theory for a Well in a Closed Drainage Area. J. Pet. Technol. 1971, 251, 1493–1505. [Google Scholar] [CrossRef]
  99. Dietz, D.N. Determination of Average Reservoir Pressure from Build-Up Surveys. J. Pet. Technol. 1965, 17, 955–959. [Google Scholar] [CrossRef]
Figure 1. Dependences of the change in the permeability of terrigenous rock samples on the effective pressure according to the data from [16,37,70,72,79,84,85].
Energies 14 02306 g001
Figure 2. Dependences of the change in the permeability of carbonate rocks samples on the effective pressure according to the data from [36,58,79,86,87,88,89].
Energies 14 02306 g002
Figure 3. The scheme of Two-Part Hooke’s Model for rocks. Reproduced from [90].
Energies 14 02306 g003
Figure 4. Permeability changes according to the TPHM model, on the example of the data from [72].
Energies 14 02306 g004
Figure 5. Dependences of exponents γ (a), n (c) and coefficients A (b), B (d) of Equations (26) and (27) on the initial permeability of the samples.
Energies 14 02306 g005
Figure 6. Dependences of permeability on effective pressure, plotted based on the results of previously published papers (dashed lines) and data from the field well tests (solid lines).
Energies 14 02306 g006
Figure 7. Dependences of exponents γ (a), n (c) and coefficients A (b), B (d) of Equations (26) and (27) on the initial permeability of layers determined by field well tests.
Energies 14 02306 g007aEnergies 14 02306 g007b
Table 1. A summary table of the parameters of the equations describing the change in permeability from the effective pressure from open literature sources.
Rock, Field, SourceKo, mDH, mExponential LawPower Law
γAR2nBR2
Limestone, Anstrude [58]0.6400.0090.9400.840.1361.1190.98
Fractured limestone, Tarim Basin [86]2.620000.6450.2180.521.4340.0530.81
Limestone, Xuzhou [79]0.0092200.1261.6270.890.9794.1390.83
Limestone, China [35]0.08700.0591.8950.941.20618.2410.85
Sandstone, Xuzhou [79]0.0152200.2422.4140.921.93716.3660.91
Sandstone, E-bei [16]127600.1041.2180.981.77820.0780.92
Sandstone, Gulf of Mexico II [84]5.125000.0521.5400.990.8166.1160.97
Limestone, Astrakhanskoe [88]340000.0020.9970.980.0261.0280.89
Limestone, Shershnevskoe [87]23.6221000.0081.0190.990.0981.1180.83
Mudstone, Yingcheng [37]12200.0411.5070.940.9178.8290.88
Fractured limestone, Yurubcheno-Tokhomskoe [89]5020470.4570.9110.980.1970.4750.78
Fractured limestone, Shershnevskoe [87]73.621000.0360.8130.930.4191.2270.94
Fractured limestone, Astrakhanskoe [88]75.440000.0361.0590.970.5730.7370.73
Sandstone, TCDP [72]659000.0030.9060.850.1171.1950.99
Shale, Wilcox, [70]0.002740001.1252.6630.902.3371.1320.91
Shale, Devon [85]0.00116000.0991.2510.951.44810.8130.99
Table 2. A summary table of the parameters of the equations describing the change in permeability on the effective pressure from field well tests.
Type of Rock, Field (Layer)Ko, mDH, mExponential LawPower Law
γAR2nBR2
Terrigenous, Arkhangelskogo (C1bb)369228017.972.830.701.073.140.69
Terrigenous, Sibirskoe (C1bb)2502250199.494.480.752.264.970.74
Terrigenous, Unvinskoe (C1bb)413223011.252.080.541.522.740.54
Terrigenous, Chashkinskoe (C1bb)2652050228.024.490.662.825.550.65
Terrigenous, Yurchukskoe (C1bb)350190062.622.140.692.14.490.68
Terrigenous, well 742, Yurchukskoe (C1bb)350203011.981.450.774.662.870.77
Carbonate, Unvinskoe (C1t-D3fm)34.22200145,5889.510.7214.0111.880.73
Carbonate, Arkhangelskogo (C1t-D3fm)8.5223093.193.820.662.224.670.75
Carbonate, Sibirskoe (C1t-D3fm)192400145,588.459.510.7314.0111.880.73
Carbonate, Sibirskoe (C1b)16.92100254.264.890.582.015.780.58
Carbonate, Chashkinskoe (C1t-D3fm)53212014.712.110.631.983.020.62
Publisher’s Note: MDPI stays neutral with regard to jurisdictional claims in published maps and institutional affiliations.

