Abstract
Considering the necessity of achieving economic development by keeping the quality of the environment, the aim of this paper is to study the impact of economic growth on GHG emissions in a sample of Central and Eastern European (CEE) countries (V4 countries, Bulgaria and Romania) in the period of 1996–2019. In the context of dynamic ARDL panel and environmental Kuznets curve (EKC), the relationship between GHG and GDP is N-shaped. A U-shaped relationship was obtained in the renewable Kuznets curve (RKC). Energy consumption, domestic credit to the private sector, and labor productivity contribute to pollution, while renewable energy consumption reduces the GHG emissions. However, more efforts are required for promoting renewable energy in the analyzed countries.
1. Introduction
In general terms, economic growth reveals the growth of the production of goods and services over a certain period. The connection between economic development and environmental quality is related to sustainable development goals, since economic activities could enhance pollution that is a barrier on the path to sustainable development [1]. Environmental degradation represents a serious health risk with negative effects on the ecosystem [2]. A non-linear and U-inversely shaped connection between economic growth and environment pollution based on environmental Kuznets curve was the subject of many previous studies [3].
Most of the papers related to EKC focused on the description of CO2 emissions evolution with mixed results depending on the level of development and geographical areas [4]. However, the positive impact of energy consumption based on fossil fuels on pollution was revealed in all the studies. Therefore, renewable energy consumption could be a solution to improve environmental quality. In this context, our analysis is focused on traditional EKC improved by adding other relevant predictors and RKC. The explanatory variables in EKC also include domestic credit to the private sector, foreign direct investment and labor productivity. Previous studies confirmed the role of renewable energy consumption in supporting economic growth without environmental degradation [5,6,7,8]. Yao et al. [5] and Paramati et al. [6] demonstrated the capacity of renewable energy consumption to reduce CO2 emissions and promote sustainable development. A bidirectional causal nexus between economic growth and renewable energy consumption was previously observed by Tugcu et al. [7] and Apergis and Payne [8].
This type of analysis is necessary since the global GDP is expected to increase by 3% each year in the period 2014–2050, while energy consumption might grow by 50% from 2018 to 2050 [9]. This accelerate growth of energy consumption which contribute to pollution is higher than GDP growth and suitable policies should be implemented to ensure sustainable development. Our analysis focuses on few countries that joined the EU starting in 2004 and 2007 where air pollution is an issue because of less investment for the environmental protection. The level of economic development is similar since these states belonged to the same communist bloc before 1989 and should make similar efforts for the transition to a functional market economy.
Domestic credit to the private sector, labor productivity and foreign direct investment also enhance environmental qualities in developing countries because of the poor policies that target economic growth without taking into account environmental challenges. There are mixed studies related to the impact of FDI on pollution. For example, Marques and Caetano [10] showed that FDI enhances CO2 emissions in middle-income countries, while the high-income states that promote green technologies succeeded in reducing the pollution through FDI. Various studies for China suggest the negative influence of FDI on pollution [11,12,13]. For V4 countries, Bulgaria and Romania we expect to have a positive influence of FDI on GHG emissions since green technologies were not enough promoted in these developing countries.
Labor productivity might enhance pollution which requires sustainable policies to support environmental protection. Simionescu et al. [14] suggested that labor productivity growth increase the GHG emission on developed EU countries, while the evidence for the EU new member states are mixed. For countries in our sample, the labor productivity might positively affect HG emissions.
Domestic credit to the private sector should promote environmentally friendly projects. The findings for 93 countries with various levels of development showed that loans from banks are attributed with priority to those projects that support sustainable development [15]. We expect to have a positive impact of domestic credit to the private sector on GHG emission in the V4 countries, Romania and Bulgaria since there is not a legal framework to support loans for environmentally friendly projects.
Most of the papers in this field used CO2 emissions as a proxy of pollution, but this study employs GHG emissions covering the gap in the literature. The natural existence of GHG emissions is vital for life and have the capacity to keep the Earth warmer. The concentration of these gases in the air grew by 30% compared to pre-industrial period and this fact might have effects for future society. The consequences of higher GHG emissions are related to vegetation and hydrological disequilibrium because of changes in surface precipitations and temperature.
Considering these environmental challenges, the aim of this research is to assess the impact of economic development on GHG emissions in Czech Republic, Romania, Slovakia, Bulgaria, Poland and Hungary in the period 1996–2019. Beside the revised EKC, the paper proposed an analysis based on REK to support the hypothesis that renewable energy consumption might replace the energy consumption based on traditional sources that have negative environmental effects. The literature review provides evidence about the impact of economic growth and other factors on GHG emissions in developing countries. After methodology description and empirical results presentation, the last section of this paper provides conclusions and recommendations for achieving sustainable development.
2. Literature Review
The economic growth–environment nexus is a major challenge for achieving sustainable development goals, because the intense economic activities bring environmental problems that negatively influence the sustainable development.
The relationship between pollution and economic growth has been the subject of many papers because of global warming that determines social and economic effects. More proxies were used to express environment pollution, the most known ones being CO2 emissions, GHG emissions, SO2, N2O, CH4, ecological footprint, biocapacity per capita. Our literature review focuses on EKC and RKC independent of indicator used to reflect pollution.
The assumption stating that there is a bell-shaped pattern between income and environmental pollution was first introduced by Grossman and Krueger [16]. This hypothesis was checked in the context of NAFTA and an inverted-U shaped pattern was observed using empirical data. In other words, economic growth is harmful for the environment until a certain income threshold, but after that, economic growth is beneficial for the environment.
Theoretical and empirical reasons are provided to explain the necessity for studying EKC. For example, Grossman and Krueger [16] showed that structural, scale, and technological effect could explain the connection between environmental pollution and economic growth. The expansion of economic activities determines scale effect reflected in more pollution. Structural changes of the economy generate structural effect. On the other hand, the technological progress based on innovation and investment in R&D supposes the use of less polluting technologies [17]. Environmental quality might be regarded as a normal good [18] or a luxury good [19]. In this light, EKC is an effect of variations in income elasticity in order to improve the environmental quality. The pollution has negative an effect on people’s life quality which imposes suitable regulations and policies in the environmental field. From this point of view, the weak regulations in developing countries favor pollution enhancement [20], but more efforts in this direction could reduce environmental degradation [21].
The theoretical models for EKC are static and dynamic. Static models employ production functions [22] or utility functions [23]. Dynamic models are based on resource distribution [24], tax policy [25], technological progress [26] and real options [27]. A particular dynamic model is Green Solow model, an extension of neoclassical growth model that takes into account the environmental challenges in a Cobb–Douglas function. The Green Solow model described by Brock and Taylor [28] explains the economic growth-pollution nexus on descending returns and technological progress. This model was later improved by flexible specifications (non-parametric and semi-parametric ones) [29].
The EKC hypothesis was checked using three classes of methods corresponding to the type of data: time series models, panel data models, time and frequency domain like wavelet analysis. In this paper, we analyze a group of countries in a certain period which supposes panel data. This approach ensures control for individual heterogeneity and better coefficients in terms of efficiency. Some papers employing panel data models for developing countries are described focusing on proxy for environmental pollution and main results. Regional studies at country level were not taken into account in this research, since the empirical analysis is focused only on countries and not sub-regions of these. Table 1 indicates only four proxies for pollution: CO2, GHG, SO2 and ecological footprint.

Table 1.
Studies in the literature based on EKC for developing countries.
A critical analysis of the literature in this field indicates the existence of two groups of analysis: larger clusters including both developed and developing countries and smaller groups with only developing economies. Most of the studies for both groups employed cointegration techniques to identify both short and long-run connections. From this point of view, our paper focused also on long and short-term relationships in the EKC framework. This view allows us to propose specific policies depending on the relationship persistence.
Most of the studies including developing or emerging economics explain CO2 and GHG emissions. For the other leading indicators, larger groups are analyzed only in one case. These cases are represented by Ulucak and Bilgili [33] who used ecological footprints for middle, lower- and higher-income countries in a cointegration analysis in the period 2000–2015 and Ridzuan [51] that analyzed to explain SO2 emissions using a fixed effect model for 174 countries the period 1991–2010. All the studies for larger groups indicated a bell shape, excepting few papers. For example, the study of Jesus Lopez-Menendez et al. [48] for the EU-27 revealed an inverted-N shape in the period 1996–2010 when GHG emissions are explained. This paper employs traditional panel data models that ignore the long and short-run horizon. Ozcan [40] obtained a U-shape pattern for 12 Middle East countries from 1990 to 2008 when FMOLS was used to explain CO2 emissions. A monotonically increasing pattern was identified by Nasir et al. [45] for 5 ASEAN countries in the period 1982–2014 based on cointegration techniques (DOLS and FMOLS) for checking the CO2 emissions-economic growth nexus.
The studies focusing only on developing/emerging countries are fewer compared to those analyzing larger groups of states. Almost of all them suggested a bell shape, but a few papers indicated other patterns. Lazăr et al. [30] indicated a monotonically increasing tendency in the case of 11 countries from Central and Eastern Europe while explaining CO2 and SO2 emissions and ecological footprint in the period 1996–2015. The authors focused on specific cointegration methods based on MG-FMOLS, MG and AMG. A part of the countries analyzed by Lazăr et al. [30] makes the subject of our paper, but this time GHG emissions are explained. A U-shaped relationship was observed by Hove and Tursoy [31] in the case of 24 emerging economies from 2000 to 2017 based on GMM approach for CO2 emissions. Another study for more emerging countries (152) identified an N-shape pattern using a fixed effect model in the period 1980–2010 [38].
3. Data
This paper uses panel data for six CEE countries (V4 countries (Hungary, Czech Republic, Poland, Slovakia), Romania and Bulgaria) in the period 1996–2019. The connection between economic growth and pollution is analyzed in these states using GHG emissions as proxy for pollution and revised environmental Kuznets curve. In Table 2, the variables’ description is presented in detail. The dependent variable that is explained in the panel data models is GHG emissions.
Table 2.
Variables in the models.
Some descriptive statistics are presented in Table 3. The maximum levels of real GDP per capita were registered by Czech Republic in the period 1996–2019, while the minimum levels were reached by Bulgaria. The highest economic growth in Czech Republic is explained by the high volume of exports and low unemployment. On the other hand, Bulgaria presents the highest unemployment and a low standard of living.
Table 3.
Descriptive statistics.
The maximum values for GHG emissions were registered by Poland in the entire period, while the value reached in 1997 is the maximum of the period. Poland is placed as the fifth EU country as GHG emissions, the principal source of pollution being fossil fuel combustion that produces around 40,000 deaths each year in this country.
Figure 1 indicates the leader position of Poland in this sample of countries in the case of GHG emissions, being followed by Romania. Air quality in Bucharest, the capital or Romania, is considered unsafe with high costs for the citizens. Even if considerable costs for pollution were registered in Bratislava, Slovakia presented the minimum values for this indicator. Air pollution represents the most important health risk in what concerns the environment in Poland and Romania. Beside negative effects on human life that sometimes arrives to death, the pollution negatively influences the condition of ecosystems. The measures to reduce pollution should take into account both human and environment protection.
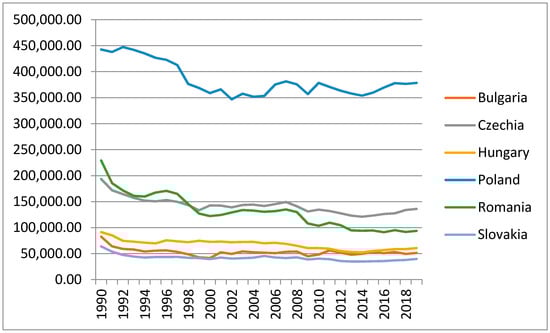
Figure 1.
The evolution of the GHG emissions in the analyzed countries (1990–2019). Source: own graph based on Eurostat data.
More efforts should be conducted by Poland to promote new coals, gas plants, wind and solar power. By 2050, this country should decrease the level of GHG emissions with more than 40% compared to 2005. Poland should reduce the particulate matter by monitoring the landscape indicators that are essential in spatial planning of the cities where ecosystem services are required [53].
4. Methodology
The relationship between pollution and economic development is analyzed in the context of various types of environmental Kuznets curves: revised EKC and renewable Kuznets curve (RKC). Let us consider a general class of EKC on panel data, where the dependent variable is represented by GHG emissions:
- GDP—gross domestic product
- GHG—greenhouse gas emissions
- X—vector of control variables
- —country-fixed effects
- —coefficients
- —error terms
- i—country index, t—time index
The renewable energy Kuznets Curve (RKC) explains GHG emissions using the renewable energy consumption as in Yao et al. [5]:
REC—renewable energy consumption
The previous equation could be modified by adding other control variables:
Cross-sectional dependence is tested, because the GHG emissions in one country could depend on the emissions level in another country, while GDP could have similar evolutions for these states that were previously under the same political regime. Since CD Pesaran [54] test is not affected by small size of the sample, it is employed under the null hypothesis of cross-sectional independence:
—pair-wise correlation coefficient of the disturbances
In case of balanced panels, the CD statistic of Pesaran [54] is calculated as:
— number of common observations for two countries i and j
In case of cross-section dependence, Breitung test to check for unit root, since it assumes the existence of this dependence between countries. For non-stationary data, the cointegration is checked using Kao, Pedroni and Westerlund tests to check for potential long-run relationship between variables in the model.
The panel Autoregressive Distributed Lag model (panel ARDL) can be used in case of no cointegration. Specific estimators like pooled mean group (PMG) and two-way fixed effect (DFE) could be computed.
The ARDL model representation for basic EKC and RKC without control variables is:
i is index for country and t is time index
After parameterization, the equations become:
The coefficients λ, λ′, λ″, λ‴ are short-run parameters for lagged endogenous variable and the explanatory variables. θ type coefficients are long-run parameters for explanatory variables. The speeds of adjustment are and .
The PMG estimator is based on homogenous long-run equilibrium across countries, but also on heterogeneous short-run relationship. The data refer to V4 countries, Bulgaria, and Romania that have similar long-run evolutions for GHG emissions. The short-run behavior should be heterogeneous due to specific gaps between countries. Therefore, the PMG estimator is suitable for this case.
Contemporaneous correlation is taken into account through the common correlated effect. The common factor control is ensured by cross-sectional means for regressors. We expect the common correlated effect mean group estimator is consistent and efficient under long-term homogeneity [55].
5. Results
Firstly, properties like cross-sectional dependence, heterogeneity and presence of unit root in panel data are checked using suitable tests. The cross-sectional dependence in GHG emissions and GDP are explained by the fact these countries belonged to the same economic system before 1990. According to CD Pesaran’s test, there is cross-sectional dependence for all variables at 5% level of significance (Table 4). Heterogeneity is explained by spatial localization, climate characteristics, different environmental regulations and policies to enhance economic growth. Moreover, these countries accessed the EU in different years. V4 countries joined the EU in 2004, while Bulgaria and Romania later, in 2007.
Table 4.
The results of CD Pesaran’s test for cross-sectional dependence (1996–2019).
According to the Breitung test, the FDI data series in logarithm is stationary in level, while all the other panel data in logarithm are stationary in the first difference (Table 5). The variables were considered in logarithmic form in order to allow interpretations in terms of elasticities.
Table 5.
The results of Breitung test for checking the presence of unit roots in panel data (1990–2019).
The results related to cointegration are mixed (see Table 6). According to Pedroni and Westerlund tests, there is a cointegration relationship between logarithm of GHG emissions and other variables: GDP, PROD, REC, EC, CREDIT (in logarithms) at 10% level of significance. Kao test indicates no cointegration, while Pedroni and Westerlund test shows no cointegration at 1% level of significance.
Table 6.
The results of Pedroni and Westerlund tests.
First, we provide estimations using models with main variables and then robustness is checked using additional variables in the models. According to PMG estimations in Table 7, the models converge to a long-run relationship. The results indicate only a long-run relationship between variables, the highest speed of adjustment was registered by RKC suggesting a correction of 40.1% for the discrepancy of this estimation.
Table 7.
Pool mean groups (PMG) regressions to explain the GHG emissions in V4 countries, Bulgaria and Romania (EKC and RKC) in basic model.
The GDP terms in all polynomial specifications are statistically significant showing the relevant impact of GDP on GHG emissions in the analyzed CEE countries, as we can observe also in Table 8. On the other hand, GDP terms are not significant in case of quadratic model. The positive sign for the linear and cubic and the negative one for squared term show that the relationship between GHG and GDP is N-shaped. The estimated GDP values for which the first derivative is zero do not represent local extrema, which show an increasing relationship between output and GHG emissions.
Table 8.
Dynamic and Pesaran common correlated effects estimators to explain GHG emissions in RKC (basic model).
According to Table 9, energy consumption has a positive and significant impact on GHG emissions, while the contribution of domestic credit to the private sector is significant, but much lower.
Table 9.
Dynamic and Pesaran common correlated effects estimators to explain GHG emissions in EKC (basic model).
The reduction of energy consumption based on traditional energy sources contributes to environmental quality, but a better solution would be the partial replacement of usual energy sources with renewable ones.
6. Robustness: Additional Control Variables
Additional variables are considered in the models. RKC is extended to include domestic credit to the private sector, labor productivity and FDI as control variables, while EKC model includes FDI and labor productivity. Table 10 shows that domestic credit to the private sector has a low, but significant effect on pollution only on long-run when RKC model is used as in the case of EKC. Labor productivity contributes to GHG emissions growth on long-run, while the impact of FDI is not significant on both cases. Speed of adjustment is higher in case of RKC suggesting a correction of 4.69% for the discrepancy of this estimation. This speed is higher than in the initial model without other control variables.
Table 10.
Pool mean groups regressions to explain the GHG emissions in V4 countries, Bulgaria and Romania (EKC and RKC).
A U-shaped relationship was obtained in the RKC for countries in the panel. The result is similar with that obtained by Yao et al. [5] for six geographical regions and for 17 developed and developing countries in the period 1990–2014.
The results in Table 11 confirm the capacity of REC to reduce GHG emissions and the contribution of domestic credit and labor productivity to pollution. Domestic credit to the private sector contributes to business development which might negatively affect the environment if the technologies do not take into account environmental protection. Labor productivity enhances pollution, as shown in the study of Simionescu et al. [14], for all the EU-28 countries in the period 2007–2019.
Table 11.
Dynamic and Pesaran common correlated effects estimators to explain GHG emissions in RKC.
The correlation between GHG emissions and the energy consumption is justified by the economic theory. In the case of developing countries, fossil fuels usually reduce energy efficiency and deteriorate the environment. This positive correlation between energy consumption and pollution was also obtained by Lazăr et al. [30] for Central and Eastern European countries in the period 1996–2015, where V4 countries, Romania and Bulgaria are included, but the proxy for pollution is CO2. The same study confirms the lack of impact for FDI that is reflected also in Table 12. Even if FDI contributed to economic growth in V4 countries [56,57], the friendly environmental technologies did not cause significant increase in pollution.
Table 12.
Dynamic and Pesaran common correlated effects estimators to explain GHG emissions in EKC.
The panel ARDL models have the advantage of reducing endogeneity. The PMG estimator allows for different responses across countries in the short-run non-heterogeneity in the long-run. The principal advantage of PMG estimators is the good results in case of small number of countries (only six countries in this study), simultaneous correction of auto-correlation and the minimum sensitivity in case of outliers [58].
The ARDL approach ignores contemporaneous correlation across countries that is explained by unobserved factor and less consistent coefficients are used [59]. The Pesaran CD test indicates a significant cross-sectional dependence in errors. The common correlated model reduces the contemporaneous correlation.
The residuals do not present unit root in all cases and the CCE estimator is appropriate even with serial correlated errors [58]. The CCEMG estimator is the most suitable due to correct specification and no issues in terms of cross-sectional dependence and serial correlation.
7. Discussion and Conclusions
The effects of economic development on pollution in six EU member states were assessed using the theoretical background of revised environmental Kuznets curves. The practical implications are related to the implementation of suitable policies to reduce the GHG emissions in order to alleviate the climate challenges. The results have implications for environmental policies in these countries. Moreover, the analysis of EKC hypotheses allows the evaluation of degree of sustainability for economic and environmental policies. As part of the EU, V4 countries, Bulgaria and Romania assume the European goals for reducing pollution through sustainable energy consumption. However, specific policy recommendations should be made for each country according to actual environmental issues. Poland is a leader in the region in what concerns the level of GHG emissions which already have negative implications on human beings and environmental quality. The energy consumption enhances the pollution which suggests that the policies are not eco-friendly and proactive actions are required at low costs [36]. The N-shaped pattern for EKC was previously confirmed by Özokcu and Özdemir [38] for 152 emerging economies from 1980 to 2010. Unlike developed countries, in this case the environmental regulations are not so strict to control energy consumption based on traditional sources. Similar studies confirm this tendency in these countries that were analyzed in other periods in larger groups: 15 new EU member states from 1992 to 2010 [60], 43 developing economies over 1996–2015 [60], 31 developing countries over 1971–2013 [61].
The U-shaped connection in RKC was confirmed for countries in the sample. Renewable energy consumption is part of European Green Deal, but more efforts are necessary for these countries in the sample to achieve the required targets [62]. On the other hand, if renewable energy is promoted to fast, the economic progress is lower [63]. Eco-innovative developments are necessary to enhance the use of renewable energy sources. These innovations could reduce the costs of renewable energy production and eliminate pollution determined by non-renewable resources. In developed counties, more investment is assigned to eco-innovation and the stage of this type of innovation in these countries is more advanced compared to developing countries [64]. The pattern in developed countries should be followed by emerging economics through more investment. The use of renewable energy in these new EU countries ensures a balanced climate and a sustainable economic development. Economic growth contributes to energy consumption and environmental pollution. Therefore, the environmental policies should promote sustainability due to policy targets related to environmentally-friendly technology, clean energy usage, higher consumption of non-renewable energy sources. The developed countries already achieved environmental benefits in electricity markets due to renewable energy [65]. Therefore, the weight of renewable energy consumption in total consumption should increase more in developing countries.
More R&D expenditure in eco-innovation technologies would be a suitable policy initiative. Labor productivity has a positive impact on pollution and the reduction of working hours could have benefits on environment. The low technological progress in industry might explain the role of labor productivity in environmental degradation [14]. Specific energy policies should promote renewable energy according to the EU directives ensuring market liberalization, support for suitable infrastructure in this field, power allocation system between regions given the dependence of certain sources of energy on meteorological conditions, transition from subsidies for fossil fuels to investment in renewable energy.
The main limit of the study is the analysis of a small sample, but the aim of the paper is to describe the connection between pollution and economic development in countries with similar trends. In a future research, more countries from Central and Eastern Europe will be considered.
Author Contributions
Conceptualization, M.S. and C.B.P.; methodology, M.S.; formal analysis, M.S.; resources, M.S., M.-D.V.N. and C.B.P.; data curation, M.S.; writing—original draft preparation, M.S.; project administration, M.S., M.-D.V.N. and C.B.P.; funding acquisition, M.S. All authors have read and agreed to the published version of the manuscript.
Funding
This work benefited from the European Union’s Horizon 2020 research and innovation program project BE-Rural funded under agreement No 818478.
Data Availability Statement
Not applicable.
Conflicts of Interest
The authors declare no conflict of interest.
References
- Shahzad, U.; Radulescu, M.; Rahim, S.; Isik, C.; Yousaf, Z.; Ionescu, S.A. Do Environment-Related Policy Instruments and Technologies Facilitate Renewable Energy Generation? Exploring the Contextual Evidence from Developed Economies. Energies 2021, 14, 690. [Google Scholar] [CrossRef]
- Sannigrahi, S.; Zhang, Q.; Pilla, F.; Joshi, P.K.; Basu, B.; Keesstra, S.; Ying Wang, R.; Sutton, P.; Chakraborti, S. Responses of ecosystem services to natural and anthropogenic forcings: A spatial regression-based assessment in the world’s largest mangrove ecosystem. Sci. Total Environ. 2020, 715, 137004. [Google Scholar] [CrossRef] [PubMed]
- Kaika, D.; Zervas, E. The Environmental Kuznets Curve (EKC) theory—Part A: Concept, causes and the CO2 emissions case. Energy Policy 2013, 62, 1392–1402. [Google Scholar] [CrossRef]
- Gill, A.R.; Viswanathan, K.K.; Hassan, S. The Environmental Kuznets Curve (EKC) and the environmental problem of the day. Renew. Sustain. Energy Rev. 2018, 81, 1636–1642. [Google Scholar] [CrossRef]
- Yao, S.; Zhang, S.; Zhang, X. Renewable energy, carbon emission and economic growth: A revised environmental Kuznets Curve perspective. J. Clean. Prod. 2019, 235, 1338–1352. [Google Scholar] [CrossRef]
- Bhattacharya, M.; Churchill, S.A.; Paramati, S.R. The dynamic impact of renewable energy and institutions on economic output and CO2 emissions across regions. Renew. Energy 2017, 111, 157–167. [Google Scholar] [CrossRef]
- Tugcu, C.T.; Ozturk, I.; Aslan, A. Renewable and non-renewable energy consumption and economic growth relationship revisited: Evidence from G7 countries. Energy Econ. 2012, 34, 1942–1950. [Google Scholar] [CrossRef]
- Apergis, N.; Payne, J.E. Renewable and non-renewable energy consumption-growth nexus: Evidence from a panel error correction model. Energy Econ. 2012, 34, 733–738. [Google Scholar] [CrossRef]
- US EIA. Annual Energy Outlook 2019 with Projections to 2050; Technical Report. 2019. Available online: https://www.eia.gov/pressroom/presentations/AEO2021_Release_Presentation.pdf (accessed on 10 February 2021). [CrossRef]
- Marques, A.C.; Caetano, R. The impact of foreign direct investment on emission reduction targets: Evidence from high-and middle-income countries. Struct. Change Econ. Dyn. 2020, 55, 107–118. [Google Scholar] [CrossRef]
- Zhu, L.; Hao, Y.; Lu, Z.N.; Wu, H.; Ran, Q. Do economic activities cause air pollution? Evidence from China’s major cities. Sustain. Cities Soc. 2019, 49, 101593. [Google Scholar] [CrossRef]
- Wang, X.; Lin, H.; Hong, J.; Mi, Z. Spatial Effects of Foreign Direct Investment on Carbon Emissions: Evidence from China’s Provincial Panel Data. In Proceedings of the 37th USAEE/IAEE North American Conference, Denver, CO, USA, 3–6 November 2019. [Google Scholar] [CrossRef]
- Huang, Y.; Chen, X.; Zhu, H.; Huang, C.; Tian, Z. The heterogeneous effects of FDI and foreign trade on CO2 emissions: Evidence from China. Math. Probl. Eng. 2019, 2019, 9612492. [Google Scholar] [CrossRef]
- Simionescu, M.; Bilan, Y.; Zawadzki, P.; Wojciechowski, A.; Rabe, M. GHG Emissions Mitigation in the European Union Based on Labor Market Changes. Energies 2021, 14, 465. [Google Scholar] [CrossRef]
- Al-Mulali, U.; Weng-Wai, C.; Sheau-Ting, L.; Mohammed, A.H. Investigating the environmental Kuznets curve (EKC) hypothesis by utilizing the ecological footprint as an indicator of environmental degradation. Ecol. Indic. 2015, 48, 315–323. [Google Scholar] [CrossRef]
- Grossman, G.M.; Krueger, A.B. Environmental Impacts of a North American Free Trade Agreement; No. w3914; NBER Working Paper Series; National Bureau of Economic Research: Cambridge, MA, USA, 1991. [Google Scholar] [CrossRef]
- Panayotou, T. Economic Growth and the Environment; United Nations Economic Commission for Europe; Harvard University: Cambridge, MA, USA, 2003; pp. 1–49. [Google Scholar]
- Martini, C.; Tiezzi, S. Is the environment a luxury? An empirical investigation using revealed preferences and household production. Resour. Energy Econ. 2014, 37, 147–167. [Google Scholar] [CrossRef]
- Ghalwash, T. Energy taxes as a signaling device: An empirical analysis of consumer preferences. Energy Policy 2007, 35, 29–38. [Google Scholar] [CrossRef]
- Lucas, R.E.; Wheeler, D.; Hettige, H. Economic Development, Environmental Regulation, and the International Migration of Toxic Industrial Pollution, 1960–1988; No. WPS 1062; World Bank Group: Washington, DC, USA, 1992. [Google Scholar]
- Dasgupta, S.; Laplante, B.; Wang, H.; Wheeler, D. Confronting the environmental Kuznets curve. J. Econ. Perspect. 2002, 16, 147–168. [Google Scholar] [CrossRef]
- Lopez, R.; Mitra, S. Corruption, pollution, and the Kuznets environment curve. J. Environ. Econ. Manag. 2000, 40, 137–150. [Google Scholar] [CrossRef]
- Di Vita, G. Renewable resources and waste recycling. Environ. Model. Assess. 2004, 9, 159–167. [Google Scholar] [CrossRef]
- Prieur, F. The environmental Kuznets curve in a world of irreversibility. Econ. Theory 2009, 40, 57–90. [Google Scholar] [CrossRef]
- Steger, T.M.; Egli, H. A dynamic model of the environmental Kuznets curve: Turning point and public policy. In Sustainable Resource Use and Economic Dynamics; Springer: Dordrecht, The Netherlands, 2007; pp. 17–34. [Google Scholar] [CrossRef]
- Hartman, R.; Kwon, O.S. Sustainable growth and the environmental Kuznets curve. J. Econ. Dyn. Control 2005, 29, 1701–1736. [Google Scholar] [CrossRef]
- Kijima, Y.; Otsuka, K.; Sserunkuuma, D. An inquiry into constraints on a green revolution in Sub-Saharan Africa: The case of NERICA rice in Uganda. World Dev. 2011, 39, 77–86. [Google Scholar] [CrossRef]
- Brock, W.A.; Taylor, M.S. The green Solow model. J. Econ. Growth 2010, 15, 127–153. [Google Scholar] [CrossRef]
- Xie, Q.; Xu, X.; Liu, X. Is there an EKC between economic growth and smog pollution in China? New evidence from semiparametric spatial autoregressive models. J. Clean. Prod. 2019, 220, 873–883. [Google Scholar] [CrossRef]
- Lazăr, D.; Minea, A.; Purcel, A.A. Pollution and economic growth: Evidence from Central and Eastern European countries. Energy Econ. 2019, 81, 1121–1131. [Google Scholar] [CrossRef]
- Hove, S.; Tursoy, T. An Investigation of the Environmental Kuznets Curve in Emerging Economies. J. Clean. Prod. 2019, 236, 117628. [Google Scholar] [CrossRef]
- Omri, A. Entrepreneurship, sectoral outputs and environmental improvement: International evidence. Technol. Forecast. Soc. Chang. 2018, 128, 46–55. [Google Scholar] [CrossRef]
- Ulucak, R.; Bilgili, F. A reinvestigation of EKC model by ecological footprint measurement for high, middle and low income countries. J. Clean. Prod. 2018, 188, 144–157. [Google Scholar] [CrossRef]
- Kim, D.-H.; Suen, Y.-B.; Lin, S.C. Carbon Dioxide Emissions and Trade: Evidence from Disaggregate Trade Data. Energy Econ. 2019, 78, 13–28. [Google Scholar] [CrossRef]
- Alvarado, R.; Ponce, P.; Criollo, A.; Córdova, K.; Khan, M.K. Environmental degradation and real per capita output: New evidence at the global level grouping countries by income levels. J. Clean. Prod. 2018, 189, 13–20. [Google Scholar] [CrossRef]
- Isik, C.; Ongan, S.; Ozdemir, D.; Ahmad, M.; Irfan, M.; Alvarado, R.; Ongan, A. The increases and decreases of the environment Kuznets curve (EKC) for 8 OECD countries. Environ. Sci. Pollut. Res. 2021, 1–9. [Google Scholar] [CrossRef]
- Akadırı, S.; Alola, A.A.; Usman, O. Energy mix outlook and the EKC hypothesis in BRICS countries: A perspective of economic freedom vs. economic growth. Environ. Sci. Pollut. Res. 2021, 28, 8922–8926. [Google Scholar] [CrossRef]
- Özokcu, S.; Özdemir, Ö. Economic growth, energy, and environmental Kuznets curve. Renew. Sust. Energ. Rev. 2017, 72, 639–647. [Google Scholar] [CrossRef]
- Albulescu, C.T.; Tiwari, A.K.; Yoon, S.M.; Kang, S.H. FDI, income, and environmental pollution in Latin America: Replication and extension using panel quantiles regression analysis. Energy Econ. 2019, 84, 104504. [Google Scholar] [CrossRef]
- Ozcan, B. The nexus between carbon emissions, energy consumption and economic growth in Middle East countries: A panel data analysis. Energy Policy 2013, 62, 1138–1147. [Google Scholar] [CrossRef]
- Pao, H.T.; Tsai, C.M. Multivariate Granger causality between CO2 emissions, energy consumption, FDI (foreign direct investment) and GDP (gross domestic product): Evidence from a panel of BRIC (Brazil, Russian Federation, India, and China) countries. Energy 2011, 36, 685–693. [Google Scholar] [CrossRef]
- Arouri, M.E.H.; Ben Youssef, A.; M’henni, H.; Rault, C. Energy consumption, economic growth and CO2 emissions in Middle East and North African countries. Energy Policy 2012, 45, 342–349. [Google Scholar] [CrossRef]
- Osabuohien, E.S.; Efobi, U.R.; Gitau, C.M.W. Beyond the Environmental Kuznets Curve in Africa: Evidence from Panel Cointegration. J. Environ. Policy Plan. 2014, 16, 517–538. [Google Scholar] [CrossRef]
- Hanif, I.; Gago-de-Santos, P. The importance of population control and macroeconomic stability to reducing environmental degradation: An empirical test of the environmental Kuznets curve for developing countries. Environ. Dev. 2017, 23, 1–9. [Google Scholar] [CrossRef]
- Nasir, M.A.; Duc Huynh, T.L.; Xuan Tram, H.T. Role of financial development, economic growth & foreign direct investment in driving climate change: A case of emerging ASEAN. J. Environ. Manag. 2019, 242, 131–141. [Google Scholar] [CrossRef]
- Waqih, M.A.U.; Bhutto, N.A.; Ghumro, N.H.; Kumar, S.; Salam, M.A. Rising environmental degradation and impact of foreign direct investment: An empirical evidence from SAARC region. J. Environ. Manag. 2019, 243, 472–480. [Google Scholar] [CrossRef] [PubMed]
- Antonakakis, N.; Chatziantoniou, I.; Filis, G. Energy consumption, CO2 emissions, and economic growth: An ethical dilemma. Renew. Sust. Energ. Rev. 2017, 68, 808–824. [Google Scholar] [CrossRef]
- López-Menéndez, A.J.; Pérez, R.; Moreno, B. Environmental costs and renewable energy: Re-visiting the Environmental Kuznets Curve. J. Environ. Manag. 2014, 145, 368–373. [Google Scholar] [CrossRef] [PubMed]
- Vasylieva, T.; Lyulyov, O.; Bilan, Y.; Streimikiene, D. Sustainable economic development and greenhouse gas emissions: The dynamic impact of renewable energy consumption, GDP, and corruption. Energies 2019, 12, 3289. [Google Scholar] [CrossRef]
- Chen, S.; Jin, H.; Lu, Y. Impact of urbanization on CO2 emissions and energy consumption structure: A panel data analysis for Chinese prefecture-level cities. Struct. Chang. Econ. Dyn. 2019, 49, 107–119. [Google Scholar] [CrossRef]
- Ridzuan, S. Inequality and the environmental Kuznets curve. J. Clean. Prod. 2019, 228, 1472–1481. [Google Scholar] [CrossRef]
- Destek, M.A.; Sarkodie, S.A. Investigation of environmental Kuznets curve for ecological footprint: The role of energy and financial development. Sci. Total Environ. 2019, 650, 2483–2489. [Google Scholar] [CrossRef]
- Łowicki, D. Landscape pattern as an indicator of urban air pollution of particulate matter in Poland. Ecol. Indic. 2019, 97, 17–24. [Google Scholar] [CrossRef]
- Pesaran, M.H. General diagnostic tests for cross-sectional dependence in panels. Empir. Econ. 2004, 1–38. [Google Scholar] [CrossRef]
- Pesaran, M.H. Estimation and inference in large heterogeneous panels with a multifactor error structure. Econometrica 2006, 74, 967–1012. [Google Scholar] [CrossRef]
- Fifeková, E.; Nemcová, E. Impact of FDI on economic growth: Evidence from V4 countries. Period. Polytech. Soc. Manag. Sci. 2015, 23, 7–14. [Google Scholar] [CrossRef]
- Gural, A.; Lomachynska, I. FDI and financial development as determinants of economic growth for V4 countries. Balt. J. Econ. Stud. 2017, 3. [Google Scholar] [CrossRef]
- Pesaran, M.H.; Shin, Y.; Smith, R.P. Pooled mean group estimation of dynamic heterogeneous panels. J. Am. Stat. Assoc. 1999, 94, 621–634. [Google Scholar] [CrossRef]
- Baltagi, B.H.; Fingleton, B.; Pirotte, A. A time-space dynamic panel data model with spatial moving average errors. Reg. Sci. Urban Econ. 2019, 76, 13–31. [Google Scholar] [CrossRef]
- Kasman, A.; Duman, Y.S. CO2 emissions, economic growth, energy consumption, trade and urbanization in new EU member and candidate countries: A panel data analysis. Econ. Model. 2015, 44, 97–103. [Google Scholar] [CrossRef]
- Narayan, P.K.; Narayan, S. Carbon dioxide emissions and economic growth: Panel data evidence from developing countries. Energy Policy 2010, 38, 661–666. [Google Scholar] [CrossRef]
- Aye, G.C.; Edoja, P.E. Effect of economic growth on CO2 emission in developing countries: Evidence from a dynamic panel threshold model. Cogent Econ. Financ. 2017, 5, 1379239. [Google Scholar] [CrossRef]
- Sinha, A.; Shahbaz, M.; Sengupta, T. Renewable energy policies and contradictions in causality: A case of Next 11 countries. J. Clean. Prod. 2018, 197, 73–84. [Google Scholar] [CrossRef]
- Santos, D.F.L.; Rezende, M.D.V.; Basso, L.F.C. Eco-innovation and business performance in emerging and developed economies. J. Clean. Prod. 2019, 237, 117674. [Google Scholar] [CrossRef]
- Hammons, T.; Boyer, J.; Conners, S.; Davies, M.; Ellis, M.; Fraser, M.; Holt, E.; Markard, J. Renewable energy alternatives for developed countries. IEEE Trans. Energy Convers. 2000, 15, 481–493. [Google Scholar] [CrossRef]

Publisher’s Note: MDPI stays neutral with regard to jurisdictional claims in published maps and institutional affiliations. |
© 2021 by the authors. Licensee MDPI, Basel, Switzerland. This article is an open access article distributed under the terms and conditions of the Creative Commons Attribution (CC BY) license (https://creativecommons.org/licenses/by/4.0/).