Article

Subcritical Hydrothermal Co-Liquefaction of Process Rejects at a Wastepaper-Based Paper Mill with Waste Soybean Oil

Department of Environmental Engineering, National l-Lan University, No.1, Sec. 1, Shen-Lung Rd., Yi-Lan 26041, Taiwan
*
Author to whom correspondence should be addressed.
Energies 2021, 14(9), 2442; https://doi.org/10.3390/en14092442
Submission received: 18 March 2021 / Revised: 16 April 2021 / Accepted: 20 April 2021 / Published: 25 April 2021

Abstract

:
This study used the subcritical hydrothermal liquefaction technique (SHLT) in the co- liquefaction of process rejects at a wastepaper-based paper mill (PRWPM) and waste soybean oil (WSO) for the production of biofuels and bio-char material. PRWPM emits complicated waste composed of cellulose, hemicellulose, lignin, and plastic from sealing film. The waste is produced from the recycled paper process of a mill plant located in central Taiwan. The source of WSO is the rejected organic waste from a cooking oil factory located in north Taiwan. PRWPM and WSO are suitable for use as fuels, but due to their high oxygen content, their use as commercial liquid fuels is not frequent, thus making deoxygenation and hydrogenation necessary. The temperature and pressure of SHLT were set at 523–643 K and 40–250 bar, respectively. The experimental conditions included solvent ratios of oil–water, temperature, reaction time, and ratios of solvent to PRWPM. The analysis results contained approximated components, heating values, elements, surface features, simulated distillations, product compositions, and recovery yields. The HHV of the product occurred at an oil–water ratio of 75:25, with a value of 38.04 MJ kg−1. At an oil–water ratio of 25:75, the liquid oil-phase product of SHTL has the highest heating value 42.02 MJ kg−1. Higher WSO content implies a lower heating value of the oil-phase product. The simulated distillation result of the oil-phase product with higher content of alcohol and alkanes obtained at the oil–water ratio of 25:75 is better than the other ratios. Here, the carbon number of the oil product is between C8–C36. The product conversion rate rises with an increase of the WSO ratio. It is proved that blending soybean oil with water can significantly enhance the quality of liquefied oil and the conversion rate of PRWPM. Therefore, the solid and liquid biomass wastes co-liquefaction to produce gas and liquid biofuels under SHLT are quite feasible.

1. Introduction

Paper rejected from recycled paper mills is a derivative waste generated from the paper industry’s recyclables and has high moisture content. In this era of rapid information exchange, the paper industry has flourished, and demand for cutting trees to make pulp has gradually increased. With rising awareness of environmental protection in society, the paper industry is recycling a large amount of waste paper to produce recycled paper, which has led to another kind of waste. Therefore, the paper rejected from the paper manufacturing process is also produced in large quantities. The paper-recycling process of paper mills generates reject waste equivalent to 5% to 25% of its raw material, depending on the recovered fiber quality and process used in the mill. The components of reject waste are largely comprised of 51% fiber and 49% plastic [1].
Liquefaction is a thermal chemical and physical process that converts biomass and or bio-waste into liquids, gases, and hydro-chars, with liquid products as the primary target. Among the processes producing liquid biofuel, the methods of hydrothermal liquefaction (HTL) [2], hydrothermal carbonization (HTC) [3], and high-pressure steam for autoclaving (HPSA) [4] have been applied by many researchers due to the simplicity of the process. The derivative fuels and cokes produced by HTL and HTC have high heating value and convenient storage and transportation and can be used as an auxiliary fuel for boilers or directly used in generators [5].
HTL and HTC are utilization methods of thermal cracking technology. The purpose is to convert organic waste into liquid and coke, and the reaction temperature and reaction time are lower than those of general thermal cracking. Generally, the thermal pyrolysis temperature is above 400–800 °C in an oxygen-free environment, while HTL and HTC require only a sealing condition above 230 °C [6]. Cheng et al. [7] used machine learning models (i.e., random forest) to fit the existing laboratory data and then use it to predict the yields and characteristics of biochar produced from slow pyrolysis of different feedstocks, including crop residues and woody wastes. The results indicate that random forest models offer good prediction accuracy for laboratory-scale (R2 = 0.78–0.87) and pilot-scale pyrolysis data (R2 = 0.45−0.65). Water is an environmentally and friendly solvent, and HTL and HTC have great advantages, including the ability to work with wet-based wastes and remove oxygen from liquid fuel [8]. Water has different definitions under different temperature and pressure conditions. It is called subcritical water at the range of 180–374 °C and pressure of 2–22 MPa and is called supercritical water above 374 °C and pressure of 22.1 MPa. Under subcritical conditions, the dielectric constant is reduced from 78 to 14, which produces hydrophobic properties that increase the solubility of free fatty acids in water [9]. The physicochemical properties of subcritical and supercritical waters are different from those in general environments. The main difference is that they have high dissociation properties, which make subcritical water and supercritical exhibit a highly reactive reaction medium for direct liquefaction of biomass [10].
The role is like a catalyst [11,12]. Although the addition of a metal catalyst can improve hydrothermal cracking [13] or polymerization [14], the removal of the solid catalyst afterwards still requires a separation [15] or fractionation process [16]. Cheng et al. [17] also used machine learning models to develop and predict product yields and characteristics from HTT of various feedstocks. Results showed random forest models had better prediction accuracy than regression tree and multiple linear regression to model HTT of feedstocks and predicted the mass yields of multiple products. Compared with the conventional carbon capture and sequestration (BECCS) system, hydrothermal treatment (HTT) with carbon capture and storage (CCS) (HTT–CCS) generally exhibited higher EROI but higher net GWP, depending on processing conditions and the feedstock types.
The HTL of biomass, in general, uses water or waste cooking oil (taking waste soybean oil (WSO) as target) as a solvent. That reason is that the raw material usually contains a lot of water and it can be used as a solvent, therefore HTL does not require drying pre-treatment. The general pyrolysis process uses dry-based materials, which requires an additional drying process [18]. Therefore, hydrothermal cracking, as an alternative to general pyrolysis, directly converts wet-based raw materials into biofuels at high temperatures (200–350 °C) and high pressure (40–200 MPa) in the presence of water [19]. Regarding co-processing effects, Li et al. [20] investigated the co-liquefaction of municipal sewage sludge (MSS) and lignocellulosic biomass such as rice straw or wood sawdust at different mixing ratios. Synergistic effects were found during co-processing of MSS with biomass for production of bio-oil with higher yield and better fuel properties than those from individual feedstock [20]. Zhang et al. [21] investigated the co-liquefaction of secondary pulp/paper-mill sludge (solids concentration: 1.6 wt.%) and waste newspaper with a total solid concentration of 11.3 wt.% with and without the addition of catalysts in a 75 mL Parr High-Pressure reactor at temperatures of 250–380 °C for 20 min. They also found that synergistic effects between secondary pulp/paper-mill sludge and waste newspaper were observed in the co-liquefaction operations [21]. For example, the heavy oil yield attained was 26.9 wt.% at 300 °C in the co-liquefaction of the mixture of 33 wt.% sludge and 67 wt.% waste newspaper, and was noted to be 9 wt.% and 6 wt.% higher than the yields obtained from liquefaction of sludge and waste newspaper alone, respectively. Therefore, this study shall use subcritical hydrothermal liquefaction (SHTL) to carry out the potential of fuels and cokes from the process rejects of a waste paper-based paper mill (PRWPM) and WSO. The purpose of this study is also to assist in the recovery of waste cooking oil (WCO) and PRWPM to new products of fuels and materials using co-liquefaction process.

2. Experiment Section

2.1. Materials

PRWPM involve complex waste consisting of cellulose, hemicellulose, lignin, and plastic for sealing membranes. This study took such PRWPM from a paper mill in central Taiwan. The waste soybean oil (WSO) of this study is sourced from organic waste produced by an edible oil plant located in northern Taiwan. After pre-drying treatment of PRWPM, it becomes the experimental sample. Under the control of different solvent mixing ratios of PRWPM to WSO, the effects of temperature and pressure are thus subsequently explored.
Solid, liquid, and gas samples were collected for analysis of characteristics. Liquid products were compared with commercial oil products to explore the potential for future reuse and development. Table 1 lists the characteristics for analysis of PRWPM and shows their approximate results. We see that PRWPM contains a large amount of moisture, and so pre-drying treatment is required before the experiment. The volatile, fixed carbon, and ash contents in the dry-based material are 90.32, 1.27, and 8.4 wt.%, respectively. Table 1 also presents the results of heating value analysis. The high heating value (HHV) of the dry basis is about 30.52 MJ kg−1, denoting that PRWPM is suitable for fuel after dehydration. Table 1 also shows the results of elemental analysis. The contents of N, C, H, S, and O are 0.26, 55.97, 8.45, 0.13, and 35.19 wt.%, respectively. As it can be seen from the table, the oxygen content of PRWPM is large. Therefore, in order to reduce the oxygen content of the fuel during the experiment, a deoxidation process must be performed to avoid a large amount of oxygen in the product and any reduction of quality in the final fuel.

2.2. Experimental Equipment

The equipment used in this study is a high-temperature and pressure autoclave (HTPA) (Figure 1). This equipment has the characteristics of high temperature and pressure resistance and also includes the function of controlling temperature and speed. The volume of the equipment tank is 1 L, and the upper limit temperature and pressure are 500 °C and 3.52 × 10⁶ kg m−2, respectively. Mathanker et al. [10] used the similar reactor of Figure 1 for the HTL of corn stover, obtained from north Alberta farms, at different temperatures of 250, 300, 350, and 375 °C, initial pressures (Pi) of 2.11 × 10⁵ and 4.22 × 10⁵ kg m−2 and retention time (tr) of 0, 15, 30, and 60 min. However, the limit temperature and pressure of this study are higher than the reference.

2.3. Subcritical Hydrothermal Liquefaction (SHTL) Experiment

This experiment is a batch experiment, where the sample feeding quantity of PRWPM is about 40 g in HTPA. The experimental steps are as follows. (1) The slag-draining dry sample of PRWPM was prepared after removing impurities through the pre-screening process and placed in HTPA (Figure 1). (2) Distilled water was a solvent, and 400 mL was placed in HTPA. The ratio of solvent to sample is about 10:1. (3) The N2 gas was passed to keep the reactor in a pure N2 environment and tested for leakage. (4) The heating and stirring device was turned on, the target temperature was set to 573, 613, and 643 K at the subcritical hydrothermal conditions, and the spin speed was adjusted to 300 rpm. (5) After reaching the target temperature, the heating power was reduced and the temperature was kept constant for 0.5, 1, 2, and 4 h. (6) A water-cooled cooling system was used to cool HTPA to 333 K. (6) An air-cooled cooling system was used for the temperature of 298K, the exhaust gas was released, and then the solid and liquid samples were taken and analyzed.

2.4. Subcritical Hydrothermal Liquefaction (SHTL) Experiment with WSO

This experiment is similar to the SHTL experiment, and the ratio of the mixed solvent WSO to sample material PRWPM is about 10 mL:1 g. Previous studies have obtained an optimized experimental operating temperature of 573 K and reaction time of 2 h. The mixed solvent was processed with oil–water ratios of 0:100, 25:75, 50:50, 75:25, and 100:0 and with a total liquid of 400 mL.

2.5. Product Analysis

The products can be divided into solid, liquid, and gas-phase ones produced after the SHTL experiment. The solid-phase products were analyzed by a scanning electron microscope (SEM) and Fourier-transform infrared spectroscopy (FTIR). Property analyses included approximate, elemental, and heating value analyses. Liquid-phase products were analyzed by gas chromatography mass spectrometry (GC/MS), and property analyses included heating value analysis and pH value. The gas-phase products were analyzed for the contents of N2, H2, CO, CO2, and CH4 by a gas chromatography thermal conductivity detector (GC/TCD).

3. Results and Discussion

3.1. Characteristic Analysis of the Solid-Phase Products from SHTL with and without WSO

The experiment’s HHV of dry basis of PRWPM is 30.52 MJ kg−1. Table S1 shows the HHV of the solid-phase residue produced after SHTL. Comparing the reaction temperatures and times, the HHV of the solid-phase product reaches the highest at 573 K and 1 h, which is 40.20 MJ kg−1. With the rise of temperature and holding times, the HHV of the product gradually decreased to a minimum of 34.69 MJ kg−1 at 643 K for 4 h. It shows that the prolonged holding time has a continuous effect on the cracking of the raw material, resulting in a decrease in HHV.
Table 2 shows that the addition of WSO will increase HHV, and HHV will increase with the increase of WSO. However, when 100% WSO is used, the heating value obviously decreases, and therefore the water content has an absolute effect on the increase of the heating value. It is speculated that when water is used as a solvent to a subcritical environment, the solid product’s HHV improves, and the experimental conditions of 100% WSO cannot reach the subcritical state and have no such effect. Therefore, in order to obtain solid-phase products with a higher energy application value, it is necessary to choose operating conditions with a small proportion of water as a subcritical solvent, and solid-phase products with higher heating values can then be obtained. The HHV of the product occurred at an oil–water ratio of 75:25, with a value of 38.04 MJ kg−1. This is much higher than the calorific value of 29.73 MJ kg−1 of anthracite. Therefore, the floc/fiber of solid-phase products can be used to manufacture the refused derived fuel (RDF) or solid recovered fuel (SRF) via granulation with or without torrefaction [23,24].
Table S1 contains an approximate analysis of the solid-phase products. The volatile content decreased with increasing temperature; otherwise, the ash and fixed carbon contents increased with increasing temperature. The decrease of volatile content may arise, because the high-molecular products in the solid-phase products cracked into low-molecular products. Conversely, the ratios of ash and fixed carbon rose with increasing temperature, especially after the temperature of 613K, where the ash content increased significantly. The maximum ash ratio was about 15.65 wt.% at 643 K, which is 1hr and 1.86 times larger than that in the dry PRWPM.
Contrary to the effect in temperature, the overall volatile content of solid-phase products increased sharply above 98 wt.% after the addition of WSO and rose slightly with the increase in the ratio of WSO. Both fixed carbon and ash content decreased, and their maximum values were 0.56 and 1.67 wt.% at oil to water ratios of 75:25 and 25:75, respectively. Furthermore, the ash content of 8.4 wt.% decreased to 0.67–1.67 wt.% after the addition of WSO. Therefore, the difference in ash content is obvious. It is speculated during the reaction that WSO was partially converted into solid volatile matter after subcritical hydrothermal creaking, which could be mutually corroborated with the change of heating value in Table 2. The reduction of ash and fixed carbon may be dissolved into the oil phase.
Elemental analysis results for solid products from SHTL with and without WSO are shown in Table S1 and Table 2. The C, N, and H ratios of solid products all increased when compared to dry PRWPM, showing that the biomass is carbonized and concentrated. It is worth noting that the O content decreased in all cases, and so the deoxidation effect was obvious. The C content decreased with increasing temperature; otherwise, the O and S contents increased with increasing temperature; however, the H content did not change significantly. Temperature is the main factor for the component changes of PRWPM.

3.2. Elemental Analysis of Solid-Phase Products

The elemental analysis results of N, C, S, and H are shown in Table S1. Compared with the PRWPM under each operating condition, the N, C, and H ratios of the residues all increased, showing that the biomass is carbonized and concentrated after the SHTL process. The highest N concentration in the residue occurs in 613 K, while the C content decreases with increasing temperature, and the S content increases with increasing temperature, but there is no obvious change rule for H content. However, the O content decreased in an all-round way, and so the deoxidation effect was obvious.
The addition of WSO can increase the C and H ratios of solid phase products and decrease the O and S ratios, indicating that adding WSO can enhance the effects of carbonization and hydrodeoxygenation. Especially in the presence of water, the effects of carbonization, hydrogenation, and deoxidation significantly improved; otherwise, when WSO is used as a solvent without water, the carbonization, hydrogenation, and deoxidation effects are less obvious and the HHV decreases. While water is used as a solvent in SHTL, the element extraction of S from the solid product is more positive. With the increase of WSO content, the S element reached a minimum of 0.01 wt.% at an oil–water ratio of 75:25. There is a nearly 13-times decrease, indicating that the presence of the oil phase transforms the S element from the solid to the liquid phase.

3.3. SEM Image of Solid Phase Products

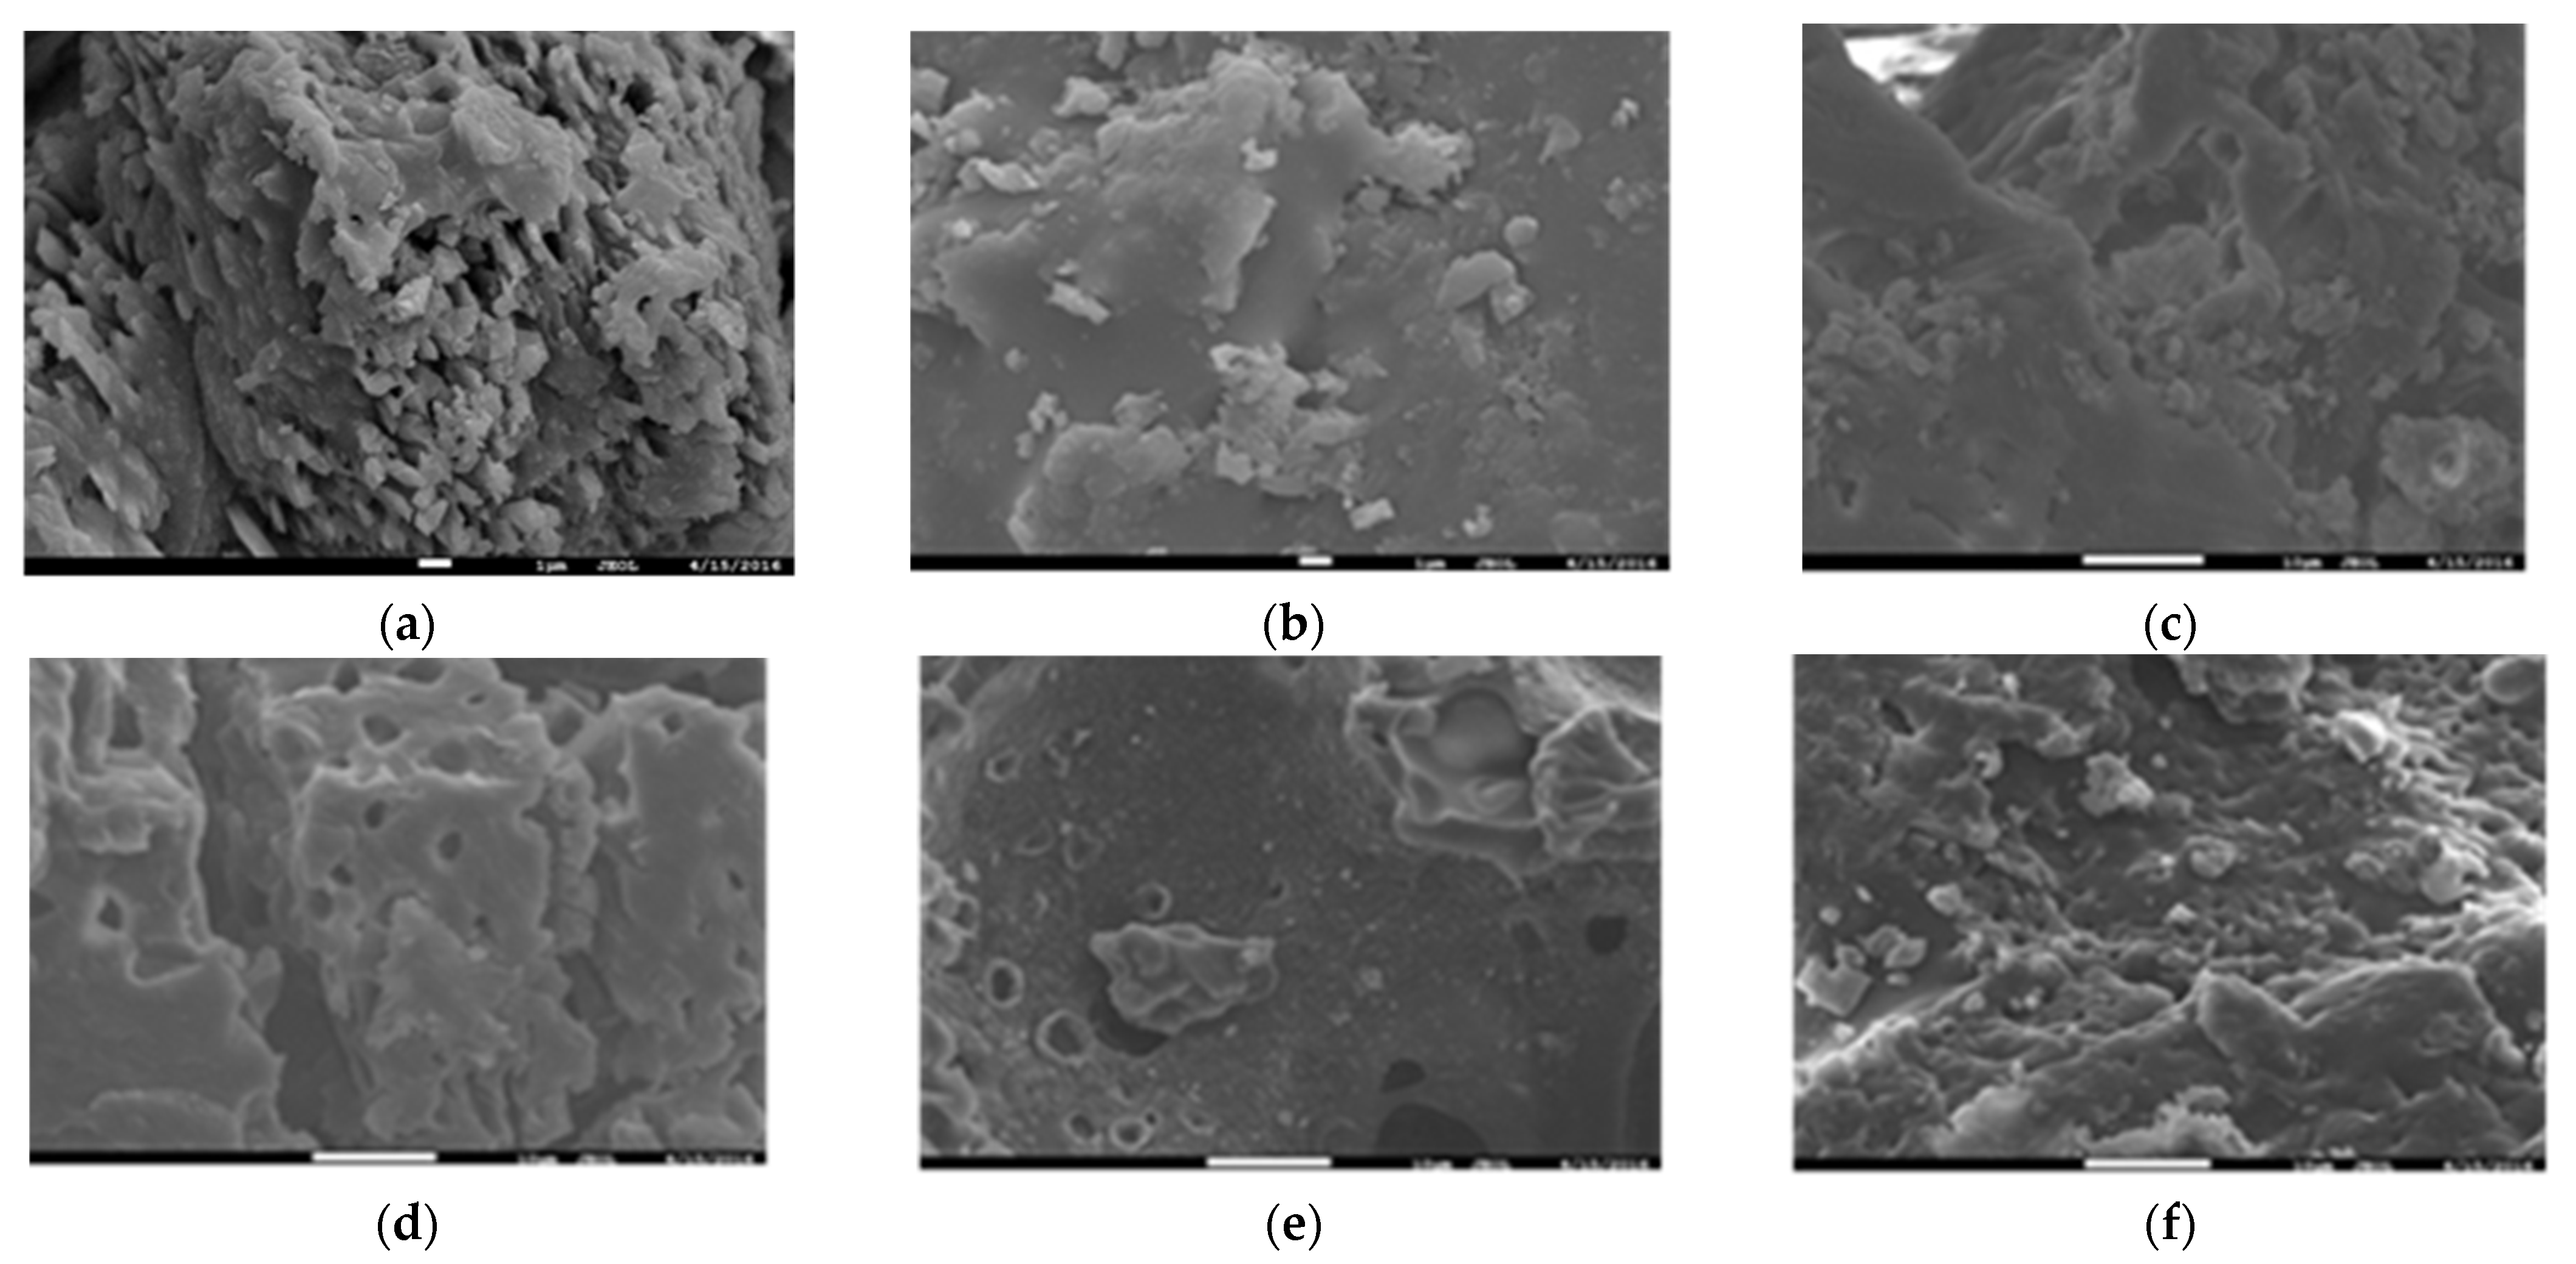
SEM analysis results are shown in Figure 2 and Figure S1. In Figure 2a, we see that raw PRWPM has an irregular layered structure, indicating that the raw material structure is relatively fluffy. With water as the solvent and holding the temperature of 613 K for 0.5 h to 4 h (Figure S1a,d), the sample changed from cracking into small pieces and showed irregular overlapping sheets, and the edge was cracked and in smaller lumps. Therefore, if the holding time is increased, then the phenomenon of secondary cracking and reorganization will occur again. At the same time, as the temperature increases, the cracking reaction becomes more obvious, as shown in Figure S1c,e and Figure 2b. Display temperature is the main factor of thermal cracking. The SEM image also shows at 573 K and 2 h reaction temperature and time, respectively, that the optimal size of the cracked product can be obtained (Figure 2b for oil–water ratio of 100:0), while at the highest temperature and holding time (Figure S1f), the reaction trend after completeness, the pores disappeared, and the small residues were broken. At a fixed 573 K and 2 h, different ratios of soybean oil were blended. In Figure 2c for an oil–water ratio of 25:75, some products can be seen undergoing the polymerization and cementation phenomena. In Figure 2d, the oil–water ratio is 50:50, the polymerization and cementation phenomena are more obvious, there are lamellar and partial layered structures, and there are also holes. Under the condition of an oil–water ratio of 75:25, product polymerization and cementation also occur together with cracking (Figure 2e). In Figure 2f, the oil–water ratio of 100:0 is all oil, except for the obvious layered polymerization. There are more broken particles and holes, but there are shrinkages, indicating that the product exhibits a common reaction phenomenon of cracking and recombination.

3.4. Characteristics of Liquid-Phase Product

In the SHTL program, the liquid-phase products include water-phase products and oil-phase products. After fractional distillation, heating value analysis, elemental analysis, qualitative composition analysis (GC/MS), simulated distillation, and pH analysis of oil-phase product were then performed. When WSO is not added (WSO-water ratio = 0:100), the liquid-phase products are subjected to simulated distillation, and the analysis results are shown in Figure S2a,b. The carbon number distribution of the liquid-phase product is between C8 and C28. Because the water content of the liquid-phase product is too high, it cannot be used directly commercially and still needs fractionation or separation procedures. It can be seen from the figure that there are many higher molecular products under the conditions of 0.5, 1, and 4 h. Furthermore, if the carbon number is compared, then the simulated distillation result is the optimum under the condition of 573 K and 2 h. One possible reason is that as the temperature rises, the recombination and polymerization phenomena will be higher than under cracking. The extended temperature holding time not increasing the quality of the product oil may be due to the incompleteness of cracking when the time is shorter and because recombination and aggregation may occur, resulting in lower quality when the time is longer. Therefore, this condition was used as the optimum parameter for the subsequent blending experiment.
When WSO is not added, the liquid is analyzed by GC/MS, and the analysis results are shown in Figure S3a,b. These figures show that the main components in each liquid-phase product are phenols and alcohol compounds, while alkanes only appear at 573 K for 0.5 h. The other obvious products are ketones and olefins. This illustrates that increasing the temperature and holding time will not increase the content of alkanes, but that changing the temperature and holding time will produce more by-products, because the oxygen content in the liquid-phase product is still too high, and the phenol is the majority compound in the liquid-phase product. Therefore, if a higher-quality liquid product is to be obtained in the future, then a deoxygenation process is still needed to improve the quality of the liquid product.
The liquid products can be divided into oil-phase and liquid-phase products. The pH value of the liquid product is between 3.86 and 4.41, which is 4.14 at 573 K for 2 h. The pH value of the product also rises as the temperature rises, indicating that higher temperatures may cause liquefaction to incur carboxylation. It may also be due to the high temperature, and the composition of the liquid product is reorganized. Therefore, the temperature is also related to the pH value.
The results of the heating value analysis of the oil-phase product are shown in Table 3 and Figure S3. At an oil–water ratio of 25:75, the liquid oil-phase product of SHTL has the highest heating value 42.02 MJ kg−1. Higher WSO content implies a lower heating value of the oil-phase product. When the oil–water ratio is 100:0, the oil-phase product has the lowest heating value of 38.56 MJ kg−1, which is lower than the raw material WSO, indicating that the WSO content affects the heating value of the oil-phase product. Therefore, the presence of water can help the solid sample into the liquid oil, and WSO undergoes a liquid-phase co-cracking reaction, which changes its original characteristics. Experiments with a lower blending ratio of WSO can obtain oil-phase products with higher heating value.

3.5. Elemental Analysis of Oil-Phase Products

The elemental analysis results of the oil-phase product are shown in Table 3. Compared with WSO, the content of C in the oil-phase product increases as the proportion of water increases, the contents of O, N, and S increase, and the H content remains unchanged. It shows that water has strong decarbonization and hydrodeoxygenation effects on PRWPM and WSO, and at the same time, the oxygens in PRWPM and water are transferred into oil-phase products [25]. The higher the water content is, the more obvious the effect is. Based on the above descriptions, the experiment with more water will cause drastic changes in the characteristics of WSO and can produce better quality oil-phase products, showing that WSO participates in the cracking and liquefaction reactions. Therefore, the blending of high-content water with low WSO can obtain oil-phase products with large element quality variation and high heating value.

3.6. Composition Analysis of Oil-Phase Products

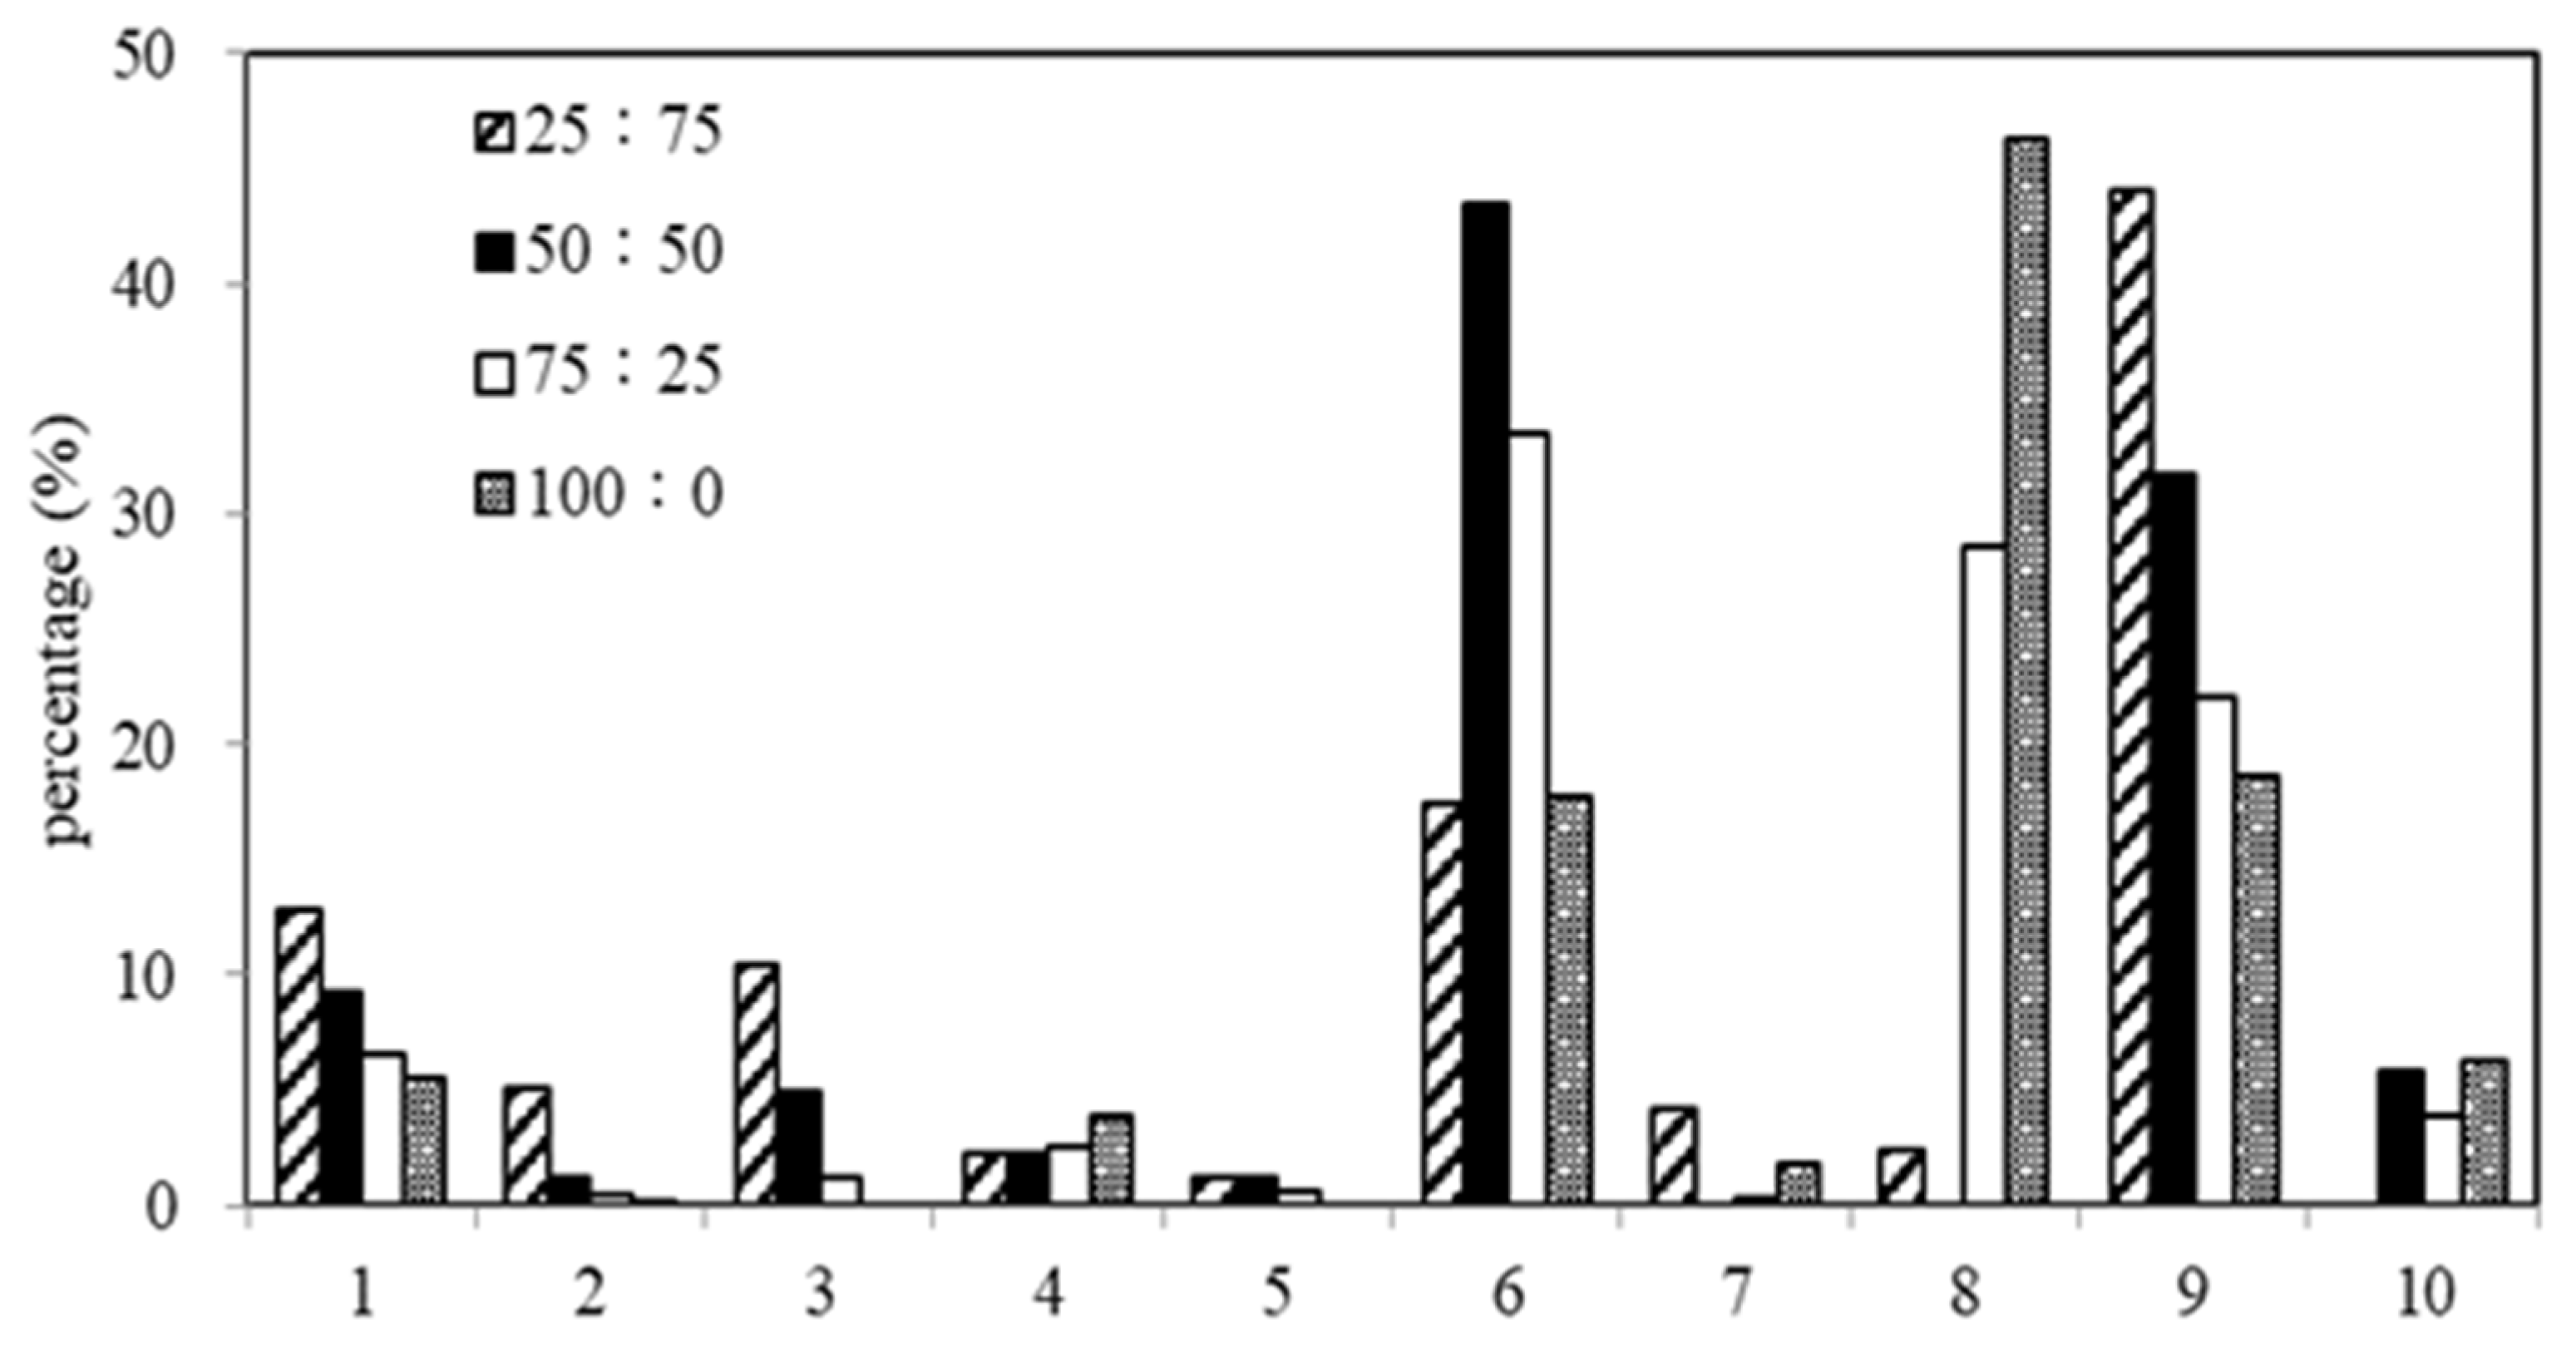
The oil-phase products were analyzed by GC/MS, and the results are in Figure 3. According to its composition, it can be divided into ten categories: Alcohol, benzene, alkenyl, ketone, phenol, acid, alkyl, digitoxin, ester, and other. The components with the largest proportion are acid, digitoxin, and ester. It can be found from Figure 3 that different oil–water ratios produce different oil-phase products. At an oil-to-water ratio of 25:75, the higher ratios of esters, acids, alcohols, alkenyls, and alkanes can be obtained in sequence, which proves that the quality of the oil-phase product is closer to that of light olefin. Brown et al. converted marine microalga Nannochloropsis sp. into a crude bio-oil product and a gaseous product via hydrothermal processing [26]. The constituents of a crude bio-oil product include phenol and its alkylated derivatives [27], heterocyclic N-containing compounds [28], long-chain fatty acids, alkanes and alkenes, and derivatives of phytol and cholesterol [29,30]. Some compounds are the same as this study. At a ratio of 50:50, acids are the most dominant components. At 100:0, digitoxin is the most important type. Therefore, 25:75 is selected as the optimum ratio condition. The similar results are shown in literature [21], for example, the bio-oils produced from MSS/biomass mixtures were mainly composed of esters and phenols with lower boiling points (degradation temperatures) than those from individual feedstock (identified with higher heavy bio-oil fractions). These synergistic effects probably resulted from the interactions between the intermittent products of PRWPM and those of WSO during processing.

3.7. Simulated Distillation Analysis of Oil-Phase Products

The oil-phase products and commercial oils are analyzed for different boiling points by GC, according to the Standard Test Method for Boiling Range Distribution of Petroleum Fractions, as proposed by the ASTM D-2887 method. The simulated distillation results are shown in Figure 4. From the comparison of the simulated distillation diagrams, it can be seen that all the obtained oil products have a hydrothermal cracking phenomenon compared with WSO, and their molecular weight is reduced. The simulated distillation result of the oil-phase product with higher content of alcohol and alkanes obtained at the oil–water ratio of 25:75 is better than the other ratios. Here, the carbon number of the oil product is between C8–C36. The optimum product can be obtained under this condition; however, the simulated distillation results of these oil products with these ratios are still not up to the quality of commercial oil like diesel fuel, kerosene, Jet A-1, and gasoline. Therefore, PRWPM is not only converted into oils, but also assists in cracking WSO into fuel. Gollakota et al. indicated that HTL of biomass seems to be the promising route for the engenderment of bio-oil equipollent to conventional crude oil. In this context, biomass-derived fuels seem to be the promising path [24]. Furthermore, this technology has the potential to treat both solid and liquid wastes at the same time. Wu et al. [31] obtained similar result for aqueous phase oil denoted as LO1 in his study. Furthermore, Davidson et al. [32] studied treatment of aqueous phase using ZnxZryOz catalyst for production of C3–C5 olefins, therefore it is necessary to further use catalysts to improve the quality of oil products.

3.8. pH Value of Oil-Phase and Liquid-Phase Products

The pH values of the oil-phase and liquid-phase products are shown in Table 3. It can be seen in the oil-phase product that the pH value is between 4.8–5, the liquid-phase product is between 4.09–4.48, and that both of them are slightly acidic, possibly because they contain a large amount of carboxyl oxygen compounds. It can be known that the more water is added, the lower is the pH of the liquid-phase product, indicating that higher water content will assist in deoxidation, and that there seems to be a linear correlation with the water content.

3.9. Gas-Phase Product Analysis

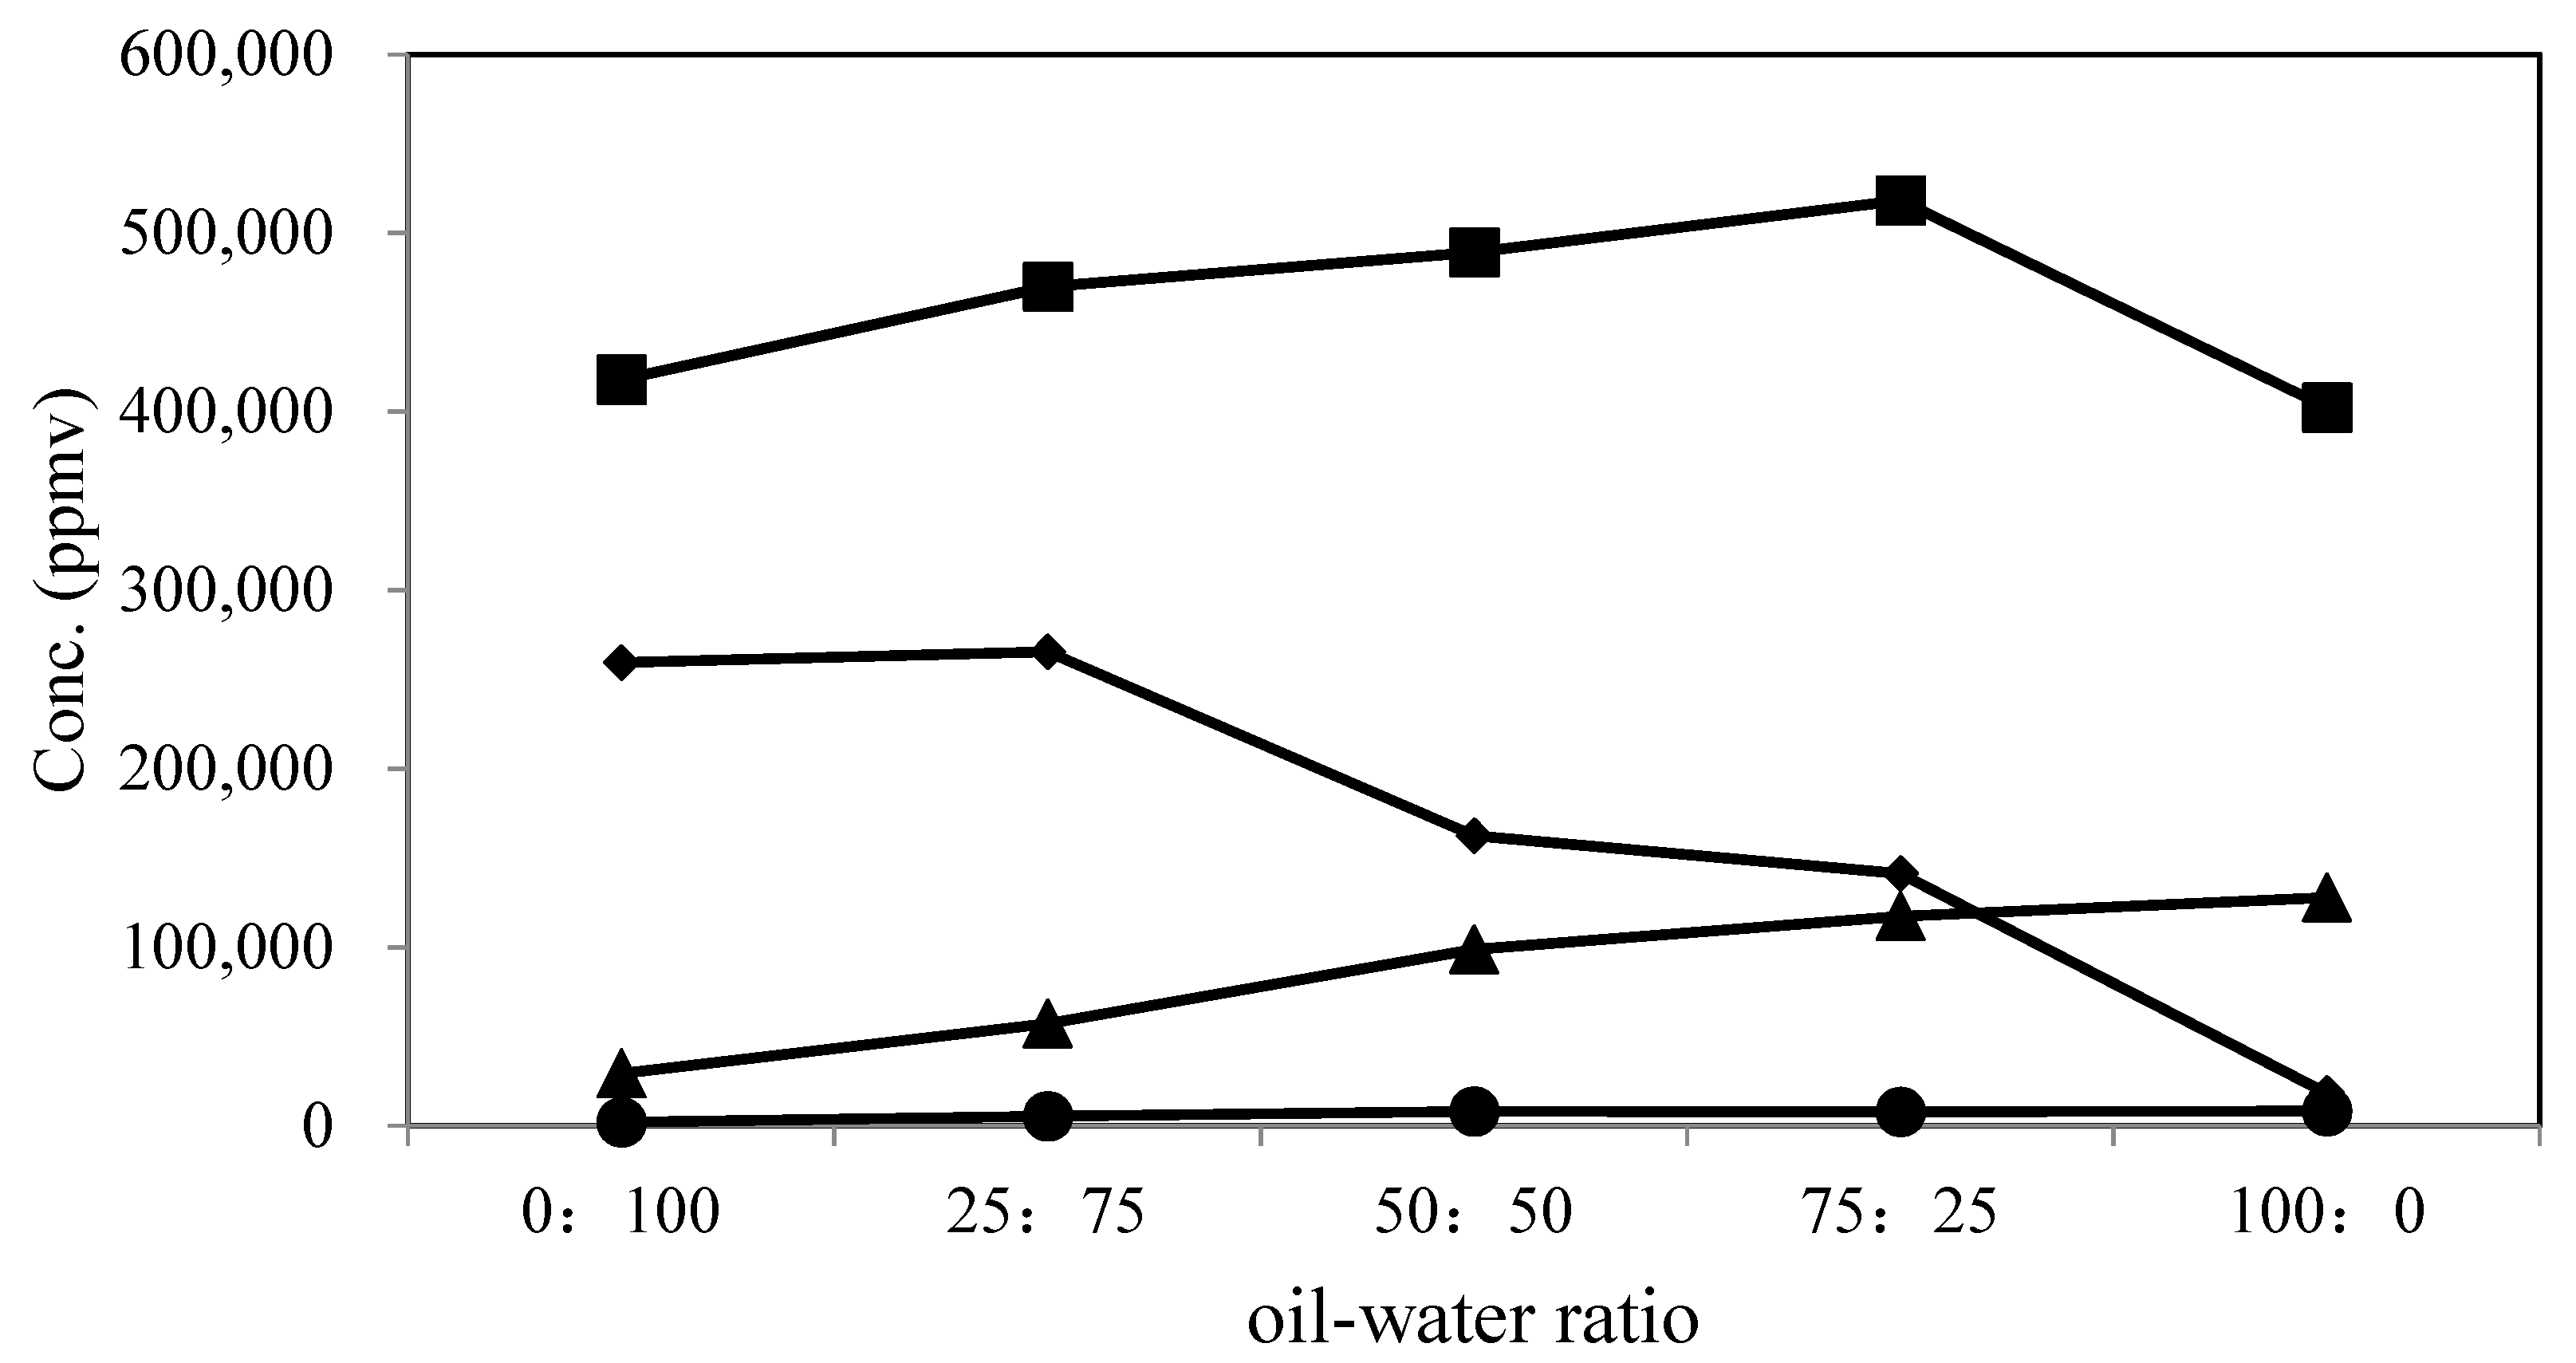
Table 4 and Figure 5 show the results of gas-phase products after GC/TCD analysis. First, in the CO2 part, as the content of added WSO increases, the total gas concentration will continue to increase, reaching the highest peak at an oil–water ratio of 75:25, indicating that the addition of WSO will result in CO2 and enhance deoxidation. However, the lowest CO2 gas concentration is in the absence of water, which may be due to the lack of water to assist in the deoxidation effect. In the H2 part, when the oil–water ratios are 0:100 and 25:75, the gas concentrations of H2 are 259,497 and 265,468 ppmv, respectively. However, in the free nitrogen and steam environment, the H2 ratio in the oil–water ratio of 0:100 reaches the highest percentage of 36.62, while in the WSO free environment or when the amount of water is gradually reduced, the concentration of H2 gas decreases distinctly. The reason could be due to the reduction of the dehydrogenation effect from water or the reduction of self-dissociation dehydrogenation. As the concentrations of CO and CH4 increase, the gas concentrations also increase as the proportion of WSO increases. The reason is the same as the increase in CO2 concentration. Furthermore, the trends of CO and CO2 are completely different when the oil–water ratio is 100:0, which shows in the absence of water that the main deoxidation reaction contributes to the formation of CO. Gas product concentration will increase as the content of WSO increases, reaching the highest gas yield at a blending ratio of 75:25, with a value of 3253 mg.

3.10. Yield and Conversion Rate

The conversion and total recovery rate of each product in the SHTL process are shown in Table 5 and Figure S6. The conversion is 35–93 wt.%., and the value increases with an increase of the WSO ratio. The lowest value of 35 wt.% is at an oil–water ratio of 25:75, and the highest one is at a ratio of 100:0. This shows that the oily medium can help the conversion of solid biomass, and the presence of water will slightly inhibit the phenomenon. The oil-phase solvent can assist with the absorption of oil product, or the liquefied oil can be dissolved into the solvent. Thus, WSO can enhance the cracking of solid biomass. Therefore, it is proved that the cracking in the oil phase is more complete than that in the water phase.
Table 5 also shows the recovery rate of all products, and the total recovery rates are between 88–98 wt.%, proving that the SHTL system has high integrity and low loss of products. The lowest recovery rate occurs at an oil–water ratio of 75:25, which may be due to too much light oil and VOC gas escaping out of the reactor. It may be that the liquid phase volatilizes and the gas phase escapes at the same time when the reaction tank is opened. Therefore, the total recovery rate is below 100%. It is recommended to add a condensation recovery system to increase the product recovery rate.

4. Conclusions

This study used PRWPM and WSO to produce biofuels using SHTL, and water was employed as a solvent at different mixing ratios to improve the conversion rate and fuel quality. The SHTL process uses a mobile high-temperature and high-pressure liquefaction reactor to investigate the influence of various operating parameters on the quality of gas, solid products, and liquid oil. Solid-phase product analysis shows that HHV increases as WSO added increases. However, when WSO goes to 100%, HHV will decrease significantly, and therefore the water steam has an obvious effect on the increase of HHV. Furthermore, the addition of WSO will increase the volatile, C, and H contents of the solid-phase products and will decrease the N and O contents, indicating that WSO can effectively enhance cracking and deoxidizing effects. For HHV of a liquid product, the higher the blending ratio is of WSO, the lower is the liquid product’s HHV. The conversion rate increases as the WSO ratio increases, and the highest one occurs at an oil-to-water ratio of 100:0. Therefore, it shows that an increase in WSO can make the reaction more complete. The overall recovery rate is more than 90%, which proves that the oil–water mixing has a decisive influence on the liquefied product. Under the blending optimum condition, the carbon distribution of the liquid product is between commercial diesel and biodiesel. Moreover, the concentration of gas product increases as the content of WSO increases, indicating that this system has co-reaction effects on liquefaction and gasification. Therefore, blending WSO and water to create a sub-critical environment can improve oil quality and the conversion rate, showing that this system has great potential for commercial operation. This study can provide all product data for the co-liquefaction of PRWPM and WSO, especially addressing model data for machine learning, and predict the possible products of co-liquefaction of various biomass and bio-oil, which can reduce the cost and time for HLT research.

Supplementary Materials

The following are available online at https://www.mdpi.com/article/10.3390/en14092442/s1, Figure S1. SEM photos of solid product, Figure S2. Simulated distillation analysis of liquid-phase products, Figure S3. High heating value of oil-phase products, Figure S4. GC/MS analysis of liquid-phase products, Figure S5. Mass of gas products, Figure S6. Conversion rate. Table S1. Characteristic analysis.

Author Contributions

J.-L.S. conceived and designed the experiments, also wrote the paper; W.-S.Y., Y.-R.L., T.-H.L. and H.-R.Y. performed the experiments. All authors have read and agreed to the published version of the manuscript.

Funding

The research in this paper received funding from the Ministry of Science and Technology of Taiwan.

Institutional Review Board Statement

Not applicable.

Informed Consent Statement

Not applicable.

Acknowledgments

We express our sincere thanks to the Ministry of Science and Technology of Taiwan for its financial support, under grant numbers: MOST 109–2221-E-197–004-MY3 and MOST 109–2622-E-197–004-CC3.

Conflicts of Interest

The authors declare no conflict of interest.

References

  1. Setiawan, Y.; Surachman, A. Reject waste pellets of paper mills as fuel and their contribution to greenhouse gas (GHG). Int. J. Technol. 2015, 5, 847–855. [Google Scholar] [CrossRef]
  2. Zhu, Z.; Toor, S.S.; Rosendahl, L.; Yu, D.H.; Chen, G.Y. Influence of alkali catalyst on product yield and properties via hydrothermal liquefaction of barley straw. Energy 2015, 80, 284–292. [Google Scholar] [CrossRef]
  3. Brand, S.; Hardi, F.; Kim, J.; Suh, D.J. Effect of heating rate on biomass liquefaction: Differences between subcritical water and supercritical ethanol. Energy 2014, 68, 420–427. [Google Scholar] [CrossRef]
  4. Christensen, P.R.; Morup, A.J.; Mamakhel, A.; Glasius, M.; Becker, J.; Iversen, B.B. Effects of heterogeneous catalyst in hydrothermal liquefaction of dried distillers grains with solubles. Fuel 2014, 123, 158–166. [Google Scholar] [CrossRef]
  5. Chang, C.C.; Chen, C.P.; Yang, C.S.; Chen, Y.H.; Huang, M.; Chang, C.Y.; Shie, J.L.; Yuan, M.H.; Chen, Y.H.; Ho, C.; et al. Conversion of waste bamboo chopsticks to bio-oil via catalytic hydrothermal liquefaction using K2CO3. Sustain. Environ. Res. 2016, 26, 262–267. [Google Scholar] [CrossRef] [Green Version]
  6. King, J.W.; Holliday, R.L.; List, G.R. Hydrolysis of soybean oil in a subcritical water flow reactor. Green Chem. 1999, 1, 261–265. [Google Scholar] [CrossRef]
  7. Fangwei, C.; Luo, H.; Colosi, L.M. Slow pyrolysis as a platform for negative emissions technology: An integration of machine learning models, life cycle assessment, and economic analysis. Energy Convers. Manag. 2020, 223, 113258. [Google Scholar]
  8. Kruse, A.; Dinjus, E. Hot compressed water as reaction medium and reactant properties and synthesis reactions. J. Supercrit. Fluids 2007, 39, 362–380. [Google Scholar] [CrossRef]
  9. Uematsu, M.; Franck, E.U. Static dielectric constant of water and steam. J. Phys. Chem. Ref. Data 1980, 9, 1291–1306. [Google Scholar] [CrossRef]
  10. Mathanker, A.; Pudasainee, D.; Kumar, A.; Gupt, R. Hydrothermal liquefaction of lignocellulosic biomass feedstock to produce biofuels: Parametric study and products characterization. Fuel 2020, 271, 117534. [Google Scholar] [CrossRef]
  11. Onwudili, J.A.; Williams, P.T. Hydrothermal gasification and oxidation as effective flameless conversion technologies for organic wastes. J. Energy Inst. 2008, 81, 102–109. [Google Scholar] [CrossRef]
  12. Tekin, K.; Karagöz, S. Non-catalytic and catalytic hydrothermal liquefaction of biomass. Res. Chem. Intermed. 2013, 39, 485–498. [Google Scholar] [CrossRef]
  13. Kayukova, G.P.; Mikhailova, A.N.; Kosachev, I.P.; Nasyrova, Z.R.; Gareev, B.I.; Vakhin, A.V. Catalytic hydrothermal conversion of heavy oil in the porous media. Energy Fuels 2021, 35, 1297–1307. [Google Scholar] [CrossRef]
  14. MacDermid-Watts, K.; Pradhan, R.; Dutta, A. Catalytic hydrothermal carbonization treatment of biomass for enhanced activated carbon: A review. Waste Biomass Valor 2020, 12, 2171–2186. [Google Scholar] [CrossRef]
  15. Mackintosh, A.F.; Shin, T.; Yang, H.; Choe, K. Hydrothermal polymerization catalytic process effect of various organic wastes on reaction time, yield, and temperature. Processes 2020, 8, 303. [Google Scholar] [CrossRef] [Green Version]
  16. Kumar, V.; Kumar, S.; Chauhan, P.K.; Verma, M.; Bahuguna, V.; Joshi, H.C.; Ahmad, W.; Negi, P.; Sharma, N.; Ramola, B.; et al. Low-temperature catalyst based hydrothermal liquefaction of harmful macroalgal blooms, and aqueous phase nutrient recycling by microalgae. Sci. Rep. 2019, 9, 11384. [Google Scholar] [CrossRef] [PubMed]
  17. Fangwei, C.; Porter, M.D.; Colosi, L.M. Is hydrothermal treatment coupled with carbon capture and storage an energy-producing negative emissions technology? Energy Convers. Manag. 2020, 203, 112252. [Google Scholar]
  18. Nam, H.; Choi, J.; Capareda, S.C. Comparative study of vacuum and fractional distillation using pyrolytic microalgae (Nannochloropsis oculata) bio-oil. Algal. Res. 2016, 17, 87–96. [Google Scholar] [CrossRef]
  19. Reddy, H.K.; Muppaneni, T.; Ponnusamy, S.; Sudasinghe, N.; Pegallapati, A.; Selvaratnam, T.; Seger, M.; Dungan, B.; Nirmalakhandan, N.; Schaub, T.; et al. Temperature effect on hydrothermal liquefaction of Nannochloropsis gaditana and Chlorella sp. Appl. Energy 2016, 165, 943–951. [Google Scholar] [CrossRef] [Green Version]
  20. Li, J.; Zhou, W.; Leng, L.; Yuan, X.Z. Beneficial synergistic effect on bio-oil production from co-liquefaction of sewage sludge and lignocellulosic biomass. Bioresour. Technol. 2017, 251, 49–56. [Google Scholar]
  21. Zhang, L.; Champagne, P.; Xu, C.C. Bio-crude production from secondary pulp/paper-mill sludge and waste newspaper via co-liquefaction in hot-compressed water. Energy 2021, 36, 2142–2150. [Google Scholar] [CrossRef]
  22. You, Y.D.; Shie, J.L.; Chang, C.Y.; Huang, S.H.; Pai, C.Y.; Chang, C.H.; Yu, Y.H. Economic cost analysis of biodiesel production: Case in soybean oil. Energy Fuels 2008, 22, 182–189. [Google Scholar] [CrossRef]
  23. Mehta, P.S.; Anand, K. Estimation of a lower heating value of vegetable oil and biodiesel fuel. Energy Fuels 2009, 23, 3893–3898. [Google Scholar] [CrossRef]
  24. Chang, C.C.; Chen, Y.H.; Lin, Y.S.; Hung, Z.S.; Yuan, M.H.; Chang, C.Y.; Li, Y.S.; Shie, J.L.; Chen, Y.H.; Wang, Y.C.; et al. A pilot plant study on the autoclaving of food wastes for resource recovery and reutilization. Sustainability 2018, 10, 3566. [Google Scholar] [CrossRef] [Green Version]
  25. Gollakotaa, A.R.K.; Kishoreb, N.; Gua, S. A review on hydrothermal liquefaction of biomass. Renew. Sustain. Energy Rev. 2018, 81, 1378–1392. [Google Scholar] [CrossRef]
  26. Kong, X.; Liu, C.; Han, Y.; Lei, M.; Fan, Y.; Li, M.; Xiao, R. Cu/CuMgAlOx-Catalyzed guaiacol hydrodeoxygenation in supercritical methanol: A modeling mechanistic insight for lignin-derivatives upgrading. Energy Fuels 2020, 35, 1511–1522. [Google Scholar] [CrossRef]
  27. Brown, T.M.; Duan, P.; Savage, P.E. Hydrothermal liquefaction and gasification of Nannochloropsis sp. Energy Fuels 2010, 24, 3639–3646. [Google Scholar] [CrossRef]
  28. Chen, Y.H.; Chang, C.C.; Chang, C.Y.; Yuan, M.H.; Ji, D.R.; Shie, J.L.; Lee, C.H.; Chen, Y.H.; Chang, W.R.; Yang, T.Y.; et al. Production of a solid biofuel from waste bamboo chopsticks by torrefaction for cofiring with coal. J. Anal. Appl. Pyrolysis 2017, 126, 315–322. [Google Scholar] [CrossRef]
  29. Chang, C.C.; Manh, V.D.; Hsu, W.L.; Liu, B.L.; Chang, C.Y.; Chen, Y.H.; Yuan, M.H.; Lin, C.F.; Yu, C.P.; Chen, Y.H.; et al. A case study on the electricity generation using a micro gas turbine fueled by biogas from a sewage treatment plant. Energies 2019, 12, 2424. [Google Scholar] [CrossRef] [Green Version]
  30. Chang, C.C.; Teng, S.; Yuan, M.H.; Ji, D.R.; Chang, C.Y.; Chen, Y.H.; Shie, J.L.; Ho, C.; Tian, S.Y.; Andrade-Tacca, C.A.D.; et al. Esterification of jatropha oil with isopropanol via ultrasonic irradiation. Energies 2018, 11, 1456. [Google Scholar] [CrossRef] [Green Version]
  31. Wu, X.F.; Zhou, Q.; Li, M.F.; Li, S.X.; Bian, J.; Peng, F. Conversion of poplar into bio-oil via subcritical hydrothermal liquefaction: Structure and antioxidant capacity. Bioresour. Technol. 2018, 270, 216–222. [Google Scholar] [CrossRef] [PubMed]
  32. Davidson, S.D.; Lopez-Ruiz, J.A.; Flake, M.; Cooper, A.R.; Elkasabi, Y.; Morgano, M.T.; Dagle, V.L.; Albrecht, K.O.; Dagle, R.A. Cleanup and conversion of biomass liquefaction aqueous phase to C3–C5 olefins over ZnxZryOz catalyst. Catalysts 2019, 9, 923. [Google Scholar] [CrossRef] [Green Version]
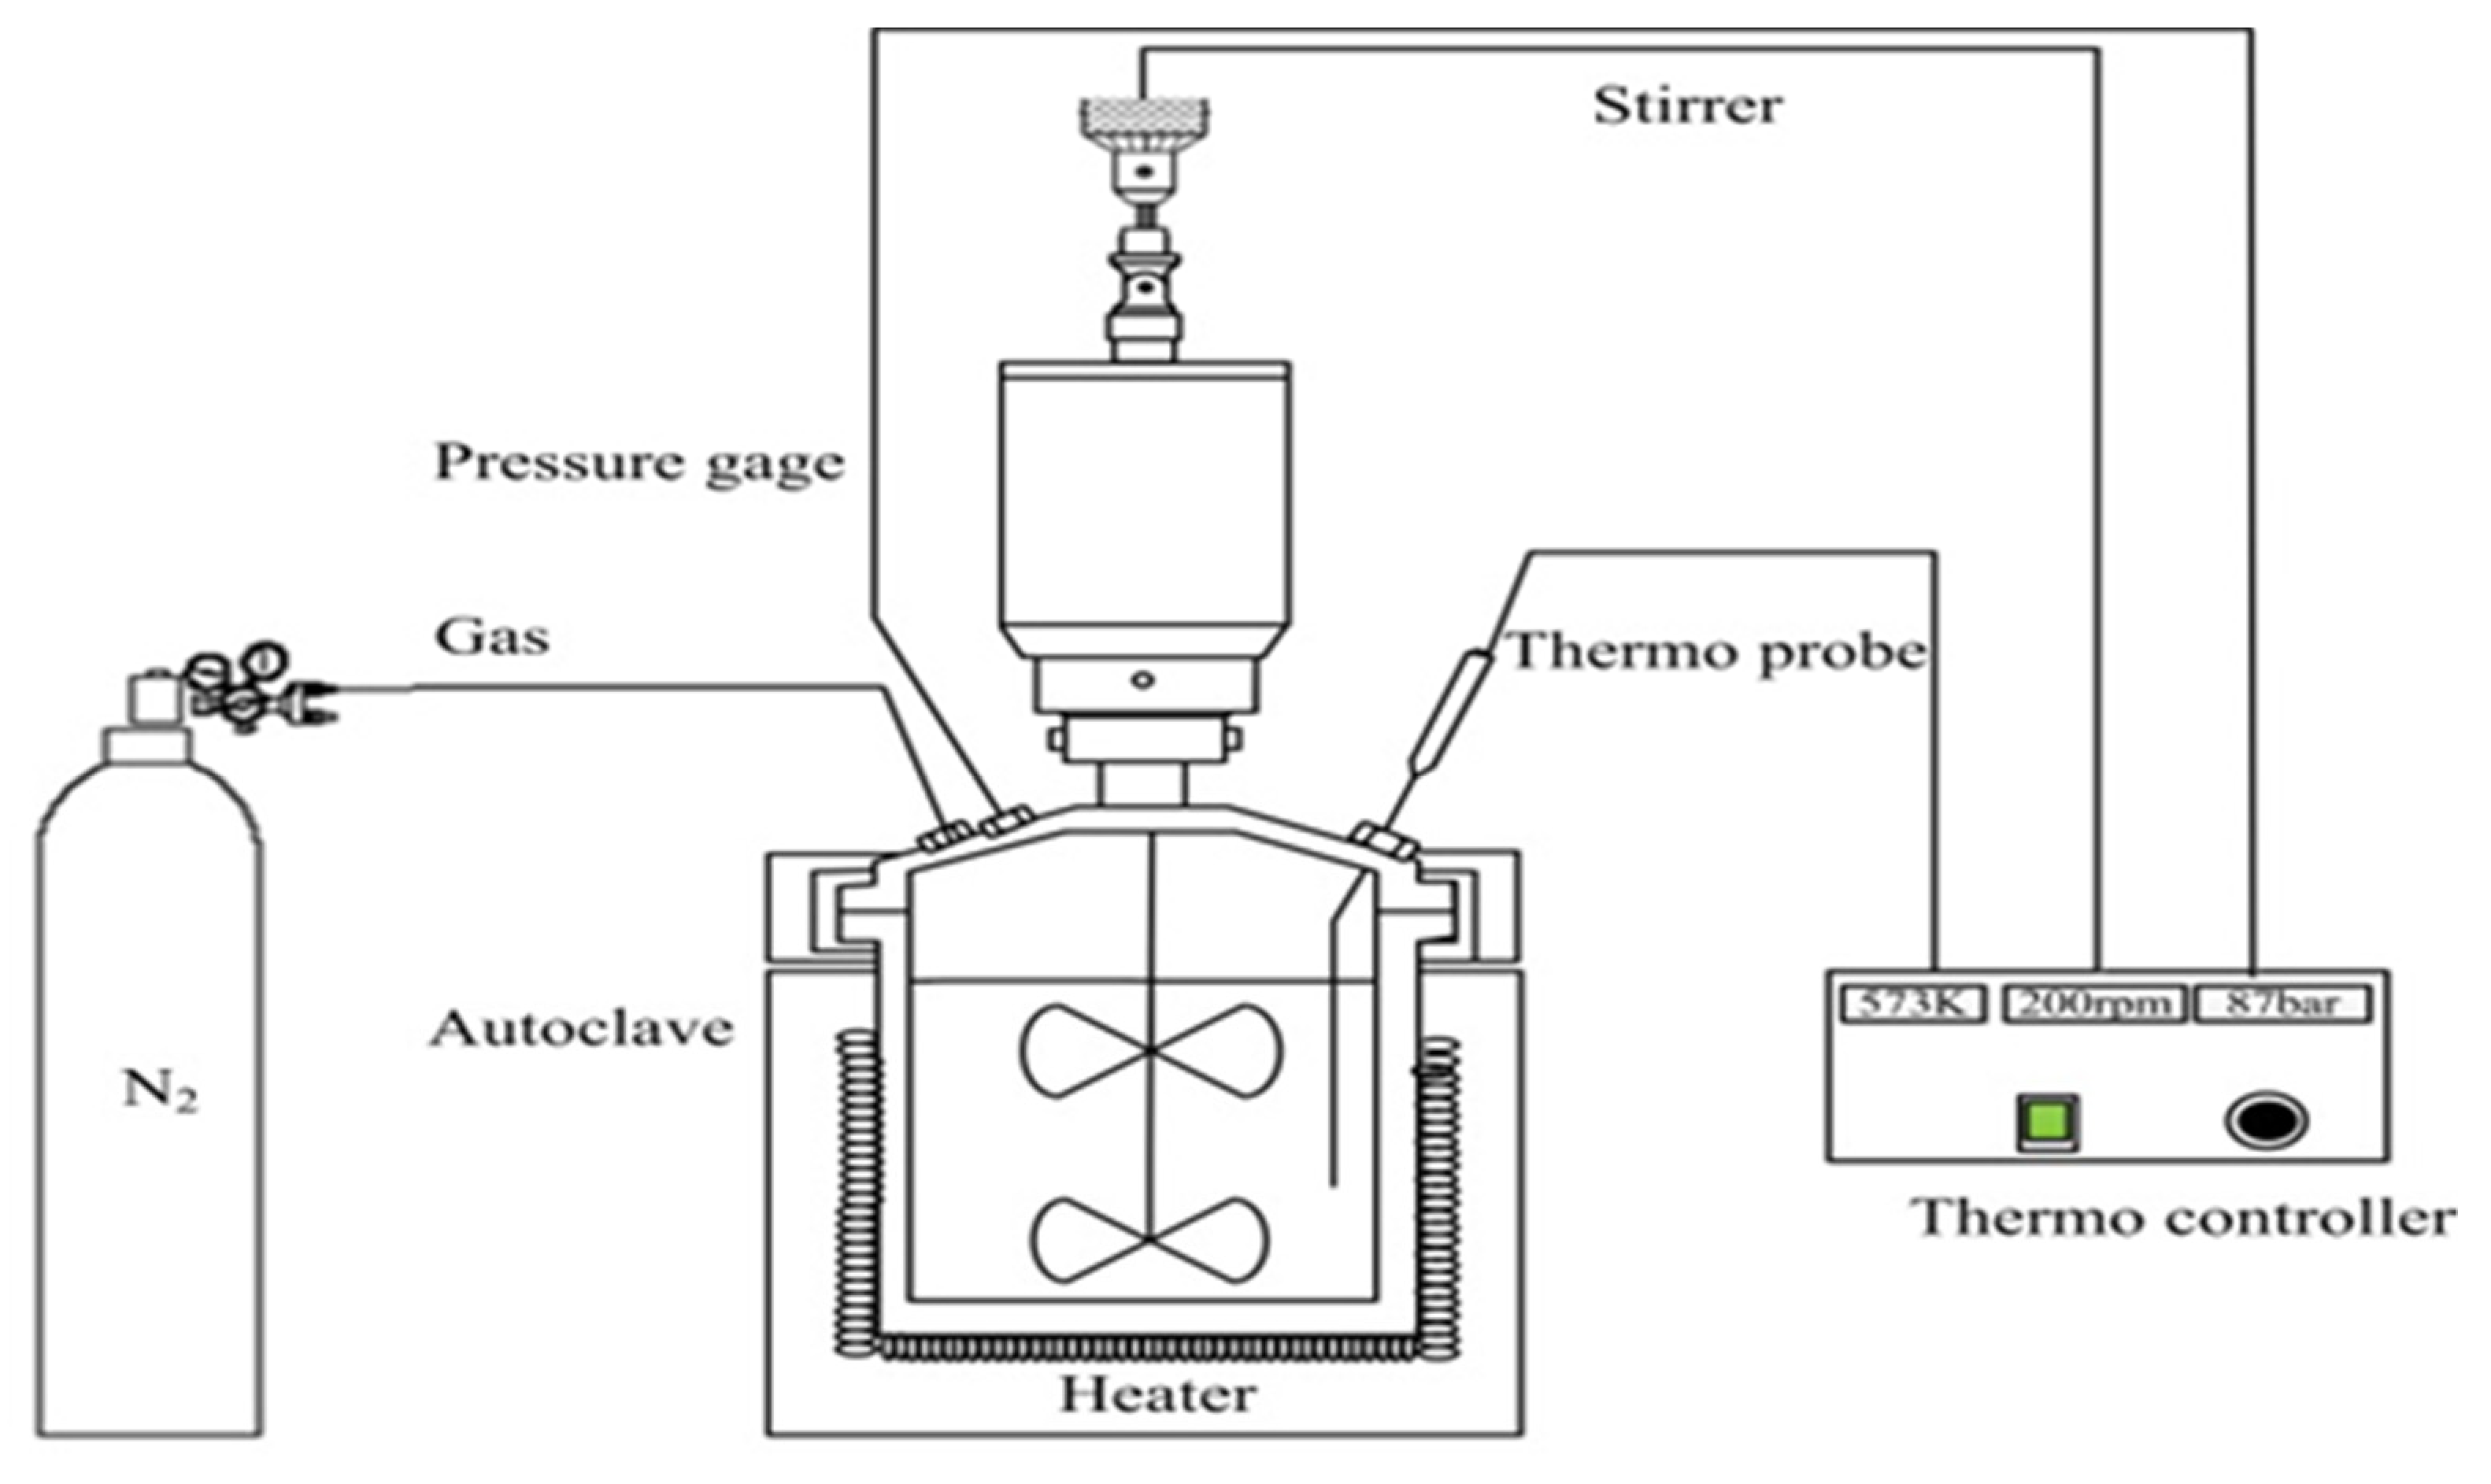
Figure 1. The picture of the high-temperature and pressure autoclave.
Energies 14 02442 g001
Figure 2. SEM photos of (a) raw PRWPM (5000×); (b) oil–water ratio of 0:100 at 573 K and 2 h (5000×); (c) oil–water ratio of 25:75 at 573 K and 2 h(2000×); (d) oil–water ratio of 50:50 at 573 K and 2 h (2000×); (e) oil–water ratio of 75:25 at 573 K and 2 h (2000×); (f) oil–water ratio of 100:0 at 573 K and 2 h (2000×).
Energies 14 02442 g002
Figure 3. The composition analysis of oil-phase products from SHTL of PRWPM at different WSO-water ratios in 573 K and 2 h. 1. Alcohol, 2. Benzene, 3. Alkenyl, 4. Ketones, 5. Phenol, 6. Acid, 7. Alkyl, 8. Digitoxin, 9. Ester, 10. Other.
Energies 14 02442 g003
Figure 4. Simulated distillation of commercial oils and oil-phase products from SHTL of PRWPM at different WSO–water ratios in 573 K and 2 h.
Energies 14 02442 g004
Figure 5. Concentration of gas-phase products from SHTL of PRWPM at different oil–water ratios in 573 K and 2 h. ■: CO2, ◆: H2, ▲: CO, ●: CH4.
Energies 14 02442 g005
Table 1. Some properties of process reject of a wastepaper-based paper mill (PRWPM) and waste soybean oil (WSO) used in this study.
ItemPRWPMWSO
Proximate analysis (%)
Moisture51.06
(0.74) a
-
Combustible45.04
(1.40)
-
Ash4.19
(1.0)
-
Fixed Carbon0.64
(0.02)
-
Heating value analysis (MJ kg−1)
High heating value of wet basis30.52
(0.35)
40.03
(0.17)
Low heating value of wet basis14.94
(0.17)
37.01 [21]
Ultimate analysis (dry basis, weight %)
C55.97
(0.20)
78.69
(0.08)
77.56 [22]
H8.45
(0.01)
11.65
(0.04)
13.22 [22]
N0.26
(0.03)
0.13
(0.01)
0.025 [22]
S0.13
(0.01)
0.02
(0.001)
<0.0001 [22]
O b35.199.2 [15]
a: The number in parentheses is the standard deviation. b. The number is balanced from 100%.
Table 2. Characteristic analysis of raw PRWPM and solid-phase products.
SampleTemp.
(K)
Time
(Hour)
Oil-Water Ratio (Oil: Water)MJ/kgCHNSO aVolatileFixed CarbonAsh
Dry
PRWPM
---30.52
(0.35) b
55.97
(0.20)
8.45
(0.01)
0.26
(0.03)
0.13
(0.01)
35.1990.32
(1.31)
1.27
(0.04)
8.4
(2.00)
Solid-phase products57320:10036.98
(2.43)
80.68
(0.40)
11.71
(0.55)
0.38
(0.01)
0.08
(0.01)
7.1592.42
(0.68)
0.44
(0.05)
7.14
(0.63)
573225:7537.14
(0.17)
82.67
(0.80)
12.98
(0.95)
0.13
(0.02)
0.06
(0.02)
4.1698.13
(0.28)
0.20
(0.49)
1.67
(0.73)
573250:5037.23
(0.27)
81.17
(0.13)
13.50
(0.003)
0.09
(0.01)
0.03
(0.006)
5.2198.65
(0.10)
0.39
(0.01)
0.96
(0.10)
573275:2538.04
(0.29)
79.64
(0.64)
13.14
(0.20)
0.11
(0.04)
0.01
(0.002)
7.1098.77
(0.33)
0.56
(0.03)
0.67
(0.35)
5732100:033.85
(0.20)
65.00
(0.35)
6.79
(0.03)
0.13
(0.01)
0.05
(0.004)
28.0398.94
(1.40)
0.34
(0.06)
0.72
(0.06)
a: The number is balanced from 100%. b: The number in parentheses is the standard deviation.
Table 3. Characteristics of oil-phase products of PRWPM using SHTL at different oil–water ratios in 573 K and 2 h.
SampleOil-Water Ratio (Oil: Water)Oil -Phase
HHV
MJ kg−1
Oil-Phase
pH
CO bHNSLiquid-Phase
pH
Raw WSO-40.03
(0.17) a
-78.69
(0.08)
9.5111.65
(0.04)
0.13
(0.01)
0.02
(0.004)
-
oil-phase product0:100NDNDNDNDNDNDND4.14
25:7542.02
(0.25)
4.8563.04
(0.10)
25.5711.1
(0.05)
0.21
(0.01)
0.08
(0.01)
4.09
50:5040.99
(0.28)
4.872.37
(0.80)
15.8811.51
(0.02)
0.19
(0.01)
0.05
(0.003)
4.24
75:2540.74
(0.46)
5.073.8
(0.11)
14.4011.56
(0.01)
0.19
(0.002)
0.05
(0.003)
4.48
100:038.56
(0.76)
4.878.21
(0.14)
10.0411.58
(0.004)
0.15
(0.006)
0.02
(0.008)
ND
a: The number in parentheses is the standard deviation. b. The number is balanced from 100%.
Table 4. Concentration of gas-phase products of PRWPM using SHTL at different oil–water ratios in 573 K and 2 h.
Conc. (ppmv)
SampleOil-Water Ratio
(Oil: Water)
CO2H2CO CH4Total Volume Yield (L)
Gas-phase product0:100417,918
(58.97) a
259,497
(36.62)
29,266
(4.13)
1981
(0.28)
2.1
25:75469,868
(58.88)
265,468
(33.27)
57,179
(7.17)
5517
(0.69)
3
50:50489,036
(64.48)
162,578
(21.44)
98,751
(13.02)
8020
(1.06)
2.7
75:25518,159
(66.04)
141,219
(18.00)
117,362
(14.96)
7928
(1.01)
2.8
100:0402,315
(72.27)
18,215
(3.27)
127,890
(22.97)
8260
(1.48)
1.3
a: Number in parentheses is the volume percentage between CO2, H2, CO and CH4 (free nitrogen and steam environment).
Table 5. Product recovery yield and conversion rate of PRWPM using SHTL at different oil–water ratios in 573 K and 2 h.
Oil-Water RatioSolidOilLiquidGasYieldConversion Rate
0:1005.86-88.330.4294.6035.56
25:757.2321.4167.530.6596.8220.43
50:504.6740.6244.090.6790.0548.63
75:254.9762.0820.990.8088.8345.33
100:00.5797.32-0.2898.1693.77
Publisher’s Note: MDPI stays neutral with regard to jurisdictional claims in published maps and institutional affiliations.