Abstract
The enrichment of natural gas with hydrogen has been identified as a promising pathway for power-to-gas technology with the potential to reduce emissions while achieving feasible return on investment. The evolving regulatory market in the province of Ontario motivates the analysis of business cases for hydrogen on the industrial microgrid scale. This paper aims to investigate the financial and environmental returns associated with producing and storing electrolytic hydrogen for injection into the natural gas feed of a manufacturer’s combined heat and power plants (CHPs). A mathematical methodology was developed for investigating the optimal operation of the integrated system (power-to-gas along with the current system) by considering hydrogen-enriched natural gas. The result of this simulation is an operation plan that delivers optimal economics and an estimate of greenhouse gas emissions. The simulation was implemented across an entire year for each combination of generation price limit and storage coefficient. Because the provincial grid imposes a lesser carbon footprint than that of a pure natural gas turbine, any offset of natural gas by hydrogen reduces the carbon intensity of the system. From an environmental perspective, the amount of carbon abated by the model fell within a range of 3000 ton CO2/year. From a policy perspective, this suggests that a minimum feasible carbon price of $60/ton CO2e must be set by applicable regulatory bodies. Lastly, a Failure Modes and Effects Analysis was performed for the proposed system to validate the safety of the design.
1. Introduction
The development of renewable energy infrastructure within the province of Ontario has resulted in a mismatch between supply and demand, with the Independent Electricity System Operator (IESO) dumping terawatts of clean, low carbon electricity each year at very low cost [1,2]. With a significant federal carbon tax on the horizon, there is a need for strong, robust business cases for microgrid systems that incorporate large-scale, efficient energy storage systems [3,4,5]. One of the most promising technologies available on a commercial scale is power-to-gas, an energy storage concept where low price, curtailed renewable energy is used to transform water into hydrogen gas that can be later redistributed through various revenue streams [6].
Of the many revenue streams available to power-to-gas, the enrichment of natural gas with electrolytic hydrogen has garnered significant interest given its ability to reduce operating costs while increasing renewable content [7,8]. This is particularly important in the context of Ontario’s utility market, given Environment and Climate Change Canada’s 2016 proposal of a nationwide clean fuels standard that will include commercial and residential natural gas [9]. The production of hydrogen enriched natural gas (HENG) in Ontario is already occurring on the utility scale; however, based on global research, there is potential to realize significant financial and environmental returns through local industrialized implementation as well [10]. It is important to recognize that these economically favorable and robust business cases exist today and that hydrogen enrichment through power-to-gas is a technology of the present rather than of the future [5]. As such, this work will evaluate the economic and environmental feasibility of introducing electrolyzer-based hydrogen production to enrich the natural gas feed stream of a combined heat and power plant at an automotive manufacturer in southern Ontario as a case study for broader provincial development.
A computational model will be developed for the 2018 calendar year, simulating the hourly production, storage and injection of hydrogen, subject to system capacity, plant demand and end-use constraints [11,12]. Subsequently, a sensitivity analysis will be performed to evaluate how changing carbon price and government capital incentives affects the investment’s financial metrics. In each scenario, the optimal system performance is identified, given storage and production parameters decided by facility operators. This information can be further used to suggest key component sizing and predict overall capital and operating costs for a projected scenario. This analysis forms the basis for preliminary design development and illustrates what metrics policy makers should target to improve adoptability of technologies focused on the decarbonization of the industrial sector.
This work is novel in that it simulates hydrogen enrichment in a real system separately from other pathways, suggesting design features unique to a CHP-based industrial energy system. In addition, it is valuable in that it identifies policy issues specifically for these types of preliminary business cases, given features of Ontario’s energy system. The economics presented are unique to the provincial market, and they stand to demonstrate that simple systems without complex stacking of revenue pathways can still obtain profitability given the appropriate incentives. Yeong et al. verified the capability of such power-to-gas technologies to be implemented within the Canadian energy system, noting that given appropriate evaluation, the existing infrastructure would possibly withstand hydrogen blending up to 5% by volume without substantial level-up to avoid failure related to hydrogen embrittlement [13]. While this work provides excellent insight into the flexibility of the natural gas transportation framework to accept hydrogen, it does not extend into an economic analysis for practical business cases. In a study on early business cases for hydrogen by Tractebel Engineering, distinct concrete business cases were developed for power-to-gas, which include hydrogen blending into the gas grid [5]. While these business cases are shown to be profitable in a European context where renewable content within the energy supply chain is high, they need to be extended to the Canadian energy grid and to cases where alternative revenue streams such as hydrogen for mobility and grid ancillary services are not currently practical. Mukherjee et al. [14] performed a techno-economic and environmental assessment of a hydrogen-powered community within the Ontario market, estimating capital expenditure, economic returns and identifying key safety parameters required for an effective design [14]. This paper will extend on this work by considering hydrogen-enriched natural gas as a potential pathway and by incorporating suggestions for an inherently safer design. Further studies have recognized the need for power-to-gas and have made attempts to analyze the technical feasibility of blending hydrogen into CHP feed streams. Work by Lo Basso (2015) and Whidden (2010) both verified the capacity of HENG to be produced and blended into combined heat and power feed streams without significant detriment to system performance [15,16]. These studies were successful in identifying the potential greenhouse gas reductions obtained with blended plants, and they motivate an investigation into the practical economic feasibility of these pathways in industrial plants, particularly within the Canadian economy.
Another report that provides considerable insight into the usefulness of hydrogen in reducing the carbon intensity of fossil fuels was published by the International Energy Agency. While they concluded that a grid-wide introduction of hydrogen generated from fossil fuels is not as economically favorable as alternative abatement options, they were able to show that the introduction would incur little costs outside those associated with production up to 3% vol. and that options exist to scale blending as high as 25% [17]. They go on to recommend further work in this area because hydrogen technology acts as a necessary bridge between fossil fuel systems and stable renewable infrastructure. The simulations presented in this report attempt to demonstrate the value of pathway optimization in the context of industrial microgrids and how electrolytic hydrogen in particular can overcome infrastructure transition costs.
By developing this simulation, we are demonstrating that not only is hydrogen blending a safe technology, but it is also readily implementable on the industrial scale. Furthermore, we are demonstrating that there are economic and environmental benefits available from exploiting a single power-to-gas pathway given the appropriate government incentives. As such, the following milestones outline the objectives of this work:
Developing a mathematical methodology for the storage and injection of hydrogen-enriched natural gas at an industrial manufacturer’s microgrid;
Performing a technology assessment of the key components of the power-to-gas system, highlighting proposed suppliers, capital and operating costs;
Analyzing key project environment and economic return indicators to assess the feasibility of the capital expenditure
Validating the results of this methodology by performing a failure modes and effects analysis to identify potential risks to plant safety.
2. Simulation Approach
This paper investigates the economic and environmental feasibility associated with the operation of a power to gas system integrated within an industrial manufacturer’s energy system.
Under current operation the heating demand of the facility is met entirely by the steam output of two combined heat and power (CHP) units, which when supplemented by the provincial energy grid also meet the company’s electricity demand. By introducing power-to-gas, the manufacturer can take advantage of fluctuations in the Hourly Ontario Energy Price. When this price drops sufficiently low due to a surplus of available grid energy, not only is it favorable to pull more from the grid than the CHPs, but this energy can also be used to generate hydrogen gas. As electricity prices climb, such that CHP generation is favorable, this hydrogen can then be mixed with natural gas to feed CHP units. Through this, one can decarbonize the heating and electricity demand for industrial facilities, bringing about significant energy savings and emission offsets. The challenge that is the focus of this paper is determining when to produce and store hydrogen and in what amounts.
As shown in Figure 1, electricity from the grid, for which the wholesale price fluctuates, will be fed to the electrolyzer. This hydrogen is either sent directly to the natural gas pipeline or to temporary storage. The decision regarding when to produce hydrogen is made by fixing an upper limit on the grid electricity price, above which no production occurs, for an entire year of analysis, then varying this limit across a broad range to determine the optimal financial performance for the given incentive structure. Similarly, the decision to store hydrogen is made by varying the storage coefficient, which is a ratio of the production demand to the amount stored.
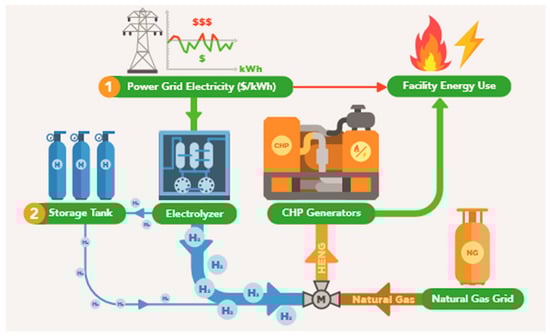
Figure 1.
Simplified schematic of the industrial manufacturer’s energy system including applicable hydrogen technologies.
A model is developed to simulate the blending of hydrogen into the CHP’s natural gas stream while considering both the demand of the manufacturer for steam and electricity as well as the cost and carbon content of the energy grid to determine the optimal system sizing and operating conditions [11,12]. In order to develop the model, it is important to define key system parameters including historical demand and pricing data, technical specifications of key hydrogen technologies as well as limitations of the existing energy hub components. One notable constraint is that the proposed configuration should provide the CHP with energy in the form of hydrogen-enriched natural gas (HENG) equivalent to the existing natural gas consumption. Moreover, hydrogen cannot be injected into the existing natural gas pipeline or consumed by end-use application (i.e., gas turbines) at a volumetric fraction of more than 5% without significant retrofitting of existing infrastructure [13].
Because the provincial grid imposes a lesser carbon footprint than that of gas turbines, any offset of natural gas by hydrogen reduces the carbon intensity of the system. This offset results in additional revenue, the amount of which depends on the carbon tax imposed by relevant governments and on the price below which the company decides to generate hydrogen. Once the energy system of the client is clearly defined, we construct the model with the objective of meeting the hourly electricity and heating demand of the facility while maximizing total revenue generated from a potential Cap and Trade or carbon tax market and natural gas consumption savings. The result is a system sized for optimal blending and an answer to the question of when to produce and store hydrogen. Based on this, we estimate the potential offset of greenhouse gas emissions and key financial metrics. This process will be repeated across a range of carbon prices and government-based capital grants with their effect on the net present value and internal rate of return of the project being investigated. Given projections developed for the province of Ontario’s previous Cap and Trade program, we will vary the carbon price between $30 per ton and $100 per ton [4]. Regarding capital grants, investigating the effect of the integration of renewable energy and power-to-gas benefit industrial facilities [18,19].
The logical flowchart for this mathematical methodology is outlined in Figure 2. The model is simulated over an entire year, and key performance indicators of the model such as total revenue generated and emissions offset are tabulated in the computational software MATLAB. Furthermore, to determine the optimal design conditions, two main operational variables, the storage coefficient and electrolyzer price threshold are manipulated. The price threshold is a logical condition in which past a certain hourly electricity price, the electrolyzer is not run and stored hydrogen is used to meet facility energy demand. Based on the distribution of electricity prices throughout the course of a year, this leads to opportunity for optimization. Secondly, there is the storage coefficient which is an operational variable which dictates the fraction of produced hydrogen stored versus sent to the CHP unit.
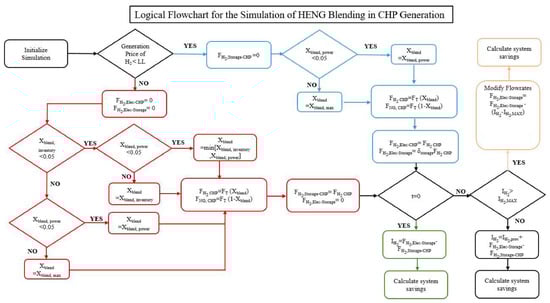
Figure 2.
Outline of the simulation logic determining the amount of hydrogen to generate, produce and store within the power-to-gas system.
As previously mentioned, the simulation incrementally increases the limit on the electricity price, under which the decision is made to generate hydrogen. Deciding on a fixed price limit effectively prevents the simulation from achieving a global optimum while avoiding the necessity for tedious hourly optimization that would be costly to implement in practice for the company. If the Hourly Ontario Electricity Price (HOEP) falls below this value for a given time increment, no hydrogen will be sent from tank storage to the CHP unit; instead, it is sent directly from the electrolyzer to the CHP and to storage. In this case, the percent blending of hydrogen into natural gas is determined by taking the minimum of the infrastructure limit of 5% and the blending limit required to maintain the necessary power output from the CHP. Because hydrogen has a lower energy content than natural gas, as the percent blended at a fixed volumetric flowrate increases the total thermal and electrical energy produced decreases. As such, the total gas consumption must increase in order to meet the required industrial demand; however, it is constrained by the maximum flowrate that the turbine is rated for. As such, this constrains the allowable blending, the maximum of which is calculated in Equation (1), where Edem represents the total required energy input to the turbine unit and the maximum flow of natural gas which for the system in question is 1700 m3/h:
In this simulation a decision variable known as the storage coefficient, relates the total hydrogen generation to the amount sent to the CHP during periods of low electricity price. This is varied to determine the optimal storage rate balancing between the cost of storage capacity and the potential future savings as the HOEP climbs. It may seem surprising that not 100% of the hydrogen generated during low price scenarios is sent to storage and that some would be consumed in the CHP. This is because it is theoretically more efficient from both a cost and environmental perspective to directly replace CHP generation with grid electricity, as opposed to converting electricity to hydrogen and hydrogen back to electricity. However, this is not necessarily the case for two reasons; the CHP must always be operating in order to meet the steam demand and the capability of the equipment to ramp is highly constricted by a stark drop in efficiency, as well as costly wear on the machine. Therefore, if environmental incentives are in place, it remains a potentially viable solution to offset the significant footprint of burning natural gas. It was found that at a storage coefficient greater than 0.5, the amount of stockpiled hydrogen produced would often go unused, which would lead to unfavorable economics of the project. As such, in order to condense the scope of study the storage coefficient was ranged from 0 to 0.5. In the case where the amount of hydrogen sent to tank storage exceeds the inventory carrying capacity, production is scaled back to send only the maximum allowable amount, curtailing electrolyzer load.
For a case where electricity price exceeds the internal limit, the electrolyzer will consume no electricity and will produce zero hydrogen. Instead, all hydrogen injection into the CHP natural gas line comes from tank storage. The hydrogen blending percentage is taken to be the minimum of the infrastructure limit; the blending limit required to maintain power and the percentage were the entire inventory to be emptied due to injection as calculated in Equation (4).
Based on the determined blending percentage, the new overall and individual gas flowrates sent to the CHP are calculated as shown in Equations (3) through (5). The total hydrogen production is the sum of the blended amount and the amount sent to storage.
Based on correspondence with the manufacturer a fixed value of $0.19 per m3 is set for the volumetric cost of purchasing natural gas. Applying emission factors for natural gas and for the electrical grid as listed by the Independent Electricity System Operator, the emission offset can be determined. While producing hydrogen will see an increase in electrical utility expenditure, it is also necessary to account for the increased consumption of water at the municipality’s industrial rate. Based on the emission and natural gas offsets, the system’s environmental and economic savings and expenses can be determined using the following formulae for any individual combination of production limit and storage parameters (Equations (6) and (7)).
Before running the simulation across a range of operating parameters, the model was first tested on a select two weeks of data with a fixed price limit and storage coefficient in an effort to validate the effectiveness of the above equations. The following graph (Figure 3) shows the resulting breakdown between energy generated by hydrogen and natural gas combustion, wherein the model continues to meet the total requirement for electricity and heating demand. While actual demand figures are shown only in percent form per the company’s request, the hydrogen blending as indicated by the grey line is effectively modulated between 0–5%. The model chooses to supply the full 5% when possible to achieve the maximum emissions offset and return on investment, except for when the energy requirement reaches 96.5% of the system’s maximum capacity. At this point, the hydrogen blending must be reduced in order to achieve the required output. The yellow portion of this line indicates when the model is calling for hydrogen to be released by the storage unit into the CHP. To demonstrate that the model is choosing these times effectively, the HOEP was overlaid to show this clearing corresponds to peaks in the local electricity price. As the amount of hydrogen blending increases, subsequently so does the total gas usage; however, there remains a net decrease in natural gas consumption of 1.6% over the two-week period (Figure 3).
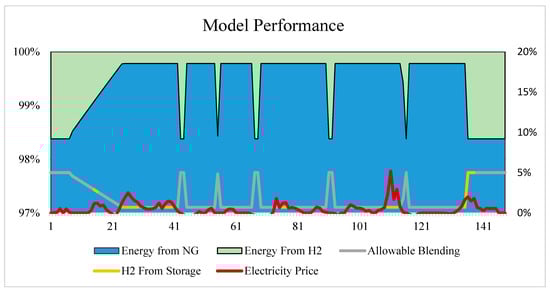
Figure 3.
Two-week period of the model’s operation, showing ability to select the appropriate blending percentage, as well as when to utilize stored vs. generated hydrogen based on the overlay of HOEP.
3. Technology Screening
In our simulation, we varied two parameters: the storage coefficient and the operational limit or minimum electricity cost required to run the electrolyzer. At each increment of these parameters, the economic and environmental benefit was calculated. Because the condition of the two decision variables impacted equipment size, we needed effective models relating capacity to capital to determine return on investment. In a P2G system of this type, there are three primary components: a hydrogen generation module, storage unit and compressor. In addition to this, considerations must be made regarding the piping, electrical, controls, and blending unit. For the purpose of this paper the focus will be directed toward the key P2G components as the remaining equipment is mature and similar to other compressed gas generation or consumption processes. For our purposes, these auxiliary installation costs will be built into the capital estimate of the electrolyzer.
3.1. Hydrogen Generation Module
Currently there are two types of electrolyzers widely available within the manufacturer’s market for P2G applications: alkaline and Polymer Electrolyte Membrance (PEM). While alkaline does pose advantages in maturity and operating range, we will not consider this as a viable option due to the required ramp rates being on the order of hours [19]. This is simply not aggressive enough to effectively respond to changes in the Hourly Ontario Energy Price [20]. Instead, we select a PEM system which, while not as mature, is widely available in the local market from suppliers such as Siemens, Proton Onsite and Hydrogenics. These systems offer increased purity, higher output pressures—but perhaps most important in reference to our application is the rapid ramp rate of up to 100%/s [21].
We determine the cost of the electrolyzer unit by applying a correlation presented by Saur [22] as expressed in the equation below. As the model determines the nominal hydrogen flowrate required for given system parameters, we can calculate the capital cost. It was also important to account for the electrolyzer’s operation and maintenance costs as well as a single stack replacement halfway through the operational life equaling 35% of the capital cost as recommended through direct communication with the supplier. In terms of operating costs, it is considered that water will be consumed at a rate of 4.45 L per kg of hydrogen produced and will cost $2.16 per m3 with an annual upkeep of 2.5% capital cost [23].
While the form of this equation is valuable, there has been significant work done in recent years to economize the electrolyzer. Because Saur presented this equation in 2008, we verify the accuracy by comparison with today’s numbers. Mayyas, A., et al. performed a bottom-up cost analysis for this electrolyzer type and estimated a range of 500$/kW and 1100$/kW for a megawatt scale PEM dependent on global manufacturing rates [24]. Based on recent production figures reported by the International Energy Agency and assuming a 78% stack efficiency or 44.7 kWh per kg of H2, we generate the following recalibrated formula [25,26,27]:
3.2. Hydrogen Storage Units
The next significant component in the P2G system is the storage unit, which will be directly impacted by the model’s selected storage coefficient, a fixed variable relating the production rate of hydrogen to the amount stored for later use at elevated prices. The total volume of the storage technology greatly impacts the system’s capability to support grid ancillary services and offset the electricity consumption of the industrial manufacturer.
There are many potential options available for hydrogen storage which, for the most part, can be divided into three main categories: physical-based, material-based and underground storage [28]. Material-based chemical or physical sorption technologies are still in their infancy, and while they offer promising solutions to many of the problems associated with conventional methods, their storage density remains low, contributing to commercial unavailability. Bulk storage refers primarily to the pressurization of hydrogen in natural forming underground caverns, which must be sufficiently tight as to avoid permeability and be void of minerals rich in sulphite, carbonate or sulfates, so as to avoid acidification [29]. The specificity, combined with the required infrastructure modifications, lends itself to a very high capital cost for this option. As such, this leaves physical based storage methods—particularly compressed gas storage due to safety benefits we will detail later—as the preferred choice. Not only is compressed storage a mature technology, but it is widely commercially available, relatively inexpensive and capable of achieving storage volumes and pressures required for this installation.
The pressure requirement of the CHP unit is a relatively low 15.1 bar, and as such, the capability of the pressure vessel is influenced by the consideration of an inherently safe design, the cost of the pressure unit itself and the cost of the compressor. While significant research lead by organizations such as the Department of Energy looks towards more lightweight, higher density designs servicing the automotive sector, commercial tanks are readily available to handle pressures of up to a maximum 500 bar [30]. A study by James, B.D., et al. investigated in detail the cost of Type IV 250 bar compressed gas pressure vessels [31]. Based on an annual production of 10,000 systems per year in 2016, the estimated cost of an installed storage system is $5221(2007) per unit with each unit capable of storing 5.6 kg H2, which, after adjusting to 2020 values, gives $6580. We will calculate the volumetric storage of hydrogen by cumulatively adding the product of the storage coefficient and the hydrogen injected into the natural gas stream. The maximum point will determine the number of 5.6 kg storage units required by our system and thus the capital cost. In addition, we will account for an annual maintenance fee of 5% of the total.
3.3. Compressors
A compressor is required to take the hydrogen from the 20-bar outlet typical of PEM electrolyzers and bring it to the 250 bar for storage. Regarding efficiency, it is widely known that the two-stage double-acting reciprocating compressor has superior energy efficiency for high level gas compression [32]. In 2014, NREL, as part of work to design a hydrogen refueling station, surveyed several vendors and, based off this work, selected a two-stage diaphragm compressor of this type to increase hydrogen from 20 to 250 bar [33]. At that time, their particular system was designed to handle 33 kg/h of hydrogen. Furthermore, research is ongoing to improve the operation of diaphragm compressors specifically for the application of hydrogen, enabling low cost and long-life solutions for the unique challenges this gas presents.
From a costing perspective, there is not substantial literature that relates hydrogen specific compression capital to desired operating parameters. However, there are well established correlations for determining reciprocating compressors in general. One such graphical correlation was selected from Chemical Engineering Economics [34]. As per this publication, additional cost multipliers need to be accounted for, including a 1.25 times pressure-based correction factor, a 2.5 times stainless steel correction factor, a 1.49 installation factor and a 2.6 module factor.
4. Results and Discussion
4.1. Economic and Environmental Analysis
The simulation is implemented across an entire year for each combination of generation price limit and storage coefficient. The result is a surface plot that shows the impact of storage coefficient and generation limit on the annual profit and emission offset of the proposed installation. For each parameter setting in the simulation, the maximum required hydrogen production rate and the maximum required tank storage capacity can be determined and used to estimate the system’s capital and operating costs. Using this information, the net present value (NPV) and internal rate of return (IRR) for each scenario can be determined, and the optimal configuration can be selected for a fixed carbon price and capital grant incentive.
Figure 4 shows one example of a surface plot for the annual simulation with a carbon price of 30$/ton CO2e. The maximum annual power-to-gas profit occurs at a storage coefficient of 0.15 and a price limit $0.031/kWh and is equal to $95,973 per year. As the carbon price is varied from 30$/ton CO2e to 100$/ton CO2e, the storage coefficient and price limit of the electrolyzer change; however, they remain unaffected by changes in the capital grant because it simply scales the price for the entire range of system sizes. In particular, the model will choose to store a higher amount of hydrogen at higher carbon prices, which intuitively makes sense given that the higher natural gas price will motivate the desire to offset a greater volume. Similarly, the general trend is to increase the operational limit to run the electrolyzer from 0.031$/kWh in the case of the lowest carbon tax up to 0.051$/kWh in the case of the 100$/ton CO2e.
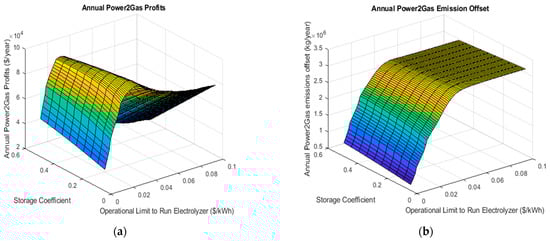
Figure 4.
Surface plots illustrating the effect of changes in the storage coefficient and the operational limit on the electrolyzer on the annual power-to-gas profits (a) and emissions offsets (b).
The environmental emission offset follows a similar pattern in regard to carbon price; however, is less sensitive than the profit (Figure 4b). The surface plot shows that the environmental offset is fairly unaffected by the storage coefficient which can be derived from the fact that the actual amount of hydrogen blended into the system is not heavily dependent on this parameter, which is more likely to actually affect the cost of the hydrogen produced. The amount of carbon abated increases rapidly with a change in the electrolyzer’s operation limit, similar to that of the power-to-gas profits. This asymptote indicates the point where the maximum amount of hydrogen blending is achieved. This also explains why the system profits reach a maximum at this point: as the amount of hydrogen generated may increase the cost, no more can be used to offset natural gas. For the $30 per ton case, a total CO2e offset of 2630 tons was realizable. In cases where the maximum available revenue and desired emission offset, either internal decision makers are tasked with weighing the tradeoff or the problem must be transferred to a multi-objective optimization problem.
Because electrolyzer size was not considered a constraint in the model, the range and frequency of hydrogen production values were recorded and used to suggest a nominal capacity. Correlations published by Mukherjee et al. [14] agree with regional market data (NextHydrogen. Personal communication, December 2018) collected from a local supplier on the per installed kilogram price of electrolytic hydrogen systems [35]. Using this information, 48 separate possible incentive schemes are analyzed, incrementing carbon price by 10$/ton CO2e from 30$/ton CO2e to 100$/ton CO2e and capital incentive by 10% of initial cost from 0% to 50%. The IRR and NPV for the entire range of data is presented in Figure 5.
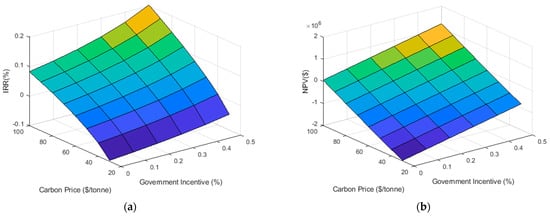
Figure 5.
Surface plots illustrating the effect of changes in the carbon price and the government capital incentive on the annual Internal Rate of Return (a) and Net Present Value (b).
Based on the criteria of a positive NPV at the Company’s 8% hurdle rate and suggested 25-year lifespan and an IRR greater than that of the hurdle rate, 16 scenarios prove to be economically viable. These 16 scenarios define the feasible region of Figure 5 and show that as the capital grant increases from 0–50%, the carbon price necessary to guarantee profitable returns decreases from 100$/ton CO2e to 60$/ton CO2e assuming discrete 10$ increments (Table 1). While certain scenarios do achieve profitability, the net present value may not be significant enough to incentivize the organization to undertake such a development. An example of this occurs when the capital incentive is fixed at 0% with a 100$/ton CO2e carbon price and a NPV of $53,240 results. In such a project, the importance of power-to-gas must be argued on grounds of non-economic means. That is the importance of an environmental offset (which in this case would be approximately 3073 ton CO2/year) above and beyond that of direct financial remuneration should be taken into account. In this case, the company in question has set a net-zero reduction target by the year 2050; as such, this problem should be converted to a multi-objective optimization, a topic for future work [16,36].

Table 1.
Feasible solutions (shown in green) to the simulation showing favorable economics under carbon prices greater than 60$/ton CO2e. CAD-Canadian Dollars.
In the best case, we see a potential return of $1,207,477, a significant amount given the capital investment of $1,152,348. This results in a simple payback of 3.8 years, well within the company’s requirements for projects of this scale. However, this scenario will require a capital grant incentive of 50% with a carbon price of 100 $/ton CO2. It is important to note that while capital incentives have a significant and direct effect on the project’s IRR, favorable NPVs can still be realized at lower capital incentives, so long as the carbon price remains sufficiently high. The most promising perhaps is the $745,782 NPV available at 100$/ton CO2e and 30% capital incentive. Such capital incentives are immediately realizable through organizations such as the Low Carbon Economy Fund which offers to cover 25% of the capital investment made by large businesses in projects that reduce CO2 while stimulating the economy [37].
From an environmental standpoint, the amount of carbon offset by the model falls within a range of 3046 ton CO2/year to 3073 ton CO2/year and increases with the corresponding carbon price at a rate less than that seen by the financial metrics. Based on this analysis, in order for the project to be economically profitable, a $60/ton CO2e tax must be implemented.
4.2. Results: Safety Analysis
Any review of the potential applications of power-to-gas and the hydrogen economy is incomplete without some discussion regarding the potential mitigation of potential safety risks. Recent local industrial installations have sparked controversy regarding the potential hazard to local communities; therefore, it is necessary to address this even in the design phase [38]. By identifying these risks, the appropriate safeguards can be implemented to mitigate the likelihood of failure, prioritizing the safety of all stakeholders and easing community concerns. The proposed design, while implementing relatively mature technology, is novel within the regional market and, because it involves blending highly flammable substances, must be treated with particular attention to global as well as local best practices and standards.
While hydrogen’s applications are promising, a significant hurdle to widespread use is the lack of well-established codes for stationary storage and its integration to our existing energy distribution framework [39]. Hydrogen is a very reactive chemical that poses significant fire and explosion hazards. Further, systems for hydrogen storage and transport require special materials of construction to prevent the escape of the very small molecule from its container; this is made even more challenging by the fact that hydrogen must be stored at high pressure to be sufficiently energy dense for practical purposes. Additionally, unlike hydrocarbon-based gaseous fuels (such as natural gas), chemical tracers cannot be used to make leaks more detectable to humans (either visually or through odor), as they cannot diffuse as fast as hydrogen [40].
Considering this, any hydrogen storage and distribution systems installed during this period of time (while the technology is not common-place) must be subject to stringent safety analyses to ensure that unexpected and unforeseen hazards can be mitigated and that public safety is not endangered.
4.2.1. Failure Modes Effects and Analysis
The first aspects to examine are inherently safer design principles and passive mitigation techniques. Conventional chemical industries use hydrogen as a reactant in continuous processes, thus minimizing the amount “stored” in the pipes significantly (hydrogen is only produced as it is used) [41]. This inherently safer design approach is entirely infeasible for the use of hydrogen as an energy storage medium, and thus it cannot be applied to the proposed energy storage and distribution systems.
This does not mean that inherently safer and passive design principles cannot be applied. In fact, it is crucial to consider the impact that materials of construction and equipment design can have on the likelihood of hydrogen release. Consider that hydrogen-containing equipment under pressure is particularly susceptible to hydrogen embrittlement. This process can proceed through a variety of mechanisms and affects most common materials of construction (e.g., iron, steel) [42]. By selecting materials and design strategies to minimize the risk of equipment failure, the likelihood of release is significantly decreased.
One aspect of passive equipment design that is often overlooked is the connections between process equipment and piping systems. Flanges in particular are a “weak spot” in many piping systems; if there is a leak of hydrogen from high temperature and pressure line, a jet fire often results [43]. This can heat the flange bolts and cause them to lengthen (this effect is exacerbated if it is a long-bolt flange), resulting in a larger leak and larger jet fire. Thus, welded connections should be considered whenever possible, and precautions should be taken in flange size and gasket selection to avoid jet fire occurrence.
While passive design principles are often the method of choice, active safeguards are an integral part of any successful design. The most common active safeguard in hydrogen systems is the pressure relief valve (PRV or PSV). These are devices with a carefully calibrated spring set to open at a specific pressure so as to avoid overpressuring the equipment. The valve can be directed to discharge to a flare header or to another safe location to control the venting of flammable materials [44].
While passive design principles and pressure relief equipment help minimize the risk of leaks, they do not eliminate it entirely; as such, it is important to have equipment that can detect leaks or fire and alarm to alert operators of the loss of containment. Infrared detection and other explosion monitoring sensors (e.g., Lower Explosive Limit (LEL) detectors) can be used near hydrogen generation, storage, and transport equipment to reduce the severity of such loss of containment events [45].
The last line of defense for industrial hydrogen safety is procedural safeguards. The most common ones employed in industry are facility-siting regulations and hot-work permitting systems.
Facility siting, often combined with required industrial electrical classification determinations, is used to provide guidance as to where certain types of equipment can be used. It is common to ban non-intrinsically safe devices and internal combustion engines (or anything else that could inadvertently ignite a hydrogen leak) from process areas where hydrogen is used.
Hot-work permitting systems are used to stringently regulate where, when, and how “hot work” (work that can generate sparks or other ignition sources) is performed on an industrial site. These permitting systems are often accompanied by gas testing procedures, grounding requirements for electrical equipment, and spark watch/fire watch requirements for any work that could result in the ignition of flammable substances.
If all of these planned safeguards fail, emergency response is used to mitigate the effects of the event once it has started. This involves having appropriate hydrogen emergency response training for plant operators as well as regular communication with local authorities to coordinate emergency response efforts. Because the required training and communication is heavily dependent on facility location and the specifics of the chemical process, a more detailed discussion will not be presented.
NFPA 2, the Hydrogen Technologies Code, can be relied on for most regulatory direction and safety requirements for these systems. As such, it will be the main resource for the work that follows. All standards referenced in this paper can be found listed in Appendix A. The following standards, some of which are referenced by NFPA 2, will also be consulted:
NFPA 68 (Standard on Explosion Protection by Deflagration Venting)
NFPA 69 (Standard on Explosion Prevention Systems)
NFPA 70 (National Electrical Code)
CGA G-5.5 (Hydrogen Vent Systems).
4.2.2. Power-to-Gas Design Considerations
To mitigate the failure of individual technologies within the power-to-gas system, it is necessary to develop an inherently safer design. In this section, we will highlight some of the more important features in the safe design of a hydrogen enrichment system.
Safety for Compressors and Storage: Compression and processing equipment for gaseous hydrogen is regulated under sections 7.1.15, 7.1.20, and 7.1.21 of NFPA 2. As a baseline for structural protection, the equipment foundations must be engineered to prevent frost heaving, and the equipment must be protected from vehicle damage [46]. The compressors themselves are also subject to stringent pressure protection; each compressor must have discharge pressure monitoring and must be equipped with check valves at the outlet to avoid over pressurizing weaker equipment upstream in the event of backflow. Further, each compressor must be outfitted with valves so that each compressor can be easily isolated from the system for maintenance. Each compressor must also be outfitted with pressure protection that has appropriate relieving capacity for abnormal operating conditions. All equipment used in the system must be specified for hydrogen service. Finally, because the equipment will operate unattended, it must be outfitted with a high discharge and a low suction pressure automatic shutdown control [45].
Pressure protection must be provided throughout the system; NFPA 2 specifies that the pressure relief device discharge must be compliant with CGA G-5.5. This provides specific information on the required length-to-diameter ratio of the discharge piping, as well as guidelines to prevent pluggage or obstruction of the vent. Pressure relief valves or rupture discs should be installed on the compressor, electrolyzer, storage tanks and in areas of the piping network where there is potential to have isolated spikes in pressure. All piping, fittings, and components should contain a CRN number and the design must be registered and assigned a P# via the Technical Standards and Safety Authority. Next, pressure and temperature indicators must be installed in and around the process units, always providing workers the operating conditions of the systems.
Whether or not the quantity of gas meets the conditions for a bulk system (more than 3.96 m3 of hydrogen), installing the system in a gas room or a detached building will be the safest storage method. The building or room must be built of noncombustible or limited-combustible materials and must be outfitted with mechanical ventilation at a rate of at least 1 scf/min per square foot of floor area in the storage space. The vents must be installed within 0.3 m of the ceiling (because hydrogen is much lighter than air) and the ventilation system must operate continuously [45].
Explosion control must also be provided, either by means of explosion prevention in compliance with NFPA 69 or deflagration venting in compliance with NFPA 68. Vessel construction must adhere to relevant pressure vessel codes and must have a suitable method of pressure relief [45].
The room will be subject to electrical requirements specified in Article 501 for Class 1, Division 2 areas according to NFPA 70, and heating must be provided by steam, hot water, or other indirect means. The space should be secured against unauthorized entry [45].
Safety for Electrolyzer: The process of water electrolysis is hazardous mostly due to its products and the amount of energy that must be put into the process. Electrical hazards can be mitigated by following NFPA 70 for all high-voltage lines and equipment. Ensuring that the oxygen and hydrogen are collected separately will reduce the risk of hydrogen ignition, and installing leak detection systems as well as automatic shut-down interlocks should reduce the risk of oxygen or hydrogen gas build-up [45]. Intensive separation equipment is not required because the oxygen and hydrogen are already separated at their collection points. However, the pure oxygen that forms can be very hazardous because it can create a flammable atmosphere. To prevent an oxygen-rich atmosphere from forming near the electrolyzer, the oxygen should be vented outside, and gas monitors should be installed near the electrolyzer to detect leaks of either O2 (any concentration exceeding 23.5% oxygen being unacceptable) or H2 (any amount exceeding 25% of the Lower Explosive Limit being unacceptable). The unit must also contain constant monitoring of key process parameters including flowrates, pressure and temperature to avoid damage to the membrane causing mechanical failure and the release of explosive gas. It is also important that the system is monitored and interlocked to the water level to avoid running dry.
Safety for Hydrogen-Enriched Natural Gas Pipelines: Most of the hydrogen produced will be consumed in the CHP; in order to ensure that the integrity of the existing equipment will not be compromised, the hazards associated with transporting hydrogen in pipelines should be considered.
The major consideration is how the inclusion of hydrogen in the natural gas stream might affect the mechanical integrity of the piping system. Certain metals (particularly, cast iron and some kinds of steel) should not be subject to more than 5% hydrogen in the pipeline by volume, or else they risk being embrittled by the hydrogen gas; this is very undesirable considering the high temperature and pressure to which the system is subjected. However, some types of steel could handle hydrogen concentrations of up to 20% without modification [13].
The end use equipment (that is, the CHP turbine itself) is also subject to limitations in hydrogen content. It is estimated that the end-use device for this system can handle a hydrogen content of 5% at the most; if retrofitted at additional capital cost, up to 40% hydrogen could be used in the turbine. If small volumes of hydrogen are used, there should be no mechanical integrity concerns with either the piping or the CHP; if more significant amounts are to be used, then the CHP will certainly require a retrofit, and other system piping and pipe fittings may need to be upgraded.
Local regulations place a limit on the change in rate of hydrogen injection of 2%/min due to the potential of over pressurization. To mitigate this, pressure sensing devices will be connected to the regulator via the programmable logic controller’s (PLC) control circuit to ensure this amount is not exceeded. To prevent risk of explosion and failure due to embrittlement, all material will be rated to schedule 80 and built according to ANSI.ASME B31.3. Furthermore, LEL monitoring should be present at all times near high-risk areas to detect potential hydrogen leaks.
It should be noted that hydrogen blending will not introduce additional electrical area classification requirements, as the area should remain classified as being a space where flammable gases are handled inside of a process but should not escape unless there is a process upset (Class 1, Division 2). However, for existing leak detection systems to be able to detect hydrogen leaks, gas detection equipment should be installed near the ceiling of the building containing the CHP. Further, existing pressure safety valve contingency studies should be revisited to ensure that blending hydrogen into the natural gas does not change the required relief capacity. A full summary of the Failure Modes and Effects Analysis of the system can be found in Table 2.
Table 2.
Summary of the Failure Modes and Effects Analysis of the power-to-gas HENG system noting the potential control measures available to mitigate risk.
5. Conclusions
The use of hydrogen enriched natural gas to offset the carbon intensity of fossil fuels in industrial combined heat and power microgrids has shown favorable financial and environmental potential given a significant enough provincial or federal carbon tax. Our system used electricity from Ontario’s provincial grid to convert water into hydrogen in a 345 m3hr−1 PEM electrolyzer. This hydrogen was compressed to a pressure of 172 Bar using a Greenfield reciprocating compressor and either stored for later use in 89 kg tanks or sent directly to a blending system to be injected into the combined heat and power plant’s natural gas stream.
Currently realizable capital incentives can see IRRs as high as 13.76% with net present values of approximately $750,000. To realize financial feasibility, the carbon price in Ontario must achieve or exceed a minimum of 60$/ton CO2e. In Ontario, the carbon price is currently 20$/ton CO2e; however, it is projected to increase to 50$/ton CO2e by 2022. The feasible region ranged from 100$/ton CO2e with 0% capital grant producing an IRR of 8.31% to 100$/ton CO2e and 50% capital grant corresponding to an IRR of 20.33%. In all economically feasible, cases the system operating under an optimal storage coefficient and operational limit produced an emission offset greater than 3000 ton CO2 per year. The system’s finances were relatively sensitive to changes in the operational limit of the electrolyzer; however, they plateaued after maximum available blending was achieved. As such, improving blending tolerances could allow for significant increases in the economic viability of the project. While a 5% maximum was considered in the simulation, given a thorough assessment and modification of the infrastructure and end-use application compatibility, it would not be unreasonable to see this number increase into the range of 10–20% in the future.
Hydrogen has been a part of industrial operations for decades, and as such, there is a significant precedent for its safe use. While the proposed uses of hydrogen for this project are less well-established, existing knowledge for the safe storage and handling of flammable gases as a fuel source can be coupled with the knowledge of hydrogen-specific hazards to develop a comprehensive safety management strategy.
New generation and storage systems should be designed to state-of-the-art standards for materials of construction (to avoid hydrogen embrittlement) as well as pressure protection and leak detection; facility siting is also paramount to ensure that risk is minimized. Existing infrastructure that will now be handling hydrogen gas (i.e., CHP and associated piping) should be rated for a maximum hydrogen content to ensure that the material is not weakened by the blending of hydrogen, and advanced hydrogen detection systems should be installed near the ceiling to detect any accumulation of hydrogen in enclosed areas. Refueling stations should be designed to industry standards, including modern safety features such as automatic shutoffs and breakaway hoses. Finally, hydrogen fuel cell vehicles should be designed to minimize the quantity of hazardous materials carried on board, and rigorous preventative maintenance should be performed to ensure that all safety devices associated with the vehicles are functioning properly.
As with any other potentially hazardous chemical, the existence of the hazards does not mean that the process cannot be made safe. If appropriate steps and mitigations are taken to ensure that the system poses negligible risk to the industrial site and surrounding community, a hydrogen generation, storage, and use system can be built to optimize the energy consumption patterns for the industrial site.
While the proposed system can achieve favorable economic and environmental outlooks, given the right incentive structure, it would not be feasible if it could not be operated safely. A Failure Modes and Effects analysis was carried out that identified 22 possible failures amongst 6 critical control points. After reviewing relevant codes and standards for hydrogen-based systems in Ontario as well as applicable national standards, active safeguards were suggested to mitigate the risk associated by each failure mode. In doing so, we can conclude that a power-to-gas system implemented on the industrial scale in Ontario would not only see favorable returns given the correct regulatory climate but also would not impose any significant risk to the public or to the plant.
Author Contributions
Conceptualization and Project Management, N.P., A.M., H.R., S.B., U.M., P.T., J.W., A.E., M.F.; Model development and simulation, N.P., A.M., H.R., S.B., U.M., P.T., J.W.; Writing- Original Draft Preparation, N.P., A.M., H.R., S.B., U.M., P.T., J.W.; Visualization and graphical analysis, N.P., A.M., H.R., S.B., U.M., P.T., J.W.; Writing-Review and editing; N.P., A.M.; Supervision and Project Administration, A.M., M.F. All authors have read and agreed to the published version of the manuscript.
Funding
This research received no external funding.
Institutional Review Board Statement
Not Applicable.
Informed Consent Statement
Not Applicable.
Data Availability Statement
Data available on request due to restrictions associated with the Company under study. The data presented in the study is available on request from any of the listed authors.
Conflicts of Interest
The authors declare no conflict of interest.
Nomenclature
| Reference Number | Relevant Standard |
| HHV Natural Gas | |
| HHV Hydrogen | |
| LL | Limit on H2 Generation PRice |
| HOEP | Hourly Ontario Energy Price |
| Xblend, inventory | H2 Volume Fraction Sent to CHP After Inventory Dump |
| Xblend, power | Maximum Volume Fraction of H2 to Maintain Electrical Power |
| Xblend, max | Maxiumum Volumetric Blending |
| Xblend | Actual Volumetric Blending |
| FH2,Elec-CHP | H2 sent from Electrolyzer to CHP |
| FH2, CHP | H2 sent to CHP |
| FT | Total Gas |
| Fmax | Maximum Gas Flowrate |
| FNG, CHP | Flow of Natural Gas to CHP |
| Equivalent Natural Gas | |
| FH2,Storage-CHP | Natural Gas Sent From Storage to CHP |
| FH2,Elec-Storage | Natural Gas Sent From Electrolyzer to Storage |
| δstorage | Storage Coefficient |
| t | Current Time Stamp |
| IH2 | Inventory of Hydrogen |
| IH2,MAX | Maximum Hydrogen Inventory |
| IH2,prev | Hydrogen Inventory of Previous Time Stamp |
Appendix A. Relevant Codes & Standards
| Reference Number | Relevant Standard |
| 1 | OHSA 1910.103 |
| 2 | SAEJ2600 |
| 3 | CAN 1784-000 |
| 4 | ASME B31.12 |
| 5 | NFPA 2 |
| 6 | NFPA 55 |
| 7 | FSM Division 13.03 |
| 8 | ISO-TC 58 |
| 9 | FSM Division 13.02 |
| 10 | FSM Division 16.06 |
| 11 | ISO 22734-1:2008 |
| 12 | ASME B31.3 |
| 13 | ASME B31.9 |
| 14 | SAE J2578 |
| 15 | NFPA 70 |
| 16 | NFPA 72 |
| 17 | NFPA 110 |
| 18 | NFPA 170 |
| 19 | NFPA 52 |
| 20 | NFPA 68 |
| 21 | NFPA 69 |
References
- Office of the Auditor General of Ontario. Electricity Power System Planning. 2017. Available online: http://www.auditor.on.ca/en/content/annualreports/reportsbytopic/bytopic_energy.html (accessed on 24 October 2018).
- Independent Electricity System Operator. Data Directory. 2018. Available online: www.ieso.ca (accessed on 19 May 2019).
- Environment and Natural Resources Canada. Pan-Canadian Framework on Clean Growth and Climate Change: First Annual Synthesis Report on the Status of Implementation (Cat. No.: En1-77E-PDF). 2017. Available online: https://www.canada.ca/en/environment-climate-change/services/climate-change/pan-canadian-framework-reports/first-annual-report.html (accessed on 24 October 2018).
- ICF Consulting Canada, Inc. Long-Term Carbon Price Forecast Report; Ontario Energy Board: Toronto, ON, Canada, 2017. [Google Scholar]
- Cap and Trade: Program Overview (Ministry of Environment and Climate Change). 2017. Available online: https://www.ontario.ca/page/cap-and-trade-program-overview (accessed on 19 May 2019).
- Maroufmashat, A.; Fowler, M. Transition of Future Energy System Infrastructure; through Power-to-Gas Pathways. Energies 2017, 10, 1089. [Google Scholar] [CrossRef]
- Tractebel and Hinicio. Study on Early Business Cases for H2 in Energy Storage and More Broadly Power to H2 Applications. 2017. Available online: https://www.fch.europa.eu/ (accessed on 19 May 2019).
- Al-Zakwani, S.S.; Maroufmashat, A.; Mazouz, A.; Fowler, M.; Elkamel, A. Allocation of Ontario’s Surplus Electricity to Different Power-to-Gas Applications. Energies 2019, 12, 2675. [Google Scholar] [CrossRef]
- Maroufmashat, A.; Fowler, M. Policy considerations for zero-emission vehicle infrastructure incentives: Case study in Canada. World Electr. Veh. J. 2018, 9, 38. [Google Scholar] [CrossRef]
- Walker, S.; Al-Zakwani, S.; Maroufmashat, A.; Fowler, M.; Elkamel, A. Multi-Criteria Examination of Power-to-Gas Pathways under Stochastic Preferences. Energies 2020, 13, 3151. [Google Scholar] [CrossRef]
- Maroufmashat, A.; Fowler, M.; Khavas, S.S.; Elkamel, A.; Roshandel, R.; Hajimiragha, A. Mixed integer linear programming based approach for optimal planning and operation of a smart urban energy network to support the hydrogen economy. Int. J. Hydrog. Energy 2016, 41, 7700–7716. [Google Scholar] [CrossRef]
- Knopf, F.C. Modeling, Analysis and Optimization of Process and Energy Systems; John Wiley & Sons, Inc.: Baton Rouge, LA, USA, 2012. [Google Scholar]
- Yeong, Y.; Glass, N.; Baker, R. Review of Hydrogen Tolerance of Key Power-to-Gas Components and Systems in Canada. Report No. NRC-EME-55882. 2017. Available online: https://nrc-publications.canada.ca/fra/voir/objet/?id=94a036f4-0e60-4433-add5-9479350f74de (accessed on 19 May 2019).
- Mukherjee, U.; Maroufmashat, A.; Ranisau, J.; Barbouti, M.; Trainor, A.; Juthani, N.; El-Shayeb, H.; Fowler, M. Techno-economic, environmental, and safety assessment of hydrogen powered community microgrids; case study in Canada. Int. J. Hydrog. Energy 2017, 42, 14333–14349. [Google Scholar] [CrossRef]
- Lo Basso, G.; de Santoli, L.; Albo, A.; Nastasi, B. H2NG effects on energy performances of a condensing micro-CHP for residential applications: An expeditious assessment of water condensation and experimental analysis. Energy 2015, 84, 397–418. [Google Scholar] [CrossRef]
- Allen, B.; Boutot, T.; Bullerwell, K.; Liu, J.; Norton, S.; Whidden, T. Hydrogen Enriched Natural Gas: Generation and Applications in Combined Heat and Power Generation and as a Fuel for High Efficiency Boilers; AIChE Spring National Meeting: San Antonio, TX, USA, 2010. [Google Scholar]
- IEA Greenhouse Gas R&D Programme. Reduction of CO2 Emissions by Adding Hydrogen to Natural Gas. (Report No. PH4/24). 2003. Available online: ieaghg.org (accessed on 23 May 2019).
- Preston, N.; Maroufmashat, A.; Riaz, H.; Barbouti, S.; Mukherjee, U.; Tang, P.; Fowler, M. How can the integration of renewable energy and power-to-gas benefit industrial facilities? From techno-economic, policy, and environmental assessment. Int. J. Hydrog. Energy 2020, 45, 26559–26573. [Google Scholar] [CrossRef]
- Ranisau, J.; Barbouti, M.; Trainor, A.; Juthani, N.; Salkuyeh, Y.K.; Maroufmashat, A.; Fowler, M. Power-to-gas implementation for a polygeneration system in southwestern ontario. Sustainability 2017, 9, 1610. [Google Scholar] [CrossRef]
- Gotz, M.; Lefebvre, J.; Mörs, F.; Koch, A.M.; Graf, F.; Bajohr, S.; Reimert, R.; Kolb, T. Renewable Power-to-Gas: A technological and economic review. Renew. Energy 2016, 85, 1371–1390. [Google Scholar] [CrossRef]
- Saur, G. Wind-to-Hydrogen Project: Electrolyzer Capital Cost Study; Technical Report; NREL National Renewable Energy Laboratory: Golden, CO, USA, 2008. [Google Scholar]
- Region of Waterloo: Billing Rates and Meters (n.d.). Available online: regionofwaterloo.ca (accessed on 24 May 2019).
- Mayyas, A.; Ruth, M.; Pivovar, B.; Bender, G.; Wipke, K. NREL/TP-6A20-72740, Manufacturing Cost Analysis for Proton Exchange Membrane Water Electrolyzers. 2019. Available online: https://www.nrel.gov/docs/fy19osti/72740.pdf (accessed on 24 May 2019).
- Office of Energy Efficiency & Renewable Energy. DOE Technical Targets for Hydrogen Production from Electrolysis. Available online: https://www.energy.gov/eere/fuelcells/doe-technical-targets-hydrogen-production-electrolysis (accessed on 24 May 2019).
- Barbir, F. PEM electrolysis for production of hydrogen from renewable energy sources. Sol. Energy 2005, 78, 661–669. [Google Scholar] [CrossRef]
- Guandalini, G.; Campanari, S. Wind power plant and Power-to-Gas System Coupled with Natural Gas Grid Infrastructure: Techno-Economic Optimization of Operation. In Proceedings of the ASME Turbo Expo 2015, Montreal, QC, Canada, 15–19 June 2015. [Google Scholar]
- Moradi, R.; Grosh, K.M. Hydrogen storage and delivery: Review of the state of the art technologies and risk and reliability analysis. Int. J. Hydrog. Energy 2019, 44, 12254–12269. [Google Scholar] [CrossRef]
- Bai, M.; Song, K.; Sun, Y.; He, M.; Li, Y.; Sun, J. An overview of hydrogen underground storage technology and prospects in China. J. Pet. Sci. Eng. 2014, 124, 132–136. [Google Scholar] [CrossRef]
- James, B.D.; Houchins, C.; Hyya-Kouadio, J.M.; DeSantis, D.A. DE-EE0005253, Final Report: Hydrogen Storage System Cost Analysis. 2016. Available online: https://www.osti.gov/servlets/purl/1343975 (accessed on 24 May 2019).
- Ambrosino, N. Plant Services: Comparing Air Compressors: Which One is Best for Your Plant. 2008. Available online: https://www.plantservices.com/articles/2008/013/ (accessed on 24 May 2019).
- Parks, G.; Boyd, R.; Cornish, J.; Remick. NREL/BK-6A10-58564, Hydrogen Station Compression, Storage, and Dispensing Technical Status and Costs. 2014. Available online: https://www.hydrogen.energy.gov/pdfs/58564.pdf (accessed on 28 May 2019).
- Garrett, D.E. Chemical Engineering Economics; Springer: Dordrecht, The Netherlands, 1989. [Google Scholar]
- Mukherjee, U.; Mohamed, E.; Walker, S.; Fowler, M.; Elkamel, A.; Hajimiragha, A. Optimal sizing of an electrolytic hydrogen production system using an existing natural gas infrastructure. Int. J. Hydrog. Energy 2015, 40, 9760–9772. [Google Scholar] [CrossRef]
- Toyota Motor Corporation. Environmental Report 2017. Available online: www.toyota-global.com (accessed on 28 May 2019).
- Environment and Natural Resources Canada. The Lower Carbon Economy Fund. 2019. Available online: www.canada.ca (accessed on 28 May 2019).
- Balat, M.; Kirtay, E. Majoy Technical Barriers to a “Hydrogen Economy”. Energy Sources Part A Recovery Util. Environ. Eff. 2009, 32, 863–876. [Google Scholar] [CrossRef]
- H2 Tools. “Introduction to Hydrogen Safety for First Repsonders,” Pacific Northwest National Laboratory. Available online: https://www.h2tools.org/user?destination=firstresponder (accessed on 25 May 2018).
- Grewal, S. Caledon residents angry over re-emergence of Canadian Tire hydrogen project. Toronto Star. Available online: thestar.com (accessed on 23 July 2016).
- Center for Chemical Process Safety. “SAChE Certificate Program—Inherently Safer Design,” American Institure of Chemical Engineers. Available online: https://www.aiche.org/academy/courses/ela984/sacher-certificate-program-inherently-safer-design (accessed on 19 May 2019).
- Robertson, I.; Nagao, A.; Sofronis, P.; Martin, L.; Wang, S.; Gross, D.; Nygren, K. Hydrogen Embrittlement Understood. Metall. Mater. Trans. A 2015, 46, 2323–2341. [Google Scholar] [CrossRef]
- NFPA 72. 2016. Available online: http://www.nfpa.org/codes-and-standards/allcodes-and-standards/list-of-codes-and-standards/detail?code=72 (accessed on 7 January 2018).
- The American Society of Mechanical Engineers, Hydrogen Piping and Pipelines, ASME B31.12-2011. 2018. Available online: http://files.asme.org/Catalog/Codes/PrintBook/31382.pdf (accessed on 25 May 2018).
- Matheson Gas. (n.d.). Lower and Upper Explosive Limits for Flammable Gases and Vapors (LEL/UEL). Available online: https://www.mathesongas.com/pdfs/products/Lower-(LEL)-&-Upper-(UEL)-Explosive-Limits-.pdf (accessed on 19 May 2019).
- Naranjo, E. Hydrogen Gas Detection. Hydrocarb. Process. 2009, 45–47. Available online: https://issuu.com/androsov.info/docs/hp_2009_03/3, (accessed on 23 May 2019).
- Center for Chemical Process Safety. SAChE CErtificate Program—Hazards and Risk: Introduction to Pressure Protection. American Society of Chemical Engineers. Available online: https://www.aiche.org/academy/courses/ela971/sacher-certificate-program-hazards-and-risk-introduction-pressure-protection (accessed on 18 May 2018).
- National Fire Protection Association. NFPA 2: Hydrogen Technologies Code. 2015. Available online: https://www.nfpa.org/codes-and-standards/all-codes-and-standards/list-of-codes-and-standards/detail?code=2 (accessed on 11 July 2018).


Publisher’s Note: MDPI stays neutral with regard to jurisdictional claims in published maps and institutional affiliations. |
© 2021 by the authors. Licensee MDPI, Basel, Switzerland. This article is an open access article distributed under the terms and conditions of the Creative Commons Attribution (CC BY) license (https://creativecommons.org/licenses/by/4.0/).