Article

Distribution Model of Fluid Components and Quantitative Calculation of Movable Oil in Inter-Salt Shale Using 2D NMR

1
Shandong Provincial Key Laboratory of Deep Oil and Gas, Qingdao 266580, China
2
School of Geosciences, China University of Petroleum (East China), Qingdao 266580, China
3
State Key Laboratory of Mining Disaster Prevention and Control, Shandong University of Science and Technology, Qingdao 266590, China
4
College of Energy and Mining Engineering, Shandong University of Science and Technology, Qingdao 266590, China
*
Authors to whom correspondence should be addressed.
Energies 2021, 14(9), 2447; https://doi.org/10.3390/en14092447
Submission received: 22 February 2021 / Revised: 22 April 2021 / Accepted: 23 April 2021 / Published: 25 April 2021
(This article belongs to the Special Issue Advances in Shale Oil and Shale Gas Technologies)

Abstract

:
Some inter-salt shale reservoirs have high oil saturations but the soluble salts in their complex lithology pose considerable challenges to their production. Low-field nuclear magnetic resonance (NMR) has been widely used in evaluating physical properties, fluid characteristics, and fluid saturation of conventional oil and gas reservoirs as well as common shale reservoirs. However, the fluid distribution analysis and fluid saturation calculations in inter-salt shale based on NMR results have not been investigated because of existing technical difficulties. Herein, to explore the fluid distribution patterns and movable oil saturation of the inter-salt shale, a specific experimental scheme was designed which is based on the joint adaptation of multi-state saturation, multi-temperature heating, and NMR measurements. This novel approach was applied to the inter-salt shale core samples from the Qianjiang Sag of the Jianghan Basin in China. The experiments were conducted using two sets of inter-salt shale samples, namely cylindrical and powder samples. Additionally, by comparing the one-dimensional (1D) and two-dimensional (2D) NMR results of these samples in oil-saturated and octamethylcyclotetrasiloxane-saturated states, the distributions of free movable oil and water were obtained. Meanwhile, the distributions of the free residual oil, adsorbed oil, and kerogen in the samples were obtained by comparing the 2D NMR T1-T2 maps of the original samples with the sample heated to five different temperatures of 80, 200, 350, 450, and 600 °C. This research puts forward a 2D NMR identification graph for fluid components in the inter-salt shale reservoirs. Our experimental scheme effectively solves the problems of fluid composition distribution and movable oil saturation calculation in the study area, which is of notable importance for subsequent exploration and production practices.

1. Introduction

With the depletion of fossil resources in conventional reservoirs, the exploration and production of unconventional oil and gas reservoirs are becoming increasingly important [1,2,3,4]. After the significant breakthrough of advanced hydraulic fracturing technology, shale oil became one of the most promising unconventional fossil resources [5]. In the U.S., nearly half of the produced crude oil directly comes from shale reservoirs. Among the shale reservoirs, inter-salt shale formation is considered a high-quality source rock [6]. The crude oil generated by such shale formations is blocked by the upper and lower salt layers and cannot be effectively discharged; therefore, it gets trapped and stored in the source rock. The inter-salt shale represents pore characteristics similar to typical shale, including both organic pores and inorganic pores. However, the experimental studies of inter-salt shale have proved many unique production problems due to the salt dissolution phenomenon [7] and the special brittleness index [8].
The movable oil saturation is an important physical characteristic of the inter-salt shale, and its component distribution pattern is of great significance for studying the properties of fluid components and multiphase flow. Nowadays, there are many typical techniques used for measuring oil, gas, and water component characteristics in multiphase flow, such as electrical capacitance [9,10], photon (gamma and X-ray) attenuation [11,12], and ultrasound technique [13]. However, shale’s complex mineralogical composition and low permeability make it challenging to study fluid distribution patterns and saturation. Being a non-destructive technique, low-field nuclear magnetic resonance (LF-NMR) has gained worldwide attention in many applications [14]. Because it only resonates with spin nuclei in the formation, in recent years, NMR technology has been greatly developed in petroleum studies, providing a large number of logging, reservoir evaluation, and fluid distribution data [15,16,17,18,19,20,21,22]. The application of NMR techniques in exploration wells is called NMR logging (NMRL). Although NMRL is considered a mature and reliable logging method, it is not feasible in every exploration well due to its high cost. Oilfield service companies offer NMRL under extreme conditions in deep boreholes (high-temperature and high-pressure) with a high vertical resolution, which is one important reason for the high cost [23]. In addition, the speed of NMRL (245 to 275 m/h) is much lower than that of conventional measurement logging (approximately 550 m/h), which increases the cost during the exploration stage. Nowadays, researchers try to put forward more cost- and time-effective approaches for obtaining NMR relaxations based on statistical algorithms and artificial intelligent algorithms [24,25]. Moreover, the cost-effective specifically designed NMRL tool has been applied in near-surface regions for evaluating formation properties [26]. Due to the great advantages of investigating pore size distributions and fluid types, NMRL is believed to be a standard logging method for future exploration exercises if the logging speed becomes reasonably high, interpreting the results is fast, and there exist low-cost, high-temperature, high-pressure-resistant materials. However, due to the different types of pores (organic pores and inorganic pores) and complex hydrogen-bearing contents (e.g., clay, kerogen, different fluids, etc.), which are crucially complicated in the case of the inter-salt shale, the evaluation of this type of reservoir by NMR is still very challenging. In shale reservoirs, identifying and distinguishing fluids is the key to calculating the saturation of movable oil.
Compared with one-dimensional (1D) NMR, two-dimensional (2D) NMR provides more valuable information about the intrinsic properties of hydrogen-bearing components. There are two frequently used 2D NMR methods in oil exploration, namely T2-D and T1-T2. The T2-D method combines transverse relaxation time (T2) and a diffusion coefficient (D) for identifying fluid types and calculating fluid saturations more accurately [27,28]. Based on the principle of T2-D, fluid identification in a conventional reservoir is simple and effective due to the differences in oil, water, and gas diffusion coefficients [29]. In addition, the T2-D method can be applied in conventional reservoirs to characterize pore geometry [30], pore surface relaxivity [31], and wettability [32]. In deep reservoirs, if the average pore size is at the level of millimeters, the above applications will be useful for understanding pores and fluids. However, in unconventional shale or in most deep reservoirs, the applicability of this method is limited due to the presence of nanopores [33]. It is difficult for water molecules to diffuse in nanopores, and only a few studies have applied the T2-D method in shale samples [34]. In contrast, the majority of the existing research works have implemented the T1-T2 method for studying shale reservoirs [35,36]. The T1-T2 method has its unique advantage of identifying hydrogen-bearing contents in shale samples due to their different longitudinal relaxation time (T1) values. Yan et al. [37] performed both 1D and 2D NMR measurements on core samples in diverse states to identify different hydrogen-bearing phases in unconventional oil reservoirs. They also combined the T1-T2 method and imbibition methods to investigate fluids associated with different types of pores [38]. Zhang et al. [39] determined adsorbed/free oil in shale samples by combining 2D NMR and centrifugal experiments. The existing studies have also conducted an in-depth study on the calculation of oil saturation using 1D NMR. The amplitude difference of T2 spectrums of a rock sample between an oven-dried state and an oil-saturated state represents the signal of oil, which is often used to calculate the oil saturation [40]. However, there are only a few studies on the calculation of the movable oil saturation of shale oil by nuclear magnetic resonance [41], and no study has reported the calculation method of movable oil saturation for inter-salt shale. Meanwhile, the existing studies have focused on common shale oil, and fluid distribution analyses in inter-salt shale have not been reported yet.
Considering all the above-described facts and challenges, in the present study, the joint 1D and 2D NMR measurements were adopted to (i) identify the distribution pattern of different hydrocarbon components and (ii) calculate the fluid saturations in the inter-salt shale reservoirs for the first time. Herein, particularly designed stepwise multi-temperature anaerobic heating equipment was developed. Moreover, to investigate the fluid components and saturations, a novel experimental procedure was developed. By conducting NMR experiments under simultaneous multi-state saturation on cylindrical samples and stepwise multi-temperature heating on powder samples, the distributions of inter-salt shale oil compositions and movable oil saturation were obtained. In addition, based on the NMR results, an identification graph of fluid components for inter-salt shale was proposed.
In this paper, two major original contributions are represented. The first one is to develop a novel experimental procedure based on the joint adaptation of multi-state saturation, multi-temperature heating, and NMR measurements. To achieve the multiple-temperature heating on large-scale powder samples, special stepwise multi-temperature anaerobic heating equipment with a big sample chamber was designed. Nevertheless, the second contribution is to establish the composition distribution graph of inter-salt shale in the 2D T1-T2 map, which is the key to understanding the fluid distribution and free movable oil saturation.

2. NMR Principles

When a nucleus with a net nuclear spin is placed in a magnetic field and is excited by a secondary resonance-frequency oscillating magnetic field, it can undergo a spin-state transition. This process is called nuclear magnetic resonance (NMR) [42]. For the NMR measurement of porous media, there is a positive relationship between the detected total signal and the number of hydrogen nuclei of the sample. In both laboratory measurements and oil field explorations, researchers and engineers usually use the CPMG (Carr–Purcell–Meiboom–Gill) pulse sequence to measure the 1D NMR T2 spectrum [43]. In CPMG, after the 90° radiofrequency pulse, multiple 180° pulses are applied to generate multiple spin echoes. To quantitatively describe the relaxation characteristics of fluids in the porous medium, Brownstein and Tarr established the Brownstein and Tarr (BT) model [44]. For a sedimentary rock, the overall relaxation (T2) is the combination of three distinctive mechanisms [45], including surface relaxation time (T2S), bulk relaxation time (T2B), and diffusion relaxation time (T2G) expressed as
1 T 2 = 1 T 2 B + ρ 2 S V + D ( γ G T E ) 2 12
where ρ2 is the surface relaxivity, S is the surface area of a pore, V is the volume of a pore, D is the diffusion coefficient, γ is the gyromagnetic ratio, G is the magnetic field gradient, and TE is the echo spacing. The pore size distribution of a rock can be derived from a T2 spectrum by setting a small value of echo spacing.
The 1D NMR T2 spectrum can only provide limited information, and its interpretation is rather full of uncertainty when T2 curves of different hydrogen-bearing components overlap. To analyze the rock properties more accurately, researchers usually use an inversion recovery (IR) pulse sequence or a saturation recovery (SR) pulse sequence followed by a CPMG pulse sequence to measure the 2D NMR T1-T2 map [46]. The SR-CPMG has more advantages than IR-CPMG because of the short polarization time in consecutive scans. Although the accuracy of Equation (1) has been proved in conventional rocks, it cannot explain the relaxation mechanisms of organic matters in shale oil, such as semi-solid kerogen and highly viscous bitumen. To solve this problem, Bloembergen, Purcell, and Pound developed the BPP model [47], which can describe the T1 and T2 of hydrogen-bearing components in a shale oil rock sample. This model is expressed as
1 T 1 = ( 6 20 ) × ( γ I 2 γ S 2 r 6 ) × ( τ c 1 + ω 0 2 τ c 2 + 4 τ c 1 + 4 ω 0 2 τ c 2 )
1 T 2 = ( 3 20 ) × ( γ I 2 γ S 2 r 6 ) × ( 3 τ c + 5 τ c 1 + ω 0 2 τ c 2 + 2 τ c 1 + 4 ω 0 2 τ c 2 )
where ħ is the Planck constant, γI and γS are the gyromagnetic ratios of nuclei, r is the spin distance, τc is the molecular rotation-related time, and ω0 is the resonance frequency. According to the BPP model, organic matters have long T1 values and short T2 values. Therefore, it is feasible to separate the detected signals of free oil and other hydrogen-bearing components through the T1-T2 map.

3. Samples and Experiments

3.1. Two Types of Inter-Salt Shale Samples

The experimental inter-salt shale samples of the present study were taken from the third member of the Qianjiang Sag of the Jianghan Basin in China. The rock skeleton contains water-soluble salt minerals, including rock salt, glauberite, gypsum, and other chemical minerals. In this study, six irregular samples were collected. Two types of samples including cylindrical shale samples and powder samples were prepared for the NMR measurements at multi-state saturations and multi-temperature heating states. Each original sample was cut in a cylindrical shape with a diameter of 2.54 cm and a length of 5.21 cm using the wire cutting technique. These samples were used to perform the multi-state saturation NMR measurements. After the wire cutting, the remaining part of each original sample was crushed into a powder with 80 mesh by a powder machine. These samples were used for the multi-temperature heating state NMR measurements.

3.2. A Novel Experimental Procedure

The objective of the current study was to investigate the distribution model of fluid components and movable oil in inter-salt shale. If the inter-salt shale contacts free water during the experiment, it leads to the dissolution of soluble salt minerals and causes pore dilation. Therefore, there should be no water in the whole experiment. Design of experiments (DoE) is a systematic approach to evaluate parameter sensitivity, quantify uncertainty, and perform optimizations in many oil and gas industrial applications [48,49], but the experimental procedure in this paper does not necessary to follow the DoE workflow because the major relevant parameters were fixed. Two series of experiments were designed and carried out based on different types of samples. Figure 1 shows the flow chart of the experimental procedure.
Experiment I: One-dimensional T2 spectrum and 2D T1-T2 spectrum NMR experiments were conducted for cylindrical samples under different conditions. Before the experiment, the SCMS-C3 type porosimeter was used to perform helium porosity analysis and an air permeability test on the cores according to the Chinese industrial standard (SY/T 6385-2016) and then 1D and 2D NMR experiments were conducted. The detailed experimental procedure was as follows:
(1)
Sample wrapping and original-state NMR test: Each prepared cylindrical sample was wrapped using a plastic film to prevent possible physical damage in the subsequent experiments. Then, the NMR tests were conducted in the original state before saturation. It is worth noting that the wrapping film was made of a specific plastic that did not produce any NMR signal to guarantee the originality of the test results.
(2)
NMR test after oil absorption: First, both oil and shale samples were put into the vacuum core saturation machine. Then, cylindrical samples were vacuumed for 8 h and absorbed oil without the external pressure for 30 days. Finally, the oil on the samples’ external surface was cleaned and 1D NMR T2 spectrum and 2D T1-T2 maps were measured.
(3)
NMR test of the oil-saturated sample: Oil-saturated shale samples were prepared under three external pressures. The inter-salt shale in this area has high brittle mineral content (average 56%) and high brittleness index (average 75.3) [50]. It was found that when the external pressure was over 2000 psi, the micro-fracture would exist. Therefore, the maximum external pressure of our research was 2000 psi. The cylindrical samples were put into the vacuum core saturation machine under external pressures of 500, 1000, and 2000 psi, respectively. Each saturation state was kept for 7 days. Then, both 1D and 2D NMR measurements were carried out at each of these saturation states.
(4)
NMR test after oil-washing and adding octamethylcyclotetrasiloxane (D4): These shale samples were washed with alcohol and toluene, and then both clean samples and D4 were put into the vacuum core saturation machine and the pressure was set to 2000 psi.
Experiment II: One important purpose of our study was to obtain the distributions of free movable oil, free residual oil, adsorbed oil, and kerogen from the 2D NMR T1-T2 map. However, it is difficult to identify different fluids only by NMR techniques. In the field of organic geochemistry, the hydrocarbon generation potential can be estimated by pyrolysis analysis under multiple temperatures [51]. The fluid distributions from the T1-T2 map can be acquired by combining NMR and multi-temperature heating methods. Each 80-mesh powder sample was divided into five parts to perform the multi-temperature heating and 1D and 2D NMR experiments. The detailed experimental procedure was as follows:
(1)
Original-state NMR test: Twenty grams of the powder sample were wrapped with a plastic film to prevent the powder loss in subsequent experiments and the 1D and 2D NMR signals of the original samples were measured.
(2)
Multi-temperature heating of powder samples: Using particularly designed stepwise multi-temperature anaerobic heating equipment, five parts of each powder sample were heated to 80, 200, 350, 450, and 600 °C, respectively. Five different temperature values were adopted from the study of Jiang et al. [52], which related to different types of hydrocarbon fractions (free movable oil, free residual oil, adsorbed oil, and kerogen). When the temperature rises up to 600 °C, no residual oil or adsorbed oil exists in the inter-salt shale powder sample. Then, the T2 spectrum and T1-T2 maps of these powder samples were measured.
In our research, 1D and 2D NMR experiments were conducted using the NUMAG MesoMR23-060H-I NMR machine (constant temperature of 32 °C). The CPMG pulse sequence was used to measure the T2 spectrum, and the SR-CPMG pulse sequence was used to measure the T1-T2 maps. Due to the difference in pore characteristics between the salt shale samples and the conventional sandstone samples, the NMR measurement parameters should be selected very carefully. Among all the measurement parameters, the echo spacing and the waiting time are the most crucial parameters that affect the shape of the T2 spectrum. When the waiting time is fixed, the T2 spectrum moves to the right with the increase of the echo spacing. Therefore, the echo spacing should be as small as possible in order to avoid missing the smaller portion of micropores. When the echo spacing is fixed, the higher the waiting time is, the more it can reflect the entire pore space information. Therefore, the echo spacing of 0.1 ms and the waiting time of 6000 ms were chosen for the NMR measurement. Meanwhile, the number of echoes was set to 6000, and the number of scans was 32.
The multi-temperature heating experiment of powder samples was carried out using our particularly designed equipment. The traditional way of conducting multi-temperature heating experiments for shale samples is using the rock pyrolysis analyzer [53], but the weight of the sample required for NMR measurement is much greater than the upper limit of the allowed sample weight for the pyrolysis experiment. Special stepwise multi-temperature anaerobic heating equipment with a big sample chamber was designed to combine the NMR experiments and multi-temperature heating experiments. Figure 2a shows the schematic diagram of the equipment, and Figure 2b shows the developed real equipment. This equipment could ensure oxygen isolation, uniformity, high efficiency, and heating of large-scale powder samples. The maximum heating temperature is 800 °C, and the maximum sample weight is 100 g, which ensures that subsequent NMR measurements can be completed after the powder samples are heated.

4. Distribution Patterns of Different Fluid Components of Inter-Salt Shale

4.1. Distribution Pattern of Free Movable Oil in Inter-Salt Shale

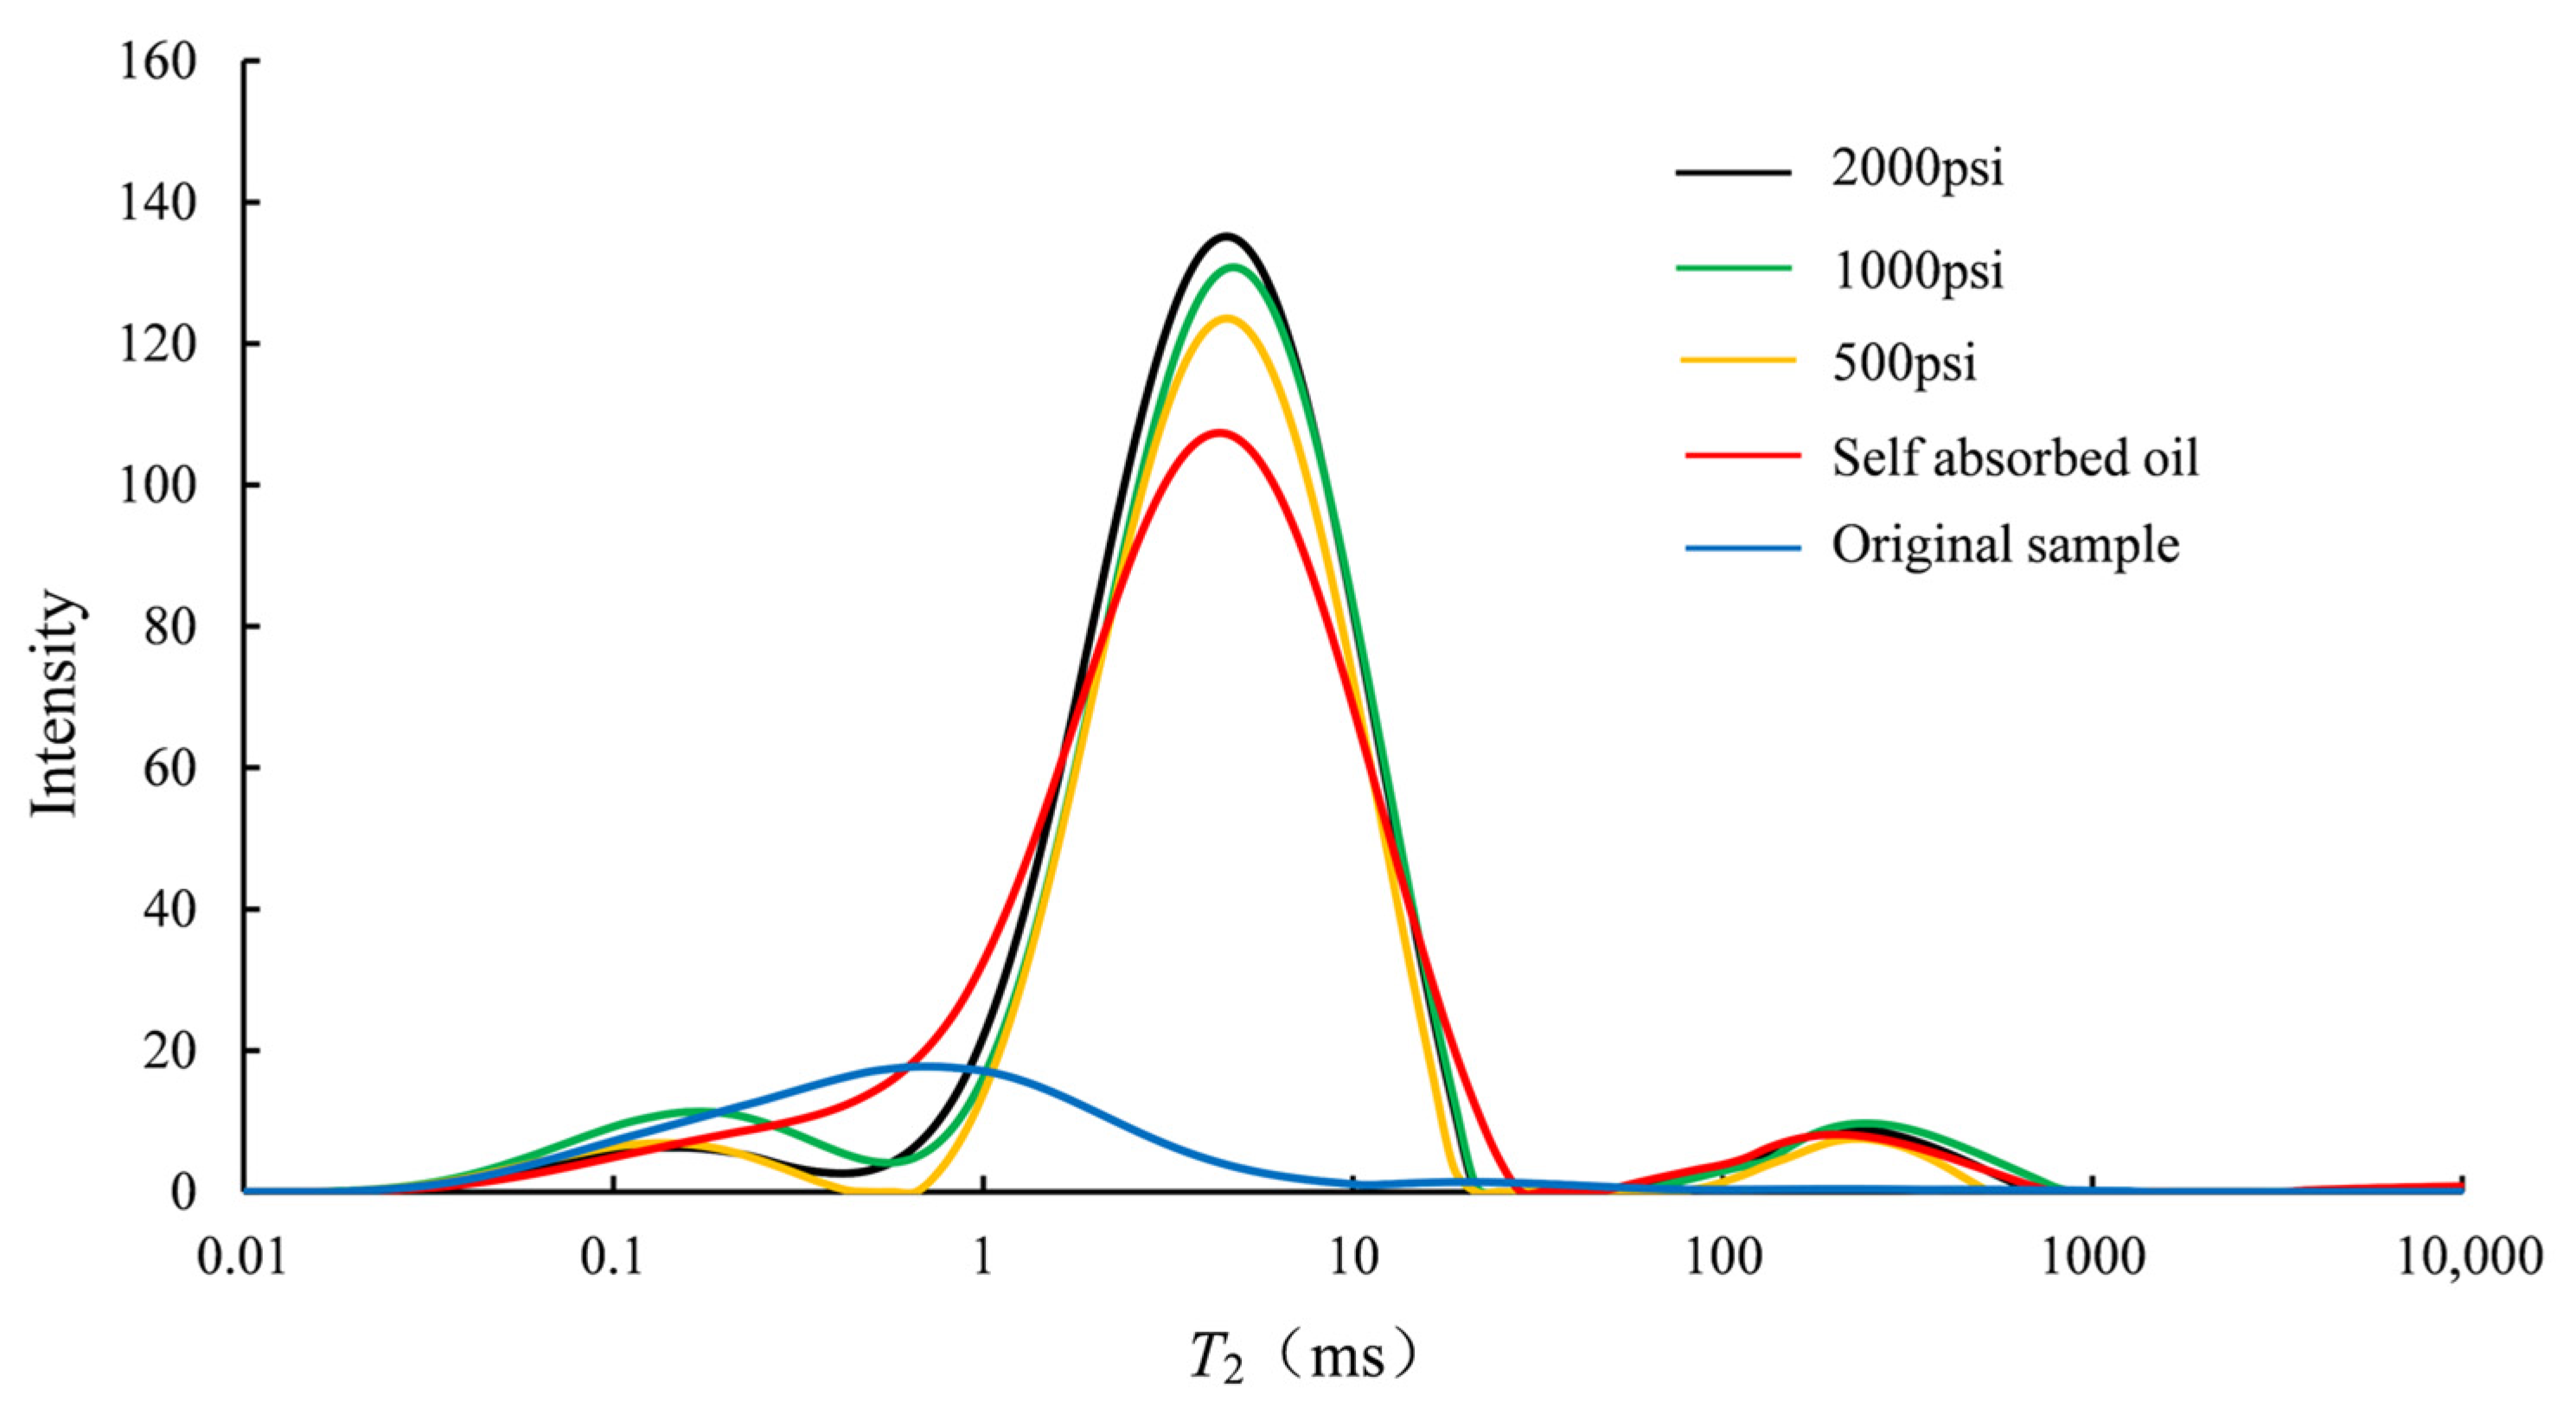
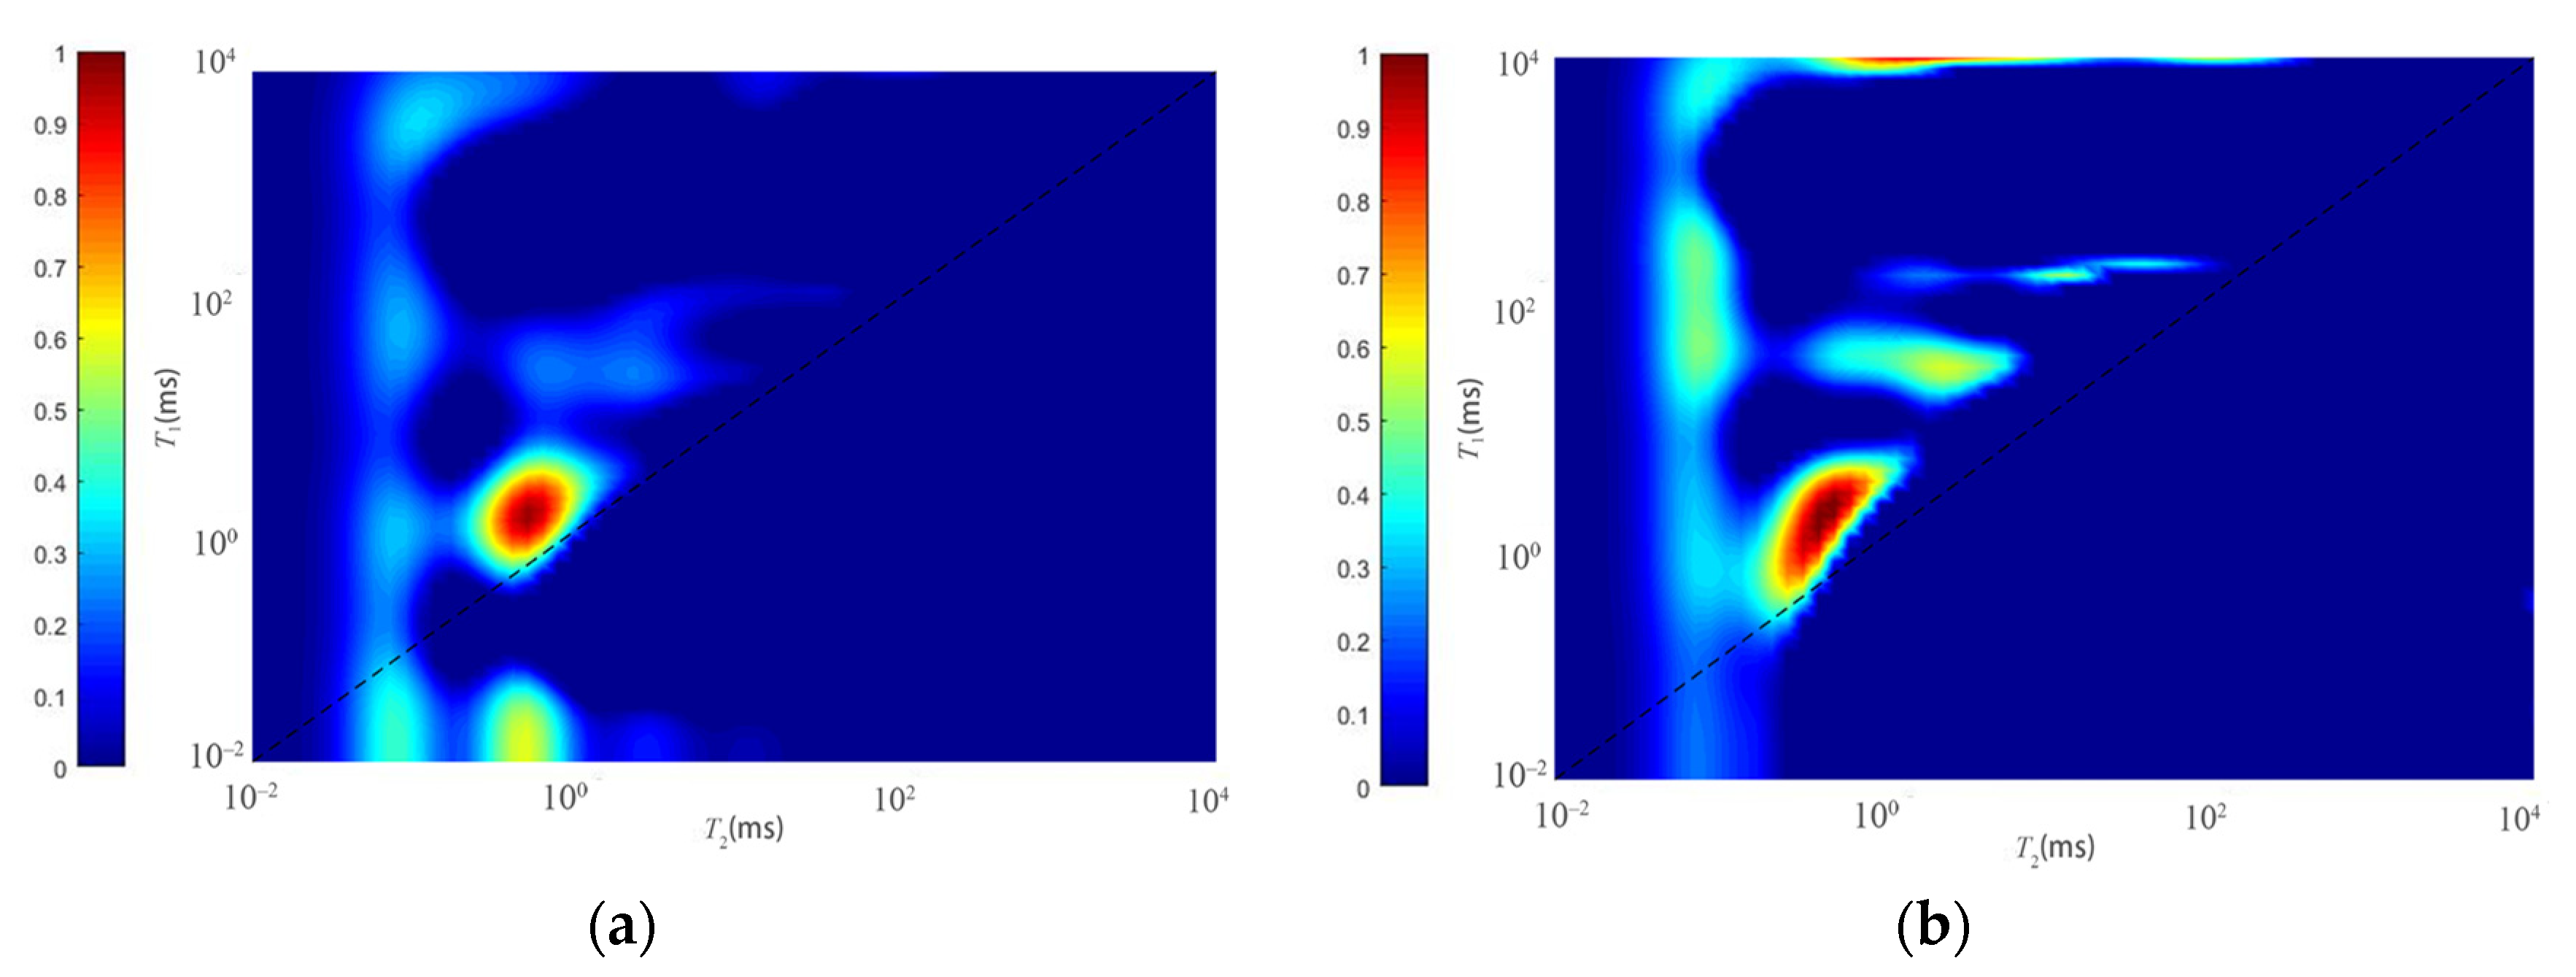
At the very beginning of the study, the inter-salt shale samples were dry rock samples, and most of the free moveable oil in the samples (i.e., part S1-1 in the pyrolysis analysis) had been lost. Hence, the distribution pattern of the free moveable oil could not be directly obtained from the sample’s original-state NMR measurements. By comparing the changes of 1D T2 spectrums (Figure 3) and 2D T1-T2 maps (Figure 4) of samples before saturation and after saturation under different pressures, the distribution pattern of free oil in the inter-salt shale could be acquired.
The experimental results showed that there was a bright area I (Figure 4a) in the original T1-T2 map of ZY1-1, which was the signal of remaining oil or water before our experiments. This area was temporarily treated as free residual oil (i.e., S1-1 in pyrolysis analysis) that originally existed within the pore space of the inter-salt shale. After self-absorption, the position of the highlighted area changed and moved to area II (Figure 4b), and the signal strength was significantly enhanced. The same kind of change occurred in the T2 spectrum as well, where the peak signal intensity of T2 was increased from 20 to 137, and the position was moved from 0.66 to 4.64 ms. The reason for this phenomenon is the imbibition of the saturating oil into the pore space. This area was temporarily treated as a free movable oil distribution area. By changing the saturation pressure, from self-absorption to 500 psi (Figure 4c), the position of the highlighted area in the 2D T1-T2 map was basically unchanged compared to the self-absorption state, but the signal strength was increased. As the saturation pressure continued to rise to 1000 psi (Figure 4d) and 2000 psi (Figure 4e), the position of the highlighted area II did not change anymore, but the signal strength was gradually increased with the pressure increase. Following the same trend, the position of the peaks on the T2 relaxation curve no longer changed with the pressure increase, but the intensity gradually increased. Through such a comprehensive analysis of six samples, this area was finally determined as the distribution area of the free movable oil. In addition, by analyzing the relationship between external pressure and measured NMR porosity, we obtained the following equation:
ϕ = 3.13 F 0.1114
where ϕ is the measured NMR porosity, %; and F is the external pressure, psi.

4.2. Distribution Pattern of Water in Inter-Salt Shale

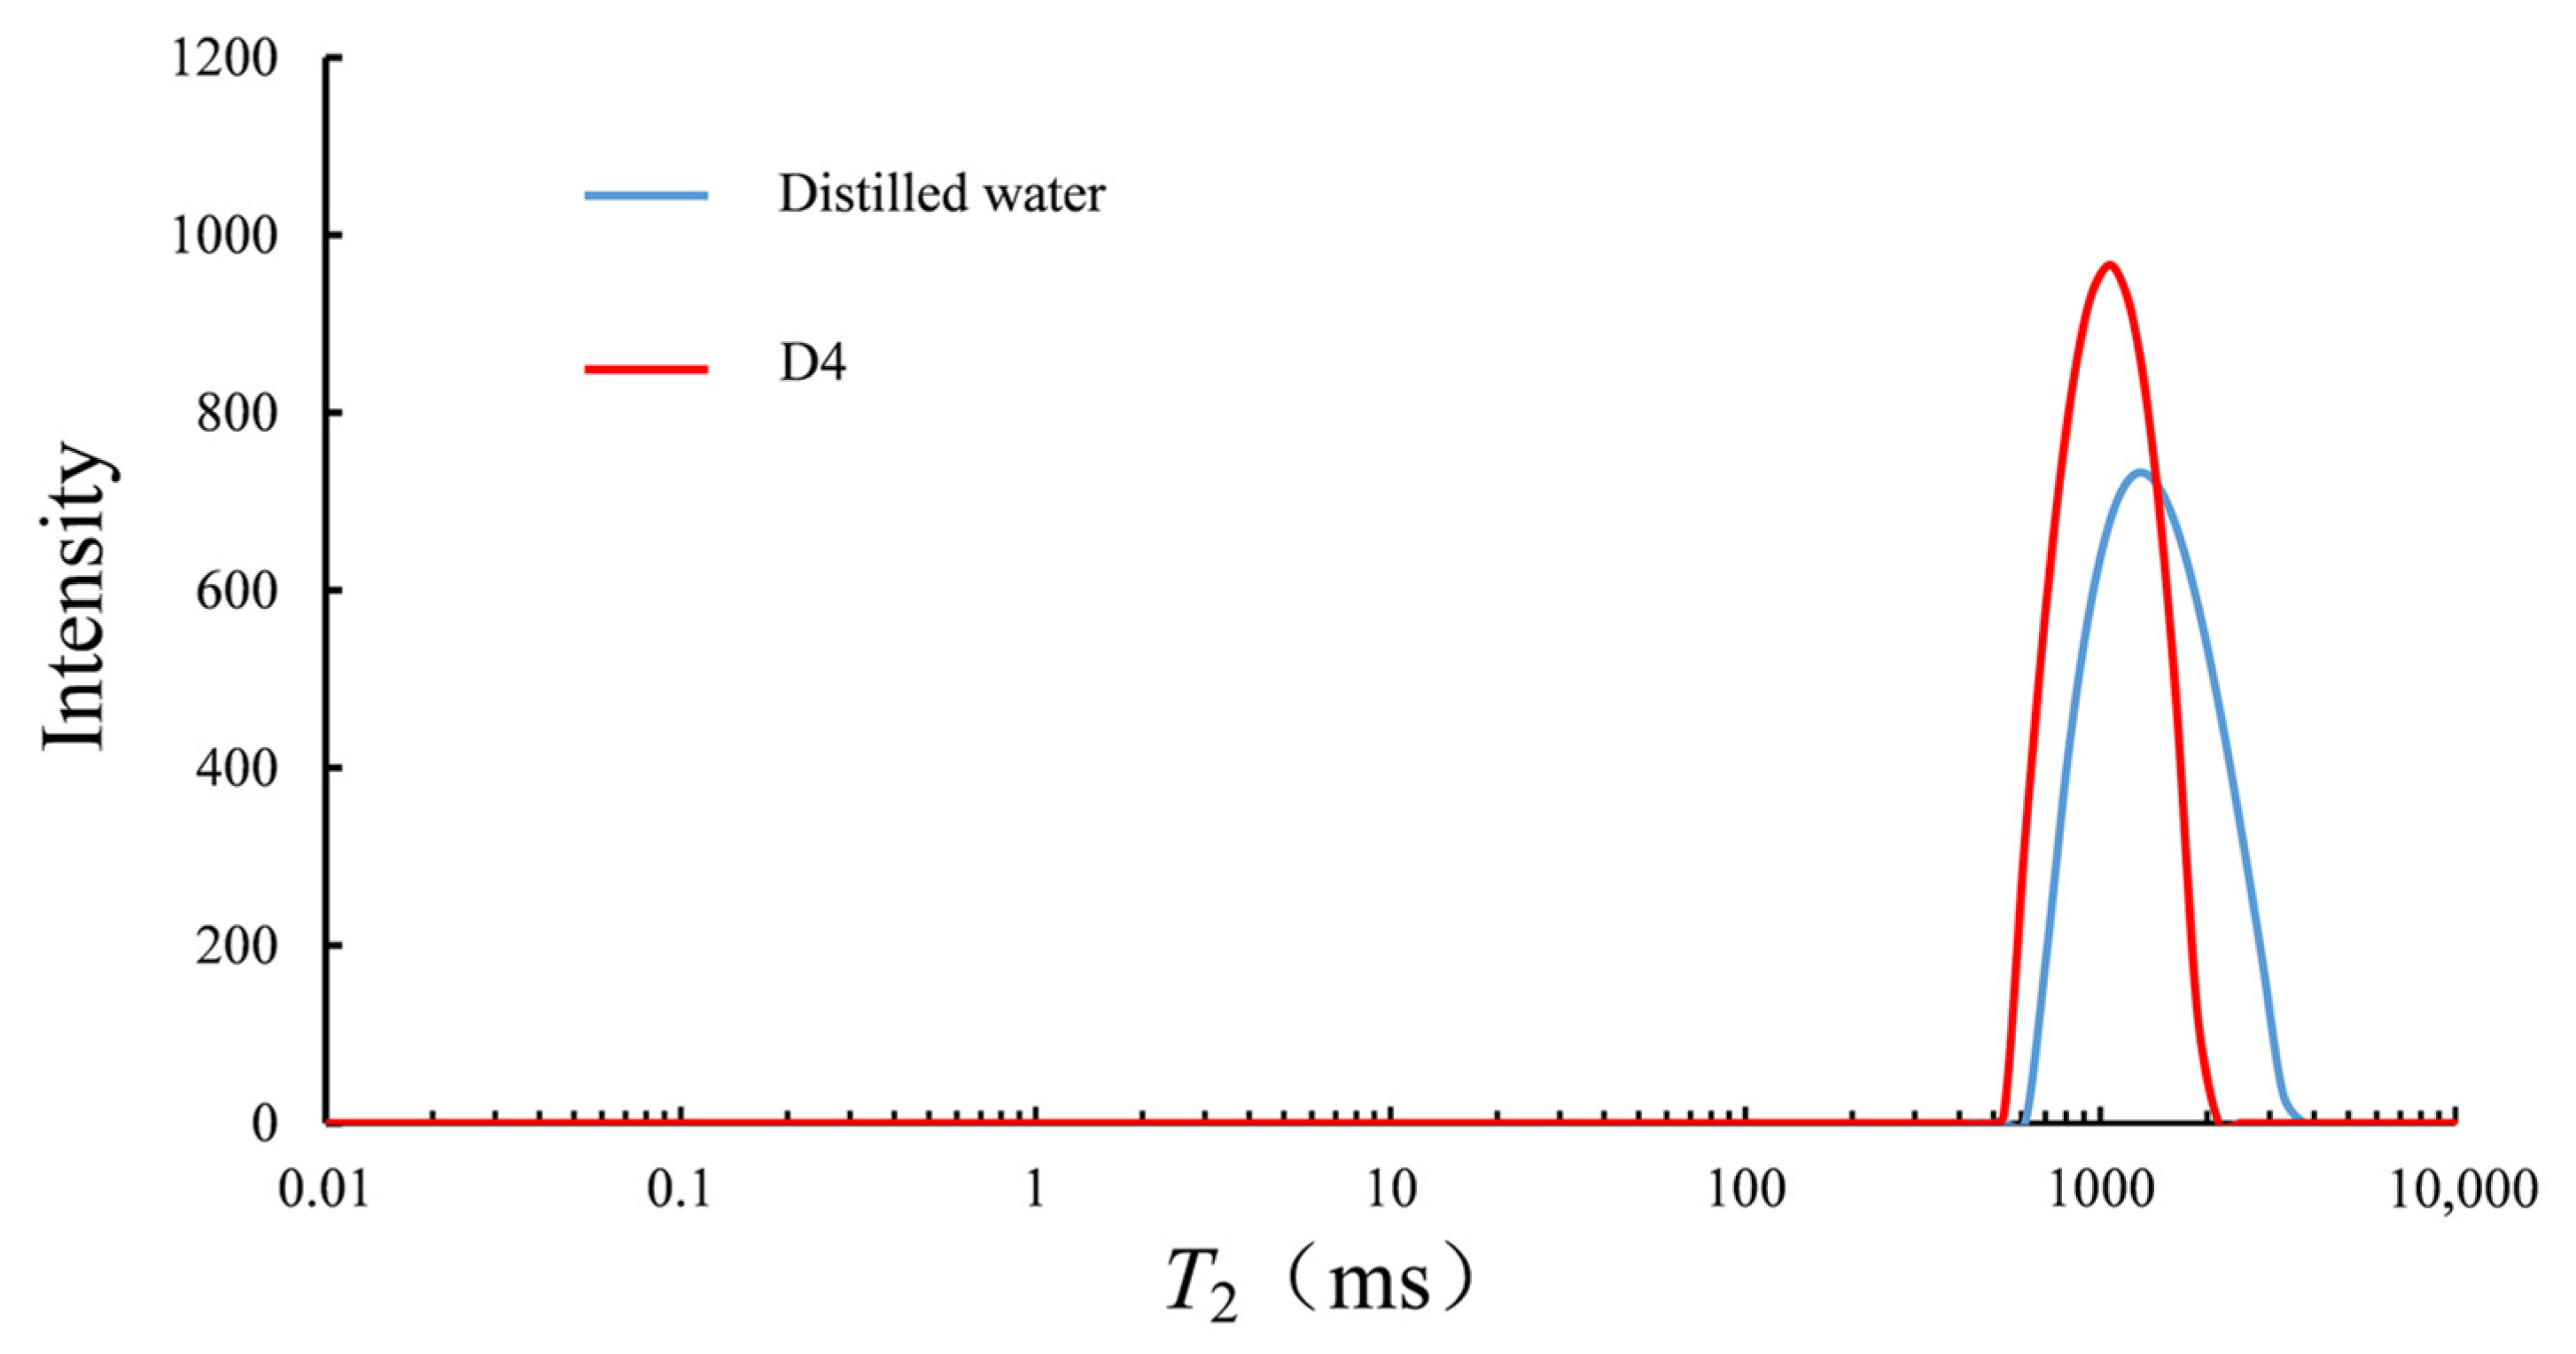
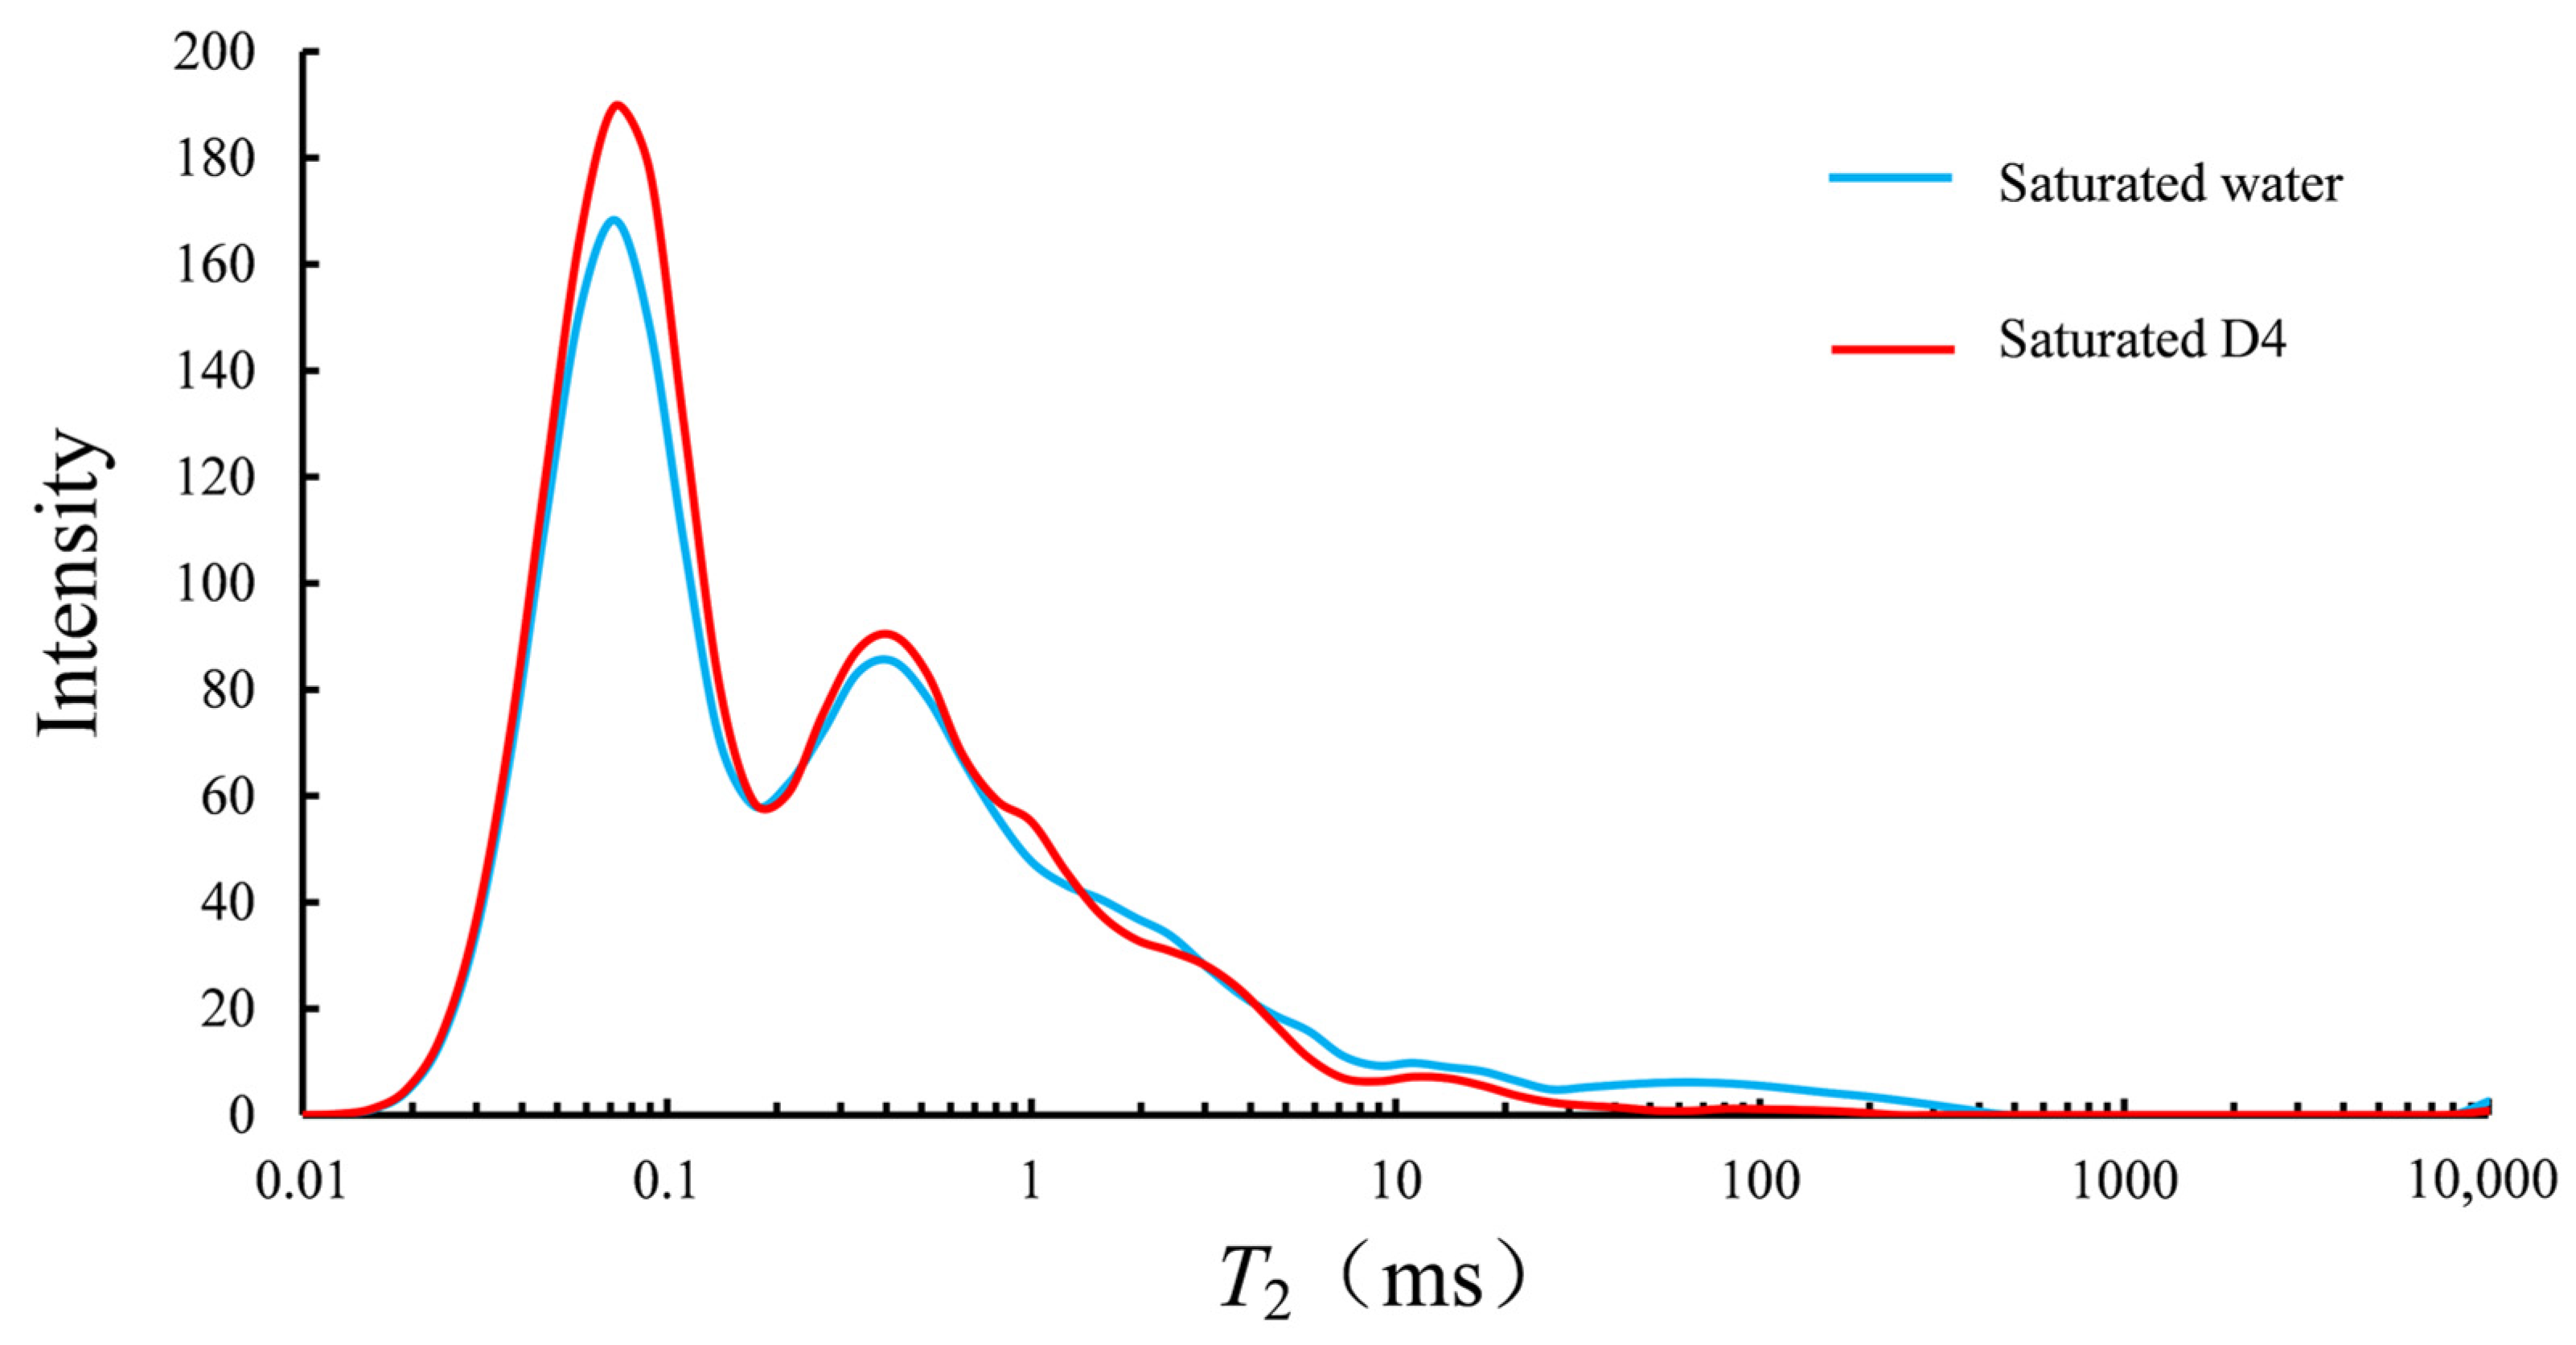
The inter-salt shale rock contains water-soluble salt minerals; therefore, it is impossible to study the distribution of water in the inter-salt shale by the method of water saturation. The existing literature has found the hydrophilic fluid octamethylcyclotetrasiloxane to resemble water [54]. In this research, in order to determine the similarity of the NMR response of octamethylcyclotetrasiloxane and water in shale pores, a shale sample was saturated with water and octamethylcyclotetrasiloxane separately, and the results were compared as shown in Figure 5 and Figure 6.
From Figure 5, it is found that when measuring the fluid properties alone, although D4 and water T2 peaks were slightly different (water T2 peak appeared at about 1600 ms, and D4 T2 peak occurred at about 1000 ms), their overall behaviors were similar. Moreover, the two fluids behave similarly on the 1D NMR of the shale sample (Figure 6). The similar behavior of the two samples in the 2D T1-T2 NMR test at different states (Figure 7) confirms the assumption that D4 could be used instead of water to saturate the inter-salt shale samples. The distribution range was T1: 0.5~4 ms, and T2: 0.2~1 ms. After this validation, D4 was chosen instead of water to simulate the distribution pattern of water in inter-salt shale by saturating the studied sample with D4.
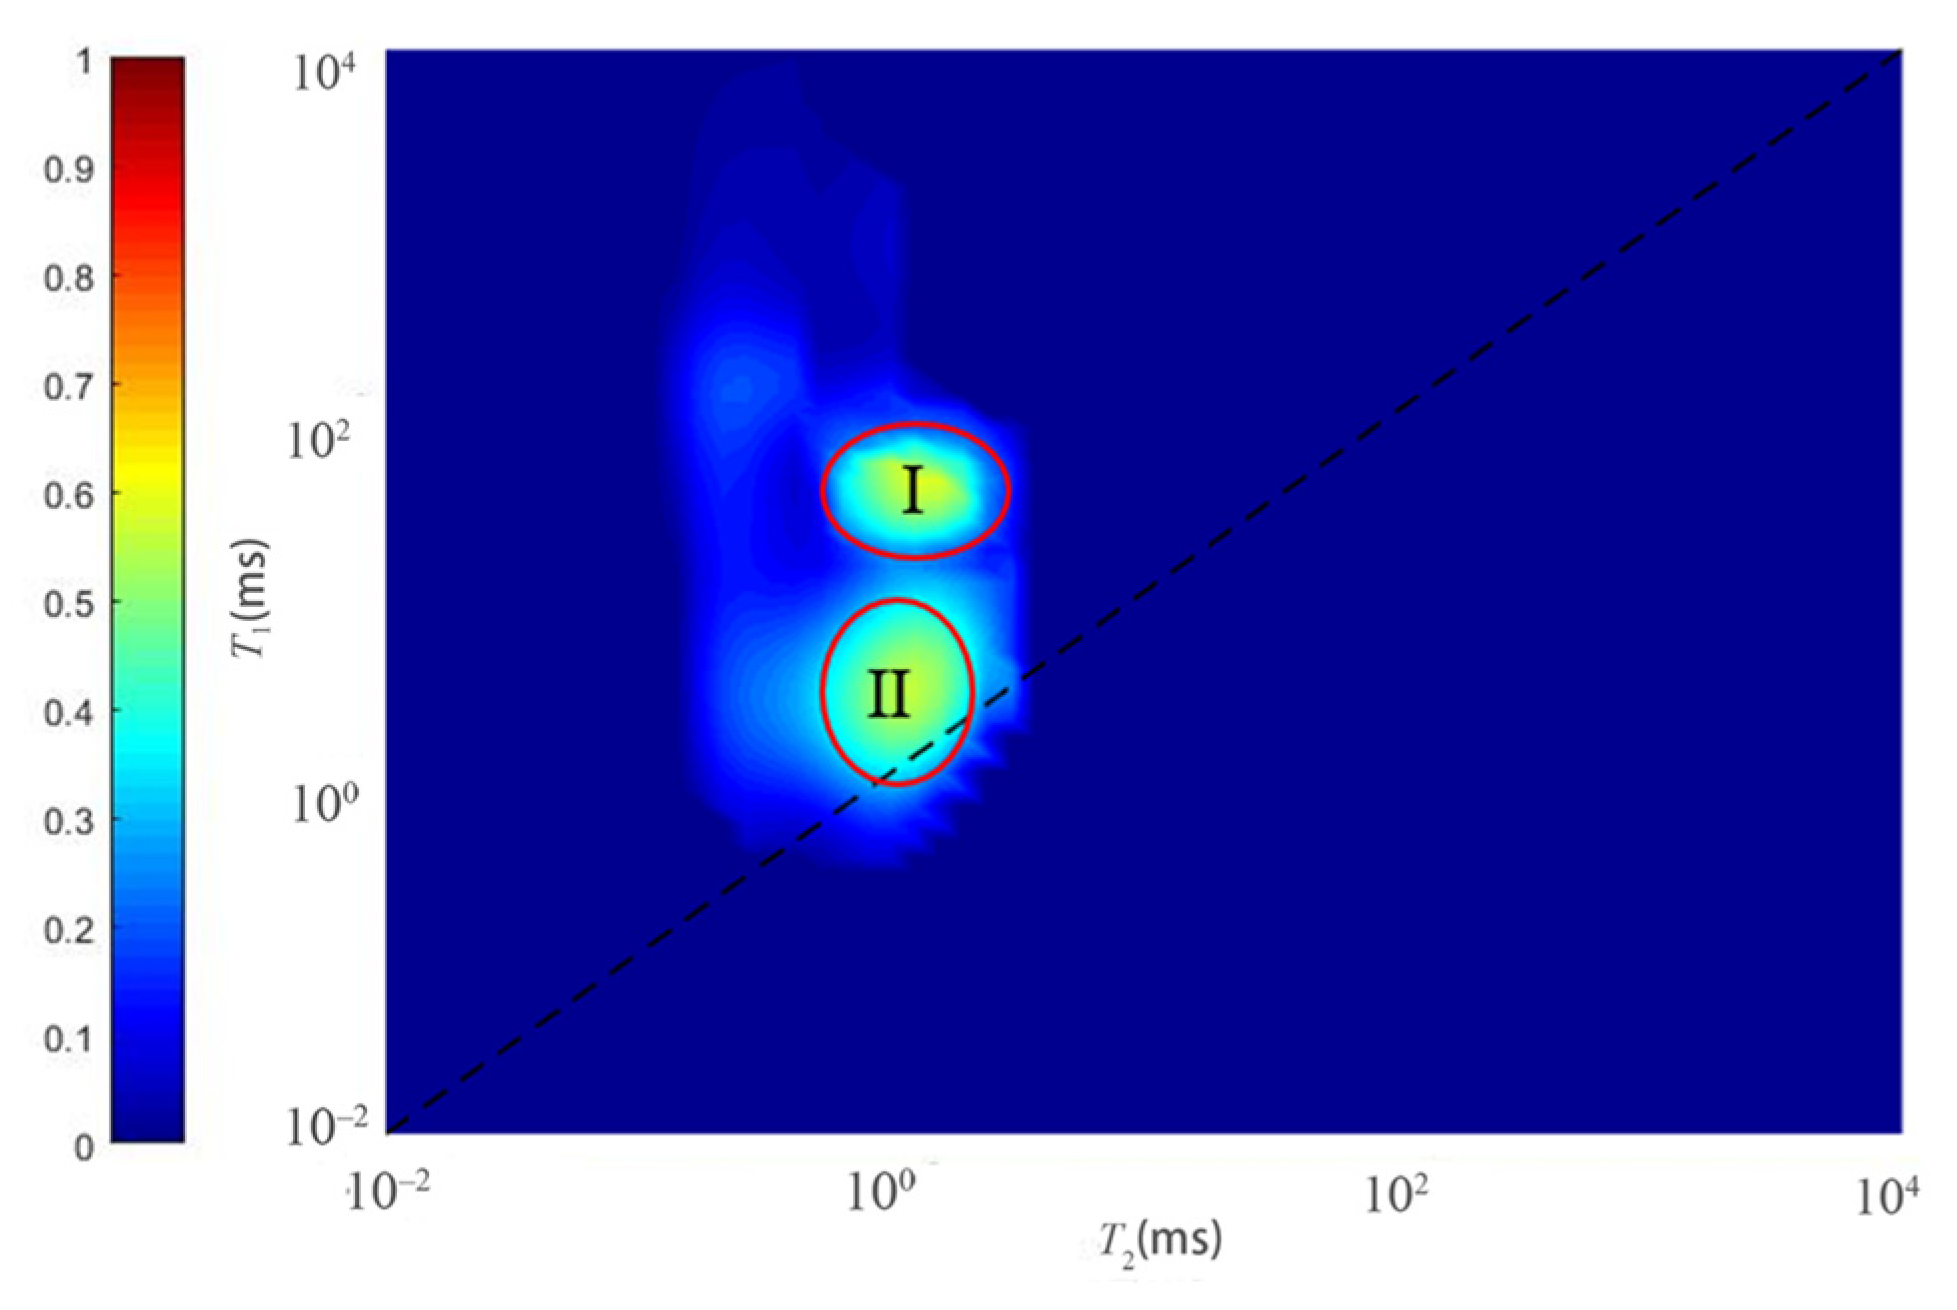
In this study, the 1D and 2D NMR spectra of six samples before and after saturation with D4 were analyzed. After saturation with D4, there were two obvious highlighted areas in the T1-T2 maps, namely areas I and II (Figure 8). Among them, the distribution of area I was the same as that in Figure 4a (T1: 4~30 ms; T2: 0.5~4 ms), which was the part remaining in the rock sample, and finally, the area was regarded as free residual oil. Region II was the NMR signal obtained after the shale was saturated with D4, so this region was regarded as the distribution range of water.

4.3. Distribution Pattern of Free Residual Oil and Other Components in Inter-Salt Shale

Considering that the permeability of the experimental shale sample was very low (only 0.01 mD), it was difficult to find the distribution pattern of free residual oil by oil–water displacement, and the existing free residual oil in the sample could be volatilized when heating the samples. High-temperature heating can also cause kerogen cracking, which can be identified on the NMR spectrum. Therefore, in this study, the novel approach of the joint multi-temperature heating–NMR test was designed. The experiment set five heating temperatures of 80, 200, 350, 450, and 600 °C. The T1-T2 maps are shown in Figure 9. Herein, through the changes of the 1D and 2D NMR results after heating at different temperatures, the distribution patterns of free residual oil and kerogen in the inter-salt shale were investigated.
Because the NMR signal was weak after the powder sample was heated, the 2D T1-T2 maps of the powder samples obtained after multi-temperature heating experiments were separately normalized. It can be seen from Figure 9 that there are three highlighted areas with obvious changes in the T1-T2 map of the powder sample. The signal in region I gradually decreases with increasing temperature. The rate of decrease was significantly faster after 450 °C, and the signal was weaker after 600 °C. The signal gradually decreases with increasing temperature in region II, and the signal disappears after 200 °C. The change of region III is similar to that of region II, and the difference is that the nuclear magnetic signal of region III disappears after 350 °C. The pyrolysis component at 200 °C was C16, which is mainly light hydrocarbons. Due to sample storage and sample preparation, some light hydrocarbons in the sample had been lost. It is estimated that region II was free of residual oil components (part S1-2 in pyrolysis analysis). The pyrolysis component of 200–350 °C was mainly C25, and the pyrolysis component of 350–450 °C had a relatively high content of high carbon number hydrocarbons, mainly colloidal asphaltenes and high molecular hydrocarbons. Region III is regarded as the distribution area of adsorbed oil (S2-1 in pyrolysis analysis). After 450 °C, the kerogen began to thermally degrade hydrocarbon generation, which caused the signal intensity of area I to decrease significantly. Finally, region I was regarded as the kerogen distribution range (S2-2 in pyrolysis analysis). In addition, by analyzing the relationship between heating temperature and measured NMR porosity, we obtained the following equation:
ϕ = 27.02 T - 0.481
where ϕ is the measured NMR porosity, %; and T is the heating temperature, °C. The existing research studies have divided oil components in shale into oil in inorganic pores and oil in organic pores through similar experiments [55]. Compared to the results of previous studies, this paper subdivided the distribution of oil into organic pores and inorganic pores and subdivided oil components into free movable oil, free residual oil, and adsorbed oil.
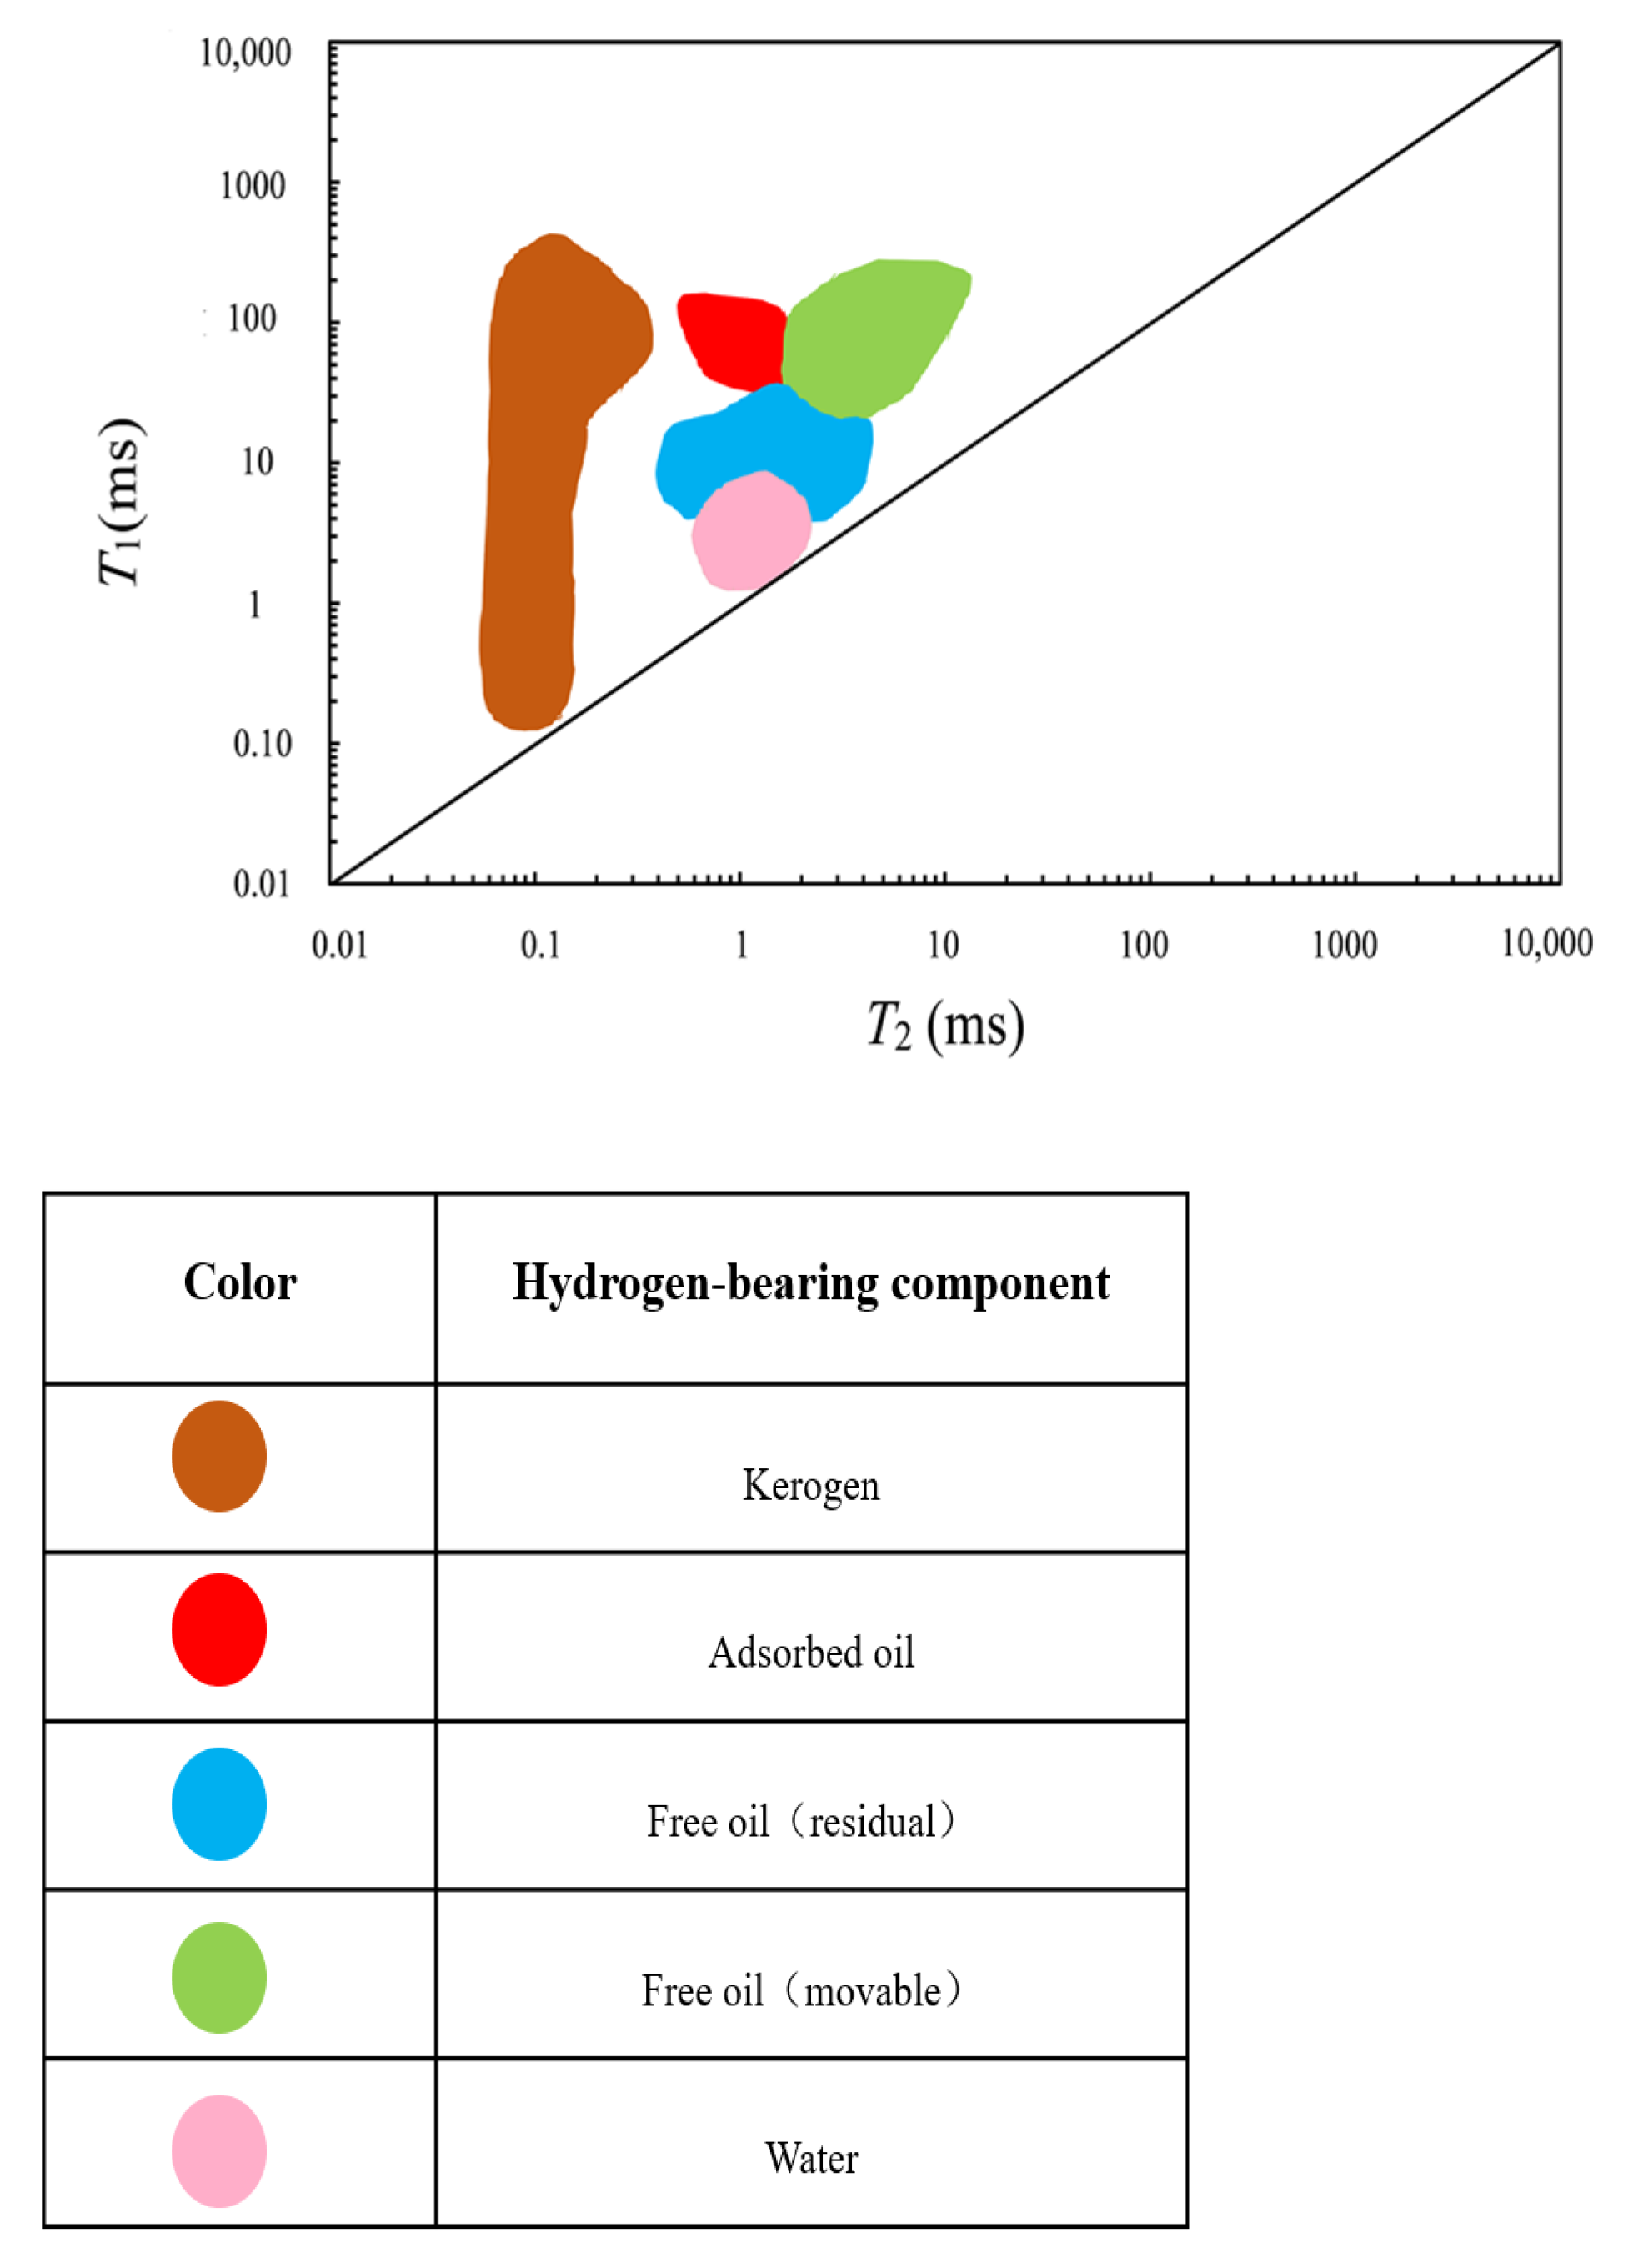
Through the comprehensive analysis of the 1D and 2D NMR results after the six cylindrical multi-state saturation and 20 pieces of multi-temperature heating experiments, it is obvious that different components occupy different distribution areas on the 2D T1-T2 map. Although the positions of the fluid components in the T1-T2 maps of different inter-salt shale are not completely consistent, the general trend is similar. Based on the NMR responses of different components, the region where each component in the 2D T1-T2 map is extracted to form a recognition graph. As shown in Figure 10, the shape boundary of each hydrogen-bearing component was calculated from the average value of multiple sets of shales.
The graph includes the distribution of free movable oil, free residual oil, adsorbed oil, water, and kerogen. The distribution range of each component is shown in Table 1.

5. Calculating the Fluid Saturation of Inter-Salt Shale

In order to assess the production capability of inter-salt shale reservoirs, calculating the saturation of each fluid in the reservoir has become one of the most significant aspects of the reservoir engineering tasks. It is a challenging task to separate the signal of each fluid through just one measured NMR result. The fluid typing analysis makes the fluid NMR signal’s identification and fluid saturation calculation easier. There is no doubt that a shale sample at a specific saturation state has its unique NMR characteristics. Free movable oil saturation, free residual oil saturation, and adsorbed oil saturation can be calculated based on NMR responses of a shale sample at four states, including original state, oil injection under 2000 psi external pressure state, heating at 350 °C, and heating at 450 °C. Therefore, this study carried out fluid typing analysis for the studied shale samples based on the conducted experiments as follows:
(1)
The amount of oil that enters the pore space of the cylindrical sample under 2000 psi saturation compared to the original state is the moveable part of the free oil, simply referred to as free movable oil.
(2)
The amount of oil in the powder sample heated at 350 °C compared to the original state is free residual oil.
(3)
The amount of oil in the powder sample between 450 °C and 350 °C heating is adsorption oil.
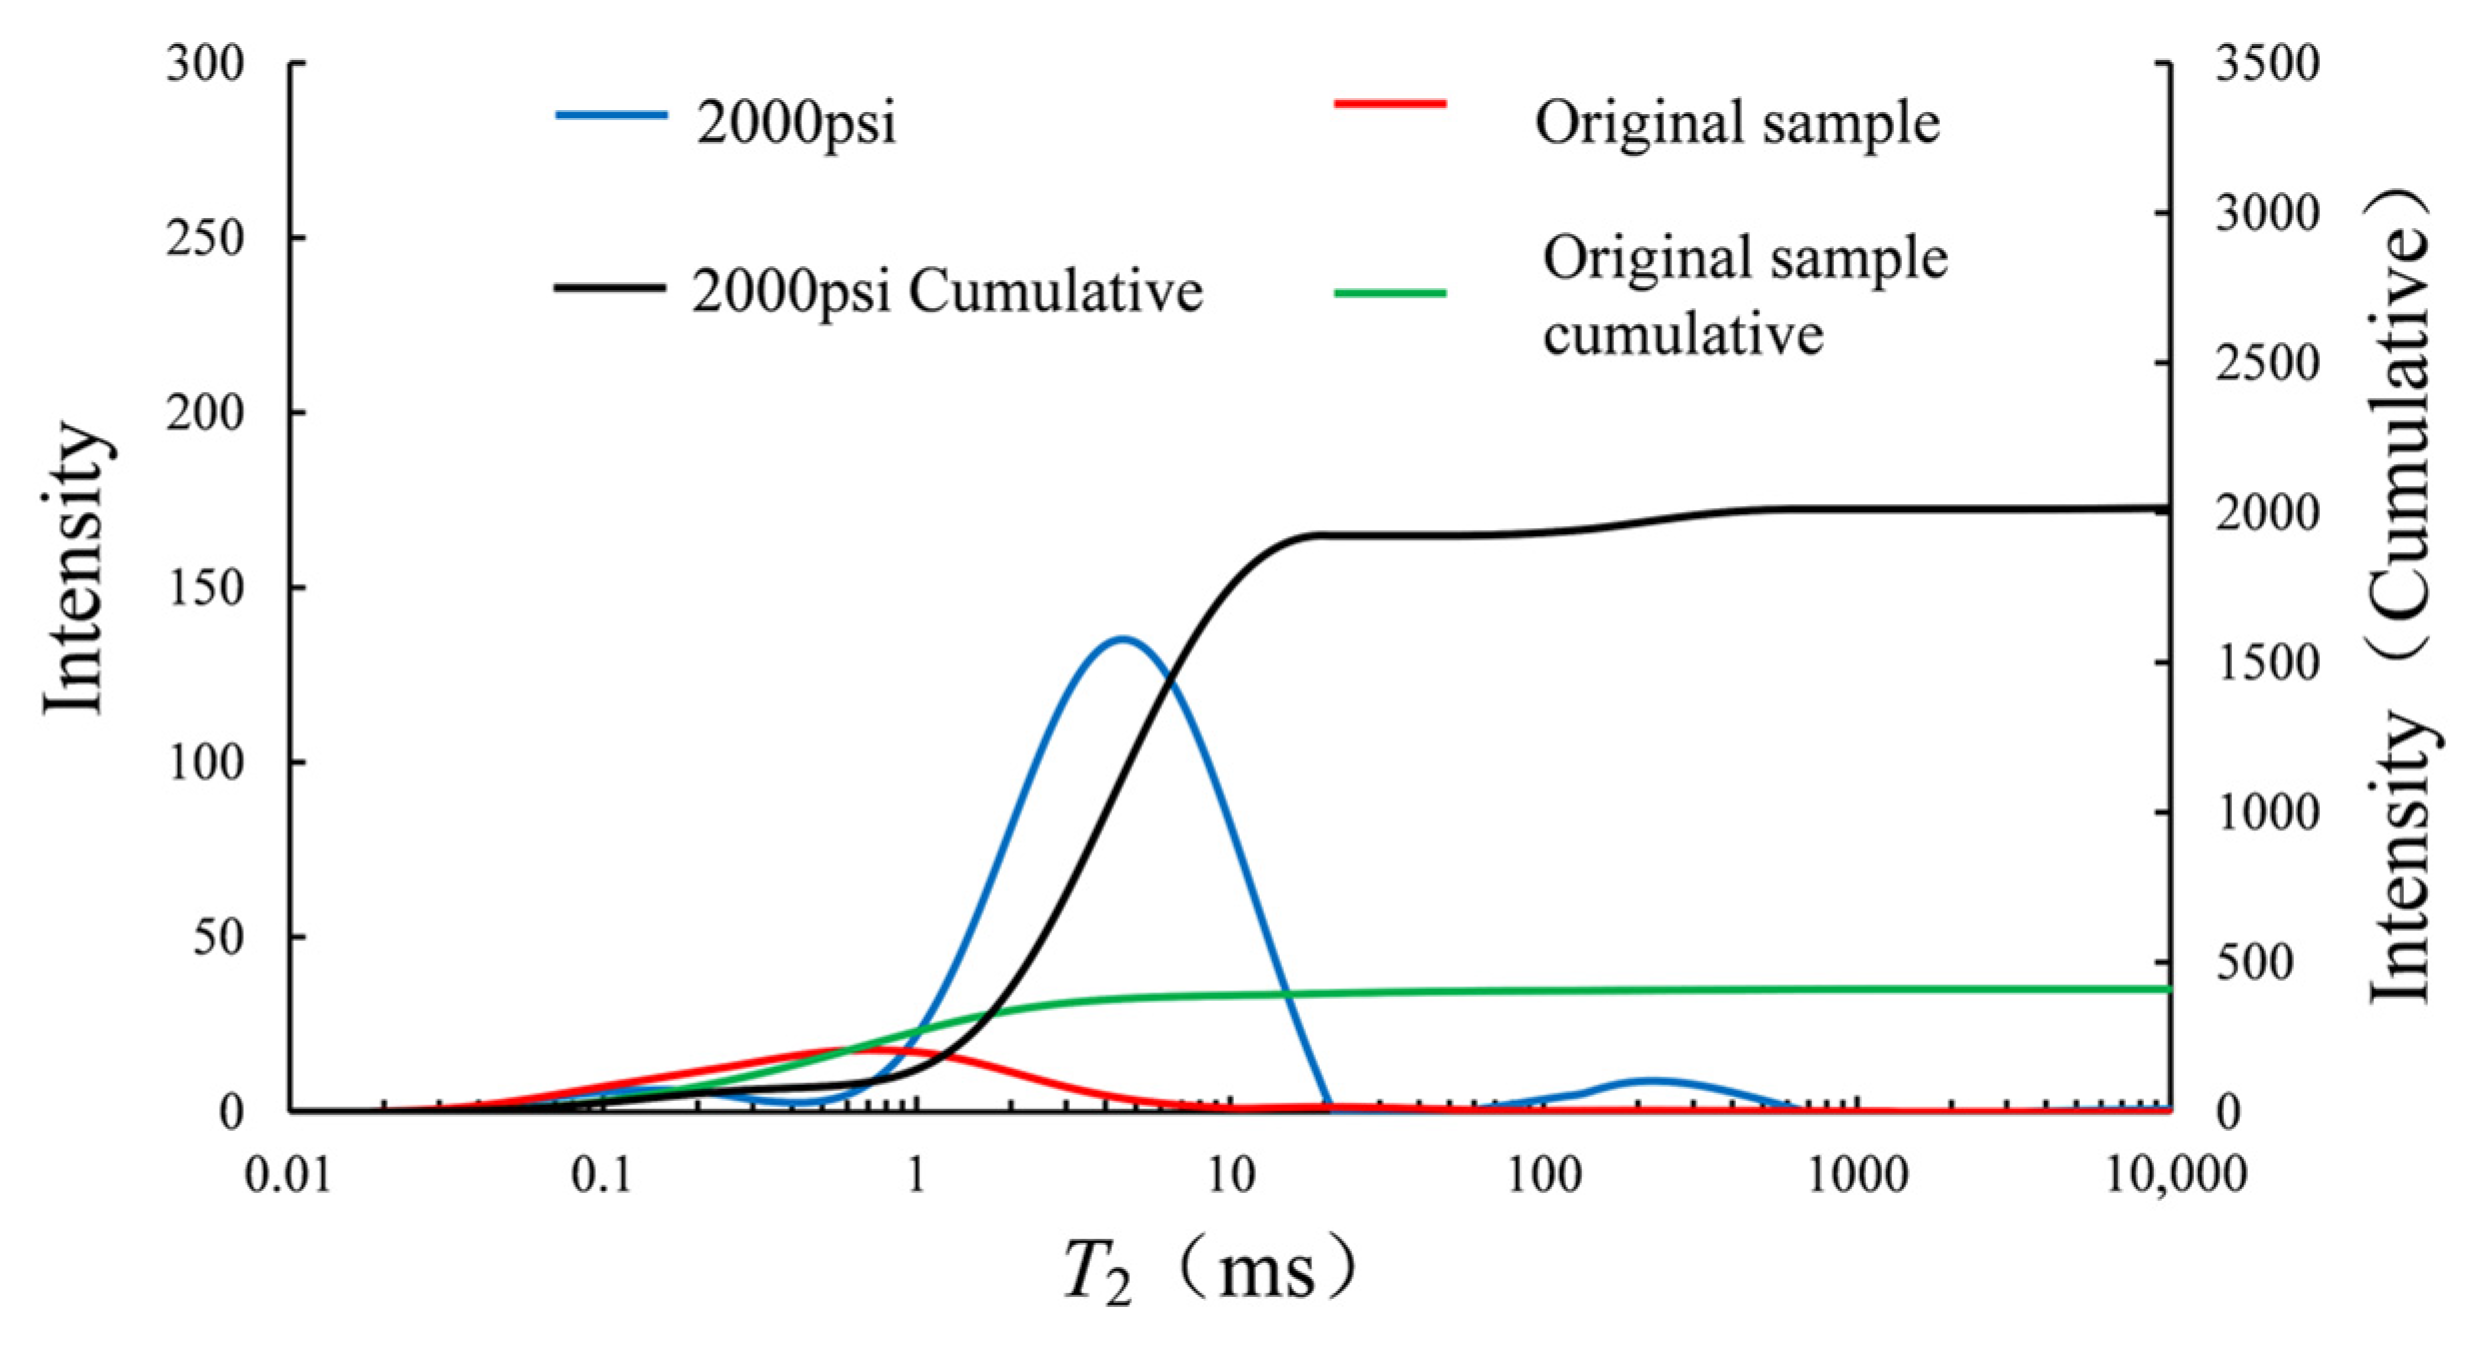
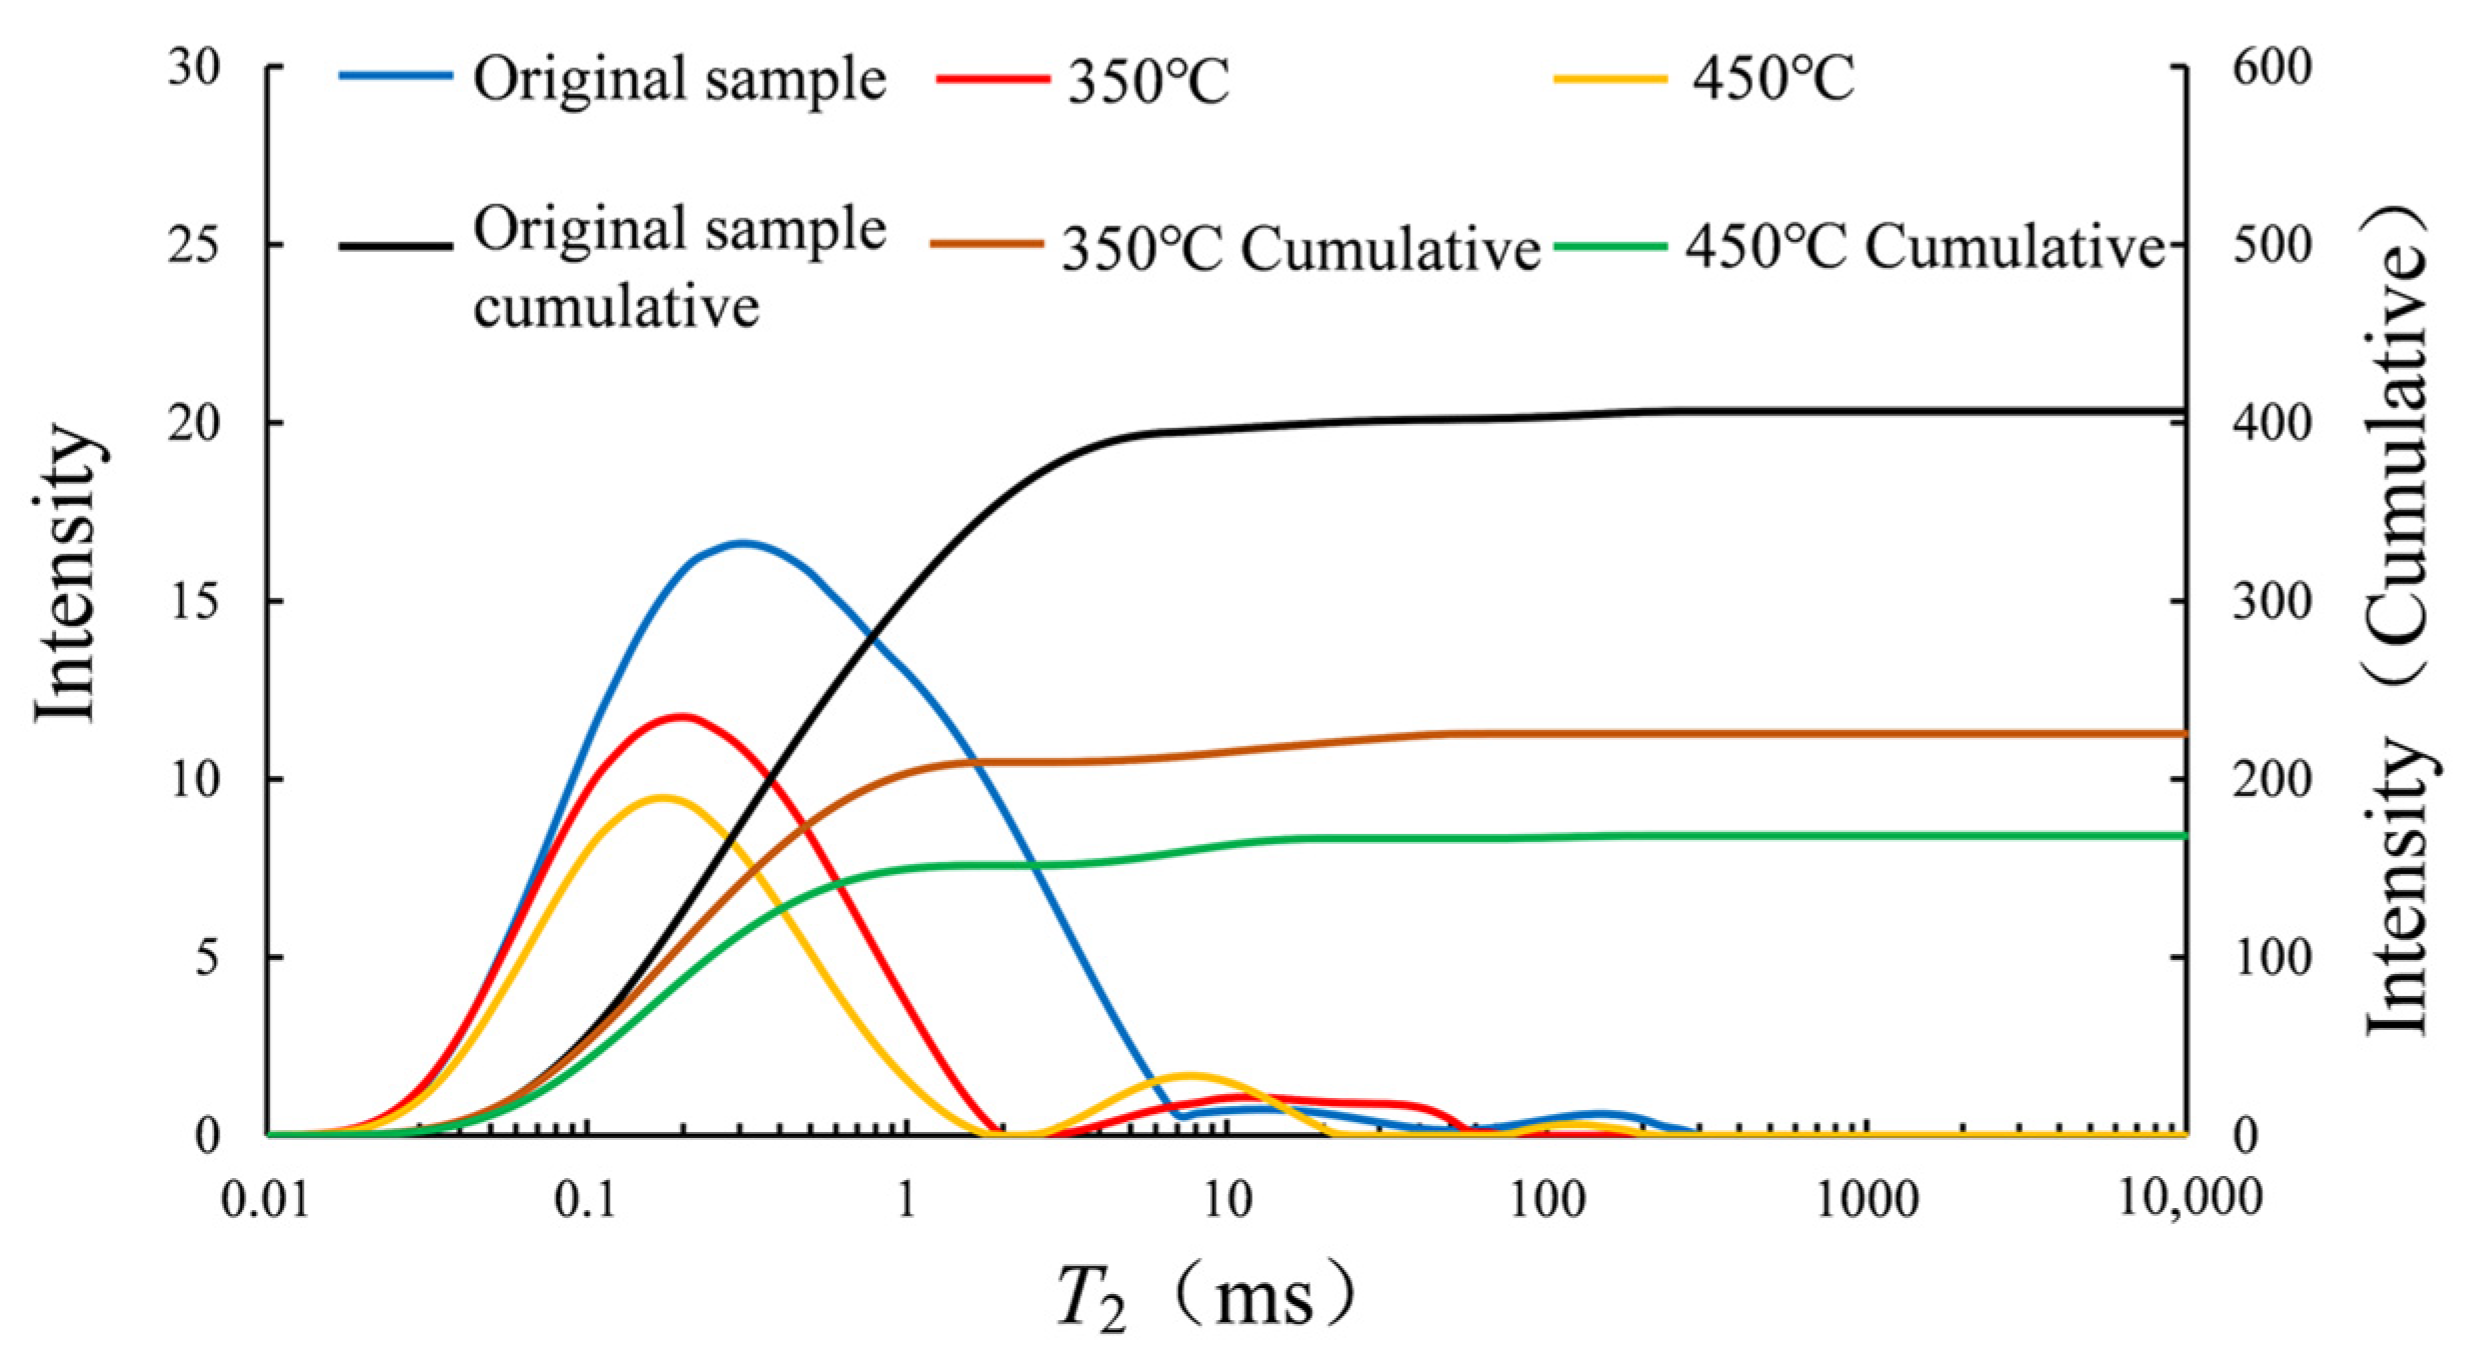
To obtain the saturation of different fluids in the studied inter-salt shale, it was necessary to saturate cylindrical samples under 2000 psi (Figure 11), and at the same time use the particularly designed stepwise multi-temperature anaerobic heating equipment to heat the powder samples. The powder sample was heated at 350 and 450 °C, and the 1D T2 spectrum was measured in different states (Figure 12). Once this step was completed, normalization analysis was carried out, and through the difference of the T2 spectral area, different fluid saturations were calculated.
Because the experimental sample was shale, the kerogen signal could be counted as the pore signal, so in the subsequent calculation of the saturation of various fluid components, the kerogen signal (i.e., after heating at 450 °C) was removed as the background signal.
Through the NMR experiment on a cylindrical sample in the original state and after the 2000 psi saturated sample, two relaxation curves were obtained where the T2 amplitude changed with the relaxation time. Then, these two T2 spectra were converted into the cumulative T2 spectra with cumulative relaxation amplitude (Figure 11). According to the principle of NMR, the T2 spectrum is proportional to the total hydrogen nuclei in the rock sample, which is dimensionless. Therefore, the signal amount between the accumulated maximum value of the 2000 psi oil-saturated and the accumulated maximum value of the heated sample at 450 °C was taken as the total signal amount, and the difference between the maximum value of the cumulative T2 spectrum after 2000 psi oil-saturation and the maximum value of the original cumulative T2 spectrum was taken as the signal amount of free movable oil. The difference was divided by the total signal amount, and finally, the free movable oil saturation was calculated to be 86.93%. Similarly, the T2 spectrums of the powder sample, heated at 350 and 450 °C, and the cylindrical sample were normalized, and the T2 spectrum obtained after the processing was accumulated (Figure 12) to obtain the cumulative T2 spectrum of the three samples. Our research used the same calculation method as in the classification standards of fluid components to calculate the saturation of free residual oil and adsorbed oil. The obtained results were, respectively, 9.91% and 3.10%.
Averaging the saturation of the different fluid components calculated from the six cylindrical samples and their powder samples serves as a reference basis for the calculation of reserve in the study area, as represented in Table 2. In these six samples, there were significant variations of saturation of different fluid components. It was mainly caused by the heterogeneous pore structures and various mineral components of shales. The six shale samples were collected from different depths; therefore, their pore structures, wettabilities, pore connectivities, and mineral components could not be the same, which leads to various fluid saturations. This phenomenon has been reported in different types of reservoirs [56,57]. The calculated free movable oil saturations of six samples in our study were all above 70%. Based on the field freezing and pyrolysis oil bearing evaluation techniques, the previous study from the Jianghan Oilfield Company has proved that the free movable oil saturation of the inter-salt shale oil in Qianjiang Sag is more than 70% [58], which is in good agreement with the results of our research.

6. Conclusions

The current study made full use of the 1D and 2D NMR techniques to characterize the inter-salt shale oil reservoir. By comparing and analyzing the NMR results of different samples in multiple states, this paper obtained the identification graphs for different components of inter-salt shale reservoirs. In addition, through the study and calculation of 1D T2 spectrums, the saturation of different fluids was obtained. The main conclusions and understanding drawn from the present study are as follows:
(1)
When it is not feasible to study the NMR signal of the water within the pore space of the sample through direct water saturation because of the mineralogical nature of the sample, the relevant experiment can be carried out using D4, which behaves similar to water under the NMR test and has obtained a similar signal.
(2)
Through the measurement of the 2D T1-T2 maps of the cylindrical and powder samples in 11 different states, the similarities were summarized, and the fluid component identification graph of inter-salt shale was obtained. It was found that the T2 value of the free movable oil was mainly between 1.7 and 13 ms, and the T1 value was mainly between 20 and 290 ms.
(3)
In the present research, the particularly designed stepwise multi-temperature anaerobic heating equipment and NMR machine were used together to calculate the saturation of free movable oil by the T2 spectrum accumulation method, which could be used as an important basis for the development of shale oil.
Finally, the researchers believe that the finding of the present study would contribute to improved production of shale oil reservoirs and would increase our understanding of the fluid distribution and flow behavior of these reservoirs. It should be noted that even though the 2D NMR T1-T2 map has unparalleled advantages in the study of fluid distribution, it has shortcomings in the quantitative calculation of fluids. Despite the wide usage of NMR techniques in exploration wells, few oil fields use the T1-T2 NMR logging tool because of the high engineering cost. Therefore, when calculating the saturation of movable oil, the 1D NMR T2 spectrum is more favorable. This limitation needs to be addressed properly in future works. Meanwhile, the deeper application of the T2-D method for characterizing various properties of the shale reservoirs is yet to be investigated in detail.

Author Contributions

Conceptualization, W.Y. and F.S.; Data curation, W.Y.; Formal analysis, W.Y. and F.S.; Funding acquisition, W.Y. and J.S.; Investigation, W.Y. and F.S.; Methodology, F.S.; Project administration, N.G. and J.S.; Resources, J.S.; Supervision, N.G. and J.S.; Validation, N.G.; Writing—original draft, W.Y. and F.S.; Writing—review and editing, N.G. and J.S. All authors have read and agreed to the published version of the manuscript.

Funding

This research was funded by the National Natural Science Foundation of China (No. 42004098), China Postdoctoral Science Foundation (No. 2019M662463), Natural Science Foundation of Shandong Province (No. ZR2020QD054), and Fundamental Research Funds for the Central Universities (No. 20CX06026A).

Institutional Review Board Statement

Not applicable.

Informed Consent Statement

Not Applicable.

Data Availability Statement

The data presented in this study are available on request from the corresponding author.

Conflicts of Interest

The authors declare no conflict of interest.

References

  1. Dong, H.; Sun, J.; Arif, M.; Golsanami, N.; Yan, W.; Zhang, Y. A Novel Hybrid Method for Gas Hydrate Filling Modes Identification Via Digital Rock. Mar. Petrol. Geol. 2020, 115, 104255. [Google Scholar] [CrossRef]
  2. Qiang, Z.; Yasin, Q.; Golsanami, N.; Du, Q. Prediction of reservoir quality from log-core and seismic inversion analysis with an artificial neural network: A case study from the Sawan gas field, Pakistan. Energies 2020, 13, 486. [Google Scholar] [CrossRef] [Green Version]
  3. Bakhshi, E.; Golsanami, N.; Chen, L. Numerical Modeling and Lattice Method for Characterizing Hydraulic Fracture Propagation: A Review of the Numerical, Experimental, and Field Studies. Arch. Comput. Method. E. 2020, 1–32. [Google Scholar] [CrossRef]
  4. Yasin, Q.; Du, Q.; Ismail, A. A new integrated workflow for improving permeability estimation in a highly heterogeneous reservoir of Sawan Gas Field from well logs data. Geomech. Geophys. Geo-Energy Geo-Resour. 2019, 5, 121–142. [Google Scholar] [CrossRef]
  5. Feng, Q.; Xu, S.; Xing, X.; Zhang, W.; Sen, W. Advances and challenges in shale oil development: A critical review. Adv. Geo-Energy Res. 2020, 4, 406–418. [Google Scholar] [CrossRef]
  6. Li, X.; Yin, H.Y.; Zhang, R.S.; Cui, J.; Wu, J.; Feng, Y.J. A salt-induced viscosifying smart polymer for fracturing inter-salt shale oil reservoirs. Petro. Sci. 2019, 16, 816–829. [Google Scholar] [CrossRef] [Green Version]
  7. Yang, Z.; Li, R.; Li, H.; Luo, Y.; Chen, T.; Gao, T.; Zhang, Y. Experimental evaluation of the salt dissolution in inter-salt shale oil reservoirs. Petro. Explor. Dev. 2020, 47, 803–809. [Google Scholar] [CrossRef]
  8. Fan, X.; Su, J.Z.; Chang, X.; Huang, Z.W.; Zhou, T.; Guo, Y.T.; Wu, S.Q. Brittleness evaluation of the inter-salt shale oil reservoir in Jianghan Basin in China. Mar. Petrol. Geol. 2019, 102, 109–115. [Google Scholar] [CrossRef]
  9. Almutairi, Z.; Al-Alweet, F.M.; Alghamdi, Y.A.; Almisned, O.A.; Alothman, O.Y. Investigating the characteristics of two-phase flow using electrical capacitance tomography (ECT) for three pipe orientations. Processes 2020, 8, 51. [Google Scholar] [CrossRef] [Green Version]
  10. Xu, Z.; Wu, F.; Yang, X.; Li, Y. Measurement of gas-oil two-phase flow patterns by using CNN algorithm based on dual ECT sensors with venturi tube. Sensors 2020, 20, 1200. [Google Scholar] [CrossRef] [PubMed] [Green Version]
  11. Roshani, M.; Phan, G.T.; Ali, P.J.M.; Roshani, G.H.; Hanus, R.; Duong, T.; Corniani, E.; Nazemi, E.; Kalmoun, E.M. Evaluation of flow pattern recognition and void fraction measurement in two phase flow independent of oil pipeline’s scale layer thickness. Alex. Eng. J. 2021, 60, 1955–1966. [Google Scholar] [CrossRef]
  12. Roshani, M.; Phan, G.; Roshani, G.H.; Hanus, R.; Nazemi, B.; Corniani, E.L.; Nazemi, E. Combination of X-ray tube and GMDH neural network as a nondestructive and potential technique for measuring characteristics of gas-oil–water three phase flows. Measurement 2021, 168, 108427. [Google Scholar] [CrossRef]
  13. Zhang, Y.; Azman, A.N.; Xu, K.W.; Kang, C.; Kim, H.B. Two-phase flow regime identification based on the liquid-phase velocity information and machine learning. Exp. Fluids 2020, 61, 1–16. [Google Scholar] [CrossRef]
  14. Michal, C.A. Low-cost low-field NMR and MRI: Instrumentation and applications. J. Magn. Reson. 2020, 319, 106800. [Google Scholar] [CrossRef]
  15. Golsanami, N.; Sun, J.; Zhang, Z. A review on the applications of the nuclear magnetic resonance (NMR) technology for investigating fractures. J. Appl. Geophys. 2016, 133, 30–38. [Google Scholar] [CrossRef]
  16. Song, Y.Q.; Kausik, R. NMR application in unconventional shale reservoirs-A new porous media research frontier. Prog. Nucl. Mag. Res. Sp. 2019, 112, 17–33. [Google Scholar] [CrossRef]
  17. Liu, Z.; Liu, D.; Cai, Y.; Yao, Y.; Pan, Z.; Zhou, Y. Application of nuclear magnetic resonance (NMR) in coalbed methane and shale reservoirs: A review. Int. J. Coal Geol. 2020, 218, 103261. [Google Scholar] [CrossRef]
  18. Golsanami, N.; Sun, J.; Liu, Y.; Yan, W.; Lianjun, C.; Jiang, L.; Dong, H.; Zong, C.; Wang, H. Distinguishing fractures from matrix pores based on the practical application of rock physics inversion and NMR data: A case study from an unconventional coal reservoir in China. J. Nat. Gas. Sci. Eng. 2019, 65, 145–167. [Google Scholar] [CrossRef]
  19. Sun, B.Q.; Dunn, K.J. Multi-dimensional NMR logging. J. Magn. Reson. 2005, 172, 152–160. [Google Scholar] [CrossRef] [PubMed]
  20. Golsanami, N.; Bakhshi, E.; Yan, W.; Dong, H.; Barzgar, E.; Zhang, G.; Mahbaz, B. Relationships between the geomechanical parameters and Archie’s coefficients of fractured carbonate reservoirs: A new insight. Energ. Source Part. A 2020, 1–25. [Google Scholar] [CrossRef]
  21. Wang, M.; Xie, J.; Guo, F.; Zhou, Y.; Yang, X.; Meng, Z. Determination of NMR T2 Cutoff and CT Scanning for Pore Structure Evaluation in Mixed Siliciclastic–Carbonate Rocks before and after Acidification. Energies 2020, 13, 1338. [Google Scholar] [CrossRef] [Green Version]
  22. Golsanami, N.; Zhang, X.; Yan, W.; Yu, L.; Dong, H.; Dong, X.; Cui, L.; Jayasuriya, M.N.; Fernando, S.G.; Barzgar, E. NMR-Based Study of the Pore Types’ Contribution to the Elastic Response of the Reservoir Rock. Energies 2021, 14, 1513. [Google Scholar] [CrossRef]
  23. Walsh, D.; Turner, P.; Grunewald, E.; Zhang, H.; Butler, J.J., Jr.; Reboulet, E.; Knobbe, S.; Christy, T.; Lane, J.W., Jr.; Johnson, C.D.; et al. A small-diameter NMR logging tool for groundwater investigations. Groundwater 2013, 51, 914–926. [Google Scholar] [CrossRef] [PubMed]
  24. Golsanami, N.; Sun, J. Developing a new technique for estimating NMR T1 and T2 relaxations. In Proceedings of the 79th EAGE Conference and Exhibition, Paris, France, 12–15 June 2017. [Google Scholar]
  25. Zargar, G.; Tanha, A.A.; Parizad, A.; Amouri, M.; Bagheri, H. Reservoir rock properties estimation based on conventional and NMR log data using ANN-Cuckoo: A case study in one of super fields in Iran southwest. Petroleum 2020, 6, 304–310. [Google Scholar] [CrossRef]
  26. Zemansky, G.M.; McElwee, C.D. High-resolution slug testing. Groundwater 2005, 43, 222–230. [Google Scholar] [CrossRef] [PubMed]
  27. Tan, M.; Zou, Y.; Zhou, C. A new inversion method for (T2, D) 2D NMR logging and fluid typing. Comput. Geosci. 2013, 51, 366–380. [Google Scholar] [CrossRef]
  28. Guo, J.; Xie, R. Numerical simulation and parameter analysis of NMR T2-D distributions of tight sandstone saturated with a gas-water two-phase fluid. J. Nat. Gas. Sci. Eng. 2017, 37, 502–511. [Google Scholar] [CrossRef]
  29. Hu, F.; Zhou, C.; Li, C.; Xu, H.; Zhou, F.; Si, Z. Fluid identification method based on 2D diffusion-relaxation nuclear magnetic resonance (NMR). Petrol. Explor. Dev. 2012, 39, 591–596. [Google Scholar] [CrossRef]
  30. Hürlimann, M.D.; Venkataramanan, L. Quantitative measurement of two-dimensional distribution functions of diffusion and relaxation in grossly inhomogeneous fields. J. Magn. Reson. 2002, 157, 31–42. [Google Scholar] [CrossRef] [PubMed]
  31. Liu, H.; Nogueira d’Eurydice, M.; Obruchkov, S.; Galvosas, P. Determining pore length scales and pore surface relaxivity of rock cores by internal magnetic fields modulation at 2MHz NMR. J. Magn. Reson. 2014, 246, 110–118. [Google Scholar] [CrossRef] [PubMed]
  32. Medina-Rodriguez, B.X.; Reilly, T.; Wang, H.; Smith, E.R.; Garcia-Olvera, G.; Alvarado, V.; Aryana, S. Time-Domain Nuclear Magnetic Resonance Determination of Wettability Alteration: Analysis for Low-Salinity Water. Appl. Sci. 2020, 10, 1017. [Google Scholar] [CrossRef] [Green Version]
  33. Kausik, R.; Minh, C.C.; Zielinski, L.; Vissapragada, B.; Akkurt, R.; Song, Y. Characterization of gas dynamics in kerogen nanopores by NMR. In Proceedings of the SPE Annual Technical Conference and Exhibition, Denver, CO, USA, 30 October–2 November 2011. [Google Scholar]
  34. Korb, J.P.; Nicot, B.; Louis-Joseph, A.; Bubici, S.; Ferrante, G. Dynamics and wettability of oil and water in oil shales. J. Phys. Chem. C. 2014, 118, 23212–23218. [Google Scholar] [CrossRef]
  35. Washburn, K.; Birdwell, J.E. A new laboratory approach to shale analysis using NMR relaxometry. In Proceedings of the Unconventional Resources Technology Conference, Denver, CO, USA, 12–14 August 2013. [Google Scholar]
  36. Birdwell, J.E.; Washburn, K.E. Multivariate analysis relating oil shale geochemical properties to NMR relaxometry. Energ. Fuel. 2015, 29, 34–43. [Google Scholar] [CrossRef]
  37. Yan, W.; Sun, J.; Cheng, Z.; Li, J.; Sun, Y.; Shao, W.; Shao, Y. Petrophysical characterization of tight oil formations using 1D and 2D NMR. Fuel 2017, 206, 89–98. [Google Scholar] [CrossRef]
  38. Yan, W.; Sun, J.; Golsanami, N.; Li, M.; Cui, L.; Dong, H.; Sun, Y. Evaluation of wettabilities and pores in tight oil reservoirs by a new experimental design. Fuel 2019, 252, 272–280. [Google Scholar] [CrossRef]
  39. Zhang, P.; Lu, S.; Li, J.; Chang, X. 1D and 2D Nuclear magnetic resonance (NMR) relaxation behaviors of protons in clay, kerogen and oil-bearing shale rocks. Mar. Petrol. Geol. 2020, 114, 104210. [Google Scholar] [CrossRef]
  40. Freedman, R.; Lo, S.; Flaum, M.; Hirasaki, G.J.; Matteson, A.; Sezginer, A. A new NMR method of fluid characterization in reservoir rocks: Experimental confirmation and simulation results. Spe. J. 2001, 6, 452–464. [Google Scholar] [CrossRef]
  41. Venkataramanan, L.; Evirgen, N.; Allen, D. An unsupervised learning algorithm to compute fluid volumes from NMR T1-T2 logs in unconventional reservoirs. Proceedings of SPWLA 59th Annual Logging Symposium, London, UK, 2–6 June 2018. [Google Scholar]
  42. House, W.V. Introduction to the Principles of NMR. IEEE Trans. Nucl. Sci. 1980, 27, 1219–1226. [Google Scholar] [CrossRef]
  43. Kleinberg, R.L.; Horsfield, M.A. Transverse relaxation processes in porous sedimentary rock. J. Magn. Reson. 1990, 88, 9–19. [Google Scholar] [CrossRef]
  44. Brownstein, K.R.; Tarr, C.E. Importance of classical diffusion in NMR studies of water in biological cells. Phys. Rev. A. 1979, 19, 2446–2453. [Google Scholar] [CrossRef]
  45. Cohen, M.H.; Mendelson, K.S. Nuclear magnetic relaxation and the internal geometry of sedimentary rocks. J. Appl. Phys. 1982, 53, 1127–1135. [Google Scholar] [CrossRef]
  46. Du, Q.; Xiao, L.; Zhang, Y.; Liao, G.; Liu, H.; Guo, J. A novel two-dimensional NMR relaxometry pulse sequence for petrophysical characterization of shale at low field. J. Magn. Reson. 2019, 310, 106643. [Google Scholar] [CrossRef]
  47. Bloembergen, N.; Purcell, E.M.; Pound, R.V. Relaxation effects in nuclear magnetic resonance absorption. Phys. Rev. 1948, 73, 679–712. [Google Scholar] [CrossRef]
  48. Santoso, R.; Torrealba, V.; Hoteit, H. Investigation of an Improved Polymer Flooding Scheme by Compositionally-Tuned Slugs. Processes 2020, 8, 197. [Google Scholar] [CrossRef] [Green Version]
  49. Leu, S.-S.; Ying, T.-M. Replacement and Maintenance Decision Analysis for Hydraulic Machinery Facilities at Reservoirs under Imperfect Maintenance. Energies 2020, 13, 2507. [Google Scholar] [CrossRef]
  50. Wang, F.; Sheng, H.; Youheng, Z.; Shiqiang, W. Mineral composition and brittleness characteristics of the inter-salt shale oil reservoirs in the Qianjiang Formation, Qianjiang Sag. Petrol. Geol. Exp. 2016, 38, 211–218. (In Chinese) [Google Scholar]
  51. Scheeder, G.; Weniger, P.; Blumenberg, M. Geochemical implications from direct Rock-Eval pyrolysis of petroleum. Org. Geochem. 2020, 146, 104051. [Google Scholar] [CrossRef]
  52. Jiang, Q.; Li, M.; Qian, M.; Li, Z.; Li, Z.; Huang, Z.; Zhang, C.; Ma, Y. Quantitative characterization of shale oil in different occurrence states and its application. Petro. Geol. Exp. 2016, 38, 842–849. (In Chinese) [Google Scholar]
  53. Johannes, I.; Kruusement, K.; Veskib, R. Evaluation of oil potential and pyrolysis kinetics of renewable fuel and shale samples by Rock-Eval analyzer. J. Anal. Appl. Pyrol. 2007, 79, 183–190. [Google Scholar] [CrossRef]
  54. Liu, B.; Yao, S.; Hu, W.; Cao, J. Applying octamethylcyclotetrasiloxane as a probe liquid for characterizing the pore size distribution of oil-bearing tight sandstones by nuclear magnetic resonance cryoporometry. Mar. Petrol. Geol. 2017, 88, 814–825. [Google Scholar] [CrossRef]
  55. Khatibi, S.; Ostadhassan, M.; Xie, Z.H.; Gentzis, T.; Bubach, B.; Gan, Z.; Carvajal-Ortizb, H. NMR relaxometry a new approach to detect geochemical properties of organic matter in tight shales. Fuel 2019, 235, 167–177. [Google Scholar] [CrossRef]
  56. Dong, X.; Shen, L.W.; Golsanami, N.; Liu, X.; Sun, Y.; Wang, F.; Shi, Y.; Sun, J. How N-2 injection improves the hydrocarbon recovery of CO2 HnP: An NMR study on the fluid displacement mechanisms. Fuel 2020, 278, 118286. [Google Scholar] [CrossRef]
  57. Jiang, L.; Zhao, Y.; Golsanami, N.; Chen, L.; Yan, W. A novel type of neural networks for feature engineering of geological data: Case studies of coal and gas hydrate-bearing sediments. Geosci. Front. 2020, 11, 1511–1531. [Google Scholar] [CrossRef]
  58. Luo, K. Study on reserves characteristics of intersalt shale oil in Qianjiang Depression. J. Jianghan Petrol. Univ. Staff Work. 2020, 33, 38–40. (In Chinese) [Google Scholar]
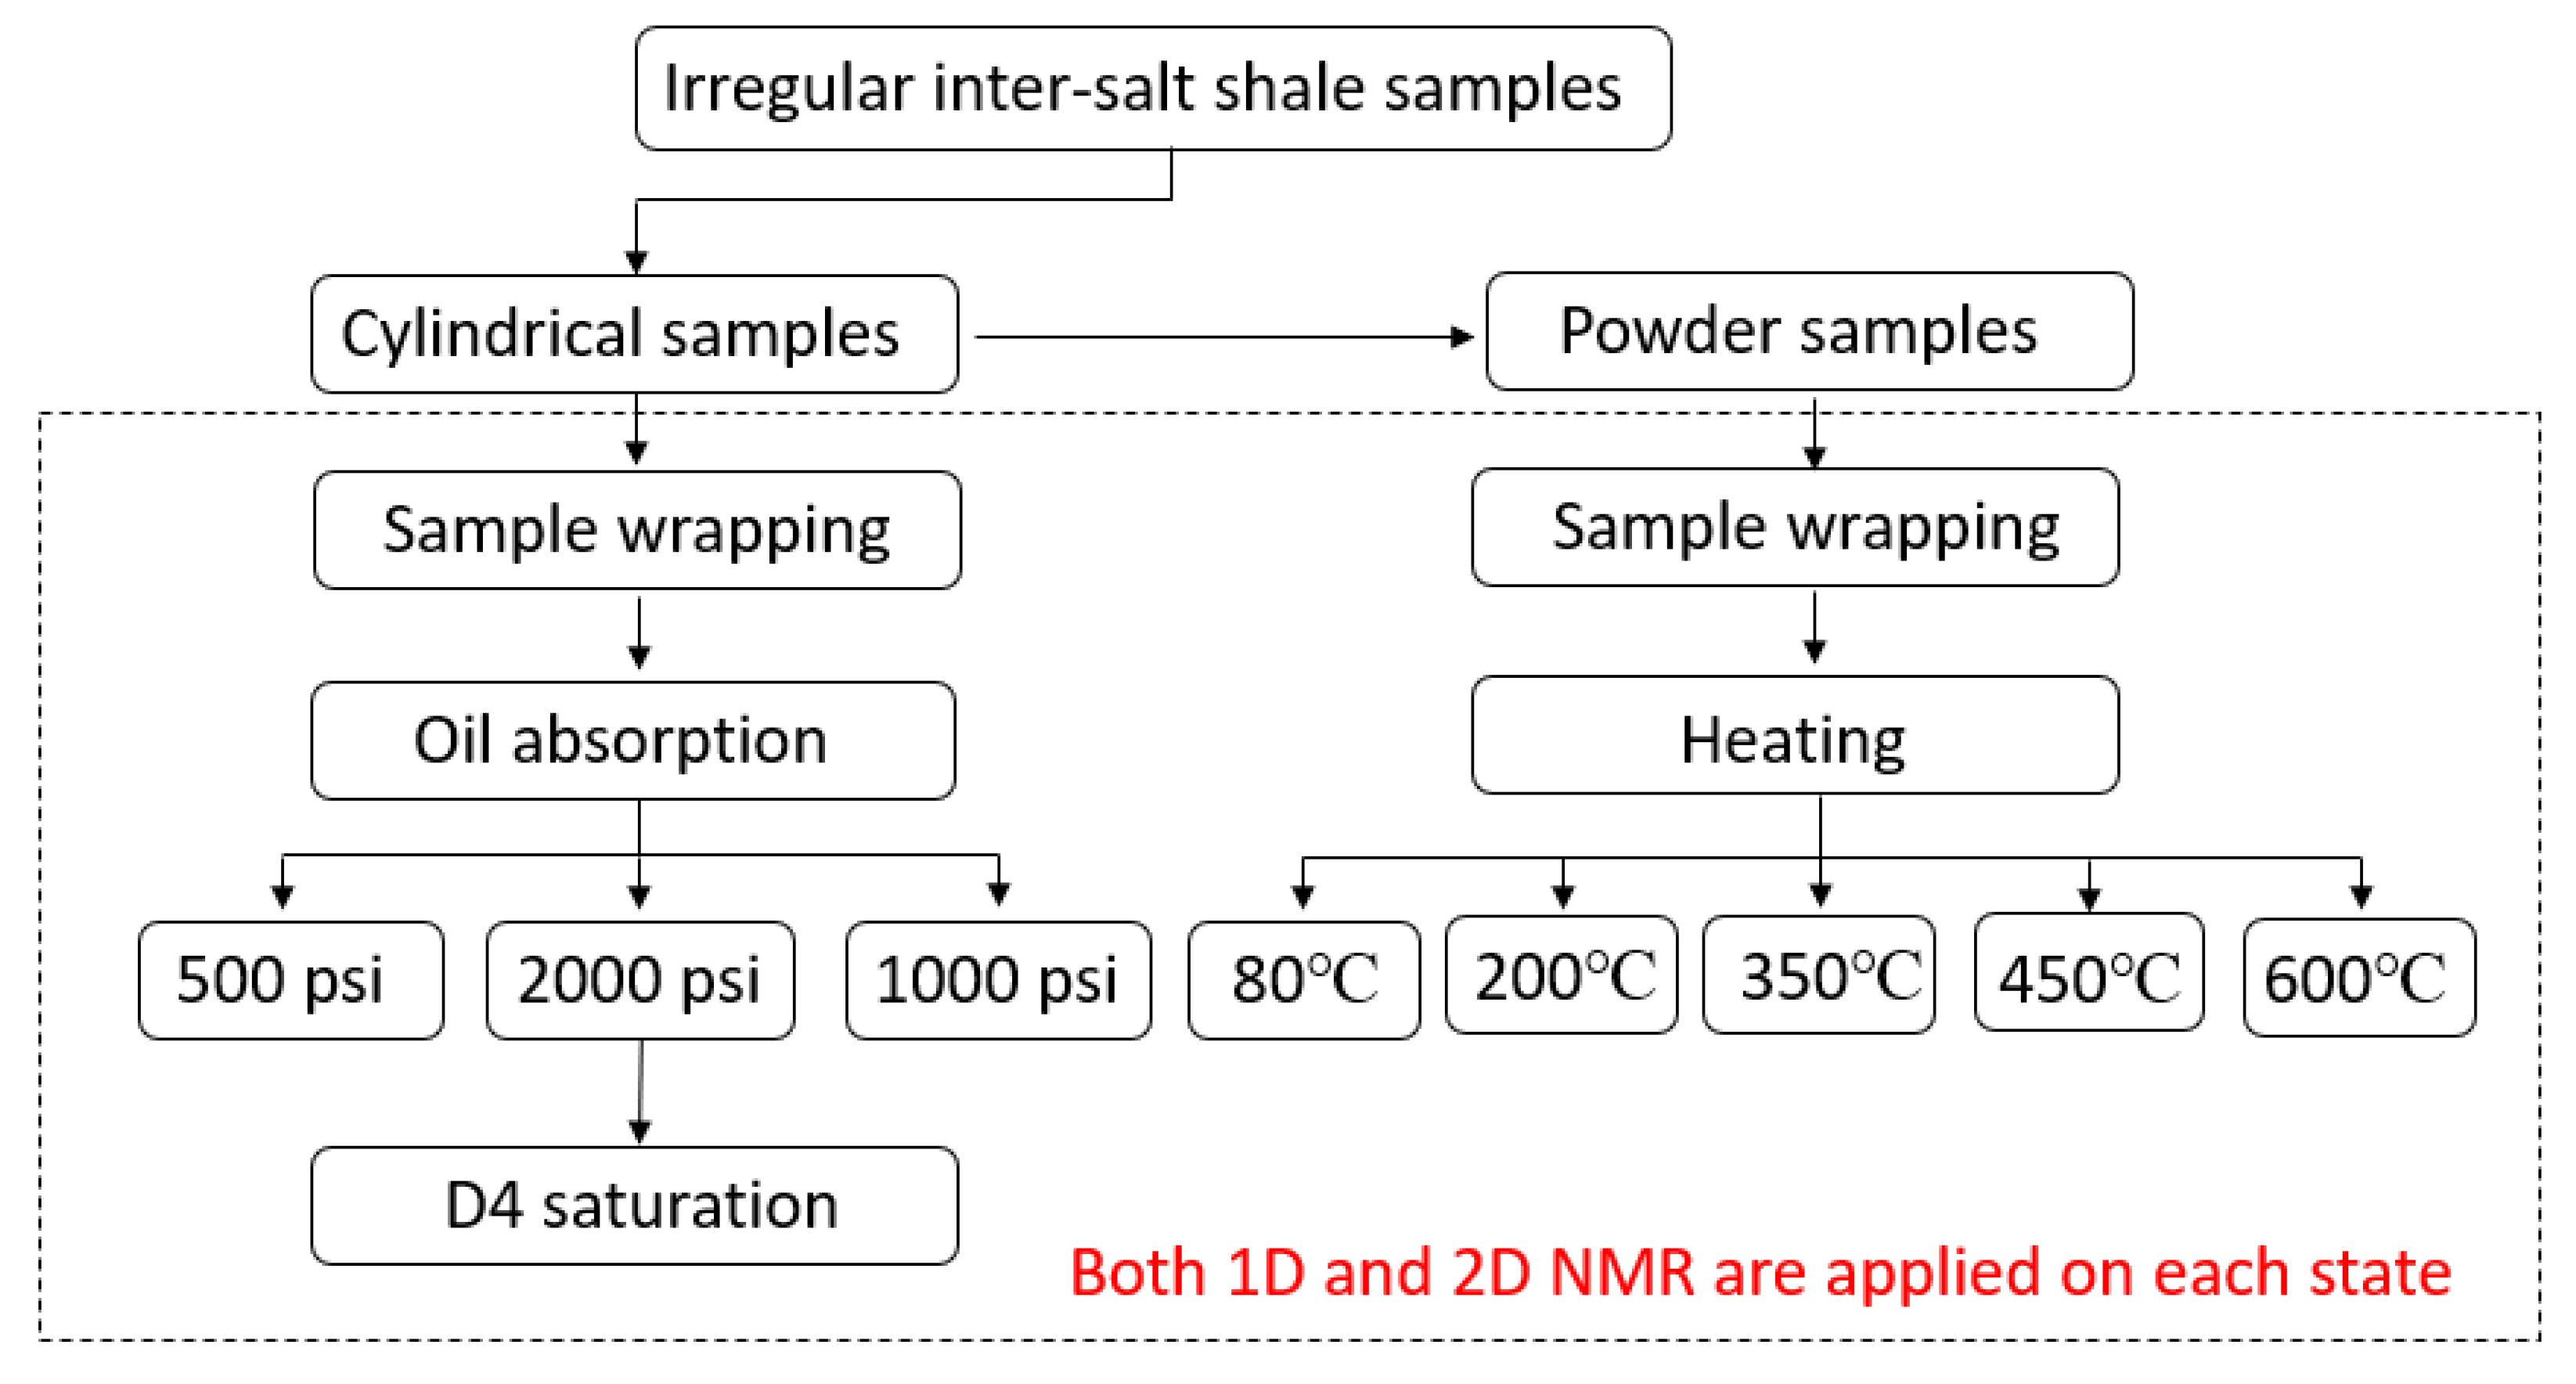
Figure 1. The flow chart of the experimental procedure.
Energies 14 02447 g001
Figure 2. The particularly designed stepwise multi-temperature anaerobic heating equipment. (a) Schematic diagram of the equipment. 1—pyrolysis chamber, 2—exhaust valve, 3—the first pressure sensor, 4—the second pressure sensor, 5—condenser, 6—collecting tube, 7—suction filter pump, 8—supporting platform, 9—main power switch, 10—suction pressure indicator, 11—heating switch, 12—pressure indicator in the kettle, 13—power control box, 14—temperature control meter, 15—pumping switch. (b) The real developed equipment.
Energies 14 02447 g002
Figure 3. T2 spectrum of the cylindrical sample (ZY1-1) in various states, including original, self-absorbed oil, and saturated oil under pressures of 500, 1000, and 2000 psi.
Energies 14 02447 g003
Figure 4. Multi-saturation state 2D T1-T2 maps for the cylindrical inter-salt shale sample ZY1-1. (a) Original state, (b) self-absorbed oil state, (ce) saturated oil under pressures of 500, 1000, and 2000 psi, respectively.
Energies 14 02447 g004
Figure 5. Comparison of T2 spectrums between distilled water and D4.
Energies 14 02447 g005
Figure 6. T2 spectrums of shale saturated with water and D4.
Energies 14 02447 g006
Figure 7. T1-T2 maps of shale at different states. (a) Saturated with water, (b) saturated with D4.
Energies 14 02447 g007
Figure 8. Two regions in the T1-T2 map of inter-salt shale saturated with D4.
Energies 14 02447 g008
Figure 9. Multi-temperature state 2D T1-T2 maps for inter-salt shale powder sample ZY1-1. (a) Original state, (bf) different temperature states of 80, 200, 350, 450, and 600 °C, respectively.
Energies 14 02447 g009
Figure 10. Composition distribution graph of inter-salt shale established in the present study.
Energies 14 02447 g010
Figure 11. T2 spectrums and cumulative curves of saturated oil experiments of inter-salt shale.
Energies 14 02447 g011
Figure 12. T2 spectrums and cumulative curves of multi-temperature experiments of inter-salt shale.
Energies 14 02447 g012
Table 1. The distribution range of various components of inter-salt shale.
Component NameT1 (ms)T2(ms)T1/T2
Free oil (movable)20–2901.7–134–50
Free oil (residue)3.5–350.4–51.3–40
Adsorption oil34–1501.5–216–300
Water1–80.5–21–10
Kerogen0.13–4280.05–0.41–4100
Table 2. Saturation of various fluid components in six samples.
Sample 1Sample 2Sample 3Sample 4Sample 5Sample 6Average
Free movable oil saturation/%86.9370.880.8773.2476.6878.2177.79
Free residual oil saturation/%9.912012.7917.3215.117.4815.43
Adsorbed oil saturation/%3.169.26.349.448.224.316.79
Publisher’s Note: MDPI stays neutral with regard to jurisdictional claims in published maps and institutional affiliations.