Article

Image Preprocessing for Outdoor Luminescence Inspection of Large Photovoltaic Parks

1
Institute for Photovoltaics and Research Center SCoPE, University of Stuttgart, 70569 Stuttgart, Germany
2
Institute of Signal Processing and System Theory, University of Stuttgart, 70569 Stuttgart, Germany
*
Author to whom correspondence should be addressed.
Energies 2021, 14(9), 2508; https://doi.org/10.3390/en14092508
Submission received: 19 March 2021 / Revised: 16 April 2021 / Accepted: 22 April 2021 / Published: 27 April 2021

Abstract

:
Electroluminescence (EL) measurements allow one to detect damages and/or defective parts in photovoltaic systems. In principle, it seems possible to predict the complete current/voltage curve from such pictures even automatically. However, such a precise analysis requires image corrections and calibrations, because vignetting and lens distortion cause signal and spatial distortions. Earlier works on crystalline silicon modules used the cell gap joints (CGJ) as calibration pattern. Unfortunately, this procedure fails if the detection of the gaps is not accurate or if the contrast in the images is low. Here, we enhance the automated camera calibration algorithm with a reliable pattern detection and analyze quantitatively the quality of the process. Our method uses an iterative Hough transform to detect line structures and uses three key figures (KF) to separate detected busbars from cell gaps. This method allows a reliable identification of all cell gaps, even in noisy images or if disconnected edges in PV cells exist or potential induced degradation leads to a low contrast between active cell area and background. In our dataset, a subset of 30 EL images (72 cell each) forming grid ( 5 × 11 ) lead to consistent calibration results. We apply the calibration process to 997 single module EL images of PV modules and evaluate our results with a random subset of 40 images. After lens distortion correction and perspective correction, we analyze the residual deviation between ideal target grid points and the previously detected CGJ after applied distortion and perspective correction. For all of the 2200 control points in the 40 evaluation images, we achieve a deviation of less than or equal to 3 pixels. For 50% of the control points, a deviation of of less than or equal to 1 pixel is reached.

1. Introduction

The photovoltaic (PV) industry has been using luminescence measurements for quality assurance in production lines for several years. It allows the detection of multiple defects like potential induced degradation (PID), defective bypass diodes, cell cracks, disconnected cell parts, busbar soldering defects. Kropp et al. [1] showed that from the defects which are detectable in EL images and their spacial properties, one can conclude to the potential power loss of a PV module and hence to the power loss of PV systems. Alongside the inline luminescence measurement in the production line, the field luminescence measurement for Operation and Maintenance (O&M) [2] purposes is increasingly used since the last years. The DaySy system is an outdoor luminescence measurement system [2] where PV modules do not have to be dismounted. Daylight EL inspection methods like DaySy rely on indium gallium arsenide (InGaAs) cameras with relatively low resolution of less than 1 MP compared to conventional complementary metal-oxide-semiconductor (CMOS) technology.
Luminescence measurements are image-based measurement techniques that use a camera as measuring device. The camera setup including lenses could cause several lens distortion types (e.g., radial, tangential, thin prism). For automated postprocessing procedures, cell extraction, automated defect detection, and the quantitative analysis of luminescence images, these undesired effects must be corrected in advance.
In the field of luminescence measurements Deitsch et al. [3] proposed an automatic segmentation for high resolution electroluminescence (EL) images of PV modules to extract cells and correct radial distortion before. The distortion correction in their method is based on the model of Devernay and Faugeras [4]. The advantage of this approach is that the distortion model estimation is decoupled from the projection to the 2D image plane. Therefore, the intrinsic camera parameters, must not be calibrated. Unfortunately, this method does not consider decentering distortion and is just applicable for EL measurements with minor perspective distortion as explicitly stated in Ref. [3]. For outdoor luminescence imaging of mounted PV modules, where perspective is almost not avoidable, this calibration technique is not applicable.
Bedrich et al. [5,6,7] used the image processing library of OpenCV [8], which is based on the calibration process of Zhang et al. [9] and Heikkilä et al. [10]. This calibration technique usually uses images of a grid of control points extracted from a chessboard as calibration pattern [5,6,7,8,9,11]. It considers radial distortion of multiple orders and decentering distortion. In Ref. [12] Bedrich et al. introduced an automated calibration chain where the cell gap grid of a PV module is extracted from EL images and used as calibration pattern. For the cell gap detection of a PV module in [12], the authors referred to [7], where a vertical and horizontal Sobel–Feldman operator [13] was used to extract edges of the PV cells and then conclude to the cell gaps by two cell edges. As the Sobel–Feldman operator is a gradient based edge detection technique, it has disadvantages in cases of small gradients between active cell area and background of the EL images. Therefore, this edge detection technique may also fail on EL images of PV modules that are heavily affected with potential induced degradation (PID), polarization, or when cell edges are partially or fully disconnected. For the calibration process in Ref. [12], the authors showed a relative line straightness improvement between 5% and 80% for most of the cases. Unfortunately, the results did not show a total accuracy or residual inaccuracy and thus do not allow an overall quantitative quality evaluation of the whole correction process. The authors proved in [12] that in principle it is possible to correct the distortion by detecting the cell gap grid in EL images with minor perspective that are measured in the laboratory. The applicability on EL images of PV modules with high perspective, measured in the field and the the quantitative consistency of the calibration process are not discussed in [12].
Mantel et al. [14] showed an algorithm to detect lines and cell corners in PV modules for perspective transformation by rotating the binary image at different angles and summing the pixel intensity values along the image axes. Their algorithm showed very accurate results for perspective distorted indoor laboratory EL measurements without lens distortion, where only the device under test (DUT) is visible in the EL measurements. Nevertheless their method was less successful for real outdoor EL measurements where noise and neighboring PV modules are present. The applicability of the algorithm on lens distorted EL images is not discussed in their work.
The present work extends the self-calibrating image processing chain (see Figure 1) with a fast, automated, reliable and accurate cell gap joint detection algorithm. The pattern detection is based on a Hough transform [15] applied on an adaptive locally thresholded [16] image. For the first time, an iterative approach based on the linear Hough transform is used to detect the distorted cell gap joints (CGJ) in an EL image. An advantage compared to existing methods is that it is also applicable for real outdoor luminescence measurements in which the PV module is affected by high perspective and large lens distortion. Another advantage of the proposed algorithm is, that it is applicable for luminescence measurements with neighboring PV modules in the image as the segmentation of the DUT is part of the algorithm. The adaptive local threshold allows to extract edges from smaller gradient environment compared to Sobel–Feldman operator as shown in [16]. Compared to the existing methods, this advantage provides more reliable cell gap detection especially for images with smaller gradient between the signal of the active cell area and the background. The detected CGJ in multiple EL images are used as calibration pattern to estimate the distortion and camera coefficients and to correct distortion and the perspective. This work proves that the camera parameter estimation becomes more reliable with more calibration image planes of different scenes. We statistically analyze the amount of images in the calibration subset of our data set necessary to get consistent results, independent of the randomly chosen calibration images. This work also provides a quantitative quality metric to evaluate the accuracy of the image processing chain (lens distortion correction and perspective correction) for the PV module. Compared to Deitsch et al. [3], the algorithm in the present work allows a throughput of 2000 luminescence images in 200 min on an AMD Ryzen 7 2700X 8 core processor which yields a mean time of 6 s per image for the whole image processing chain, including pattern detection, camera parameter estimation, distortion and perspective correction. An advantage of the presented work is that it is applicable for EL images with a lower resolution of ( 640 × 512 ) px and high perspective of the object in the EL image.

2. Calibration Principle

The automated self-calibration for EL images introduced by Bedrich et al. [12] which is sketched in Figure 1 is an extension on the method of Zhang et al. [9] and Heikkilä et al. [10]. It is based on the pinhole camera model to project a three dimensional (3D) world point (X, Y, Z) into an image plane (Figure 1a–c). The extrinsic camera parameters describe the conversion from 3D world coordinates to 3D camera coordinates. The intrinsic camera parameters describe the projection from 3D camera coordinates to 2D image coordinates u and v. This ideal projection model does not consider lens distortion. Nevertheless, an optical system produces a lens distorted images (Figure 1). The distortion model of Brown [17].
u ˜ = u ˜ d + u ˜ ˚ d ( k 1 r 2 + k 2 r 4 + k 3 r 6 ) radial + p 1 ( r 2 + 2 u ˜ ˚ d 2 ) + 2 p 2 u ˜ ˚ d v ˜ ˚ d decentering v ˜ = v ˜ d + v ˜ ˚ d ( k 1 r 2 + k 2 r 4 + k 3 r 6 ) radial + 2 p 1 u ˜ ˚ d v ˜ ˚ d + p 2 ( r 2 + 2 v ˜ ˚ d 2 ) decentering
with u ˜ ˚ d = ( u ˜ d u 0 ) , v ˜ ˚ d = ( v ˜ d v 0 ) and r = u ˜ ˚ d 2 + v ˜ ˚ d 2 describes the correction of a distorted image point P ( u ˜ d , v ˜ d ) to an undistorted point P ( u ˜ , v ˜ ) with the unknown distortion coefficients k 1 , k 2 , k 3 , p 1 , p 2 . It is assumed as the most complete model because it considers radial distortion of multiple orders and decentring distortion. Other calibration techniques [3,18,19,20,21,22] just consider radial distortion for simplification.
The methods of Zhang et al. [9] and Heikkilä et al. [10] allow the extraction of the extrinsic and intrinsic camera parameters and the distortion coefficients k 1 , k 2 , k 3 , p 1 , p 2 . The algorithms are based on a parameter estimation and non-linear optimization with a source (distorted) and target pattern (undistorted), usually extracted from images of a chessboard pattern. Instead of chessboard pattern, Bedrich et al. [12] used the distorted CGJ pattern of the PV module in Figure 1d) as source pattern, as the square-shaped PV cells form a good regular pattern. A pattern of equidistant grid points in Figure 1e was assumed as target pattern containing the ideal positions of the CGJs. The algorithms of Zhang et al. [9] and Heikkilä et al. [10] estimated the homography between source and target (see Figure 1f) and provide a closed-form solution to get a good initial guess for the extrinsic and intrinsic camera parameter. The distortion coefficients are assumed to be zero for this initial step. With a non-linear optimization, the camera parameters are refined and the distortion coefficients are estimated (see Figure 1g). The abort criterion is predefined by the desired mean reprojection error of all calibration pattern points. The distortion corrected coordinates of a point P ( u ˜ , v ˜ ) in the image are calculated from the distorted coordinates of point P ( u ˜ d , v ˜ d ) and the estimated camera parameters and distortion coefficients by Equation (1).
As can be seen in Figure 1, a precise and reliable detection of the complete distorted CGJ pattern is absolutely essential for the whole calibration chain because it has strong influence on the parameter estimation. We show a robust pattern recognition algorithm for low resolution, highly distorted outdoor EL images with high perspective, that finds the CGJ between the PV cells of a crystalline silicon module in an EL image (see Figure 1d). The algorithm allows the differentiation between cell gaps and other line structures in the image of a PV module or cell (e.g., busbars) because busbars should be excluded from the calibration pattern.

3. Pattern Detection Procedure

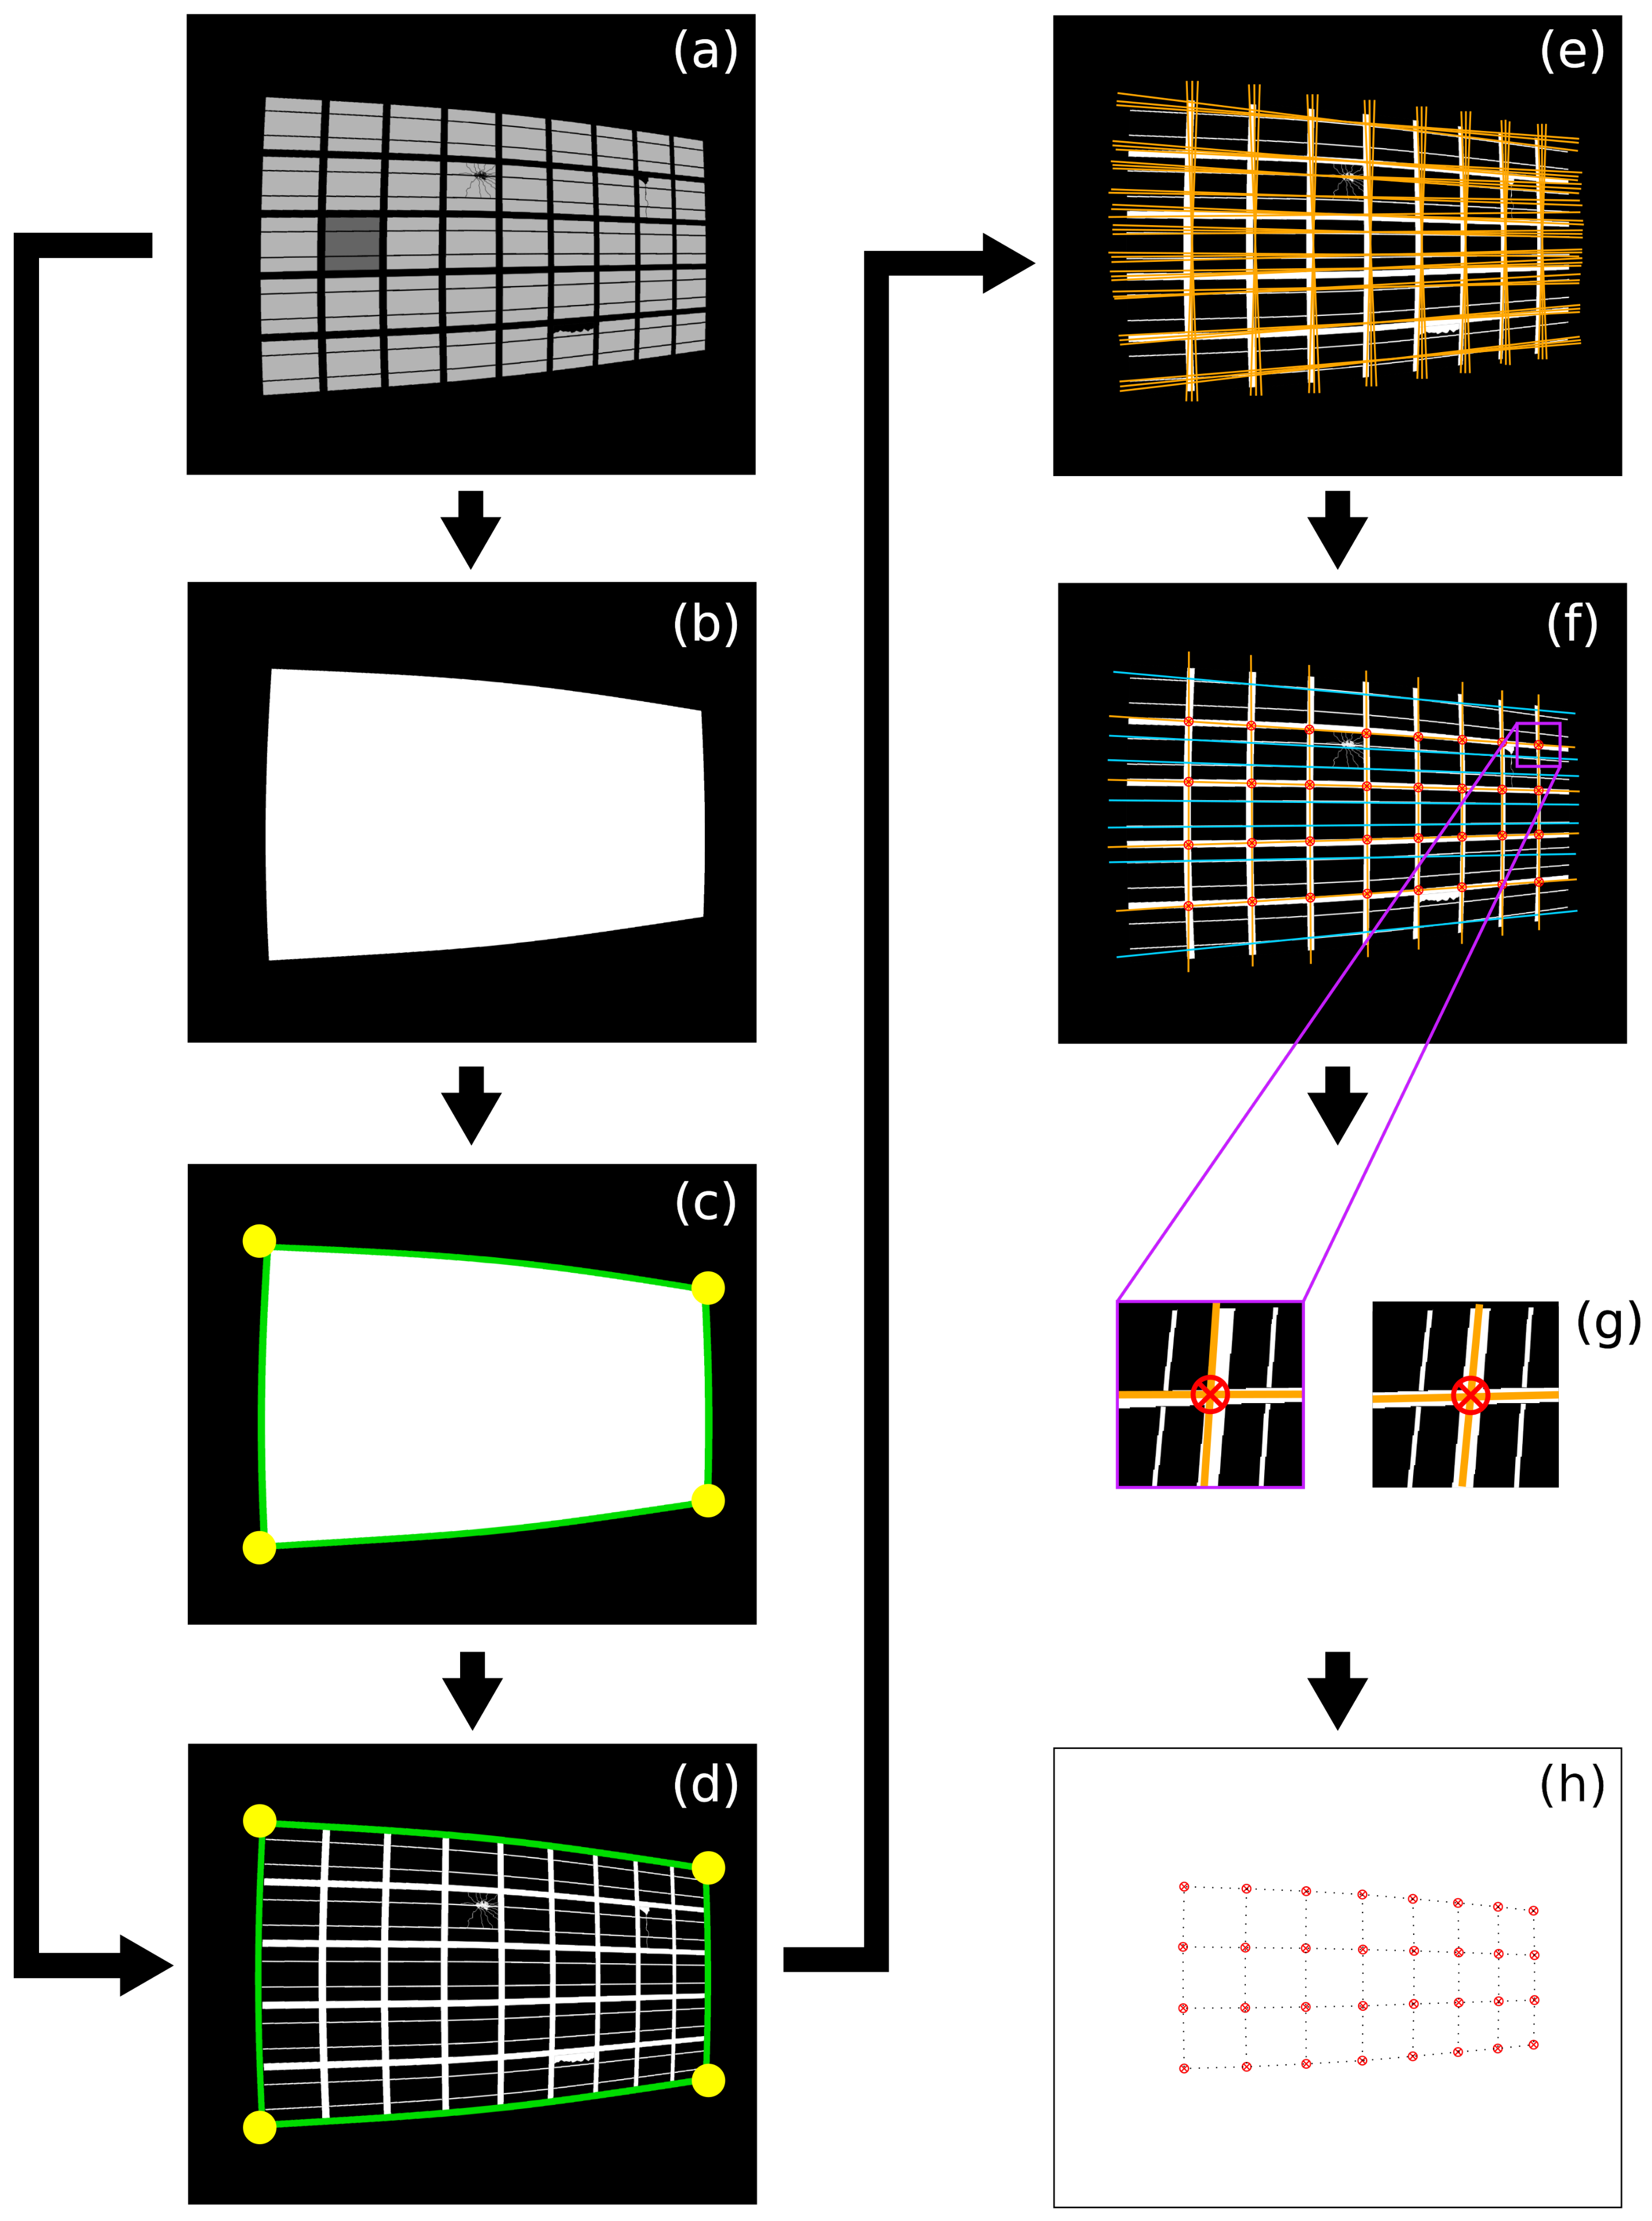
Figure 2 shows the processing steps of the distorted CGJ source pattern detection introduced in this section and discussed in more detail in the following subsections. The subsection structure depicts the structure of the processing steps in Figure 2b–g.
Looking at a crystalline silicon based PV module shows clearly that the cell gaps and busbars form a grid pattern of straight lines. Due to lens distortion, these straight line structures are displayed as curved line structures in an EL image of such PV modules as shown in Figure 2a. First, we find the contours and corner points of the active cell area of the PV module in the center of the image to define a region of interest (ROI) (Figure 2b,c). We assume the PV module in the image center as the object to find the reference pattern and thus isolate this ROI from the rest of the image. This avoids artefacts or other interfering objects (e.g., neighboring PV modules) in the pattern detection process. In the isolated ROI, image binarization and morphological operations are performed to outline the desired cell gap and busbar structures (Figure 2d). The Hough Transform allows the detection of parameterizable geometric forms, such as straight lines and curves in binary images as described in Ref. [15]. For the sake of simplicity we use the Hough Transform in a line search step to find multiple straight line forms in the EL image of a PV module as rough estimation of the curved lines structures in the EL image. This Hough line search step leads to the detection of a cluster of multiple straight lines for one curved line structure (Figure 2e). In a line validation step this cluster is evaluated and filtered for the straight line that represents best the curved line structure. With our line classification algorithm we are able to distinguish between busbar lines and cell gap lines (Figure 2f). The cell gap lines form a regular grid for a rough estimation of the CGJ positions (Figure 2f). As the image is affected by radial and tangential distortion, and thus the CGJ are not at the intersection points of the straight line structures, the CGJ search is refined by using the intersection points of Figure 2f and performing the steps from Figure 2e,f again in a smaller cropped ROI around the intersection point. Figure 2g shows the results before and after the improvement. This results in Figure 2h which shows the refined distorted CGJ positions for the whole PV module. These CGJ are used as reference pattern for the camera parameter and distortion coefficient estimation.

3.1. PV Module Corner Detection

In this section, we describe the corner localization for the module of interest. This is necessary for the following steps in order to provide a robust algorithm. The corner detection process is divided into five parts. In a first step, the solar modules in the image will be segmented and in the following step, the module of interest will be selected. Since the images are taken under real world conditions, the segmented module could suffer from the low image quality and, much more important, some corners could lie outside of the image area. Therefore, a robust estimate of the module contour is needed in order to get the exact corner coordinates. To achieve the precise estimate, we assume a geometric model for the PV modules and fit the segmented contour in a robust way to the assumed model.
To segment the module, we first apply a bilateral filter to reduce image noise without smoothing out the edges of the module contour [23]. To distinguish between pixels belonging to the PV module and pixels belonging to the background of the EL image, we use either an Otsu Thresholding which is based on the gray-level histogram of the image [24] or an adaptive local median thresholding algorithm [16]. Since the pixel intensity is inhomogeneous, the thresholding does not lead to the desired segmented module. Therefore, we apply erosion and dilation to the thresholded image in order to isolate individual pixels and joining separate pixels in the EL image [25]. An example of a segmented module is shown in Figure 2b). For further processing, the contour of the segmented module area is needed. Therefore, we use a common contour finding algorithm [26]. In a last step, the contour of the module of interest is selected based on its moment. The contour with the closest moment location to the image center will be selected. The result is shown in Figure 2c).
As already mentioned, the extracted contours often suffer from the low image resolution which results in noisy contour points. Furthermore, it is possible that some parts of the module lie outside of the captured image. To overcome those two severe problems, we suggest to robustly fit the module contour to a geometric model. A simple approach would assume the rectangular geometry of the real PV module. Due to the heavy lens distortion of the used cameras, this assumption is not suitable. We suggest using a geometric model consisting of four parabolic line segments. To easily fit this geometric model, we group the contour points into four groups for each edge and afterwards fit each group to a parabolic model. To split the contour points, we first calculate the distance for each contour point to the PV module center. The maximum distances are assumed as a rough estimate of the corners. By using the estimated corners, we select the corresponding contour points for each edge of the module. To robustly fit each parabolic model, we suggest using the RANSAC algorithm [27]. To get the coordinates of the module corners in a last step, the intersection points of the neighboring parabolic functions have to be calculated.

3.2. Binarization for Cell Gap Detection

Figure 2d shows the binarization for the cell gap detection. The detected corners of Section 3.1 in Figure 2c define a ROI for the cell gap detection. In EL measurement only active cell area emits a radiation signal that is detected with the camera system. Background, cell caps, busbars, disconnected cell areas and cracks do not emit a radiation signal and therefore appear dark in a greyscale EL image (see Figure 2a. An adaptive local threshold [16] with a kernel size of 5 × 5 is applied to the ROI window to binarize the image in the ROI. Every pixel outside the ROI is set to zero (black). The pixel values in the binarized ROI are inverted to emphasise the cell caps, busbars, disconnected cell areas and cracks instead of the active cell area as can be seen in Figure 2d. Morphological operations (erosion and dilation) remove artefacts and close small gaps in the structures.

3.3. Identification of Line Structures

To detect line structures in the inversed binarized image in Figure 2d), the perspective position of the PV module is estimated from the cornerpoints of Figure 2c). From the perspective position and the amount of cells in the PV module we define ROIs from the long-to-long module edges and from short-to-short module edges. These are potential locations of line structures that represent cell gaps. A line detection algorithm based on Hough transformation [15] in the entire image and in each specific ROI results in a set of multiple straight lines which is shown in Figure 2e. In order to get the best representation of a cell gap line and distinguish between busbar and cell gap we propose a three step validation process:
  • Filter out straight lines by angle and position that do not match the perspective of the PV module
  • Reduce the number of straight lines for one curved line structure to one straight line with the closest representation
  • Distinguish between cell gap line and busbar line
Depending on the perspective of the PV module in the image, only straight lines in a certain angular range and position are valid and are clustered for short-to-short edge lines and long-to-long edge lines. The following characteristics are used to reduce the set of lines to the best representation of one straight line for each curved line structure (cell gap lines or busbar lines):
  • Weight ( w i ) of each line—sum of distance weighted pixel intensity.
  • (Intersection) of lines. Wherever two found lines of the same cluster (long-to-long or short-to-short module edge) intersect, the line with the higher weight is assumed as the valid line and is used for further steps.
The validation process results are shown in Figure 2f. For each line structure in Figure 2f there exists exactly one found straight line that represents best the curved line structure in the binary image. Let
g x , y : x = a + λ b
be the parametric representation of a valid found line in long-to-long or short-to-short module edge direction in Figure 2f, where a is the position vector, b the directional vector and λ is the parameter. As mentioned before, the valid found straight lines g x , y are rough approximations for both busbars as well as cell gaps in Figure 2f. For an equidistant calibration pattern or for location of PV cell borders one has to distinguish between cell gap line structures and busbar line structures.
By knowing the PV module corner points from Section 3.1 and the perspective, we now approximate a distortion free grid between the PV module corner points that represents the cell gap grid pattern and hence the perspective.
Assume the matrix
M = P 11 P 12 P 13 . . . P 17 P 18 P 19 P 21 P 22 P 23 . . . P 27 P 28 P 29 P 31 P 32 P 33 . . . P 37 P 38 P 39 P 41 P 42 P 43 . . . P 47 P 48 P 49 P 51 P 52 P 53 . . . P 57 P 58 P 59
to be the matrix with the 45 grid points P m n in the approximated grid for a 60 cell PV module in landscape format with 1 m 5 and 1 n 9 .
The points P m 1 to P m 9 represent an imaginary line h m from the short edge on one side to the short edge on the other side of the PV module. The points P 1 n to P 5 n represent an imaginary line h n from long to long edge of the PV module.
For each point P on the imaginary lines h m and h n the distance
d p m n = | ( p m n a ) × b | | b |
represents the distance of this point to a valid straight line of the same cluster (short-to-short edge line or long-to-long edge line) in Figure 2f.
The mean distance
d ¯ h m = 1 9 n = 1 9 d p m n
respectively
d ¯ h n = 1 5 m = 1 5 d p m n
is assumed as mean distance between an imaginary grid line and a valid straight line of its cluster.
For each imaginary line h m or h n , its four nearest valid straight lines g i of the same cluster, given by the four smallest mean distances d ¯ h m , respectively, d ¯ h n define a set G = { g 1 . . . g 4 } . If two imaginary lines h m and h m + 1 (or h n and h n + 1 ) share the same line g i in their set, the line is assigned to the set with the smaller mean distance d ¯ h m (or d ¯ h n ). This results in sets G = { g 1 . . . g i } ( 1 i 4 ) with a minimum size of two and a maximum size of four nearest valid straight lines (cell gap lines and busbar lines) for each imaginary line.
Further for each line h m or h n , the line in G most likely to be a cell gap line is searched.
Three different key figures (KF) are defined to determine the cell gap line:
For the KF i 1 , all lines in G are sorted by their weight w i , which is defined earlier in this section. The key figure
K F i 1 = w i w 2 1
compares each line in the sorted set G with the line that has the second highest w i .
This results in positive K F i 1 values for strong and long line structures in G and negative values for thinner and shorter line structures.
Let Q i be the intersection point of a line g i G with the vertical perpendicular bisector of the bounding box around the PV module area in the image. The set S = { q 1 , . . . , q i } defines the set of the position vectors of the intersection points of all lines g i G with the vertical perpendicular bisector.
The distance
d i j = | q i q j |
is the distance between two intersection points in S and is assumed as distance between two lines in G. The set
D i = { | q i q j | q i , q j S , j i }
contains the distances of a line g i G to the other lines in the set. The union set
D = i I . D i
contains the distances of all lines in a set G to each other.
The ratio
K F i 2 = m i n ( D ) m i n ( D i )
is defined as second indicator for each g i G . Lines that are close to other lines in the set have a higher KF i 2 .
The ratio
K F i 3 = m i n ( D ) m a x ( D i )
is defined as third indicator for each g i G . Lines that are located in the center of a set have a higher KF i 3 .
All indicators yield to a total indicator by the weighting function
K F i t o t a l = 2 K F i 1 + 1 K F i 2 + 1 K F i 3 .
The line with the highest total key figure KF i total is considered most likely to be the line that represents the cell gap line. This separation technique considers the main features which distinguish a cell gap line from a busbar line in the image and can be adjusted individually for different PV module types.

3.4. Precise Cell Gap Joint (CGJ) Search in ROI

The intersection points of the cell gap lines in Figure 2f do already give a precise representation of the cell gap joints in the center of the PV module. The location of the intersection points near the PV module corners do not match exactly due to the lens distortion as can be seen in Figure 2g. Additional iteration steps of the Hough line algorithm, validation and classification steps in individual variable windows around the CGJs refine the location of each CGJ, which is shown in Figure 2g. This individual refined CGJ pattern shown in Figure 2h is a good approximation for the distorted source pattern shown in Figure 1d.

4. Experiment

4.1. Setup

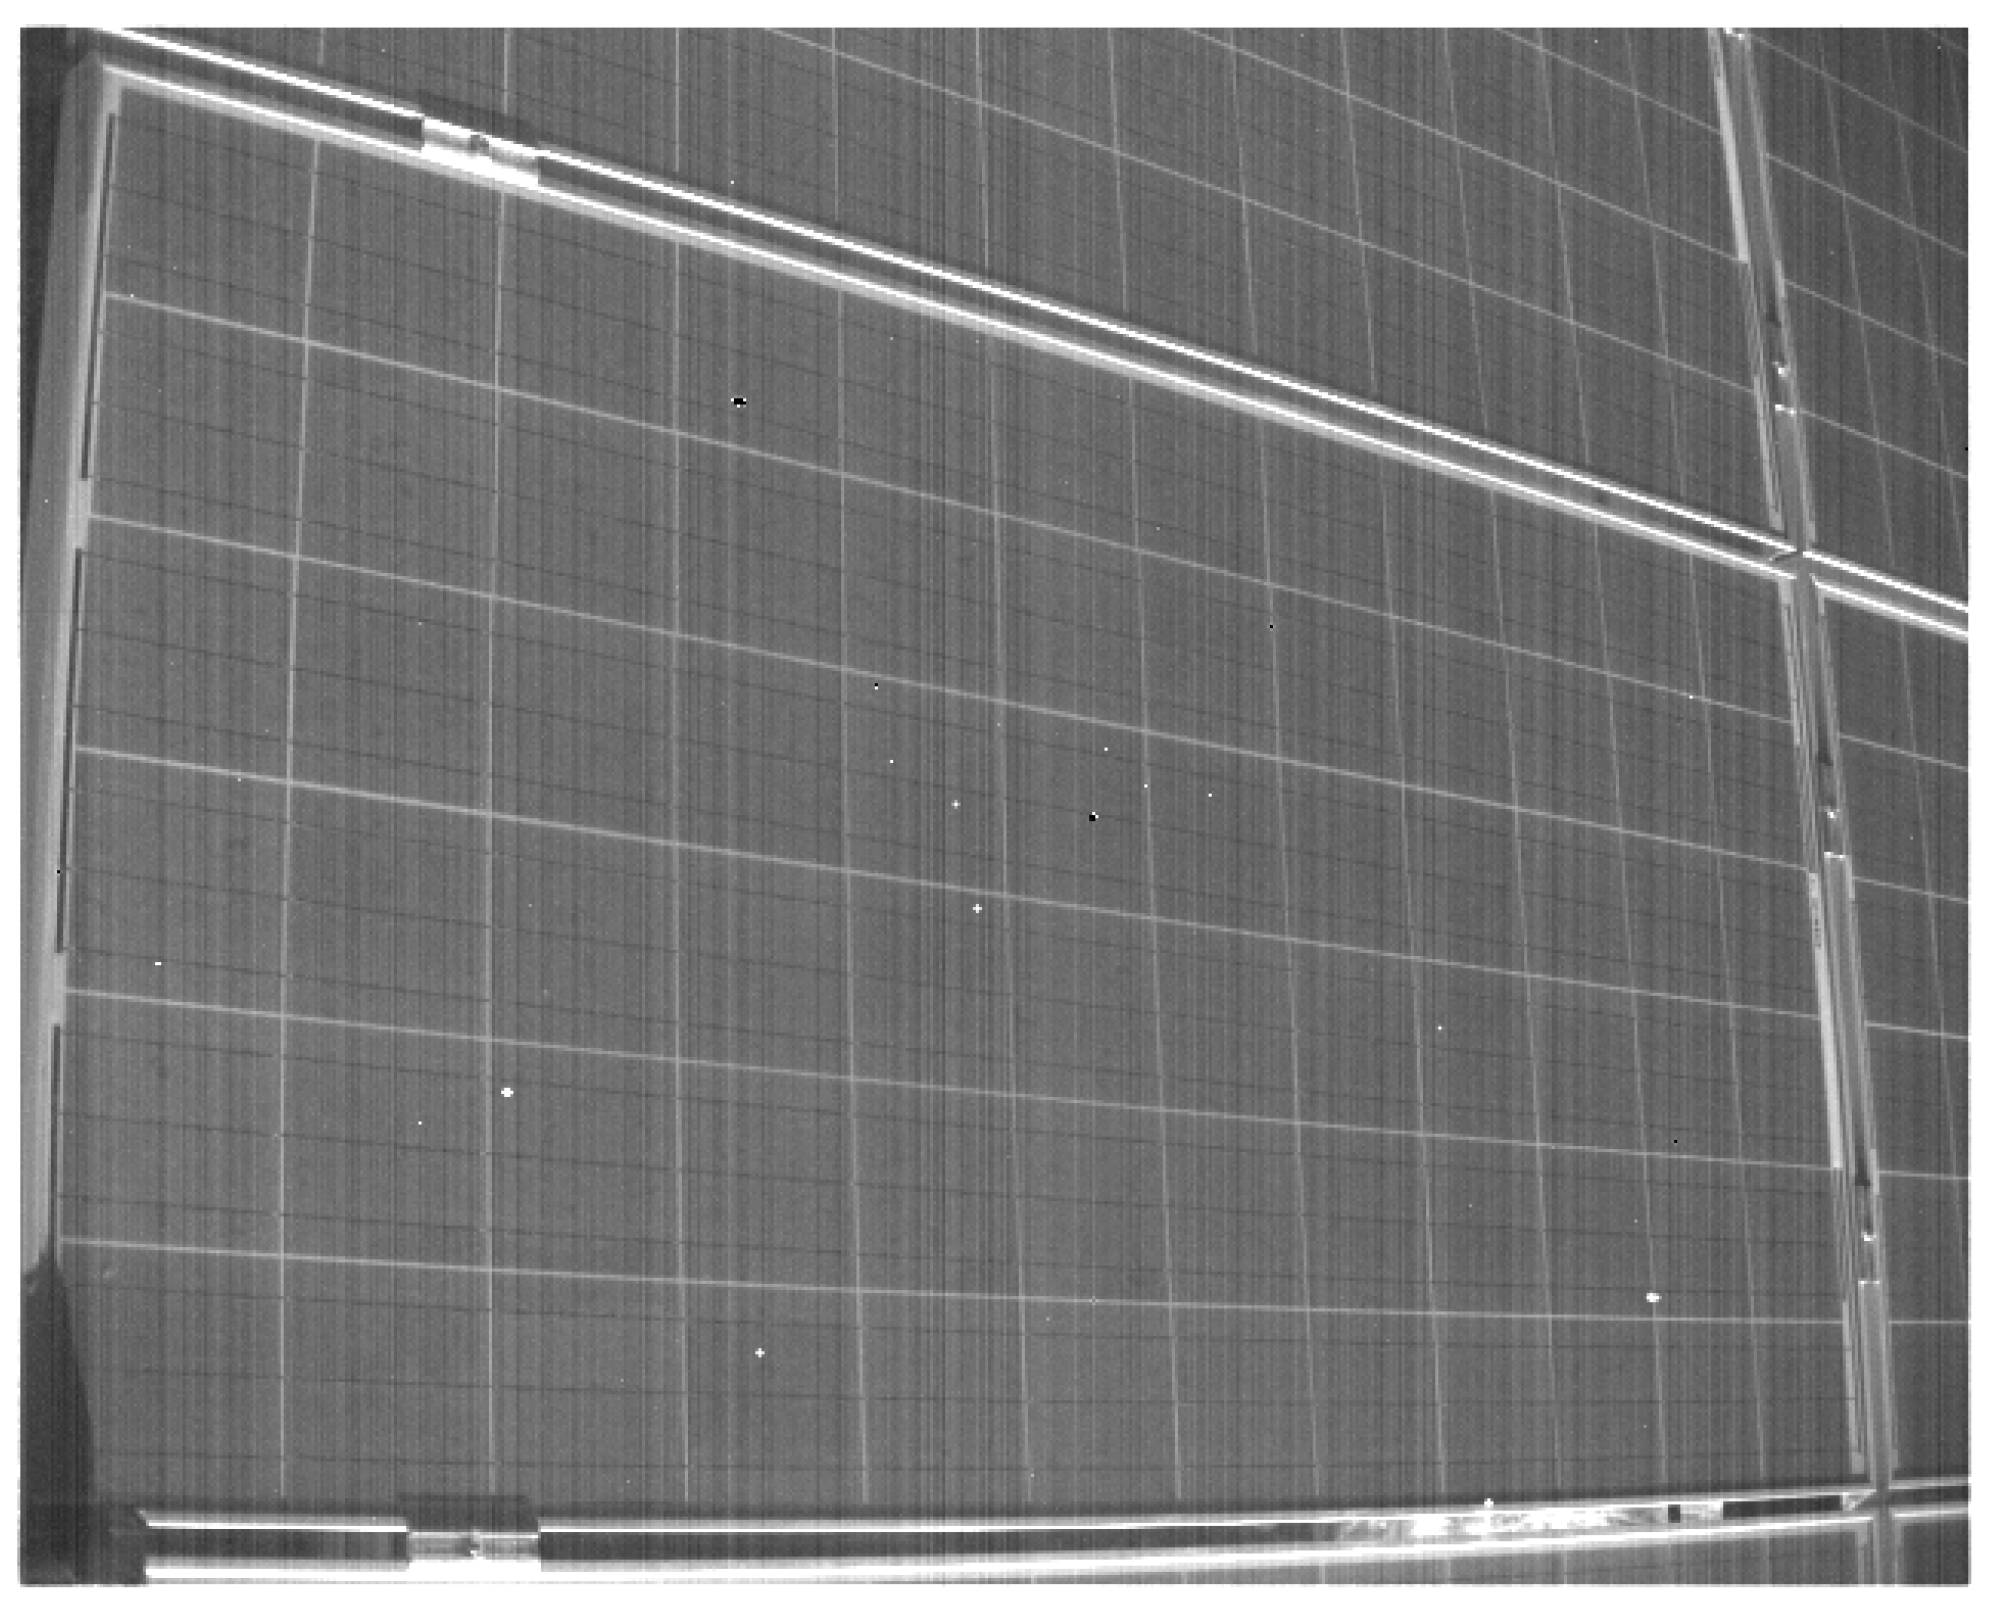
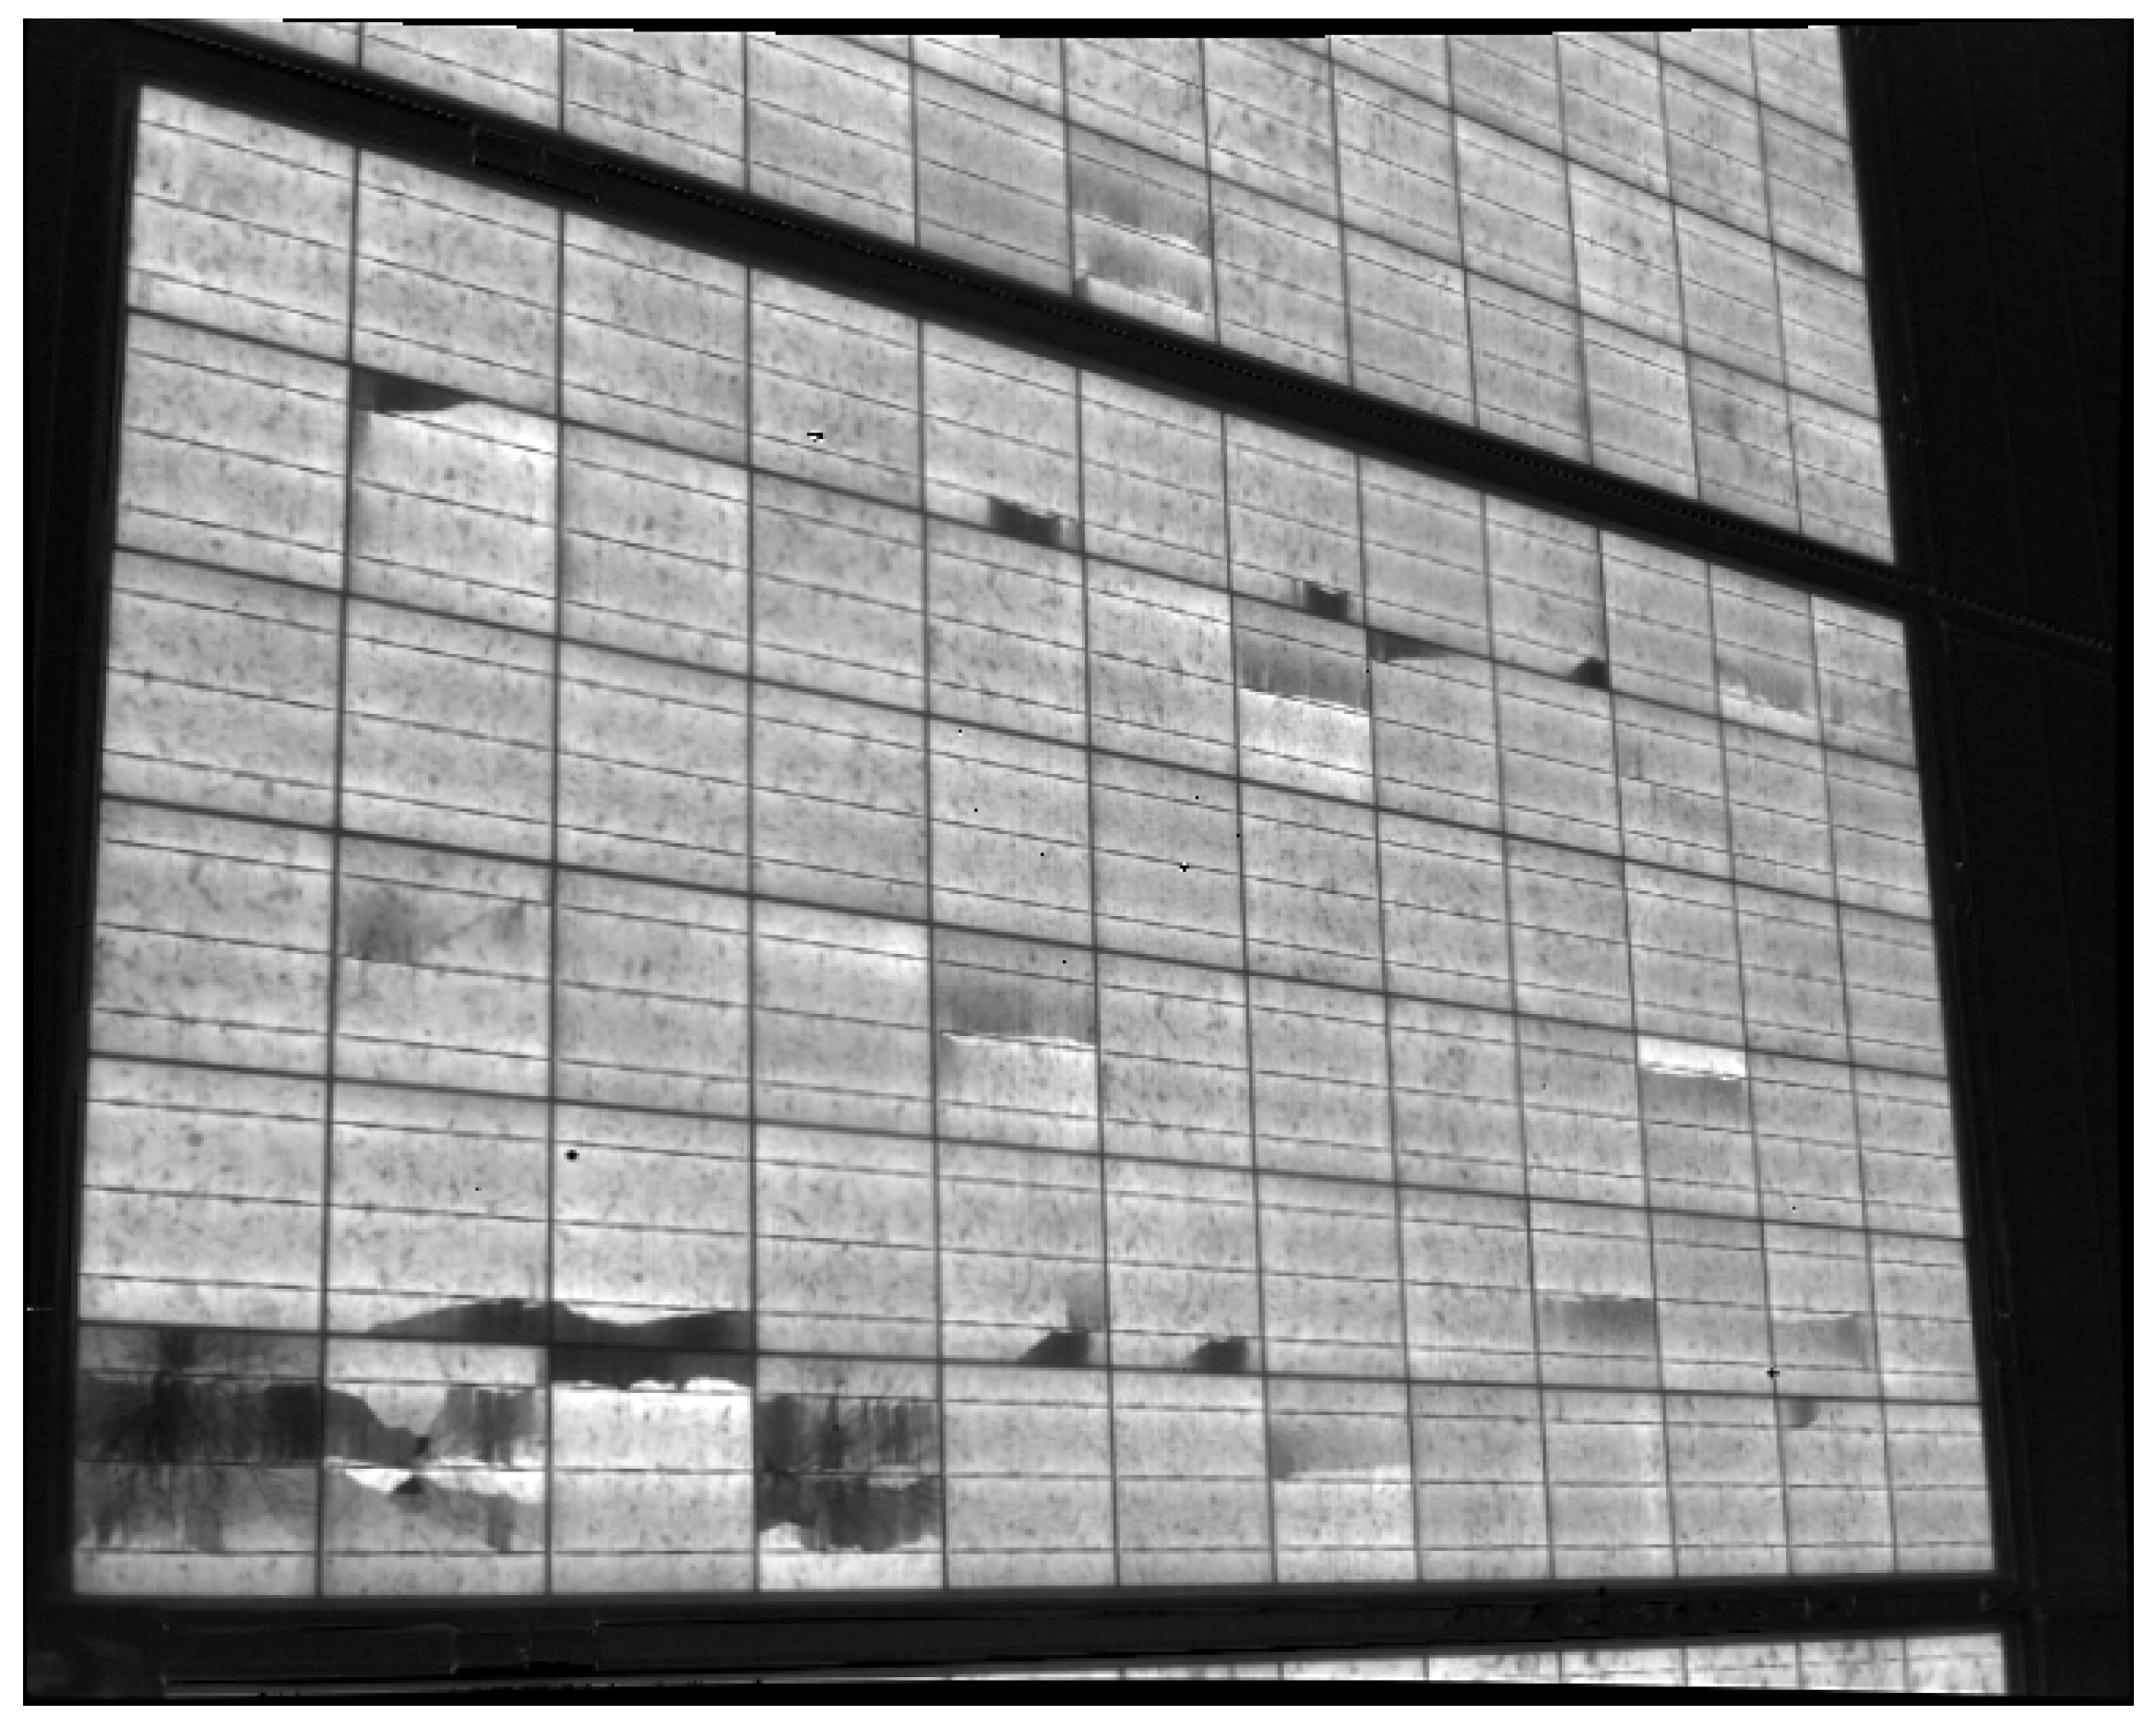
In the following experiments, a dataset of 997 EL measurement images of PV modules is used, that are measured in the field by the Solarzentrum Stuttgart GmbH. Each EL measurement image displays one complete PV module and parts of neighbouring PV modules as can be seen in Figure A1. The EL images in the dataset show different PV modules but from the same manufacturer and PV module type. All images in the sample set are measured with the same objective (focal length f = 25 mm). The system includes a 1,3 MP camera with an InGAs camera sensor and a resolution of (640 × 512) px. The DaySy system provides two outputs as can be seen in Figure A1 and Figure A2. Figure A1 shows a typical DaySy system EL measurement image of a defective multicrystalline silicon PV module with 72 PV cells. Figure A2 shows a photography image of the same scene as Figure A1. Therefore both images are highly affected by the same perspective and lens distortion and both are used as input images for the pattern detection algorithm. In case that the detection of the distorted CGJ pattern in the EL image is not accurate, alternatively the photography image is passed through the same algorithm.
The PV modules in the EL images contain 72 PV cells ( 6 × 12 ) that allow one to extract a pattern of 55 CGJ points ( 5 × 11 ). Any other calibration pattern for the optical system is not available and the optical system is not calibrated in advance.

4.2. Results

Two experiments are performed to evaluate the presented pattern detection algorithm and the distortion correction acc. to Bedrich et al. [12], Zhang et al. [9] and Heikillä [10] for highly perspective and highly lens distorted images.

4.2.1. Experiment 1—Parameter Estimation Quality Depending on the Amount of Image Planes

This experiment investigates the parameter estimation quality of the intrinsic camera parameters f x and f y (focal length camera parameters) and u 0 and v 0 (principal point camera parameters) in Figure 1b) depending on the amount of different PV module planes used for calibration. First, we select manually 20 EL images of PV modules with various orientations from our 997 EL image dataset. These 20 EL images are used as calibration subset. Zhang et al. showed in Ref. [9] that images of the calibration pattern measured from at least three different perspectives are essential to estimate all intrinsic parameters. The parameter estimation from multiple images acc. to Zhang et al. uses a nonlinear optimization as described in detail in Ref. [9].
Each time a parameter estimation is performed from a different random sample set (here 55 CGJ points), the estimated parameter slightly differs from the true parameter of the model. Performing this parameter estimation multiple times leads to a distribution of this estimated parameter. The standard error
S E = σ ^ 2 N
gives a quality criterion for the parameter estimation, where σ ^ 2 = s 2 N N 1 is the estimated variance of the population, calculated from the sample variance s 2 and the correction term with the sample size N Let y ^ be the mean value of the estimated parameter. The relative standard error (RSE)
R S E = S E y ^
is the Standard Error (SE) divided by the estimate y ^ .
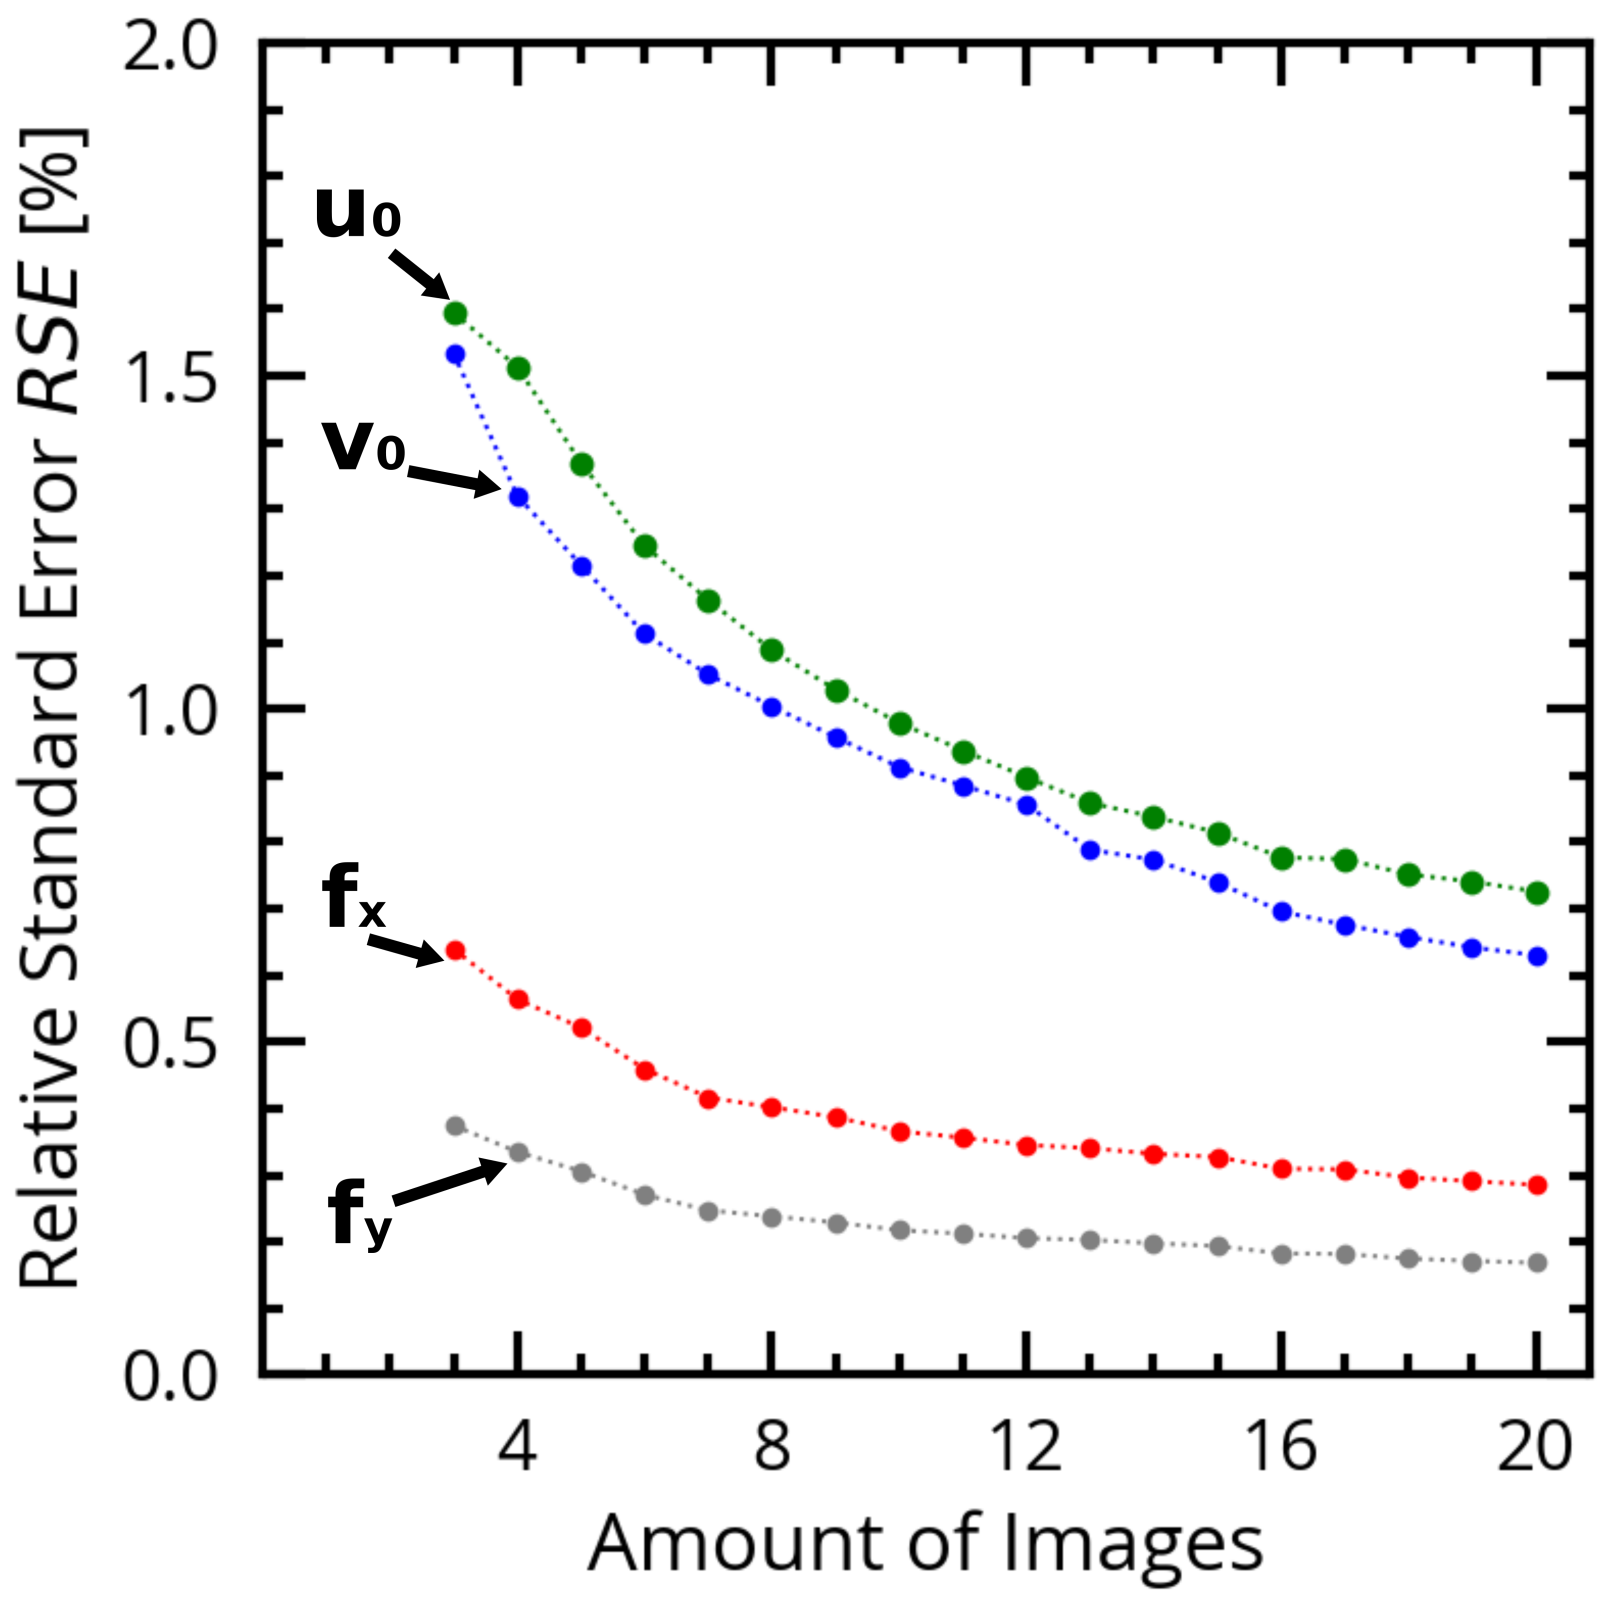
Figure 3 shows the relative standard error (RSE) for the camera parameters ( f x , f y , u 0 , v 0 ) for the n first images in the calibration subset from n = 3 to n = 20 . It is assumed that the pixel of the camera chip are square shaped and thus the pixel skew coefficient c is neglected.
The RSE decreases with the amount of image planes used for the parameter estimation and therefore the approximation becomes more significant. The decreasing RSE is based on the decreasing SE with increasing sample size and decreasing variance. This is similar to the results of Zhang et al. [28]. Just three to four images are sufficient to get a RSE below 2% for all the parameters in Figure 3. With 10 images or more the RSE of the parameters in Figure 3 falls below 1%.
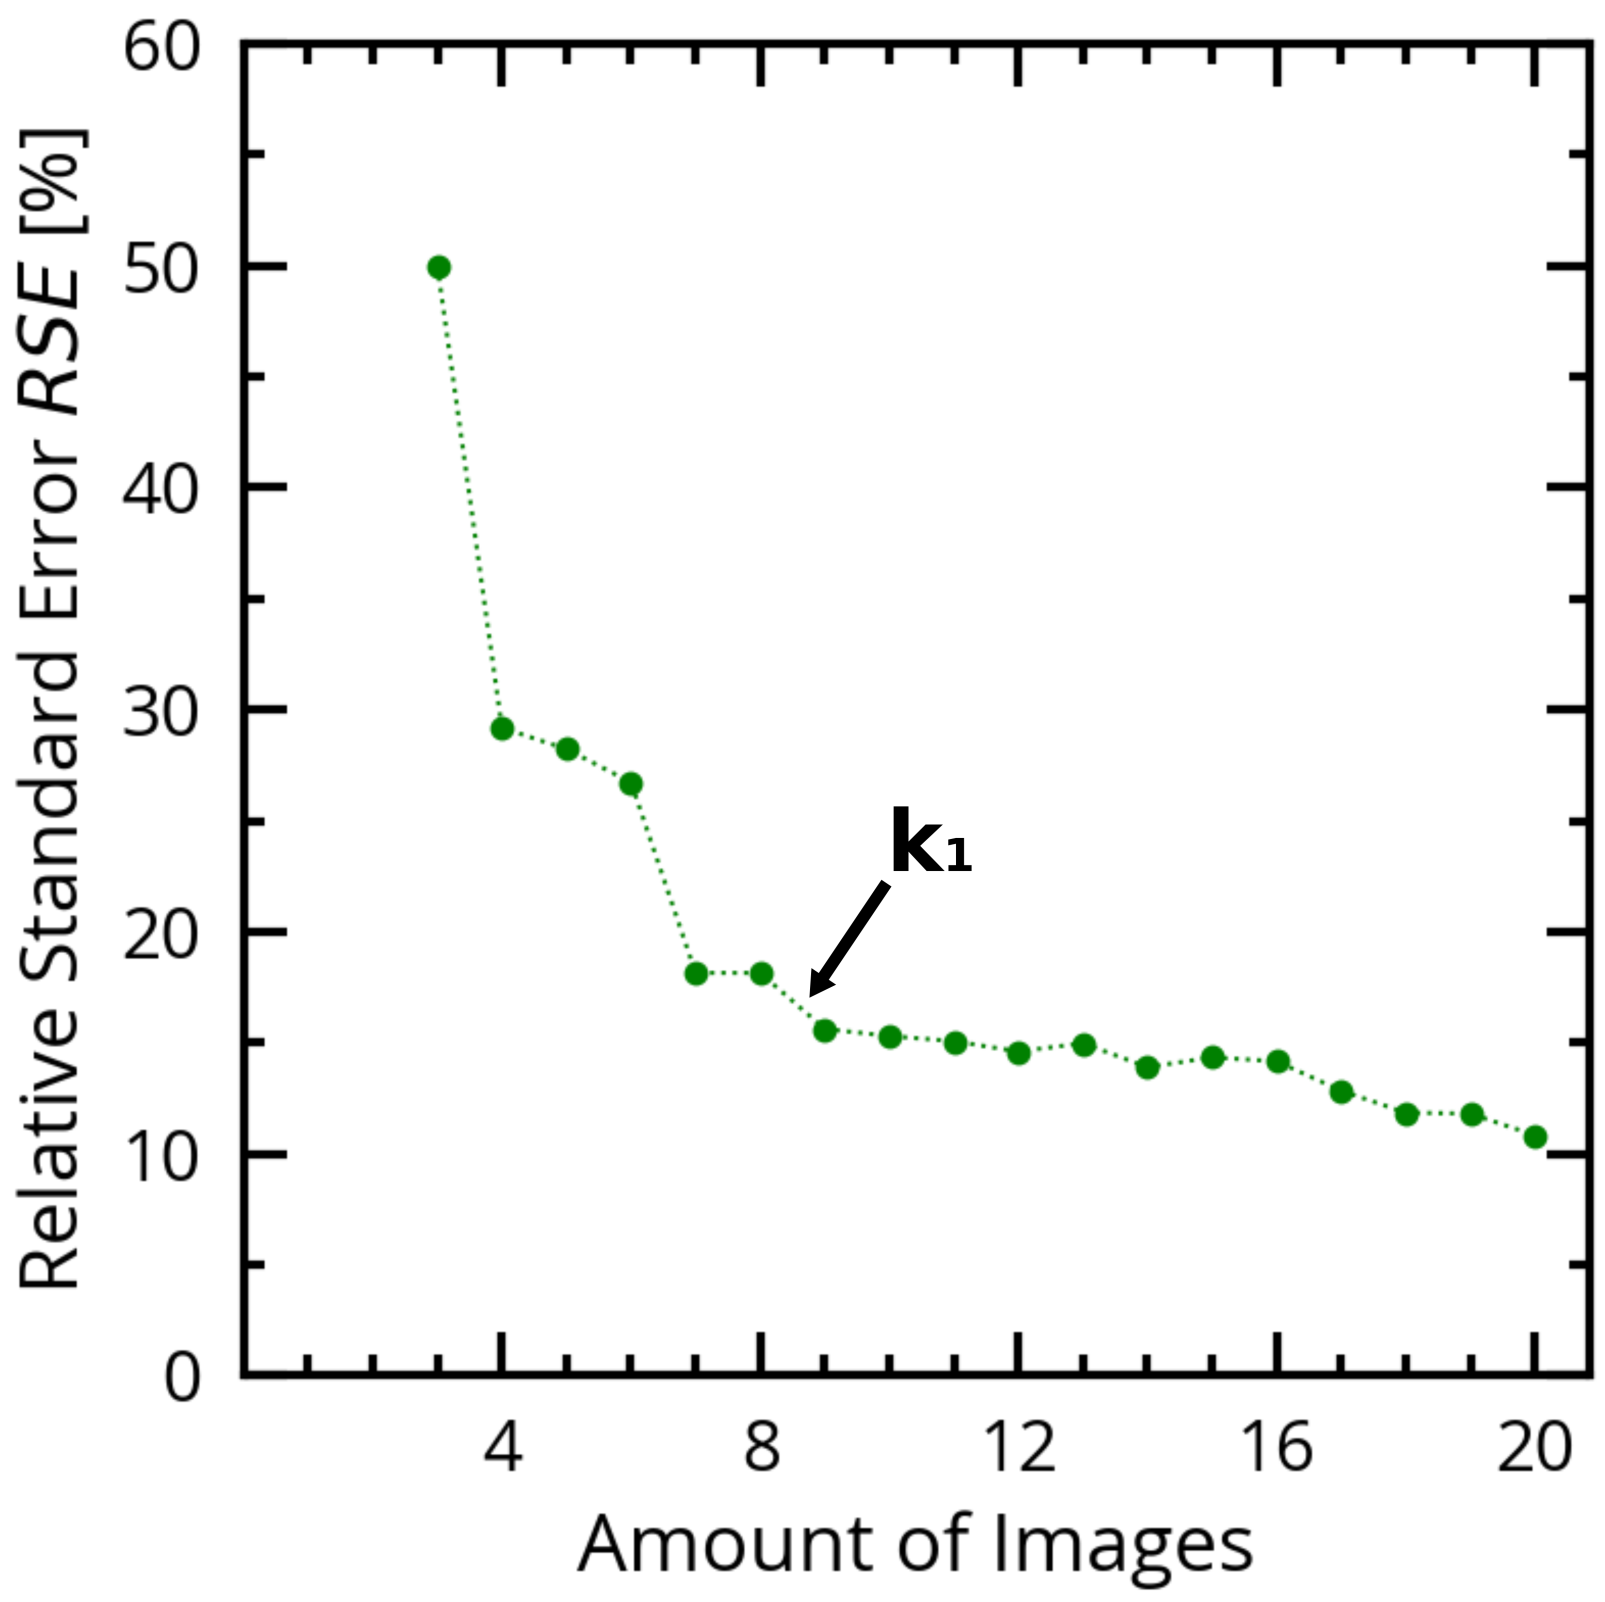
Figure 4 shows the RSE for the radial distortion parameter k 1 for the n first images in the calibration subset from n = 3 to n = 20 .
Similar to Figure 3, the RSE decreases with the number of image planes used for the parameter estimation. At least seven images should be used for this calibration subset to get a reliable RSE below 20%. With all 20 calibration images in the subset, a RSE 10.8% is achieved for the radial distortion parameter k 1 .
The result of this experiment is highly dependent on the manually selected EL images especially the different PV module plane angles and the different formats of the PV module in the EL image. In an automated self-calibration preprocessing of EL images for field and industry application it is useful to not choose the calibration images manually. In this case, a proper solution is to random select the calibration image subset out of the complete dataset.

4.2.2. Experiment 2—Calibration Quality for Large On-Field Datasets

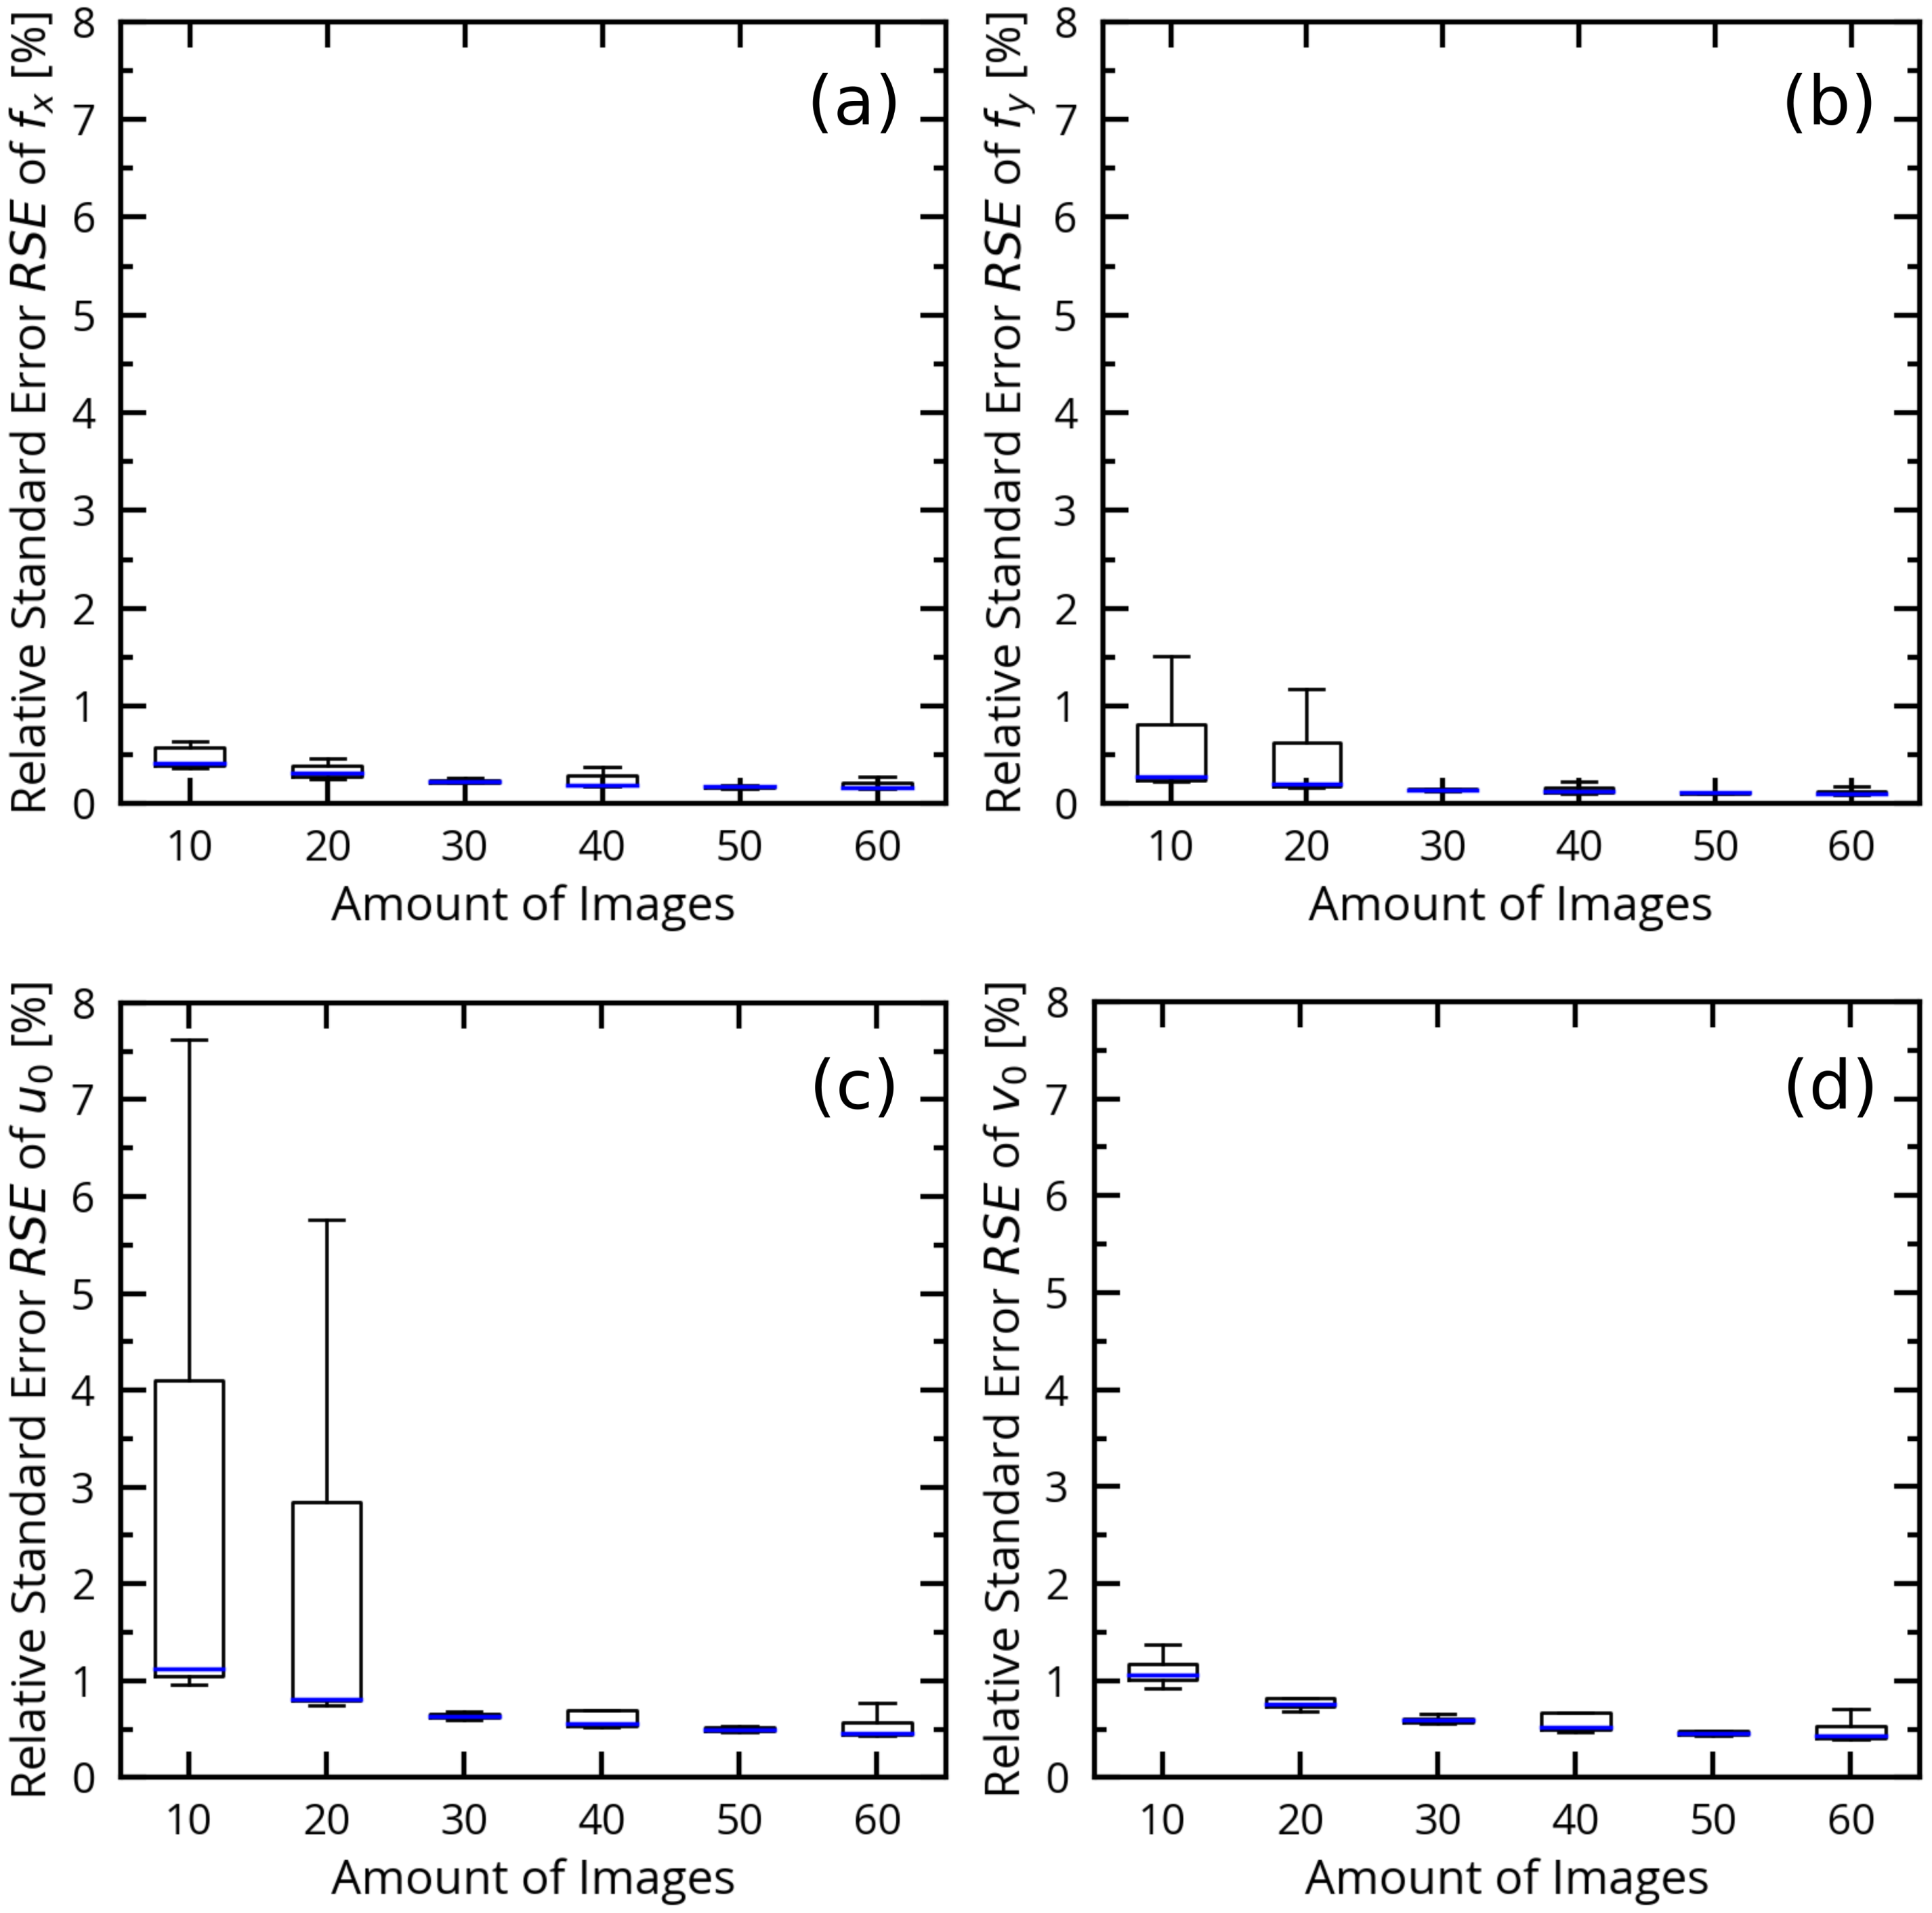
This experiment investigates the application of the pattern detection and camera calibration of Figure 1 and Figure 2 for a large dataset of EL images to prove the applicability on a typical EL field measurement service with many EL images. A randomly selected subset of calibration images is used to perform pattern detection and camera calibration. For the dataset in this work, 20 calibration rounds with different amounts of random selected calibration images are performed. Figure 5 shows the statistical distribution of the RSE after 20 rounds.
The random selection of just a few calibration images leads to a high variation of the standard error of the camera parameter estimation. This is due to a low variation in the perspectives of the PV module planes in this EL image dataset. Nevertheless, a small set of 10 images is still sufficient to get a reliable RSE smaller than 8% in 19 of 20 rounds for u 0 and smaller than 2% for all rounds for the other parameters. For the dataset in this work, a sample size of 30 randomly selected EL images lead to a relative standard error below 1% for all intrinsic camera parameters f x , f y , u 0 , v 0 , for all 20 calibration rounds.

Quality Evaluation Metric

For the evaluation of the self-calibrating image processing chain, the pattern is detected acc. to Section 3 followed by a distortion correction acc. to Figure 1 introduced by Bedrich et al. [12]. After distortion correction, the CGJ search algorithm is performed again and the image is perspective transformed by knowing the CGJ points. Compared to existing methods, where the four corner points of the PV module are used, we use all CGJ points and thus more reference points for the perspective transformation. More available reference points, e.g., 45 reference points in a 60 cell PV module, also allow more complex geometrical transformations such as polynomial transformations of higher order. As an example, Appendix A shows three images before, after distortion correction and after perspective transformation. After distortion correction and perspective transformation we use the following three control patterns to evaluate the accuracy of the image processing chain:
  • Ideal equidistant grid points, in a undistorted and perspective transformed image—target points (of perspective transformation)
  • CGJ points as detected in the distorted image, undistorted and perspective transformed—source
  • Ground truth CGJ points labeled by an expert in the distortion corrected and perspective transformed image—real location of CGJ after correction
We define the inaccuracy of the distortion correction and perspective correction process by the 2D euclidean distance
d p , q = u q u p 2 + v q v p 2
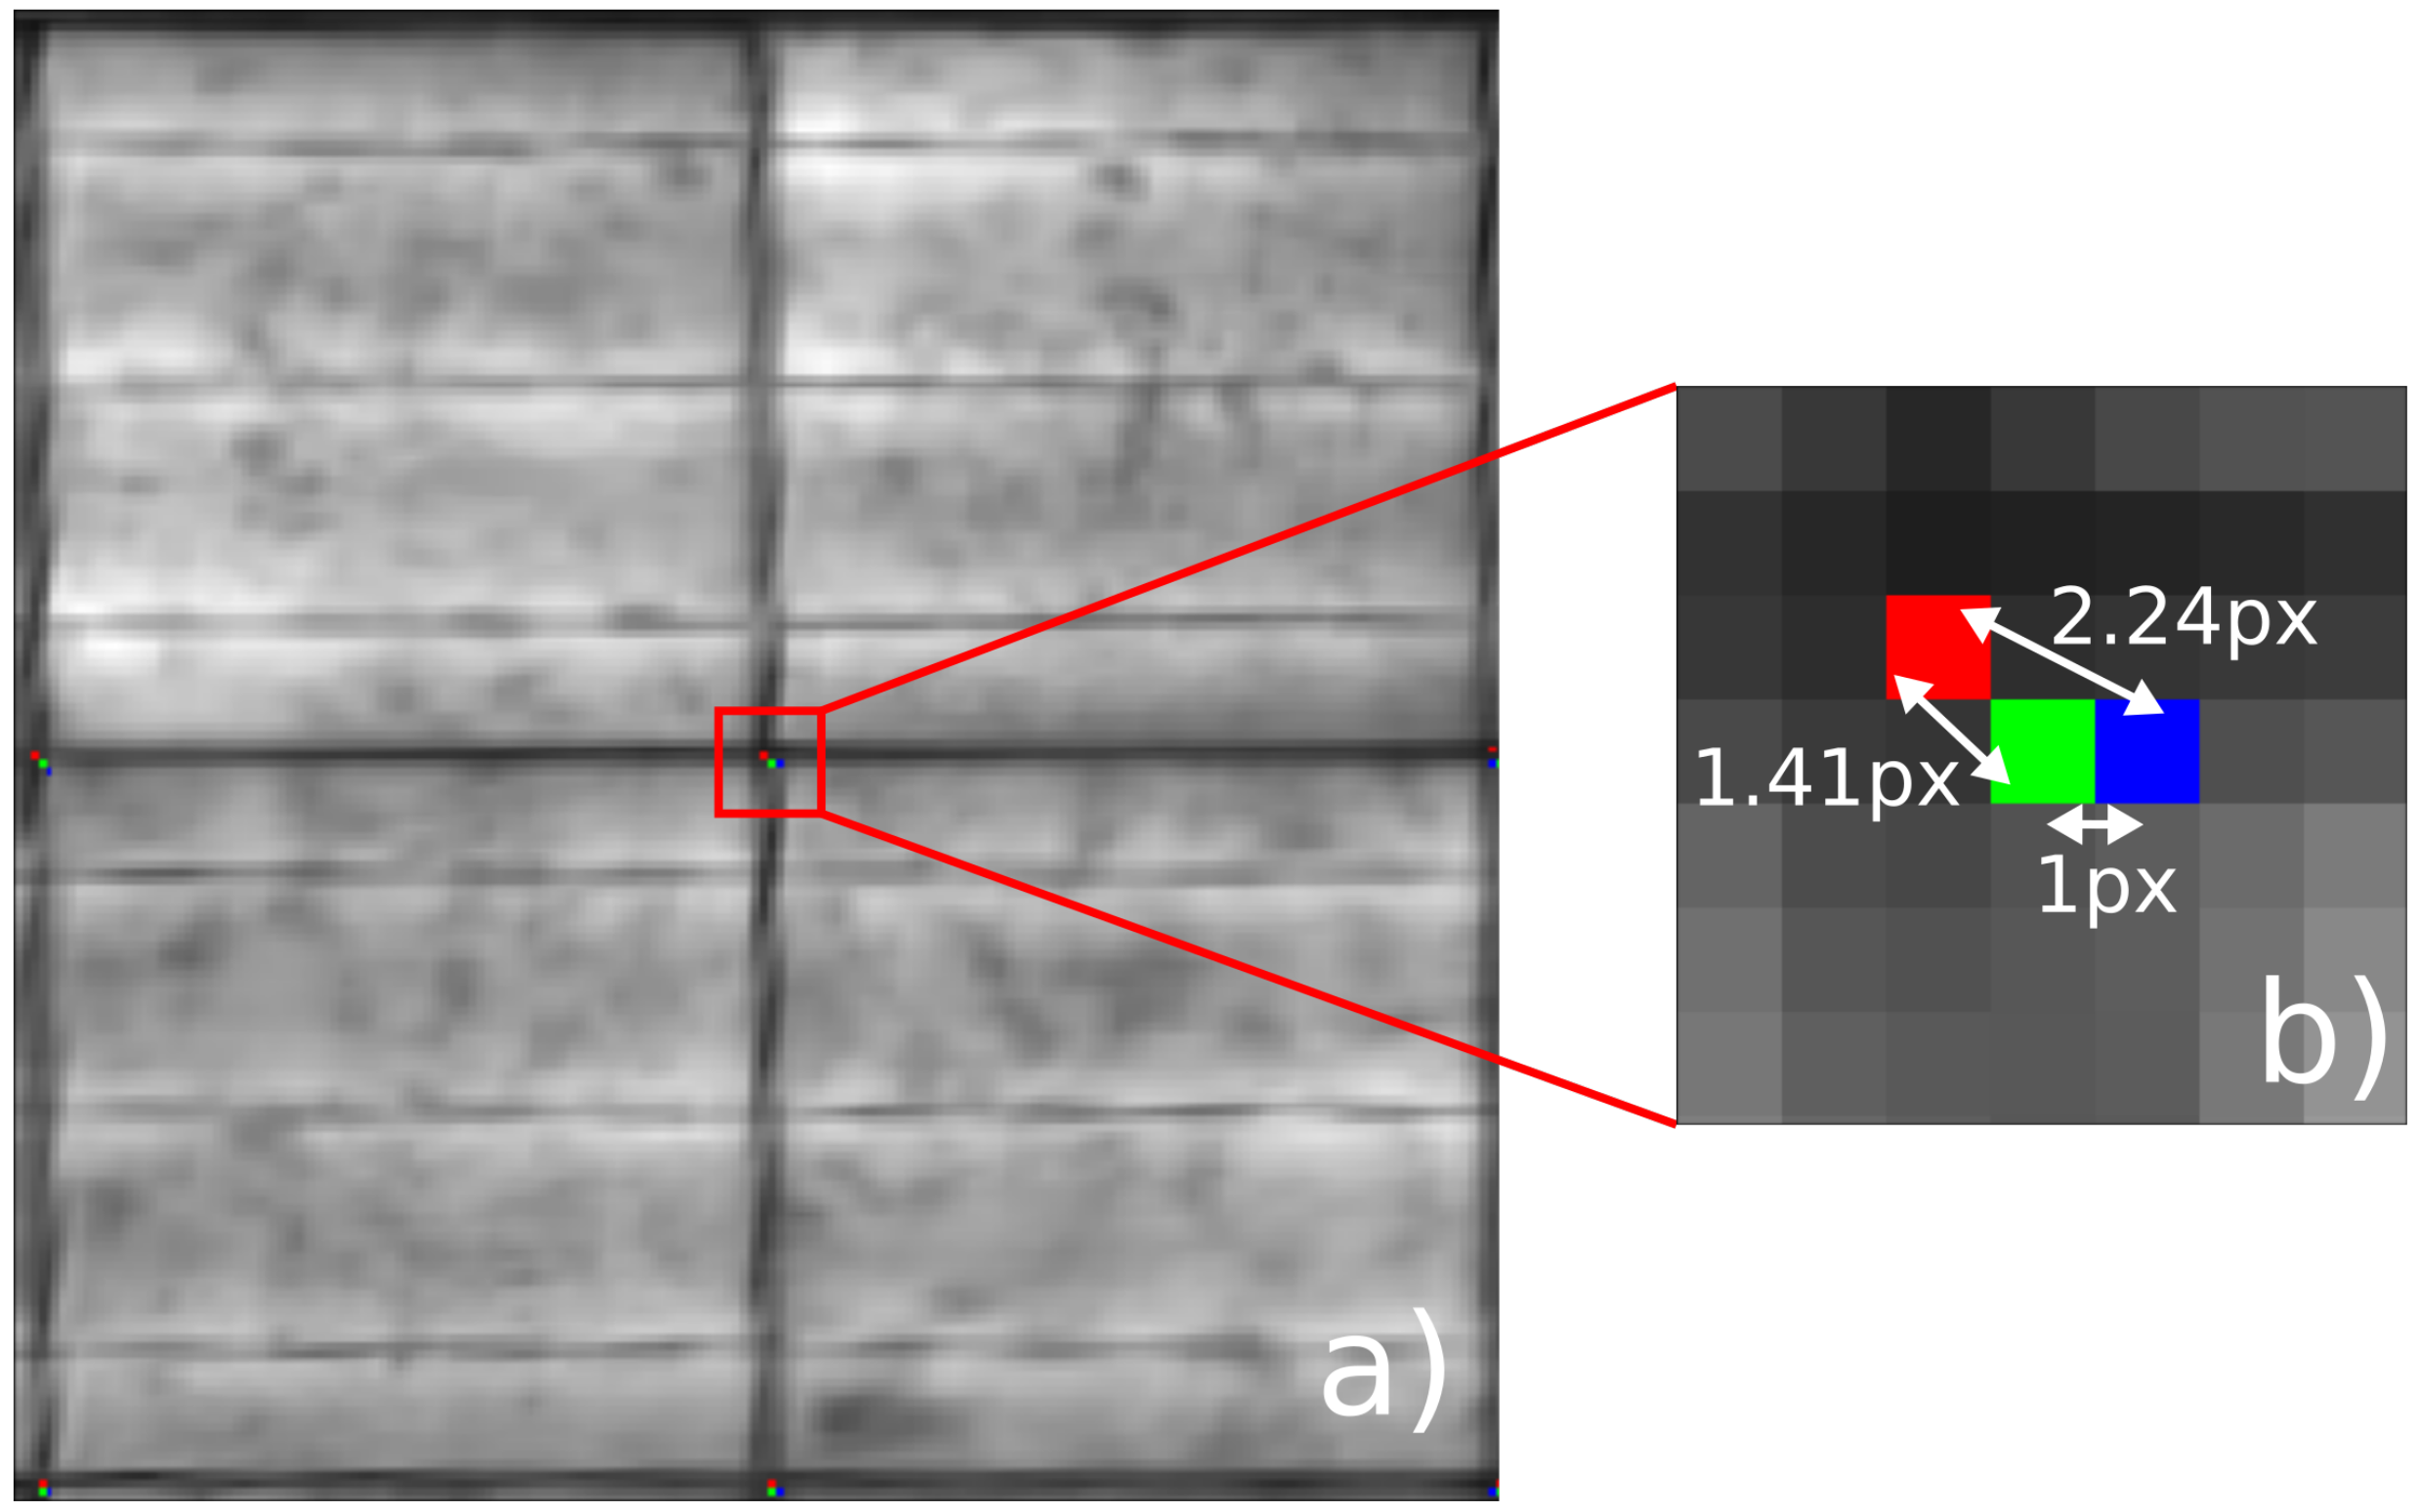
between two corresponding CGJ control points p ( u p , v p ) and q ( u q , v q ) of two different control patterns. A small Euclidean distance between the expert labeled ground truth CGJ points and algorithm detected CGJ points, signifies a successful CGJ pattern recognition algorithm which leads to a good distortion correction. A small Euclidean distance between the expert labeled ground truth CGJ points and the target pattern CGJ points, shows the success of both distortion correction and perspective transformation. A small Euclidean distance between the algorithm detected CGJ points and the target pattern also indicates success of distortion correction since the algorithm detected CGJ points are therefore aligned on straight lines in both the distortion corrected and perspective corrected image. Figure 6 shows an image detail of four cells of a PV module EL image after the preprocessing steps of Figure 1 followed by perspective transformation.
Figure 6 shows that the CGJ control points do not always match exactly because of the residual inaccuracy of the distortion correction and perspective transformation. Nevertheless, Figure 6 indicates that a high accuracy is achieved. A Euclidean distance of 0 px describes an exact match of the control points. A Euclidean distance of 1.41 px describes a deviation of 1 px in each direction (u and v). A Euclidean distance of 2.89 px describes a deviation of 2 px in each direction (u and v).

Self Calibration Quality

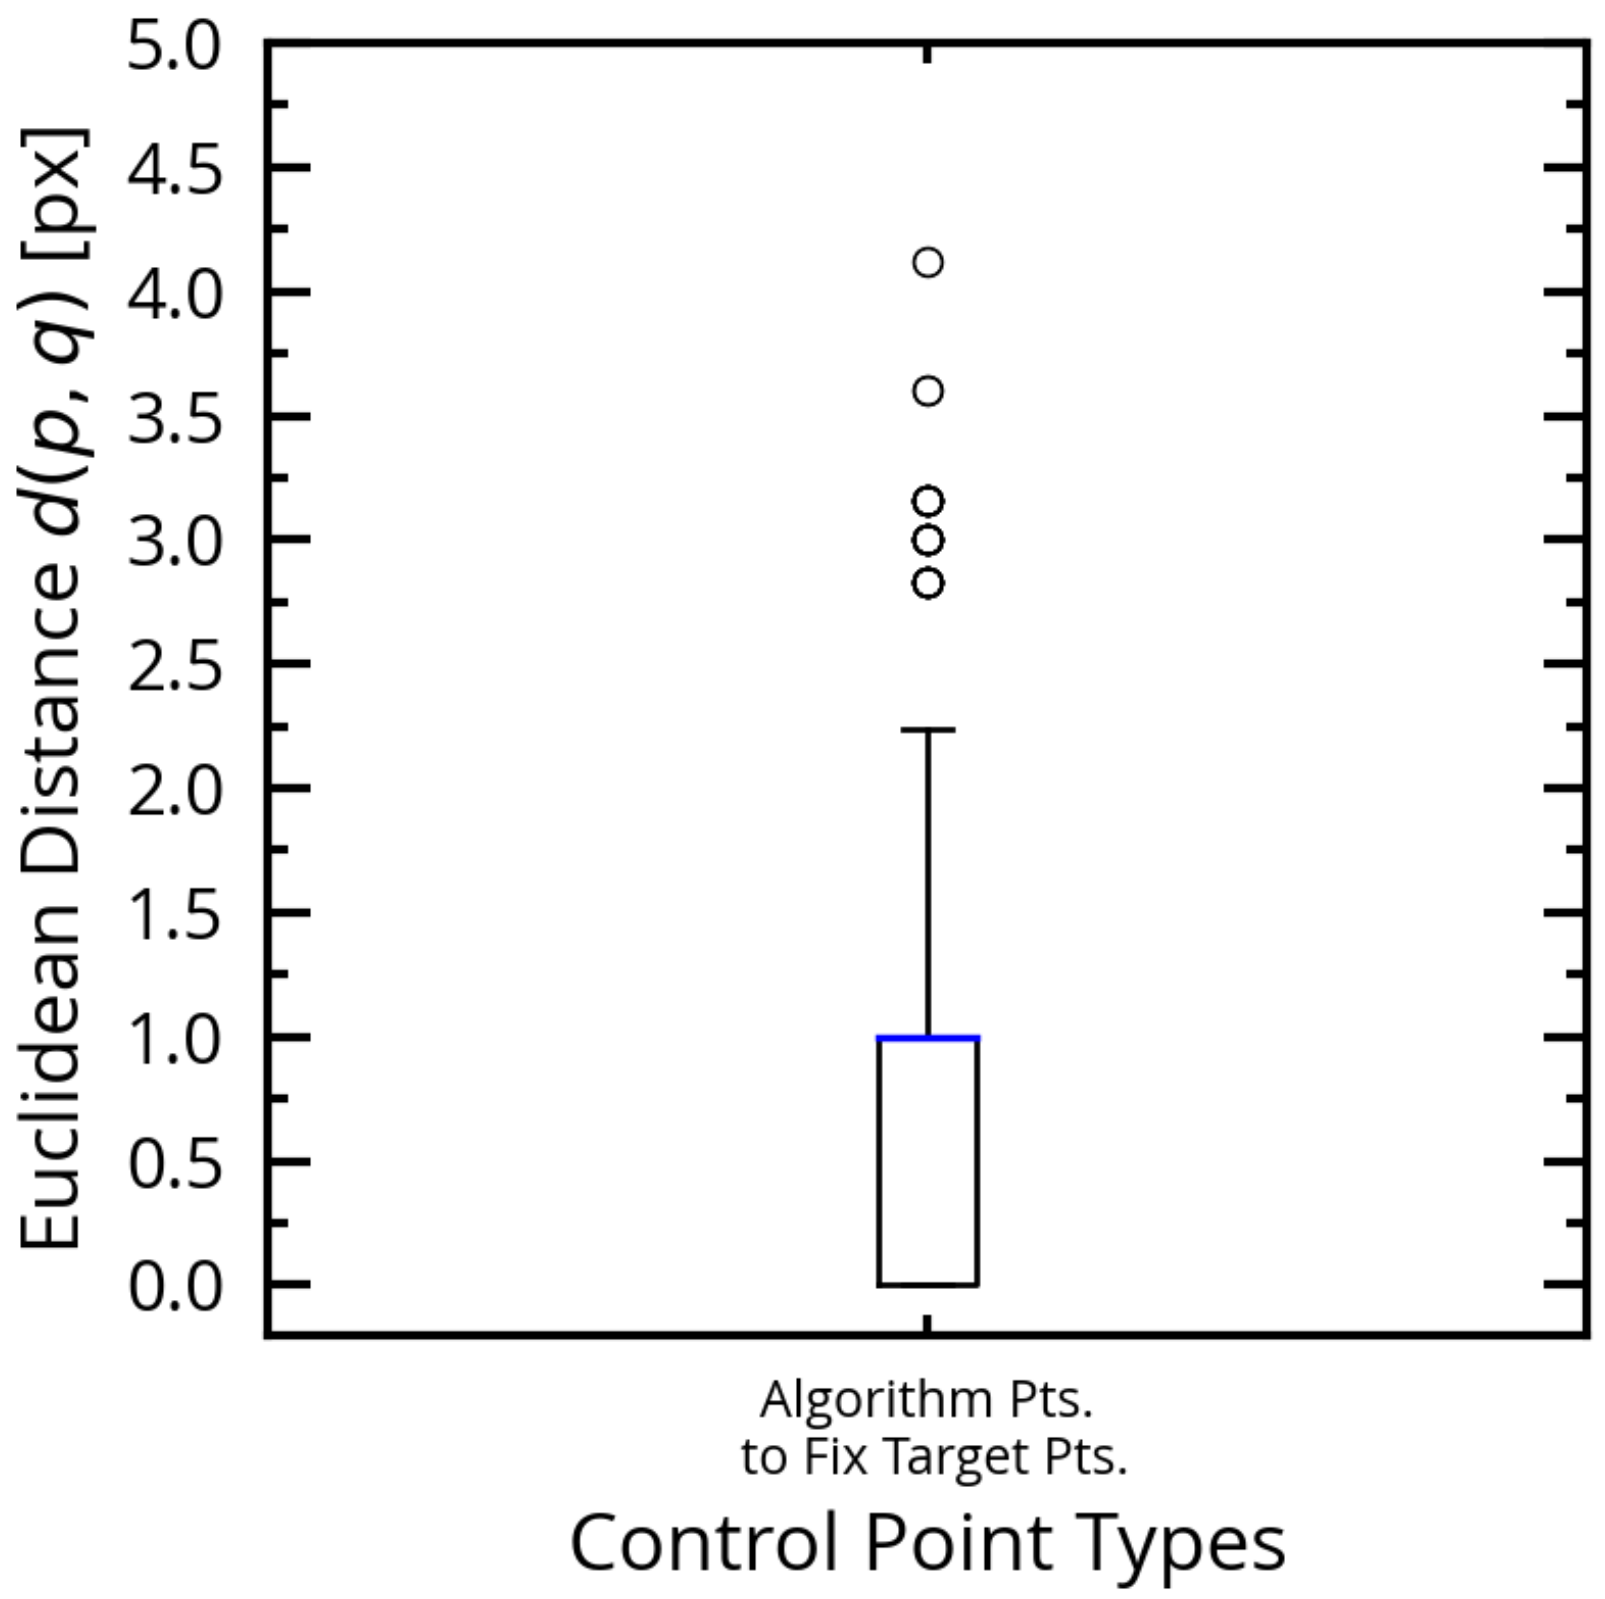
This experiment shows the statistical distribution of the Euclidean distances between the algorithm found control points and target pattern points for the f = 25 mm objective in the dataset. The statistical data consists of 997 EL images of 997 different PV modules (72 cells each) (see Figure A1) which results in 54,835 algorithm detected control points. For each algorithm detected control point, the Euclidean distance to the corresponding target pattern point is calculated by Equation (16). Figure 7 shows the statistical distribution of the Euclidean distances.
As can be seen in the box plot in Figure 7, 75% of the Euclidean distances are below 1 px difference. In 99% (whisker length) of the cases, the Euclidean distances are below 2.24 px difference, which is less than ±2 px difference between ideal point position and perspective corrected position of the algorithm detected CGJ point in the distortion corrected image.
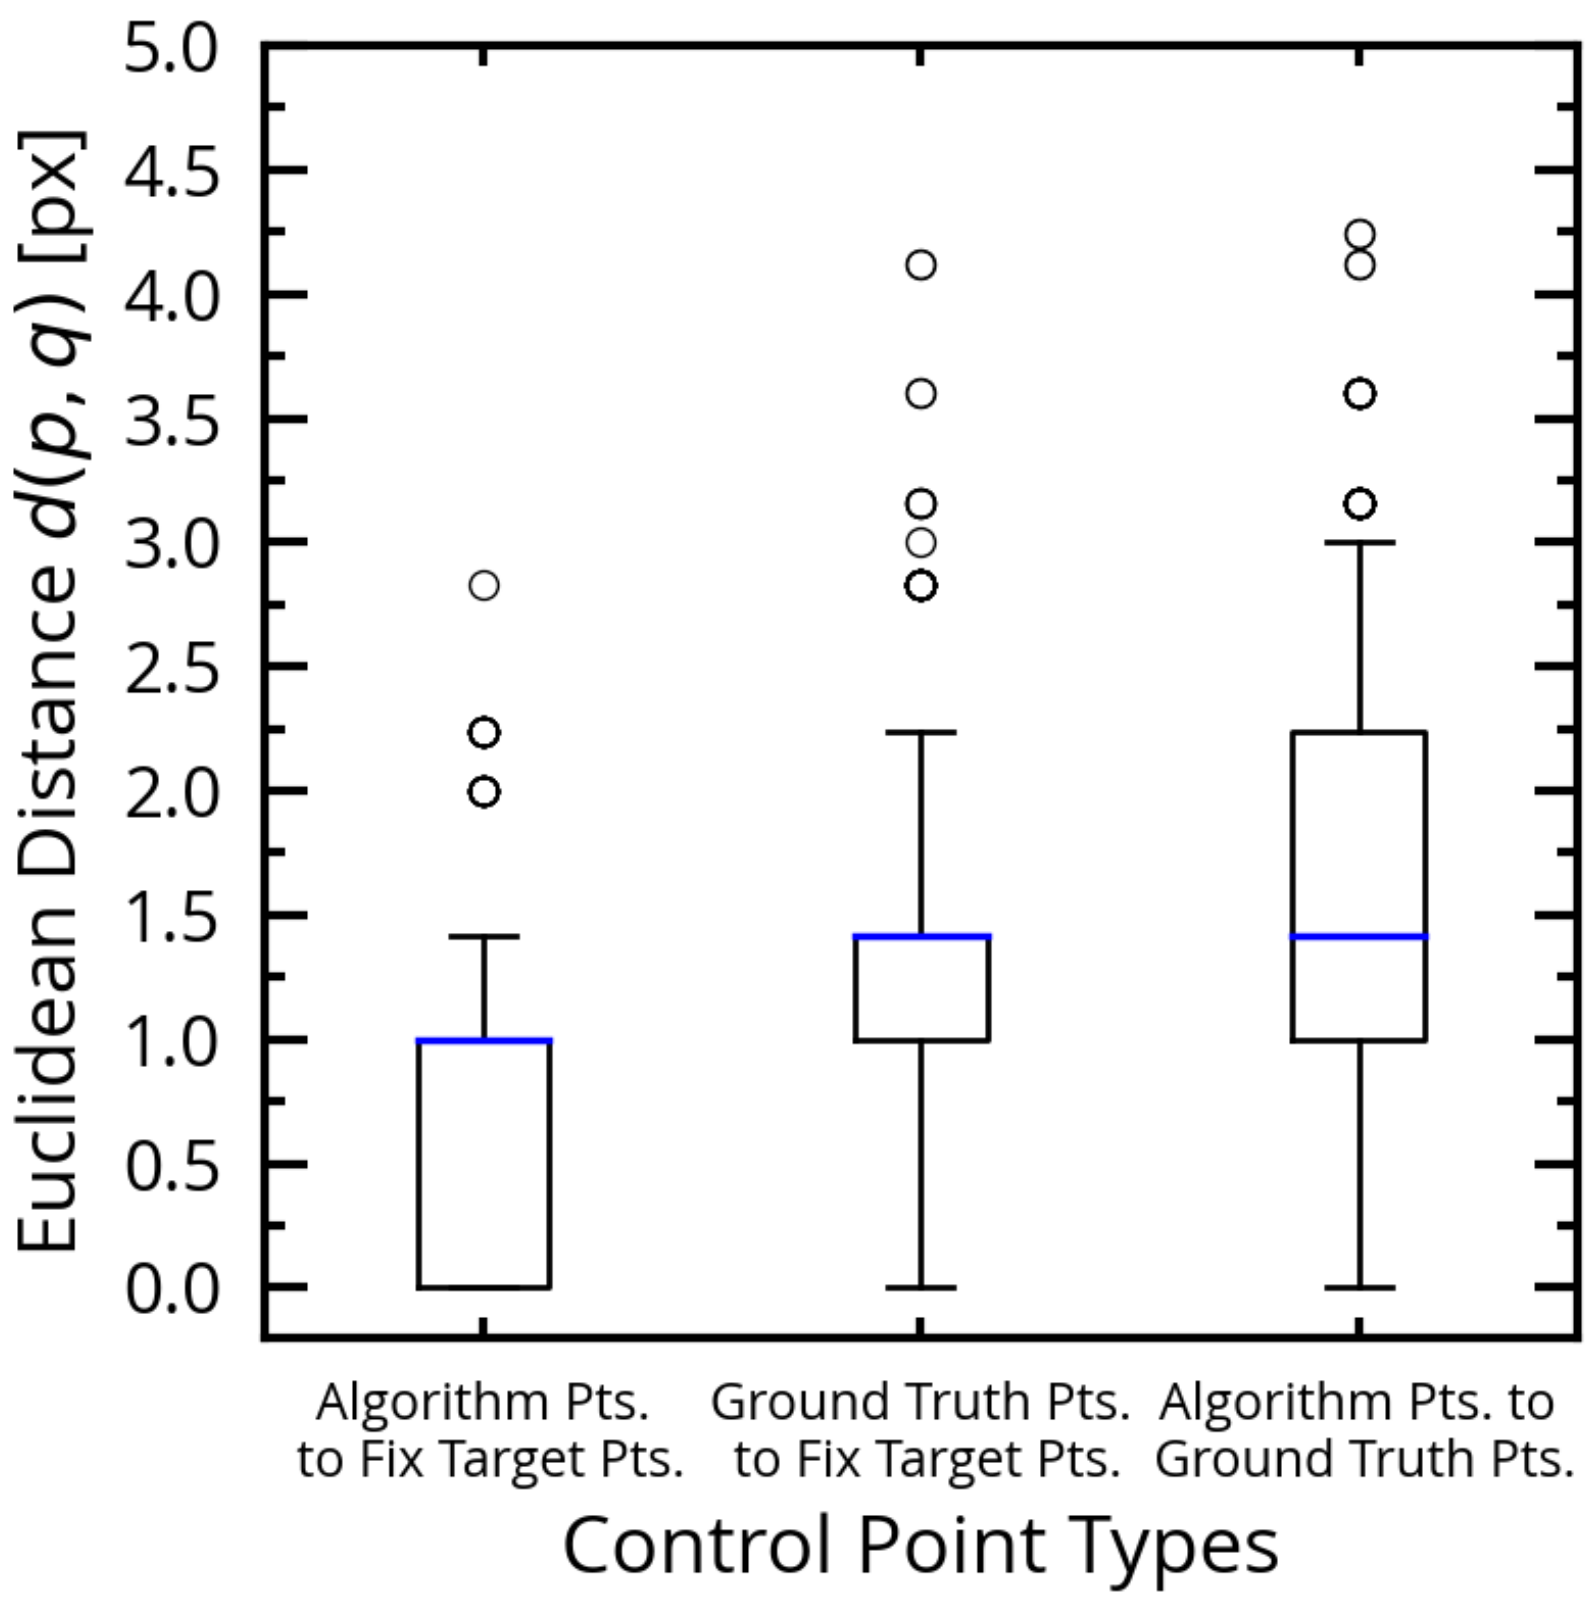
For the evaluation with the ground truth CGJ points the CGJ points in 40 random selected EL images were labeled, which provides 2200 ground truth control points in total. Figure 8 shows the results of the Euclidean distances between all 2200 control points of the ground truth dataset and the corresponding algorithm detected CGJ pattern (after distortion correction and perspective transformation) and the ideal target pattern points. A comparison of the Euclidean distances between the algorithm detected CGJ points and the ideal target pattern points in Figure 8 with the results in Figure 7 for the whole dataset (54,835 control points) shows that the results are very similar. This allows the conclusion that the results for the 2200 control points (40 ground truth images) are statistically significant for the whole dataset.
The Euclidean distances between the algorithm detected control points (after distortion correction and perspective transformation) and the ground truth control points in Figure 8 show a larger displacement than the distances of the algorithm detected CGJ points and the ideal fix grid control points. The exact position (Euclidean distance below 1 px) is achieved for 25% of the control points. Figure 8 shows 50% of the Euclidean distances are below 1.41 px and 75% below 2.24 px. Almost all control points distances (99%) are below 3.16 px, which is a deviation of 1 px in one image coordinate direction and 3 px in the other image coordinate direction. The absolute maximum value of the Euclidean distances in this dataset is 4.24 px which represents a deviation of 3 px in both coordinate directions and thus a maximum inaccuracy of 3 px in pattern detection. Looking at the deviation between ground truth pattern and the ideal fix target pattern, 99% of the control points are within a range of less or equal to 2 px, which is represented by the Euclidean distance of 2.82 px.
If we consider, that the cell gaps in this EL images have a width of 4–5 px in the sharp image areas, the results let conclude that the pattern detection and distortion correction is really accurate and precise and we can achieve a almost perfect perspective transformation. Appendix A shows the EL images before and after lens distortion correction and the final output image after perspective correction that is used for further defect impact analysis algorithms.

5. Discussion

The proposed pattern recognition algorithm and the calibration chain excellently works with highly distorted low resolution EL images of crystalline silicon based PV modules measured under field conditions. No other camera calibration pattern is required. A high accuracy and precision for the camera parameter estimation is achieved and a generalization for a randomly selected calibration subset is possible. A premise for the algorithm is the knowledge of the cell geometry in the PV module that is measured. It is also a prerequisite, that the PV module under test shows a detectable regular cell gap pattern with cell gap joints. The proposed algorithm is not applicable for standard thin film PV modules, because they show only cell gaps in one module direction and therefore, do not show cell gap joints. PV modules with shingled PV cells are not tested in this work but could possibly lead to an irregular cell gap pattern. Standard half-cut PV cell modules usually show a regular cell gap joint pattern that is detectable but could lead to a more unequal distribution of calibration points (e.g., 5 × 23 ) and thus could cause a higher difference of the relative standard error of the estimated camera parameters when just using EL images of PV module with the similar orientation.
For the random sample dataset in this work, a minimum of 30 calibration images leads to a RSE below 1% for the camera parameter estimation; a high precision is achieved. Using more calibration images results in a more stable camera parameter and distortion coefficient estimation, which is shown in the smaller distribution of the standard error of the estimated parameters in Figure 4 and Figure 5. For a calibration with 30 randomly selected images, a high calibration accuracy of less than ±2 px for 99% of the detected CGJ points compared to the ideal fix grid point position is achieved. All of the 2200 ground truth points labeled by an expert after distortion correction and perspective transformation are within a precision range of ±3 px from the ideal expected target point position, which shows that the camera calibration and perspective transformation are accurate. The algorithm in this work is designed for low resolution real outdoor EL images with a fixed images size of 640 px × 512 px. For other image sizes, the filter kernel sizes as well as the ROI window sizes for the detailed line search should be adjusted. The proposed pattern recognition algorithm and camera calibration chain seems also applicable for on-field photoluminescence images.

6. Conclusions

This work proposes a robust pattern recognition algorithm for detecting cell gap joints in EL images of PV modules. The detected cell gap joints pattern is used as calibration pattern for a camera calibration acc. to Bedrich et al. [12], which is based on the algorithm of Zhang et al. [9] and Heikkilä et al. [10]. For EL images with a resolution of 640 px × 512 px, the pattern recognition algorithm results in a camera calibration of high accuracy and precision of ±2 px difference between ideal point position and perspective corrected position of the algorithm detected CGJ point in the distortion corrected image for 99% of the control points. The more calibration images are used, the more stable is the camera parameter and distortion coefficient estimation. The distortion corrected and perspective transformed EL images of the PV modules are used for further image processing steps such as defect localisation and measurements in PV cells and PV modules, e.g., by machine learning (ML) algorithms. The pattern detection algorithm allows also the extraction of individual PV cells in the image. For cell based ML, this could improve an automated preprocessing of the training data.
For online EL monitoring, e.g., with drones in the future, a calibration of the camera setup is not necessary before starting the measurement. The operator can start to capture EL images under different perspectives. The EL images can be from different PV modules in the PV-Park or from the same module at different angles. The algorithm automatically detects the CGJ pattern and calculates the camera parameters and lens distortion coefficients while the measurement continues. When the desired quality acc. to Section 4.2.2 is achieved, the drone system can store the lens distortion coefficients and then correct the lens distortion in all images without a new estimation. The lens distortion correction with this distortion coefficients is allowed until the camera-objective setup changes. Afterwards the algorithm only has to detect the CGJ pattern in undistorted images and make a simple perspective transformation to display the DUT.
As the CGJ pattern detection algorithm is very fast, easy computable, accurate and works with both on-field EL images and photography images of tilted PV modules, it could be also useful for other drone based applications. From the estimated intrinsic and extrinsic camera parameters of the camera model used in this work, it is not only possible to estimate lens distortion coefficients, it is also possible to determine the location of the camera and the DUT in the 3D space, which could be useful for object tracking, distance measurement to the object under test or orientation measurement as well as for focusing applications. For this “real-time” online applications, the software should be optimized in the future to improve processing performance. In an EL image of a standard crystalline silicon based PV module the detection of the 45 CGJ points in a 60 cell PV module (or 55 CGJ points in a 72 cell PV module) also allows more complex geometrical transformations (e.g., polynomial transformation of higher order) which could lead to a more precise correction that is useful for image registration.

Author Contributions

Conceptualization, methodology, software, P.K., M.F. and A.B.; validation, investigation, P.K.; resources, P.K. and A.B.; visualization, P.K.; writing–original draft preparation, P.K. and A.B. All authors have read and agreed to the published version of the manuscript.

Funding

This research was funded by the German Federal Ministry for Economic Affairs and Energy (BMWi) under contract No. 0324069A.

Data Availability Statement

The EL measurement data provided by the project partner is confidential and therefore not publicly available because of a non-disclosure agreement (NDA).

Acknowledgments

The authors would like to thank Liviu Stoicescu, Michael Reuter and the company Solarzentrum Stuttgart GmbH for providing data for the development and analyzation process and helpful discussions of the results. We would like to thank rer. nat. habil Jürgen Werner and Ing. Bin Yang for the critical review of the paper. We would like to offer our special thanks to Ing. Markus Schubert for supervision, project administration and funding acquisition. We thank Michael Saliba for the support of this research. We would also like to extend our thanks to Matthias Schlecht for setting up the Hard- and Softwareenvironment for large batch processing. We gratefully acknowledge funding by the German Federal Ministry for Economic Affairs and Energy (BMWi) under contract No. 0324069A.

Conflicts of Interest

The authors declare no conflict of interest.

Abbreviations

The following abbreviations are used in this manuscript:
DUTDevice Under Test
ELElectroluminescence
CGJCell Gap Joints
KFKey Figures
MLMachine Learning
PVPhotovoltaic
PIDPotential Induced Degradation
CMOSComplementary Metal-Oxide-Semiconductor
ROIRegion Of Interest
SEStandard Error
RSERelative Standard Error

Appendix A. Images after the Processing Steps
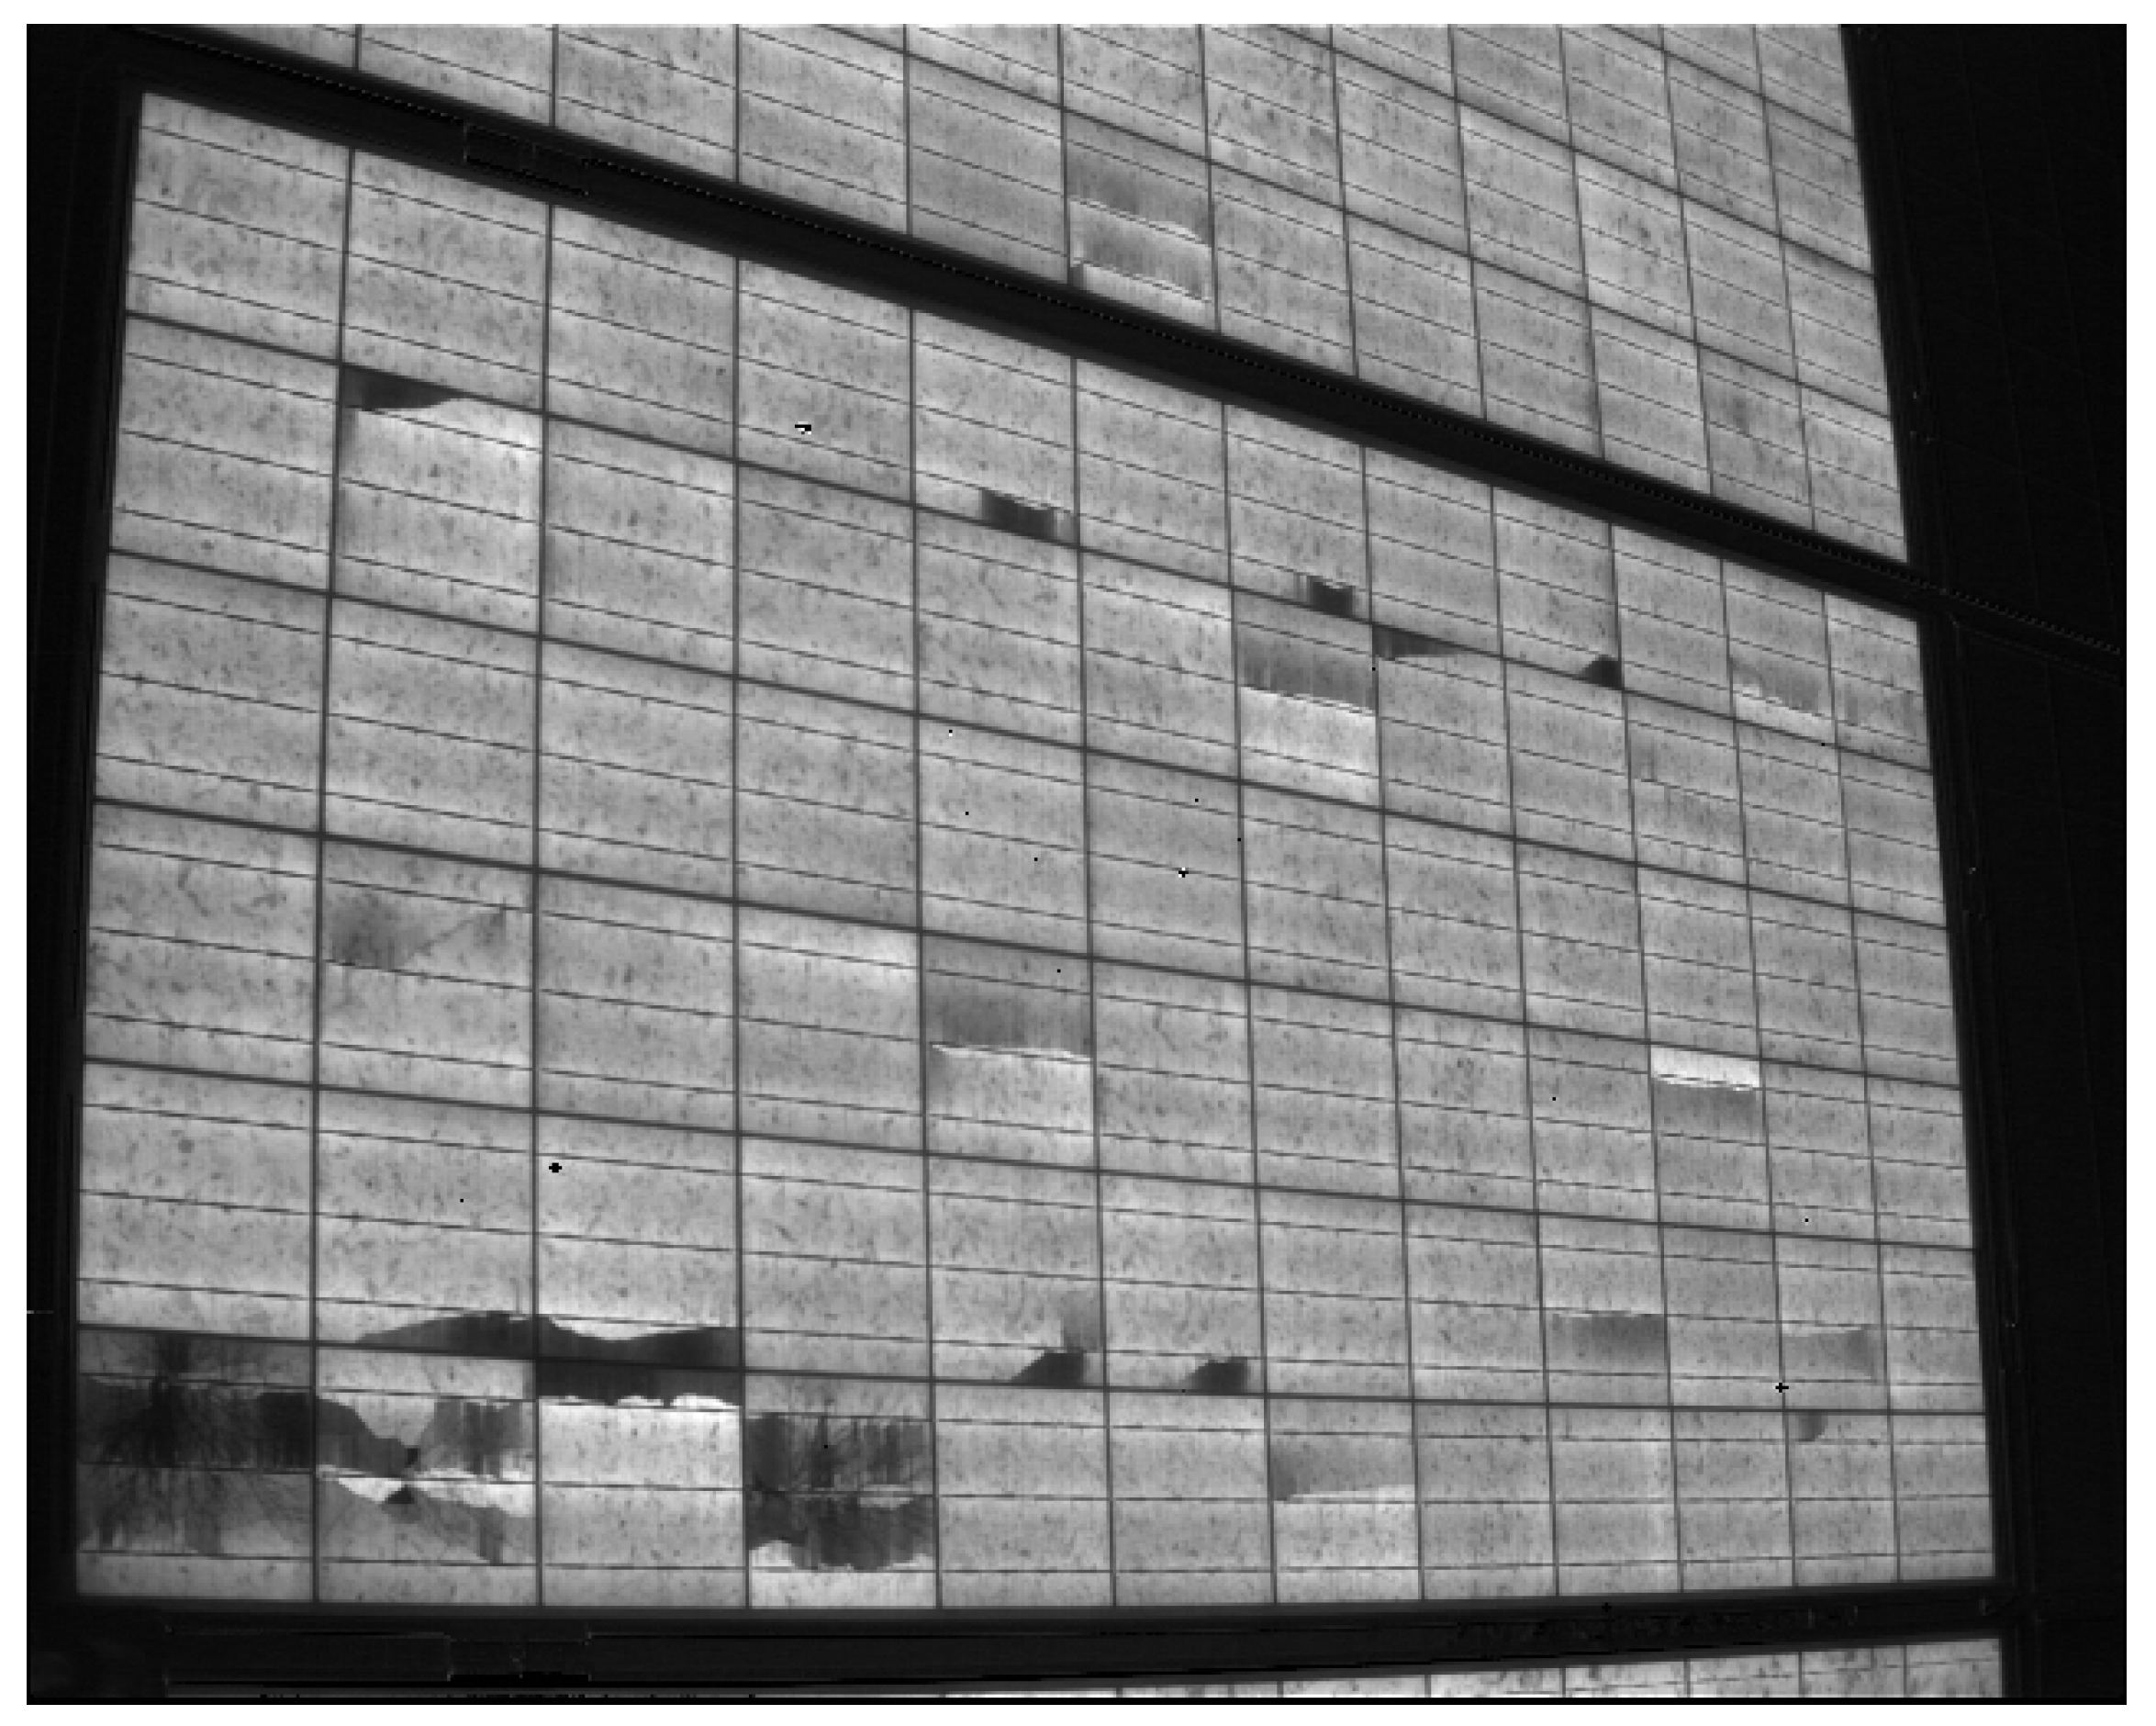
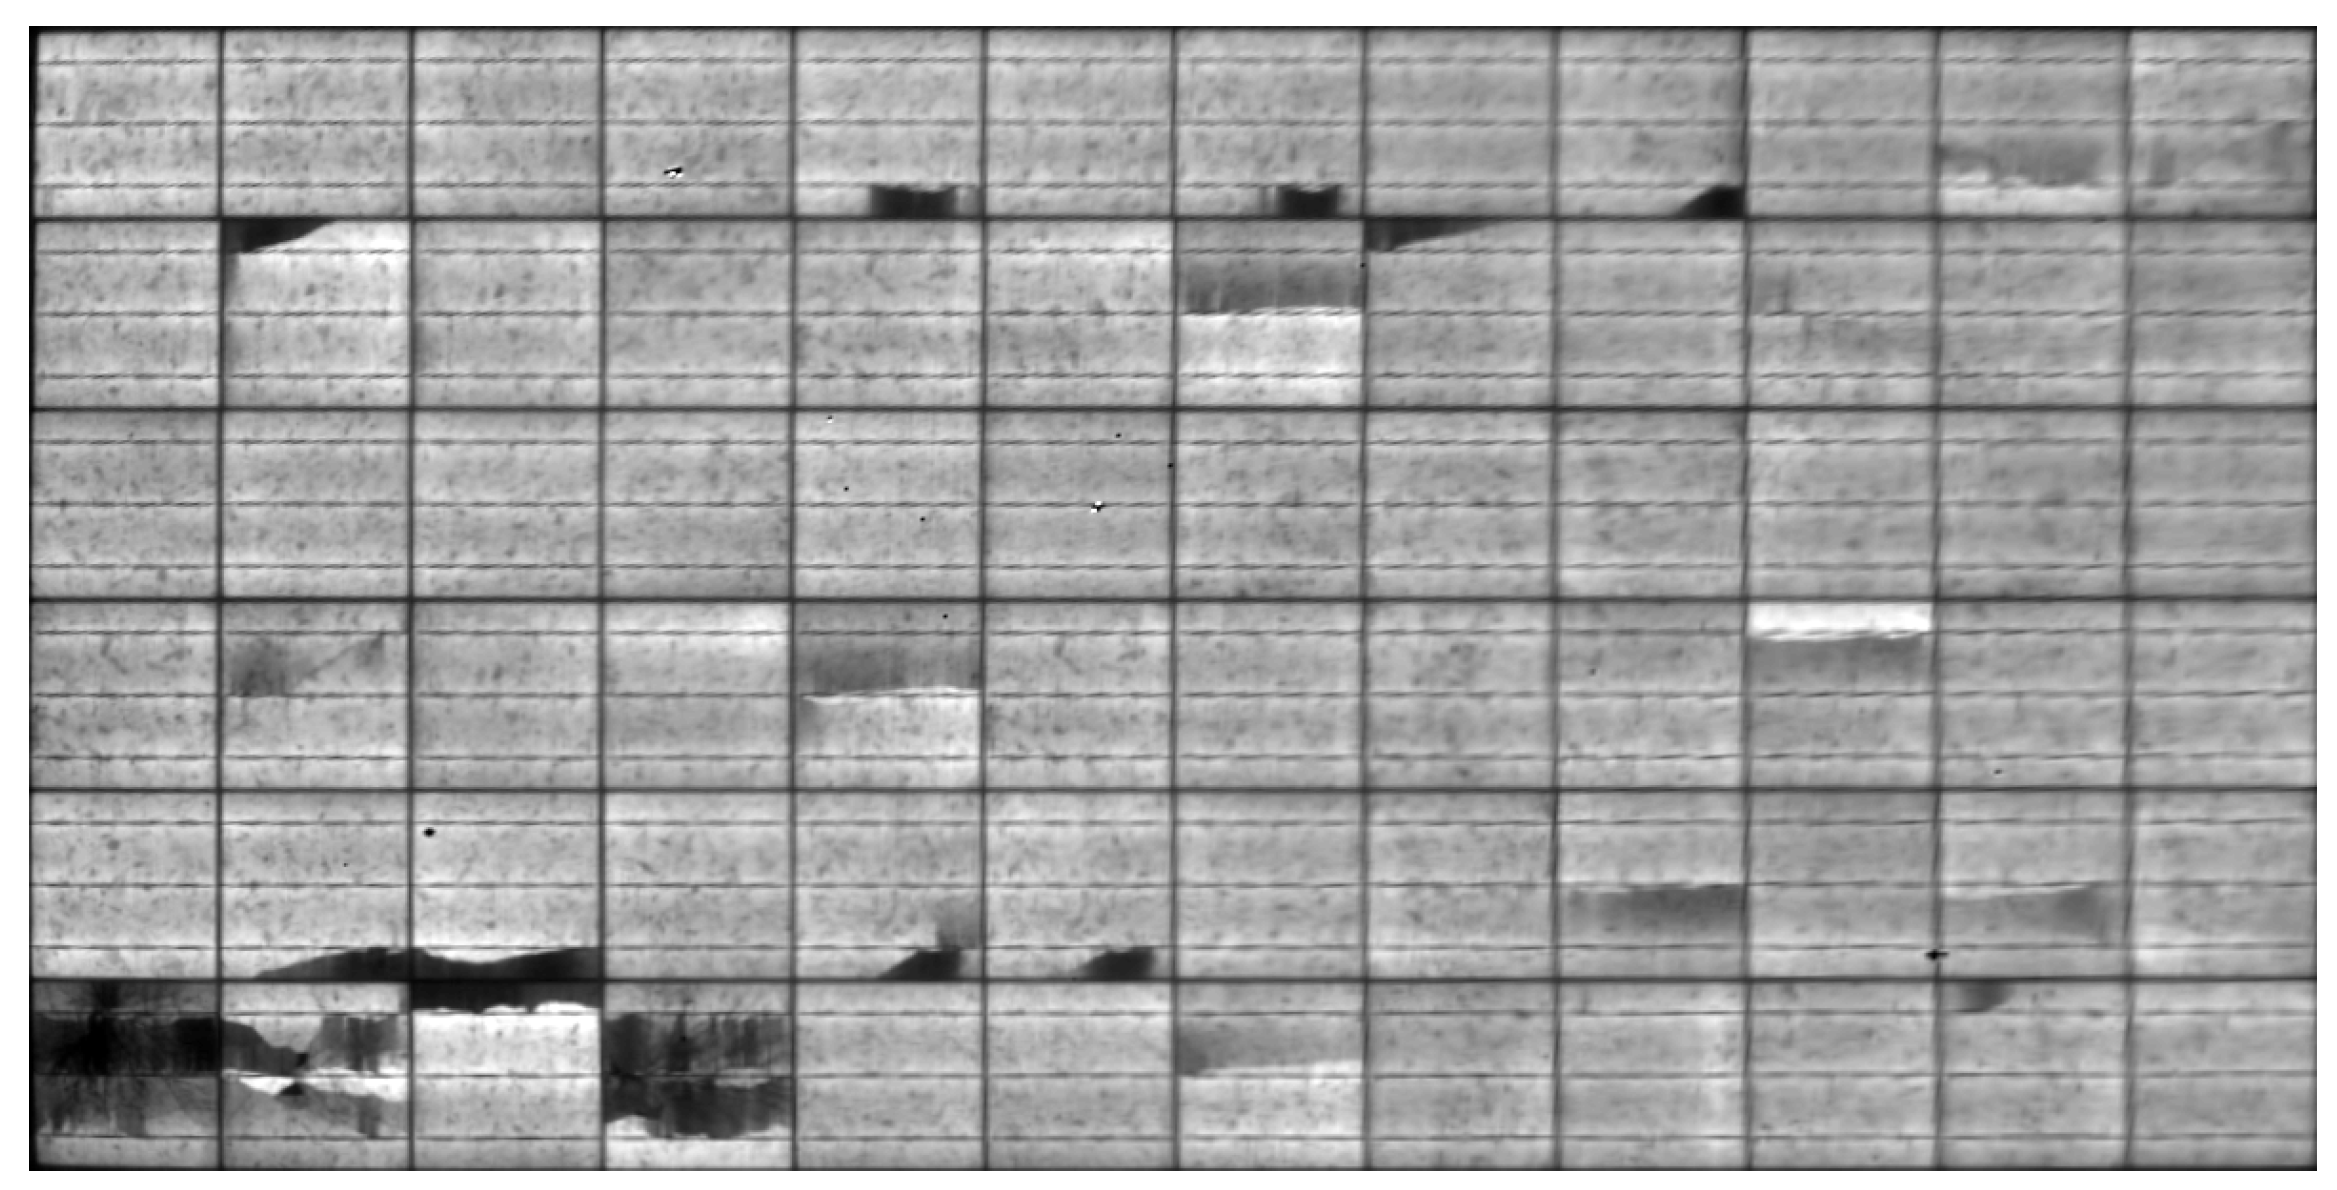
The images used in Section 4.2.2 for quality evaluation after each step of the calibration process. Figure A1 and Figure A2 show the lens distorted DaySy system electroluminescence and photography image before camera calibration. Applying the distortion correction described in this work on Figure A1 results in Figure A3. Figure A4 shows the distortion corrected and perspective transformed image of the PV module in the center of Figure A1 and Figure A3 which is the region of interest and therefore used for quality evaluation.
Figure A1. Original DaySy electroluminescence (EL) image of Solarzentrum Stuttgart GmbH affected by barrel lens distortion. Straight line structures in the PV module are represented by curved line structures in the image.
Energies 14 02508 g0a1
Figure A2. Original DaySy photography image of Solarzentrum Stuttgart GmbH affected by barrel lens distortion. Straight line structures in the PV module are represented by curved line structures in the image.
Energies 14 02508 g0a2
Figure A3. DaySy electroluminescence (EL) image after distortion correction. Straight line structures in the PV module are represented by straight line structures in the image.
Energies 14 02508 g0a3
Figure A4. DaySy electroluminescence (EL) image after distortion correction and perspective transformation. This image can be used for further automated image processing steps.
Energies 14 02508 g0a4

References

  1. Kropp, T.; Schubert, M.; Werner, J.H. Quantitative Prediction of Power Loss for Damaged Photovoltaic Modules Using Electroluminescence. Energies 2018, 11, 1172. [Google Scholar] [CrossRef] [Green Version]
  2. Stoicescu, L.; Reuter, M.; Werner, J.H. DaySy: Luminescence Imaging of PV Modules in Daylight. In Proceedings of the 29th European Photovoltaic Solar Energy Conference and Exhibition, Amsterdam, The Netherlands, 22–26 September 2016; pp. 2553–2554. [Google Scholar] [CrossRef]
  3. Deitsch, S.; Buerhop-Lutz, C.; Sovetkin, E.; Steland, A.; Maier, A.; Gallwitz, F.; Riess, C. Segmentation of Photovoltaic Module Cells in Electroluminescence Images. arXiv 2018, arXiv:1806.06530. [Google Scholar]
  4. Devernay, F.; Faugeras, O. Straight lines have to be straight. Mach. Vis. Appl. 2001, 13, 14–24. [Google Scholar] [CrossRef]
  5. Bedrich, K.; Bliss, M.; Betts, T.R.; Gottschalg, R. Electroluminescence Imaging of PV Devices: Uncertainty due to Optical and Perspective Distortion. In Proceedings of the 31st European Photovoltaic Solar, Energy Conference and Exhibition, Hamburg, Germany, 14–18 September 2015; pp. 1748–1752. [Google Scholar] [CrossRef]
  6. Bedrich, K.G.; Bliss, M.; Betts, T.R.; Gottschalg, R. Electroluminescence imaging of PV devices: Camera calibration and image correction. In Proceedings of the 2016 IEEE 43rd Photovoltaic Specialists Conference (PVSC), Portland, OR, USA, 5–10 June 2016; pp. 1532–1537. [Google Scholar] [CrossRef] [Green Version]
  7. Bedrich, K.G. Quantitative Electroluminescence Measurements of PV Devices. Ph.D. Thesis, Loughborough University, Loughborough, UK, 2017. [Google Scholar]
  8. OpenCV Team. Camera Calibration and 3D Reconstruction. 2019. Available online: https://docs.opencv.org/2.4/modules/calib3d/doc/camera_calibration_and_3d_reconstruction.html (accessed on 10 August 2020).
  9. Zhang, Z. A flexible new technique for camera calibration. IEEE Trans. Pattern Anal. Mach. Intell. 2000, 22, 1330–1334. [Google Scholar] [CrossRef] [Green Version]
  10. Heikkila, J.; Silven, O. A four-step camera calibration procedure with implicit image correction. In Proceedings of the IEEE Computer Society Conference on Computer Vision and Pattern Recognition, San Juan, PR, USA, 17–19 June 1997; pp. 1106–1112. [Google Scholar] [CrossRef] [Green Version]
  11. The Mathworks Inc. What Is Camera Calibration? 2020. Available online: https://de.mathworks.com/help/vision/ug/camera-calibration.html (accessed on 10 August 2020).
  12. Bedrich, K.G.; Chai, J.; Wang, Y.; Aberle, A.G.; Bliss, M.; Bokalic, M.; Doll, B.; Köntges, M.; Huss, A.; Lopez-Garcia, J.; et al. 1st International Round Robin on EL Imaging: Automated Camera Calibration and Image Normalisation. In Proceedings of the 35th European Photovoltaic Solar Energy Conference and Exhibition, Brussels, Belgium, 24–28 September 2018; pp. 1049–1056. [Google Scholar] [CrossRef]
  13. Sobel, I.; Feldman, G. A 3 × 3 isotropic gradient operator for image processing. Unpublished but first presented by Sobel and Feldman at a talk at the Stanford Artificial Project (1968). In Pattern Classification and Scene Analysis; Duda, R., Hart, P., Eds.; John Wiley and Sons: New York, NY, USA, 1973; pp. 271–272. [Google Scholar] [CrossRef]
  14. Mantel, C.; Villebro, F.; Parikh, H.R.; Spataru, S.; dos Reis Benatto, G.A.; Sera, D.; Poulsen, P.B.; Forchhammer, S. Method for Estimation and Correction of Perspective Distortion of Electroluminescence Images of Photovoltaic Panels. IEEE J. Photovolt. 2020, 10, 1797–1802. [Google Scholar] [CrossRef]
  15. Duda, R.O.; Hart, P.E. Use of the Hough Transformation to Detect Lines and Curves in Pictures. Commun. ACM 1972, 15, 11–15. [Google Scholar] [CrossRef]
  16. Sanjay, G.B.; Mehta, S.; Vajpai, J. Adaptive Local Thresholding for Edge Detection. IJCA Proc. Natl. Conf. Adv. Technol. Appl. Sci. NCATAS(2) 2014, 2, 15–18. [Google Scholar]
  17. Brown, D.C. Close-Range Camera Calibration. Photogramm. Eng. 1971, 37, 855–866. [Google Scholar]
  18. Sun, Q.; Wang, X.; Xu, J.; Wang, L.; Zhang, H.; Yu, J.; Su, T.; Zhang, X. Camera self-calibration with lens distortion. Optik 2016, 127, 4506–4513. [Google Scholar] [CrossRef]
  19. Mallon, J.; Whelan, P. Precise radial un-distortion of images. In Proceedings of the 17th International Conference on Pattern Recognition, ICPR 2004, Cambridge, UK, 26 August 2004; Volume 1, pp. 18–21. [Google Scholar] [CrossRef] [Green Version]
  20. Wei, G.-Q.; Ma, S.D. Implicit and explicit camera calibration: Theory and experiments. IEEE Trans. Pattern Anal. Mach. Intell. 1994, 16, 469–480. [Google Scholar] [CrossRef]
  21. Tsai, R. A versatile camera calibration technique for high-accuracy 3D machine vision metrology using off-the-shelf TV cameras and lenses. IEEE J. Robot. Autom. 1987, 3, 323–344. [Google Scholar] [CrossRef] [Green Version]
  22. Faig, W. Calibration of Close-Range Photogrammetric Systems: Mathematical Formulation. Photogramm. Eng. Remote Sens. 1975, 41, 1479–1486. [Google Scholar]
  23. Tomasi, C.; Manduchi, R. Bilateral filtering for gray and color images. In Proceedings of the Sixth International Conference on Computer Vision (IEEE Cat. No.98CH36271), Bombay, India, 7 January 1998; Volume 1, pp. 839–846. [Google Scholar] [CrossRef]
  24. Otsu, N. A Threshold Selection Method from Gray-Level Histograms. IEEE Trans. Syst. Man Cybern. 1979, 9, 62–66. [Google Scholar] [CrossRef] [Green Version]
  25. Süße, H.; Rodner, E. Bildverarbeitung und Objekterkennung: Computer Vision in Industrie und Medizin; Springer Vieweg: Wiesbaden, Germany, 2014. [Google Scholar]
  26. Suzuki, S.; Be, K. Topological structural analysis of digitized binary images by border following. Comput. Vis. Graph. Image Process. 1985, 30, 32–46. [Google Scholar] [CrossRef]
  27. Fischler, M.A.; Bolles, R.C. Random sample consensus: A paradigm for model fitting with applications to image analysis and automated cartography. Commun. ACM 1981, 24, 381–395. [Google Scholar] [CrossRef]
  28. Zhang, Z. Flexible camera calibration by viewing a plane from unknown orientations. In Proceedings of the Seventh IEEE International Conference on Computer Vision, Kerkyra, Greece, 20–27 September 1999; Volume 1, pp. 666–673. [Google Scholar] [CrossRef]
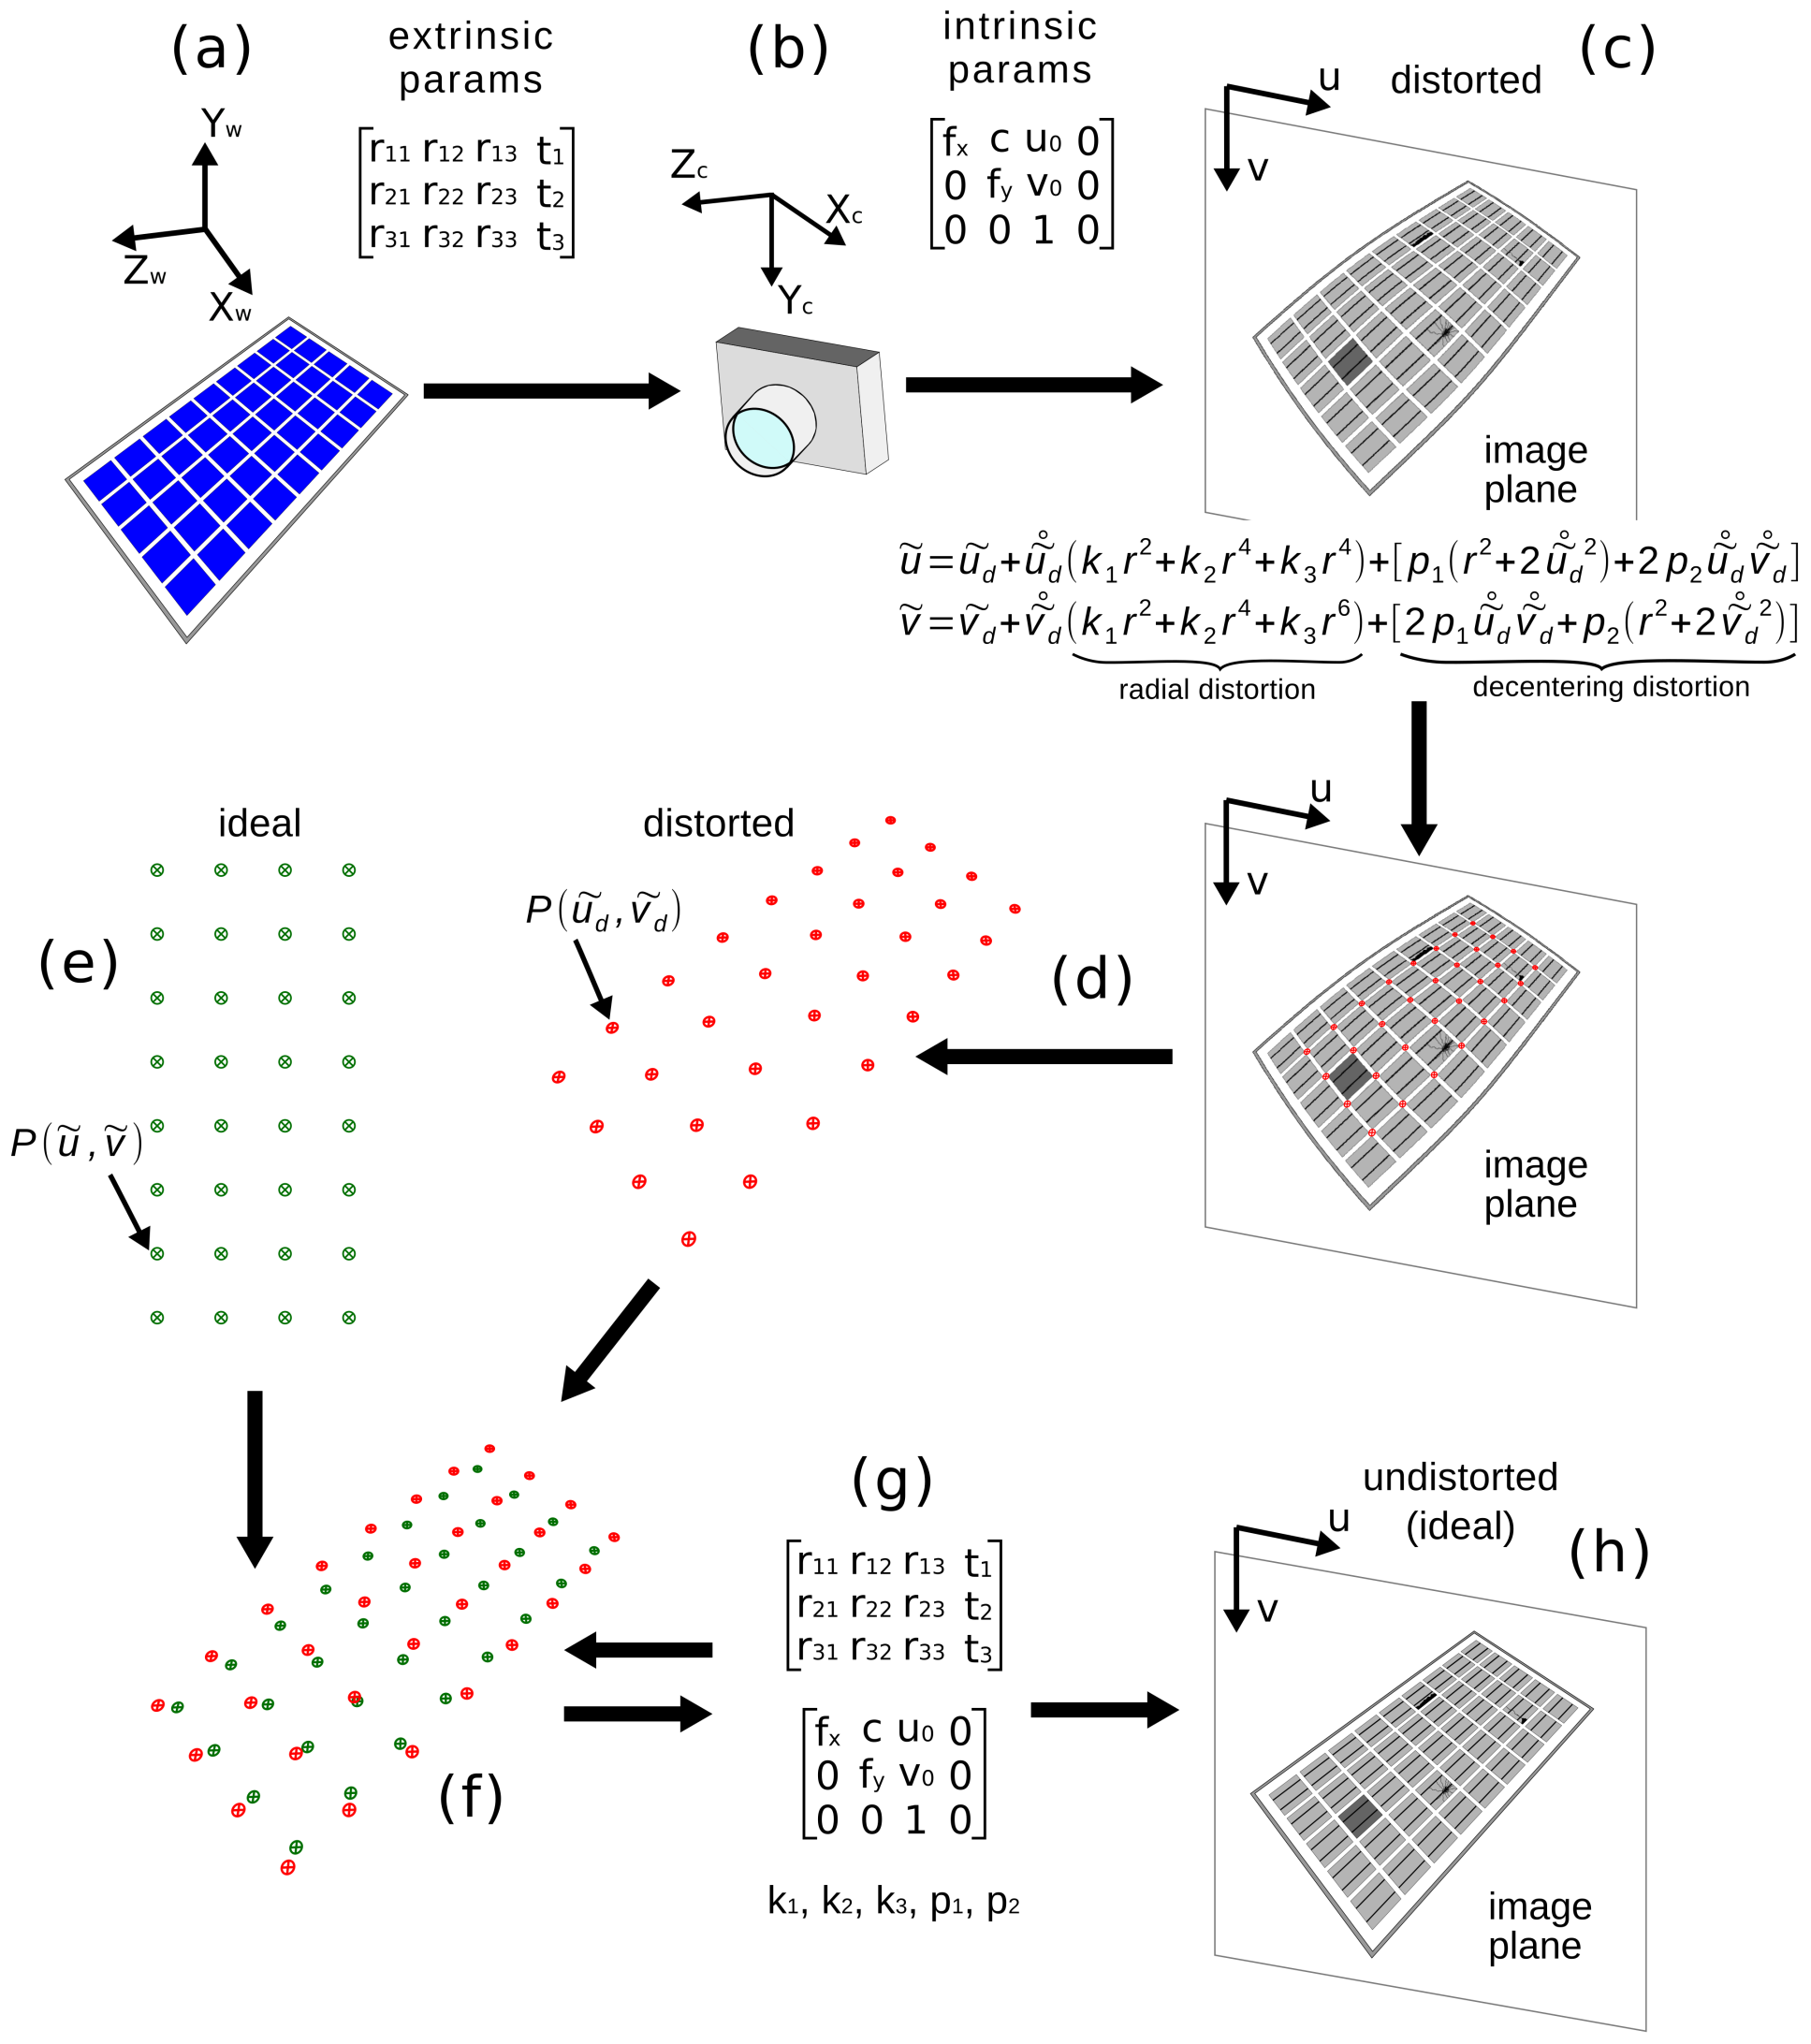
Figure 1. Automated camera calibration procedure acc. to Bedrich et al. [12]: (a) Device under test (DUT) in 3D world coordinates. (b) The extrinsic camera parameters describe the transfer from 3D world coordinate system to 3D camera coordinate system. (c) The intrinsic camera parameters describe the transfer from 3D camera coordinate system to 2D image coordinates. The lens distortion model of Brown [17] is assumed, which is described by the unknown coefficients k 1 , k 2 , k 3 , p 1 , p 2 . A distorted image point P ( u ˜ d , v ˜ d ) corrected with the distortion coefficients leads to a distortion corrected point P ( u ˜ , v ˜ ) . (d) Pattern detection of the distorted cell gap joints (CGJ) grid. Our pattern detection process is described in Figure 2. (e) The assumed distortion free CGJ pattern is used as target pattern. (f) Camera parameter and distortion coefficient estimation based on the algorithm of Zhang et al. [9] and Heikkilä et al. [10]. The method estimates the homography between the detected distorted CGJ and target CGJ. (g) The extrinsic parameters, intrinsic parameters and the distortion coefficients are adjusted with a non-linear optimization until the predefined abort criterion is achieved. (h) The estimated parameters allow the undistortion of the original distorted input image.
Energies 14 02508 g001
Figure 2. Pattern Detection Process: (a) Distorted input EL image. (b) Binarization of the EL image and morphological filters to highlight active cell area as one object. (c) Contour and corner detection. The active cell area contour is the region of interest (ROI) for the pattern detection process. The corners are used for perspective transformation and for cropping the active cell area. (d) Binarization of the EL image and morphological filters to highlight dark structures in the ROI. (e) Hough line search algorithm detects multiple lines for each cell gap and busbar structure. (f) Line validation and classification. Determining of the line that fits the best for a curved cell gap or busbar structure. Line classification to differentiate between busbars and cell gaps. Intersection points of cell gap lines are used to define small ROI windows around the intersection points. (g) Additional iteration steps (from (e) to (f)). Precise Hough line search in ROI windows because the straight lines do not match exactly on the curved cell gaps. (h) Final cell gap joint pattern for camera parameter estimation in Figure 1d.
Energies 14 02508 g002
Figure 3. Relative Standard Error (RSE) of the focal length camera parameters ( f x , f y ) and the principal point camera parameter ( u 0 , v 0 ) for the parameter estimation in Figure 1 with respect to the number of images in the calibration dataset (f = 25 mm). The RSE decreases with the amount of image planes used for the parameter estimation. All RSEs show a small value and therefore a good estimation accuracy
Energies 14 02508 g003
Figure 4. Relative Standard Error (RSE) of the distortion coefficient k 1 for the parameter estimation in Figure 1 with respect to the number of images in the calibration dataset (f = 25 mm). The RSE decreases with the number of image planes used for the parameter estimation. In our dataset the error k 1 becomes reliable with seven or more images for calibration as the RSE falls below 20%.
Energies 14 02508 g004
Figure 5. Statistical deviation of the relative standard error ( R S E ) of f x , f y , u 0 and v 0 with respect to the number of images in the calibration dataset (f = 25 mm) after 20 rounds. (a) RSE for f x shows consistent results below 1% for 10 to 60 calibration images. (b) RSE for f y shows varying results between 1.6 % and 0.2 % for 10 calibration images and 1.2 % to 0.17 % for 20 calibration images. For 30 images and more the RSE shows consistent results below 0.40 % . (c) RSE for u 0 shows varying results between 7.6 % and 1 % for 10 calibration images and 5.8 % to 0.8 % for 20 calibration images. For 30 images and more the RSE shows more consistent results below 0.7 % . (d) RSE for v 0 shows varying results between 1.4 % and 1 % for 10 calibration images. For 30 images and more the RSE is below 0.7 % . For this dataset, 30 random selected images are used to achieve a low and consistent RSE for camera parameter estimation.
Energies 14 02508 g005
Figure 6. Accuracy measurement. (a) Image section (four cells) of a PV module after distortion and perspective correction. (b) Zoomed ( 7 × 7 ) px section of (a). Three cell gap joint (CGJ) grid pattern point types (algorithm detected points, ideal target points, expert labeled points) serve as control pattern for the inaccuracy measurement of the distortion correction and perspective transformation. Assuming all PV cells are the same size and are regularly aligned, the cell gaps (CG) form an equidistant grid of straight horizontal and vertical lines in distortion free and perfect perspective transformed image. The CGJ locations of the grid should also form an equidistant pattern (target control pattern (green)). The pattern detection, distortion correction and perspective transformation have a residual inaccuracy which means that the previously algorithm detected CGJ point locations (blue) (of Section 3.4) and the target locations (green) deviate from each other. The third control pattern (red) is labelled manually by an expert as visually detected in the distortion corrected and perspective transformed image. The Euclidean distance (Equation (16)) between the points showed in (b) provides a suitable accuracy metric that shows how they deviate from each other. A Euclidean distance of zero means that the two positions are at the identical pixel location.
Energies 14 02508 g006
Figure 7. Euclidean distance between algorithm found control points and the fix grid control points for the dataset of 54,835 control points. The whisker lengths indicate 0% percentile to 99% percentile.
Energies 14 02508 g007
Figure 8. Euclidean distance between the control point types for the 40 EL ground truth EL images (2200 control points). The whisker lengths indicate 0% percentile to 99% percentile.
Energies 14 02508 g008
Publisher’s Note: MDPI stays neutral with regard to jurisdictional claims in published maps and institutional affiliations.