Article

Day-Ahead and Intra-Day Optimal Scheduling of Integrated Energy System Considering Uncertainty of Source & Load Power Forecasting

College of Electrical Engineering, Qingdao University, Qingdao 266071, China
*
Author to whom correspondence should be addressed.
Energies 2021, 14(9), 2539; https://doi.org/10.3390/en14092539
Submission received: 17 March 2021 / Revised: 20 April 2021 / Accepted: 26 April 2021 / Published: 28 April 2021

Abstract

:
At present, due to the errors of wind power, solar power and various types of load forecasting, the optimal scheduling results of the integrated energy system (IES) will be inaccurate, which will affect the economic and reliable operation of the integrated energy system. In order to solve this problem, a day-ahead and intra-day optimal scheduling model of integrated energy system considering forecasting uncertainty is proposed in this paper, which takes the minimum operation cost of the system as the target, and different processing strategies are adopted for the model. In the day-ahead time scale, according to day-ahead load forecasting, an integrated demand response (IDR) strategy is formulated to adjust the load curve, and an optimal scheduling scheme is obtained. In the intra-day time scale, the predicted value of wind power, solar power and load power are represented by fuzzy parameters to participate in the optimal scheduling of the system, and the output of units is adjusted based on the day-ahead scheduling scheme according to the day-ahead forecasting results. The simulation of specific examples shows that the integrated demand response can effectively adjust the load demand and improve the economy and reliability of the system operation. At the same time, the operation cost of the system is related to the reliability of the accurate prediction of wind power, solar power and load power. Through this model, the optimal scheduling scheme can be determined under an acceptable prediction accuracy and confidence level.

1. Introduction

With the transformation of the energy system structure and the further development of the energy internet, the integrated energy system (IES) with an electric power system as the core and the integration of natural gas, thermal and other systems has become the focus of research [1]. IES can make the coupling between energy sources closer, improve energy efficiency and ensure the economy and reliability of system operation. At present, more than 70 countries have carried out relevant research and application of IES [2]. The United States focused on the development of distributed energy and combined cooling heating and power (CCHP) technology, and took improving the flexibility of power system as the research direction of demand side management [3]. In 2015, the UK formulated the energy system catapult program, with an annual investment of 30 million pounds to support UK enterprises to focus on research and development of integrated energy systems [4]. Denmark arranged small power generation equipment in energy consumption areas to supplement or replace the centralized power supply system [5]. Compared with other countries, the research of IES in China started late, but developed rapidly [6]. At present, a series of achievements have been made in the concept and framework of integrated energy systems, technical and economic analysis, operation analysis and optimization.
The development and utilization of clean energy such as wind power and solar power which has been developed and applied in IES can not only save fuel cost for the system, but also reduce environmental pollution [7], as renewable energy, wind energy and solar energy are cheap and environmentally friendly. It is an effective low-carbon method to gather wind energy and solar energy into IES [8]. The development of low-carbon power has become an important measure to promote the sustainable development of IES [9]. Meanwhile, the randomness and volatility of clean energy such as wind power and solar power bring severe challenges to the optimal scheduling of IES. Nowadays, many scholars are studying the uncertainty of wind power output and solar power output. In terms of improving the capacity of absorbing wind power and solar power of the system, Chen et al. established a fuzzy model for the economic dispatch of a power system with wind farms based on fuzzy theory [10], which obeyed the wishes of decision makers and adapted to the randomness of wind power output. Ai et al. further inherited and developed the research results of the literature [10], processed the fuzzy parameters that were difficult to determine, established the fuzzy chance constraint model, and transformed it into a clear equivalence class for solution [11]. In response to the uncertainty of solar power generation, some researches have improved the solar power prediction model to reduce the uncertainty of prediction as much as possible. Based on the k-means method, Li et al. conducted cluster analysis on the fluctuation of photovoltaic output, constructed the Long Short-Term Memory (LSTM) prediction model, and improved the accuracy of photovoltaic output prediction [12]. There are also studies on further processing the predicted value in the scheduling model. In order to reduce the impact of uncertainty of solar power output, Li et al. proposed a multi-time scale model [13]. In the day-ahead scale, the solar power forecast output was analyzed by the multi-scene stochastic programming method, and fuzzy parameters were used to make fuzzy equivalence for the solar power forecast in the intra-day scale. In addition, in literature [14], the concentrating solar power (CSP) model was introduced as a new idea of solar power absorption, and was introduced into the traditional grid dispatching model for analysis. Through the simulation of specific examples, it was verified that the introduction of CSP could effectively reduce costs and improve energy utilization.
In order to cope with the randomness and volatility of wind power, solar power and other energy sources, many experts and scholars have carried out researches on system scheduling with multiple time scales. In literature [15], Zhang et al. described the day-ahead wind power output by simplifying the cene set, and the high-load energy load was invested in the intra-day decision; thus, the scheduling model of source-load coordination with multiple time scales was established [15]. Liu et al. established a day-ahead scheduling model considered price-based demand response [16], and the day-ahead scheduling plan and intra-day wind power forecast were taken as the input of the intra-day scheduling model. Thus, the feasibility and economy of the model was verified through specific examples. Considering the deviation interval of wind power forecasting, Yuan et al. expressed the impact of load uncertainty on the system operation through the deviation interval of load forecasting and the deviation interval under the condition of electricity price response, and proposed the interruptible load dispatching mode based on deviation precontrol [17].
However, most of the above studies are carried out in the power system, and the above factors are less considered in IES. With the development of IES application, the connection between clean energy and IES has become closer. Therefore, ensuring the stability and economy of the system while dealing with the uncertainties of wind power and solar power has become a key issue of current research. Based on this, according to the day-ahead load forecasting, the IDR strategy was formulated to adjust the load curve, and the predicted values of wind power, solar power and load power were expressed by fuzzy parameters to participate in the system optimal scheduling. The day-ahead and intra-day optimal scheduling model of IES considering the prediction uncertainty of wind power, solar power and loads power was established, and minimizing the operation cost of the system was taken as the goal. The feasibility and economy of the proposed model were verified through a specific example.
This paper is organized as follows: Section 2 introduces the related equipment contained in the system; Section 3 establishes the day-ahead and intra-day scheduling model and introduces the algorithm; Section 4 refers to the processing strategy for the model; Section 5 presents a case study to study the impact of processing strategy on the model; Section 6 summarizes the full text and provides some conclusions.

2. Equipment Introduction

The structure of the IES and related equipment in this paper is shown in Figure 1.
In the figure, CHP is short for combined heat and power; P2G is short for power to gas; GB is short for gas boiler. They will be specifically introduced below. The flow of electrical power is marked in blue; the flow of gas power is marked in green; the flow of thermal power is marked in red.

2.1. Energy Conversion Equipment

Energy conversion equipment is the key to realize the coupling between energy sources in IES, which can realize energy substitution and reduce the operating pressure of IES.

2.1.1. CSP Model

CSP is a rapidly developing solar power generation technology [18]. In CSP, the solar energy is absorbed to heat the medium, and the heated medium can store the heat through the heat storage system in CSP. At the same time, the heat energy can be used to generate hot steam, which drives the system to realize the power generation of steam turbine. The simplified model of CSP system is shown in Figure 2.
In the figure, SF, TS and P are the solar field, the heat storage system and the power generation end, respectively. P s o l a r and P C S P represent the solar power received and the electrical power generated by CSP system, respectively. P d i s . s , P d i s . h and P d i s . p are power losses of each system, respectively. P S N , P N P , P T N and P N T represent the power transferred between the systems, respectively.
In this paper, the power balance relationship is represented through a node in the CSP model.
P S N P N P + P T N P N T = 0
P C S P = σ P N P
where σ is the power generation efficiency of CSP power generation end.
TS is an energy storage system in CSP, and its heat dissipation is unavoidable, which is usually reflected in the energy storage state equation.
H t T S = ( 1 γ ) H t 1 T S + ( P t 1 N T P t 1 T N ) Δ t
where H t T S and H t 1 T S are the total heat storage in TS at time t and time (t-1), respectively; γ is the dissipation coefficient.

2.1.2. CHP Model

Combined heat and power (CHP) can use heat engine or power equipment to generate both electricity and heat energy at the same time. Its electric power can be output by gas turbine (GT) and thermal power can be output by waste heat boiler (WHB).
The mathematical model of GT can be expressed as a linear function of the conversion efficiency of gas to electricity.
P G T = λ G G T
where P G T is the electric power output of GT; G G T is the gas power input of GT; λ is the conversion efficiency of GT.
WHB is to recover the waste heat generated in the power generation process of GT, and its model is as follows:
H W H B = ξ P G T ( 1 λ λ 1 ) λ
where H W H B is the thermal power output of WHB; ξ is the efficiency of WHB; λ 1 is the heat dissipation loss coefficient of GT.

2.1.3. Other Energy Conversion Equipment

The models of other energy conversion equipment such as gas boiler (GB) and power to gas (P2G) are similar to GT, which are linear functions of energy conversion efficiency, and can refer to Formula (4).

2.2. Energy Storage Equipment

The model of electricity storage and gas storage is similar to the model of the heat storage system in CSP, which can refer to Formula (3).

3. Problem Formulation

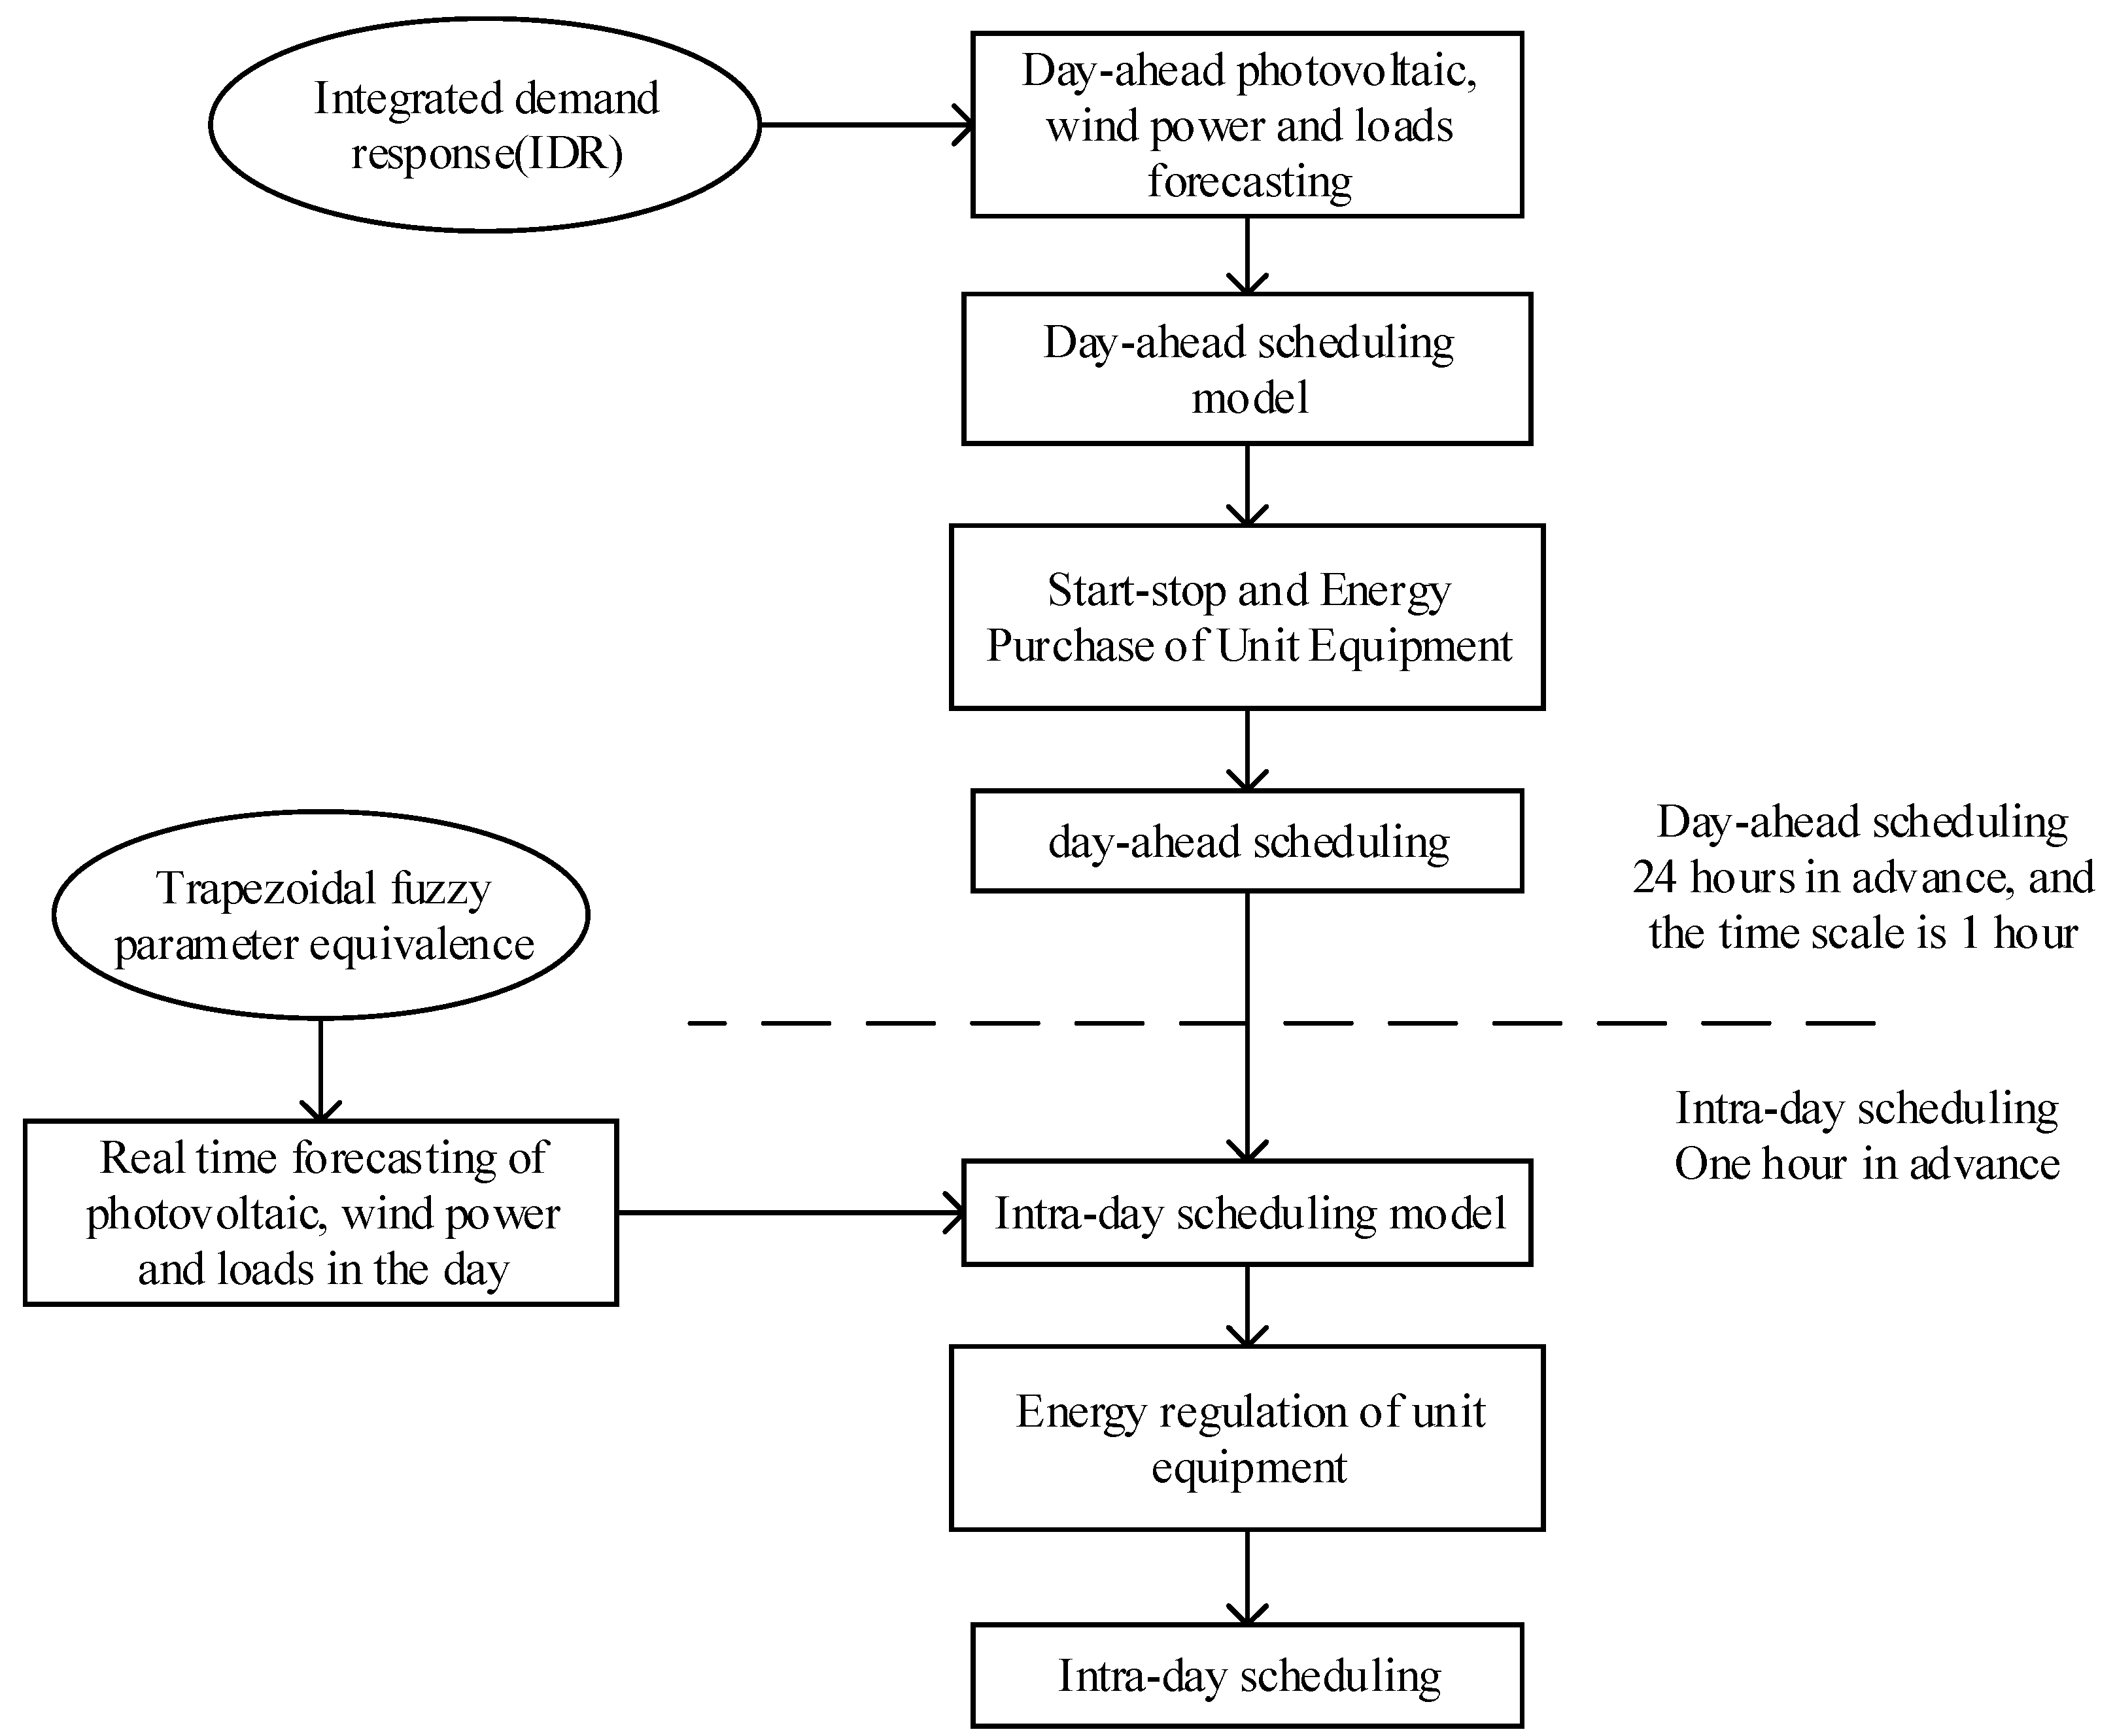
The framework of day-ahead and intra-day scheduling model constructed in this paper is shown in Figure 3.
The day-ahead scheduling was carried out 24 h in advance, and the time scale was 1 h. Integrated demand response is introduced according to the results of day-ahead load forecasting to adjust load demand, and day-ahead scheduling plan is formulated with the goal of minimizing system operation cost and wind abandonment penalty.
The intra-day scheduling plan was carried out 1 h in advance. The forecast value of intra-day wind power, solar power and loads power were represented by fuzzy parameters, and considering the day-ahead scheduling plan, the intra-day scheduling plan was formulated with the goal of minimizing the equipment adjustment cost and wind abandonment penalty.

3.1. Day-Ahead Scheduling Model

3.1.1. Objective Function

In this paper, the objective function of day-ahead scheduling is minimizing the total cost of system operation and wind abandonment penalty.
min C a h e a d = t T ( C t L + C t e c e . a + C t S . a + C t c u r t . a + C t U . a )
{ C t L = C e P t L + C g G t L C t e c e . a = i I [ C G T P i , t G T . a + C P 2 G G i , t P 2 G . a +     C W H B H i , t W H B . a + C G B H i , t G B . a + C C S P P i , t C S P . a ] C t S . a = i I ( C E S | P i , t E S . a | + C G S | G i , t G S . a | + C T S | H i , t T S . a | ) C t c u r t . a = C W ( P t p r e . a W P t a W ) C t U . a = i I [ a U ( P i , t U . a ) 2 + b U P i , t U . a + c U ]
where C t L , C t e c e . a , C t S . a , C t c u r t . a and C t U . a are energy purchase cost, day-ahead energy conversion cost, day-ahead energy storage cost, day-ahead wind abandonment penalty and cost of thermal power unit output, respectively; P t L and G t L are the purchased electric energy and purchased natural gas power, respectively; C e and C g are the unit price of the corresponding energy; P i , t G T . a , G i , t P 2 G . a , H i , t W H B . a , H i , t G B . a and P i , t C S P . a are the power output of GT, P2G, WHB, GB and CSP at node i in the day-ahead, respectively; C G T , C P 2 G , C W H B , C G B and C C S P are the operation and maintenance unit price of corresponding equipment respectively; P i , t E S . a , G i , t G S . a and H i , t T S . a are the output of power storage equipment, gas storage equipment and heat storage equipment at node i in the day-ahead, respectively; C E S , C G S and C T S are the operation and maintenance unit price of the corresponding equipment, respectively; P t p r e . a W and P t a W are wind power day-ahead forecast output and wind power day-ahead dispatching output, respectively; C W is the penalty coefficient of wind abandonment; a U , b U and c U are the cost coefficients of thermal power units; P i , t U . a is the output of thermal power unit at node i in the day-ahead.

3.1.2. Constraints

The constraints in this model include three power balance equality constraints and nine output limit inequality constraints.
(1) System power balance constraints
P t L + P i , t G T . a + P i , t C S P . a + P i , t E S . a + P t a W + P i , t U . a = Q i , t E a + P i , t P 2 G . a
G t L + G i , t P 2 G . a + G i , t G S . a = Q i , t G a + G i , t G T . a + G i , t G B . a
H i , t G B . a + H i , t W H B . a + H i , t T S . a = Q i , t H a
where Q i , t E a , Q i , t G a and Q i , t H a are the day-ahead load forecast values, respectively; P i , t P 2 G . a   G i , t G T . a and G i , t G B . a are the day-ahead power inputs of P2G, GT and GB, respectively.
(2) Unit output limit
The output of each unit should not exceed the upper and lower limits of its output. Take GT and electric energy storage as examples.
P i , t , min G T P i , t G T P i , t , max G T
P i , t , min E S P i , t E S P i , t , max E S
where P i , t , max G T and P i , t , min G T are the upper and lower limits of GT output, respectively; P i , t , max E S and P i , t , min E S are the upper and lower limits of electric energy storage output, respectively.

3.2. Intra-Day Scheduling Model

3.2.1. Objective Function

The intra-day scheduling model is based on the day-ahead scheduling plan, considering the intra-day forecast of wind power, solar power and load power and pursuing the lowest system adjustment cost and wind abandonment penalty cost.
min C i n = t T ( C t e c e . i n + C t S . i n + C t c u r t . i n + C t U . i n )
{ C t e c e . i n = i I ( k G T | P i , t G T . a P i , t G T . i n | + k P 2 G | G i , t P 2 G . a G i , t P 2 G . i n |     + k W H B | H i , t W H B . a H i , t W H B . i n | + k G B | H i , t G B . a H i , t G B . i n |     + k C S P | P i , t C S P . a P i , t C S P . i n | ) C t S . i n = i I ( k E S | P i , t E S . a P i , t E S . i n | + k G S | G i , t G S . a G i , t G S . i n |     + k T S | H i , t T S . a H i , t T S . i n | ) C t c u r t . i n = C W ( P t p r e . i n W P t i n W ) C t U . i n = i I k U ( P i , t U . a P i , t U . i n )
where C t e c e . i n , C t S . i n , C t U . i n and C t c u r t . i n are the intra-day adjust output cost of energy conversion equipment, energy storage equipment and thermal power unit and intra-day penalty cost of wind curtailment, respectively; P i , t G T . i n , G i , t P 2 G . i n , H i , t W H B . i n , H i , t G B . i n , P i , t C S P . i n , P i , t E S . i n , G i , t G S . i n , H i , t T S . i n and P i , t U . i n are the intra-day output power of GT, P2G, WHB, GB, CSP, power storage, gas storage, heat storage and thermal power units, respectively; k G T , k P 2 G , k W H B , k G B , k C S P , k E S , k G S , k T S and k U are the adjustment cost coefficients of the corresponding equipment, respectively; P t p r e , i n W and P t i n W are intra-day wind power forecast output and intra-day wind power dispatching output, respectively.

3.2.2. Constraints

The constraint conditions in the intra-day scheduling model are similar to those in the day-ahead scheduling model, which can be specifically referred to Formula (8)–(12).

3.3. Algorithm for Solving the Model

The model in this paper is a linear programming problem with many variables, which can be solved by the improved particle swarm optimization algorithm. The real decision variables to be solved include the purchased energy, the output of each unit and the wind power dispatching output.
Based on the conventional particle swarm optimization algorithm, the particle velocity iteration formula of the algorithm used in this paper is updated and the oscillation link [19] is introduced to improve the global search ability of the algorithm. The iteration formula of particle velocity is as follows:
v ( t + 1 ) = v ( t ) + c 1 r 1 [ P b e s t ( t ) ( 1 + ξ 1 ) x ( t ) + ξ 1 x ( t 1 ) ] + c 2 r 2 [ G b e s t ( t ) ( 1 + ξ 2 ) x ( t ) + ξ 2 x ( t 1 ) ]
where v is the particle velocity; x is the particle position; t represents the number of particle iterations; c 1 and c 2 are the individual learning factor and social learning factor of the particle, respectively; r 1 and r 2 are the random numbers uniformly distributed in [0,1], respectively; Pbest and Gbest are the individual extreme value and group extreme value of the particle, respectively. The values of ξ 1 and ξ 2 are as follows:
ξ 1 = ( 2 c 1 r 1 1 ) / c 1 r 1
ξ 2 = ( 2 c 2 r 2 1 ) / c 2 r 2

4. Model Processing Strategy

4.1. Day-Ahead Integrated Demand Response Strategy

Integrated demand response (IDR) introduced into the integrated energy system can effectively guide users to adjust their energy demand, promote the stable operation of the system and improve the operating efficiency. The IDR strategy adopted in this paper includes price-based demand response and alternative demand response.

4.1.1. Price-Based Demand Response

The mechanism of time-of-use electricity price and time-of-use gas price are introduced in price-based demand response to guide the energy consumption of users to shift from peak period to trough period. Taking electricity price-based demand response as an example, the relationship between user response degree and electricity price change can be expressed by elastic coefficient [20], which is specifically represented as the ratio of load change rate to price change rate.
ε i j = Δ Q j Q j / Δ P i P i
where P i and Δ P i are the electricity price and price change amount at time i; Q j and Δ Q j are the electricity load and load change amount at time j.
Through the elastic coefficient, the electric load change model of users expressed by the elastic matrix of demand can be obtained:
[ Δ Q 1 / Q 1 Δ Q 2 / Q 2 Δ Q n / Q n ] = [ ε 11 ε 12 ε 1 n ε 21 ε 22 ε 2 n ε n 1 ε n 2 ε n n ] [ Δ P 1 / P 1 Δ P 2 / P 2 Δ P n / P n ]
In the formula, the value of elastic coefficient can be obtained from the analysis of historical data [21]. According to the above formula, the electric load after response can be obtained.
Natural gas has the same commodity property as electric energy [22], so the solution of natural gas response load can be analogous to electric load. Because the use of natural gas is more easily affected by the price than that of electricity, the absolute value of the elasticity coefficient of natural gas is larger than that of electric energy.
In the day-ahead time scale, the corresponding time-sharing price can be set by the energy supplier according to the day-ahead load forecast, so as to guide users to complete peak clipping and valley filling, and reduce the operation pressure of the integrated energy system.

4.1.2. Alternative Demand Response

In IES, energy conversion can be realized through energy conversion equipment. When the cost of a certain type of energy is too high or the consumption of a certain type of energy is large, it can be replaced by other types of energy to reduce the operating pressure of the system and improve the energy efficiency. Based on the law of conservation of energy, the transformation relationship of alternative demand response can be expressed by the energy conversion equipment model.

4.2. Intra-Day Trapezoidal Fuzzy Parameter Equivalence Strategy

The forecast of intra-day wind power, solar power and load power require more accuracy. In order to cope with the uncertainty of forecast error, trapezoidal fuzzy parameters [23] are adopted in this paper to represent the predicted value of wind power, solar power and loads power. Trapezoidal fuzzy parameters are expressed as follows:
μ ( P F ) = { P F 4 P F P F 4 P F 3 , P F 3 < P F < P F 4 1 ,    P F 2 < P F < P F 3 P F P F 1 P F 2 P F 1 , P F 1 < P F < P F 2 0 ,    e l s e
where μ ( P F ) is the membership function; P F i (i = 1,2,3,4) is the membership parameter of the trapezoidal function, and its calculation formula is:
P F i = ω i P f c
where ω is the proportional coefficient and P f c is the predicted value of the parameter.
On the basis of fuzzy theory and with reference to [13], the fuzzy parameters are numerically equivalent:
P ˜ F = 1 α 2 ( P F 1 + P F 2 ) + α 2 ( P F 3 + P F 4 )
where α is the confidence level of the constraint conditions obeyed by the fuzzy parameters.

5. Example Simulation

5.1. Example Parameters

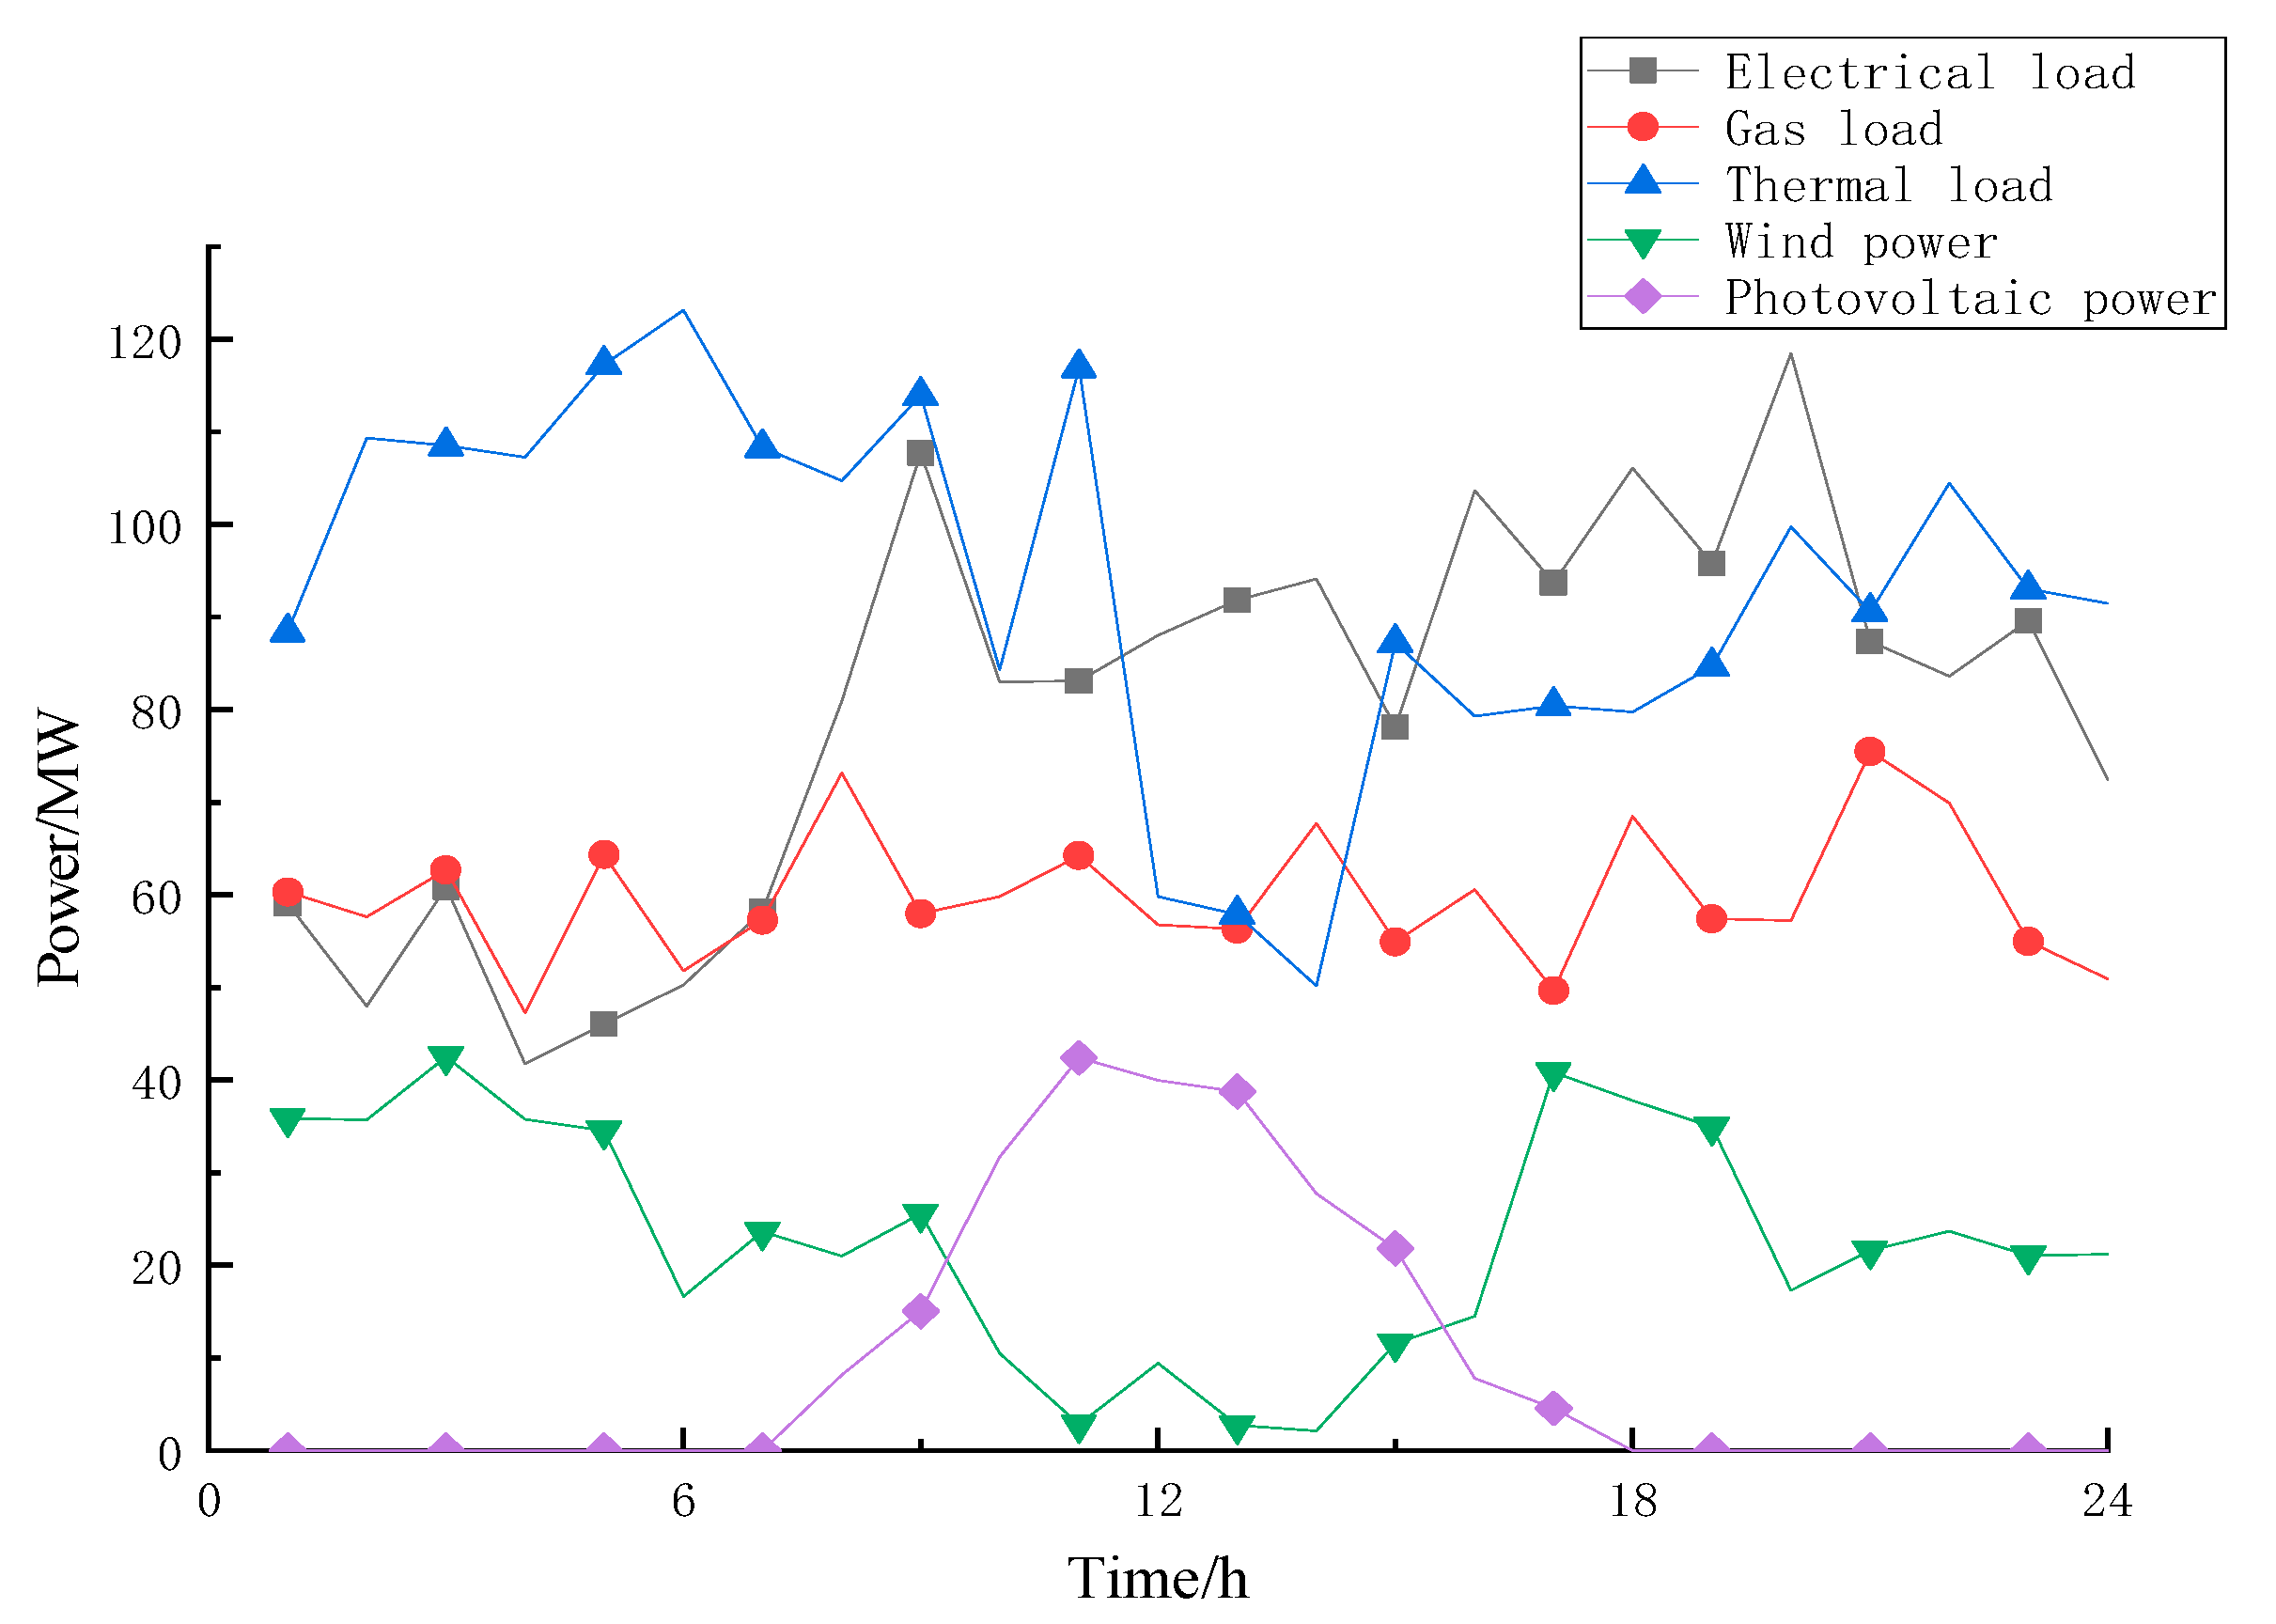
In order to verify the effectiveness of the proposed model, a regional IES is selected in this paper for analysis. In the example, the operating parameters of equipment are shown in Table 1, and the time-of-use prices of electric and natural gas are shown in Table 2. The penalty for wind abandonment is 500 yuan/MW, and the adjustment cost of thermal power unit is 300 yuan/MW. The day-ahead and intra-day prediction curves of wind power, solar power and loads power are shown in Figure 4 and Figure 5, and the trapezoidal membership is shown in Table 3. Other parameters refer to [16].
In the table, the energy purchase price before and after adopting IDR is before and after the “/” in the price column.
As the output of wind power and solar power is more difficult to predict than the loads power, the expansion range of their membership parameters is larger [24].

5.2. Result Analysis

In order to quantitatively analyze the influence of IDR and equivalent representation of fuzzy parameters on the model, three scenarios are proposed for comparison:
Scenario 1: Day-ahead optimization scheduling without IDR.
Scenario 2: Day-ahead optimization scheduling with IDR.
Scenario 3: Based on scenario 2, the intra-day optimal scheduling which contains the equivalent representation of fuzzy parameters is considered.
The operating costs of the scheduling models proposed in scenario 1 and scenario 2 are shown in Table 4. Compared scenario 1 with scenario 2, the total cost, electricity purchase cost and gas purchase cost of the day-ahead scheduling model after IDR are reduced, indicating that IDR can effectively adjust the load demand of users, realize peak clipping and valley filling, and improve the economy and reliability of the system operation.
Among them, the output of some equipment after adopting IDR is shown in Figure 6.
As can be seen from the Figure 6, GB gives priority to the output of converting natural gas to thermal energy in the valley period of gas price, and the output trend decreases in the peak period. The thermal load demand is met by the aid of the output of GT and WHB. The output of P2G increases in the valley period of electricity price and the peak period of gas price, and decreases in the other periods. GT increase its output during the peak period of electricity price and the valley period of gas price. Meanwhile, influenced by WHB’s mechanism of determined electric power by heat power, GT will also increase its power output during the peak time of gas price from 9:00 to 12:00. In the integrated energy system, energy conversion equipment can be used to achieve alternative demand response, reduce system operation pressure and improve energy efficiency.
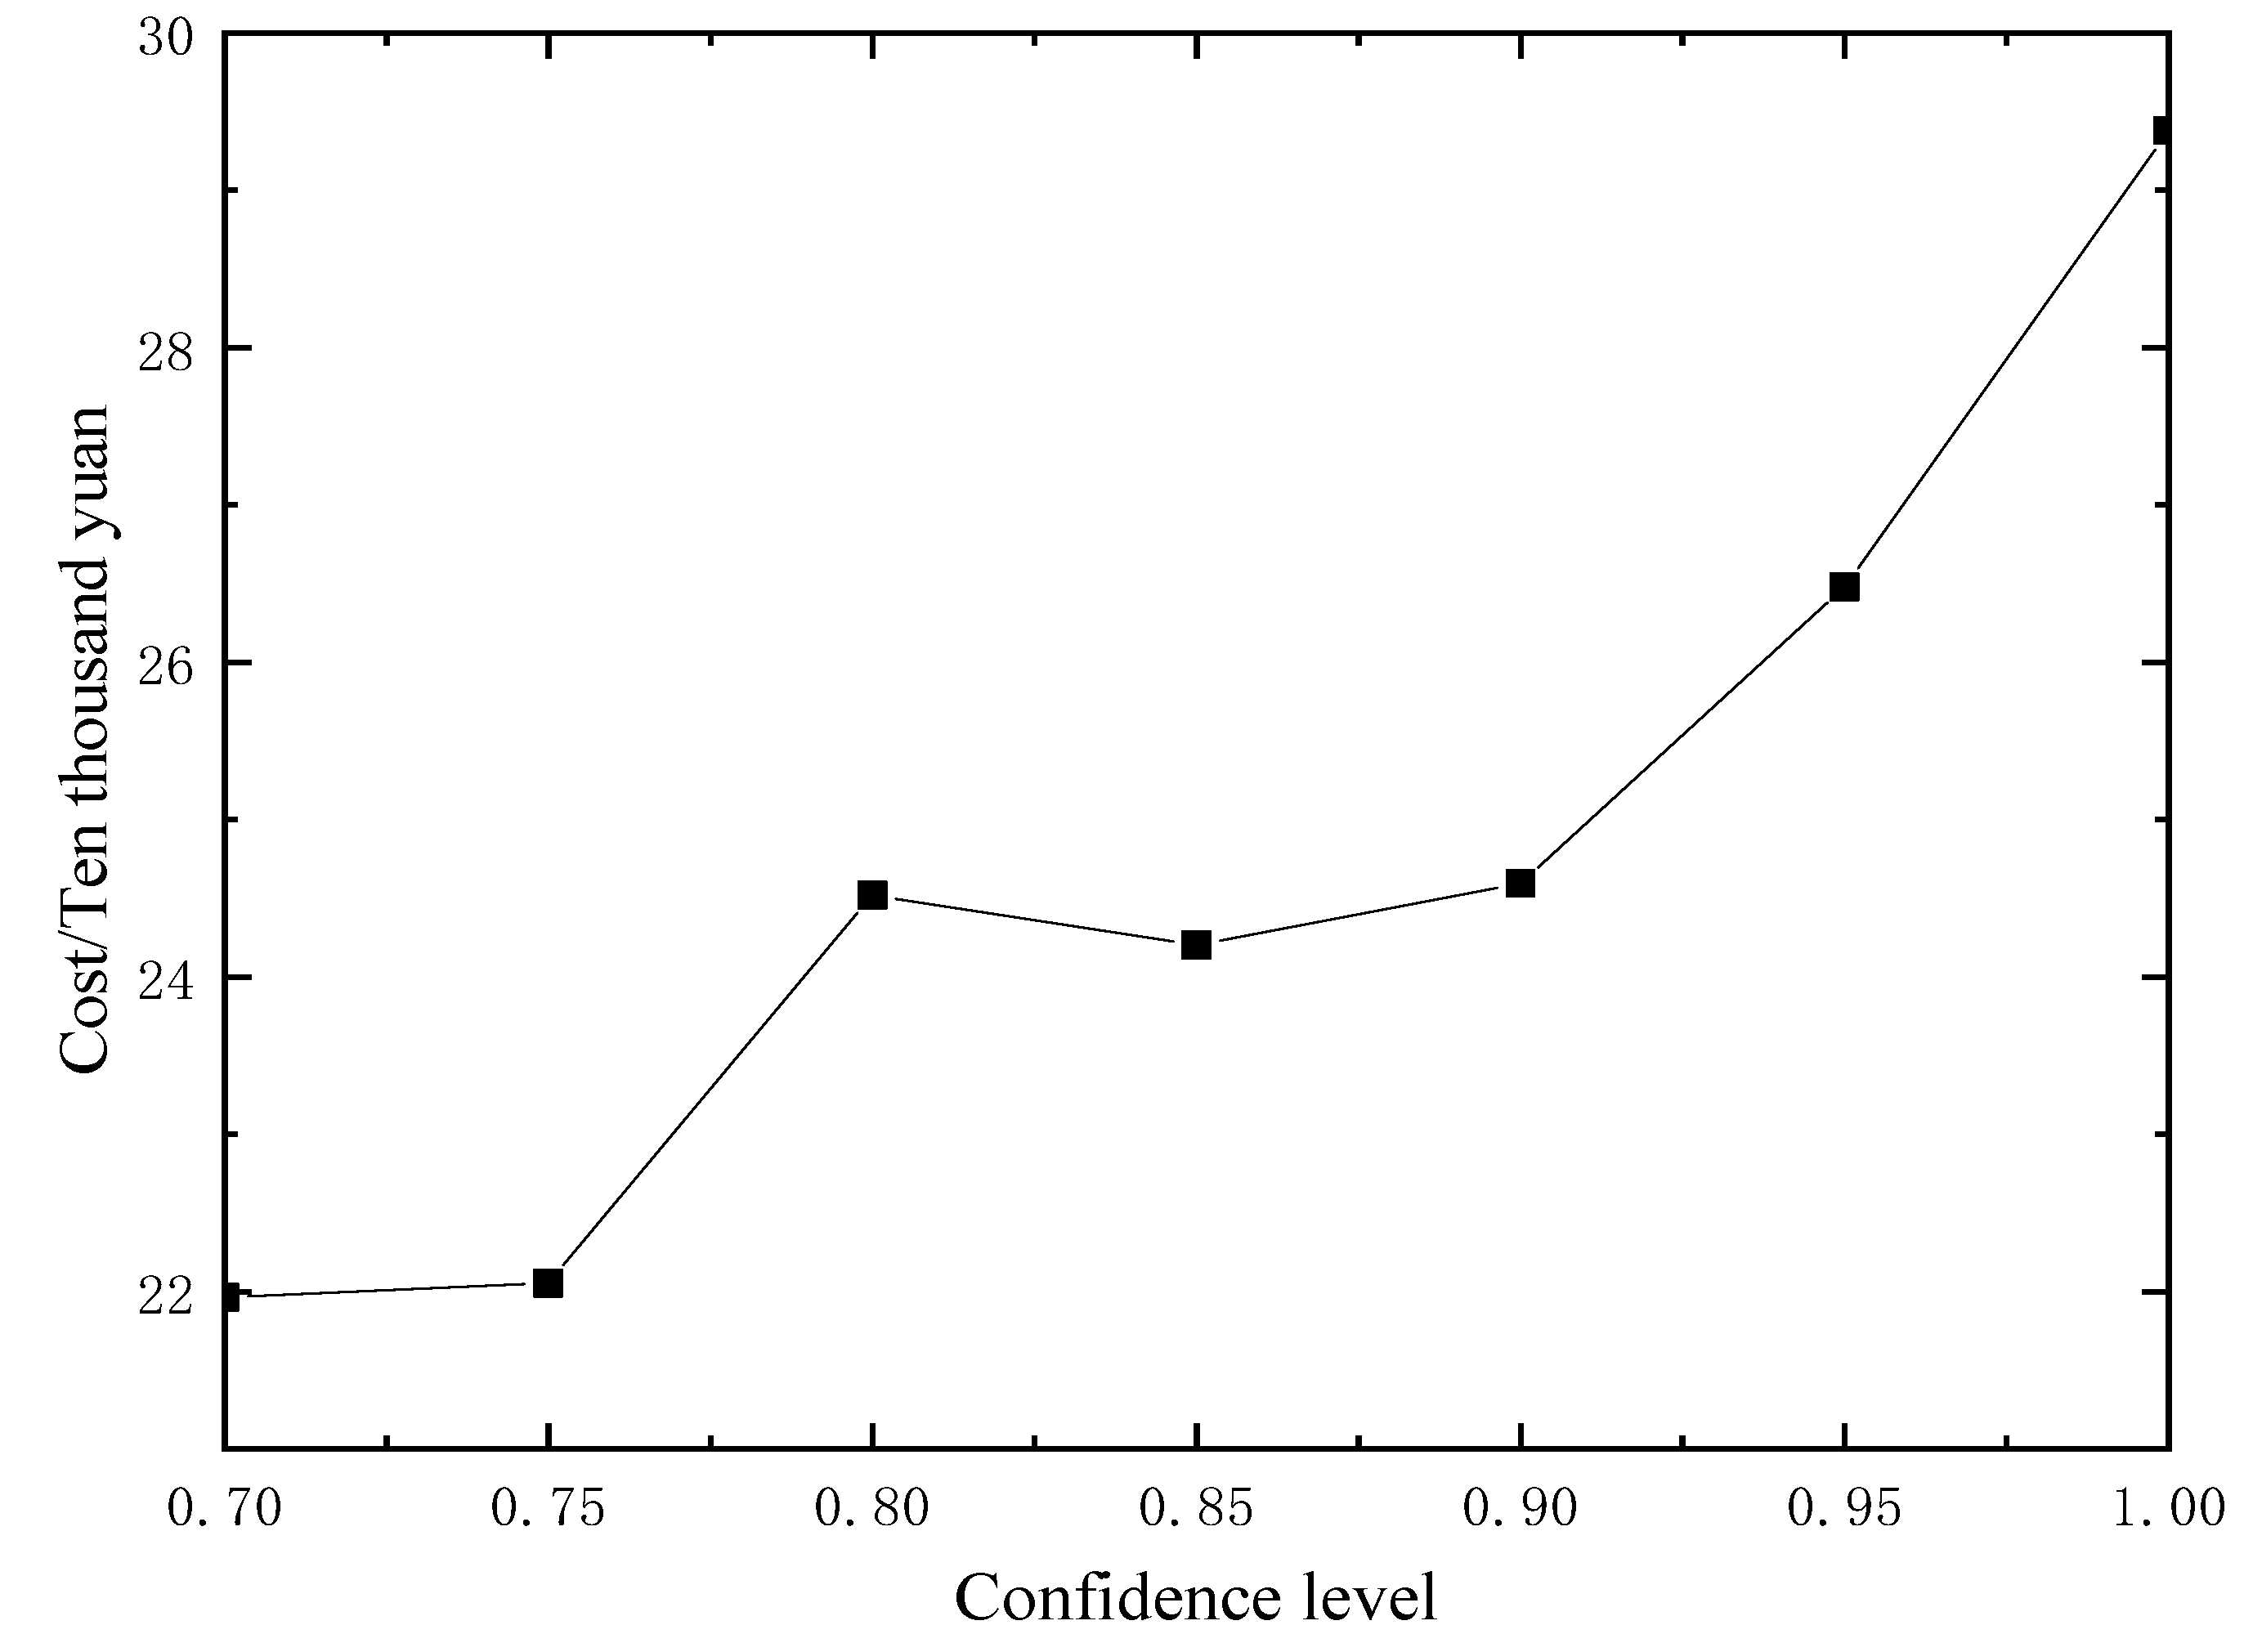
In scenario 3, the relationship between the adjustment cost of the intra-day optimal scheduling model and the confidence level α is shown in Figure 7. The confidence level α starts from 0.7 and increases by 0.05 steps to 1.
As can be seen from Figure 7, with the continuous increase of confidence level α, the overall trend of system adjustment cost is also increasing. In the α∈ (0.75,0.8]∪(0.9,1.0] interval, the cost–confidence level curve increased rapidly, and in the α∈ (0.7,0.75]∪(0.8,0.9] interval, the rising trend of the cost–confidence level curve tended to be flat or even slightly decreased. It can be inferred that the system adjustment cost is related to the confidence level. This means that if we want to pursue a high confidence level and ensure the stability of the system, we need to pay a higher cost. High reliability will lead to high cost, and high risk will bring high return.
The decision maker’s ability to control the risk can be reflected by the confidence level. In the day-ahead and intra-day optimal scheduling model of IES proposed in this paper, the risk comes from the uncertainty of solar power output, wind power output and various types of load power forecasting, which will cause the destruction of the balance constraint of the system. Therefore, the discussion of confidence level is introduced into the intra-day actual decision, and the optimal scheduling scheme is selected under the tolerable risk.
It can be seen from Figure 7 that the cost–confidence level curve turns to an inflection point when α = 0.75, α = 0.8, and α = 0.9. The curve is smooth in the range of 0.7–0.75, and has a large increase in the range of 0.75–0.8, which indicates that a good confidence level has been reached at α = 0.75. If the confidence level is to be further improved, the intra-day cost will be greatly increased. The curve decreases slightly in the range of 0.8–0.85, indicating that further increase of confidence level at α = 0.8 will reduce the intra-day cost instead. Therefore, it can be concluded that α = 0.8 is not an appropriate confidence level. In the range of 0.85–0.9, the curve increases steadily, while in the range of 0.9–1.0, the curve increases greatly, which indicates that α = 0.9 is also a good confidence level. If we want to further reduce the risk when α = 0.9, it will lead to a substantial increase in intra-day costs. Since intra-day scheduling requires as high scheduling accuracy and reliability as possible, in summary, in this example, α = 0.9 can be chosen by the decision maker as the optimal confidence level according to the actual demand.
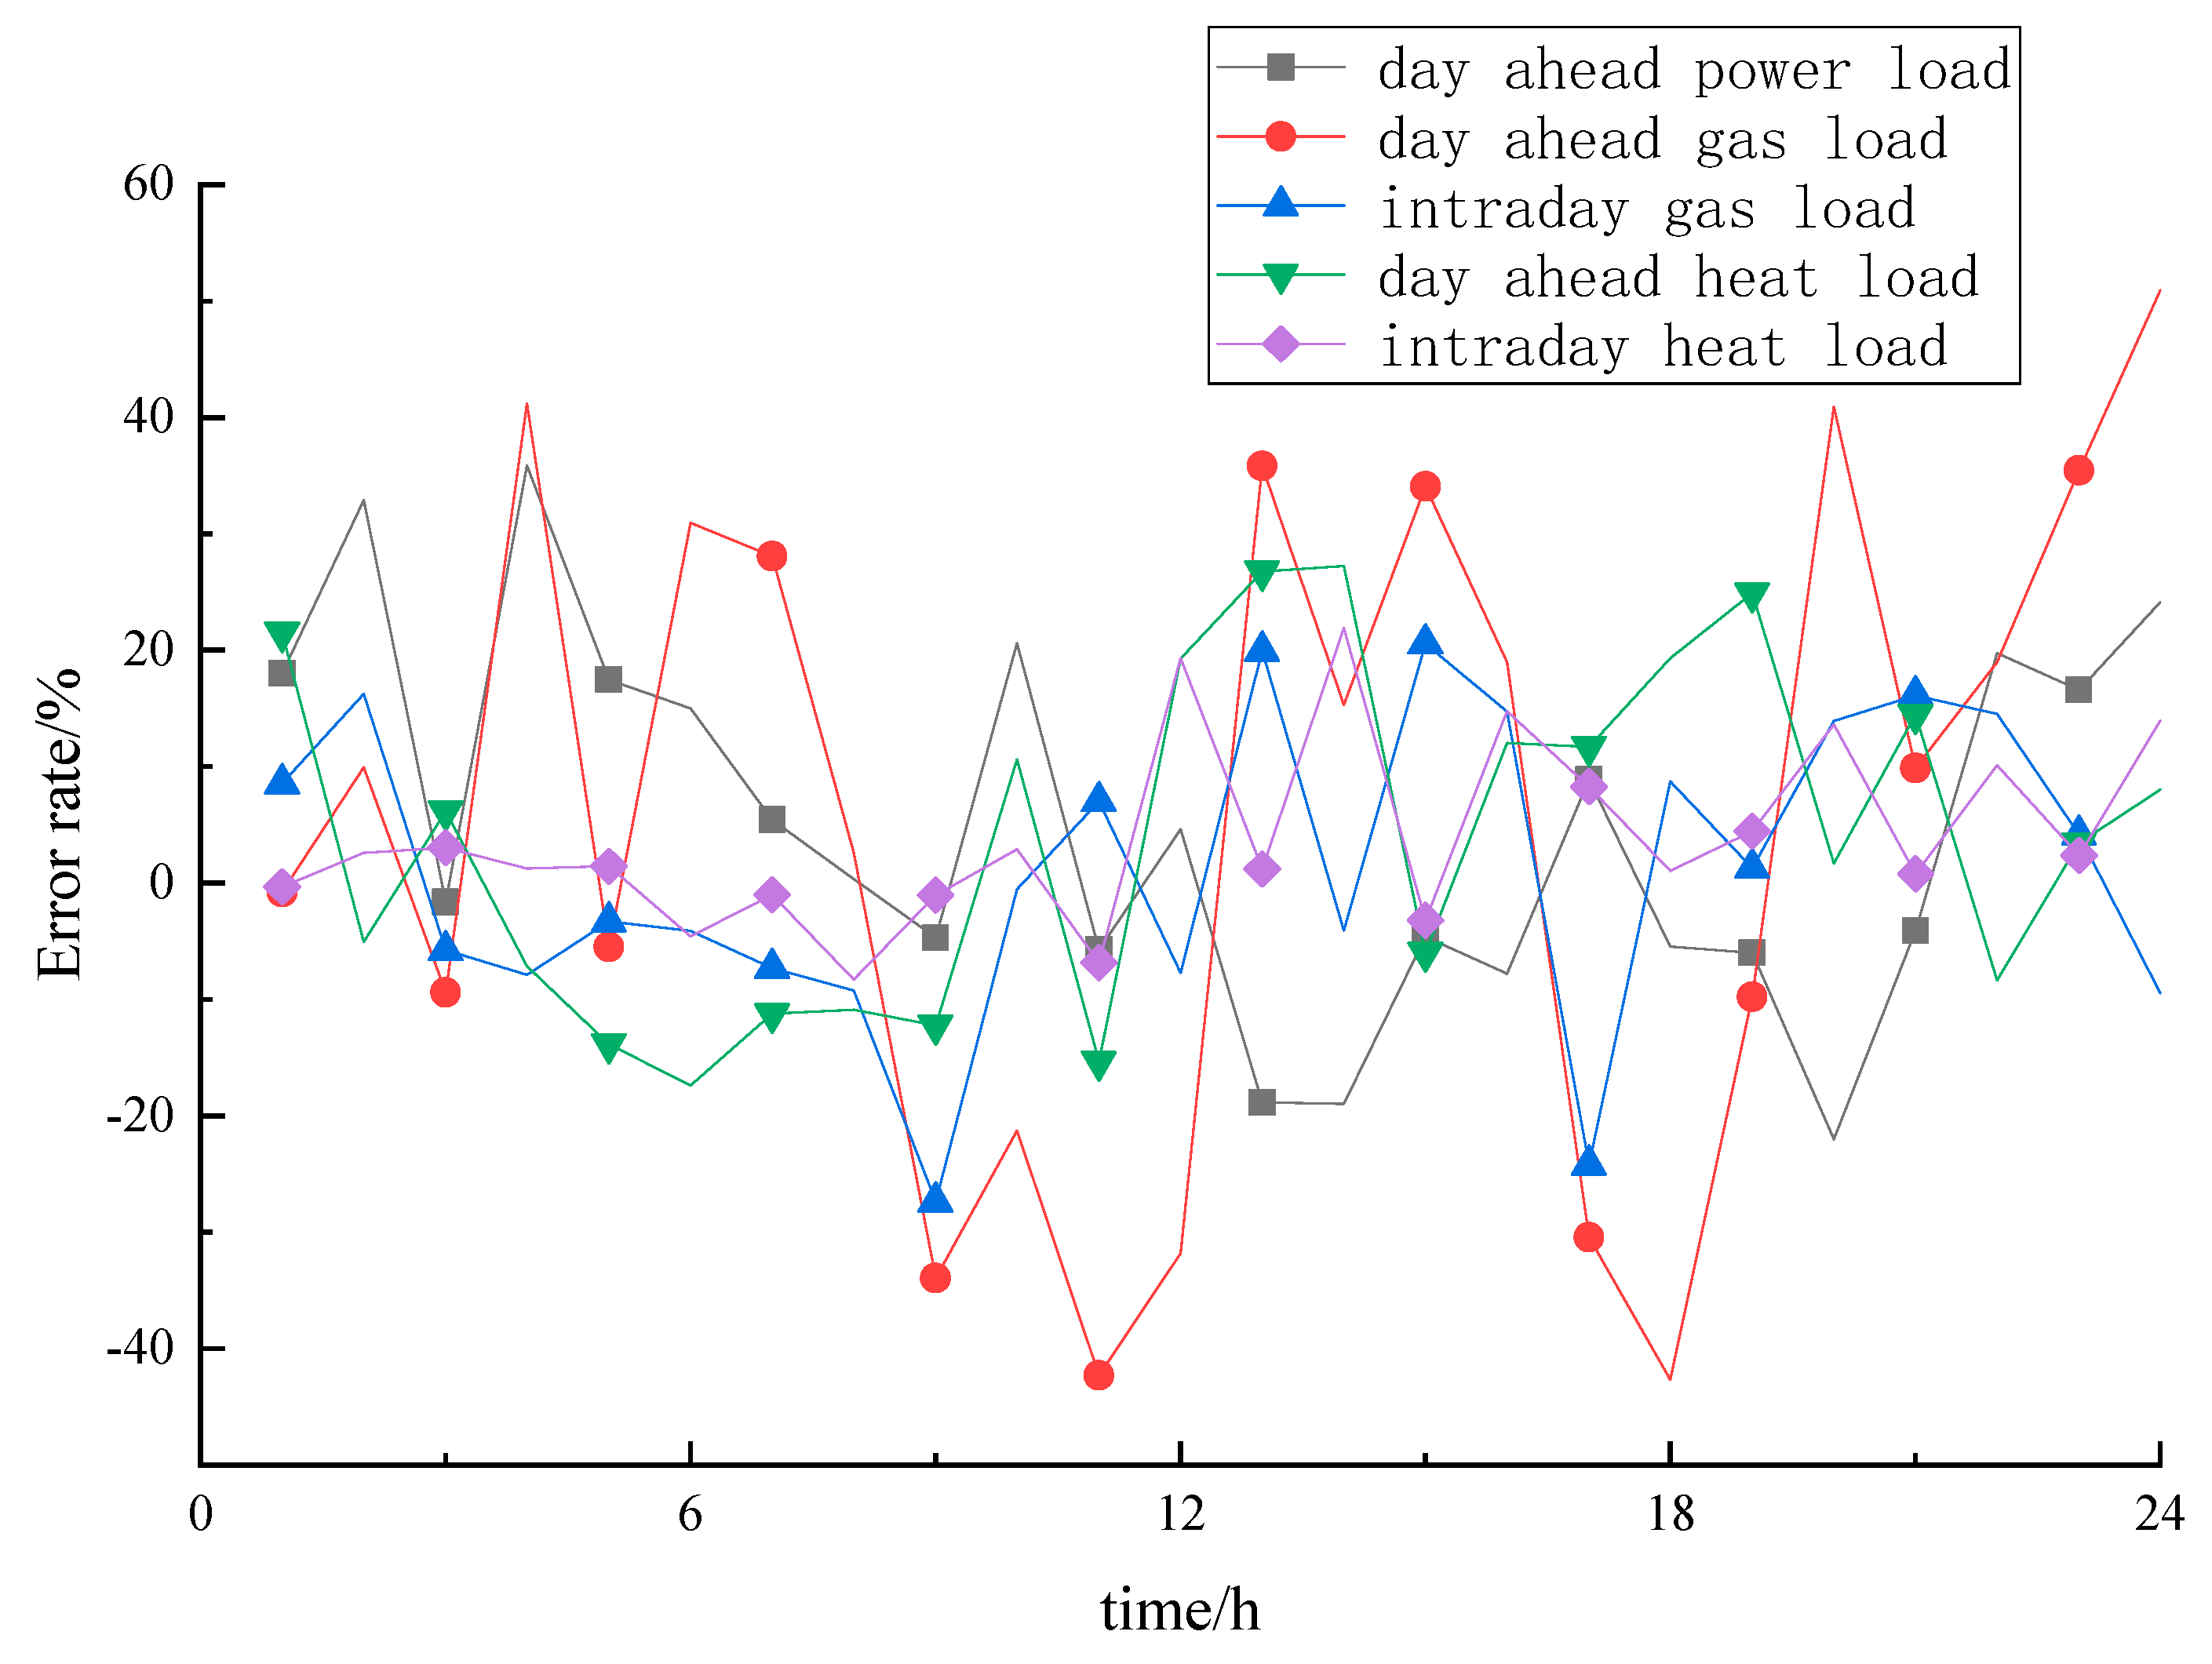
The confidence level α = 0.9 was selected to analyze the error rate between the intra-day loads and the sum of equipment output of the intra-day scheduling plan determined in scenario 3, which compared with the error rate between the intra-day loads and the sum of equipment output of the day-ahead scheduling plan determined in scenario 2. as shown in Figure 8.
It can be seen from Figure 8 that except for the high error rate of the day-ahead gas load, which is because the prediction error of the day-ahead gas load is large, the other error rates are mostly within 20%. Comparing the day-ahead and intra-day load errors, the intra-day load errors are much lower than those of the day-ahead, indicating that the scheduling scheme under the confidence level selected in scenario 3 is more accurate than the day-ahead scheduling scheme, and it can give consideration to both reliability and accuracy.

6. Conclusions

Under the background of rapid development of IES, aiming at the uncertainty of wind power, solar power and load power forecasting, a day-ahead and intra-day optimal scheduling model of integrated energy system is proposed in this paper. According to the day-ahead load power forecasting, the integrated demand response strategy is formulated, and the optimal scheduling scheme is obtained. Thus, the forecast output of intra-day wind power, solar power and load power is expressed by fuzzy parameters to participate in the optimal scheduling of the system, and the output of units are adjusted based on the day-ahead scheduling scheme according to the day-ahead forecasting results. Through the analysis of a specific example, the following conclusions are obtained:
(1)
The system scheduling level can be affected by the integrated demand response. Compared with the absence of IDR, the load curve of the system is obviously improved during the day-ahead scheduling after the implementation of IDR, and the economy and reliability of the system are improved.
(2)
The intra-day adjustment cost of the system is related to the confidence level, and the higher the confidence level, the higher the intra-day cost. That is to say, high reliability will lead to high cost, and high risk will bring high return.
(3)
After fuzzy parameters are used to represent the intra-day prediction of wind power, solar power and loads power, the optimal confidence level of the model can be obtained through simulation analysis. The optimal scheduling scheme can be determined by decision makers according to the actual demand to improve the system economy.
(4)
Compared with day-ahead scheduling only, the optimization of IES can improve the accuracy of decision-making by further shortening the time-scale of intra-day scheduling and adjusting unit output based on day-ahead scheduling scheme
In this paper, a day-ahead and intra-day optimal scheduling model of IES considering uncertainty of source & load power forecasting is proposed to study the impact of forecasting uncertainty on system operation. The fuzzy parameters are used to express the wind power, solar power and load power prediction values to participate in the optimal scheduling of the system. However, there may be other more appropriate treatment methods to study the impact of prediction uncertainty on system operation. In addition, the time scale of this study is one day, and the longer time scale factor is not considered, so further study and discussion are needed in the practical application.

Author Contributions

Writing—original draft preparation, Z.L.; writing—review and editing, Z.Z. All authors have read and agreed to the published version of the manuscript.

Funding

This research was funded by National Natural Science Foundation of China, grant number 52077108.

Acknowledgments

This work was supported by the National Natural Science Foundation of China (52077108).

Conflicts of Interest

The authors declare no conflict of interest.

References

  1. He, J.; Li, Y.; Li, H.; Tong, H.; Yuan, Z.; Yang, X.; Huang, W. Application of game theory in integrated energy system systems: A review. IEEE Access 2020, 8, 93380–93397. [Google Scholar] [CrossRef]
  2. Gong, F.; Li, D.; Tian, S.; Zhang, Y.; Shi, K.; Zhang, P.; Li, J. Review and prospect of core technologies of integrated energy system. Renew. Energy Resour. 2019, 37, 1229–1235. [Google Scholar]
  3. Jia, H.; Mu, Y.; Yu, X. Thought about the integrated energy system in China. Electr. Power Constr. 2015, 36, 16–25. [Google Scholar]
  4. Wu, J. Drivers and state-of-the-art of integrated energy systems in Europe. Autom. Electr. Power Syst. 2016, 40, 1–7. [Google Scholar]
  5. Wei, X.-X.; Liu, S.-W. Analysis on international development in distributed generation and its revelation to China. Electr. Power Technol. Econ. 2010, 22, 58–61. [Google Scholar]
  6. Li, G.; Huang, Y.; Bie, C.; An, J.; Sun, S.; Qiu, Q.; Gao, X.; Peng, Y.; Lei, Y. Review and prospect of operational reliability evaluation of integrated energy system. Electr. Power Autom. Equip. 2019, 39, 12–21. [Google Scholar]
  7. Yao, Z.; Wang, Z. Two-level collaborative optimal allocation method of integrated energy system considering wind and solar uncertainty. Power Syst. Technol. 2020, 44, 4521–4531. [Google Scholar]
  8. Lin, B.; Chen, Y. Impacts of policies on innovation in wind power technologies in China. Appl. Energy 2019, 247, 682–691. [Google Scholar] [CrossRef]
  9. Lewis, J.I.; Chai, Q.; Zhang, X. Low-carbon electricity development in China: Opportunities and challenge. In Generating Electricity in a Carbon-Constrained World; Academic Press: Cambridge, MA, USA, 2010; pp. 473–500. [Google Scholar]
  10. Chen, H.; Chen, J.; Duan, X. Fuzzy modeling and optimization algorithm on dynamic economic dispatch in wind power integrated system. Autom. Electr. Power Syst. 2006, 30, 22–26. [Google Scholar]
  11. Ai, X.; Liu, X.; Sun, C. A fuzzy chance constrained decision model for unit commitment of power grid containing large-scale wind farm. Power Syst. Technol. 2011, 35, 202–207. [Google Scholar]
  12. Li, G.; Dong, C.; Liang, Z.; Li, X.; Lu, W.; Li, Z. Cross-provincial two level optimal scheduling model considering the uncertainty of photovoltaic power generation. High Voltage Eng. 2021, 1–14. [Google Scholar] [CrossRef]
  13. Li, G.; Li, X.; Bian, J.; Li, Z. Two level scheduling strategy for inter-provincial DC power grid considering the uncertainty of PV-load prediction. CSEE 2021, 1–18. [Google Scholar] [CrossRef]
  14. Chen, R.; Sun, H.; Li, Z.; Liu, Y. Grid dispatch model and interconnection benefit analysis of concentrating solar power plants with thermal storage. Autom. Electr. Power Syst. 2006, 38, 22–26. [Google Scholar] [CrossRef]
  15. Zhang, Y.; Liu, K.; Liao, X.; Hu, Z. Multi-time scale source-load coordination dispatch model for power system with large-scale wind power. High Voltage Eng. 2019, 45, 600–608. [Google Scholar]
  16. Liu, X.; He, C.; Cheng, X.; Bo, L.; Zhang, J.; Zheng, H.; Hao, J. Day-ahead and intra-day scheduling strategy of concentrated solar power station with thermal energy storage and wind farm considering coordination between generation and load. Electr. Power 2021, 1–13. Available online: http://kns.cnki.net/kcms/detail/11.3265.TM.20200921.1349.009.html (accessed on 24 January 2021).
  17. Yuan, Q.; Wu, Y.; Li, B.; Sun, Y. Multi-timescale coordinated dispatch model and approach considering generation and load uncertainty. Power Syst. Prot. Control 2019, 47, 8–16. [Google Scholar]
  18. Dong, H.; Fang, L.; Ding, K.; Wang, N.; Zhang, Z. Peak regulation strategy of CSP plants based on operation mode of cogeneration. Acta Energ. Sol. Sin. 2019, 40, 2763–2772. [Google Scholar]
  19. Yetkin, M.; Inal, C.; Yigit, C.O. Use of the particle swarm optimization algorithm for second order design of levelling networks. J. Appl. Geod. 2009, 3, 171–178. [Google Scholar] [CrossRef]
  20. Ma, Z.; Zheng, Y.; Mu, C.; Ding, T.; Zang, H. Optimal trading strategy for integrated energy company based on integrated demand response considering load classifications. Int. J. Electr. Power Energy Syst. 2021, 128. [Google Scholar] [CrossRef]
  21. He, L.; Lu, Z.; Geng, L.; Zhang, J.; Li, X.; Guo, X. Environmental economic dispatch of integrated regional energy system considering integrated demand response. Int. J. Electr. Power Energy Syst. 2019, 116, 105525. [Google Scholar] [CrossRef]
  22. Yi, S.; Zhang, P.; Yang, M.; Bai, H.; Yang, Q. Multi-time scale optimal scheduling of integrated energy system considering demand-side response. Proc. CSU-EPSA 2020, 32, 35–42. [Google Scholar]
  23. Xiong, H.; Xiang, T.; Chen, H.; Lin, F.; Su, J. Research of fuzzy chance constrained unit commitment containing large-scale intermittent power. Proc. CSEE 2013, 33, 36–44. [Google Scholar]
  24. Zhai, J.; Ren, J.; Zhou, M.; Li, Z. Multi-time scale fuzzy chance constrained dynamic economic dispatch model for power system with wind power. Power System Technol. 2016, 40, 1094–1099. [Google Scholar]
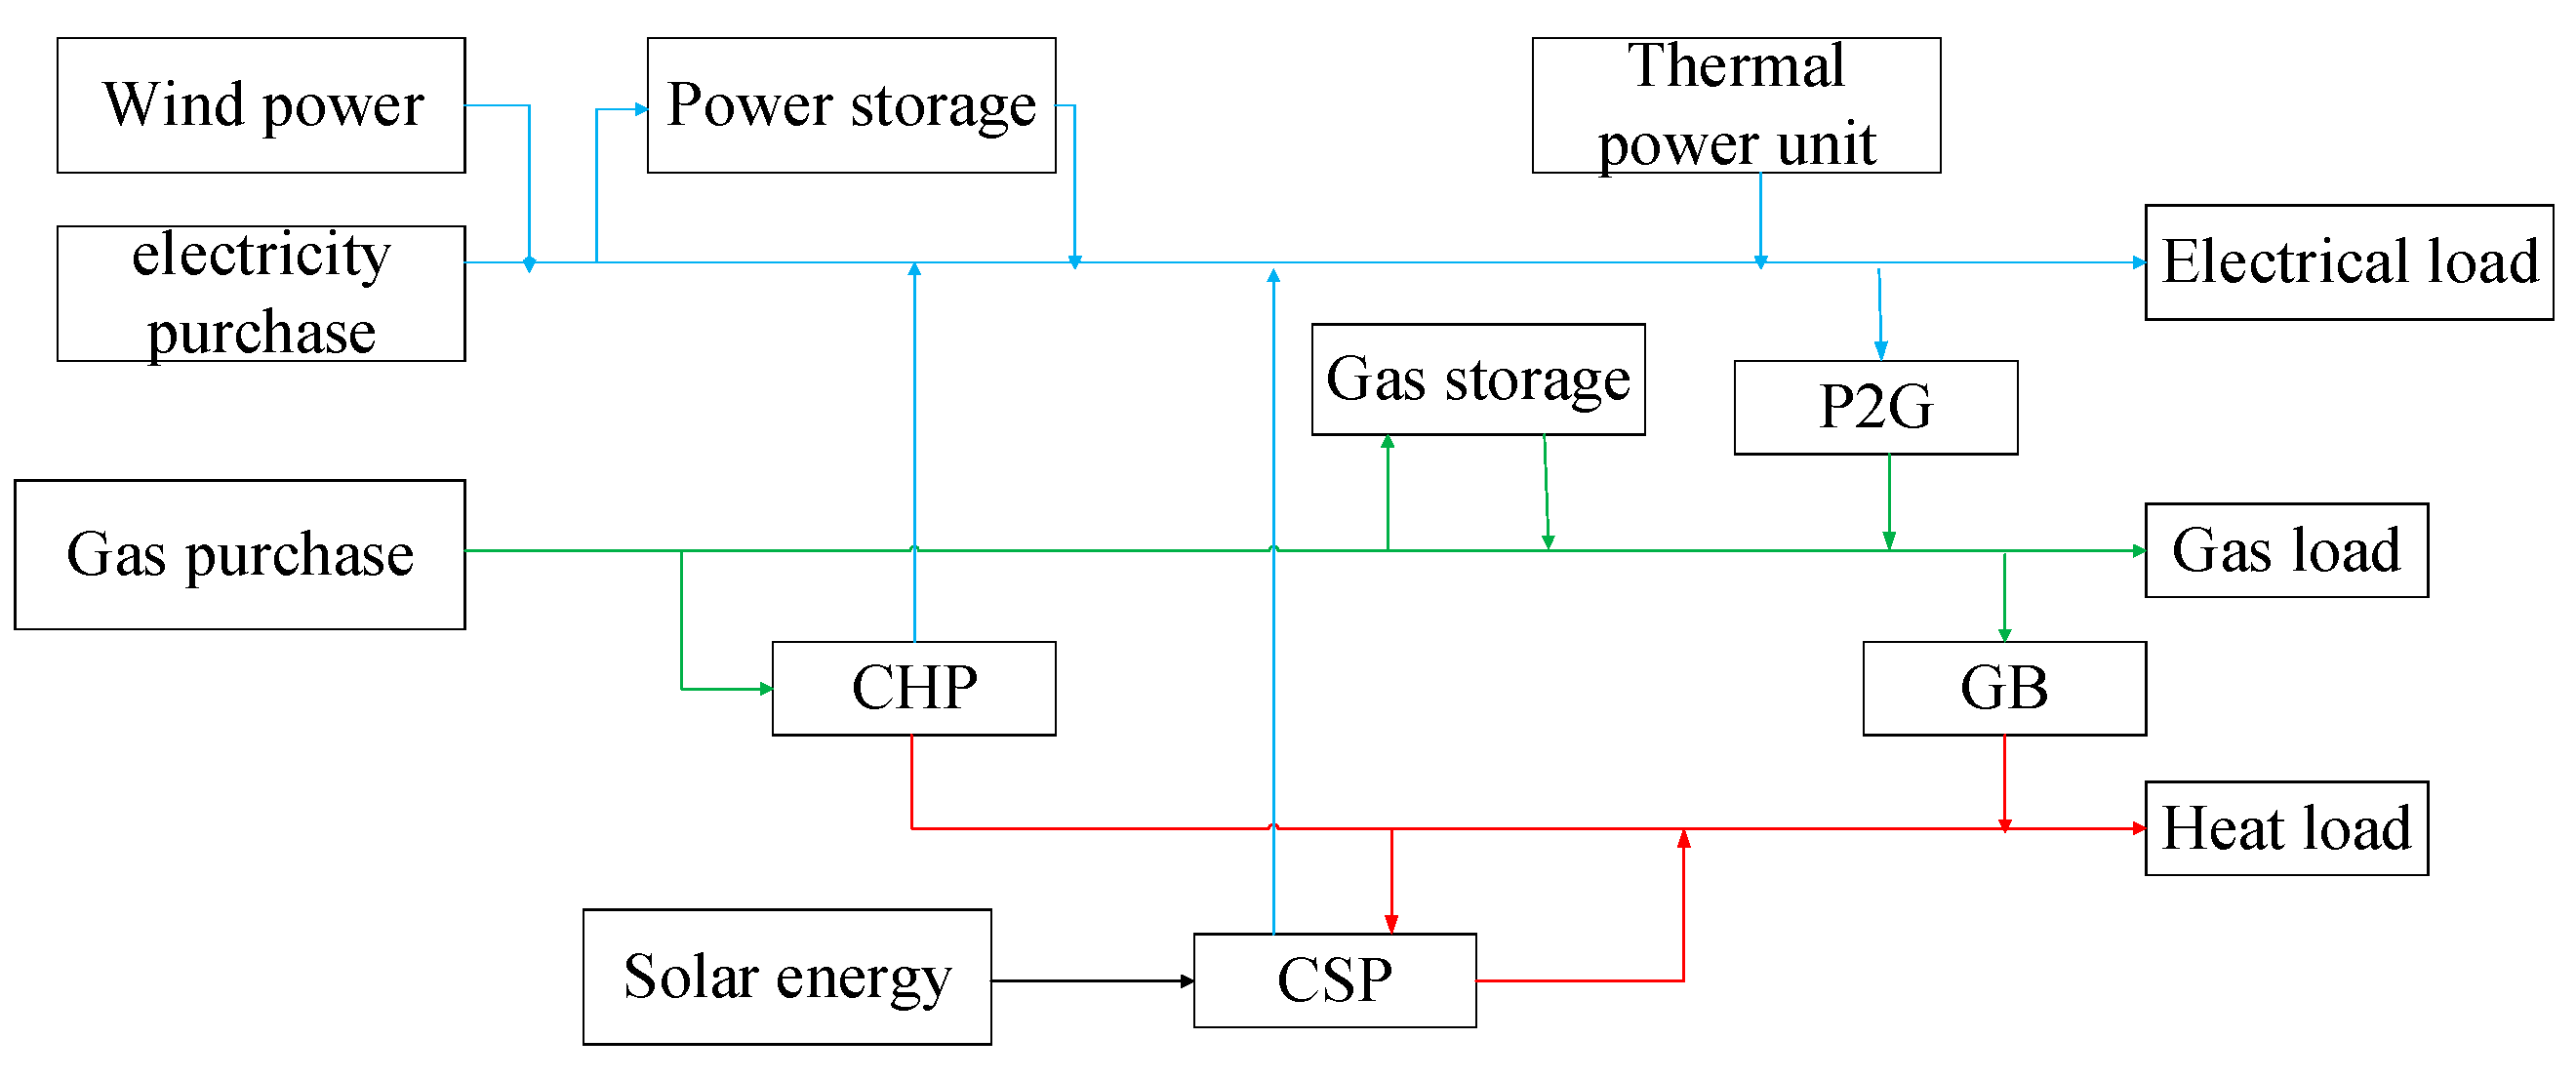
Figure 1. The structure of IES.
Energies 14 02539 g001
Figure 2. Simplified model of CSP.
Energies 14 02539 g002
Figure 3. Day-ahead and intra-day scheduling model.
Energies 14 02539 g003
Figure 4. Day-ahead prediction of source & load power [22].
Energies 14 02539 g004
Figure 5. Intra-day forecast of source & load power.
Energies 14 02539 g005
Figure 6. Output of some equipment.
Energies 14 02539 g006
Figure 7. Cost under different confidence levels.
Energies 14 02539 g007
Figure 8. Error rate of each load in day-ahead and intra-day.
Energies 14 02539 g008
Table 1. Operating parameters of components.
EquipmentEfficiencyOperation and Maintenance Cost (Yuan/MW)Output Range (MW)
GT0.441(0,100)
P2G0.650(0.50)
GB0.8536(0,100)
WHB0.435(0,20)
CSP0.450(0,20)
ES0.918(−15,15)
GS0.918(−20,20)
TS0.916(−10,10)
Table 2. Energy purchase price.
ClassSegmentPeriodPrice (Yuan/MWh)
ElectricPeak period10:00–15:001112/1155
18:00–21:00
Normal period07:00–10:00667/617
15:00–18:00
21:00–23:00
Valley period00:00–07:00322/298
23:00–24:00
GasPeak period08:00–12:00428/441
16:00–19:00
Normal period06:00–08:00210/196
12:00–16:00
19:00–22:00
Valley period22:00–06:00162/151
Table 3. Trapezoidal fuzzy parameters.
Fuzzy Parameterω1ω2ω3ω4
Wind power0.60.91.11.4
Solar power0.750.91.11.25
Loads0.90.951.051.1
Table 4. Operating costs in different scenarios.
ScenarioTotal Cost (Yuan)Electricity Purchase Cost (Yuan)Gas Purchase Cost (Yuan)
12,380,977.356308,359.03271,700,017.44
22,221,565.65287,023.33571,572,484.016
Publisher’s Note: MDPI stays neutral with regard to jurisdictional claims in published maps and institutional affiliations.