Article

Experimental Study on Mechanical Properties of Hydrate-Bearing Sand: The Influence of Sand-Water Mixing Methods

Key Laboratory of Ocean Energy Utilization and Energy Conservation of Ministry of Education, Dalian University of Technology, Dalian 116024, China
*
Author to whom correspondence should be addressed.
Energies 2021, 14(9), 2554; https://doi.org/10.3390/en14092554
Submission received: 29 March 2021 / Revised: 24 April 2021 / Accepted: 25 April 2021 / Published: 29 April 2021

Abstract

:
Laboratory-synthesized specimens are employed for an experimental study on the mechanical properties of hydrate-bearing sediments (HBS) due to the difficulty of field coring. A representative synthesized sample for the analysis of the mechanical properties of HBS in the experimental study requires evenly distributed hydrates in the pores of the sample. However, a specimen made with an improper sand–water mixing method might have an uneven water distribution, resulting in an uneven hydrate distribution when applying the ice-seeding method for hydrate formation. This study adopted three kinds of methods to mix sand and water before forming hydrates and applied the low-field nuclear magnetic resonance (NMR) technique to investigate how these methods affect the hydrate distribution, further affecting the mechanical properties. To analyze the mechanical properties of HBS, we conducted drained triaxial tests. As shown in low-field NMR, when we compacted a sample of the sand–water mixture and froze it upside-down before hydrate formation, a sample with an even water distribution was obtained. Subsequently, the hydrate in HBS distributed also evenly. The stress-strain curves present different strain softening and hardening patterns due to the different hydrate distributions. Moreover, the samples with the evenly distributed hydrates have higher initial elastic modulus and strength than the ones made with other methods.

1. Introduction

Natural gas hydrate, a crystalline material composed of a water cage surrounding natural gas molecules [1,2], exists widely in deep permafrost and submarine strata where there are the proper temperatures and pressures, as well as abundant natural gas [3,4]. It is considered to be a prospective resource of natural gas due to its high energy density and the enormous amount of reserves [5,6]. Commercial exploitation of natural gas hydrate has not been achieved, and it is still in the research stage, due to the safety problem of exploitation and gas transportation [7,8]. The exploitation methods proposed so far include depressurization, inhibitor injection, gas replacement, and thermal stimulation [9,10,11,12]. The decomposition of hydrate will destroy the original cemented structure of the reservoir, which may prompt strata instability and even climate change [13,14]. Hence, it is of vital importance to study the mechanical properties of hydrate-bearing sediments (HBS) for the efficiency and safety of natural gas hydrate production.
Currently, a number of researchers have done numerous experimental studies on the mechanical properties of hydrate sediments. Yun et al. [15] have studied the mechanical properties of sand, silt, as well as clay containing tetrahydrofuran (THF) hydrate. They reported that the mechanical properties of HBS appeared to be influenced by hydrate concentration. However, researchers widely agreed that THF molecule was distinct from the methane molecule, which led to different mechanical properties [16]. Hyodo et al. [17] focused on the mechanical properties and dissociation characteristics of sands containing methane hydrate. Results indicated that the strength of methane hydrate sand increased with methane hydrate saturation due to particle bonding. Wang et al. [18] chose clay for host sediment and remolded hydrate-bearing sample, investigating the undrained mechanical behavior of the sediments in fine-grained sediments of the South China Sea. The experiment’s results showed that the failure strength of methane-hydrate-bearing sediments increased with the increase in hydrate saturation and initial effective mean stress. From the microscopic aspect, Wu et al. [19] presented an original pore-scale 3D morphological modeling algorithm in view of different saturations and occurrences of hydrate in sediments, based on X-ray computed tomographic images.
Generally, hydrate-bearing samples are synthesized in the laboratory for triaxial tests, given the limitations of field coring techniques and their cost. At present, the partial water saturation method is the most popular and widely-used remold technique in which hydrate can form in situ. Its water in sample shows a vertical aggregation due to gravity [20], especially for sand samples, and its hydrate distribution is uneven [21], because hydrate distribution depends on initial water/ice distribution [22]. Uneven distribution of hydrate will cause the heterogeneity of the sample, lowering its representativeness. Zhou et al. [23] proposed an advanced soil model to better represent the heterogeneous structure of the hydrate-bearing sediments, and gave more accurate mechanical responses for numerical simulation. Liu et al. [24] modeled specimens with uneven hydrate distributions, simulated the triaxial compression test process of the specimens using the discrete element method, and confirmed that the heterogeneity of hydrate distribution has great impacts on the mechanical properties of HBS. It is crucial to figure out how to achieve an even hydrate distribution despite the effect of gravity on pore water when using the partial water saturation method. Moreover, in frozen soil research, Terms et al. [20] has studied the effect of sample preparation on the strength of artificially frozen sand and found that the method of sand–water mixture is important for sample homogeneity. Ma et al. [25] has revealed that the moisture content of different locations in a sample is related to the sand–water mixing method used. Namely, water distribution was determined by the sand–water mixing methods. The ice-seeding method, as another in situ hydrate formation method, has an even hydrate distribution in sample [21]. Moreover, the hydrate is formed in the exact position where ice has been, because hydrate forms while ice melts. However, its main occurrence of hydrate is load-bearing, with a lack of cementing [16], so few scholars use it. Combining the hydrate formation step with the ice-seeding method, the partial water saturation method can be modified to synthesize a sample with both uniform hydrate distribution and cementing structure. In this new method, to obtain a sample with evenly distributed hydrate, the emphasis is on the sand–water mixing operation and whether it can achieve even water distribution and keep it still.
Previous studies have synthesized samples with various methods, as mentioned above. Scholars have not taken the uneven hydrate distribution of samples into consideration, which may cause the difference in experimental results. Although the effect of sand–water mixing methods on the strength of frozen sand has been studied, there is not sufficient research about HBS. In this paper, three commonly used sand–water mixing methods were proposed to study their influence on the mechanical properties of HBS. The low-field nuclear magnetic resonance (NMR) technique, which has been applied to clathrate hydrate research [26], was introduced to detect the water distribution in samples thoroughly. Correspondingly, drained triaxial tests were conducted to investigate sand–water mixing methods’ influence on the mechanical properties of hydrate-bearing sediments. The saturation profile of water and stress-strain curves were acquired to verify the influence of the sand–water mixing methods on the stress-strain relationship and dilatant behavior of HBS. In the end, we found a sand–water mixing method showing the most robust mechanical properties.

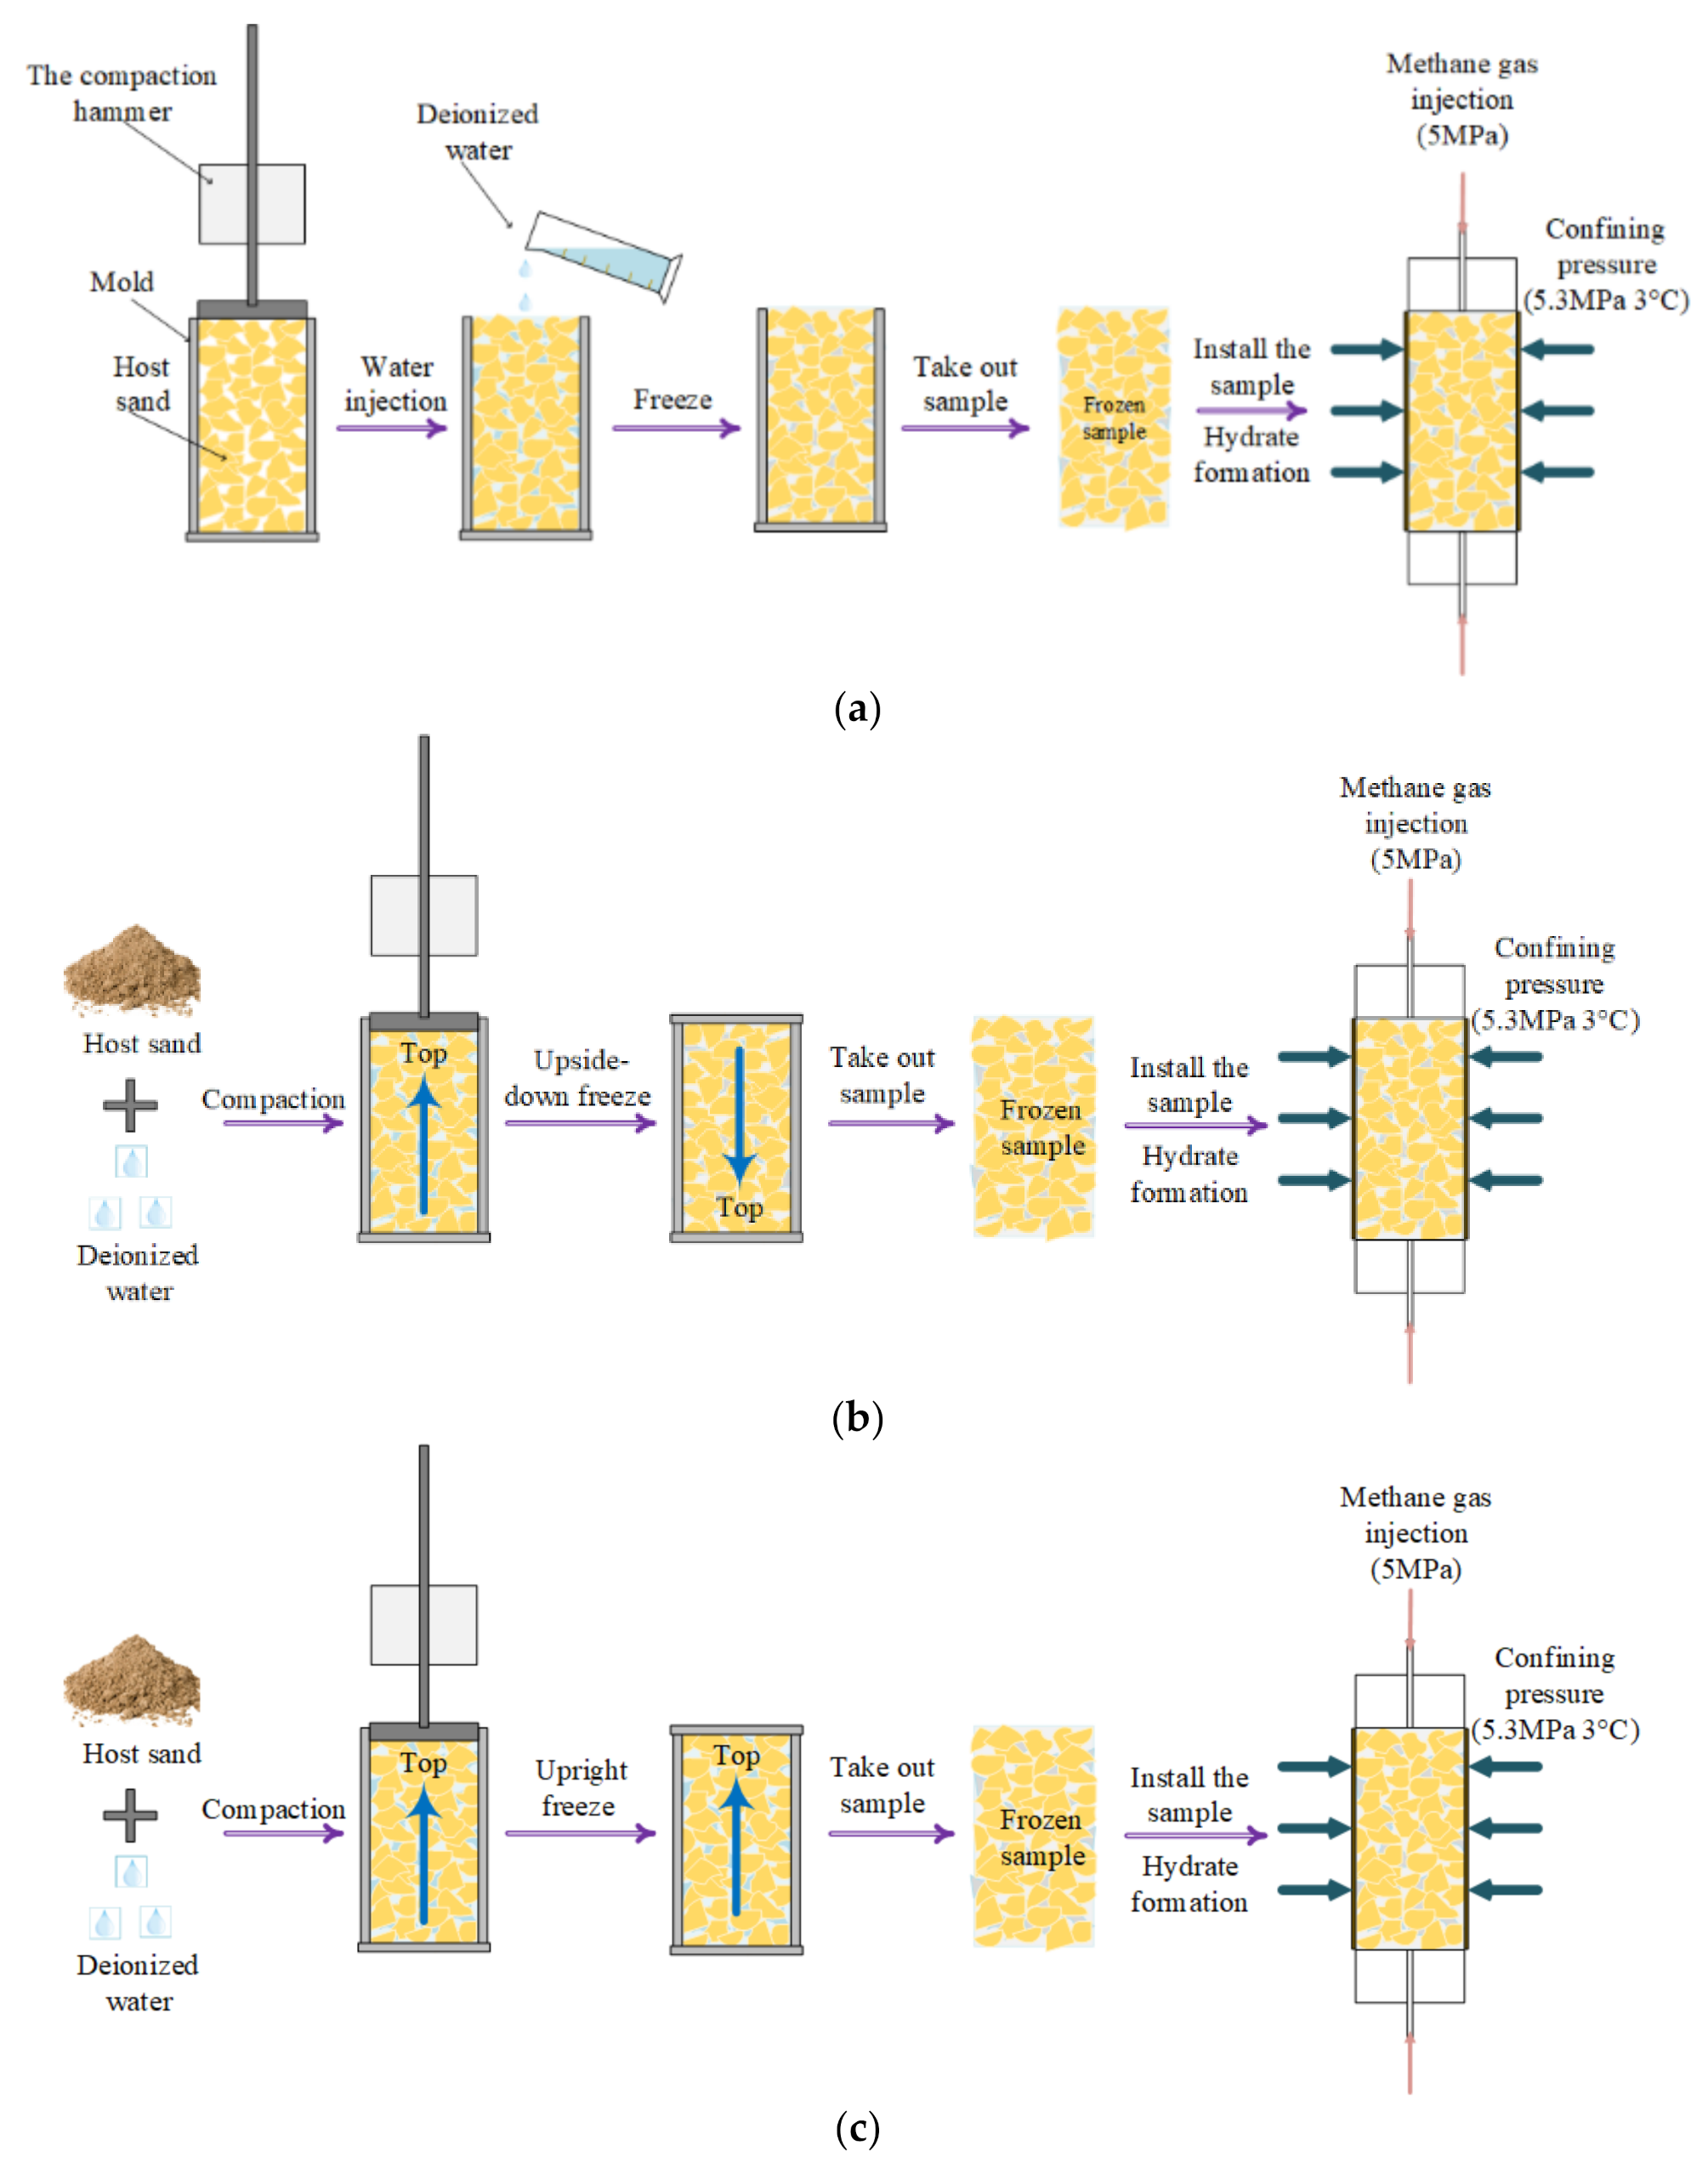
2. Materials and Methods

2.1. Materials

Sand is a common sediment in the area of oil and gas exploitation [27], so it was selected as the host sediment in this study. We used silica sand (China ISO standard sand) as the raw material and it was sifted to the proper grain. The median grain diameter was approximately 224 μm. The porosity was set to 40%, and only deionized water was used.
Besides, the partial water saturation method of sand–water mixing was used for sample molding, and the ice-seeding method was used for in situ hydrate formation in the host sample (61.8 mm diameter, 125 mm height). In the sample preparation process, three different sand–water mixing methods were conducted. Figure 1 shows the schematic diagrams of these three methods.
In method 1, as shown in Figure 1a, the dry sand was compacted in a mold by 15 layers, and each layer was tamped 20 times by the compaction hammer. About 75 g of water was injected into the samples from the top. Then, the mold was put into a low-temperature freezer (−20 °C) for more than 12 h. After that, the frozen sample was taken out from the mold and rapidly installed in the triaxial apparatus. The temperature and pore pressure were set to appropriate values for hydrate formation (3 °C, 5 MPa). The sample made using method 1 is called sample 1.
In method 2, as shown in Figure 1b, the host sand was mixed with about 75 g of water, uniformly at first. Then, the mixture was compacted in the mold with 15 layers, and each layer was tamped 20 times by the compaction hammer. The mold containing the mixture was put into the low-temperature freezer (−20 °C) upside-down for more than 12 h. Then, the frozen mixture taken out from the mold was set up in the triaxial test apparatus. After that, the temperature and pore pressure were set to hydrate formation values (3 °C, 5 MPa). The sample made using method 2 is called sample 2.
Method 3, as shown in Figure 1c, was the same as the last method, except that the mold was frozen upright. The sample made using method 3 is called sample 3.
Samples were put in the triaxial test apparatus still for in situ hydrate formation. Then, low-temperature methane gas (3 °C) was gradually injected into the specimen from the lower end. It takes about two days to form hydrate completely. The hydrate saturation is calculated from the methane gas consumption read by the ISCO pump. The hydrate saturation calculation is conducted as in Shen et al. [28], and specifically, the equation is shown as the following:
S h = V h V p
V h = m h ρ h
m h = P V g Z R T M h
where S h is hydrate saturation; V h is the volume of hydrate in the pore space; V p is the pore volume of the host sand; m h   and ρ h represent the mass and density of the hydrate, respectively; V g   refers to the amount of the methane gas consumed by the samples, and M h refers to the molar mass of methane hydrate; P means the hydrate formation pressure, Z is the compressibility factor, and R is the value of the gas constant, T means the hydrate formation temperature. Based on the hydrate saturation calculation method, the hydrate saturations of these samples were equal to 58.1% for sample 1, 59.4% for sample 2, and 59.7% for sample 3. The hydrate saturations of these three samples are close to each other.
After two days of hydrate formation, the 3 °C deionized water was injected into the sample through a plunger pump to saturate the samples. During the saturation process, the differential pressure between the inlet and outlet was kept at 200 kPa. After the sample was fully saturated, an effective confining pressure of 2 MPa was applied to the sample for 12 h to be consolidated.

2.2. Methods

2.2.1. Low-Field NMR

The distribution of hydrates may be affected by the distribution of water in the sample before hydrate formation, which can be obtained by low-field NMR. The measurements were accomplished by a 12.74 MHz NMR system (Oxford Instruments, Abingdon, UK). A customized nonmagnetic sand-packed tube, whose inner space had a diameter of 25 mm and height of 50 mm, was used for sample holding. The frozen sample was packed into the tube to be put in the NMR system vertically. During the test, each type of sample was detected several times. One-dimensional saturation profiles were collected by GIT software (Green Imaging Technologies, Fredericton, NB, Canada), observing water content distribution. The field of view was 7 cm, ranging from −3.5 cm to 3.5 cm. Generally, samples were placed in the center from −2.5 cm to 2.5 cm.
It should be noted that the samples utilized in NMR were smaller than those used in the triaxial test due to the limitation of the NMR apparatus size. To ensure identical water saturation, the total volume of water and host sand was appropriately reduced. As a matter of fact, the theoretical water saturation will not be achieved, precisely because the loss in operation is inevitable. The actual water saturation only depends on the measurement results of proton NMR.

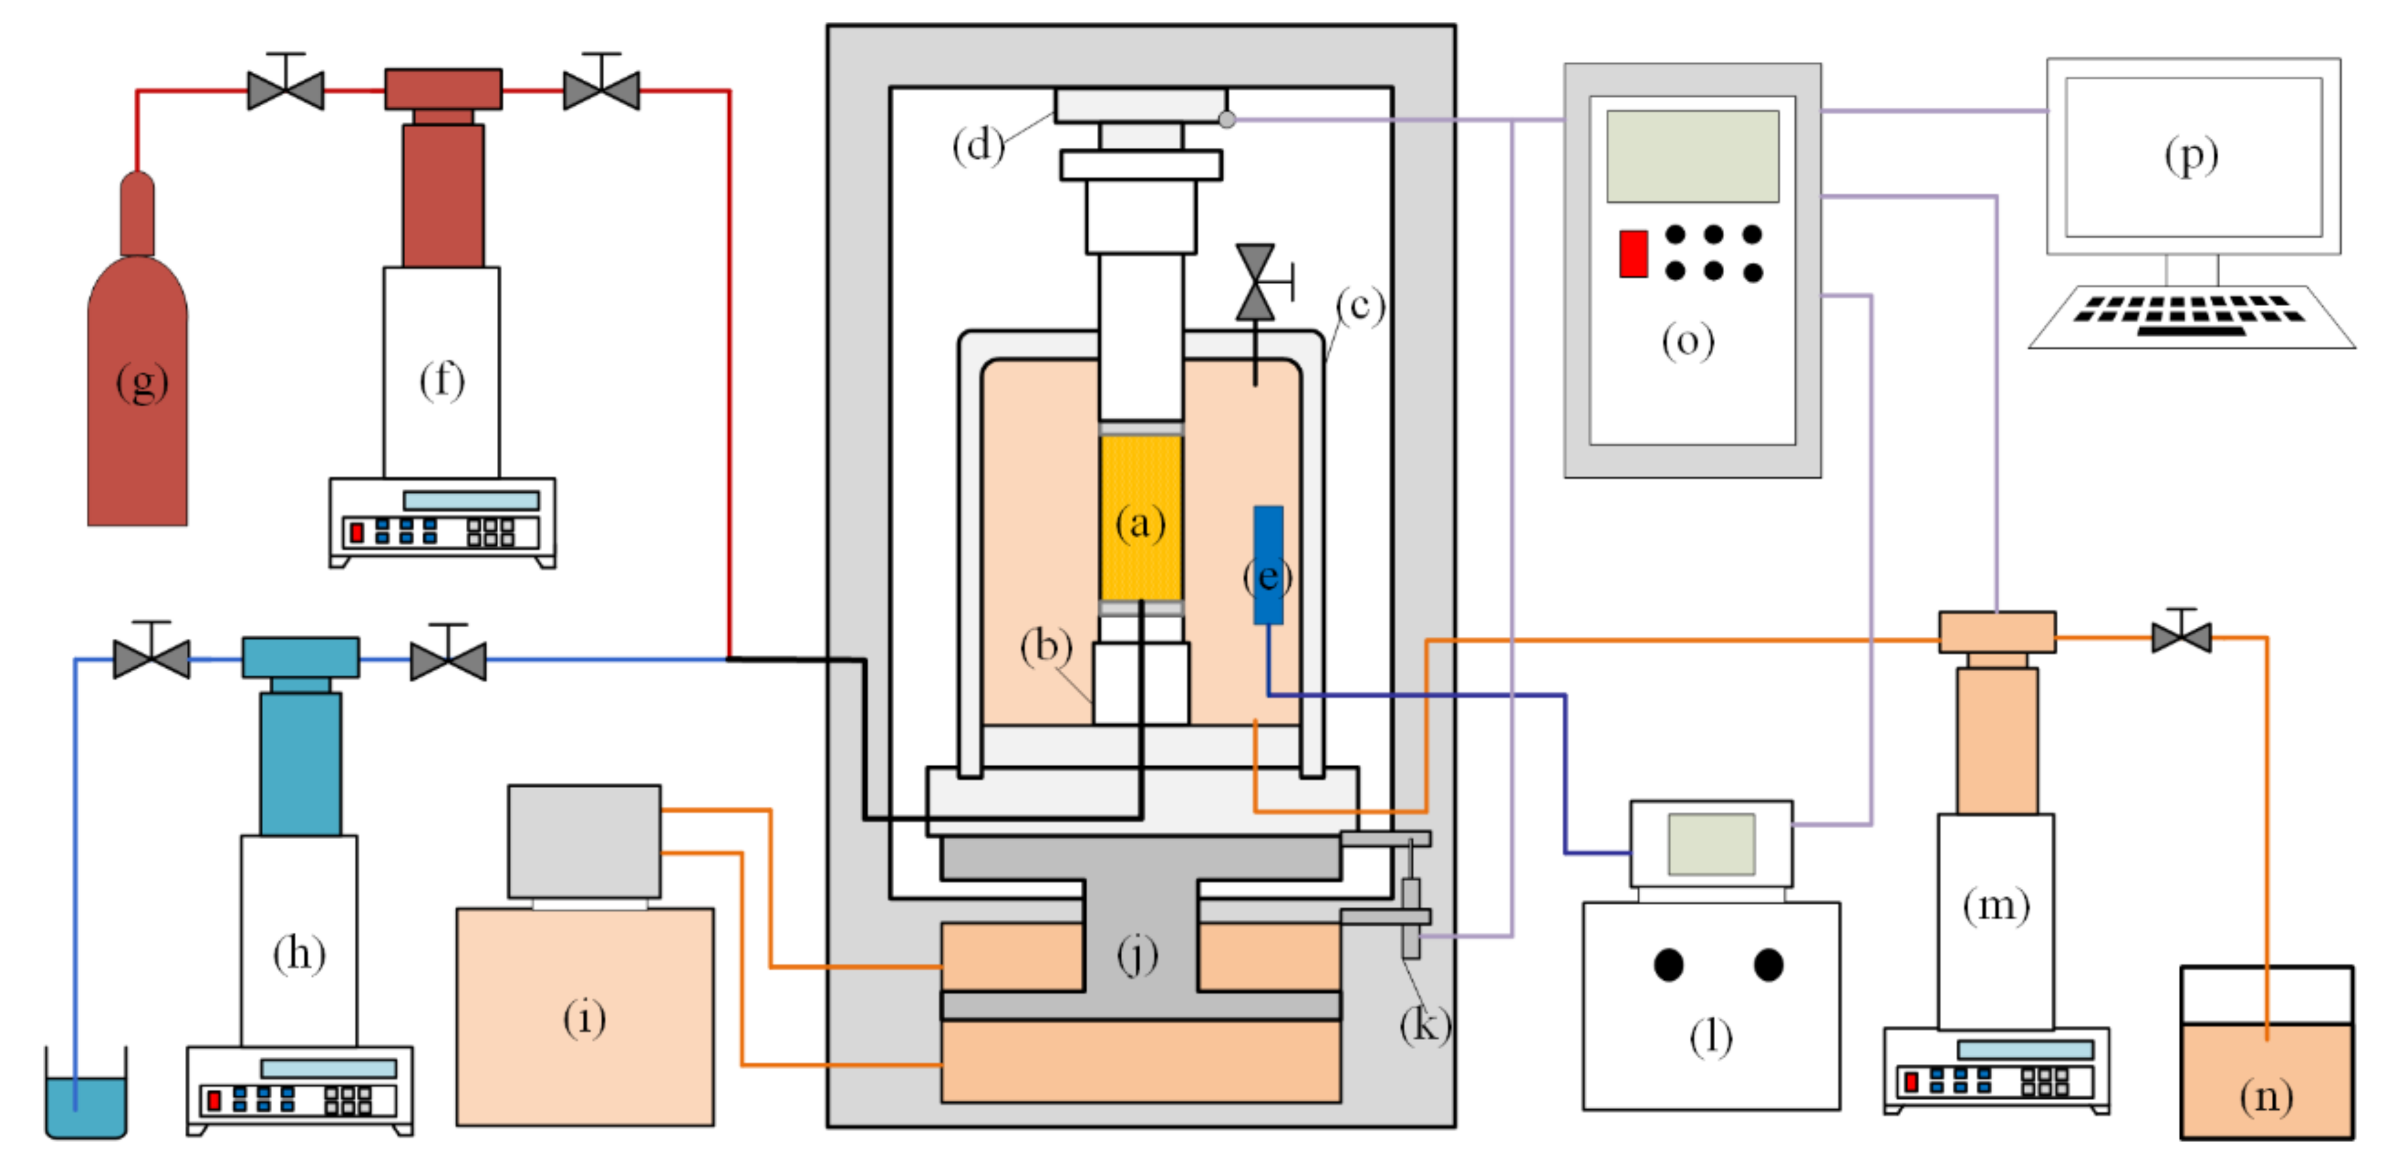
2.2.2. Triaxial Test Apparatus

Based on the temperature-controlled and high-pressure triaxial testing equipment we developed, a series of drained triaxial tests were carried out, as shown in Figure 2. The hydraulic system, including the hydraulic oil source and a syringe pump (Teledyne ISCO, 500D, Lincoln, NE, USA), is able to provide confining pressure ranging from 0 to 20 MPa and an axial load capacity of 600 kN. The pore pressure capacity of 25 MPa is achieved by another ISCO pump. Water was injected into the sample through a syringe pump during the saturation process. The temperature of the tested specimens can be regulated by a circulation thermostatic water bath ranging from −35 °C to room temperature with an accuracy of ±0.1 °C. Affixed to the outside of the load cell, the linear variable displacement transducer (LVDT) measures the axial deformation of synthesized specimens during the test process. Data is recorded in the data acquisition module.

2.2.3. Drained Triaxial Test

After consolidation, the hydrate-bearing sample was sheared under a constant shear rate. Meanwhile, the pore pressure and effective confining pressure remained unchanged by setting the plunger pump to constant pressure mode. The test was finished when the strain reached 40%. During the triaxial test, the stress-strain curve was recorded. By reading the change in the amount of water in the syringe pump, we can calculate the volumetric strain of the test sample. By testing different kinds of samples, we can study the influence of various sand–water mixing methods on the mechanical properties of HBS.

3. Experimental Results

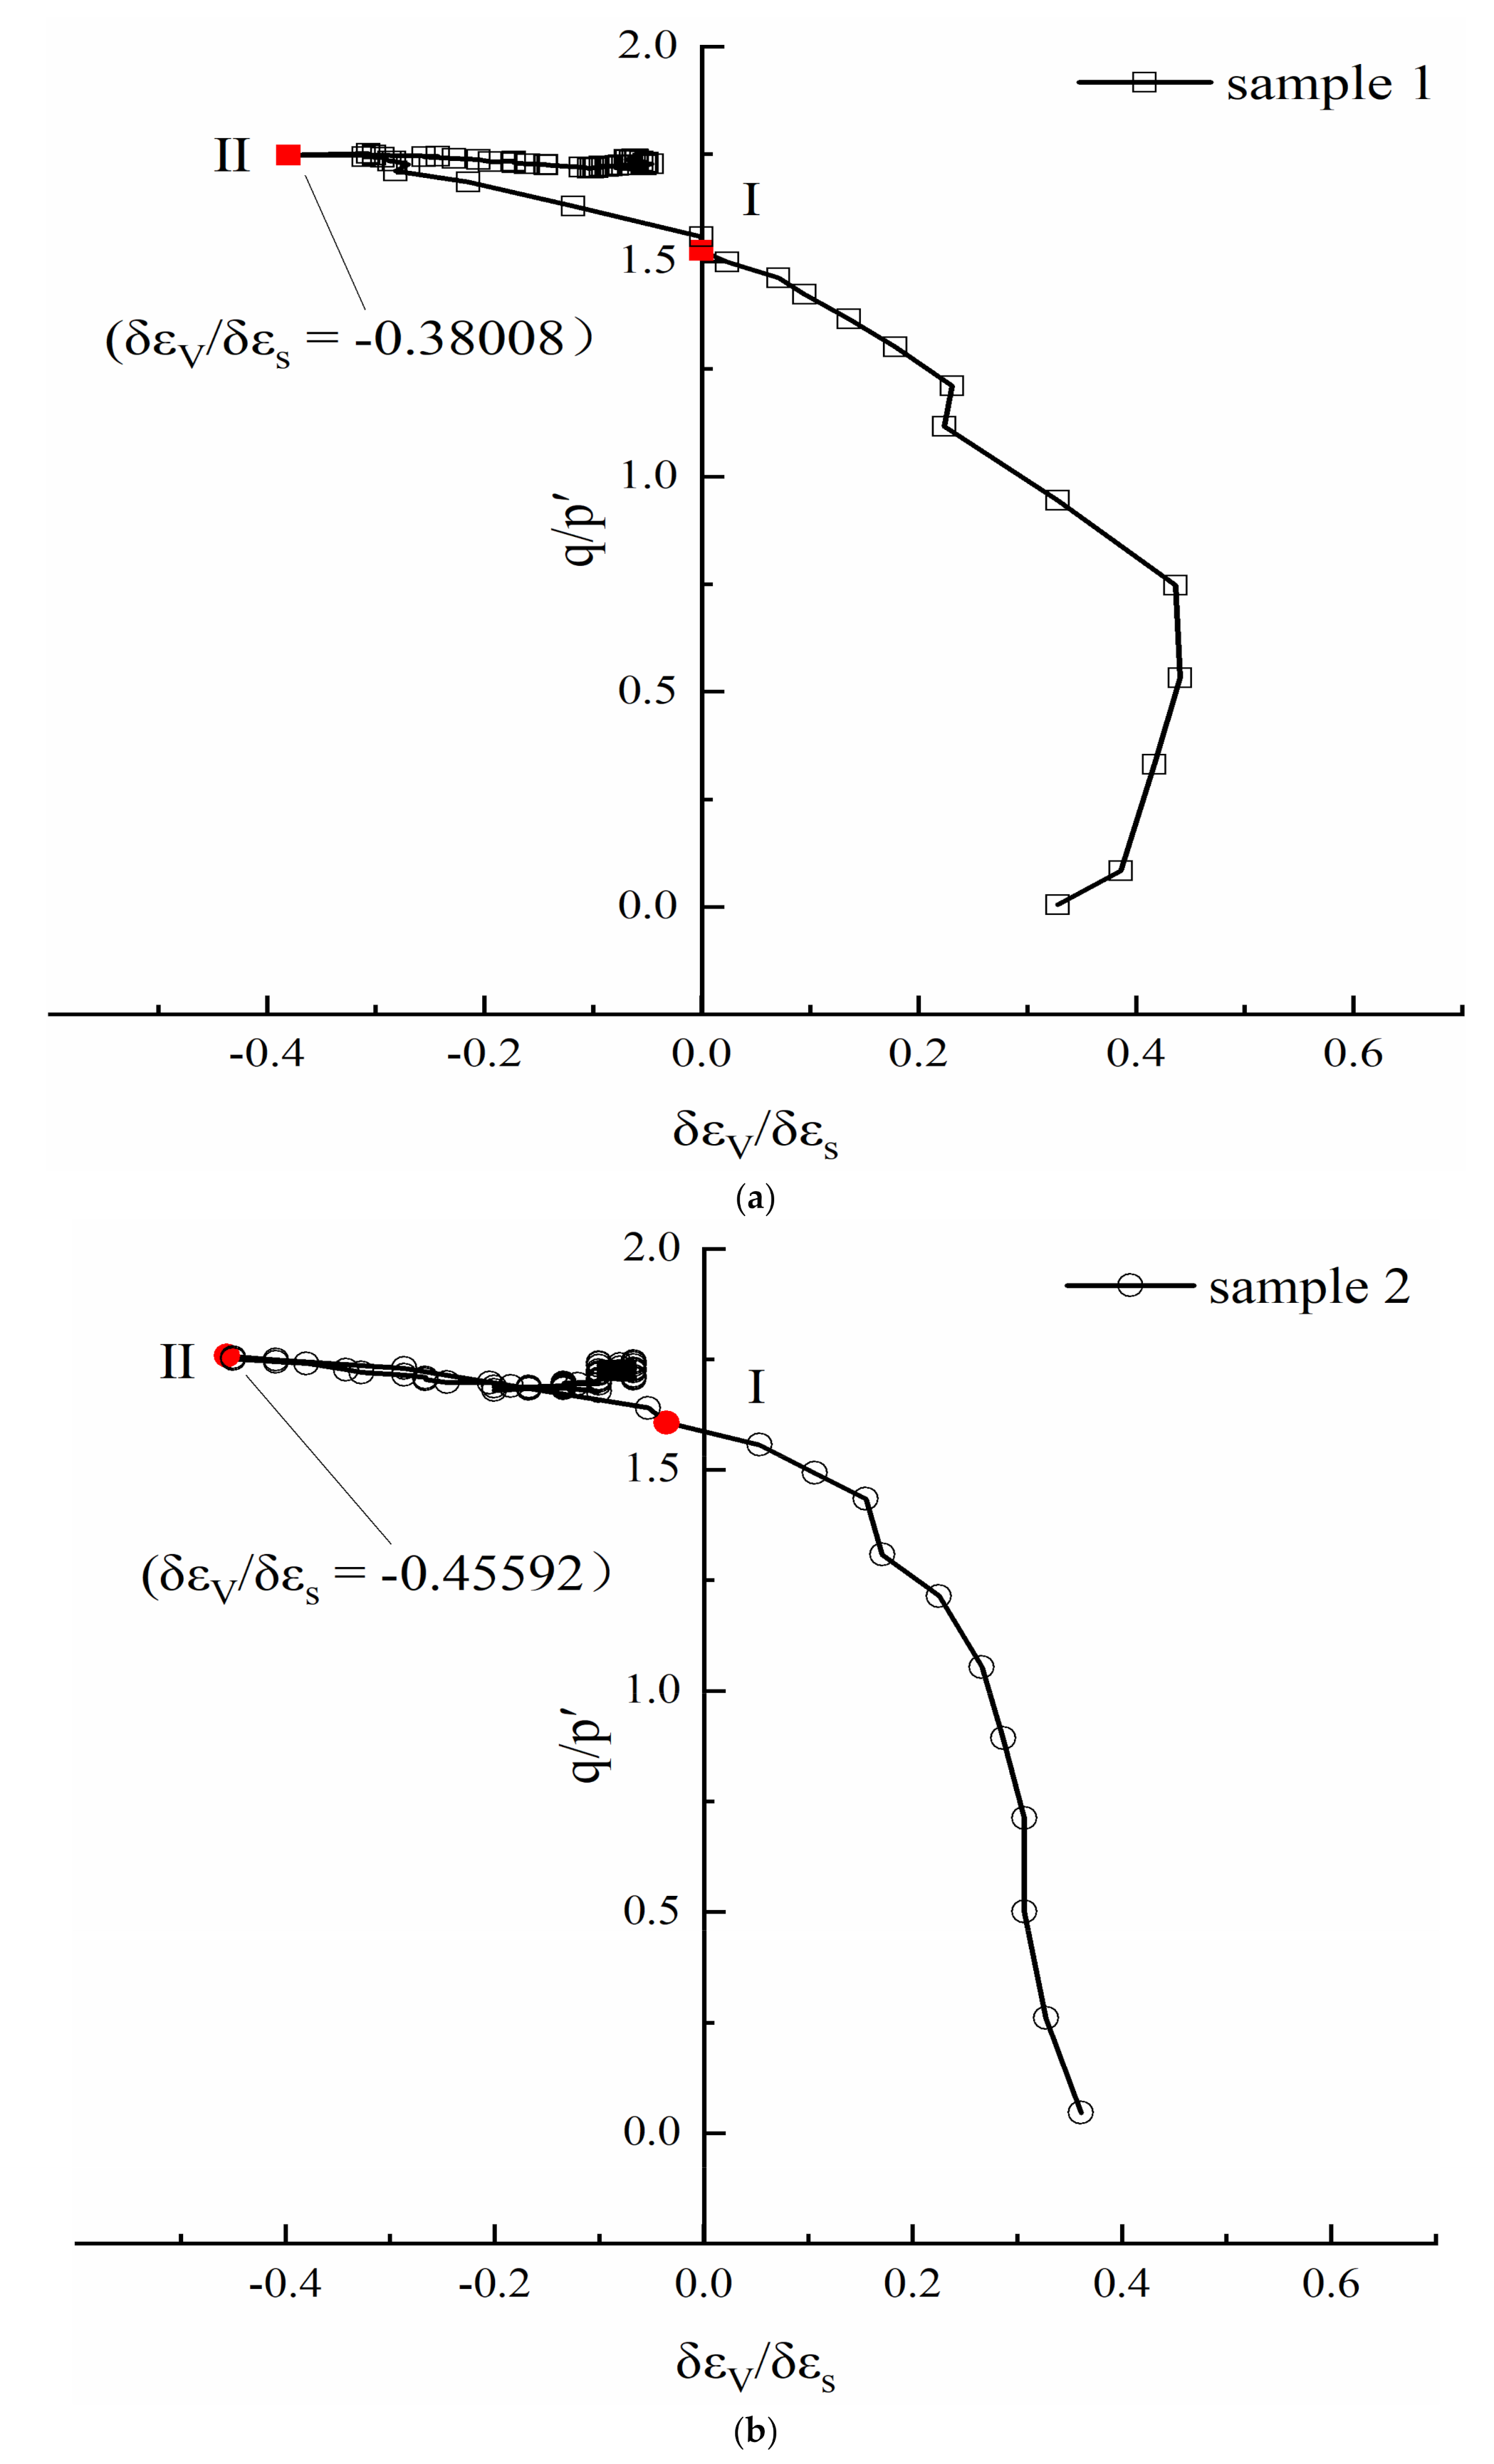
3.1. Stress-Strain Relationship and Dilatancy

The stress-strain curves and volumetric strain curves are shown in Figure 3. The mechanical properties of the three samples obtained by different sand–water mixing methods present apparent differences. As discussed above, all the test conditions were the same for these tests, except for the sand–water mixing method. Therefore, the test results are able to indicate the effects of sand–water mixing methods on the mechanical properties of the samples. The stress-strain curves in which the strain reaches 40% are shown in Figure 3. The peak strength of sample 2 is higher than that of sample 1. With the increase of strain, the stress of sample 2 become lower than that of sample 1 when the strain exceeds 5%. Then, with the increase of strain, the stress difference between sample 1 and sample 2 first increases and then decreases. Comparing sample 2 with sample 3, the peak strength of sample 2 is higher than the strength (the stress at 15% strain) of sample 3. When the strain exceeds 7.0%, the stress of sample 3 is higher than that of sample 2. With the increase of strain, the stress of sample 3 is always higher than that of sample 2. Figure 3 also shows a high dependence of dilatancy on the sand–water mixing methods. All three samples show the characteristic of contraction at the initial state and then dilation. As axial strain goes up, we can observe that sample 2 has the most considerable volumetric strain. The volumetric strain of sample 1 is second largest before about 35% axial strain. Then, it is exceeded by sample 3 at last.
Table 1 shows that sample 2 has the largest initial elastic modulus, while sample 1 has the smallest initial modulus. The stress-strain curves of sample 1 and sample 2 show strain-softening behavior, while the stress-strain curves of sample 3 show strain hardening behavior. The peak strength of sample 1 is slightly higher than the strength of sample 3, which is defined as the stress value corresponding to the axial strain of 15%. Sample 2 has higher peak strength than the other two, and the peak strength comes up early. For sample 1, the peak strength and its corresponding strain are approximately 8.4 MPa and 6.5%, respectively, while for sample 2, they are approximately 8.5 MPa and 3.0%. The peak strength of sample 2 is 1.2% higher than that of sample 1 in our test.

3.2. Measurement of Saturation Profile

Proton NMR is sensitive primarily to the hydrogen in liquid water [29], which can be introduced to distinguish water from other substances. This function is usually utilized to measure the water saturation of the samples. Therefore, water content will be detected precisely and displayed directly in the saturation profile by proton NMR. The DHK SPRITE method was employed to measure the one-dimensional profiles [30], as shown in Figure 4.
Water content obtained at different positions of samples are presented in Figure 4. It should be pointed out that the apparatus scanned from the bottom to the top, so the left side of the one-dimensional saturation profile was the bottom of samples. Through repeated experiments on various samples, we find that the samples prepared by the same method have similar initial water distribution, but the initial water distribution is different in the samples prepared by different methods. Namely, it was confirmed that sand–water mixing methods influence the initial distribution of water content. To be more specific, water in sample 3 distributed mainly at the bottom, and that of sample 2 was relatively even. The reason for this difference may be that water was driven to the bottom by gravity. Under the same saturation, this phenomenon might be observed in large samples more obviously. For sample 1, most water concentrated in the middle, and it had the most water volume among these three samples. This is because sample 3 and sample 2 mix water and sand in advance, which might cause extra operation loss, but sample 1 doesn’t. Previous studies have shown that the saturation profile of water is able to represent the distribution of methane hydrate when using the ice-seeding method to form hydrate [22]. Therefore, the water distribution in samples described above also illustrates the hydrate distribution in each type of sample.

4. Discussion

In this work, the mechanical properties of samples prepared by different methods were studied. The stress-strain curves and the volumetric strain curves of the samples were different from each other under the condition that the overall saturation of the sample remained unchanged. From the results of low-field NMR, the water distribution of each preparation method is directly displayed in Figure 4. It confirms that the water distribution in the samples is related to the sand–water mixing methods. Water content in sample 2 distributes more uniformly than sample 3. For these two samples, the only difference in the preparation procedure was whether the sample was put upside-down when frozen. Therefore, we can deduce that this difference is mainly caused by gravity.
According to the stress-strain curves plotted in Figure 3, a distinction can be observed between different samples, which means that sand–water mixing methods influence mechanical properties of HBS. Based on the discussion above, the hydrate distribution in sample 2 would be more uniform compared to sample 3. Because the downward movement of water would occur during the sample compacting process, uneven hydrate distribution would occur. Therefore, method 2 was selected for sample preparation to compare with the sample made using method 3. The schematic diagrams of hydrate distribution in the three kinds of samples are illustrated in Figure 5, according to the results of NMR. The scale of the sample is the FOV of the NMR, ranging from −2.5 cm to 2.5 cm.
Comparing sample 2 and sample 3, the mechanical properties of the samples are different. According to the stress-strain curves, the initial modulus of elasticity of sample 2 is higher than that of sample 3. Before the strain of 7.0%, the stress of sample 2 is higher than that of sample 3. Then, with the increase of strain, the stress of sample 3 is higher than sample 2. According to the research of Kajiyama et al. [31], the initial modulus of elasticity is influenced by hydrate saturation. In this paper, considering the uneven distribution of water, the hydrate saturation at the downward side of sample 3 is higher than that at the upward side. Because the hydrate integral saturation of these two kinds of samples is almost equal, the hydrate saturation at the upward part of sample 2 is higher than that of sample 3, and the hydrate saturation at the downward part of sample 2 is lower than that of sample 3. For sample 3, the lower hydrate saturation part dominates the mechanical properties when the shearing process begins, because of the hydrate’s uneven distribution. The low hydrate saturation shows a low initial modulus of elasticity. The initial modulus of elasticity of sample 2 is higher than that of sample 3. Regarding the influencing mechanism of the stress difference between sample 2 and sample 3, the uneven hydrate distribution can also explain this phenomenon. With increasing axial strain, the compaction and shearing of the lower hydrate saturation section would continue. When the shearing process reaches some point, the section with higher hydrate saturation might influence the mechanical properties of the sample. As previous research mentioned, with an increase of hydrate saturation, the stress-strain curves of samples change from strain-hardening to strain-softening [32]. Although the high saturation sample would show strain-softening behavior, the residual strength would also be higher than the strength of the low hydrate saturation sample showing strain-hardening. However, in this paper, the deviatoric stress of sample 3 is higher than that of sample 2 when the strain was in excess of 7.0%. It is indicated that the lower part of sample 3 with high saturation might influence the mechanical properties of the sample. Simultaneously, sample 1 has the smallest initial modulus of elasticity. From stress-strain curves, it can be seen that the stress of sample 1 is lower than that of sample 2 before the strain of 5.0%. Then, sample 1 has higher stress than sample 2 until the strain is in excess of 30.0%. This phenomenon can also be explained by the uneven hydrate saturation discussed above. Through the analysis of the triaxial test and low-field NMR measurement, it is evident that sample 2 has the most uniform hydrate saturation, and accordingly, the most robust mechanical properties.
Figure 6 presents the stress-dilatancy relationship of three kinds of samples. The dilatancy is δ ε V / δ ε s , where δ ε V and δ ε s represent the increment of the volumetric strain and the shear strain, respectively. The stress ratio refers to the ratio of deviatoric stress and mean effective stress. At the beginning of the shearing process, samples all show contraction. Dilatancy of samples increases at first, then decreases to 0 at maximum contraction point (I). The stress ratio of all samples goes up. Then, with increasing stress ratio, dilatancy still decreases until the minimum of its own, called maximum dilation point (II). The absolute value of the maximum dilatancy point decreases successively from sample 2 to sample 1, then to sample 3. Meanwhile, the stress of sample 1 and sample 2 also reaches the maximum value at point II. Finally, the dilatancy of the three samples all approach 0. The stress ratio of sample 2 and sample 1 decreases gradually. That of sample 3 increases, showing a strain-hardening pattern.
The difference of maximum dilatancy points shown in Figure 6 can be explained by the heterogeneity of hydrate distribution caused by sand–water mixing methods. As discussed before, uneven hydrate distribution means different hydrate saturation in different parts of samples. To be specific, with the investigation of NMR, it can be inferred that hydrate saturation is higher in the downward section of sample 3, and lower in the upward. For sample 1, hydrate mainly concentrates in the middle. Previous research proposed that maximum dilation increases with increasing hydrate saturation [33]. In the pore scale, particle rotation and displacement as well as malposition lead to dilation of samples. The increasing presence of hydrate will intensify these phenomena, then promote or enhance dilation [15]. In a heterogeneous hydrate distribution sample, breakage always appears at the low saturation part because of its lower strength. Then, deformation occurs, which is a major factor in volumetric strain during the shearing process at first. As axial strain goes up, though the high saturation part contributes to the strength gradually, the volumetric strain is still dominated by the low saturation part, because it is probable that the shear band has already been generated at the low saturation part where apparent plastic failure might occur. However, the hydrate saturation of homogeneous samples is relatively higher than heterogeneous ones at the part where breakage usually happens. That is why it has the largest dilation. Thus, dilation is influenced by sand–water mixing methods.
However, all the studies used sand as the host sediment in this article. Clay is also a frequently used host sediment in much research, and the results of clay may be distinct from those of sand. Furthermore, water distribution driven by gravity in the sand is also related to its size of grain because of capillary force. These all require more detailed research. This will contribute to the standardization of the triaxial test process and improve the standard procedures for sample preparation with sufficient studies.

5. Conclusions

Remolding the sample is an indispensable step in the experimental research of HBS. Thus, triaxial tests and low-field NMR measurements were conducted in this paper to investigate the effect of sand–water mixing methods on HBS mechanical properties. Experimental results are as follows:
  • Most of the water of sample 1 concentrates in the middle section, and the water content of sample 3 distributes mainly at the bottom. Nevertheless, water in sample 2 distributes uniformly. The reason for water’s uneven distribution is that liquid water would show a downward movement driven by gravity. The hydrate distribution habit would be determined by water (ice) distribution before hydrate formation.
  • Compared with the sample with the evenly distributed hydrate, the sample with unevenly distributed hydrate shows a lower initial modulus of elasticity and lower strength. Furthermore, for these two kinds of host-sand-and-water-mixture prepared samples, the sample with evenly distributed hydrate shows strain-softening behavior, while the sample with unevenly distributed hydrate shows strain-hardening behavior. The peak strength of the sample with evenly distributed hydrate is higher than the 15% strain strength of the sample with unevenly distributed hydrate. During the shearing process with increasing strain, the stress of the sample with unevenly distributed hydrate is higher than that of the sample with evenly distributed hydrate.
  • All three samples show the characteristic of contraction at first, and then dilation. Sample 2 has the largest dilation, and sample 3 has the smallest one.
This study provides a sand–water mixing method to achieve a sample with evenly distributed hydrate, which increases the precision of experimental laboratory results and enhances the representativeness of the triaxial test.

Author Contributions

W.L., S.S. and X.S. designed the experiments and interpreted the results; D.P., S.S., Z.Y. and Y.Z. performed the experiments; X.S., D.P. and S.S. analyzed the data and wrote the paper. All authors have read and agreed to the published version of the manuscript.

Funding

This research was funded by the National Natural Science Foundation of China (51909025, 52076030).

Institutional Review Board Statement

Not applicable.

Informed Consent Statement

Not applicable.

Data Availability Statement

Not applicable.

Conflicts of Interest

The authors declare no conflict of interest.

Abbreviations

HBShydrate-bearing sediments
NMRnuclear magnetic resonance
THFtetrahydrofuran
S h hydrate saturation
V h volume of hydrate
V p pore volume of the host sand
m h mass of the hydrate
ρ h density of the hydrate
V g volume of the methane gas consumed by the samples
M h molar mass of methane hydrate
Phydrate formation pressure
Thydrate formation temperature
Zcompressibility factor
Rgas constant
GITGreen Imaging Technologies
LVDTlinear variable displacement transducer
DHKdouble half-k-space
SPRITEsingle-point ramped imaging with T1 enhancement

References

  1. Boswell, R. Is Gas Hydrate Energy Within Reach? Science 2009, 325, 957–958. [Google Scholar] [CrossRef] [PubMed]
  2. Sloan, E.D. Fundamental principles and applications of natural gas hydrates. Nature 2003, 426, 353–359. [Google Scholar] [CrossRef] [PubMed]
  3. Dawe, R.A.; Thomas, S. A Large Potential Methane Source—Natural Gas Hydrates. Energy Sources Part A Recover. Util. Environ. Eff. 2007, 29, 217–229. [Google Scholar] [CrossRef]
  4. Milkov, A.V. Global estimates of hydrate-bound gas in marine sediments: How much is really out there? Earth-Sci. Rev. 2004, 66, 183–197. [Google Scholar] [CrossRef]
  5. Englezos, P. Clathrate hydrates. Ind. Eng. Chem. Res. 1993, 32, 1251–1274. [Google Scholar] [CrossRef]
  6. Li, X.-S.; Xu, C.-G.; Zhang, Y.; Ruan, X.-K.; Li, G.; Wang, Y. Investigation into gas production from natural gas hydrate: A review. Appl. Energy 2016, 172, 286–322. [Google Scholar] [CrossRef] [Green Version]
  7. Liu, Z.; Liu, W.; Lang, C.; Liu, R.; Song, Y.; Li, Y. Viscosity investigation on metastable hydrate suspension in oil-dominated systems. Chem. Eng. Sci. 2021, 238, 116608. [Google Scholar] [CrossRef]
  8. Liu, Z.; Song, Y.; Liu, W.; Liu, R.; Lang, C.; Li, Y. Rheology of methane hydrate slurries formed from water-in-oil emulsion with different surfactants concentrations. Fuel 2020, 275, 117961. [Google Scholar] [CrossRef]
  9. Yang, M.; Zhao, J.; Zheng, J.; Song, Y. Hydrate reformation characteristics in natural gas hydrate dissociation process: A review. Appl. Energy 2019, 256, 113878. [Google Scholar] [CrossRef]
  10. Yousif, M.H.; Li, P.M.; Selim, M.S.; Sloan, E.D. Depressurization of natural gas hydrates in berea sandstone cores. J. Incl. Phenom. Mol. Recognit. Chem. 1990, 8, 71–88. [Google Scholar] [CrossRef]
  11. Kim, H.C.; Bishnoi, P.R.; Heidemann, R.A.; Rizvi, S.S.H. Kinetics of methane hydrate decomposition. Chem. Eng. Sci. 1987, 42, 1645–1653. [Google Scholar] [CrossRef]
  12. Ohgaki, K.; Takano, K.; Sangawa, H.; Matsubara, T.; Nakano, S. Methane Exploitation by Carbon Dioxide from Gas Hydrates—Phase Equilibria for CO2-CH4 Mixed Hydrate System. J. Chem. Eng. Jpn. 1996, 29, 478–483. [Google Scholar] [CrossRef] [Green Version]
  13. Glasby, G.P. Potential impact on climate of the exploitation of methane hydrate deposits offshore. Mar. Pet. Geol. 2003, 20, 163–175. [Google Scholar] [CrossRef]
  14. Rabbani, E.; Davarpanah, A.; Memariani, M. An experimental study of acidizing operation performances on the wellbore productivity index enhancement. J. Pet. Explor. Prod. Technol. 2018, 8, 1243–1253. [Google Scholar] [CrossRef] [Green Version]
  15. Yun, T.S.; Santamarina, C.J.; Ruppel, C. Mechanical properties of sand, silt, and clay containing tetrahydrofuran hydrate. J. Geophys. Res. Solid Earth 2007, 112, 1–13. [Google Scholar] [CrossRef]
  16. Wu, P.; Li, Y.; Sun, X.; Liu, W.; Song, Y. Mechanical Characteristics of Hydrate-Bearing Sediment: A Review. Energy Fuels 2020, 35, 1041–1057. [Google Scholar] [CrossRef]
  17. Hyodo, M.; Yoneda, J.; Yoshimoto, N.; Nakata, Y. Mechanical and dissociation properties of methane hydrate-bearing sand in deep seabed. Soils Found. 2013, 53, 299–314. [Google Scholar] [CrossRef] [Green Version]
  18. Wang, L.; Li, Y.; Wu, P.; Shen, S.; Liu, T.; Leng, S.; Chang, Y.; Zhao, J. Physical and mechanical properties of the overburden layer on gas hydrate-bearing sediments of the South China sea. J. Pet. Sci. Eng. 2020, 189, 107020. [Google Scholar] [CrossRef]
  19. Wu, P.; Li, Y.; Sun, X.; Liu, W.; Song, Y. Pore-Scale 3D Morphological Modeling and Physical Characterization of Hydrate-Bearing Sediment Based on Computed Tomography. J. Geophys. Res. Solid Earth 2020, 125. [Google Scholar] [CrossRef]
  20. Winters, W.J.; Pecher, I.A.; Waite, W.F.; Mason, D.H. Physical properties and rock physics models of sediment containing natural and laboratory-formed methane gas hydrate. Am. Mineral. 2004, 89, 1221–1227. [Google Scholar] [CrossRef]
  21. Waite, W.F.; Santamarina, J.C.; Cortes, D.D.; Dugan, B.; Espinoza, D.N.; Germaine, J.; Jang, J.; Jung, J.W.; Kneafsey, T.J.; Shin, H.; et al. Physical properties of hydrate-bearing sediments. Rev. Geophys. 2009, 47, RG4003. [Google Scholar] [CrossRef]
  22. Stern, L.A.; Kirby, S.H.; Durham, W.B. Polycrystalline methane hydrate: Synthesis from superheated ice, and low-temperature mechanical properties. Energy Fuels 1998, 12, 201–211. [Google Scholar] [CrossRef]
  23. Zhou, M.; Soga, K.; Yamamoto, K. Upscaled Anisotropic Methane Hydrate Critical State Model for Turbidite Hydrate-Bearing Sediments at East Nankai Trough. J. Geophys. Res. Solid Earth 2018, 123, 6277–6298. [Google Scholar] [CrossRef]
  24. Liu, J.; Li, X.; Kou, X.; Wang, Y.; Li, L. Analysis of Hydrate Heterogeneous Distribution Effects on Mechanical Characteristics of Hydrate-Bearing Sediments. Energy Fuels 2021, 35. [Google Scholar] [CrossRef]
  25. Ma, L.; Qi, J.; Yu, F.; Yao, X. Experimental study on variability in mechanical properties of a frozen sand as determined in triaxial compression tests. Acta Geotech. 2016, 11, 61–70. [Google Scholar] [CrossRef]
  26. Gao, S.; House, W.; Chapman, W.G. NMR/MRI Study of Clathrate Hydrate Mechanisms. J. Phys. Chem. B 2005, 109, 19090–19093. [Google Scholar] [CrossRef]
  27. Salahi, A.; Dehghan, A.N.; Sheikhzakariaee, S.J.; Davarpanah, A. Sand production control mechanisms during oil well production and construction. Pet. Res. 2021. [Google Scholar] [CrossRef]
  28. Shen, S.; Sun, X.; Wang, L.; Song, Y.; Li, Y. Effect of temperature on the mechanical properties of hydrate-bearing sand under different confining pressures. Energy Fuels 2021, 35, 4106–4117. [Google Scholar] [CrossRef]
  29. Kleinberg, R.L.; Flaum, C.; Griffin, D.D.; Brewer, P.G.; Malby, G.E.; Peltzer, E.T.; Yesinowski, J.P. Deep sea NMR: Methane hydrate growth habit in porous media and its relationship to hydraulic permeability, deposit accumulation, and submarine slope stability. J. Geophys. Res. Solid Earth 2003, 108. [Google Scholar] [CrossRef]
  30. Shakerian, M.; Afrough, A.; Vashaee, S.; Marica, F.; Balcom, B.J. Monitoring gas hydrate formation with magnetic resonance imaging in a metallic core holder. E3S Web Conf. 2019, 89, 2008. [Google Scholar] [CrossRef]
  31. Kajiyama, S.; Hyodo, M.; Nishimura, A. Mechanical characteristics and localized deformation of Methane Hydrate-bearing sand using high pressure plane strain shear tests. Jpn. Geotech. Soc. Spec. Publ. 2016, 2, 2549–2552. [Google Scholar] [CrossRef] [Green Version]
  32. Li, Y.; Liu, C.; Liu, L.; Sun, J.; Liu, H.; Meng, Q. Experimental study on evolution behaviors of triaxial-shearing parameters for hydrate-bearing intermediate fine sediment. Adv. Geo-Energy Res. 2018, 2, 43–52. [Google Scholar] [CrossRef] [Green Version]
  33. Miyazaki, K.; Masui, A.; Sakamoto, Y.; Aoki, K.; Tenma, N.; Yamaguchi, T. Triaxial compressive properties of artificial methane-hydrate-bearing sediment. J. Geophys. Res. Solid Earth 2011, 116, 1–11. [Google Scholar] [CrossRef]
Figure 1. The schematic diagrams of different sand-water mixing methods: (a) method 1, (b) method 2, (c) method 3.
Energies 14 02554 g001
Figure 2. The schematic diagram of the low-temperature, high-pressure triaxial test system: (a) specimen, 61.8 (diameter) × 125 mm (height); (b) pedestal; (c) chamber; (d) load cell; (e) heat exchanger; (f) plunger pump (hydrate formation); (g) CH4 gas cylinder; (h) plunger pump (water saturation); (i) hydraulic oil source; (j) axial loading device; (k) LVDT; (l) circulation thermostatic water bath (sample temperature control); (m) plunger pump (confining pressure control); (n) oil tank; (o) data acquisition module; (p) PC.
Energies 14 02554 g002
Figure 3. The stress-strain curves and volumetric strain curves of the samples.
Energies 14 02554 g003
Figure 4. Water distribution of each type of sample: (a) water distribution of sample 1, (b) water distribution of sample 2, (c) water distribution of sample 3.
Energies 14 02554 g004aEnergies 14 02554 g004b
Figure 5. The schematic diagrams of hydrate distribution in three kinds of sample.
Energies 14 02554 g005
Figure 6. Stress-dilatancy relationship of hydrate-bearing samples.
Energies 14 02554 g006aEnergies 14 02554 g006b
Table 1. The initial elastic modulus of the test samples.
Sand–Water Mixing MethodMethod 1Method 2Method 3
Initial elastic modulus (100 MPa)5.7247.1685.466
Publisher’s Note: MDPI stays neutral with regard to jurisdictional claims in published maps and institutional affiliations.

