Abstract
Abnormal weather conditions due to climate change are currently increasing on both global and local scales. It is therefore important to ensure the safety of the areas where major national facilities are located by analyzing risk quantitatively and re-evaluating the existing major facilities, such as nuclear power plants, considering the load and capacity of extreme flood conditions. In this study, a risk analysis method is developed that combines flood hazard curves with fragility curves using hydraulic and hydrological models by GIS tools and the @RISK model for the probabilistic flood analysis of nuclear power plant sites. A two-dimensional (2D) analysis is first carried out to estimate flood depths in various watershed scenarios, and a representative hazard curve for both external and internal flooding is made by applying a verified probability distribution type for the flood watersheds. For the analysis of flooding within buildings, an internal grid is constructed using GIS with related design drawings, and based on the flood depth results of the 2D analysis, a hazard curve for the representative internal inundation using a verified probability distribution type is presented. In the present study, walkdowns with nuclear experts are conducted around the nuclear power plant area to evaluate the fragile structures and facilities under possible flooding. After reviewing the 2D inundation analysis results based on the selected major equipment and facilities, the zones requiring risk assessment are re-assigned. A fragility curve applying probability distribution for the site’s major equipment and facilities is also presented. Failure risk analysis of the major facilities is then conducted by combining the proposed hazard and fragility curves. Results in the form of quantitative values are obtained, and the indicators for risks as well as the reliability and optimal measures to support decision-making are also presented. Through this study, it is confirmed that risk assessment based on the proposed probabilistic flood analysis technique is possible for flood events occurring at nuclear power plant sites.
1. Introduction
In recent years, the intensity of precipitation and the frequency of typhoons have increased due to an abnormal climate [1]. Between August and September 2020, three typhoons, Bavi, Maysak, and Haishen, hit the Republic of Korea, and the resulting heavy rains that fell caused flood damage. As typhoons Maysak and Haishen passed east of Korea, the local nuclear power plants were automatically shut down [2,3,4].
There are numerous such examples. In August 2014, in Korea, local intensive precipitation of 134 mm per hour occurred at the nuclear power plant site located in Jangan-eup, Gijang-gun, Busan. An accident occurred in which rainwater flowed into the pump room after the rainwater drainage pipe’s capacity was exceeded due to the intense precipitation. As a result, the turbines were shut down manually and the reactor had an automatic shutdown for safety reasons [5]. In France, high waves accompanied by strong winds from Hurricane Martin in 1999 hit the Le Blayais nuclear power plant, causing flooding [6]. In 2011, the Fort Calhoun nuclear power plant in the U.S. was flooded due to Missouri River flooding from local intensive precipitation. [7]. In the same year, March 2011, a large earthquake occurred on the Pacific coast in the Tohoku region of Japan, and a 15 m tsunami struck the Fukushima nuclear power plant site causing extensive flood damage [8]. These examples demonstrate that external flood events can lead to nuclear accidents involving personal and property damage. Therefore, it has been judged necessary to increase safety and prevent nuclear accidents through analyses of external flood events.
Currently, the Korea Institute of Nuclear Safety (KINS) regulates the assessment of the hydrological characteristics and surrounding environment, flooding due to local rainfall, and river flooding due to the collapse of an upstream dam when constructing a nuclear power plant [9]. Similarly, the U.S. Nuclear Regulatory Commission (NRC) stipulates that safety reviews and countermeasures for external flooding at nuclear power plant sites must be conducted [10]. The NRC also holds a workshop every year in the U.S. on how to apply probabilistic methods rather than deterministic methods for external flooding events and evaluating risk [11]. A report on the Great East Japan Earthquake and Tsunami, prepared by probabilistic risk assessment (PRA) practitioners, also explains why the probabilistic approach is necessary [12]. In addition, the International Atomic Energy Agency (IAEA) has regulated that when assessing flood risk, the impacts of extreme rainfall, tide levels, storm surges, tsunamis, waves, and possible dam and levee failures on NPP sites should be analyzed [13].
The field of dam safety in the U.S. and other countries is shifting from a deterministic approach to a stochastic approach. In this regard, Bowles and Schaefer proposed a flood risk assessment method through the probabilistic risk assessment of the dam performance [14]. Wall used specific programs to conduct probabilistic risk assessments, the results of which were more in depth than those currently provided in nuclear power plant regulations; as a result, several proposals were made for the development of probabilistic safety targets and basic principles [15]. Furthermore, Winter et al. provided varying uncertainties in their flood model and analyzed the variability of the modeling results according to five uncertainties [16]. Representing another approach, to complement the standard fault tree methodology in the nuclear field, a new evaluation method with Bayesian networks built into the current probabilistic safety assessment (PSA) framework has been studied [17]. Relatedly, probabilistic seismic assessment for CANDU 6 nuclear power plants has been conducted by adopting the PSA methodology [18]. As such, probabilistic concepts are being actively studied in various fields.
Flood assessment of existing power plant sites has generally been based on modeling with deterministic methods that do not take into account uncertainties. In general, nuclear power plant safety assessments for extreme flooding use flood depth results from two dimensions (2D) numerical analysis but do not consider the uncertainty [19]. Therefore, the purpose of the current study is to apply the probabilistic concept to the assessment of external and internal flood risk of a nuclear power plant (NPP) site for extreme rainfall events. To this end, a fragility assessment is carried out on the major facilities at the NPP site, after which a flood hazard curve and a facility fragility curve are combined to present the probability of flooding failure of the major facilities considering uncertainty. The proposed approach is conducted in this study as follows. First, the two-dimensional (2D) external flood results in the paper “Probabilistic flood hazard assessment method considering local intense precipitation at NPP sites”, (2021) [20] are applied as the external boundary conditions for an internal flood analysis. Second, based on plant walkdowns, NPP design, and satellite data, the internal flood paths of the buildings at the site are estimated. Third, 2D flood analysis is performed after modeling the interiors of the NPP buildings through hydraulic and hydrological models and ArcGIS software. On the basis of the results, a flood hazard curve is estimated. Fourth, the major facilities located in the flood path are calculated, and a fragility curve is estimated via fragility assessment for the selected facilities. Finally, the @RISK program [21], which allows for various samplings considering uncertainty, is employed to present the probability of damage causing the failure/non-failure of the facilities vulnerable to flooding. Taken together, the proposed method represents a flood assessment technique based on probabilistic analysis that combines flood hazard and fragility curves. On the basis of this approach, it is believed that further research on ways to minimize flood risk in the future will be possible.
2. Study Area
The target area of this study is an NPP site in Korea. The site is surrounded by mountains in the back and a 10 m coastal barrier in the front. Due to these topographic and structural conditions, it was judged as the most vulnerable NPP to flooding in Korea and was therefore selected as the target area for this study. When modeling the internal flooding due to external flooding, the 2D inundation results from a previous paper, “Probabilistic flood hazard assessment method considering local intense precipitation at NPP sites” (2021), [20], were applied as the external boundary conditions for the internal flood analysis.
The overall site is divided into power plant site 1 and power plant site 2, as shown in Figure 1. Power plant site 1 contains NPPs 1 and 2, while power plant site 2 has NPPs 3 and 4. Currently, NPP 1 in site 1 is shut down, and thus was excluded from the selection of flooded areas. For NPP 2 in site 1, the large flooded area includes a containment building, auxiliary building, intermediate building, control building, fuel building, turbine building, emergency diesel power generation building, cooling water building, seawater cooling unit building, and circulation building. As a result of investigation through a walkdown, most of the entrance doors of the buildings were found to have been replaced with waterproof doors. However, the two entrance doors and roll-up doors of the turbine building were not replaced with waterproof doors, so it was judged that there is a risk of flooding. In the case of power plant site 2, the auxiliary buildings and cooling water buildings had waterproof doors, while the exterior doors of the turbine buildings and control buildings had not been replaced with waterproof doors. Therefore, the large flooded area of site 2 was first selected as the turbine and control buildings; in the case of the turbine building, though, it was judged that there was no risk because the building contained no major facilities vulnerable to flooding, and thus it was excluded from the large flooded area.

Figure 1.
Flood areas (red boxes) selected for the NPP sites (Google Maps image).
3. Probabilistic Flood Assessment Method
3.1. Internal Flood Analysis of Nuclear Power Plants by External Flooding
When selecting the flooded area, the entire power plant should be viewed from the perspective of a flooding event, and the areas that can be affected by flooding should be independently defined. The purpose of the flooded area selection is to identify the major flooding event scenarios that affect the stability of the power plant by dividing the site into areas that a flooding accident would have significant impact on and areas that would not be significantly affected. For this, the design data of the power plants should be reviewed, and the physical arrangement of the buildings, the location and capacity of potential flood sources, and the flood paths should be identified. The process of selecting the flooded area, then, should consist of two steps as follows.
- The entire power plant is classified into large flooded areas;
- The large flooded areas are subdivided into smaller flooded areas that require detailed analysis.
3.1.1. Large Flooded Area Selection
To determine the large flooded areas, the independent areas that make up the power plant site should be considered as large flooded areas. Examples include containment buildings, auxiliary buildings, intermediate buildings, control buildings, fuel buildings, turbine buildings, emergency diesel generator buildings, equipment cooling water buildings, equipment cooling seawater buildings, and circulation buildings.
It is necessary to identify the cause of flooding in the large flooded areas, whether or not equipment vulnerable to flooding is installed, and the flood paths. Flood path surveys are conducted to determine whether large flooded areas are mutually independent in a flood event. Flood paths are generally formed by operator access paths, a device’s moving path, or door gaps between buildings. Therefore, to understand the flood path, it is necessary to check the possibility of water penetration and propagation by examining the presence or absence of entrance doors or drainage pipes and the differences in the floor heights between buildings.
3.1.2. Small Flooded Area Selection
Selection of the small flooded areas involves subdividing the selected large flooded areas. Small flooded areas are defined as those containing equipment belonging to a safety-related system that should maintain mutual independence during flooding. For example, the residual heat removal pump room, containment building, spray pump room, safety injection pump room, charge pump room, and so forth are considered small flooded areas.
To evaluate small flooded areas, it is necessary to consider entrance doors, stairs, walls, drainage systems, openings, and so on, and reflect them when selecting the target area. Furthermore, the power plant design data, the physical layouts of the buildings, and the characteristics of the areas should be identified in the selection of small flooded areas.
3.1.3. Determination of Analysis Target Facilities
To determine the facilities to be analyzed, reviews of the power plant design data and internal flood analysis results should be conducted. The final analysis targets are decided on the basis of active devices that change their state when a flood occurs, devices that can trigger an initial event when a failure occurs, and sensors and transmitters that are essential for plant monitoring.
3.1.4. Determination of Flood Source and Flood Flow Path
To determine the flood source, it is necessary to review the system function manuals, piping design drawings, piping instrumentation diagrams, and general layout diagrams of the plant. It is also necessary to analyze what kind of fluid piping exists in the flooded area and how the flood waters flow from outside to inside.
For this, the flow path of the flood source should be evaluated for a qualitative identification analysis of the flood event. If a flow path is formed from the outside, and the flooding event may damage some devices, it is decided as an analysis target area. If there is no device to be analyzed and only a flood source exists, the flood analysis target area is decided if the flood source can propagate to other areas where there are devices to be analyzed.
When determining the flood source and flow path, it is necessary to identify the paths that can propagate in the event of a flood accident through the power plant’s general arrangement, design of the drainage pipes, and a walkdown. The probability that discharges or inflows will propagate to adjacent flooded areas due to flooding must also be evaluated on the basis of engineering judgment.
3.2. 2D Internal Flood Analysis Method
To perform a 2D internal flood analysis of an NPP site, the FLO-2D program [22] can be applied. Through a walkdown, the door gaps in the flooded area causing flooding along the flow path can be measured. To simulate the flow through the door gaps, the culvert function is used in the FLO-2D program. The culvert function allows researchers to create a culvert of desired shape to reproduce real doors. In the current study, internal flood analysis was performed through modeling that applied the culvert function so that the flood could flow through the gaps of various doors.
3.3. Probabilistic Flood Assessment
This study applies a probabilistic rather than deterministic method to evaluate and present the probability of flooding considering uncertainty. To this end, the 2D internal inundation analysis applied the external inundation results of the paper “Probabilistic flood hazard assessment method considering local intense precipitation at NPP sites” (2021), [20].
A probabilistic flood hazard curve is estimated by applying probability distribution to the values (flood depth, wave height, wind speed, seismic intensity, precipitation intensity, etc.) that result when an event occurs. A fragility curve is estimated probabilistically by the @RISK analysis tool by calculating the critical heights for the vulnerable major facilities and equipment selected in the target watershed. Then, the hazard curve and the fragility curve are combined, and failure probabilities can be presented; this probabilistic flood assessment method considering uncertainty is shown in Figure 2. On the basis of data gathered in the future, it is expected that event trees can be applied to assist the relevant engineers and decision-makers in making optimal decisions regarding flood prevention and mitigation.
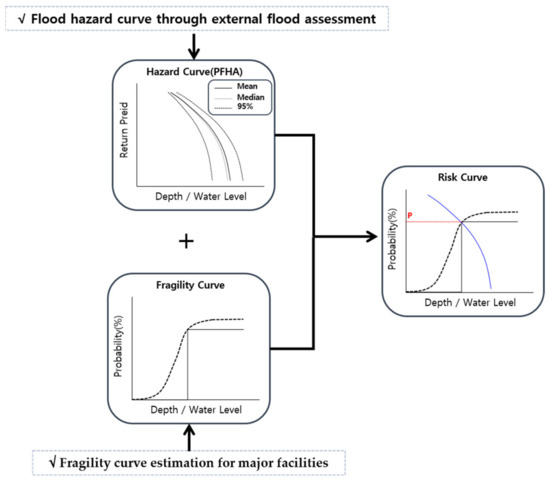
Figure 2.
Probabilistic flood assessment method.
4. Internal Flood Hazard Assessment
Nuclear power plants can be severely damaged if critical equipment and facilities fail due to flooding. For possible external events, the site to be analyzed is classified into large and small flooded areas. The flow path through which water could flow is identified, and vulnerability analysis is performed by identifying the critical heights of the major facilities in the event of flooding. To collect these basic data, in the current study, satellite data and walkdowns of the NPPs were conducted. For power plant site 2, NPPs 3 and 4 have the same layout; therefore, NPP 4 was applied by referring to the design of NPP 3. On the basis of the investigated data, a 2D model was constructed, and a flood analysis was simulated. As a result, flood depth data were obtained for probabilistic flood assessment.
4.1. Flow Path Determination
Information on the actual site was verified through a walkdown of each flooded area determined on the basis of an external flood analysis (i.e., [23]). During the walkdown with a plant expert, the locations of the major facilities and the critical heights of the equipment were identified. For each location, the flow paths, flood prevention facilities such as waterproof doors, and threshold heights were examined, and major flood sources that could cause flood accidents were reviewed. The effect of flooding in one area on other areas was also investigated during the walkdown, and the validity of the inflow boundary conditions was confirmed when selecting the flooded areas.
As a result of the walkdown with a plant expert, the points where floods could inflow from the outside and the door gaps inside the buildings that were replaced with waterproof doors were identified for NPPs 2, 3, and 4. The walkdown results are shown in Table 1 and Table 2, where it can be seen that most of the doors had been replaced with waterproof doors (gray shaded rows), allowing numerous flooded areas to be screened out. As a result, the turbine generator building (TGB) and the battery charge room were selected as the flooded areas for NPP 2. In the case of NPPs 3 and 4, the control building located at 100 ft elevation (ground level) and the motor control center (MCC) room of the control building at 80 ft elevation (20 ft underground) were selected as the flooded areas.

Table 1.
Walkdown results of NPP 2.
Table 2.
Walkdown results of NPPs 3 and 4.
4.2. 2D Internal Flood Analysis
On the basis of the walkdown results, the inflow boundary points for the internal flood analysis according to the occurrence of an external flood event were selected, as detailed in Figure 3 and Table 3. As for the inflow conditions of the selected points, 2D external flood results from a previous report [23] were used, as shown in Figure 4, Figure 5, Figure 6, Figure 7 and Figure 8. The resulting flood depth data for the selected points were applied as the external water level boundary conditions in the 2D internal flood analysis.
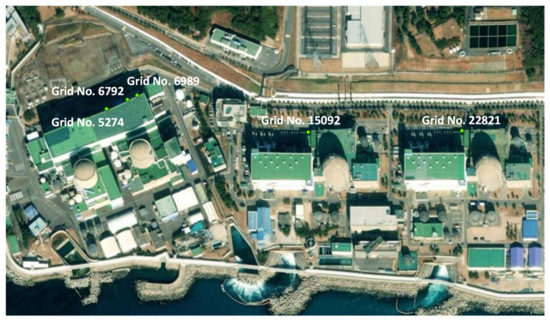
Figure 3.
Inflow boundary points for internal analysis (Google Maps image).
Table 3.
Inflow boundary point.
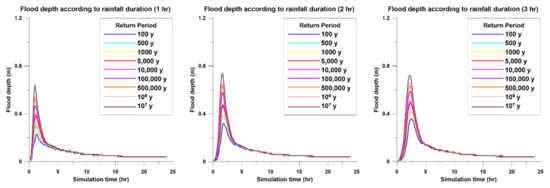
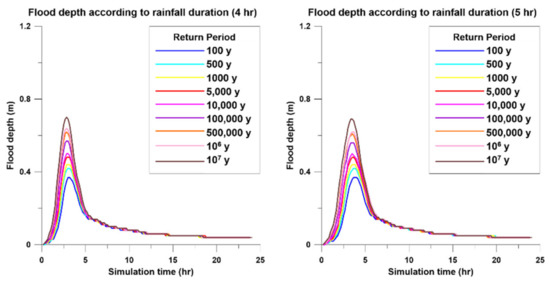
Figure 4.
Inflow boundary conditions for grid no. 5274 (turbine building, NPP 2).
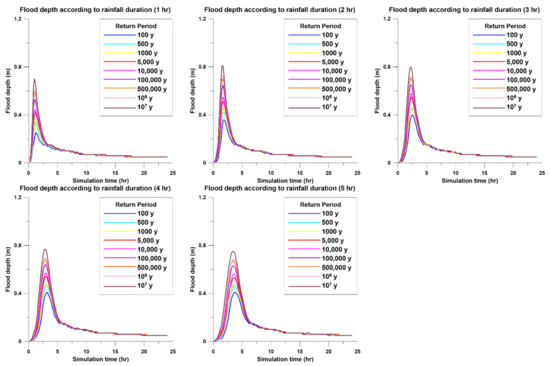
Figure 5.
Inflow boundary conditions for grid no. 6792 (turbine building, NPP 2).
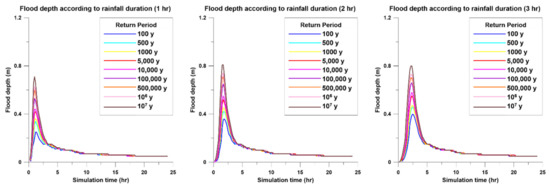
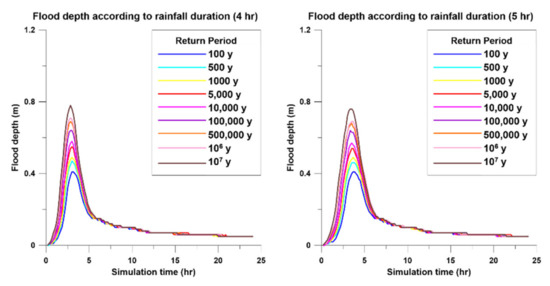
Figure 6.
Inflow boundary conditions for grid no. 6989 (turbine building, NPP 2).
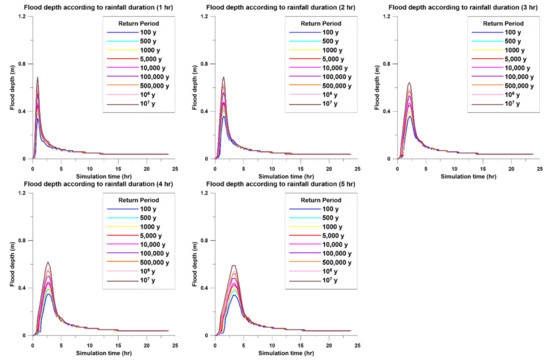
Figure 7.
Inflow boundary conditions for grid no. 15092 (control building, NPP 3).
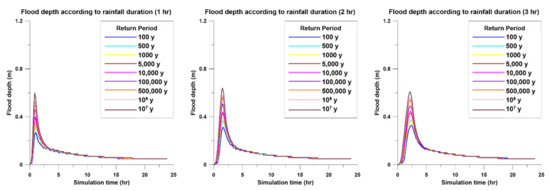
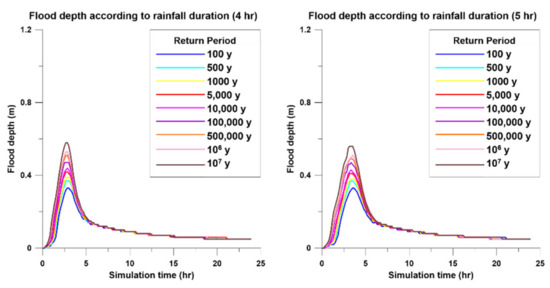
Figure 8.
Inflow boundary conditions for grid no. 22821 (control building, NPP 4).
On the basis of the inflow boundary conditions, a grid for the 2D internal flood analysis was constructed. For an accurate and detailed analysis, the grid size was 1 m × 1 m. In order to treat the internal structures in an independent form following the characteristics of NPPs, the rest of the structures except for the door points were modeled as walls. The 2D structures of NPPs 2, 3, and 4 constructed for the internal flood analysis are shown in Figure 9. In order to divide the analysis target areas into small flooded areas, area assignments A and B and A–D were determined, as shown in Table 4 and Table 5 and Figure 9.
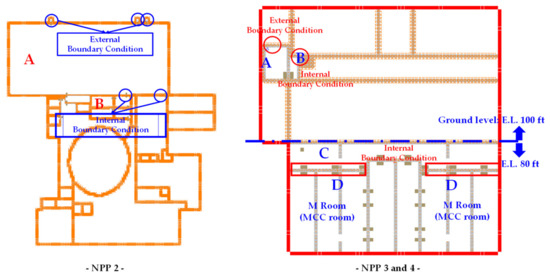
Figure 9.
2D modeling for internal flood analysis.
Table 4.
Small flooded area selection, NPP 2.
Table 5.
Small flooded area selection, NPPs 3 and 4.
In the 2D internal flood analysis, the water level according to rainfall duration for each return period was applied as the external boundary condition for the grid points (doors or windows) where floods could inflow. Furthermore, a rectangular culvert was applied to the door gaps through the culvert function of the FLO-2D program [22]. The flood can therefore move in both directions (i.e., from the outside to the inside or from the inside to the outside), so the flood flow was analyzed to be smooth.
The total simulation time for the internal flood analysis was selected as 24 h in consideration of the flood inflow conditions. Various internal flood analysis scenarios were carried out by selecting 45 scenarios according to rainfall duration from the return period. Figure 10 presents the 2D analysis results of flood inundation range by time and maximum flood depth for NPP 2. Figure 11 and Figure 12 show the results for NPP 3 and 4, respectively. The presented results are representative results of the internal inundation analysis at a rainfall duration of 2 h for a return period of 10 million years.
Figure 10.
2D internal flood analysis for a return period of 107 years (NPP 2).
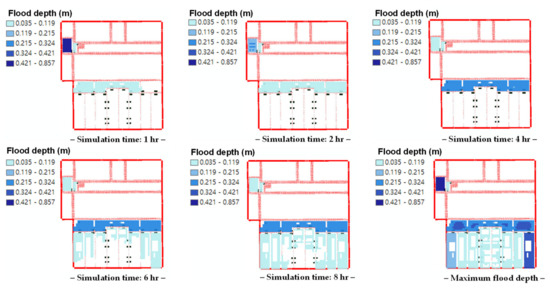
Figure 11.
2D internal flood analysis for a return period of 107 years (NPP 3).
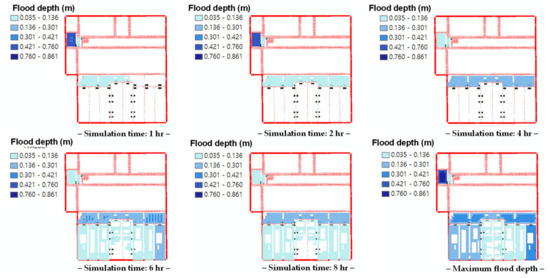
Figure 12.
2D internal flood analysis for a return period of 107 years (NPP 4).
From the results of the 2D internal flood analysis, flood depths according to rainfall duration for each return period for NPPs 2, 3, and 4 were found, as respectively shown in Figure 13, Figure 14 and Figure 15. The maximum flood depths according to a 2D analysis are shown in Table 6, Table 7 and Table 8. It can be seen in the results that the trend of the overall flood depth gradually increases and converges over time. The reason for this is that increasing flood heights spread to other areas as the flood generated by an external event flows into specific spaces through door gaps, and at the same time, water flowing in from the outside decreases over time.
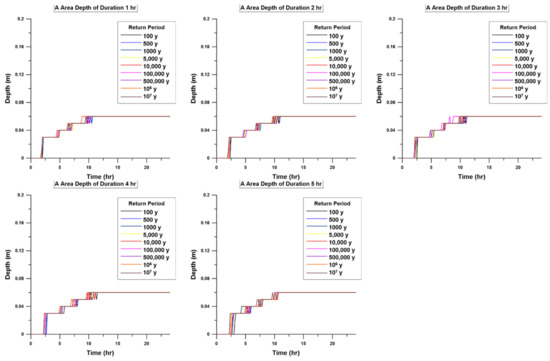
Figure 13.
2D flood depths from the 2D internal analysis results (Area A, NPP 2).
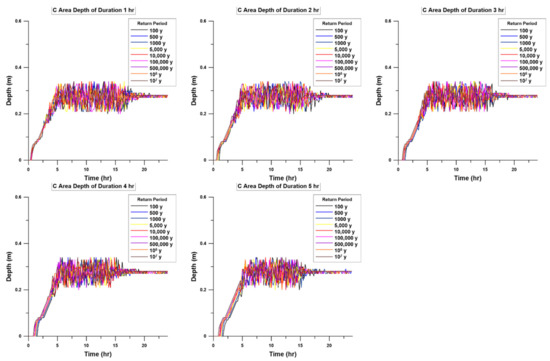
Figure 14.
2D flood depths from the 2D internal analysis results (Area C, NPP 3).
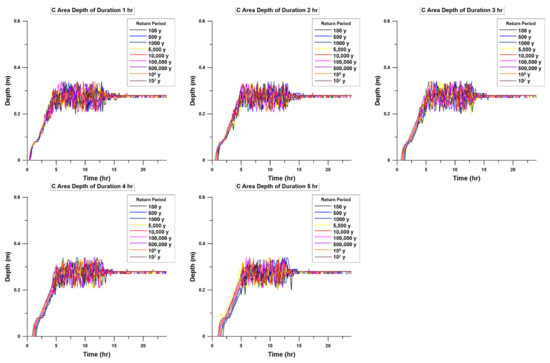
Figure 15.
2D flood depths from the 2D internal analysis results (Area C, NPP 4).
Table 6.
Maximum flood depth in the turbine building of NPP 2 (2D analysis result).
Table 7.
Maximum flood depth in the control building of NPP 3 (elevation 80 ft, 2D analysis result).
Table 8.
Maximum flood depth in the control building of NPP 4 (elevation 80 ft, 2D analysis result).
As a result of internal inundation analysis, in NPP 2, the flood flowed into the turbine building (A) with a maximum flood depth of 0.06 m in about 10 h. The flood depth threshold in the turbine building (A) to propagate to the battery charge room (B) and cause an accident is 0.10 m. Accordingly, since the maximum flood depth of A was analyzed as 0.06 m, the flood did not propagate to B in this study. Area B in NPP 2 was therefore judged as safe from flooding and screened out from additional flood risk analysis.
In the case of NPPs 3 and 4, flooding at the 80 ft elevation control building reached a maximum flood depth of 0.33 to 0.34 m after 4 h. Therefore, it was judged that flooding in the control building (C) would exceed the threshold height of 0.25 m for the area (D) where the MCC is located, thereby requiring additional flood risk analysis.
5. Probabilistic Flood Assessment Application
The probability distribution type was verified through Akaike’s Information Criterion (AIC) [24] based on the 2D flood depth results of the probabilistic internal flood assessment. A hazard curve was calculated by estimating the depth of flooding for 5%, mean, mode, and 95% through the applied probability distribution type. Furthermore, a fragility assessment was conducted through a walkdown to calculate the critical heights for the major facilities and equipment flooding. A fragility curve was then estimated by applying the probability distribution type to the critical heights. Finally, a probabilistic flood analysis was conducted by combining the estimated hazard curve and fragility curve. As a result, the probability of flood failure for the major facilities and equipment can be presented.
5.1. Estimation of Probabilistic Flood Hazard Curve for External Flooding
To estimate the probabilistic internal flood hazard curve, the flooding depth results of the external and internal flood analyses were used. From the internal flood analysis, it was judged that NPP 2 had no internal flood risk, and was thus excluded from further analysis. Probabilistic flood hazard assessment was performed for the control buildings located at an elevation of 80 ft in NPPs 3 and 4.
As the internal structure of these control buildings was the same, the flood path was applied in the same way in the analysis. The flood path was identified as the course that a flood goes from the control building located at 100 ft (ground level) down to 80 ft through a staircase inside the building. In the case of the stairs, it was assumed that 100% of the flood inflow would go down to 80 ft because no facilities were provided for flood prevention. Simulation conditions for flood propagation were conducted by applying culverts that reflect the height and width of the stairs.
As mentioned in Section 4.1, the control building located at 80 ft elevation is where the MCC is installed and operated. If flooding occurs that exceeds the MCC room threshold height of 0.25 m, core damage at the plant can occur. To estimate the probabilistic flood hazard curve for area C of NPPs 3 and 4 at 80 ft elevation, the maximum flood depth point (grid No. 892) and four door points connected to the MCC room were selected, as shown in Figure 16. As shown in Table 9 and Table 10, the maximum flood depths for the selected points were also estimated.
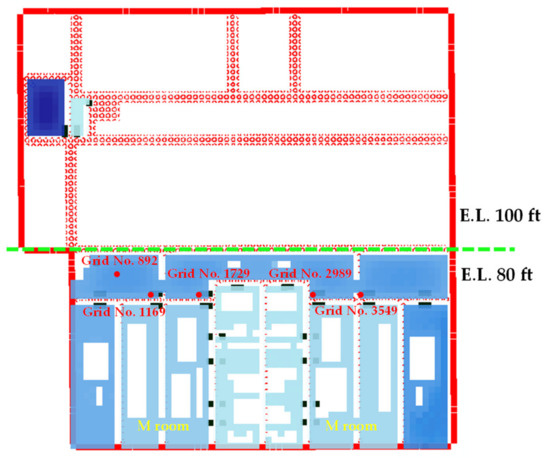
Figure 16.
Flood depth points for the control building at 80 ft elevation (NPPs 3 and 4).
Table 9.
Maximum flood depths for probabilistic analysis in the control building of NPP 3 (elevation 80 ft).
Table 10.
Maximum flood depths for probabilistic analysis in the control building of NPP 4 (elevation 80 ft).
The estimated maximum flood depth of area C in NPPs 3 and 4 remained constant over time. It was analyzed that the maximum flood depth was 0.28 to 0.34 m because the flooding at 80 ft propagates to other spaces over time.
A suitable statistical model was then selected for the probabilistic flood hazard assessment through AIC verification based on the maximum flood depth analyzed for the control building at 80 ft elevation. AIC verification is a method of comparing the performance of several statistical models by ranking the models and indicating the best model with smaller AIC values [24]. The basic equation of AIC is as Equation (1).
Here, is the number of parameters in the model, and is a measure of the fit of the model.
Equation (2) can be used for regression analysis using least squares when following a normal distribution.
Here, is , where SSR is the sum of squared regression and is the sample size.
An AIC value can be said to be the relative difference between each model and the statistical model with the best performance. The related equation is as follows.
Here, is the score of the th model, and is the score of the model with the best performance.
Table 11.
Criteria for determining model suitability [24].
As a result of AIC verification, the log-logistic distribution type was analyzed to be the most suitable for both NPPs 3 and 4. The correlation analysis results for the maximum flood depth, as shown in Table 12, were applied to the statistical model selected through AIC verification. Then, after applying the correlation to the selected distribution type using the @RISK program, probabilistic analysis was performed through 10,000 iterations of Monte Carlo simulation.
Table 12.
Correlation results for maximum flood depth.
Based on the results of the statistical analysis model, the mean, standard deviation, 95% reliability, 5% reliability, and mode were estimated as shown in Table 13 and Table 14. Probabilistic flood hazard curves were then estimated as shown in Figure 17 and Figure 18 on the basis of the analyzed statistical flood depth data. The estimated probabilistic flood hazard curves are almost straight; the reason is the same one as described in the results of the 2D internal flood analysis, as the probabilistic analysis was performed on the basis of the 2D results. Since the hazard curves were estimated from the maximum flood depth for area C for each return period, it was judged to have a straight line.
Table 13.
Probabilistic flood hazard analysis results for the control building of NPP 3 (elevation 80 ft).
Table 14.
Probabilistic flood hazard analysis results for the control building of NPP 4 (elevation 80 ft).
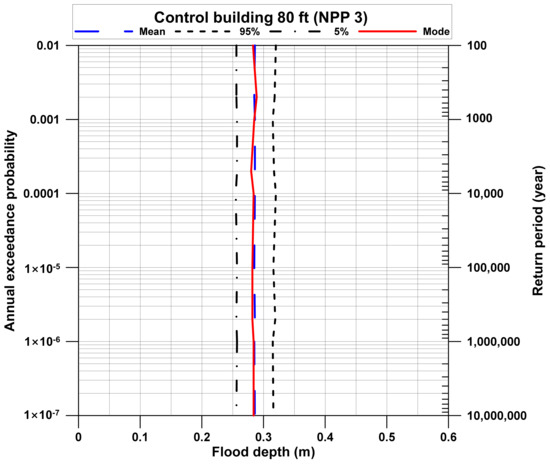
Figure 17.
Probabilistic flood hazard curve for NPP 3.

Figure 18.
Probabilistic flood hazard curve for NPP 4.
5.2. Fragility Assessment of the Major Facilities
As a result of the 2D internal flood analysis, in the case of NPP 2, as shown in Figure 19, the flood flowed from the outside into the turbine building in area A. However, it was analyzed that the flood did not propagate to area B where major facilities were located. Therefore, area B was judged to be safe from flooding and excluded from fragility analysis. In the case of NPPs 3 and 4, as shown in Figure 20, the flood flowed from the outside (100 ft elevation) and propagated down through the stairs to area C at 80 ft elevation. It was confirmed that flooding occurred in area D where the MCC was located. Therefore, a fragility assessment was conducted by selecting the MCC installed in the 80 ft elevation control buildings of NPPs 3 and 4.
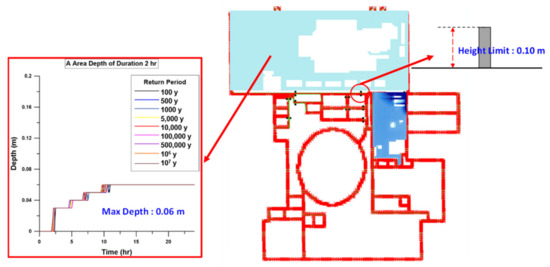
Figure 19.
2D internal flood analysis result for NPP 2.
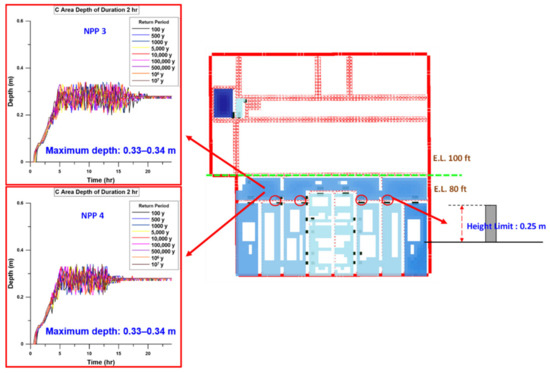
Figure 20.
2D internal flood analysis result for NPPs 3 and 4.
For flooding to occur in the MCC room (D) located 20 ft underground, the flood depth must exceed 0.25 m, as shown in Figure 20. When flooding occurs in area D, it was assumed that the MCC immediately fails. Therefore, a threshold height of 0.25 m between areas C and D was selected as the critical height, and a fragility curve was estimated through a probabilistic method.
A lognormal distribution was applied to estimate the fragility curve. Lognormal distribution is a statistical continuous distribution of random variables whose logarithms are normally distributed. In other words, y = ln (x) is normally distributed, meaning that the variable x is lognormally distributed. Therefore, various characteristics of lognormal distribution can be derived from normal probability distribution. This continuous distribution is generally used when a random variable cannot have negative values. Referring to the report “Technical Guidelines for Seismic Fragility Analysis of Nuclear power plants Structures and Facilities” [25], it is mentioned that lognormal distribution is more advantageous than Weibull or normal distributions when evaluating vulnerability. It is also mentioned that a conservative analysis is possible when randomness () and uncertainty () have the same value.
Therefore, the mean and standard deviation of the lognormal distribution were calculated using Equations (4) and (5). Fragility curves for NPPs 3 and 4 were estimated by applying this probability distribution type, as shown in Figure 21.
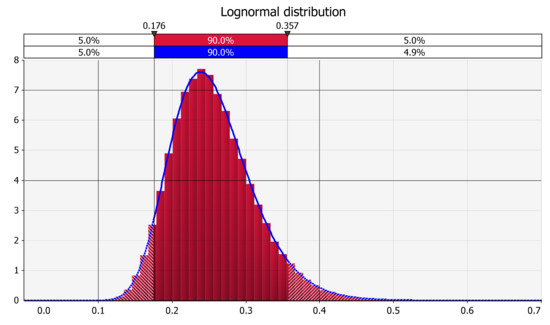
Figure 21.
Fragility curve estimated for the MCC room in NPPs 3 and 4.
Here, is the median value, and (log-standard deviation) = .
To estimate the fragility curves of NPPs 3 and 4, as shown in Table 15, both and values were assumed to be 0.1, and the median value was applied with a threshold height of 0.25 m.
Table 15.
Parameters of lognormal distribution.
5.3. Probabilistic Flood Assessment Combining Hazard and Fragility Curves
A probabilistic flood assessment was then conducted for NPPs 3 and 4, excluding NPP 2 as it was evaluated as safe from flooding (see Section 4.2). The probability of MCC failure was analyzed by combining the estimated hazard curve and the fragility curve for flood inflows exceeding the critical height of 0.25 m in area D located in the control building at 80 ft elevation (20 ft underground).
Table 16 shows the mode values of the flood depths for NPPs 3 and 4 based on the hazard curve; general flood analysis of NPPs 3 and 4 was conducted on the basis of the mode flood depth data. Probabilistic flood analysis was performed using the relationship between load and capacity, as shown in Equation (6).
Probabilistic Flood Assessment = Load > Capacity
Table 16.
Mode flood depths for the control building MCC area (elevation 80 ft).
Here, Load is the flood depth, and Capacity is the threshold height of the MCC area.
If the calculated flood assessment indicator was less than or equal to 0, it was judged that the structure was safe, and if it was greater than 0, it was judged that the structure could fail. This is summarized in Table 17.
Table 17.
Standard for flood assessment.
For probabilistic flood assessment, the probability that the flood indicator is greater than 0 is presented through an analysis combining the flood hazard curve and the facility fragility curve using the @RISK statistical model. As a result of the 2D internal flood analysis, in NPPs 3 and 4, the flood depth in area D was similar according to the return period due to the flooding characteristics of the underground space. The probability of MCC failure can be presented by combining the curves after applying a statistical model to the flood depth according to the return period estimated from the hazard curve.
As a result of verification through the AIC method, a lognormal statistical distribution was selected for the flood depth for each return period calculated in area D of NPPs 3 and 4. A new statistical model was estimated by applying the mode flood depth to the selected distribution type. And since the critical height between areas C and D of NPPs 3 and 4 is the same, the previously estimated fragility curve was applied. Finally, the probabilistic flood assessment was conducted by performing a Monte Carlo simulation with 10,000 iterations based on the combined statistical model of the fragility curve and the flood hazard curve. As a result of probabilistic flood analysis, the probability that a flood indicator exceeding 0 in the flood assessment can occur, or in other words, the probability that the depth of flooding exceeds the critical height, is presented in Figure 22 and Figure 23 and Table 18.
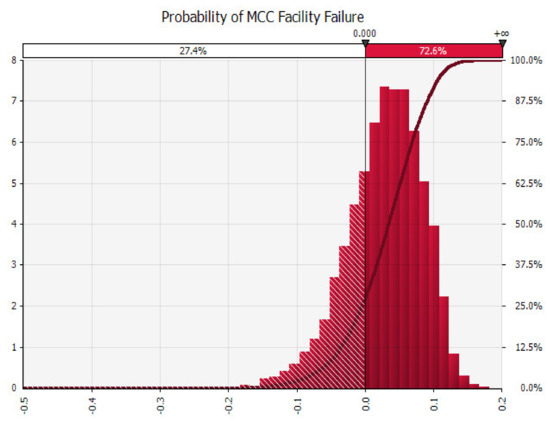
Figure 22.
Probabilistic flood assessment result for NPP 3.
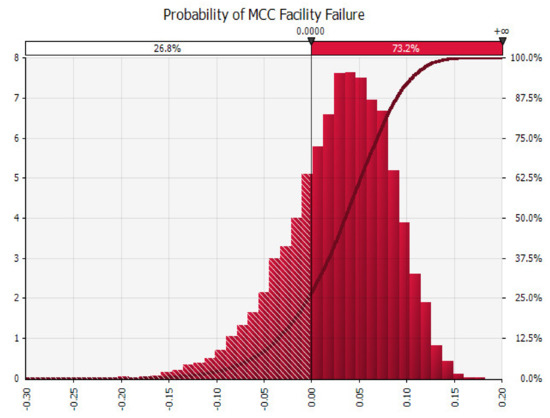
Figure 23.
Probabilistic flood assessment result for NPP 4.
Table 18.
Probabilistic flood assessment results.
6. Conclusions
In this study, the probability of flooding in a nuclear power plant was analyzed by applying a probabilistic flood assessment method. As probabilistic methods are currently excluded from existing flood evaluations, it is believed that the methodology presented in this study is valuable in providing quantitative data based on flood evaluation considering uncertainty. A summary of the current application in this work is as follows.
- (1)
- Through walkdowns, the path of the flood propagation to the MCC areas located 20 ft beneath the control buildings of NPPs 3 and 4 in an external flood event was identified. A threshold height of 0.25 m between flood areas C and D, where the MCC is located, has also been identified.
- (2)
- As a result of the 2D internal flood analysis, flooding into area C exceeded the threshold height of 0.25 m in area D, where the MCC was located. It was confirmed that the flood from area C propagated to area D, causing the MCC to flood. Based on the results of the 2D flood analysis according to the return period, a flood hazard curve was calculated based on the flood depth at the location 20 ft underground.
- (3)
- For probabilistic flood assessment, the fragility curve was estimated by applying the proper distribution type through AIC verification to the threshold height of 0.25 m located in the C and D areas. A probabilistic flood assessment was then conducted through statistical analysis by combining the developed flood hazard curve and fragility curve.
- (4)
- On the basis of the analyzed results, general flood assessment and probabilistic flood assessment were compared. The probability of MCC failure due to internal flooding caused by an external flooding event was analyzed as 72.6% for NPP 3 and 73.2% for NPP 4. Further research on the concept of resistance for increased MCC safety is expected to follow this study, applying the proposed probabilistic flood assessment method.
As a result of this study, it was analyzed that there is a possibility of flooding into the D area where the MCC is located in the example plant. To prevent flooding in areas where major facilities are located, research on structural measures applying optimization techniques is in progress. It should be noted that the stochastic, quantitative flood assessment methodology of this study results from a model that includes some assumptions about the example site, due to the security characteristics of the power plant. In the future, by applying the methodology of this study with more detailed data on the target power plant, it is expected that more reliable and quantitative evaluation will be possible for flood assessment.
Author Contributions
Conceptualization, B.-J.K., K.-Y.H. and M.K.; methodology, B.-J.K., K.-Y.H. and M.K.; software, B.-J.K.; validation, B.-J.K. and J.P.; formal analysis, B.-J.K. and D.H.; investigation, B.-J.K., J.P. and D.H.; resources, B.-J.K. and K.-Y.H.; data curation, B.-J.K.; writing—original draft preparation, B.-J.K.; writing—review and editing, M.K., D.H. and J.P.; visualization, B.-J.K.; supervision, M.K. and K.-Y.H.; project administration, D.H. and K.-Y.H.; funding acquisition, D.H. and K.-Y.H. All authors have read and agreed to the published version of the manuscript.
Funding
This work was supported by a National Research Foundation of Korea (NRF) grant funded by the Korean government (NRF-2017M2A8A4015290).
Acknowledgments
This work was supported by a National Research Foundation of Korea (NRF) grant funded by the Korean government (NRF-2017M2A8A4015290).
Conflicts of Interest
The authors declare that they have no known competing financial interests or personal relationships that could have appeared to influence the work reported in this paper.
References
- National Institute of Meteorological Sciences. Global Climate Change Forecast Report; National Institute of Meteorological Sciences: Jeju-do, Korea, 2019.
- ChosunBiz. Typhoon BAVI Damage Case. Available online: https://biz.chosun.com/site/data/html_dir/2020/08/27/2020082700001.html (accessed on 27 August 2020).
- ChosunBiz. Typoon MAYSAK Damage Case. Available online: https://biz.chosun.com/site/data/html_dir/2020/09/03/2020090300411.html (accessed on 3 September 2020).
- B News. Typoon HAISHEN Damage Case. Available online: https://www.bbc.com/korean/news-54052944 (accessed on 7 September 2020).
- Korea Institue of Nuclaer Safety. “Circulation Water Pump Room Due to LIP of Kori Unit 2 Turbine Manual Shutdown and Reactor Due to Flood Automatic Stop” Rating Result; Korea Institue of Nuclaer Safety: Daejeon, Korea, 2014. [Google Scholar]
- Institut de Protection Et de Surete Nucleaire. Reprot sur Linondation du Site Blayais Survenue le 24 Decomber 1999; Institut de Protection et de Surete Nucleaire: Fontenay-aux-Roses, France, 2000. [Google Scholar]
- ABC News. Nebraska Residents in No Danger after Floods Hit Nuke Plant: Waters Breach Berm at Fort Calhoun Nuclear Station. Available online: https://abcnews.go.com/US/minot-north-dakota-floods-community/story?id=13932406&cid=ESPNheadline (accessed on 26 January 2011).
- ABC News. Fukushima Disaster: Japan Acknowledges First Radiation Death from Nuclear Plant Hit by Tsunami. Available online: https://www.abc.net.au/news/2018-09-06/first-man-dies-from-radiation-from-fukushima-nuclear-disaster/10208244 (accessed on 6 January 2018).
- Korea Institute of Nuclaer Safety. Flood and Water Supply and Evaluation Criteria for the Site and the Surrounding Area of the Reactor Facility; Korea Institue of Nuclaer Safety: Daejeon, Korea, 2015. [Google Scholar]
- U.S. Nuclear Regulatory Commission. Regulatory Guide 1.59, Design Basis Floods for Nuclear Power Plants; U.S. Nuclear Regulatory Commission: Rockville, MD, USA, 1977; p. 64.
- U.S. Nuclear Regulatory Commission. Extreme Flood Hazard Assessment; U.S. Nuclear Regulatory Commission: Rockville, MD, USA, 2019.
- Epstein, W. A Probabilistic Risk Assessment Practioner Looks at the Great East. Japan Earthquake and Tsunami; Tokyo Institute of Technology: Tokyo, Japan, 2011. [Google Scholar]
- International Atomic Eenergy Agency. Meteorological and Hydrological Hazards in Site Evaluation for Nuclear Installations; International Atomic Eenergy Agency: Vienna, Austria, 2011; pp. 15–23. [Google Scholar]
- Bowles, D.S.; Schaefer, M. Probabilistic Flood Hazard Assessment, DAM Performance PRA and Nuclear Plant Risk. In Proceedings of the 9th Nuclear Plants Current Issues Symposium, Charlotte, NC, USA, 8–10 December 2014. [Google Scholar]
- Wall, I.B. Probabilistic risk assessment in nuclear power plant regulation. Nucl. Eng. Des. 1980, 60, 11–24. [Google Scholar] [CrossRef]
- Winter, B.; Schneeberger, K.; Huttenlau, M.; Stötter, J. Sources of uncertainty in a probabilistic flood risk model. Nat. Hazards 2018, 91, 431–446. [Google Scholar] [CrossRef]
- Kwag, S.; Oh, J. Development of network-based probabilistic safety assessment: A tool for risk analyst for nuclear facilities. Prog. Nucl. Energy 2019, 110, 178–190. [Google Scholar] [CrossRef]
- Nour, A.; Cherfaoui, A.; Gocevski, V.; Léger, P. Probabilistic seismic safety assessment of a CANDU 6 nuclear power plant including ambient vibration tests: Case study. Nucl. Eng. Des. 2016, 304, 125–138. [Google Scholar] [CrossRef]
- Korea Hydro and Nuclear Power. Stress Test Performance Report; Korea Hydro and Nuclear Power: Gyeongju, Korea, 2020. [Google Scholar]
- Kim, B.; Kim, M.; Hahm, D.; Han, K.Y. Probabilistic Flood Hazard Assessment Method Considering Local Intense Precipitation at NPP Sites. J. Hydrol. 2021, 597, 126192. [Google Scholar] [CrossRef]
- Palisade. @RISK. Available online: https://www.palisade.com/risk/ (accessed on 3 April 2021).
- O’Brien, J.S. FLO-2D Users Manual; FLO-2D Software, Inc.: Nutrioso, AR, USA, 2007. [Google Scholar]
- Korea Atomic Energy Research Institute. Flood Hazard and Fragility Analysis Resulting from External Event at Nuclear Power Plants; Korea Atomic Energy Research Institute: Daejeon, Korea, 2020. [Google Scholar]
- Burnham, K.P.; Anderson, D.R. A Practical Information-Theoretic Approach. Model Selection and Multimodel Inference, 2nd ed.; Springer: New York, NY, USA, 2002; Volume 2. [Google Scholar]
- Choi, I.K.; Seo, J.M.; Choun, Y.S. Technical Guide for Seismic Fragility Analysis of NPP Structures and Equipments; Korea Atomic Energy Research Institute: Daejeon, Korea, 2002. [Google Scholar]


Publisher’s Note: MDPI stays neutral with regard to jurisdictional claims in published maps and institutional affiliations. |
© 2021 by the authors. Licensee MDPI, Basel, Switzerland. This article is an open access article distributed under the terms and conditions of the Creative Commons Attribution (CC BY) license (https://creativecommons.org/licenses/by/4.0/).