
Evaluation Method of Production Pressure Differential in Deep Carbonate Reservoirs: A Case Study in Tarim Basin, Northwest China

Abstract
:1. Introduction
2. Experimental Study on the Properties of Carbonate Rocks
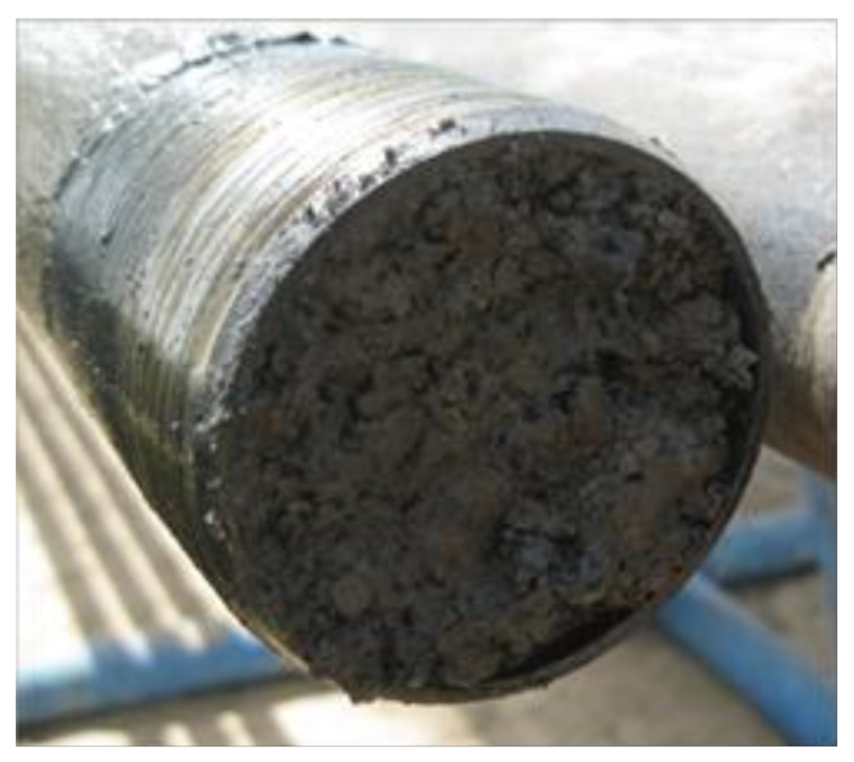
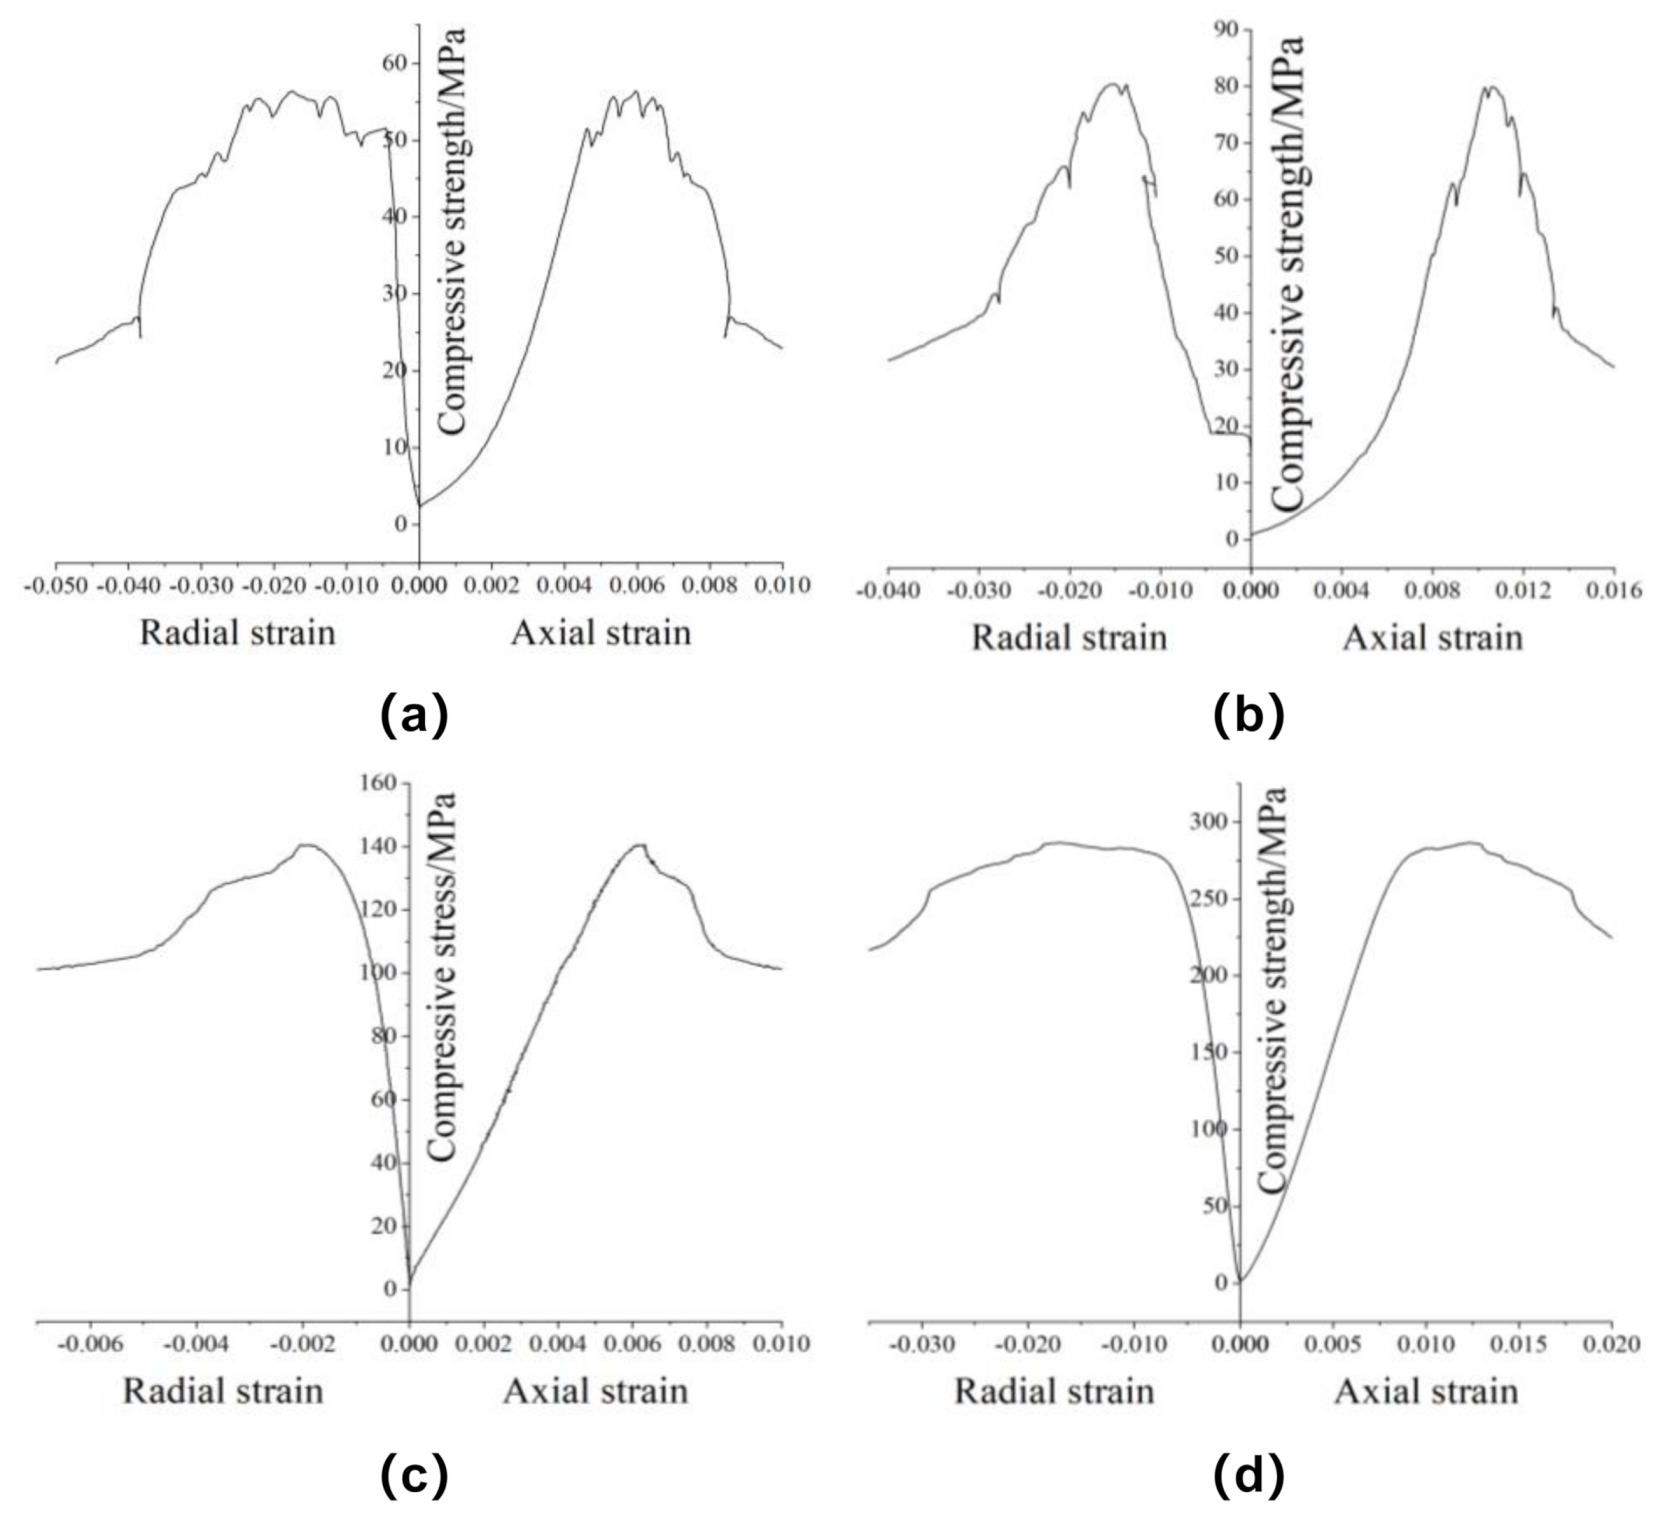
2.1. Experimental Study on Rock Mechanical Properties
2.2. Experimental Study on Rock Physical and Chemical Properties
3. Evaluation Methods for Predicting Production Pressure Differential
3.1. Analytical Method for Production Pressure Differential Evaluation
- Production pressure differential evaluation based on Mohr–Coulomb criterion
- 2.
- Production pressure differential evaluation based on Drucker–Prager criterion
- 3.
- Production Pressure Differential Evaluation Based on Hoek–Brown Criterion
- 4.
- Production Pressure Differential Evaluation Based on Mogi–Coulomb Criterion
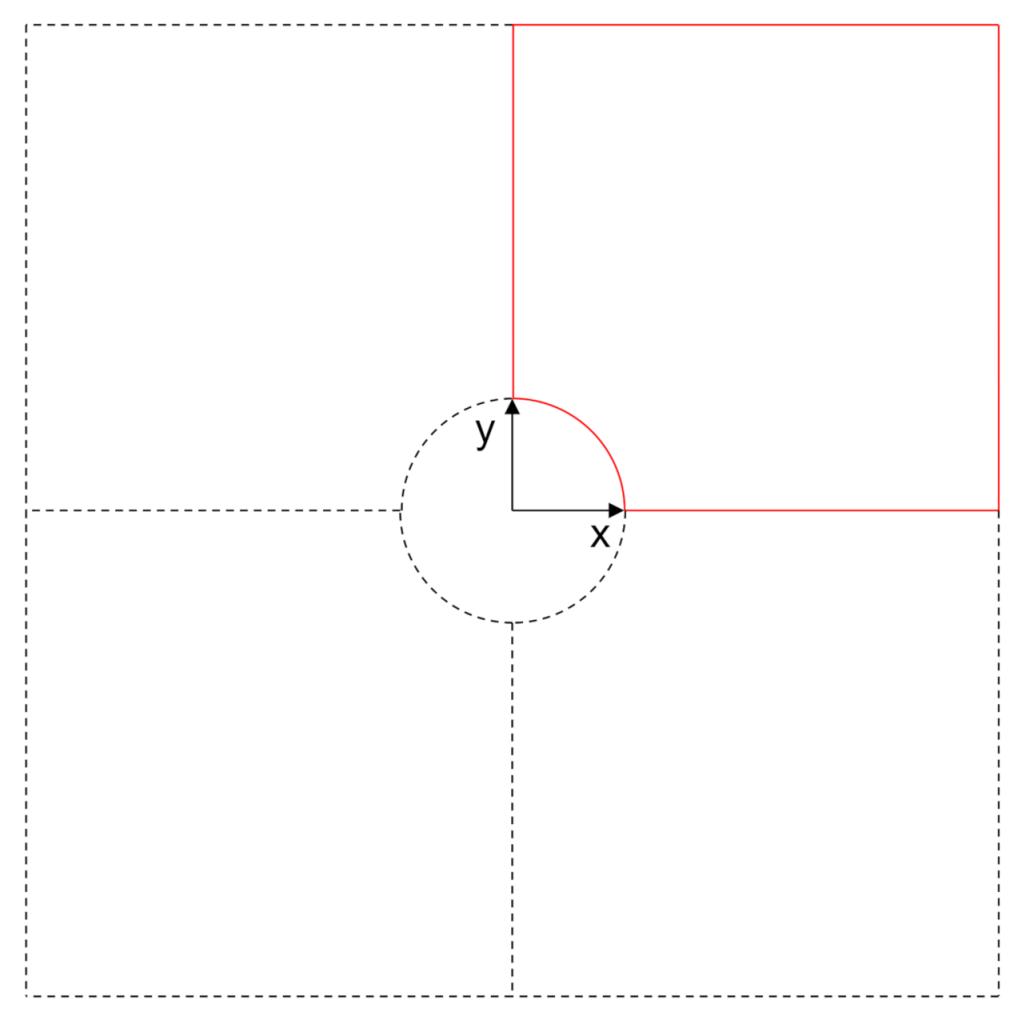
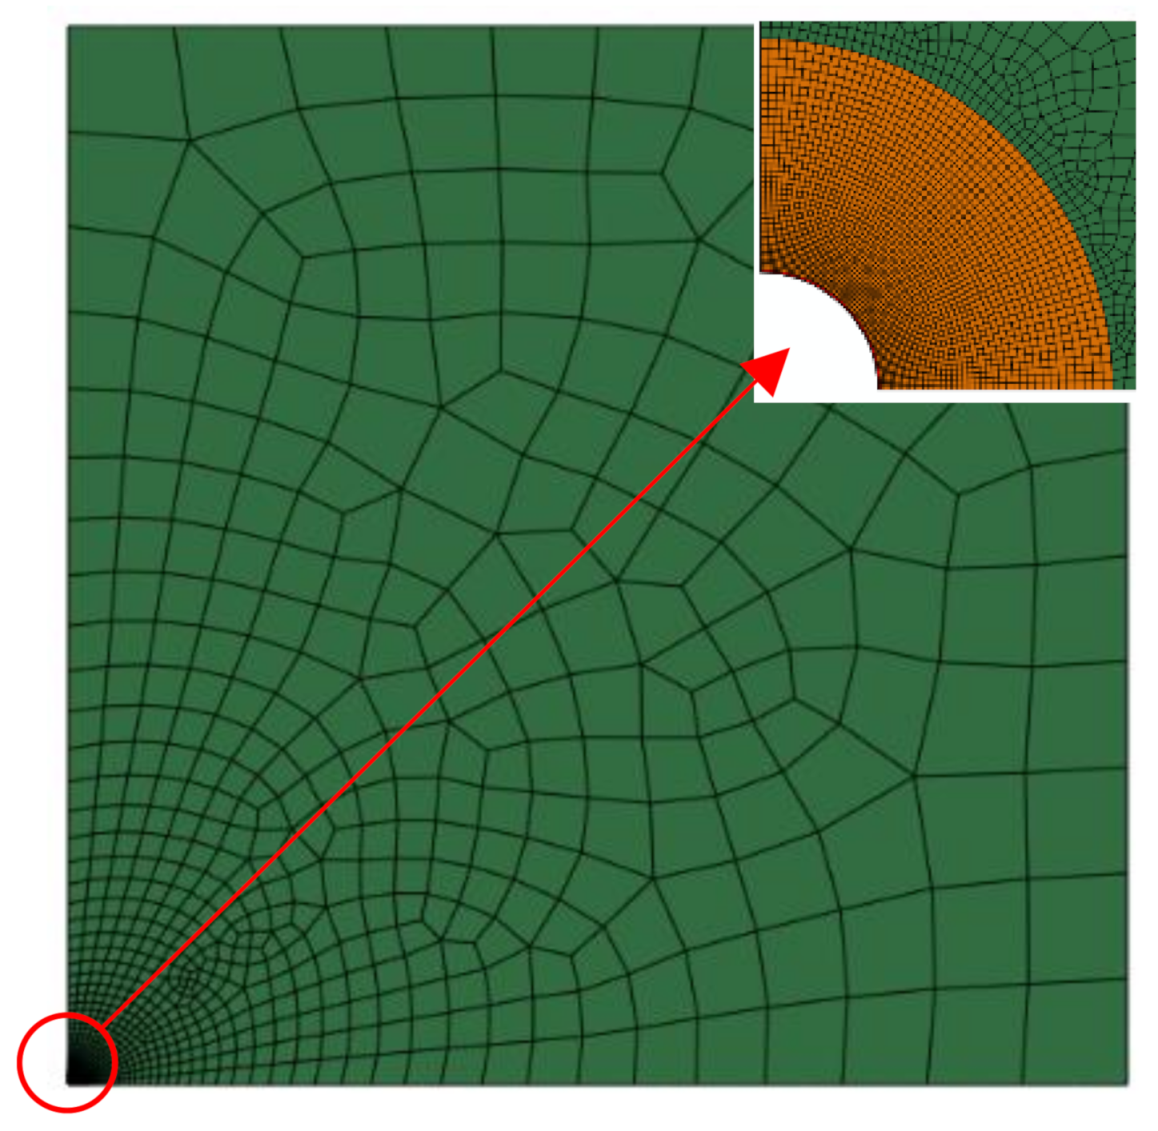
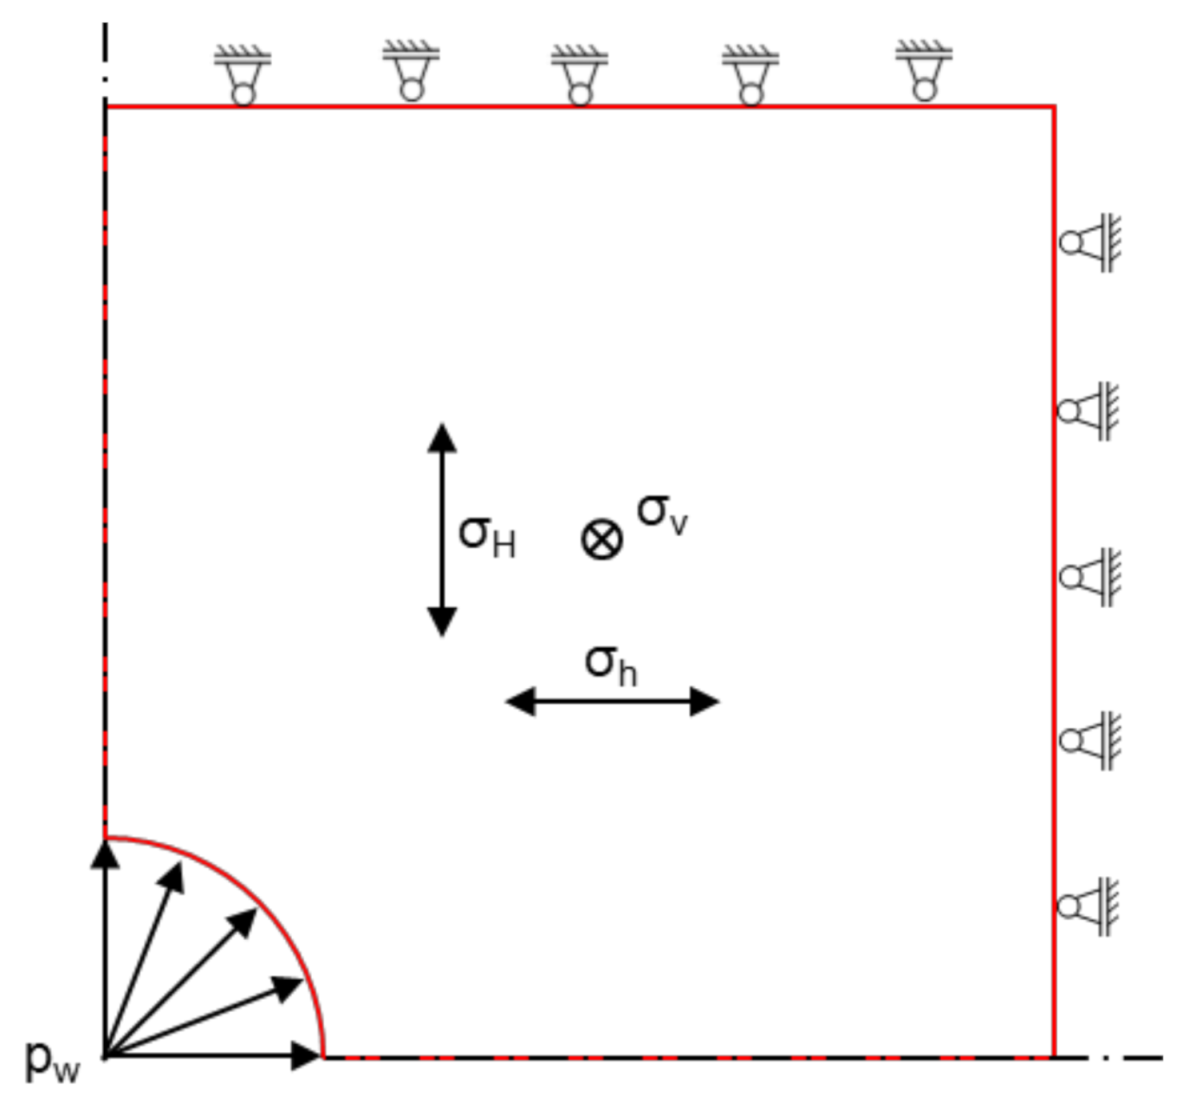
3.2. Numerical Method for Production Pressure Differential Evaluation
4. Application and Discussion
- (1)
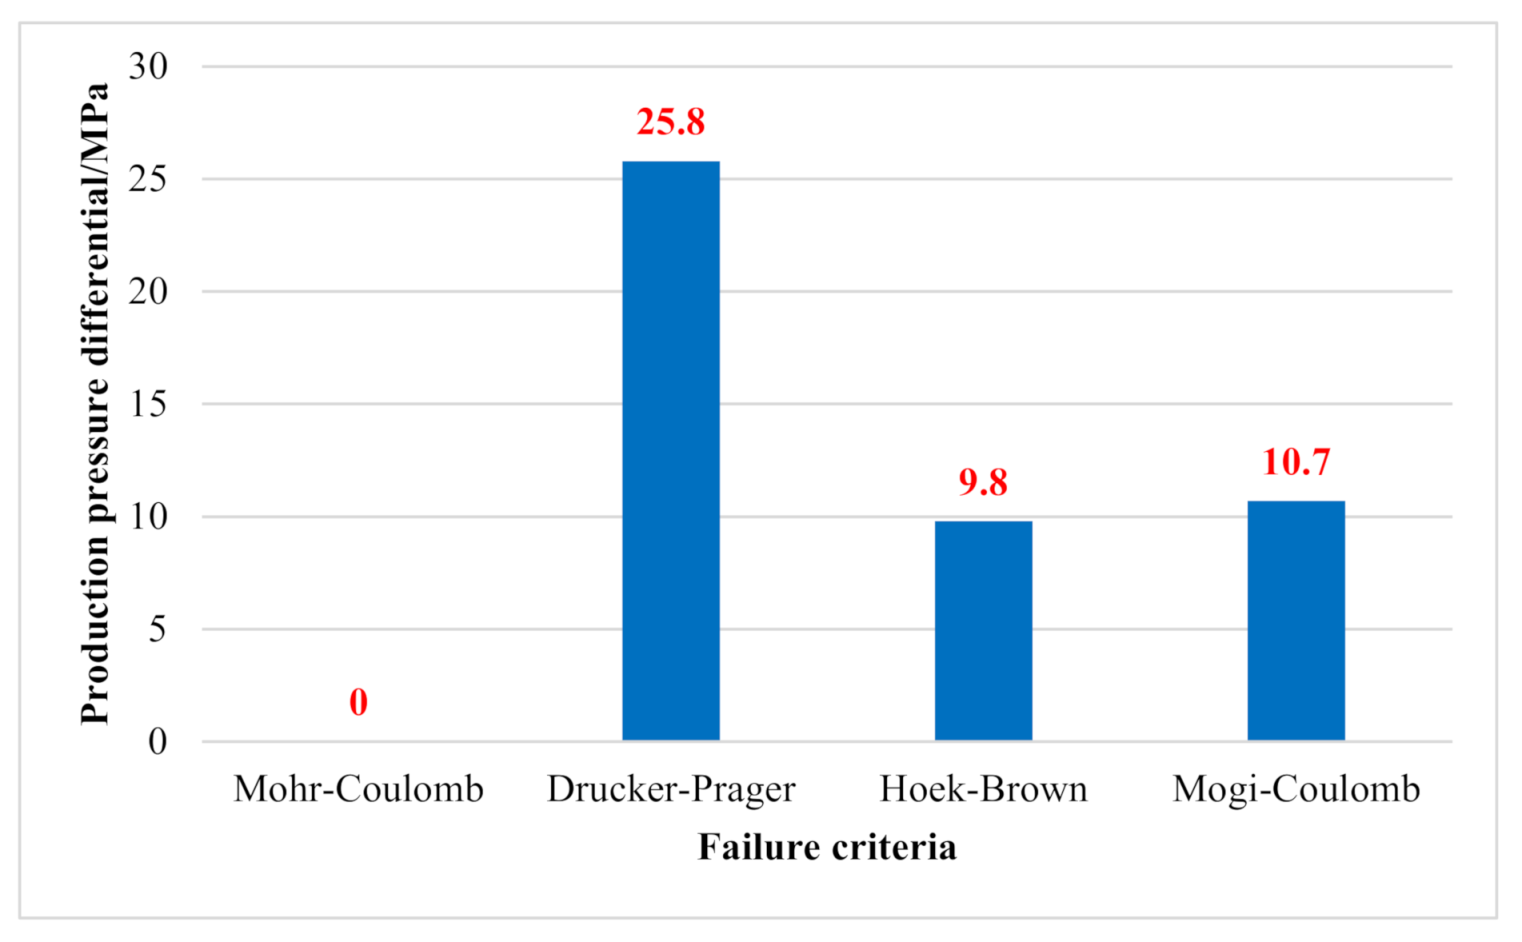
- The Mohr–Coulomb criterion is too conservative in the estimation of rock failure. Although it has many successful applications in wellbore stability analysis, it is obviously not suitable for production pressure differential analysis under quasi-static conditions because there are no dynamic effects, such as drill string vibration and pressure fluctuating, during the production process. In contrast, the production pressure differential evaluated by the Drucker–Prager criterion is too optimistic. There is a strong risk of blockage when the production pressure differential is above 20 MPa according to the production practice, so the results evaluated by the Drucker–Prager criterion cannot be adopted too.
- (2)
- The pressure differential evaluation results obtained from the Hoek–Brown and Mogi–Coulomb criteria are close, and neither will cause wellbore instability. Both of them can be used to quickly predict the production pressure differential. However, it should be noted that the selection of the empirical parameters in the Hoek–Brown criterion is experience-dependent. Therefore, a large amount of experimental data and geological data is required for parameter correction, which limits the application of the Hoek–Brown criterion. Meanwhile, the Mogi–Coulomb criterion seems to still underestimate the supporting effect of the intermediate principal stress on the rocks according to the production data, resulting in a slightly lower evaluated production pressure differential and difficulty maximizing the productivity.
- (3)
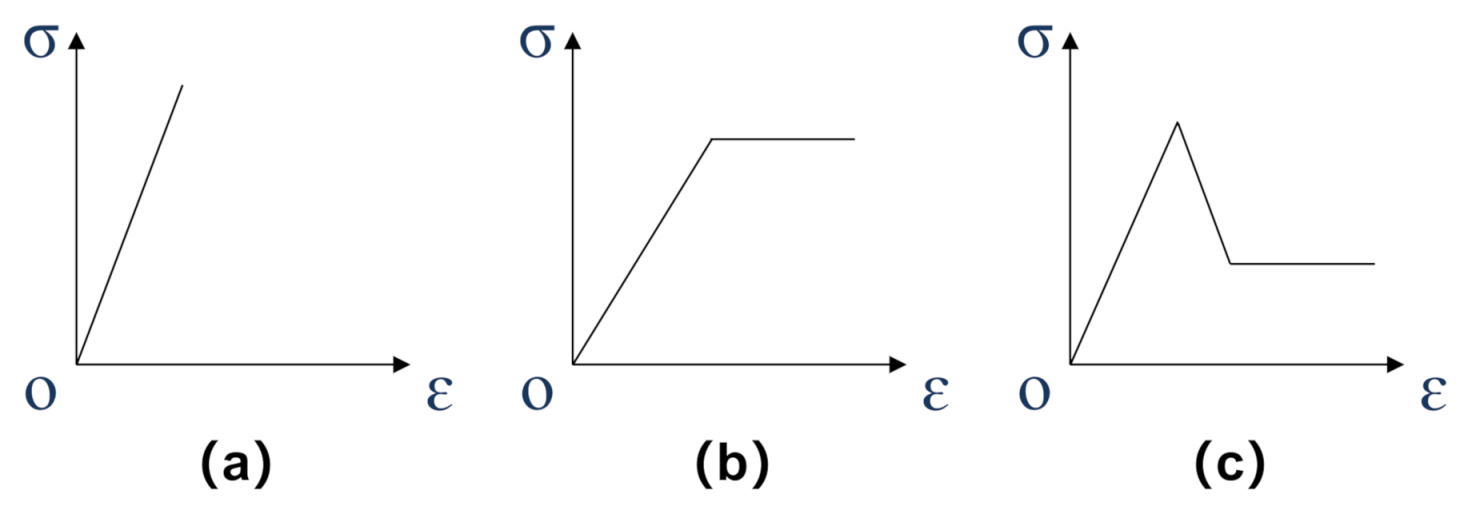
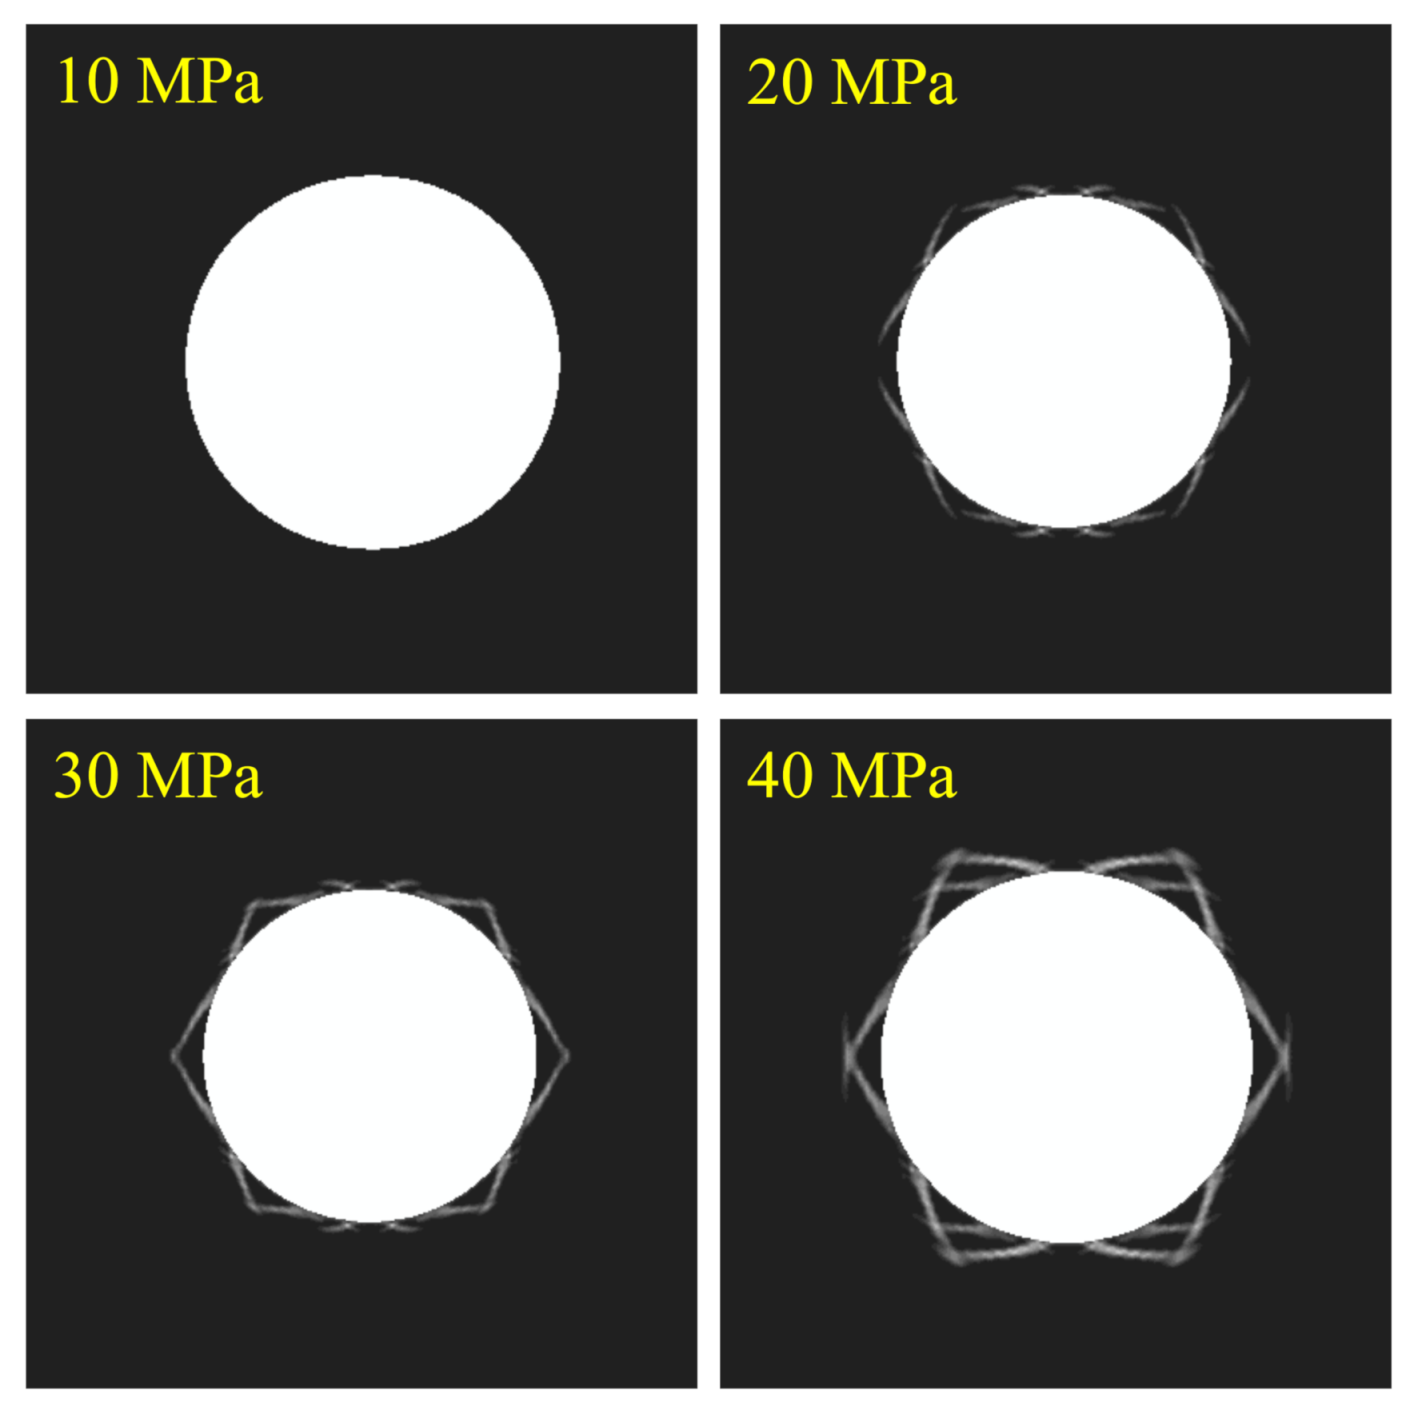
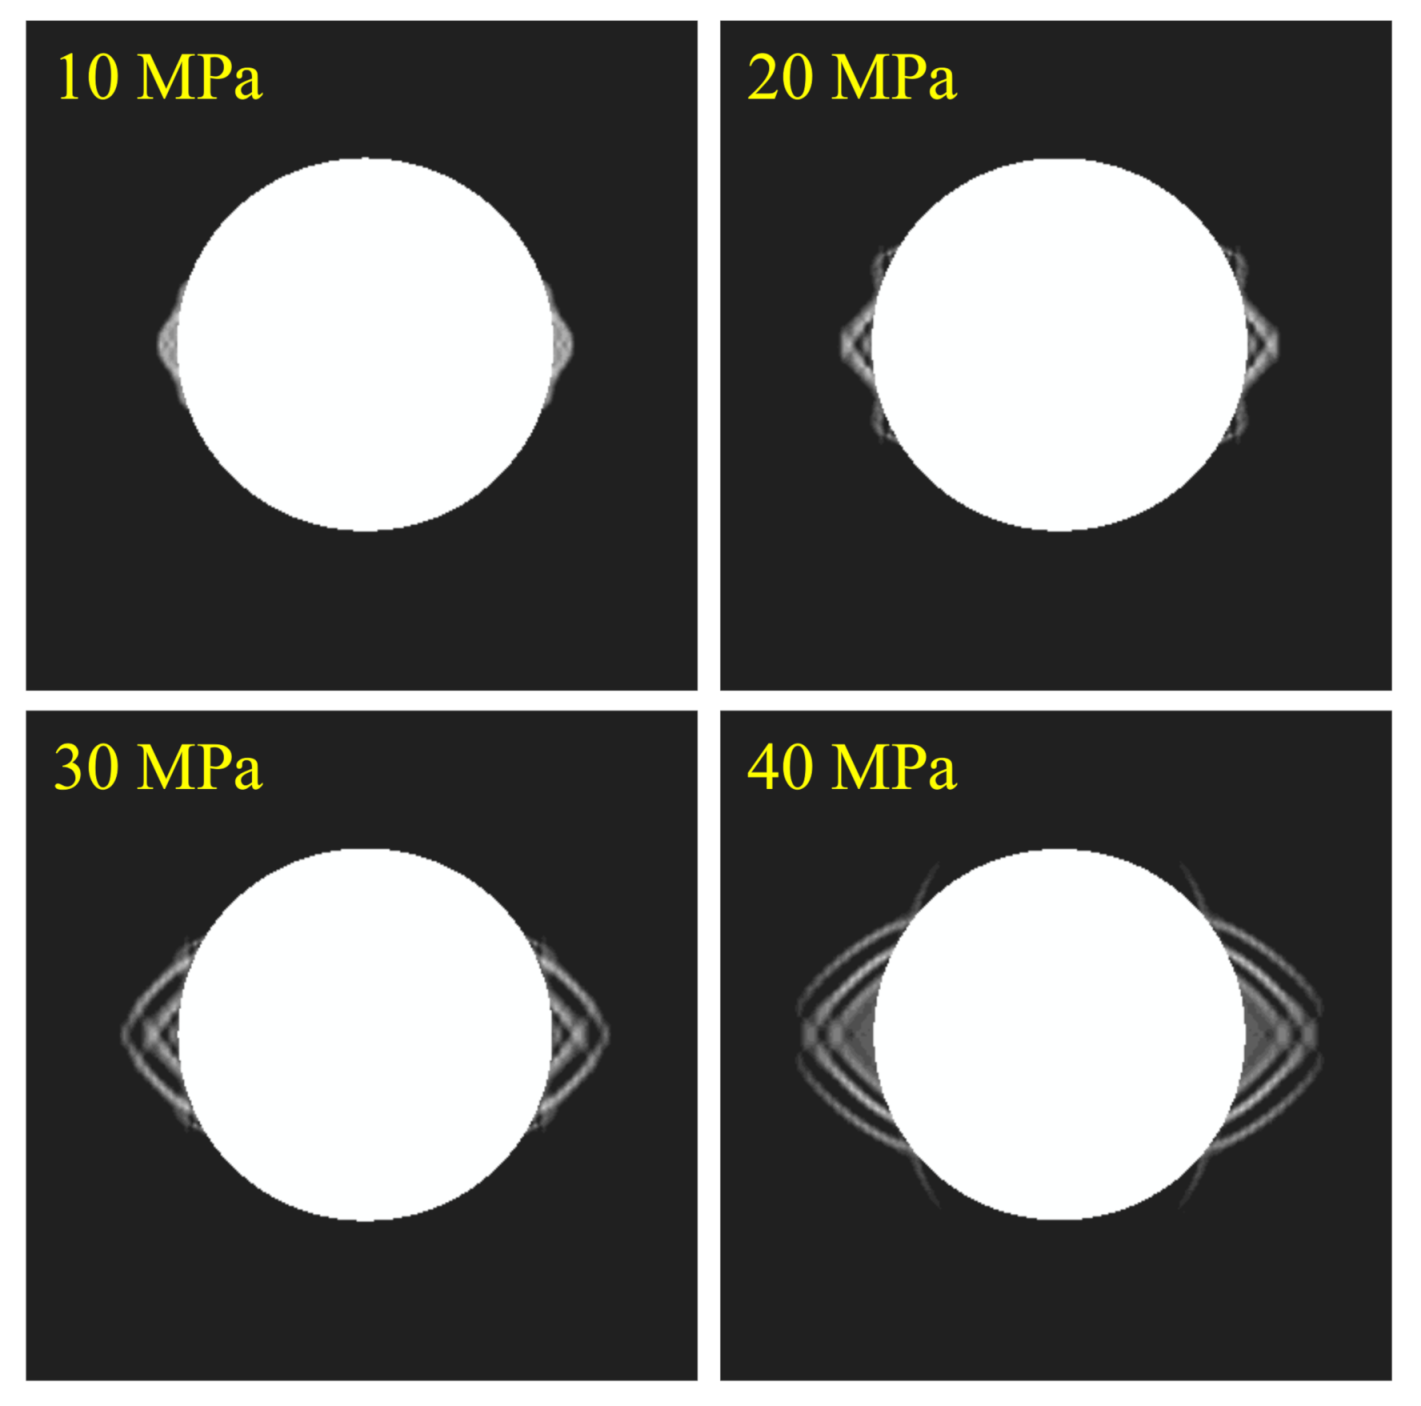
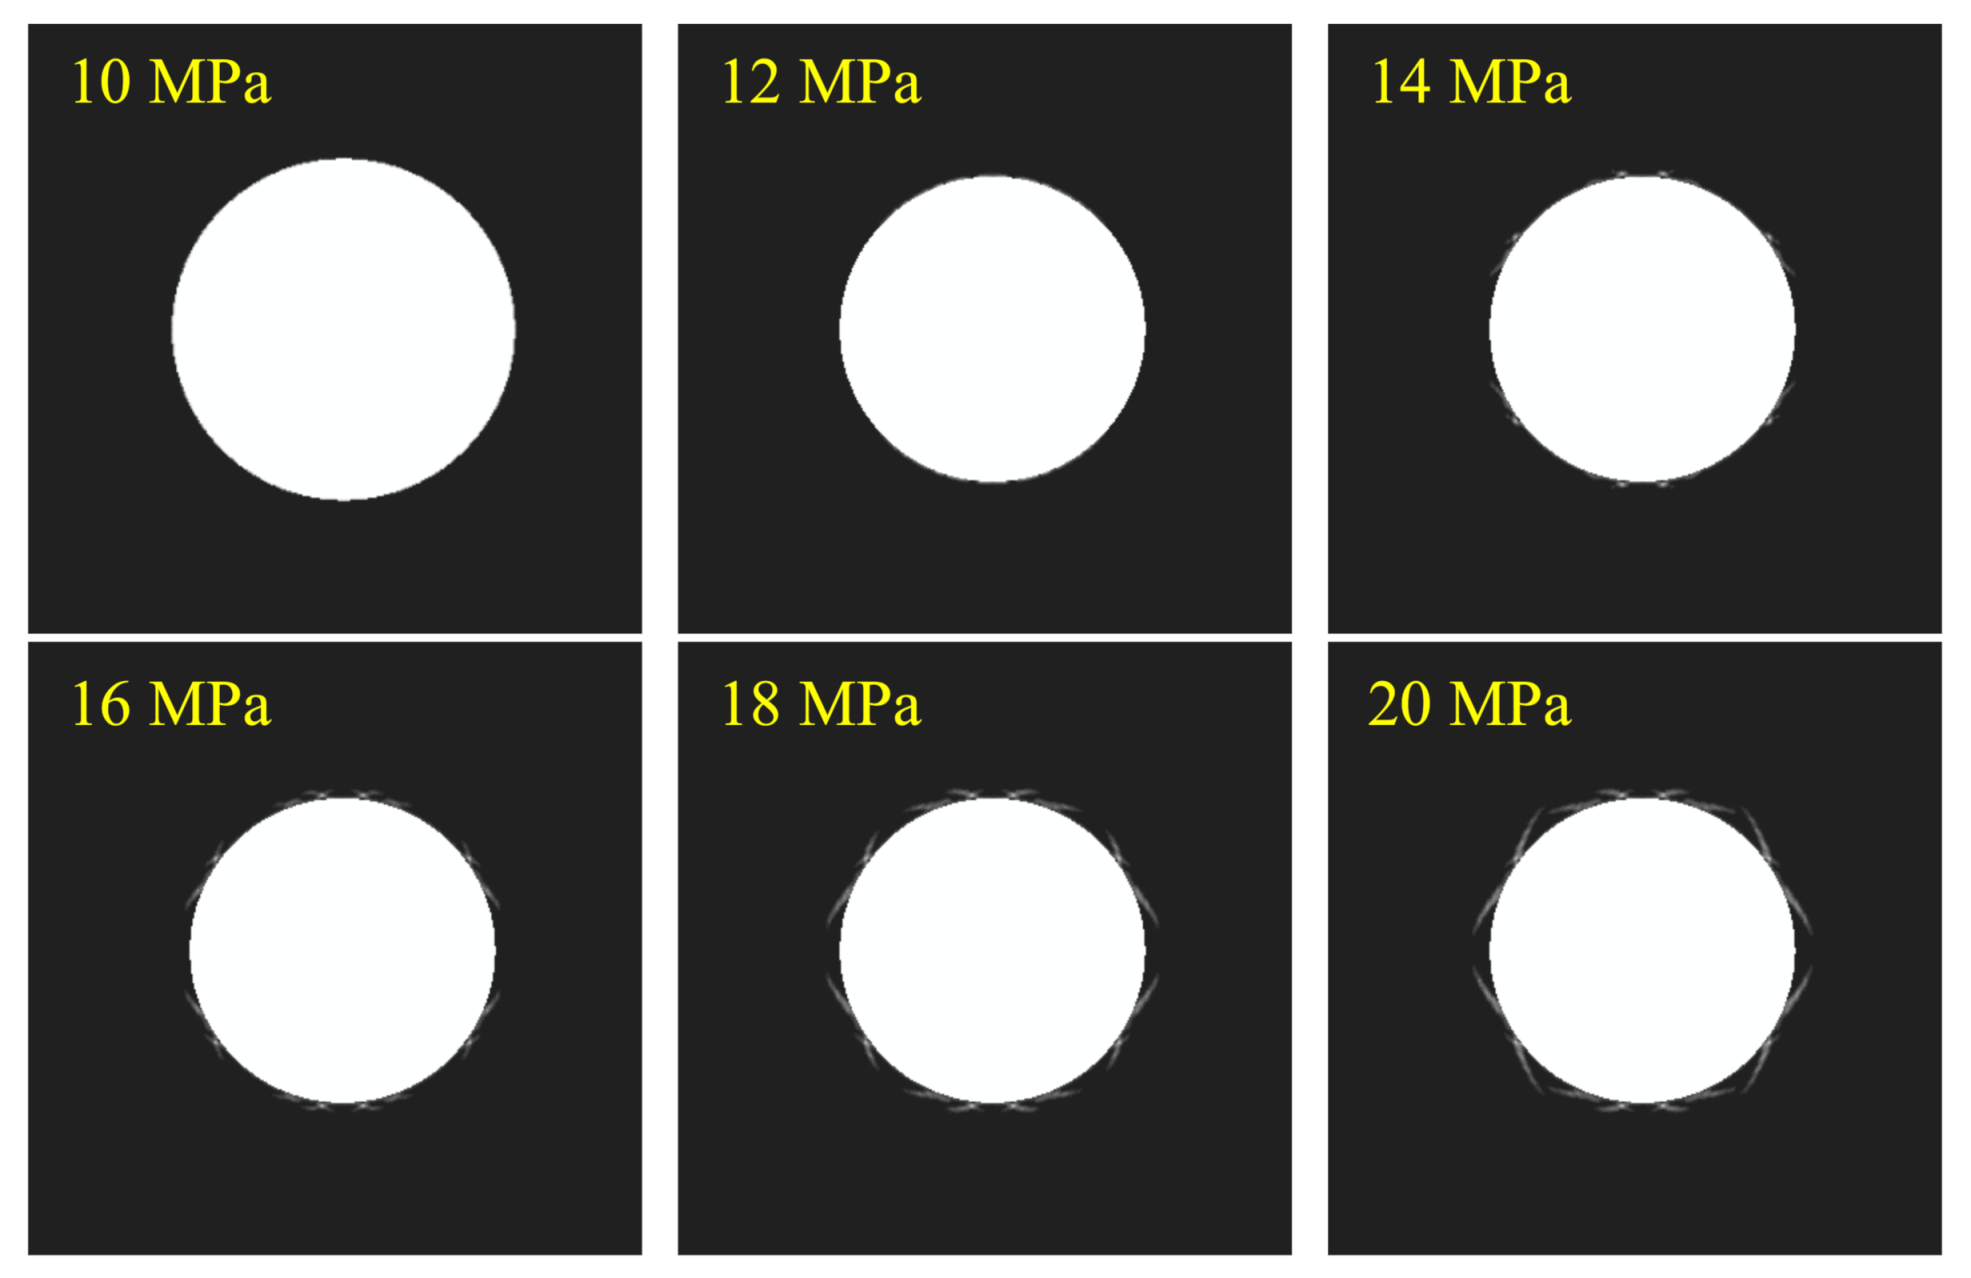
- The numerical method overcomes the shortcoming of elastic assumption in analytical methods by adding the strain-softening characteristic to the rock material in the finite element model, which helps to reveal the mechanism of wellbore instability and tubing blockage. In addition, the absolute error of the numerical method is less than 3 MPa, while that of the analytical methods is more than 4.3 MPa. Therefore, the numerical simulation is a better way to determine the critical production pressure differential because it can obtain a more accurate solution. However, solving an analytical formula may only spend a few seconds on the calculator, while the numerical simulation can take tens of minutes or even hours, depending on the computing power of the computer. It cannot be ignored that the numerical method is not as time-efficient as the analytical methods in field applications.
5. Conclusions
- (1)
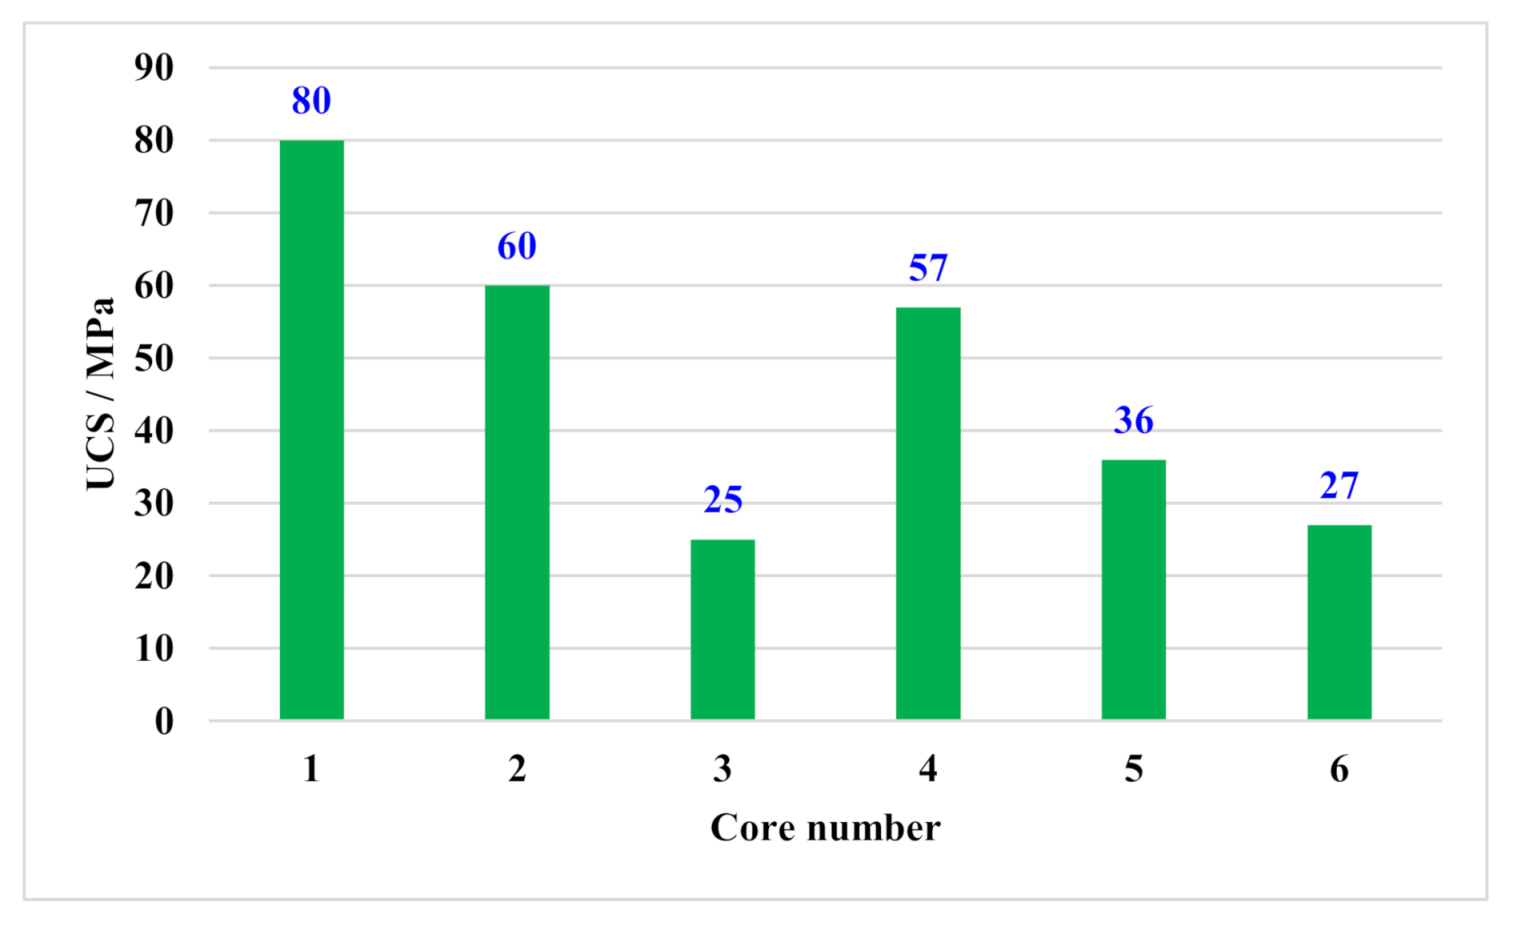
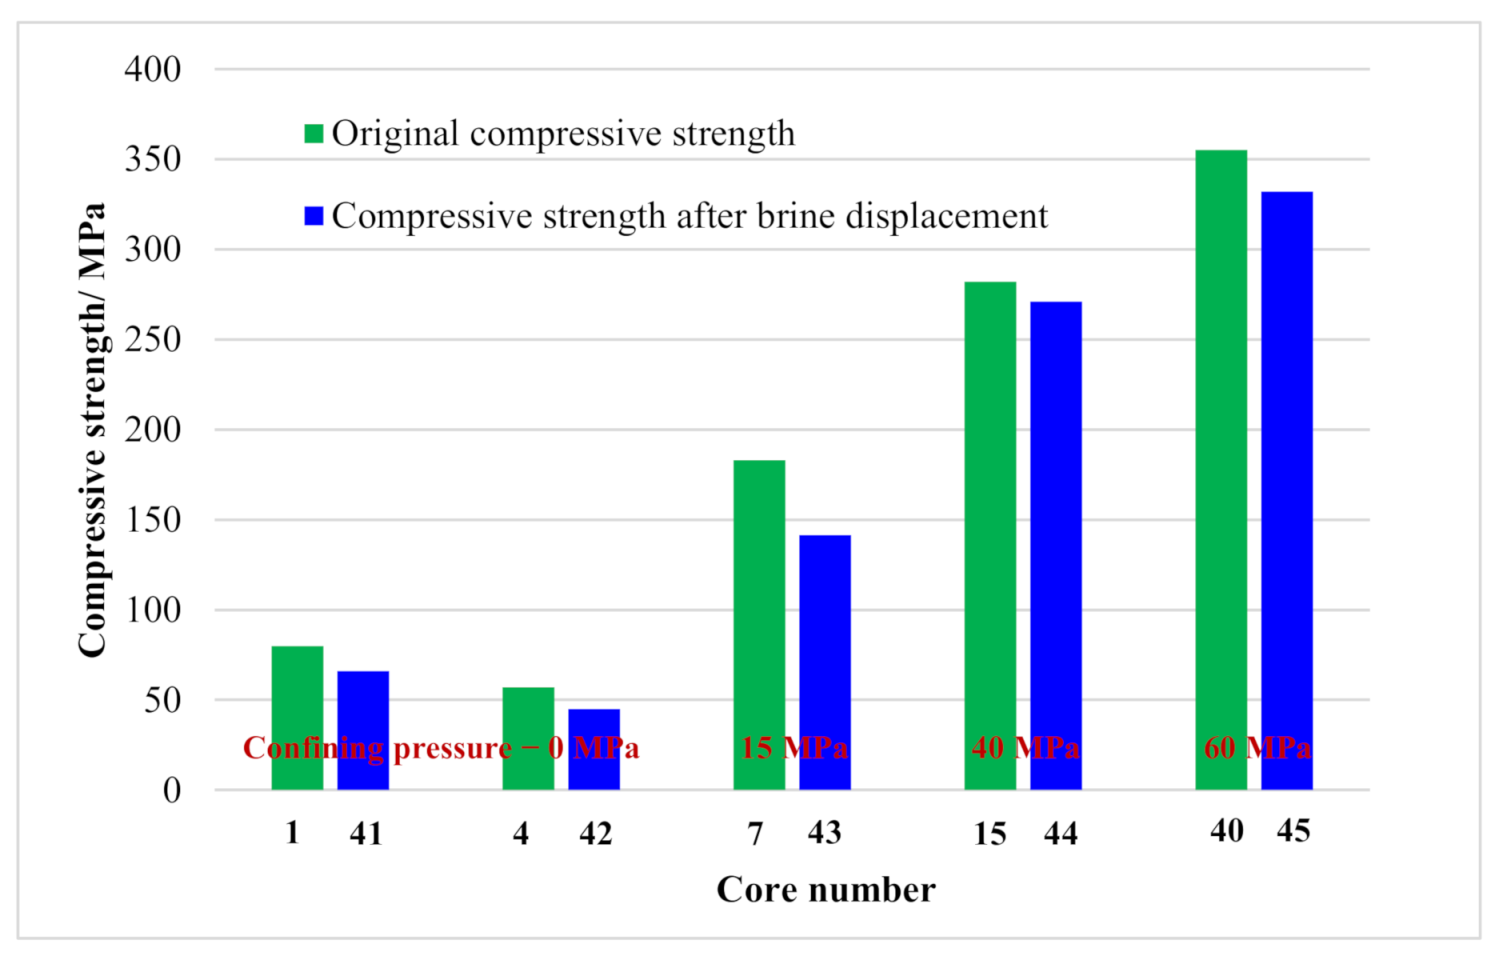
- The carbonate rocks in the Tarim Basin feature strong heterogeneity that their porosity is about 0.4–2.5%, permeability is about 0.02–3.15 md, uniaxial compressive strength is about 25–80 MPa, the elastic modulus is about 10–20 GPa, Poisson’s ratio is about 0.19–0.27, cohesion is about 11–17 MPa, and internal friction angle is about 42–46°. Furthermore, the compressive strength can be weakened about 20% and 5% after the reaction with gelling acid and completion fluids, respectively.
- (2)
- The analytical methods can be used to quickly and easily evaluate the production pressure differential, but based on different failure criteria, each method has its own limitation. The method with Mogi–Coulomb criterion can obtain a relatively accurate result according to the comprehensive comparison.
- (3)
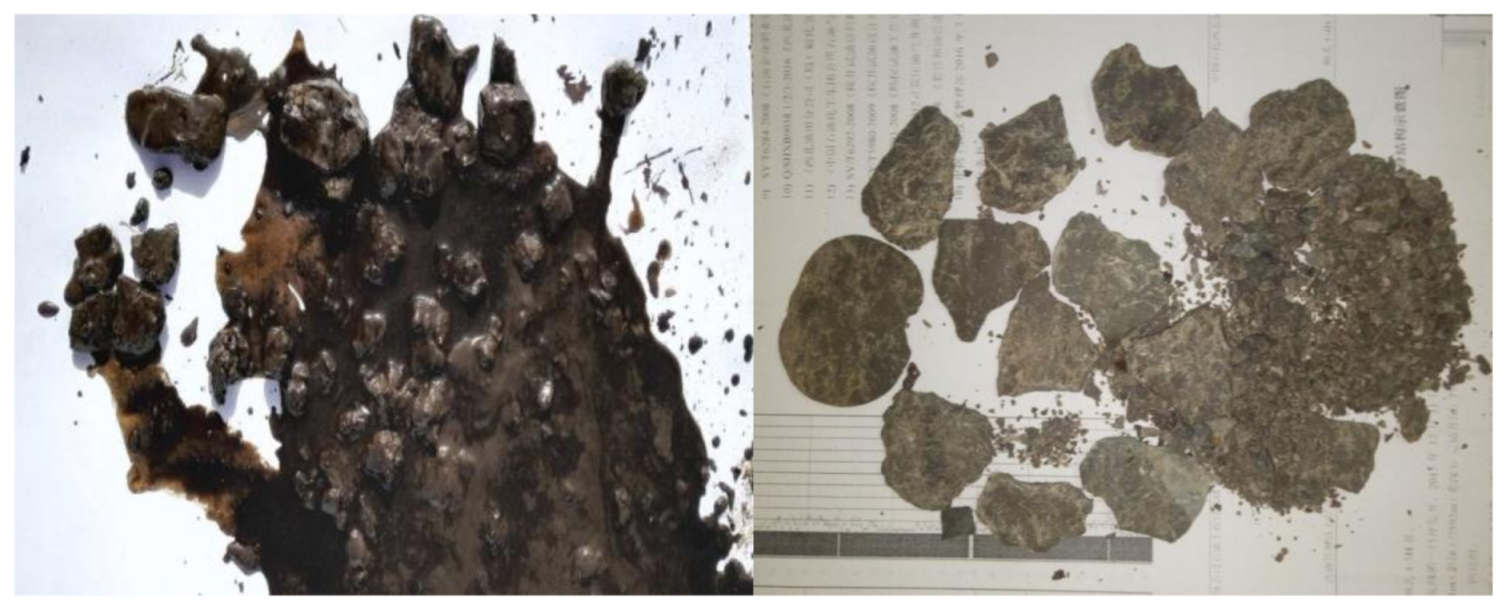
- A numerical method based on the finite element model was developed to evaluate the production pressure differential, which can truly reflect the mechanical properties, such as strain-softening of carbonate rocks. Moreover, the simulation revealed the mechanism of wellbore instability that is the rock stripping caused by the interconnection of near-wellbore plastic zones. Above all, the production pressure differential derived from the simulation is most consistent with the production data, which proves that the numerical method mentioned above is the most accurate approach to determine the critical production pressure differential. Therefore, the finite element model proposed in this paper is a better choice for predicting the production pressure differential in deep carbonate reservoirs.
Author Contributions
Funding
Conflicts of Interest
References
- Zhao, W.Z.; Hu, S.Y.; Liu, W.; Wang, T.S.; Li, Y.X. Petroleum geological features and exploration prospect of deep marine carbonate rocks in China onshore: A further discussion. Nat. Gas Ind. B 2014, 1, 11–18. [Google Scholar]
- Zeng, Y.J. Key technologies for safe and efficient drilling of marine carbonate ultra-deep oil and gas wells. Pet. Drill. Tech. 2019, 47, 25–33. (In Chinese) [Google Scholar]
- Li, Y.; Kang, Z.J.; Xue, Z.J.; Zheng, S.Q. Theories and practices of carbonate reservoirs development in China. Pet. Explor. Dev. 2018, 45, 712–722. [Google Scholar] [CrossRef]
- Zhao, W.Z.; Shen, A.J.; Hu, S.Y.; Zhang, B.M.; Pan, W.Q.; Zhou, J.G.; Wang, Z.C. Geological conditions and distributional features of large-scale carbonate reservoirs onshore China. Pet. Explor. Dev. 2012, 39, 1–14. [Google Scholar] [CrossRef]
- Chang, C.D.; Zoback, M.D.; Khaksar, A. Empirical relations between rock strength and physical properties in sedimentary rocks. J. Pet. Sci. Eng. 2006, 51, 223–237. [Google Scholar] [CrossRef]
- Geertsma, J. Some rock-mechanical aspects of oil and gas well completions. Soc. Pet. Eng. J. 1985, 25, 848–856. [Google Scholar] [CrossRef]
- Wang, Y. The effect of a nonlinear Mohr-Coulomb criterion on the stresses and plastic deformation near a circular opening in a poorly consolidated permeable medium. Int. J. Rock Mech. Min. Sci. Geomech. Abstr. 1996, 33, 197–203. [Google Scholar] [CrossRef]
- Wang, Y.; Lu, B. A coupled reservoir-geomechanics model and applications to wellbore stability and sand prediction. In Proceedings of the SPE International Thermal Operations and Heavy Oil Symposium, Margarita, Venezuela, 12–14 March 2001; Society of Petroleum Engineers: Richardson, TX, USA, 2001. [Google Scholar]
- Yi, X.J. Numerical and Analytical Modeling of Sanding Onset Prediction. Ph.D. Thesis, Texas A&M University, College Station, TX, USA, August 2003. [Google Scholar]
- Liu, X.J.; Liu, H.; Duan, Y.G.; Luo, P.Y.; Wu, X.L. Influence of well completion way on critical producing pressure differential and well productivity in sandstone reservoir. Drill. Prod. Technol. 2007, 30, 33–35. (In Chinese) [Google Scholar]
- Wang, A.P. Research on the Stress Distribution and Sanding Prediction Model for Horizontal Wells. Master’s Thesis, China University of Petroleum, Beijing, China, April 2011. (In Chinese). [Google Scholar]
- Zhang, R.; Shi, X.Y.; Zhu, R.F.; Zhang, C.; Fang, M.Z.; Bo, K.H.; Feng, J.X. Critical drawdown pressure of sanding onset for offshore depleted and water cut gas reservoirs: Modeling and application. J. Nat. Gas Sci. Eng. 2016, 34, 159–169. [Google Scholar] [CrossRef]
- Geng, S.H. Experiment Research on Rock Mechanics and Determination of Reasonable Production Pressure Difference—A Case of W Block. Master’s Thesis, Yangtze University, Jingzhou, Hubei Province, China, April 2019. (In Chinese). [Google Scholar]
- Shi, X.Y.; Huang, X.; Shi, J.Y.; Zhao, G.Y.; Xu, L.Y. Critical drawdown pressure of sanding onset for unconsolidated sandstone reservoirs when reservoir pressure depleted. J. Southwest Pet. Univ. 2020, 42, 115–122. (In Chinese) [Google Scholar]
- Jaeger, J.C.; Cook, N.G.W. Fundamentals of Rock Mechanics, 3rd ed.; Chapman and Hall: London, UK, 1979; 593p. [Google Scholar]
- Drucker, D.; Prager, W. Soil mechanic sand plastic analysis or limit design. Appl. Math. 1952, 10, 157–165. [Google Scholar]
- Hoek, E.; Brown, E.T. The Hoek–Brown failure criterion and GSI—2018 edition. J. Rock Mech. Geotech. Eng. 2019, 11, 445–463. [Google Scholar] [CrossRef]
- Zervos, A.; Papanastasiou, P.; Cook, J. Elastoplastic finite element analysis of inclined wellbores. In Proceedings of the SPE/ISRM Rock Mechanics in Petroleum Engineering, Trondheim, Norway, 8–10 July 1998; Society of Petroleum Engineers: Richardson, TX, USA, 1998. [Google Scholar]
- Al-Ajmi, A.M.; Zimmerman, R.W. Relationship between the parameters of the Mogi and Coulomb failure criterion. Int. J. Rock Mech. Min. Sci. 2005, 42, 431–439. [Google Scholar] [CrossRef]
- Liu, G.; Cai, M.; Huang, M. Mechanical properties of brittle rock governed by micro-geometric heterogeneity. Comput. Geotech. 2018, 104, 358–372. [Google Scholar] [CrossRef]
- Wong, T.F.; Robina, H.C.; Wong, K.T.; Tang, C.A. Microcrack statistics, Weibull distribution and micromechanical modeling of compressive failure in rock. Mech. Mater. 2006, 38, 664–681. [Google Scholar] [CrossRef]
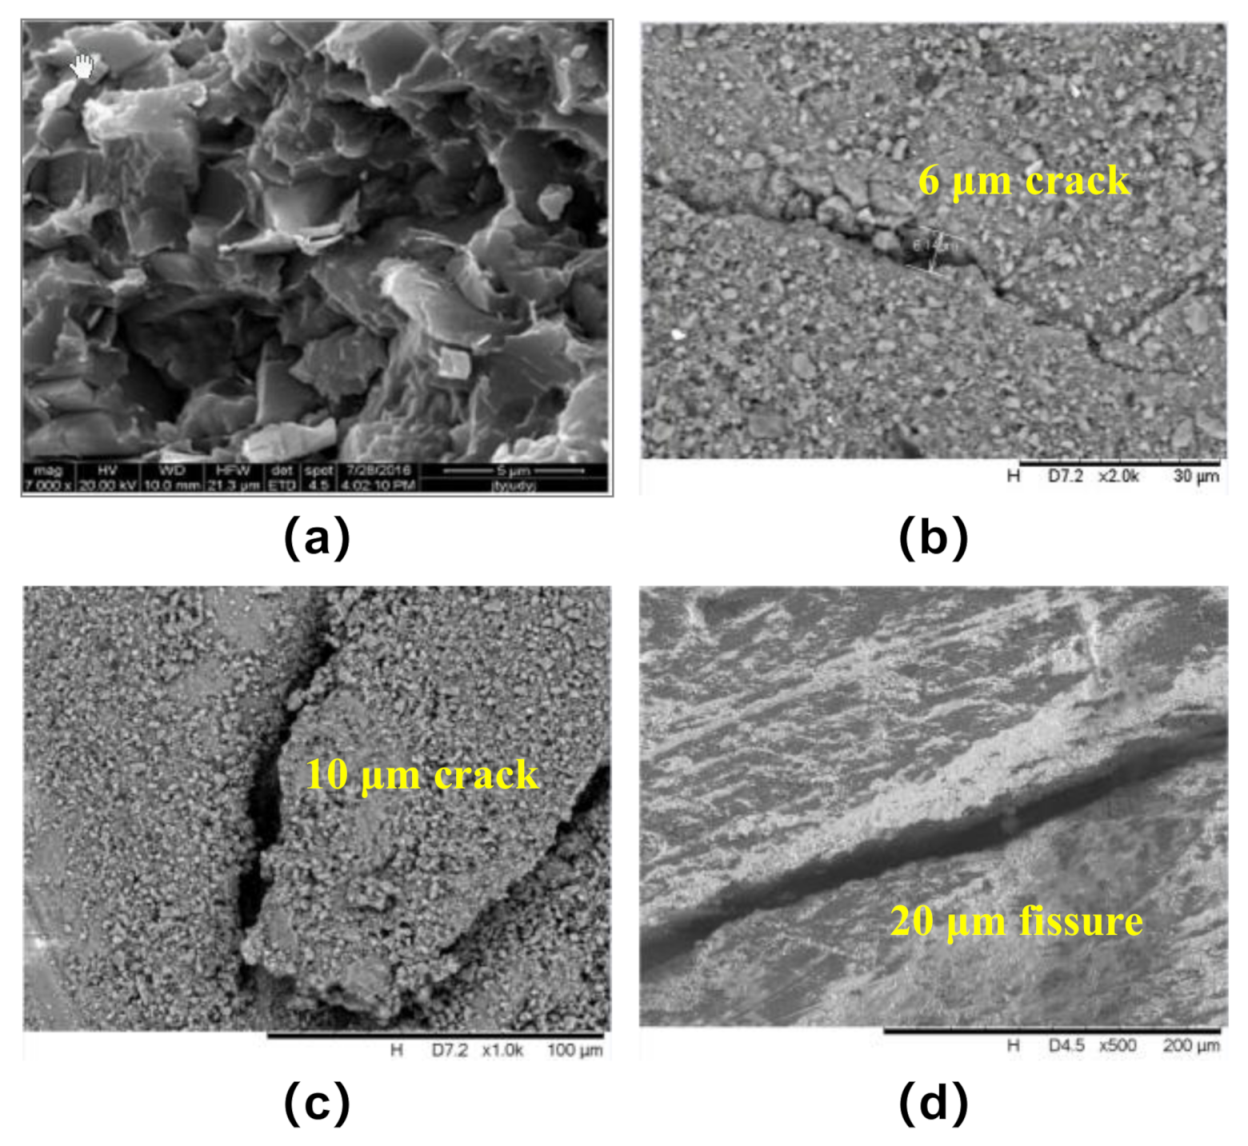
- Liu, H.B.; Cui, S.; Meng, Y.F.; Deng, H.; Han, X. Micro-mechanical structure and mechanical properties of fractured carbonate rock. Spec. Oil Gas Reserv. 2020, 27, 155–161. (In Chinese) [Google Scholar]
- Xu, K. Characteristics and Main Controlling Factors of Ordovician Carbonate Rock Reservoir in Tazhong Area of Tarim Basin. Ph.D. Thesis, China University of Geosciences, Beijing, China, October 2015. (In Chinese). [Google Scholar]
- Tan, Q.; Li, S.G.; Su, P.; Weng, H.Y.; Xiao, Y. A classification and description method for carbonate reservoir mechanical properties based on the Hoek-brown criterion. In Proceedings of the 53rd US Rock Mechanics/Geomechanics Symposium, New York, NY, USA, 23–26 June 2019; American Rock Mechanics Association: Alexandria, VA, USA, 2019. [Google Scholar]
- Lei, Z.D.; Tao, L.; Zhu, H.Y.; Chen, S.; Liu, Q.Y. Experimental study of Wufeng-Longmaxi shale core: The fracture characteristics and the change of permeability under the natural fractures influence. In Proceedings of the SPE Asia Pacific Hydraulic Fracturing Conference, Beijing, China, 24–26 August 2016; Society of Petroleum Engineers: Richardson, TX, USA, 2016. [Google Scholar]
- Fairhurst, C.E.; Hudson, J.A. Draft ISRM suggested method for the complete stress-strain curve for intact rock in uniaxial compression. Int. J. Rock Mech. Min. Sci. 1999, 36, 279–289. [Google Scholar]
- Shi, B.Q. Rock Petrophysics Experiment in Medium-Deep Gas Reservoirs. Master’s Thesis, China University of Petroleum, Shandong, China, April 2007. (In Chinese). [Google Scholar]
- Zhang, R.X.; Hou, B.; Zhou, B.C.; Liu, Y.J.; Xiao, Y.; Zhang, K.P. Effect of acid fracturing on carbonate formation in southwest China based on experimental investigations. J. Nat. Gas Sci. Eng. 2020, 73, 103057. [Google Scholar] [CrossRef]
- Hou, B.; Zhang, R.X.; Chen, M.; Kao, J.W.; Liu, X. Investigation on acid fracturing treatment in limestone formation based on true tri-axial experiment. Fuel 2019, 235, 473–484. [Google Scholar] [CrossRef]
- Zhang, H.; Zhong, Y.; Zhang, J.; Zhang, Y.C.; Kuang, J.C.; Yang, B. Experimental research on deterioration of mechanical properties of carbonate rocks under acidified conditions. J. Pet. Sci. Eng. 2020, 185, 106612. [Google Scholar] [CrossRef]
- Nasr-El-Din, H.A.; Al-Driweesh, S.M.; Metcalf, A.S.; Chesson, J.B. Fracture acidizing: What role does formation softening play in production response? SPE Prod. Oper. 2008, 23, 184–191. [Google Scholar] [CrossRef]
- Ru, Z.X.; Zhao, R.; Zhang, J.B.; Deng, S.; Li, H.L.; Wang, Q. Impacts of working fluid immersion on strength of deep-buried rocks in Shunbei, Tarim. Rock Soil Mech. 2020, 41, 1–10. (In Chinese) [Google Scholar]
- Zhang, L.W.; Dusseault, M.B. Sand-production simulation in heavy-oil reservoirs. SPE Reserv. Eval. Eng. 2004, 7, 399–407. [Google Scholar] [CrossRef]
- Liu, W.; Tan, Q.; Yu, B.H.; Deng, J.G. Modeling the borehole breakout in coal seams with a coupled hydro-mechanical model. In Proceedings of the 51st US Rock Mechanics/Geomechanics Symposium, San Francisco, CA, USA, 25–28 June 2017; American Rock Mechanics Association: Alexandria, VA, USA, 2017. [Google Scholar]
- Zhou, S.H.; Hillis, R.; Sandiford, M. On the mechanical stability of inclined wellbores. SPE Drill. Complet. 1996, 11, 67–73. [Google Scholar] [CrossRef] [Green Version]
- Kaarstad, E.; Aadnoy, B.S. Optimization of borehole stability using 3-D stress optimization. In Proceedings of the SPE Annual Technical Conference and Exhibition, Dallas, TX, USA, 9–12 October 2005; Society of Petroleum Engineers: Richardson, TX, USA, 2005. [Google Scholar]
- Al-Ajmi, A.M.; Zimmerman, R.W. Stability analysis of deviated boreholes using the Mogi-Coulomb failure criterion, with applications to some oil and gas reservoirs. In Proceedings of the IADC/SPE Asia Pacific Drilling Technology Conference 2006—Meeting the Value Challenge: Performance, Deliverability and Cost, Bangkok, Thailand, 13–15 November 2006; IADC/SPE Asia Pacific Drilling Technology Conference and Exhibition: Richardson, TX, USA, 2006. [Google Scholar]
- Kanfar, M.F.; Chen, Z.; Rahman, S.S. Effect of material anisotropy on time-dependent wellbore stability. Int. J. Rock Mech. Min. Sci. 2015, 78, 36–45. [Google Scholar] [CrossRef]
- Li, Q.; Tang, Z.Q. Optimization of wellbore trajectory using the initial collapse volume. J. Nat. Gas Sci. Eng. 2016, 29, 80–88. [Google Scholar] [CrossRef]
- Fan, X.; Zhang, M.M.; Zhang, Q.G.; Zhao, P.F.; Yao, B.W.; Lv, D. Wellbore stability and failure regions analysis of shale formation accounting for weak bedding planes in ordos basin. J. Nat. Gas Sci. Eng. 2020, 77, 103258. [Google Scholar] [CrossRef]


| Core Number | Density/g·cm−3 | Confining Pressure/MPa | Compressive Strength/MPa | Elastic Modulus/GPa | Poisson’s Ratio |
|---|---|---|---|---|---|
| 1 | 2.65 | 0 | 80 | 18.11 | 0.24 |
| 2 | 2.64 | 0 | 60 | 11.89 | 0.21 |
| 3 | 2.64 | 0 | 25 | 5.00 | 0.20 |
| 4 | 2.57 | 0 | 57 | 17.36 | 0.22 |
| 5 | 2.64 | 0 | 36 | 7.85 | 0.21 |
| 6 | 2.63 | 0 | 27 | 4.54 | 0.27 |
| 7 | 2.64 | 15 | 183 | 29.15 | 0.29 |
| 8 | 2.64 | 15 | 140 | 27.14 | 0.19 |
| 9 | 2.65 | 15 | 138 | 20.51 | 0.20 |
| 10 | 2.62 | 15 | 170 | 21.54 | 0.31 |
| 11 | 2.64 | 20 | 244 | 38.49 | 0.23 |
| 12 | 2.66 | 20 | 184 | 26.82 | 0.21 |
| 13 | 2.63 | 20 | 181 | 35.03 | 0.19 |
| 14 | 2.63 | 20 | 200 | 38.10 | 0.26 |
| 15 | 2.68 | 40 | 282 | 39.24 | 0.30 |
| 16 | 2.65 | 40 | 264 | 29.27 | 0.33 |
| 17 | 2.61 | 50 | 292 | 35.70 | 0.20 |
| 18 | 2.62 | 50 | 328 | 35.15 | 0.33 |
| Well Number | Core Number | Well Depth/m | Density/g·cm−3 | Porosity/% | Permeability/mD | Remarks |
|---|---|---|---|---|---|---|
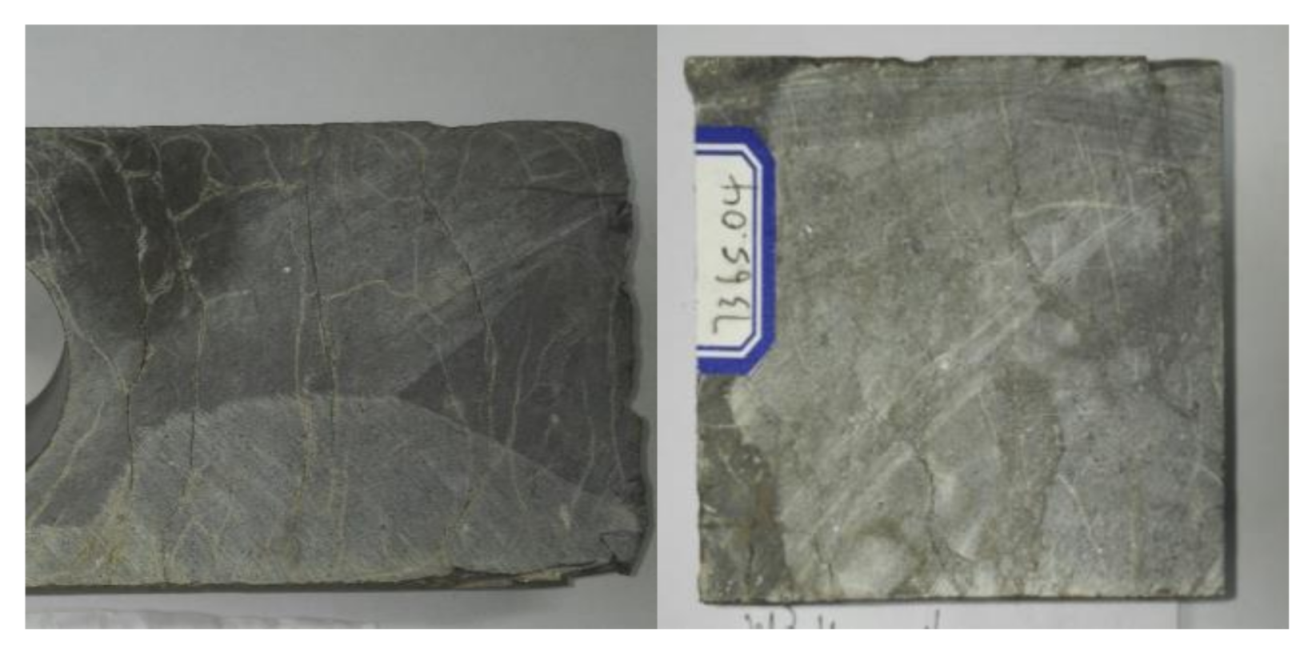
| A1 | 19 | 7268.1 | 2.69 | 0.6 | 0.46 | contain cracks |
| 20 | 7274.0 | 2.69 | 1.1 | 6.75 | contain fissures | |
| 21 | 7288.8 | 2.70 | 0.6 | 1.93 | intact | |
| A2 | 22 | 7350.7 | 2.70 | 0.4 | 0.05 | intact |
| 23 | 7353.6 | 2.71 | 1.9 | 0.03 | intact | |
| 24 | 7356.9 | 2.71 | 2.2 | 0.56 | intact | |
| A3 | 25 | 7358.4 | 2.71 | 1.3 | 0.02 | intact |
| 26 | 7446.3 | 2.71 | 2.5 | 3.15 | intact | |
| 27 | 7737.4 | 2.70 | 0.9 | 38.8 | contain fissures |
| Core Number\Mineral Type | Mineral Content/% | |||||
|---|---|---|---|---|---|---|
| Quartz | Plagioclase | Calcite | Dolomite | Anhydrite | Clay | |
| 28 | 1.0 | 1.2 | 97.8 | / | / | / |
| 29 | 2.6 | 1.3 | 92.3 | 3.8 | / | / |
| 30 | 6.2 | 3.1 | 90.7 | / | / | / |
| 31 | 1.6 | / | 89.8 | 7.7 | 0.9 | / |
| Geological Parameters | Value Assignment |
|---|---|
| Vertical depth/m | 7510 |
| Overburden pressure/MPa | 179.5 |
| Maximum horizontal in-situ stress/MPa | 182.5 |
| Minimum horizontal in-situ stress/MPa | 135.2 |
| Pore pressure/MPa | 82.6 |
| Effective stress coefficient | 0.6 |
| Porosity/% | 2 |
| Permeability/mD | 10 |
| Elastic Modulus/GPa | 17 |
| Poisson’s ratio | 0.23 |
| Cohesion/MPa | 13.4 |
| Residual cohesion/MPa | 11.2 |
| Internal friction angle/° | 42 |
| Residual internal friction angle/° | 38 |
| Critical equivalent plastic strain | 0.018 |
| Production Pressure Differential/MPa | Blockage of Tubing |
|---|---|
| <15 | No blockage |
| 15–20 | Slight blockage |
| 20–30 | Remarkable blockage |
| 30–40 | Severe blockage |
Publisher’s Note: MDPI stays neutral with regard to jurisdictional claims in published maps and institutional affiliations. |
© 2021 by the authors. Licensee MDPI, Basel, Switzerland. This article is an open access article distributed under the terms and conditions of the Creative Commons Attribution (CC BY) license (https://creativecommons.org/licenses/by/4.0/).
Share and Cite
Weng, H.; Deng, J.; Zhang, C.; Tan, Q.; Chen, Z.; Liu, W. Evaluation Method of Production Pressure Differential in Deep Carbonate Reservoirs: A Case Study in Tarim Basin, Northwest China. Energies 2021, 14, 2721. https://doi.org/10.3390/en14092721
Weng H, Deng J, Zhang C, Tan Q, Chen Z, Liu W. Evaluation Method of Production Pressure Differential in Deep Carbonate Reservoirs: A Case Study in Tarim Basin, Northwest China. Energies. 2021; 14(9):2721. https://doi.org/10.3390/en14092721
Chicago/Turabian StyleWeng, Haoyang, Jingen Deng, Chunfang Zhang, Qiang Tan, Zhuo Chen, and Wei Liu. 2021. "Evaluation Method of Production Pressure Differential in Deep Carbonate Reservoirs: A Case Study in Tarim Basin, Northwest China" Energies 14, no. 9: 2721. https://doi.org/10.3390/en14092721