1. Introduction
Huge axial multistage multi-flow pressure compounded steam turbines are the backbone of electricity generation today. The achieved expansion efficiency of those turbines is well above 90%. In 2017, according to the International Energy Agency [
1], almost 50% of world’s electricity demand was generated in nuclear and fossil fired steam power plants, i.e., by those steam turbines. However, in 2021, some countries, e.g., Chile, Denmark, and Germany, have already decided to shut down all coal fired plants by the middle of this century, and it is expected others will follow. Thus, the energy system must be changed dramatically from a few gigawatt plants to a high number of small power units close to the consumers. By doing so, the waste heat, which is unavoidable for any thermal plant, can be used directly and more efficiently for heating and cooling purposes. Furthermore, electric transmission losses are reduced, and the grid itself is released.
Aside from wind power and solar, the aimed distributed power generation will still make use of many small thermal plants, which will work as steam or organic Rankine cycles in the range of few megawatts, a few hundred kilowatts, or even below 100 kW
el. The heat sources will be geothermal wells, biomass, waste heat, or even stored heat in the case of CARNOT batteries [
2]. The expanders in those small plants must be simple, easily adjustable to different applications, and cost effective. The expansion efficiency will no longer play the same role as in today’s large power plants, as the dumped heat can be used on site. The required small expanders must convert enthalpy drops in a similar magnitude compared to their large counterpart but should implement this in few stages or even one stage to reduce specific costs. The mass flow rate or volume flow rate passing the turbines is small due to the small power output. Both together lead to unfavorable small specific speeds.
For those applications, the authors developed a micro-turbine construction kit [
3], which relies on a simple partially admitted impulse turbine architecture. The single turbine wheel is directly mounted on the generator shaft; the whole turbo generator is hermetically sealed. The achieved efficiencies of the small test turbines (5 kW–15 kW, 60% <
< 75%) are satisfactory [
4,
5]. However, the necessary rotational speeds are high (20,000 rpm <
n < 50,000 rpm) and require a high-speed generator (>6000 rpm). The high-speed generator contributes about 2/3 of the specific cost of the entire turbo generator (1000 €/kW
el to 1500 €/ kW
el). Therefore, the authors are aiming for a solution, which works with an inexpensive standard generator from the shelf (1500–6000 rpm). In turbomachinery, velocity compounding is a way to bring down the necessary circumferential velocity or the corresponding rotational speed, respectively.
This concept was widely used in Curtis turbines [
6] at the start of the electrification era in the early 20th century. As power plants grew in power rating and efficiency requirements increased, it was replaced by pressure compounded impulse and reaction stages [
7]. However, for the applications described above, the cost advantage of the standard generator might more than compensate for the efficiency disadvantage. Therefore, the authors investigate the potential of velocity compounding to reduce the necessary rotational speed.
Figure 1 compares the simplified velocity triangles of an ideal impulse turbine equipped with 180° deflecting blades (therefore parallel vectors) with the velocity triangles of an ideal velocity compounded stage (two velocity stages). In both turbines, the entire stage enthalpy respectively pressure drop is already converted to kinetic energy at the nozzle exit (absolute velocity
c1). There is no pressure drop across the blades. Therefore, both turbines can work with partial admission in contrast to reaction turbines. Thanks to the second velocity stage, the velocity compounded turbine operates with only 50% of the rotational speed (
u =
c1) of the pure impulse turbine (
u =
c1). Two additional velocity stages (= 4 stages) would further halve the rotational speed to 25% of the impulse turbine [
8]. At the outlet of both idealized turbines, the absolute velocity (
c2,
c2′) is zero, i.e., the entire specific kinetic energy (
c12) is transferred to the turbine shaft.
For distributed small-scale power generation, other authors have also rediscovered velocity compounding. Klonowicz et al. [
9] investigated a radial Curtis turbine with two velocity stages. The radial architecture avoids a major disadvantage of the axial Curtis turbine: the axial Curtis needs a separate disc for each velocity stage. The radial turbine arranges the two rotor blade rows on one single disc, which can be mounted directly on the generator shaft like for the simple impulse turbine.
The disadvantage of one disc per velocity stage can also be overcome by a re-entry design. An axial re-entry turbine of Evans et al. [
10] is displayed in
Figure 2. The jet, leaving the nozzle, passes the unique blade wheel several times (here, three times). In axial arrangement, the necessary deflection channels are quite complicated and enlarge the overall size of the turbine. In a radial architecture, the deflection channels can be easier integrated like shown by Kryllowicz et al. [
11] in
Figure 3. The radial velocity compounded re-entry turbine is also called “Elektra” [
12,
13,
14]. Already in Stodola 1905 [
15], the experimental results of a 30 kW Elektra turbine running at about 3000 rpm were presented. These simple turbines served as direct drives for fans and pumps on ships. Their exhaust steam was used for preheating in the ships steam drive system. Thus, their efficiency was not decisive. Because of their simple and compact structure, re-entry turbines were even investigated for space application by NASA [
16,
17] in the 1960s.
In the opinion of the authors, the concept of a velocity compounded radial re-entry turbine (Elektra) has the potential to implement a simple cost-effective turbo generator for small-scale distributed power generation. Thus, based on the present knowledge, the goal of the current and future research projects is to answer the following two main questions:
Although the velocity compounded turbines in general, and the re-entry concept in particular, have a high potential for a low-cost small turbo generator, this concept has not been investigated since the 1960s. There was no application and the technology has been almost forgotten. Since then, however, the requirements for power systems have changed significantly. Furthermore, new design and manufacturing methods such as 3D flow simulation and 3D printing are available today. The present work applies these methods for the first time in the development of a velocity compounded re-entry turbine and would like to clarify the open question of whether it is possible today with these methods to realize a turbo generator that is competitive in terms of efficiency and superior in terms of the specific costs.
2. Materials and Methods
The investigation of the Elektra turbine, treated in this article, followed the design process, displayed in
Figure 4. Starting from the given input data and boundary conditions, that will be described later, a first flow geometry of the turbine was determined using an in-house 1D Turbine Design Tool (1DTDT). The geometry parameters were then elaborated into a computer aided design (CAD) model. Based on this, numerical investigations using 3D computational fluid dynamics (CFD) simulations were carried out, which led to an optimization of the geometry in an iterative process. Depending on the complexity of the geometry changes, they were directly implemented in the CFD environment or adapted first in the CAD software. Measurements of different versions of the turbine on the compressed air test stand served to validate the simulation results and revealed further potential for improvement. The individual tools of the design and optimization process are explained in detail below.
2.1. 1D Turbine Design Tool
The 1D Turbine Design Tool enables a quick calculation of geometry data, power output, and turbine efficiency for axial impulse and two wheel velocity compounded Curtis turbines, as well as for radial cantilever quasi impulse turbines. The Excel-based program uses a 1D mean line model and an in-house developed simple loss model [
3]. Moreover, radial inflow axial outflow reaction turbines can be calculated with the help of an open access loss model introduced in [
18]. For further information on the applied loss models, the reader is referred to [
3]. The tool accesses REFPROP fluid properties [
19] to calculate the thermodynamic conditions of the chosen working fluid. The existing 1DTDT has now been further developed so that it can also be used to design velocity compounded radial re-entry turbines in one dimension. The procedure has already been described in [
8] but is repeated here for the sake of completeness.
The working fluid, the inlet total conditions, the required mass flow rate, and the static exit pressure must be defined to start the iterative design approach (
Table 1). Moreover, a total-to-static isentropic expansion efficiency must be assessed to determine the static outlet conditions of the final wheel pass (see
Table 1). An optimal circumferential velocity can be simply determined based on the considerations in
Figure 1 (two wheel passes
u =
c1). The rotor blading can only be designed or optimized for one flow pass. For the other pass(es), “design” is not a design calculation but an analysis calculation.
Because pressure builds up from downstream to upstream, the design approach starts with exit pressure of the last wheel pass. Flow velocity, velocity triangle, total, and total relative thermodynamic condition at wheel exit are determined. Subsequently, flow velocity, velocity triangle, total, and total relative thermodynamic condition at wheel inlet are calculated by assessing enthalpy losses of the wheel pass based on the implemented loss models [
3].
If there is a deflection channel upstream of the wheel pass, the channel flow area distribution is calculated for constant pressure under consideration of enthalpy dissipation as function of the Mach number and the deflection angle like for a blade row. Since the deflection angle is a function of the absolute inlet angle at the considered wheel pass and the absolute exit angle of the wheel pass just upstream, it becomes obvious that the boundary condition of the calculation is influenced by its results. Thus, this task cannot be solved just analytically, it must be solved iteratively. If there is a nozzle upstream of the wheel pass, the supersonic nozzle can be calculated by means of a simple loss correlation for Laval nozzles. The convergent–divergent nozzles show a rectangular cross-section area, and the divergent part is equipped with straight walls. The area increase is implemented only in one dimension. Such simple nozzles work very reliably (see [
20,
21]).
The turbine blade wheel outer diameter is determined with respect to the possible maximum rotational speed regarding mechanical integrity and bearing technology. The diameter ratio should be close to unity (about 0.95) to avoid useless adding and extracting of pumping work by the centrifugal pressure field for each wheel pass. The blade angles of the impulse blades ( = 180° ) should be chosen in the range 15° < < 20°. The required blade height can then be calculated with the outlet diameter of the final wheel pass, the blade angle, the thermodynamic outlet conditions, and the mass flow rate. The outer and inner shell areas of the wheel should be equal because the flow passes the wheel from both sides, i.e., the blade height from outer to inner diameter varies inversely proportional to the wheel diameter: .
As a result of the velocity compounding, absolute velocity and its radial component drops from wheel pass to wheel pass. Thus, the degree of admission, i.e., the flow area of the deflection channels must increase from pass to pass. Furthermore, with decreasing radial component of velocity, the angle between the absolute velocity c and circumferential velocity u becomes smaller, because the blade angle and the circumferential velocity u are fixed. Therefore, the final nozzle inclination to circumferential direction u will be higher than the usual 12°–15° of classical impulse turbine stages. Due to the defined constant area wheel the flow would not change its relative velocity without friction. However, with growing boundary layers the effective flow area decreases and the velocity must change. For relative flow Mach numbers below unity, the flow accelerates, i.e., pressure drops. For relative Mach numbers higher than unity, in contrast, the flow decelerates, i.e., the pressure rises. Thus, despite an impulse wheel design ( = 180° − , ), a pressure change occurs for every wheel pass. Several internal and external iterations must be performed until the required total inlet pressure is achieved for the given mass flow rate, and the calculated expansion efficiency coincides with the original assessed one.
2.2. CFD Physical Models and Boundary Conditions
Starting from the geometry data generated by the 1DTDT and converted into a 3D CAD model of the turbine, several steady and unsteady 3D CFD simulations were carried out for design boundary conditions. Here, the approach was to apply the same physical models and boundary conditions in every step of the design optimization to make the results comparable to previous simulations. For this purpose, the Fine
TM/Turbo package from Cadence (San Jose, CA, USA) was used [
22], more precisely the EURANUS flow solver, based on Reynolds-averaged Navier-Stokes (RANS) equations, in combination with multiblock structured grids. Further information concerning the flow solver can be found in Hirsch et al. [
23] and Jameson et al. [
24].
The workflow of the numerical investigation commenced with the preprocessing in the Interactive Geometry Generator (IGG) and Autogrid to create block-structured grids for both stationary and rotating components. After obtaining a converged solution from the flow solver, the results were analyzed in CFView. The postprocessing focused on the evaluation of total and static quantities (mass flow weighted) for pressure and temperature to obtain the total-to-static stage efficiency. In addition, contour plots of pressure distribution and Mach number were used for visual evaluation of the results, as will be described in the results section. After evaluating the optimization potential, the turbine geometry was adjusted in CAD, or directly in IGG, and iteratively improved.
The models and boundary conditions, respectively, the main input data for the simulations in Fine
TM/Turbo are listed in
Table 2. The goal was to reach reliable numerical results within reasonable computing time. This could be achieved by solving the Reynolds-averaged Navier–Stokes equations in conjunction with the Spalart–Allmaras turbulence model. The Spalart-Allmaras turbulence model was used in combination with an extended wall function, to further reduce the computational effort, especially for the unsteady simulations.
Figure 5 shows the resulting simulation model of the Elektra turbine. Due to the rotational symmetry, it was possible to reduce the simulation model to a 120°-section of the turbine to limit the computing time. Compared to the manufactured turbine that is described in the later course of this work, some assumptions and simplifications were applied to the simulation model. The radial gaps between the rotor and stator were modelled. However, to simplify the 3D CFD simulation, the gaps were closed off at hub and shroud. Accordingly, losses due to fluid circulation and flows on the outer side of the wheel’s hub and shroud were not considered. In addition, discontinuities in channel height between the rotor and stator, to compensate for manufacturing tolerances, were neglected. It was assumed that these height differences have no significant influence on the efficiency.
The mesh finally consisted of approximately 16 million cells, which led to a computation time of less than five hours (steady state simulation), with the available hardware (20 cores). To assess the quality of the grid, a mesh-study was conducted. The diagram (
Figure 6) shows the inlet and outlet mass flow rate and the total-to-static isentropic efficiency of the turbine as a function of the number of grid points in millions. As can be seen, the mass flow rate through the turbine was consistently between approximately 61.4 g/s and 62.08 g/s with the coarsest mesh having a lower mass flow rate (approx. 60.3 g/s). The deviations from the inlet to the outlet mass flow rate were small but increased for a finer mesh. The total-to-static isentropic efficiency of the turbine increased from 54.19% to 55.6% for the meshes with 7.3 and 10.2 million grid points, respectively, and decreased again to 54.3%. After this point, it flattened out at 54.9% for the meshes with 20.5 and 23.15 million grid points. For the simulation, the mesh with 16.1 million grid points was used, because it had the smallest difference between the inlet and outlet mass flow rate, was in the efficiency range of the finer grids, and still required an affordable computational effort.
2.3. Test Facility for Compressed Air Drives and Technology (PDLT)
Several promising versions of 5 kW air turbine demonstrators were designed and experimentally investigated by the authors (see, e.g., [
25]), which would not have been possible without the so-called “Test facility for compressed air drives and technology (
PDLT)” in the laboratory for turbomachinery of the Technical University of Applied Sciences Amberg-Weiden (OTH-AW). In the following, the test stand and the measurement setup are briefly introduced.
The
PDLT enables fast and simple preliminary testing and validation of new turbine concepts using compressed air before they are realized for their actual working medium, such as steam, hydrocarbons, or siloxanes. The test rig has been in operation since 2000 and is constantly kept up to date and expanded with the latest technology [
26]. It can be used to determine characteristic curves for various measured variables such as speed, torque, power, and mass flow rate. The structure of the
PDLT is shown in
Figure 7.
The most important information about the various components of the system, containing compressed air supply, measurement equipment, and evaluation units are listed in
Table 3.
Two KAESER SK 25 screw compressors with a power consumption of 15 kW each and nine 1 m
3 air tanks provided the compressed air for the measurements. For the sake of simplicity, the compressors, etc., arranged in parallel, are shown as one unit in
Figure 7. Another important factor, when examining turbines, is the reliable cleaning and, above all, drying of the air by means of various filters and dryers. In particular, the optional drying by the membrane dryer KMM8, which can lower the dew point temperature of the air to as low as 233.15 K, is of great importance, since the turbines under investigation tend to create surfaces of ice on the blades due to the inflow air at ambient temperature [
26].
For the measurement of the Elektra turbine, a pressure of >1.4 MPa in the compressed air tanks was required so that maximum inlet pressures of approx. 1.1 MPa could be applied for a longer period without fluctuations at a given mass flow rate. The exact setting of the inlet pressure (±5 kPa) was carried out by a precision control valve (ER3000), a connected pressure sensor, and the associated control and regulation unit (C&R unit). Two volumetric flow meters (DN20 and DN40), with evaluation unit, one for flows up to 223 Nm
3/h and the other for 904 Nm
3/h, respectively, determined the mass flow rate. A dew point meter (EE 371) and a thermocouple (Thermo Type K) recorded the humidity and temperature of the compressed air at turbine inlet. Seven individual pressure sensors (7x P8AP) enabled the recording of different pressure values within the turbine, e.g., at nozzle inlet or wheel outlet. In addition, speed and the applied counter-torque of the brake were recorded by the built-in eddy current brake from Magtrol (WB/PB 65 and 4503A). This determined the torque and rotational speed of the turbine and converted the turbine power into heat, which must be dumped via a cooling circuit. The rotational speed of the eddy current brake could be adjusted via a controller unit (DSP 7001). All determined data were transmitted to the data acquisition PC via an Analog-Digital converter (A/D). Finally, the data were processed with the aid of LABVIEW software (National Instruments, Austin, TX, USA, version 19.0) [
26].
The program for processing the measured data provides a graphical user interface for displaying the current measured values. It is also possible to set the offset between the values before and after the AD converter for speed, torque, and mass flow rate. For this purpose, the displays in the program and on the various evaluation units can be visually adjusted. The recorded data are continuously written to a text file.
2.4. Initial Turbine Design Data
The turbines investigated in this work and a recent publication of the authors [
8] were designed to be tested on the available compressed air test rig (
Section 2.3). Therefore, their power rating and size was chosen to fit to the capacities and dimensions of the rig. Furthermore, the experimental results should be directly comparable to those of formerly tested impulse and cantilever air turbines [
25]. Thus, the design pressure ratio of all air turbines was 10:1 and their wheel diameter was 80 mm. As a result, the design rotational speed was 49,000 rpm for the impulse stage [
25]. A velocity compounded re-entry turbine, equipped with four wheel passes would reduce the necessary rotational speed theoretically to 12,250 rpm. Obviously, this is still too high for a standard generator (1500–6000 rpm). However, the investigated air turbine serves as a technology demonstrator on which the development process and tools are tested and validated so that they can then be used to safely design larger Elektra turbines. As [
8] was the authors’ first design of an Elektra turbine, they decided, for the sake of simplicity and to minimize risk, to investigate an Elektra with only two wheel passes, whose theoretical design speed was 24,500 rpm. The design optimization led finally to 29,000 rpm. The most important data, resulting from the 1DTDT, are shown in
Table 4. The geometry data for nozzle, channel, and blades, specified by the design tool, were transferred into a 3D CAD model and elaborated into a complete 3D model of the test turbine.
3. Results
In the following section, the resulting turbine geometries of the optimization process and of various modifications of the turbine are briefly explained. Furthermore, the results of the 3D CFD simulations and the experimental investigations are summarized. Four different geometry modifications have been investigated:
Version 1: Basic design according to 1D-Turbine-Design-Tool
Version 2a: Basic design with applied cover on deflection channels
Version 2b: Version 2a with 3D-printed wheel
Version 3: Optimized stator geometry
3.1. Investigated Turbine Modifications
The given boundary conditions and the geometry data calculated by the 1DTDT led to the flow geometries of the first Elektra design (
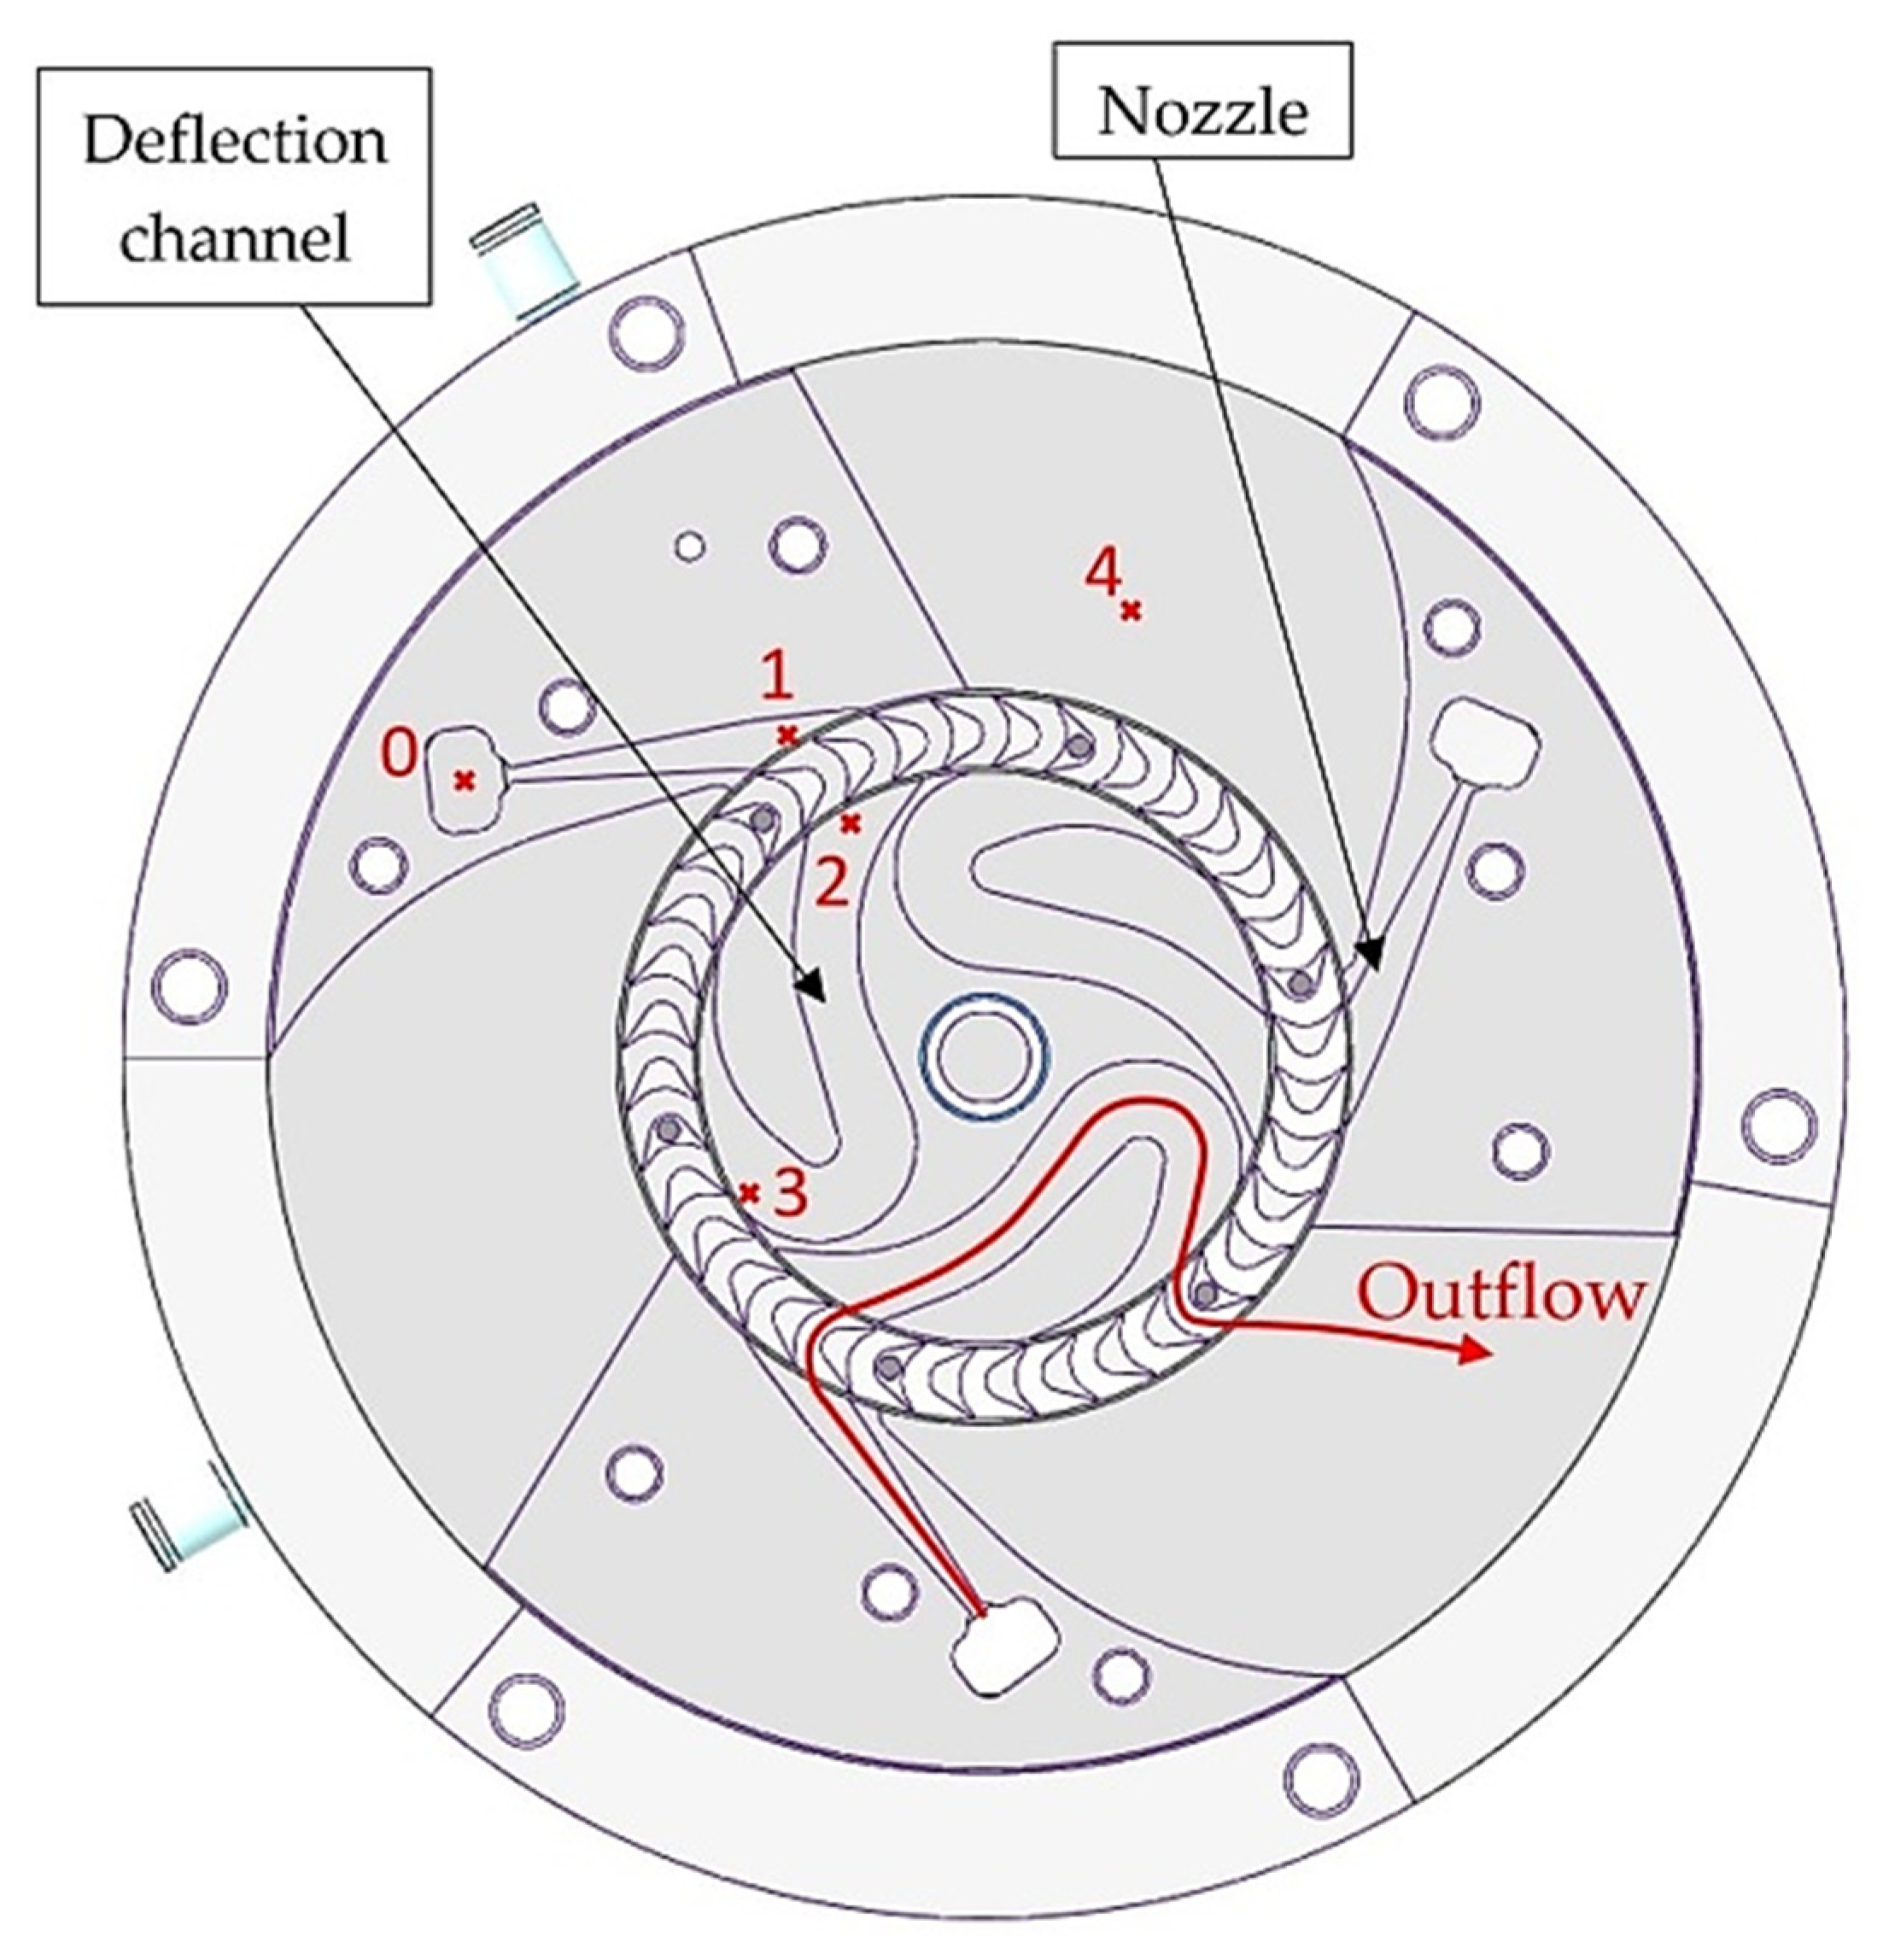
Version 1), shown in a sectional view of the constructive realization in
Figure 8. Using this figure, the basic design features of the manufactured Elektra are explained. Three nozzles, each with an offset by 120°, are directed towards the wheel. The flow is then diverted through three channels, passes the wheel again, and finally flows into the environment via three separate outlet areas.
Figure 8 also shows the locations of various pressure sensors in the turbine (red crosses). Pressure values are recorded at:
Nozzle inlet (p0);
Nozzle outlet (p1);
Deflection channel inlet (p2);
Deflection channel outlet (p3);
Turbine outlet area (p4); and
Environment (p5).
Based on
Version 1, different modifications were made to improve the performance of the turbine. As a first step, the originally open deflection channel was provided with a fixed cover to avoid flow losses through the open gap between the rotor and deflection channel (
Version 2a). This gap was considered as a major reason for the low efficiency of the turbine compared to the CFD simulations in which the channel is perfectly closed with a fourth fixed wall. Hence, the air exiting the wheel can escape at various locations both before entering the deflection channel and while passing through it. Thus, it is lost for the energy conversion in the second wheel pass. The misdirected stream might even have an influence on the flow through the first wheel pass.
Figure 9 shows
Version 1 on the left (a) where the wheel disc forms the fourth wall of the channel and on the right (b) the modified channel with the cover applied (
Version 2a).
For
Version 2b no direct changes of the geometry were applied. Instead, the turned and milled aluminum wheel was replaced by a completely 3D printed wheel (
Version 2b) fabricated from EOS Maraging Steel (MS1). Three-dimensional printed parts are already being used in turbomachines in some cases, e.g., for parts of aircraft turbines. Moreover, 3D printed rotor blades with complex cooling systems to improve performance are already being investigated, cf. [
27]. This version was, therefore, intended to evaluate the potentials of 3D printed rotors for use in turbomachinery, especially for cost-effective and easy prototyping.
Figure 10 shows both the printed (a) and the milled aluminum wheel (b) of the present Elektra turbine.
The 3D printed wheel was sandblasted and turned off after the printing process. In the flow channel, however, where this was not possible, it had a rather rough surface, especially at the shroud side (cf.
Figure 11a,b). The milled aluminum wheel, which was additionally glass bead blasted, (cf.
Figure 11c,d)) showed a much more even surface. The measured values for the surface roughness for both wheels, at different positions in the flow channel, are displayed in
Table 5.
The higher roughness increased the frictional losses in the 3D printed wheel and, thus, a decrease in turbine efficiency was expected with Version 2b compared to Version 2a. The material MS1 had a density of 8.0–8.1 g/cm3 compared to aluminum with approx. 2.7 g/cm3, which is why a more sluggish behavior of the turbine was observed.
It was also the aim of the authors to further improve the efficiency of the turbine. For this purpose, starting from the previous design (Version 2a) investigations were carried out with the aid of 3D CFD simulations to improve the flow geometry of the turbine. The approach was to reverse the course of the deflection channel compared to Version 1, 2a, and 2b to obtain an early deflection of the flow at the beginning of the channel. Thus, the air has a longer distance to regain uniformity before entering the second wheel pass. To achieve a sensible channel shape, it was also necessary to redirect the flow in the direction of rotation of the turbine. In the previous versions, the deflection was realized against the rotation direction. However, the limited diameter, the available space along the circumference for a channel, and the specified inlet and outlet angles of the wheel led to a required deflection of nearly 180°. In addition, the reuse of essential parts of the previous turbine, such as wheel, shaft, and housing, should be enabled, which further limited the possibility of variations.
Figure 12b shows the optimized geometry (
Version 3) as a result of various investigated samples. This turbine geometry achieved the highest total-to-static isentropic efficiency in the CFD simulations and was, therefore, constructed and manufactured. The design was characterized by a 20% reduction in the nozzle outlet width and a widening of the deflection channel, deviating from the original specifications of the 1DTDT. In combination with this, the deflection channel was also equipped with guide vanes to reduce the separation of the flow through the high deflection. A first simple design of guide vanes can be seen in
Figure 12b. The new stator design was modularly implemented. The deflection channel geometry was attached to the nozzle stator with screws and could easily be exchanged without having to manufacture the complete stator twice. This also facilitated the investigation of further deflection channel geometries. As a comparison,
Figure 12a shows the flow geometry of
Version 1,
2a, and
2b.
3.2. CFD Simulation Results
The following comparison (
Figure 13) of the steady-state computation results for the original Elektra turbine (
Version 2a; left side) and the new turbine geometry (
Version 3; right side) show the improvements by the applied geometry modifications. Both simulations were carried out under design conditions of a total-to-static pressure ratio of
PR = 10 and a rotational speed of
n = 29,000 rpm. At a constant span position of 50% of the nozzle/blade height the blade-to-blade cut was carried out. Steady simulations were not quite suitable for reproducing the real behavior of the turbine as accurately as possible. Nevertheless, they give a first impression of the flow conditions and were, therefore, used in this work to enable an assessment of the effects of the various modification steps within a reasonable computing and turnaround time, respectively. The results were verified with several unsteady computations during the design process [
8]. The aim of the investigations was in particular the reduction in the high leakage mass flow from the nozzle directly into the outlet that was detected for
Version 2a [
8]. To achieve this, the overpressure in the deflection channel should be reduced as it was identified as the main reason for the leakage mass flow and also contradicts the ”constant pressure design approach” for the deflection channel, cf. [
8]. Furthermore, all these adjustments should lead to an improved efficiency of the overall turbine. Therefore, various variants of the overall turbine were simulated from the beginning.
As can be seen in
Figure 13b the reduced nozzle outlet width in the new design led to a reduction in the maximum Mach number after the expansion in the nozzle to approximately 2.5, compared to 2.7 in
Figure 13a. Therefore, the strength of the shock wave that can be seen in both pictures was mitigated. This was confirmed by the higher nozzle exit pressure at the end of the expansion visible in
Figure 13d (approx. 70 kPa for
Version 3 compared to approx. 40 kPa for
Version 2a). Further shockwaves occurred in both the left and right picture, while the air was divided by the leading edges of the blades and passed through the blade channels.
Furthermore, the comparison of
Figure 13c,d shows, that the pressure distribution in the channel of
Version 3 was much more homogeneous than that of
Version 2a. The pressure value lay close to ambient pressure in most parts of the channel, especially at the channel outlet. This satisfied the approach of keeping the pressure in the deflection channel constant. In both cases, there was an increase in pressure around the high deflection, but the early deflection and the guide vane in the new design compensated for this in the further course of the channel. The guide vane caused additional friction losses, but these were outweighed by the better flow guidance. The advantage of early deflection was that the flow was deflected in a state in which, by leaving the wheel with high velocity gradients, large flow irregularities occurred anyway. It then had enough time without further disturbances to homogenize again. The late redirection (
Version 2a) caused new turbulence and pressure differences that led to increased misdirected flow phenomena just upstream of the second wheel pass. This was confirmed by the results in
Figure 13c,d. In the original design (
Figure 13c), the pressure dropped significantly near the inner curve, caused by the strong curvature, whereby the flow reached transonic conditions and was separated again directly upstream of the second wheel pass. This was not observed for the new channel design (
Figure 13d).
The modifications led to an improvement of the total-to-static isentropic efficiency from 47.1% to 54.3%, for the steady simulation. The unsteady result for the total-to-static isentropic efficiency was increased from 39.8% to 49.4%. These results also considered the leakage mass flow rate that was reduced from 9 to 15% to almost zero. This allowed the conclusion that the reduction in the nozzle outlet width improved the behavior of the nozzle in this case. In addition, the extension of the deflection channel width led to a reduction in the leakage mass flow by reaching an overall lower pressure in the channel and a reduced backpressure at the nozzle outlet. Combined with a guide vane in the area of deflection, this improved the homogeneity of the flow and, therefore, the overall efficiency of the turbine. To confirm the results of the CFD simulations, the new turbine geometry (Version 3) was experimentally investigated on the PDLT.
3.3. Experimental Investigation of the Different Turbine Modifications
To compare the performance of the different versions, conclusions about the total-to-static isentropic expansion efficiency
were drawn from the measured values for the mechanical power
, the pressures at the inlet (
p0) and outlet (
p5) of the turbine, temperature
, and mass flow rate
through the turbine. The measured efficiency curves in dependency on the rotational speed for the final Elektra geometry (
Version 3) are shown in
Figure 14. This illustration is intended to clarify the form in which the turbine maps were determined and to show the basic characteristics of the turbine behavior. To determine the deviation of the measured values, the standard deviation was calculated for all measuring points. The Gaussian uncertainty was also determined for the efficiency as a value influenced by several measured variables. The maximum measurement deviation of the total-to-static isentropic efficiency, thus, determined for each measurement point approached is graphically displayed as an error indicator in the presentation of the experimental results.
As can be seen in
Figure 14,
Version 3 achieved a maximum efficiency of approximately 45.0% at 35,000 rpm and a pressure ratio of
PR = 10.4. The optimal operating point was only slightly shifted compared to the design point (29,000 rpm;
PR = 10). Close to the design point at approximately
PR = 10.4 and 29,000 rpm, an efficiency of approximately 44.0% was realized. At high pressure ratios, a relatively low dependence of the efficiency on the pressure ratio was noted. Only below
PR = 8.3 did the curves begin to significantly diverge at higher speeds. In the lower speed range at 10,000 rpm, efficiencies between 22.1% and 24.3% were still achieved. For lower
PRs, the optimal operating point shifted to lower rotational speeds. Overall, the turbine showed a typical and stable behavior, even at low pressure ratios, and the measured values were plausible. The error indicators tended to become wider towards lower pressure ratios, i.e., turbine inlet pressures, as all sensors worked toward the lower end of their measuring range.
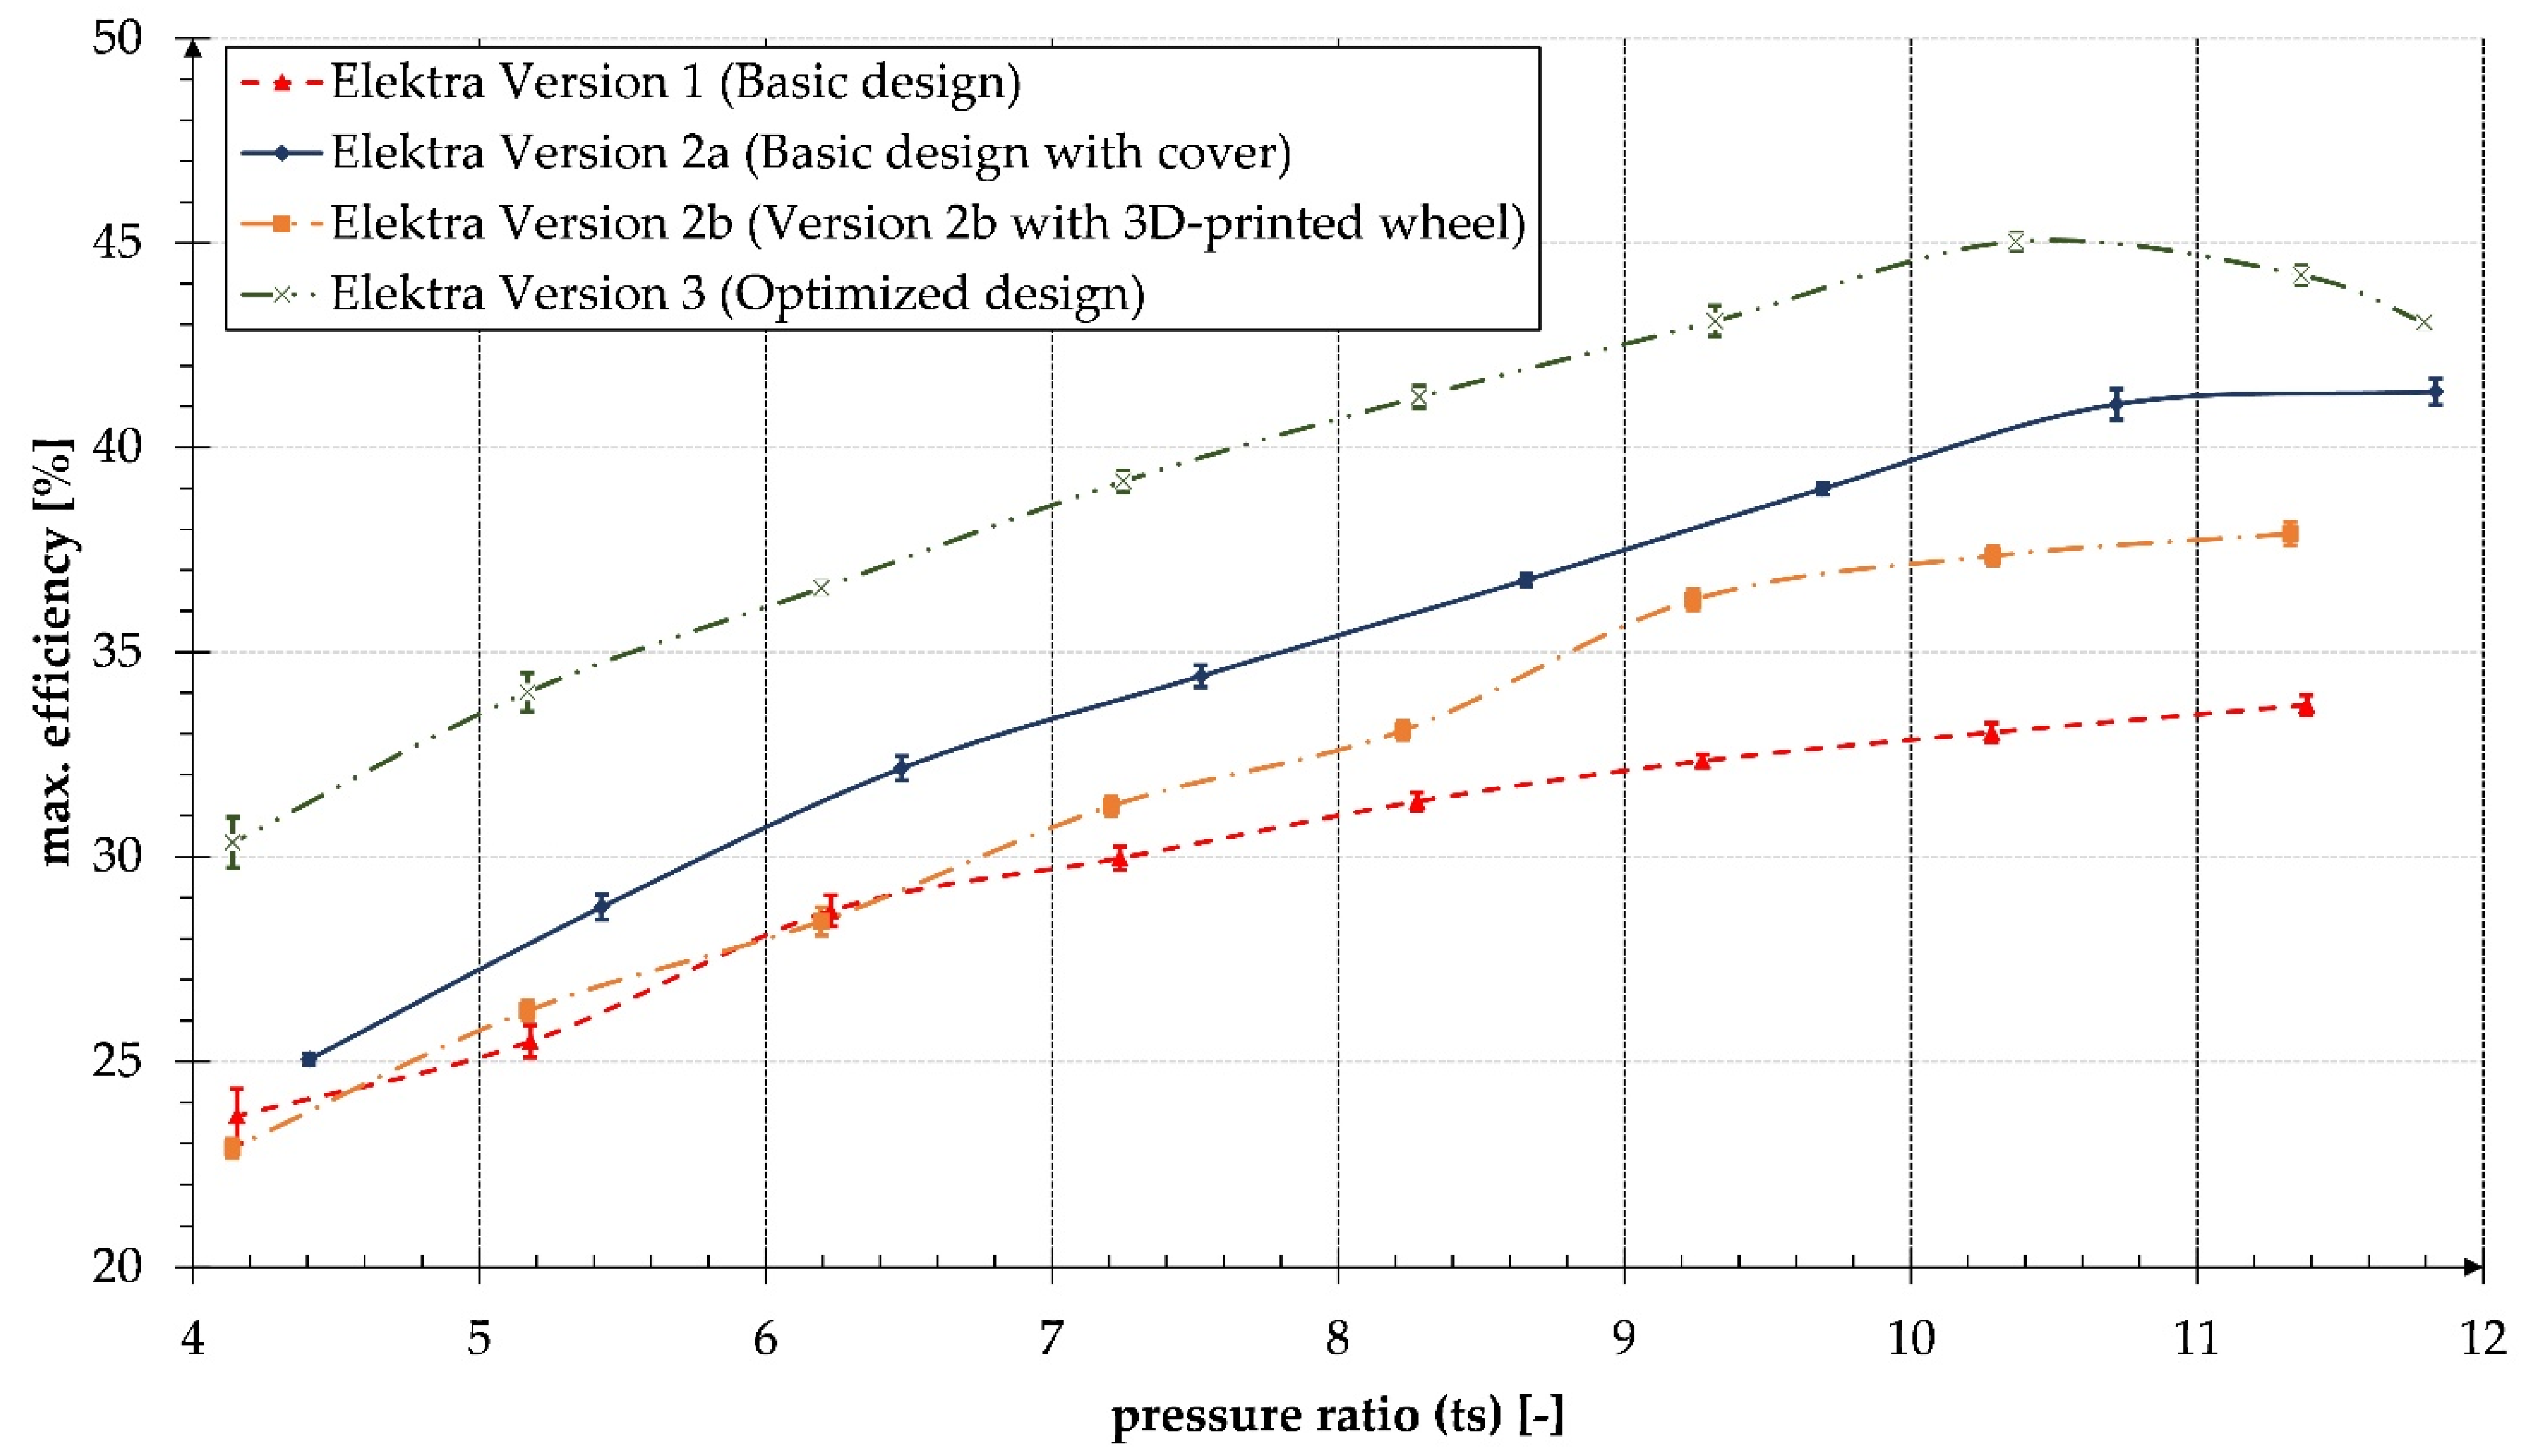
The different turbine versions are compared in
Figure 15. The maximum achieved efficiencies are plotted as a function of the total-inlet-to-static-outlet (ts) pressure ratio (
PR). For each
PR = const. curve (e.g., in
Figure 14), just the maximum total-to-static isentropic efficiency was taken into account for
Figure 15. Thus, the rotational speed is not a constant in
Figure 15. Furthermore, the measurement deviation of the total-to-static isentropic efficiency is displayed by an error indicator.
It is obvious in
Figure 15 that the various Elektra modifications led to a significant improvement in efficiency compared to the basic design
Version 1. Even the first step, the simple application of the cover on the deflection channel (
Version 2a), resulted in a significant increase in efficiency, from approximately 33% to more than 39% at design
PR. The 3D printed wheel (
Version 2b) reduced the efficiency of
Version 2a in a range from approximately 1.5 to 4%p depending on the
PR. Below
PR = 6.2, this partly led to efficiencies below that of
Version 1. This can be explained by the fact that, at this low
PR, the measurement deviation was close to the maximum error of the test stand. At the design point (
PR = 10), the efficiency was reduced by approximately 2.9%p. Except for
Version 3, all curves also showed the highest efficiency at the highest
PR. The optimum operating point of these versions was shifted to significantly higher inlet pressures.
Version 3 showed a clear peak at measured
PR = 10.4 and delivered the best results. The measured efficiencies of this version were below the maximum value at
PR = 10.4 almost constantly approximately 4–5%p above those of
Version 2a. The maximum efficiency of 45% was reached here close to the design point. Even at the design pressure ratio of
PR = 10,
Version 3 still showed approx. 44.5% efficiency.
4. Discussion
The experimental results confirmed the authors’ theory that the 1DTDT, which predicted 64% efficiency and to some extent inappropriate geometry specifications, only provided very rough indications for the design of the Elektra geometry. This is because the obviously inappropriate loss assumptions in the 1DTDT were amplified by the triple application of the loss model (in the first wheel pass, in the channel, and in the second wheel pass). An investigation combined with continuous design improvements by means of 3D CFD simulations was therefore indispensable. In this context, steady state simulations provided good reference points and delivered qualitatively meaningful results with a justifiable expenditure of time. However, unsteady computations were necessary for a quantitative assessment, specially in the case of the Elektra, which was characterized by highly unsteady and supersonic flow conditions.
Starting from
Version 1,
Figure 15 clearly shows that the sealing of the deflection channel by means of the cover led to a significant increase in efficiency, as the flow could no longer escape towards the hub and was better guided in the channel. The use of the 3D printed wheel (
Version 2b) led, as expected, to a reduction in efficiency compared to
Version 2a. In view of the highly irregular surface of the wheel, the losses of approximately 1.5–4%p, depending on the pressure ratio are, however, well within a range that makes further investigations appear reasonable, especially since the surface irregularities mentioned before might decrease in the future by improvements of the manufacturing and reworking process.
The results of the 3D CFD simulation of the optimized design (Version 3) could not be fully confirmed by the experimental investigation (49.4% efficiency in the simulation compared to approximately 44.5% in the experimental investigations at design conditions). Moreover, the primary goal of 50% expansion efficiency has not been achieved yet, despite the application of CFD. The reasons for this, might be at least twofold.
The proper design of the deflection channel has been identified as decisive. A transonic flow must be deflected by about 180° in the investigated air turbines. The former industrial Elektra turbines [
11,
14] showed only 110°–140° deflection. Due to a quite small degree of admission at nozzle outlet (≈5%), i.e., a large wheel diameter with respect to the processed mass flow rate, these designs provided more space for the deflection channels. Because of the restrictions by the available test rig (
Section 2.4), the wheel diameter was quite limited, and a degree of admission of about 13% must be chosen for the air turbines. Thus, there was only little space around the wheel’s circumference. The unfavorable high deflection was unavoidable. Therefore, future Elektra versions will not be designed for the air test rig.
The originally designed wheel (Version 1) was not changed in the described investigations. The first, rather simple blading, was used for all versions for the sake of time and costs. Surely, there is a certain potential of improvement. For the first wheel pass, inlet and outlet relative Mach numbers were supersonic. The CFD optimization of the blading will be the subject of a following project.
In summary, the latest design (Version 3) showed a significant improvement in the efficiency over the entire range of pressure ratios investigated compared to Version 1, 2a, and 2b. So far, the achieved result with 44.5% expansion efficiency is encouraging but still not satisfactory. Compared to conventional turbine designs that can achieve higher efficiencies, the Elektra still does not appear to be a competitor. In view of the significantly lower purchase and maintenance costs of a low-speed turbo generator (1500–6000 pm), it can nevertheless be concluded that the Elektra might provide advantages in the field of small scale WHR. In this field, not high efficiency but competitive specific costs are the most important criteria.
5. Conclusions
The main goal of realizing a velocity compounded re-entry turbine with 50% efficiency was not quite achieved with almost 45%. The proper design of the deflection channel turned out to be very important and has not been fully accomplished yet, partly due to the constraints of the test rig and partly due to a lack of understanding of the flow. The design process based on a 1D turbine design tool, 3D CFD optimization, and experimental verification with a compressed air turbine has overall proven itself. The simple loss model in the 1DTDT was unsatisfactory. It led to inappropriate turbine geometries. Since the optimizations of the flow geometry using 3D CFD have been successful, it is questionable whether it still makes sense to try to further develop the 1DTDT for the prediction of the highly unsteady supersonic flow in an Elektra turbine. Rather, it seems to make more sense to increasingly carry out the future design process with the help of unsteady 3D CFD simulations.
For the authors, the results obtained justify continuing research on the Elektra turbine concept working at low speed and enabling the use of a cost-effective standard generator for small scale WHR. There is a growing demand for small-scale WHR units below 100 kWel. The high-speed turbo generator is responsible for about one third of the total cost of those systems. Substituting it with a low speed Elektra turbo generator, would help to significantly reduce specific costs.
Because it has become obvious that the constraints of the compressed air test rig limit the design space for the Elektra technology demonstrator, the next test turbine will be designed for the application in the organic Rankine cycle (ORC) research plant at the University of Bayreuth. This research plant has already been used for testing the authors´ axial impulse and radial cantilever turbines [
4]. The recently investigated two 12 kW
el ORC turbines [
4] are running at about 24,000 rpm. They are equipped with ∅ 120 mm turbine wheels. If the simple impulse turbines are substituted by a velocity compounded radial re-entry turbine with four velocity stages (compare [
8,
12]), the rotational speed can be reduced to about 6000 rpm (25%). If the wheel diameter is doubled to 240 mm, even 3000 rpm are feasible. The integration of the necessary three deflection channels will surely require an enlarged diameter. Thus, a 12 kW Elektra turbine for the ORC research plant seems to be practicable.


