Article

PEFC System Reactant Gas Supply Management and Anode Purging Strategy: An Experimental Approach

by
Naseruddin Khan
*,
Yousif Al-Sagheer
* and
Robert Steinberger-Wilckens
Centre for Fuel Cell and Hydrogen Research, School of Chemical Engineering, University of Birmingham, Birmingham B15 2TT, UK
*
Authors to whom correspondence should be addressed.
Energies 2022, 15(1), 288; https://doi.org/10.3390/en15010288
Submission received: 1 December 2021 / Revised: 27 December 2021 / Accepted: 28 December 2021 / Published: 1 January 2022
(This article belongs to the Special Issue Design, Modeling, and Optimization of Novel Fuel Cell Systems)

Abstract

:
In this report, a 5 kW PEFC system running on dry hydrogen with an appropriately sized Balance of Plant (BoP) was used to conduct experimental studies and analyses of gas supply subsystems. The improper rating and use of BoP components has been found to increase parasitic loads, which consequently has a direct effect on the polymer electrolyte fuel cell (PEFC) system efficiency. Therefore, the minimisation of parasitic loads while maintaining desired performance is crucial. Nevertheless, little has been found in the literature regarding experimental work on large stacks and BoP, with the majority of papers concentrating on modelling. A particular interest of our study was the anode side of the fuel cell. Additionally the rationale behind the use of hydrogen anode recirculation was scrutinised, and a novel anode purging strategy was developed and implemented. Through experimental modelling, the use of cathode air blower was minimised since it was found to be the biggest contributor to the parasitic loads.

1. Introduction

Currently, there is a strong global push towards decarbonisation and carbon footprint reduction. Hydrogen fuel cells will potentially play a vital role in contributing to these goals in numerous areas of the economy, including the energy and transport sectors. Hydrogen-fuel-cell-powered passenger electric vehicles, trains, and heavy duty trucks are leading examples in the transport sector. Stationary power units, electrolysers, and decentralised microgrids are good examples of hydrogen fuel cell applications in the energy sector. Polymer electrolyte fuel cells (PEFCs) electrochemically convert the chemical energy present in the fuel directly into electrical energy. Specifically, hydrogen fuel is supplied into the fuel cells from the anode side and oxygen is supplied from the cathode side. Hydrogen is then oxidised into protons and electrons at the anode catalyst region. The Nafion membrane is proton-conducting and electron-insulating. As a result, the electrons are compelled to leave the anode side and pass through an external circuit in order to reach the cathode side, where the oxygen reduction reaction takes place [1,2]. The by-products of this reaction are heat and water, with no local carbon emissions, thus making PEFCs zero-emission power sources. In addition, hydrogen fuel cell systems offer several superior features over conventional power systems such as high efficiency and power density, as well as low maintenance requirements and noise levels. Fuel cell systems appear to be a viable alternative to traditional internal combustion engine or turbine power generators, and they can be linked with renewable energy sources to provide sustainable energy systems. However, in addition to their clear environmental benefits, fuel cells must also prove that they are a reliable and cost competitive alternative to incumbent technologies. This will require fuel cell systems to have compact designs that fit a variety of applications. All commercially available hydrogen fuel cell systems include the Balance of Plant (BoP), which requires a control system that manages the performance of the system. A crucial role of the BoP is to implement an appropriate reactant gas-management strategy in both the anode and cathode sides of the stack.
Reactant gas flow and water management are important aspects of PEFC systems and the key to achieving optimum performance. Generally, the issues of reactant gas flow and water management are interlinked. An uneven distribution of gases within the stack results in current density, humidity, and temperature gradients that will eventually lead to performance degradation [3]. Specifically, this occurs due to limitations in mass transportation and thus the undersupply of the catalytic sites with reactants [4]. The excess or lack of humidification in the membrane can have a similar result [4,5,6,7]. Therefore, a balanced approach between membrane drying and flooding must be implemented to prevent fuel cell degradation and guarantee a high and homogenous performance level. When calibrated well, crucial parameters such as gas flow rates, operating temperature, and inlet pressure can assist in mitigating the effects of flooding or fuel starvation.
Providing a homogeneous supply of fuel into a fuel cell stack is one of the core processes generally dealt with during the system design phase [2]. The choice of a fuel supply design depends mainly on the application, availability, and storage subsystems. There are three main types of anode fuel feed designs: dead-end, open-ended, and semi-dead-ended or ‘flow through’. In a dead-ended design, there is no outlet present from the stack anode. As a result, the entirety of the fuel gas flow into the stack has to be reacted and passed through the membrane. The purity of the fuel therefore has to be extremely high to avoid any negative effect of the impurities concentrating in the anode compartment over time [8]. This design is usually preferred for small-scale systems where compactness and high fuel utilisation are most desired. In contrast, both semi-dead-ended and open-ended designs have an exhaust outlet. However, in the former design, there is a valve present in the exhaust line on the stack outlet that is periodically opened in order to release any unreacted gas, including impurities. In the case of an open-ended or flow through design, the exhaust from the anode is always open in order to enable the bleeding of hydrogen, although a restrictive orifice may be employed to increase the back pressure within the anode stream [9]. Since the semi-dead-ended design is the most common one found in literature and is usually discussed synonymously with the dead-end design, we hereafter refer to it using the dead-end terminology in this paper. To reiterate, the main purpose of the anode fuel supply system is to uniformly distribute a sufficient amount of hydrogen gas throughout the active stack area. For this purpose, a hydrogen recirculation pump can be employed within the anode loop. The type of pump depends on the scale of the system. Most commonly in medium-sized systems, a low power brushless direct current (BLDC) pump is used, whereas in large-scale systems, a high power centrifugal pump can satisfy the high flow rate requirements.
There has been an extensive amount of research concerning PEFC systems using a dead-end anode design with periodic purges [10,11,12], including experimental work to study the effects of operational parameters at the cell level [13]. The authors concluded that the average time between a given purge cycle decreased with the decay of current density and relative humidity on the cathode side. Furthermore, the visual analysis of the effect of water transport at the cell level has been reported [14]; the authors visualised the effect of liquid water accumulation that was back-diffused from the cathode side into the anode stream, and they reported that a high air stoichiometric ratio prolonged the cell voltage decay. Similar work on the stack level, employing a dead-end anode design with periodic purges, was reported in [7,15]. Additionally, crucial findings on nitrogen crossover in the membrane into the anode from the cathode side have been published [16,17].
Most commercially available PEFC systems have an anode recirculation loop to evenly distribute gas and improve fuel utilisation. Most previous work in the literature on systems employing anode recirculation has been reported at the stack level. Some researchers have aimed to find the appropriate trade-off between impurity accumulation and fuel utilisation, while others have derived mathematical models to describe the performance of different anode gas supply strategies [10,18]. Studies involving gas composition within the fuel supply system have also been extensively performed [19,20,21]. The comparative analysis of anode recirculation incorporating periodic purges and bleeding was reported and experimentally validated on a laboratory-scale system [9]. Furthermore, He et al. [22] scrutinised the control aspect of a purging cycle while suggesting a model predictive control (MPC) approach instead of the conventional PID approach to regulate hydrogen recirculation based on a linearised model simulation.
Another key aspect studies have paid attention to in the context of gas and water management is the purging criterion. The rules adopted in deciding when and for how long to purge play an important role in terms of the subsystem’s complexity and cost, and the loss of unused hydrogen [23]. According to available literature, a common way of triggering a purge event in an anode stream is based on voltage drop [10,11,24,25]. Some researchers have used the nitrogen composition level in the anode stream to generate a trigger of when to purge [16,26]. For example, Hu et al. used various tools such as an advanced cell voltage monitoring (CVM) unit and mass spectroscopy to monitor the nitrogen level, which allowed them to analyse the cell voltage drop due to impurity concentration and to devise a purging strategy [21]. The least complex anode purging strategy reported in the literature was one involving current integration [12,27]. However, there have been no experiments on a systems level found with such purging strategies. This approach relies on the stack current measurement integrated at the required sampling rate. With such a process parameter, the change is only proportional to the operational degree and not effected during idle periods. Other variables such as hydrogen consumption and stack voltage require additional executions in order to stop gas flow into the stack, thus zeroing the stack voltage. In addition, such purging strategies require complex model-based designs and additional instruments for the purpose of gas composition sensing.
On the cathode side, a blower injects oxygen content from the atmospheric air into the channels. Previous work on this aspect of the BoP has mostly comprised numerical analyses. Experimental work related to an accurately sized BoP with detailed rationale and discussion is scarce. Much of the reported work includes modelling and control of the cathode stream for PEFC systems [28]. Theoretical work on cathode humidification was analysed by recirculating the exhaust gas, thereby removing the need to employ external humidifiers [29]. Similarly, work on dynamic modelling for PEFC to investigate the transient response of the fuel cell to load changes has also been reported in the literature [30]. Optimised control strategies for an air supply system based on a fuzzy logic control strategy have been proposed and modelled [31].
For this paper, we used a systems level approach in BoP analysis and gas-management design with a focus on anode purging strategy. We present the results of the experimental simulation of the biggest contributor of parasitic loads. In addition, a novel and effective purging strategy using a single key parameter as input is proposed. Finally, the experimental validation of the control strategy over the entire BoP is demonstrated.

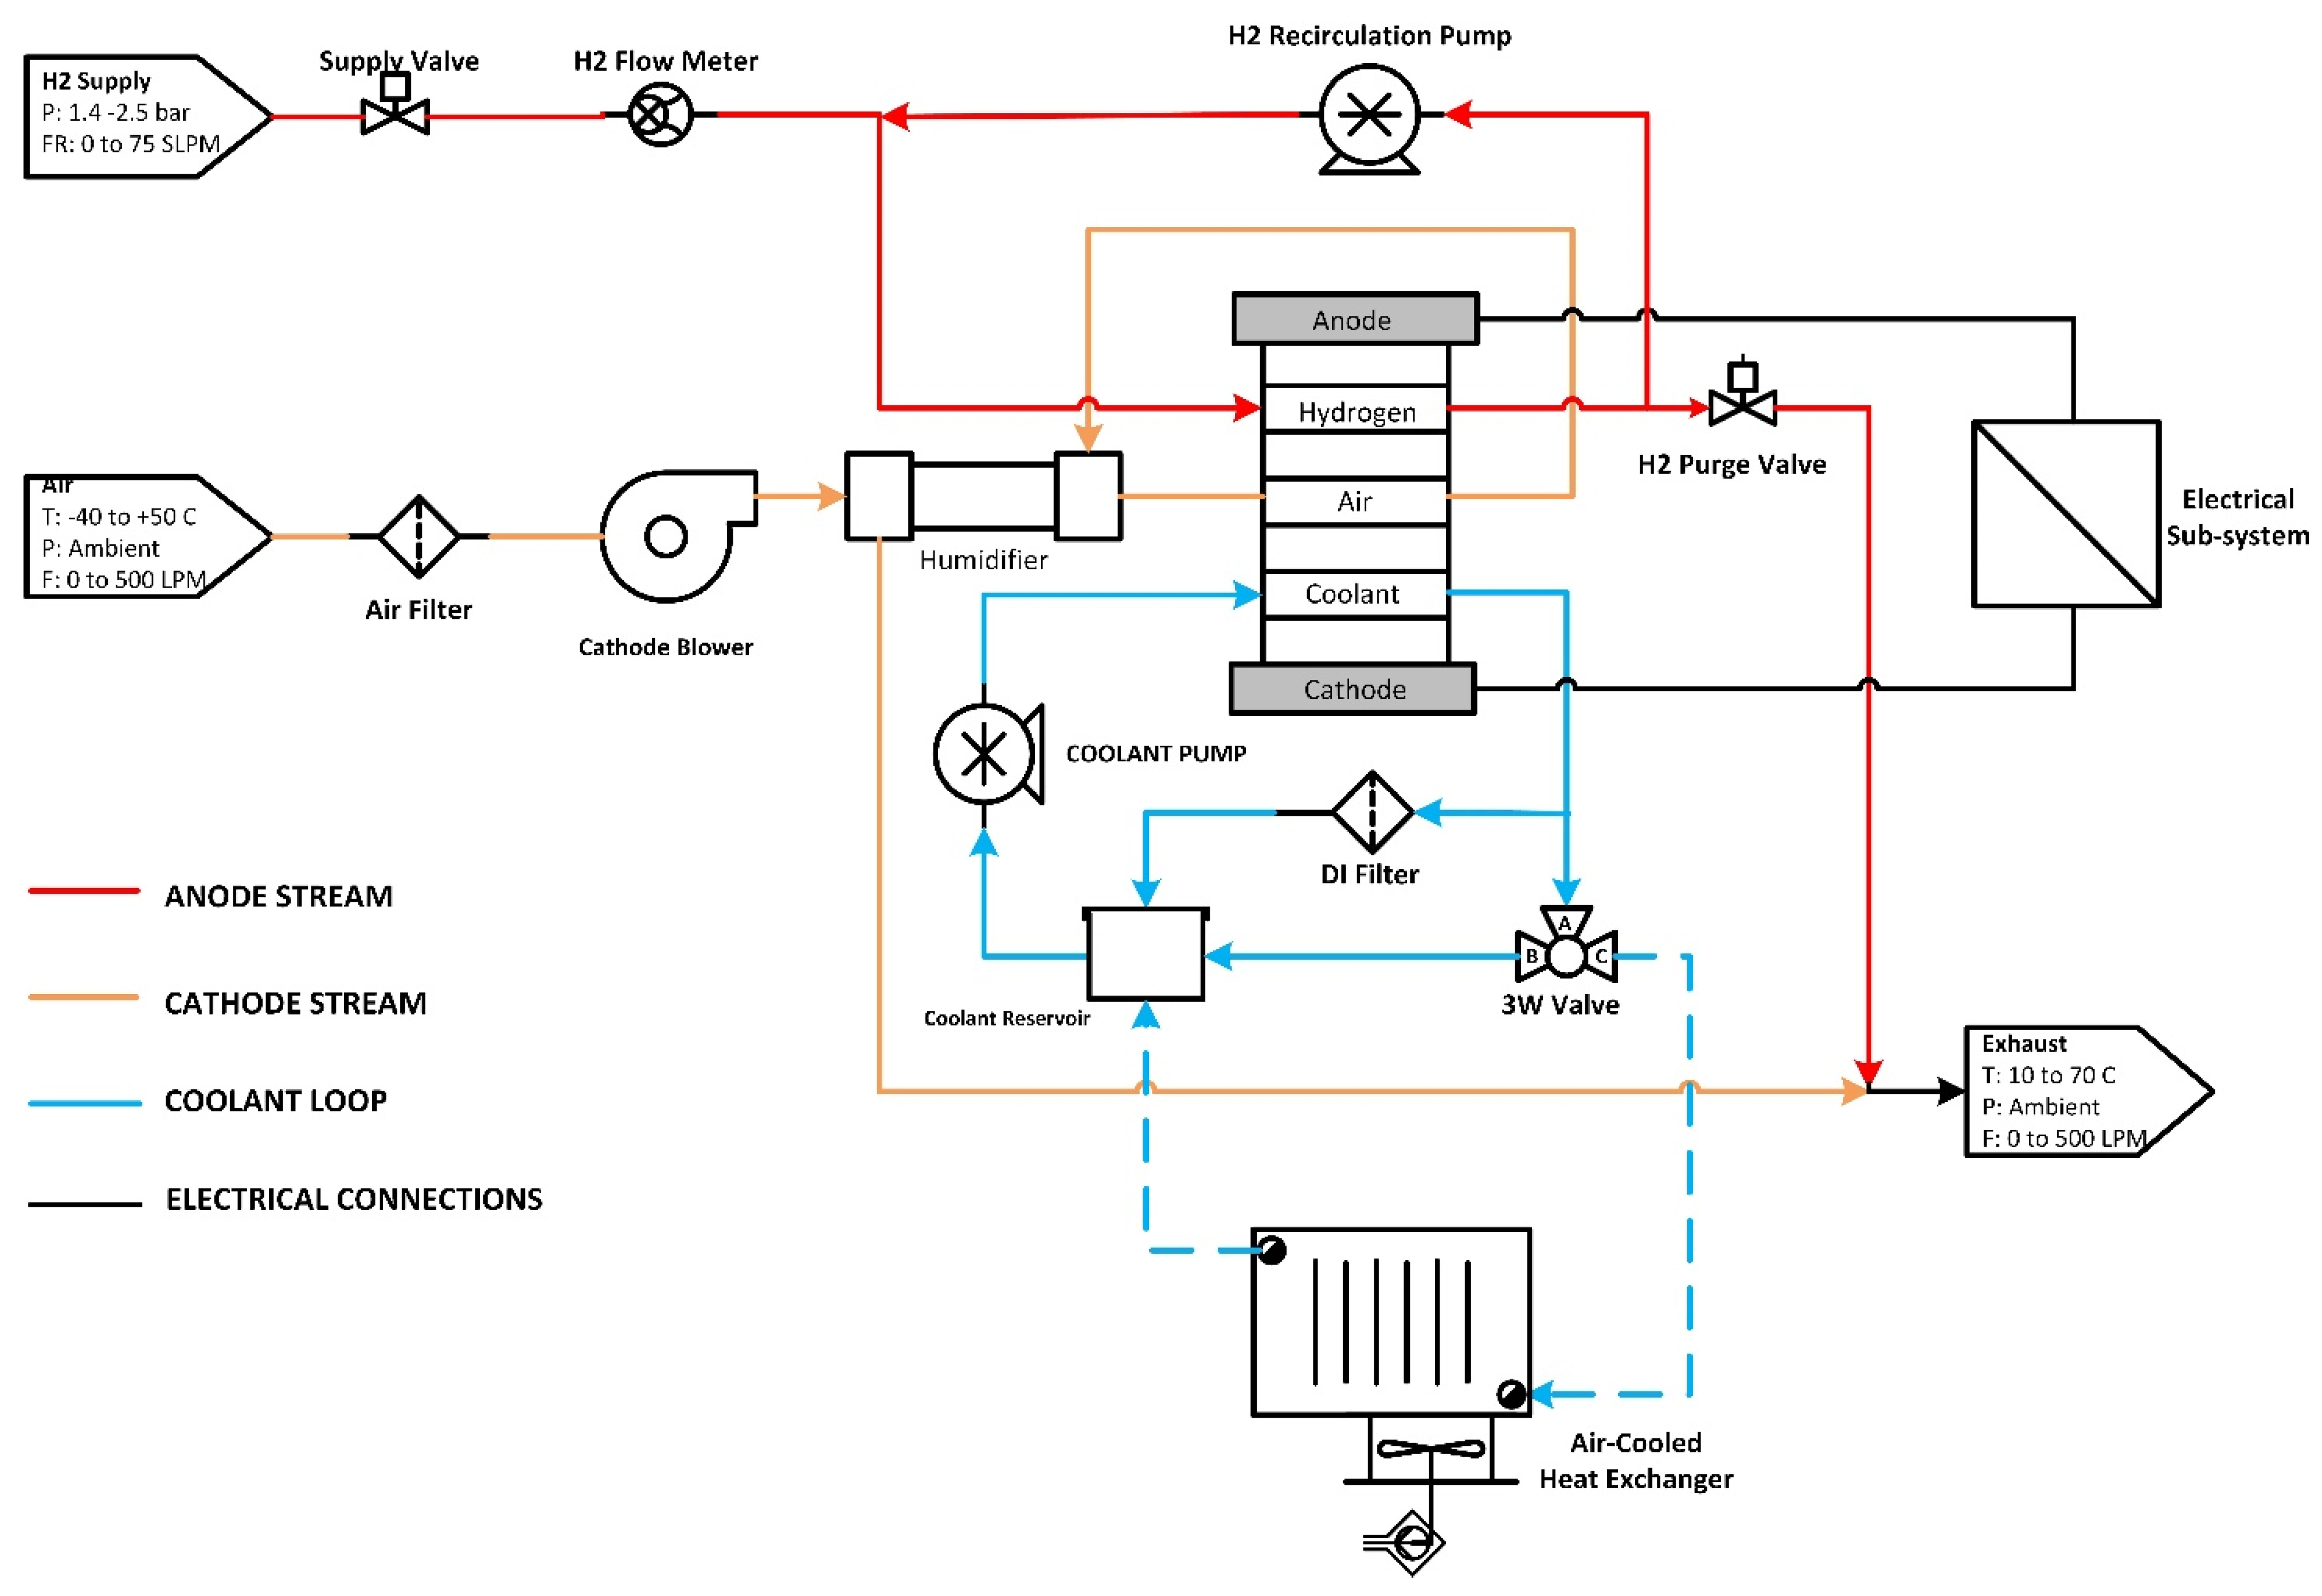
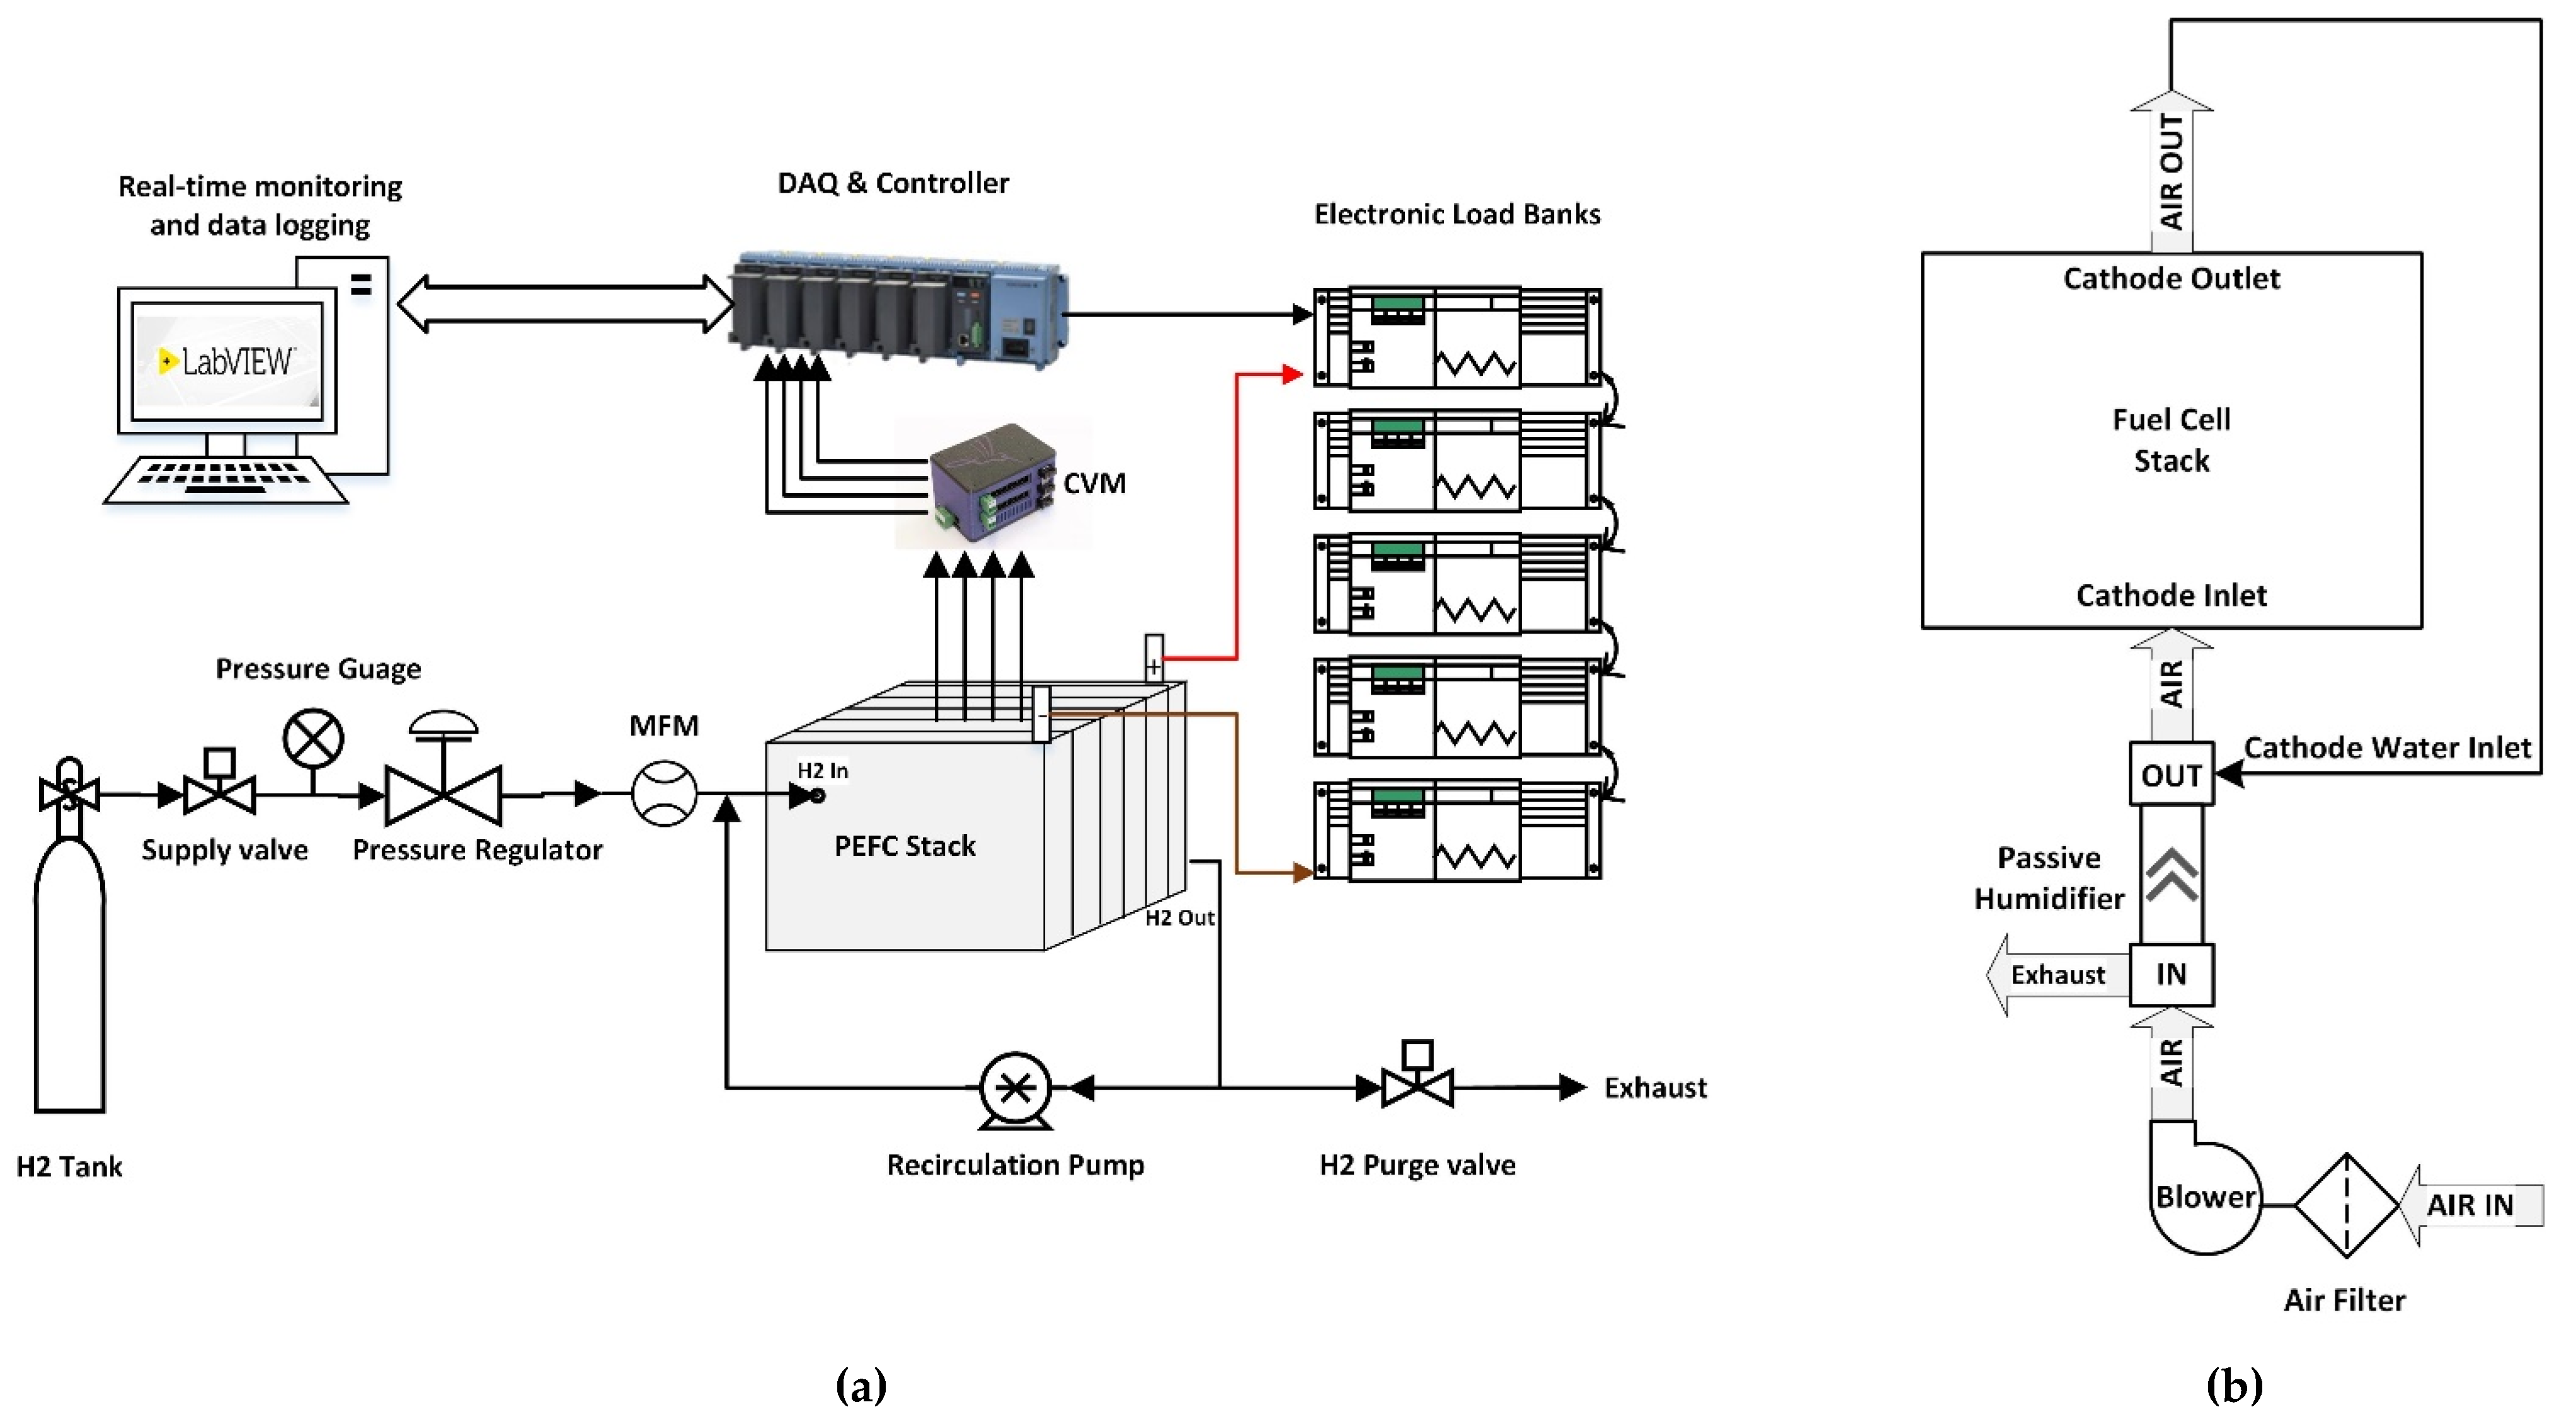
2. Experimental Setup

The experimental setup consisted of a liquid-cooled PEFC stack, manufactured by Ballard Power Systems, utilising dry hydrogen. The specifications of the stack such as open circuit voltage (OCV), nominal and peak power, number of cells, stack design and material, dimensions, weight, coolant type, and pressure and flow are given in Table 1.
The control system for the BoP was conceptualised, developed, and implemented in situ on a test bench. This included the control of reactants flow and hydrogen purging, as well as safety monitoring and thermal management. The BoP in question consisted of both passive and actively-controlled purpose-built units. LabVIEW software was adopted to represent the system control. In addition, data acquisition and software–hardware interfaces were implemented by using the modular, high-performance embedded controller compact RIO (cRIO) by National Instruments (NI). The control system parameters for the cathode air blower and hydrogen recirculation were extracted based on experimental modelling in order to obtain accuracy and reduce parasitic losses.
The main design objective of the BoP is to provide a stable maximum power output of up to 5 kW while catering to variations in external stimulus such as temperature or electrical load. In order for this to effectively take place, the BoP mainly requires four subsystems: hydrogen fuel feed (in anode stream), oxidant feed (in cathode stream), thermal management, and electrical subsystems. These are controlled and monitored using a software-based control system interfaced with application-specific and fit-for-purpose instrumentation. Figure 1 illustrates the complete PEFC system with its BoP design.

2.1. Fuel Feed Subsystem

The hydrogen feed subsystem is an important part of the BoP. The subsystem is responsible for supplying fuel to the anode stream of the stack at a regulated pressure. During operation, the pressure at the stack inlet is maintained at a low and safe pressure of 1.3 bar with the help of a compact, diaphragm-based pressure regulator. In the conducted experiments, the hydrogen flow rate was unregulated and measured using a high capacity mass flow meter (MFM) connected in series with the main supply. For safety purposes and emergency shutdown, solenoid valves and a hydrogen sensor were used. A controllable, low power, and compact diaphragm-based BLDC pump was used for the recirculation of hydrogen gas into the anode stream. Periodic purges from the channel are considered to be essential for avoiding inert gas accumulation and water flooding of the anode [22,32,33]. In addition, the recirculation of hydrogen into the anode stream is essential for improving the fuel utilisation [34,35]. A purging strategy, independent of time, was developed, experimentally implemented, and validated in the system. This aspect is discussed in greater detail later in this paper. The strong rationale for implementing the aforementioned recirculation was the fact that without recirculation, there was the requirement of frequent purge cycles in order to create a flow in the channel and avoid flooding, thereby reducing fuel utilisation [19]. As stated before, there are two main purging methods: the dead-end and recirculation modes. Based on previous work and our findings, the latter mode is favourable. It must be noted that, depending on the size of the fuel cell system and recirculation pump type, there may be an additional parasitic load demand. However, in the considered PEFC system, parasitic load due to hydrogen recirculation was minimal thanks to the compact and low power pump used. Figure 2a illustrates the complete dead-ended fuel supply with a recirculating anode subsystem involving a real-time data monitoring and logging setup.

2.2. Oxidant Feed Subsystem

For the electrochemical reaction to take place, oxygen from ambient air must be delivered into the cathode stream of the stack. This is achieved by using air compressors or blowers that, through suction or injection, provide ambient air into the stack. Fuel cell membranes only offer superior proton conduction when they are sufficiently humidified [36]. There are two main methods of humidification in a fuel cell: internal (also known as self-humidification) and external humidification. The former can be achieved by modifying the cell material composition and channel design [37], whereas the latter requires an external humidifier to cause humidification in the gaseous reactant flow prior to entering the cathode inlet. External humidifiers are capable of providing a certain level of regulatory control in maintaining the desired relative humidity level so as to avoid drying and/or flooding of the cell [38]. In this work, a passive external humidifier with shell and tube moisture exchanger containing a Nafion membrane was used—as shown in Figure 2b.

2.3. Thermal Management Subsystem

It is imperative that the stack operates within a regulated temperature range for optimal performance [39,40,41]. The thermal management subsystem in the liquid-cooled PEFC in our setup was responsible for effectively dissipating the heat produced by the stack using a heat exchanger. The subsystem consisted of an air-cooled radiator, a three-way passive valve to direct the flow of coolant into the heat rejector based on the stack temperature, a reservoir for the liquid storage and pressure compensation, and a coolant circulation pump (as depicted in Figure 1).

3. Results, Comparisons, and Discussion

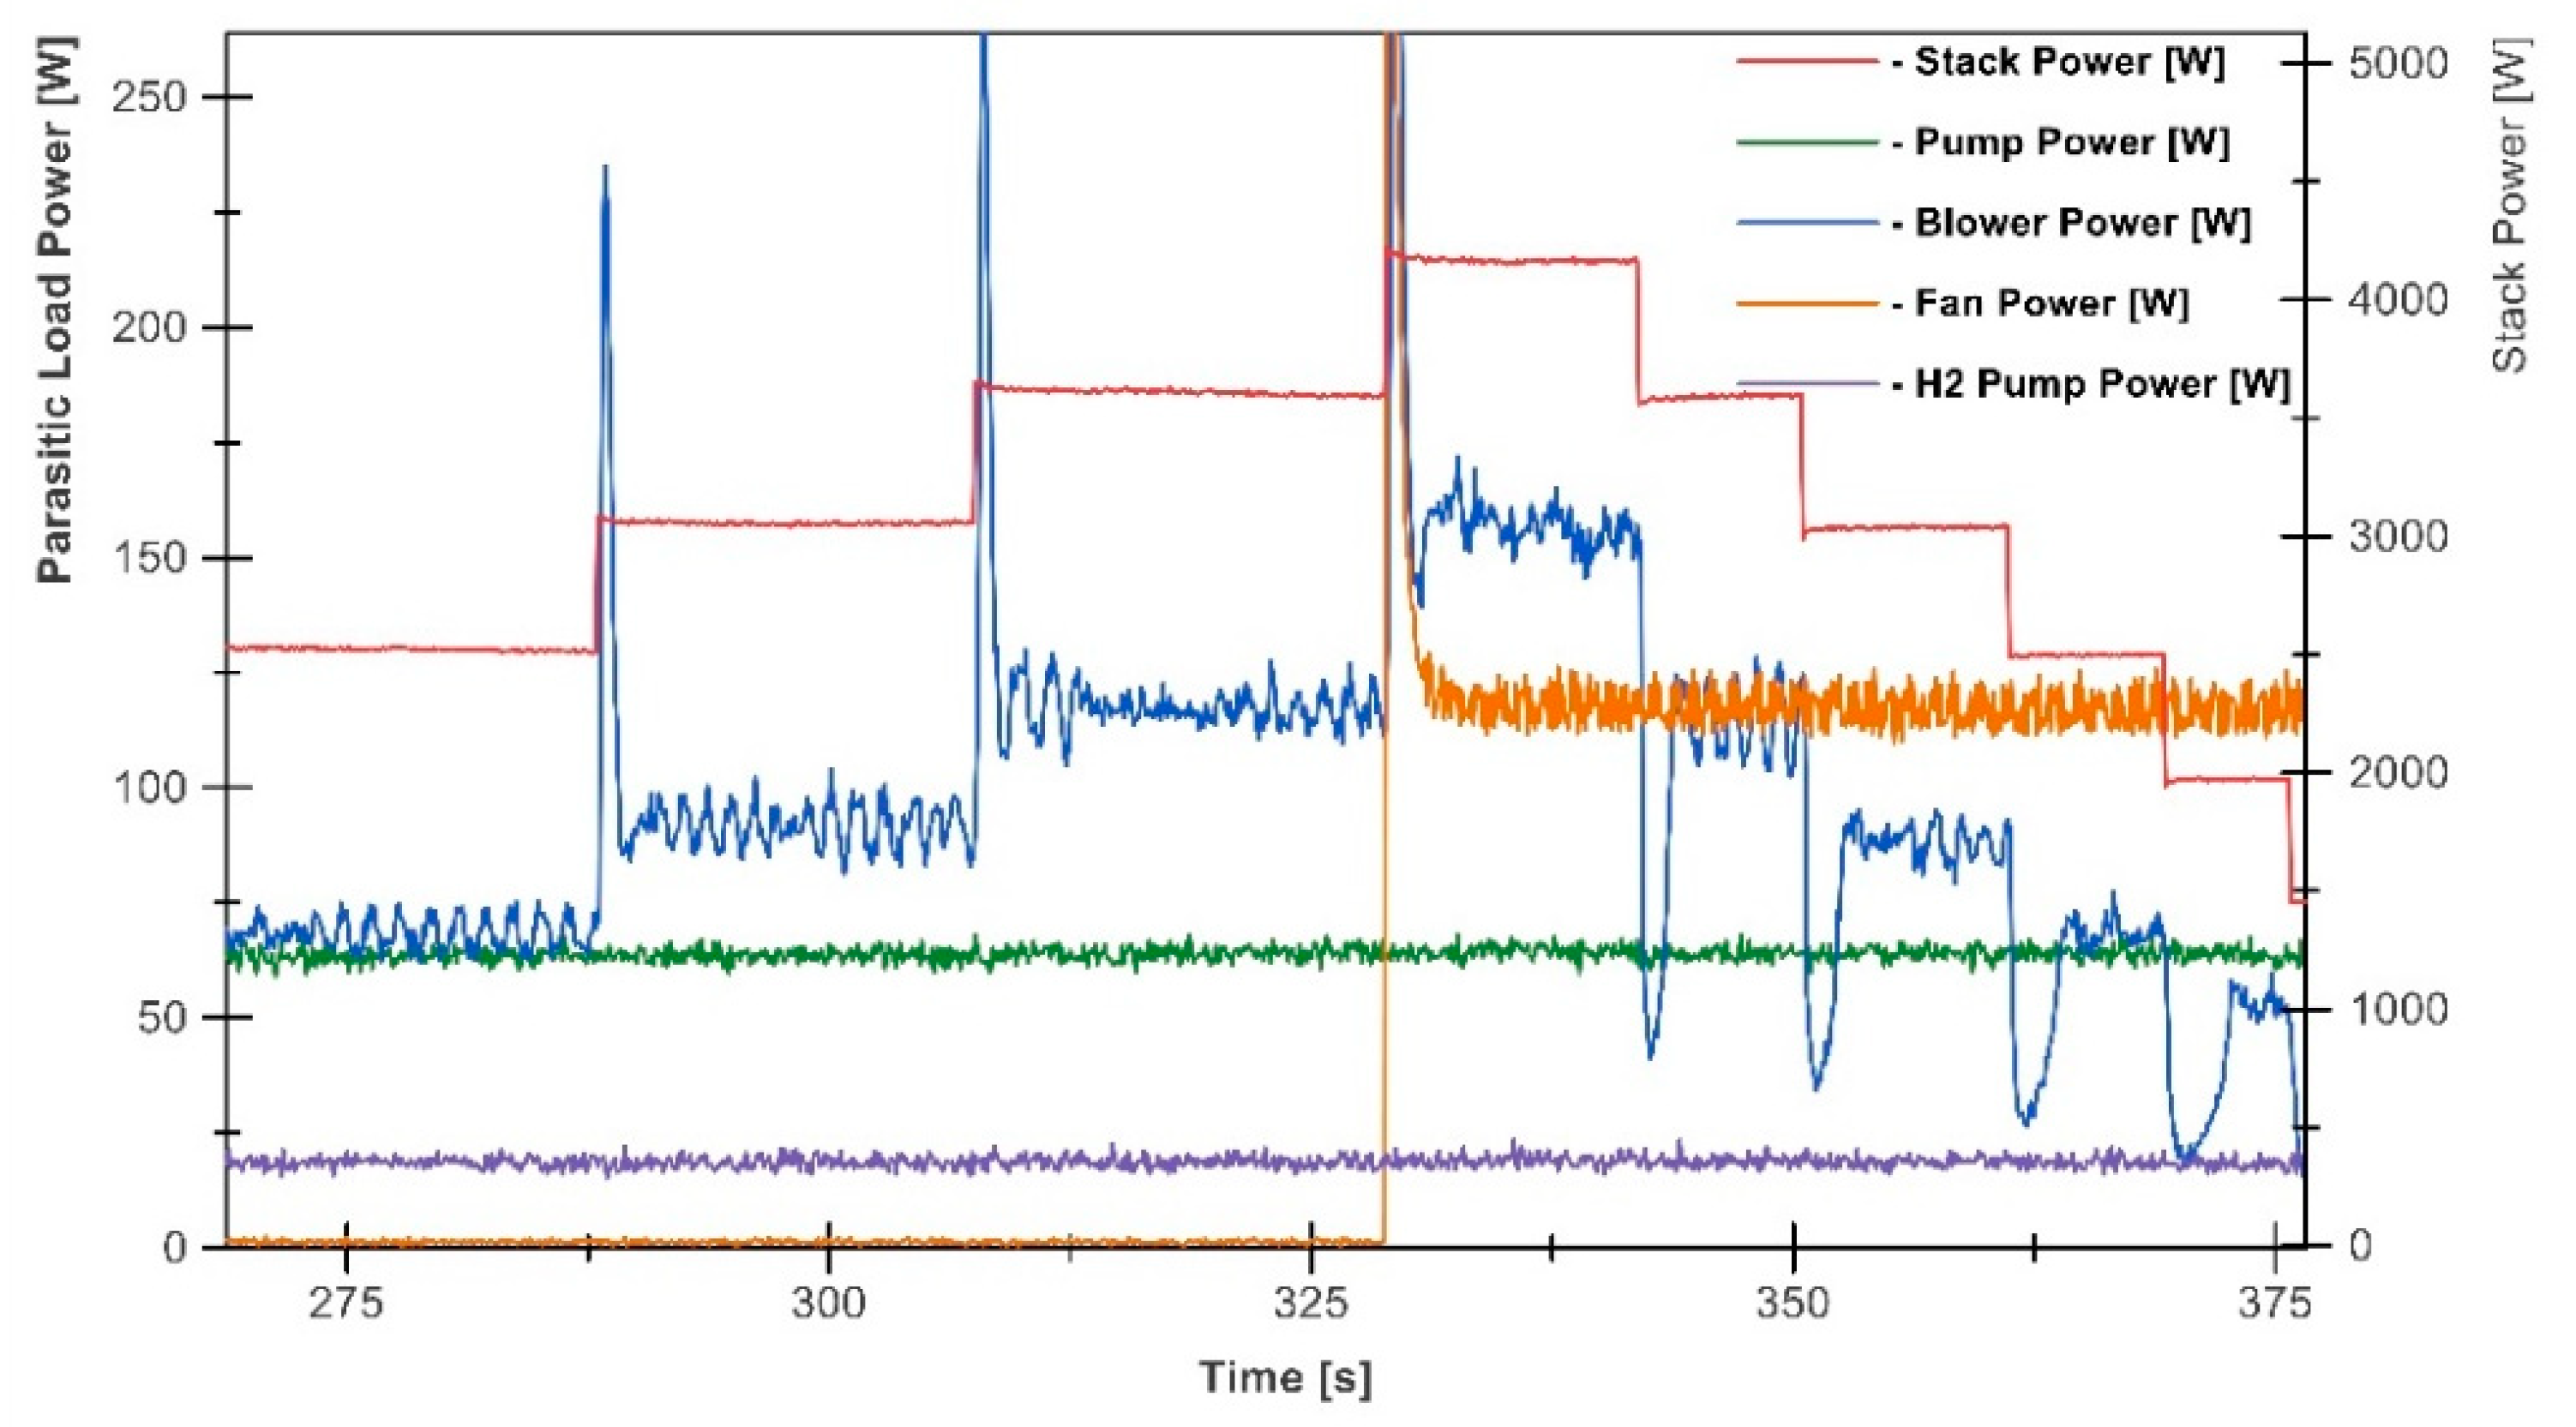
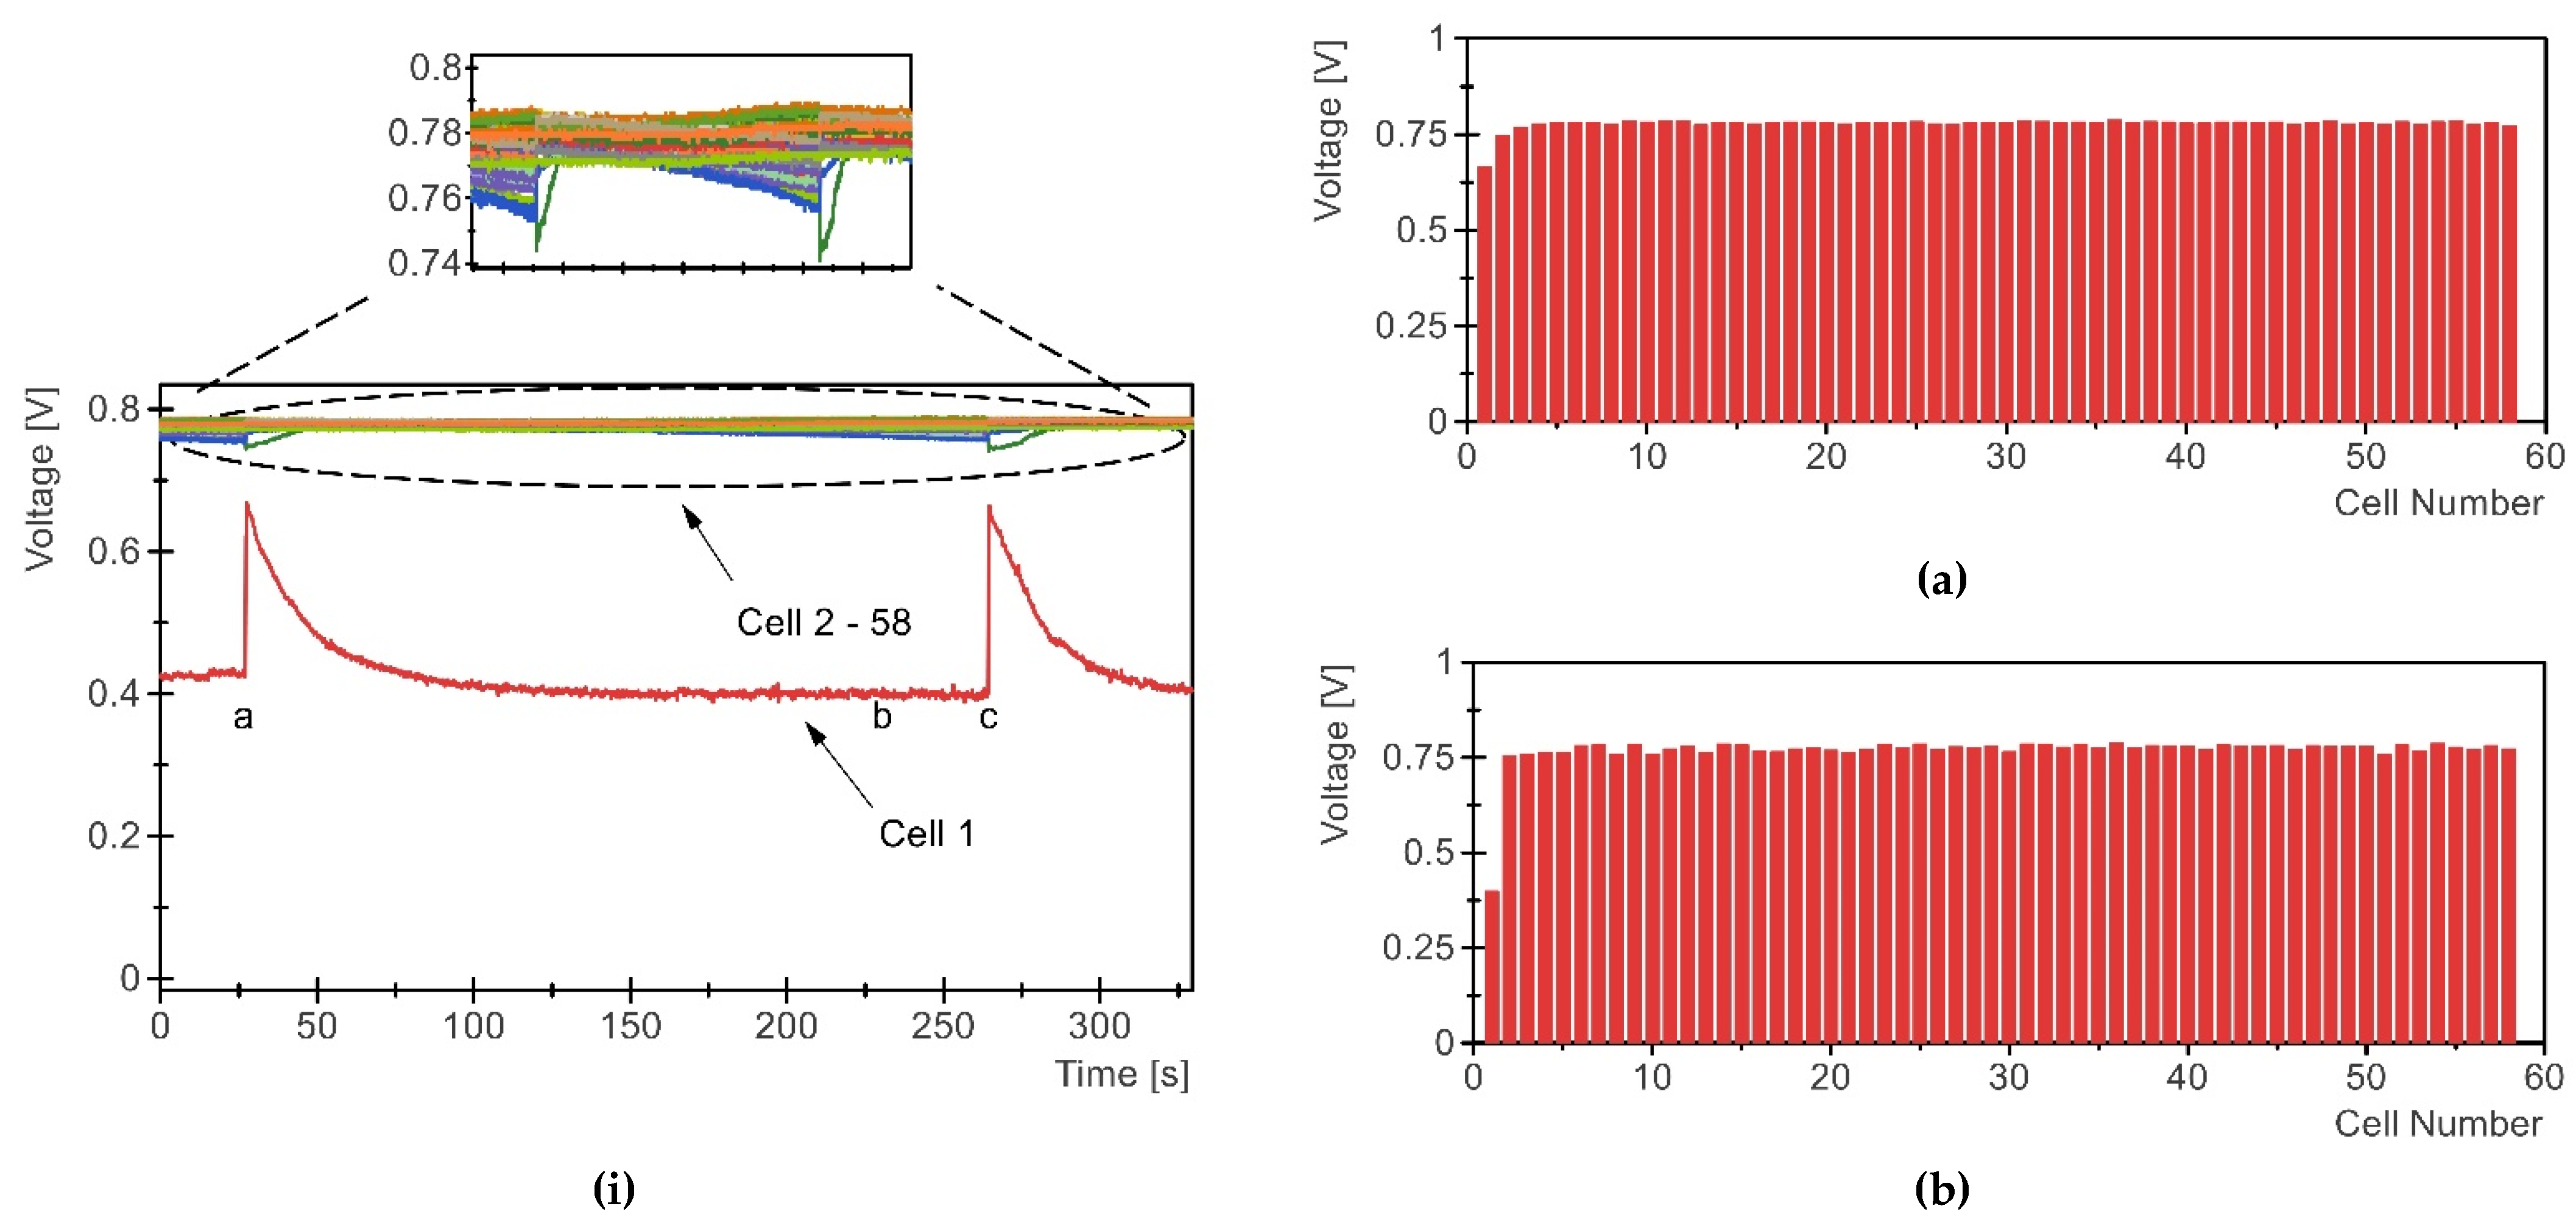
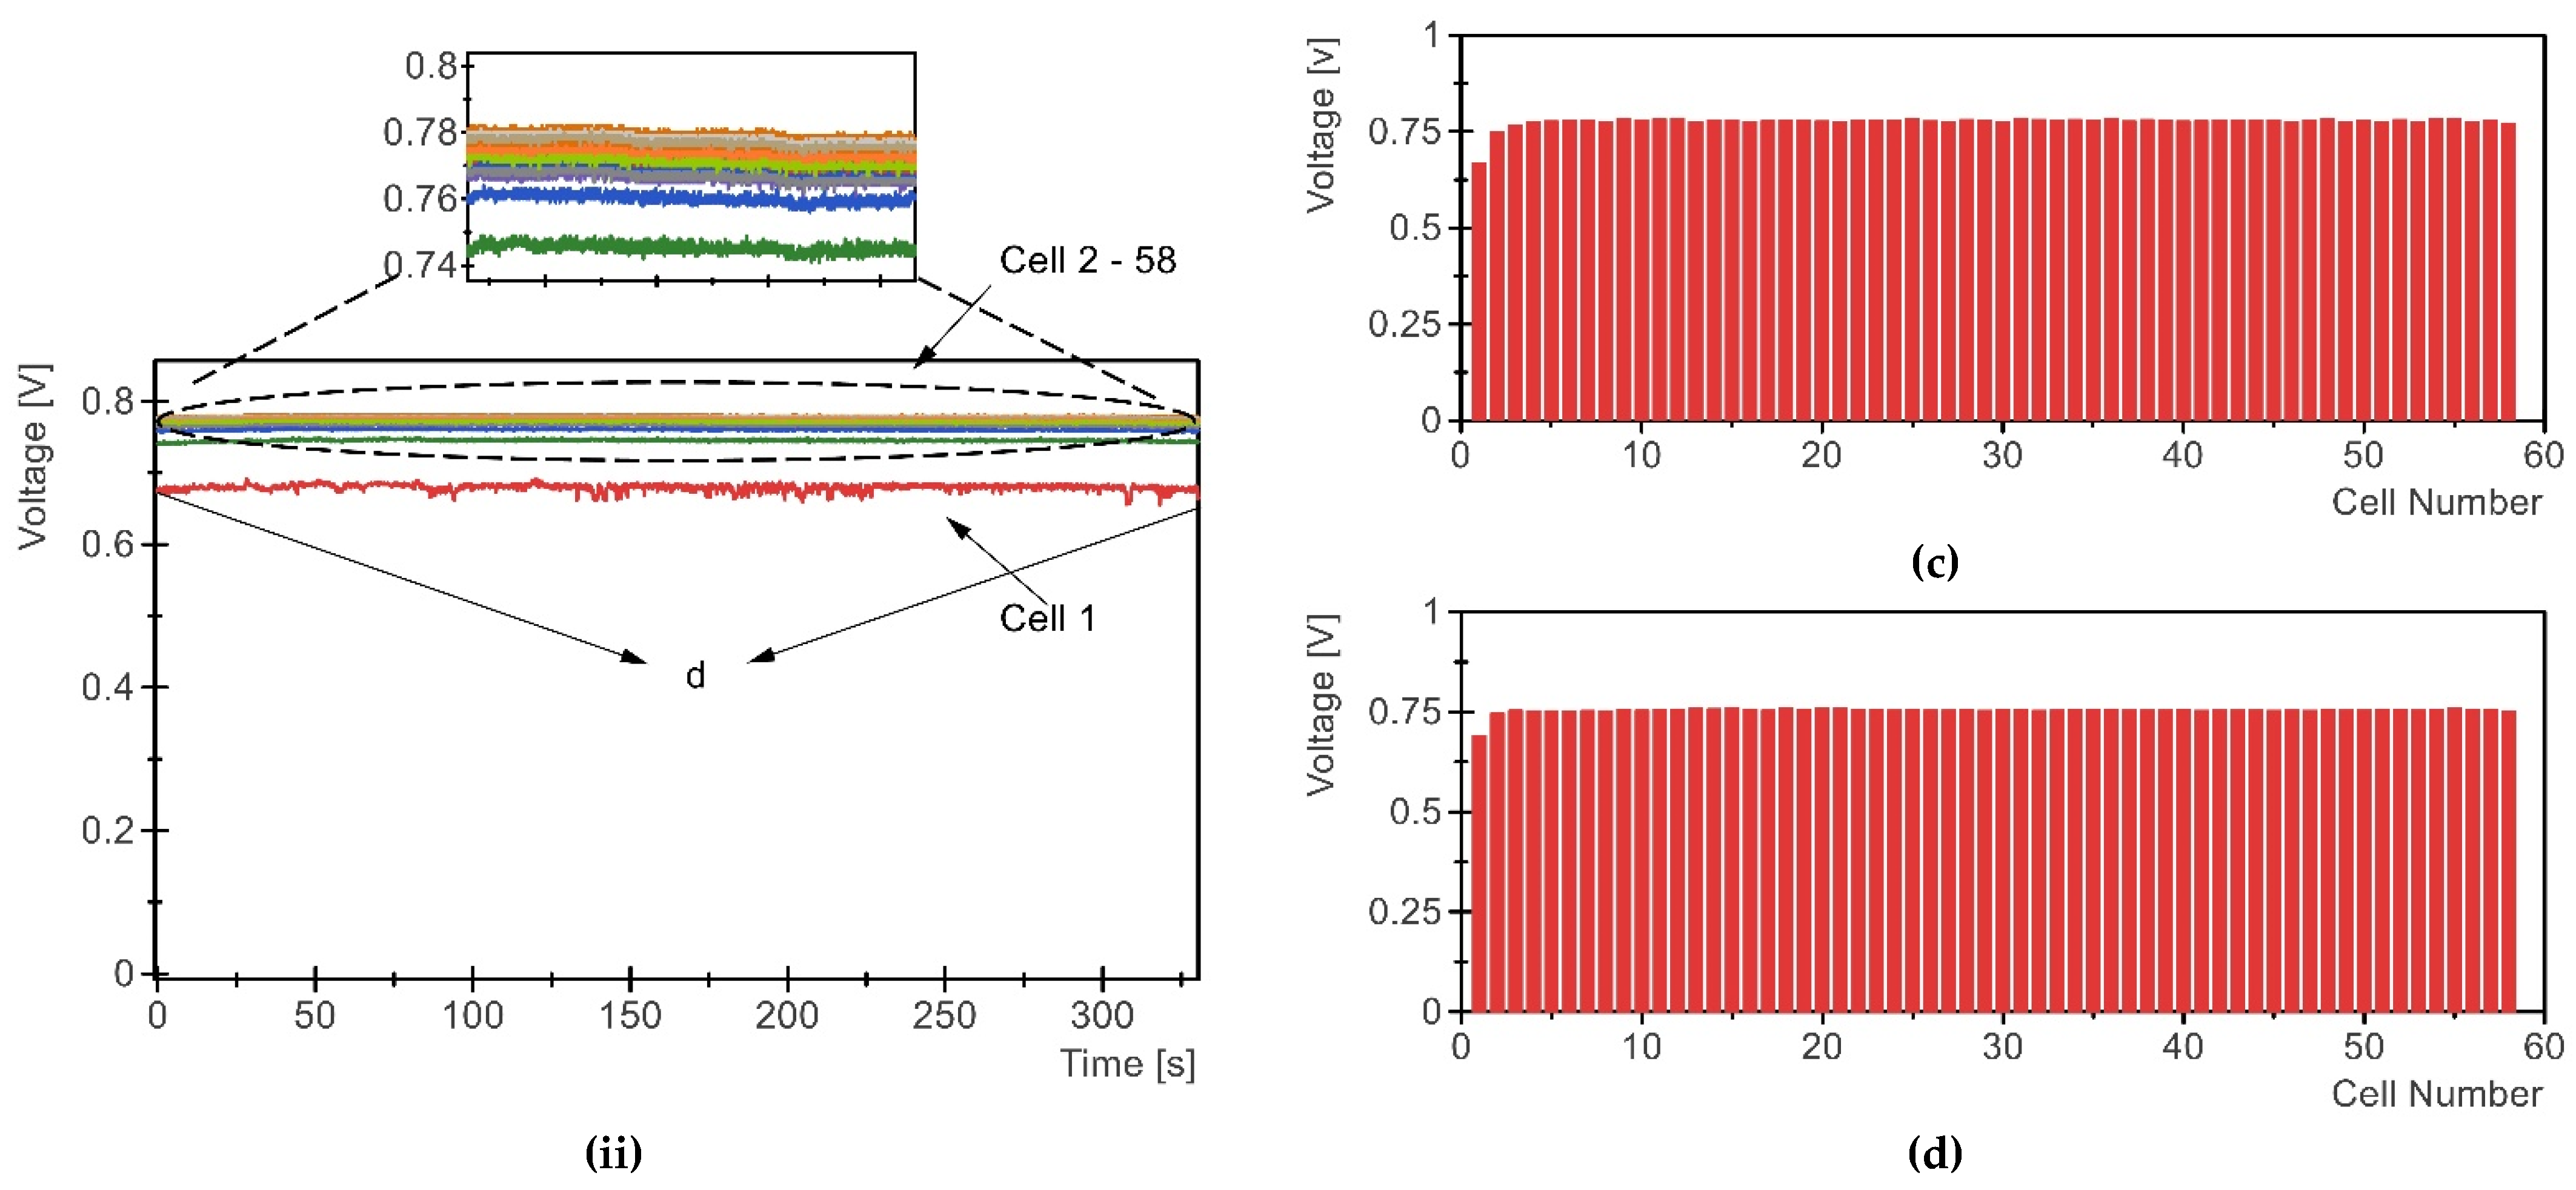
3.1. Preliminary Experiments

The stack polarisation curve in Figure 3b was obtained using the LabVIEW software programme to automate the step changes with minimal duration so as to not be impacted by the temperature rise. The stack was made to operate at its ideal temperature of 60 °C. Prior to each experiment, a purging event was triggered in order to avoid the negative effects of inert gasses and water accumulation. The delay between each step change of 100 W was selected as two seconds in order to reach the steady state. The stack and system efficiency curves were then obtained to showcase the best operating point of the stack (Figure 3a). It can be seen that at peak power, the stack efficiency was approximately 45% and the system efficiency was approximately 40%. This reduced value of efficiency was attributed to the high parasitic loads at the high stack power. Equations (1) and (2) describe the stack and system efficiencies, respectively.
η s t a c k =   V s t a c k 1.48 × N
η s y s t e m = η s t a c k × P s t a c k P s t a c k + P B l o w e r   + P C o o l a n t   p u m p + P F a n + P H 2   p u m p  

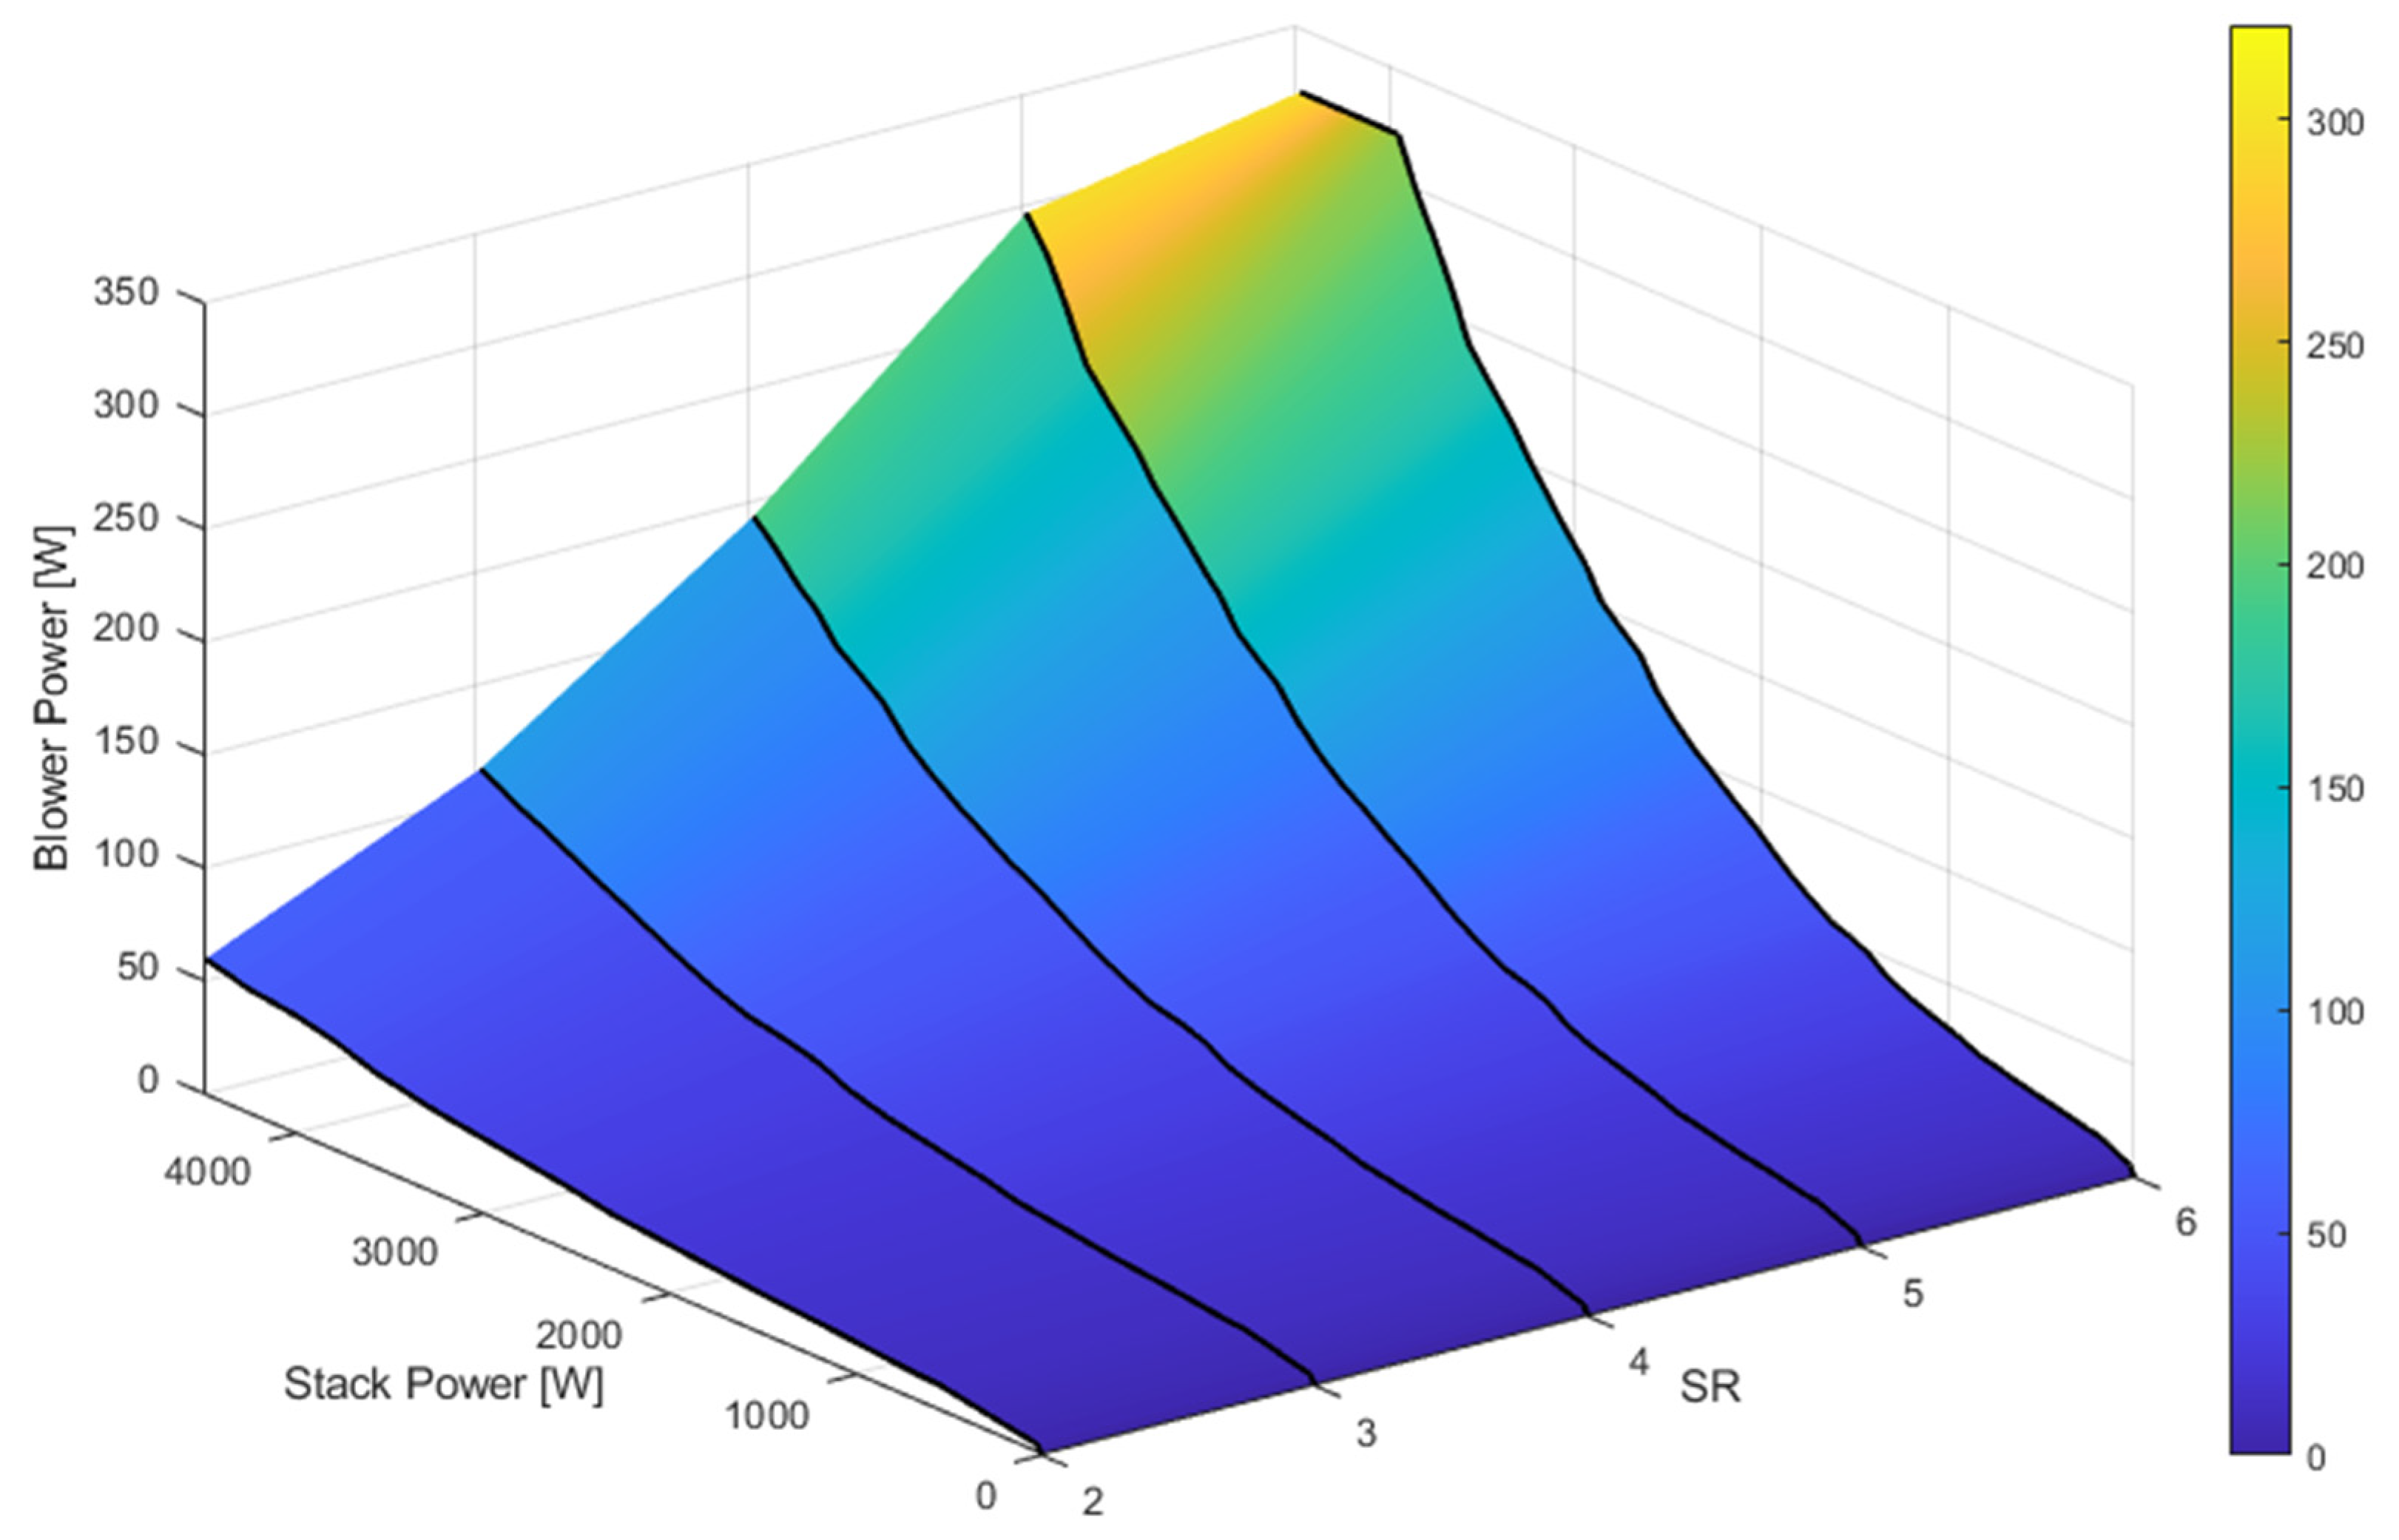
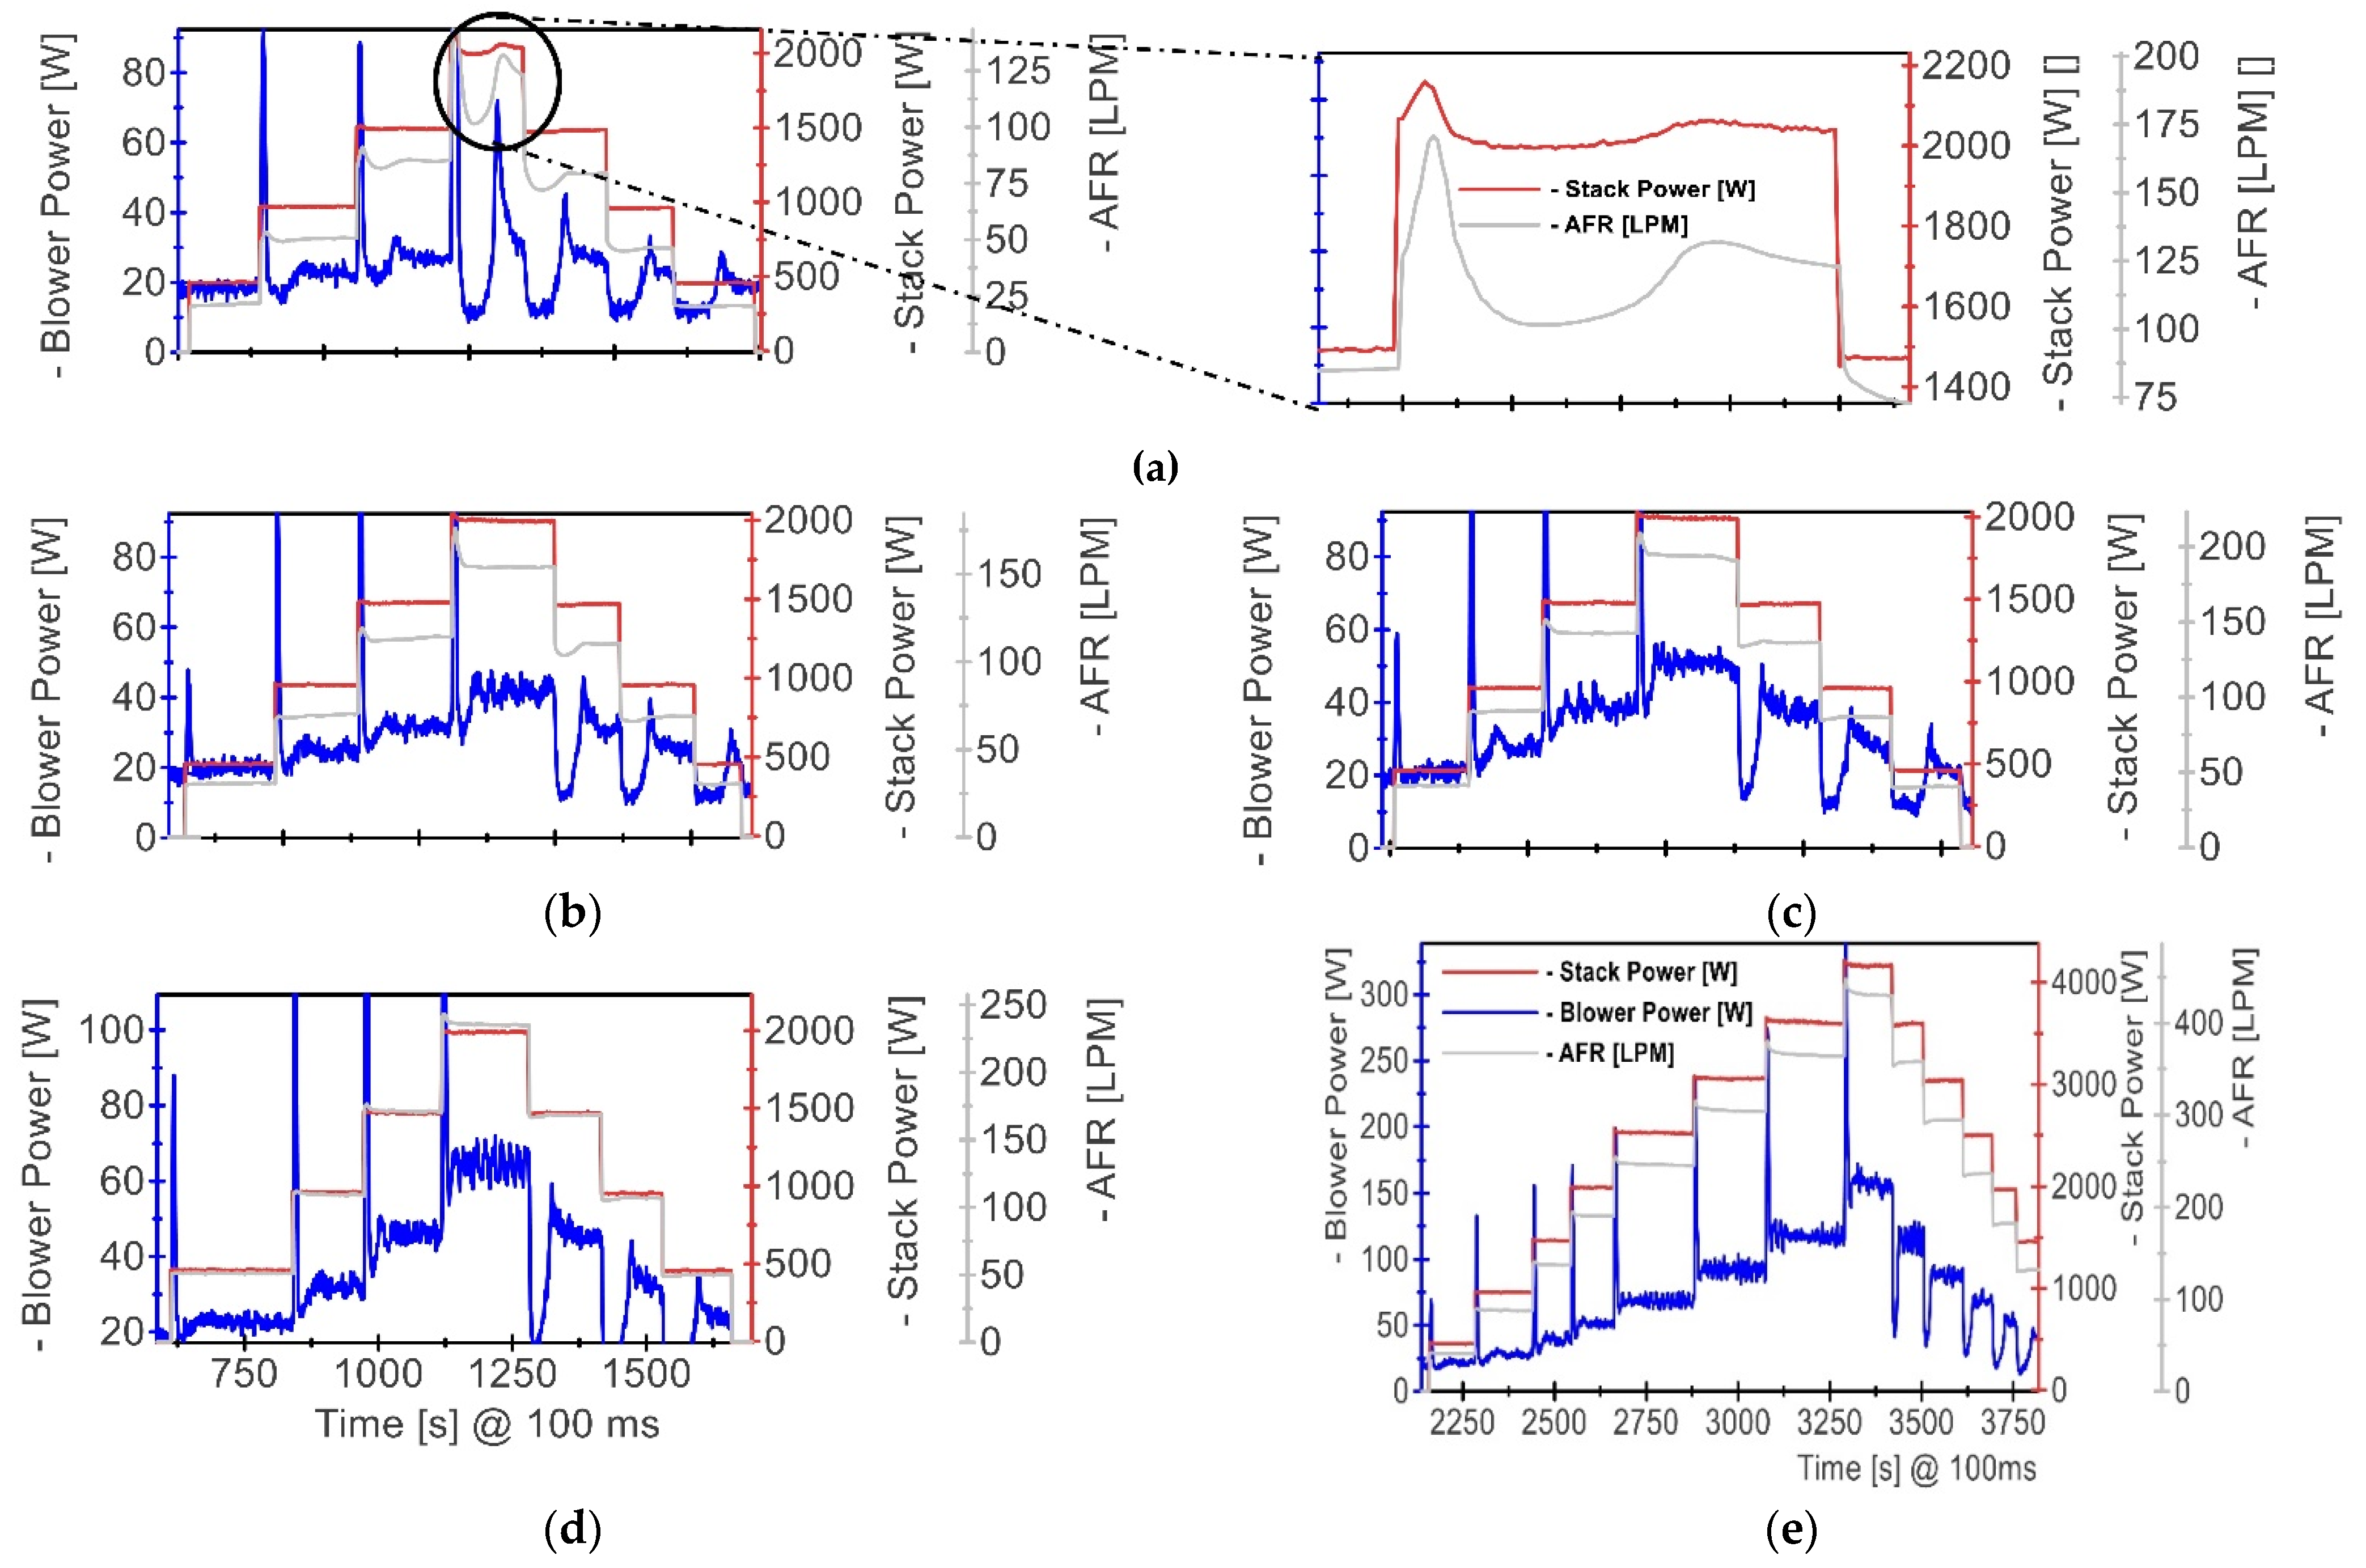
3.2. Cathode Blower Experimental Modelling

System efficiency is closely related to parasitic loads. Therefore, it was desirable to minimise the usage of the cathode air blower, heat exchanger fan, and hydrogen recirculation pump while maintaining stack performance. From Figure 4, it can be seen that at high electrical load (4 kW), the blower was the biggest contributor to parasitic loads. The coolant pump was usually left to continuous operation for the precision of temperature measurement. The power consumed by the hydrogen recirculation pump was the lowest due to its small size. The heat exchanger fan was made to operate at its maximum power for a limited duration until the lower threshold of the dead band was reached.
A ‘black box’ modelling technique was adopted to develop a functional map of the cathode air blower. Black box models are based on data acquired through statistical analyses or experiments wherein the mapping of inputs to appropriate outputs is performed [42]. With this approach, there is no need to rely on complex physical laws or governing equations. The disadvantage of this, however, is the inability to apply certain forms of optimisation techniques. Here, the approach involved taking measurements of the air flow rate at the outlet of the cathode manifold using a high-range air flow meter, which enabled us to extract accurate air flow measurement values based on the control signal of the blower without having to perform numerical modelling or requiring knowledge of the stack geometry. At the same time, power consumption values were noted against each flow rate value. These were all obtained at the steady-state phase after every step change. Based on Equation (3), the air usage of the fuel cell stack at a required electrical power output could be determined:
AFR = 3.57 × 10 7 × λ × P s t a c k V c e l l
Figure 5 shows the flow rate requirement for the stack power at different air stoichiometry ratios, λ, with values ranging between 2 and 6. These, when plotted against the blower power, demonstrate the capability of the blower with reference to stoichiometry ratio (SR) values. The calculated air flow rate requirements for the stack power were interpolated to fit the real AFR range of the blower, as shown below in the x-axis. The graph provides an operational map for the blower with respect to its electricity consumption and air flow rate for a chosen SR value and required stack power. The consideration of three parameters is imperative for the minimisation of blower energy use, especially in view of the non-linear behaviour of the aforementioned parameters. It can be seen in Figure 5 that the lowest and highest power consumption were attributed to SR values of two and six because of low and high flow rates, respectively. It can also be noticed that the blower was not capable of delivering the entire flow rate range with an SR of six due to it being undersized, as it exceeded the functional map of the blower.
Selecting an appropriate value of air SR is crucial to deal with both the electrochemical reaction and water management. Moreover, the deficiency of reactant gases, especially air on the cathode side, at high electrical loads can lead to fuel starvation. Fuel starvation is defined as the phenomenon of having an insufficient supply or slow transport of the reactants to the reaction sites [43]. The reactant starvation phenomenon can be distinguished into two categories based on the starvation area and magnitude: local and overall starvation. Local starvation occurs at the cell level due to uneven distribution of gasses on the surface of the electrode. The effect of this is usually a drop in output performance [44]. Overall, oxidant feed starvation mainly occurs due to external components such as compressors or blowers that, at a sudden change in demand, lag in sufficing the stoichiometric value of air and thereby cause cell degradation and major reductions in performance [44,45,46]. In our work, we primarily aimed at implementing an experimentally derived blower functional map so as to fulfil the required air flow rate without causing fuel starvation and significant effects on system efficiency. Thus, neither the optimisation nor dynamic calculation of the SR value were considered, as seen in previous work done by some authors [47,48].
Figure 6 illustrates the results of sensitivity analysis performed in order to illustrate the effect of oxidant fuel starvation at low air SR levels. The rationale for determining the optimal value is evident in the figure, where fuel starvation can be observed at a low air SR value of 2 and a medium electrical load. Specifically, the step change in the electrical load value created an abrupt demand for reactants. In the event of the slow supply of reactant, fuel starvation was seen (as illustrated in Figure 6a). Higher values of air SR resolved this issue (Figure 6b–d), but the blower power consumption also increased. Although fuel starvation was not seen when operating the stack with SR value of 3 or higher, an SR value of 4 was preferred because of the need to avoid water flooding in the cathode stream thanks to relatively higher flow rate. However, this presented a small trade-off in terms of blower power consumption. Figure 6e displays the high power demand being met with the aforementioned value of air SR, i.e., 4.

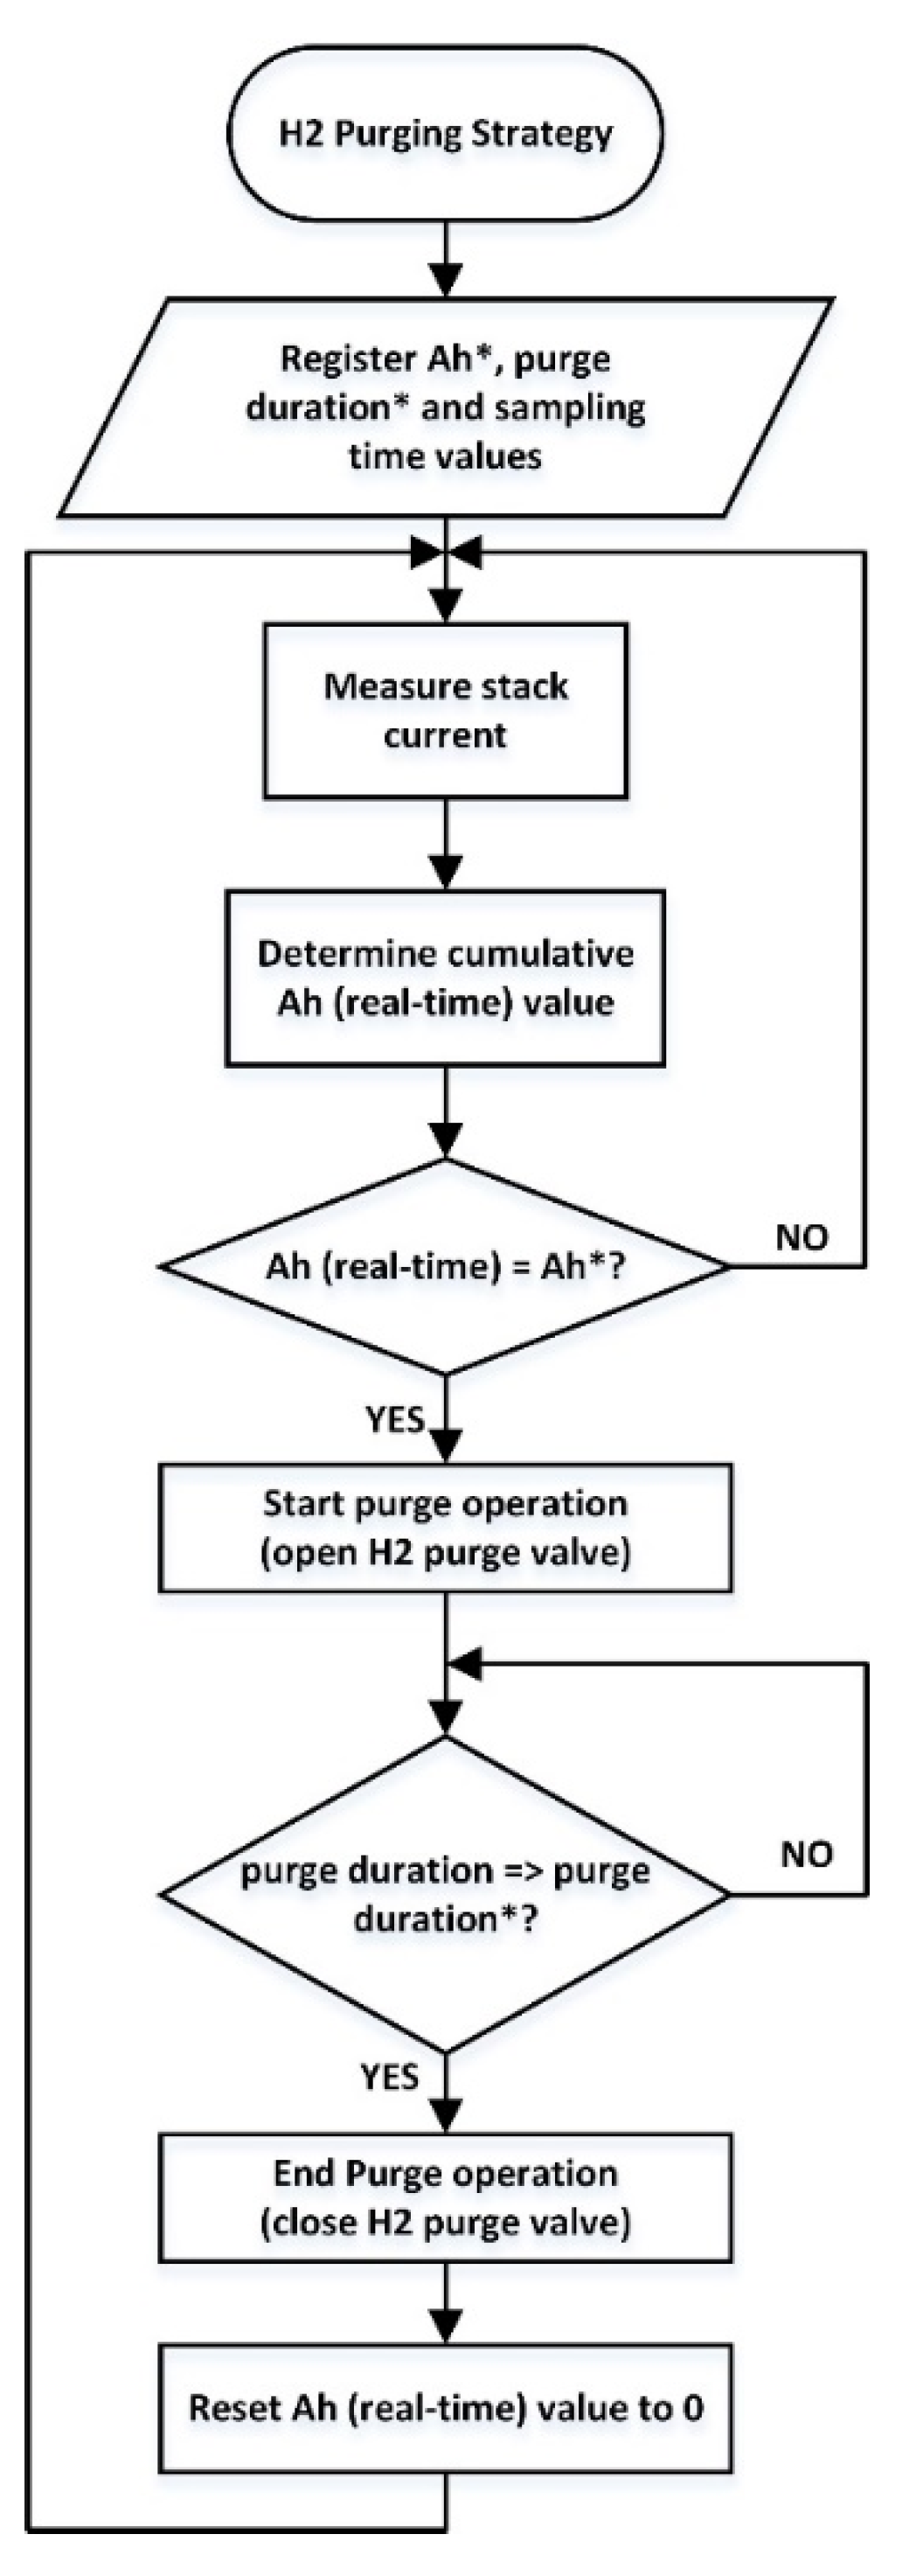
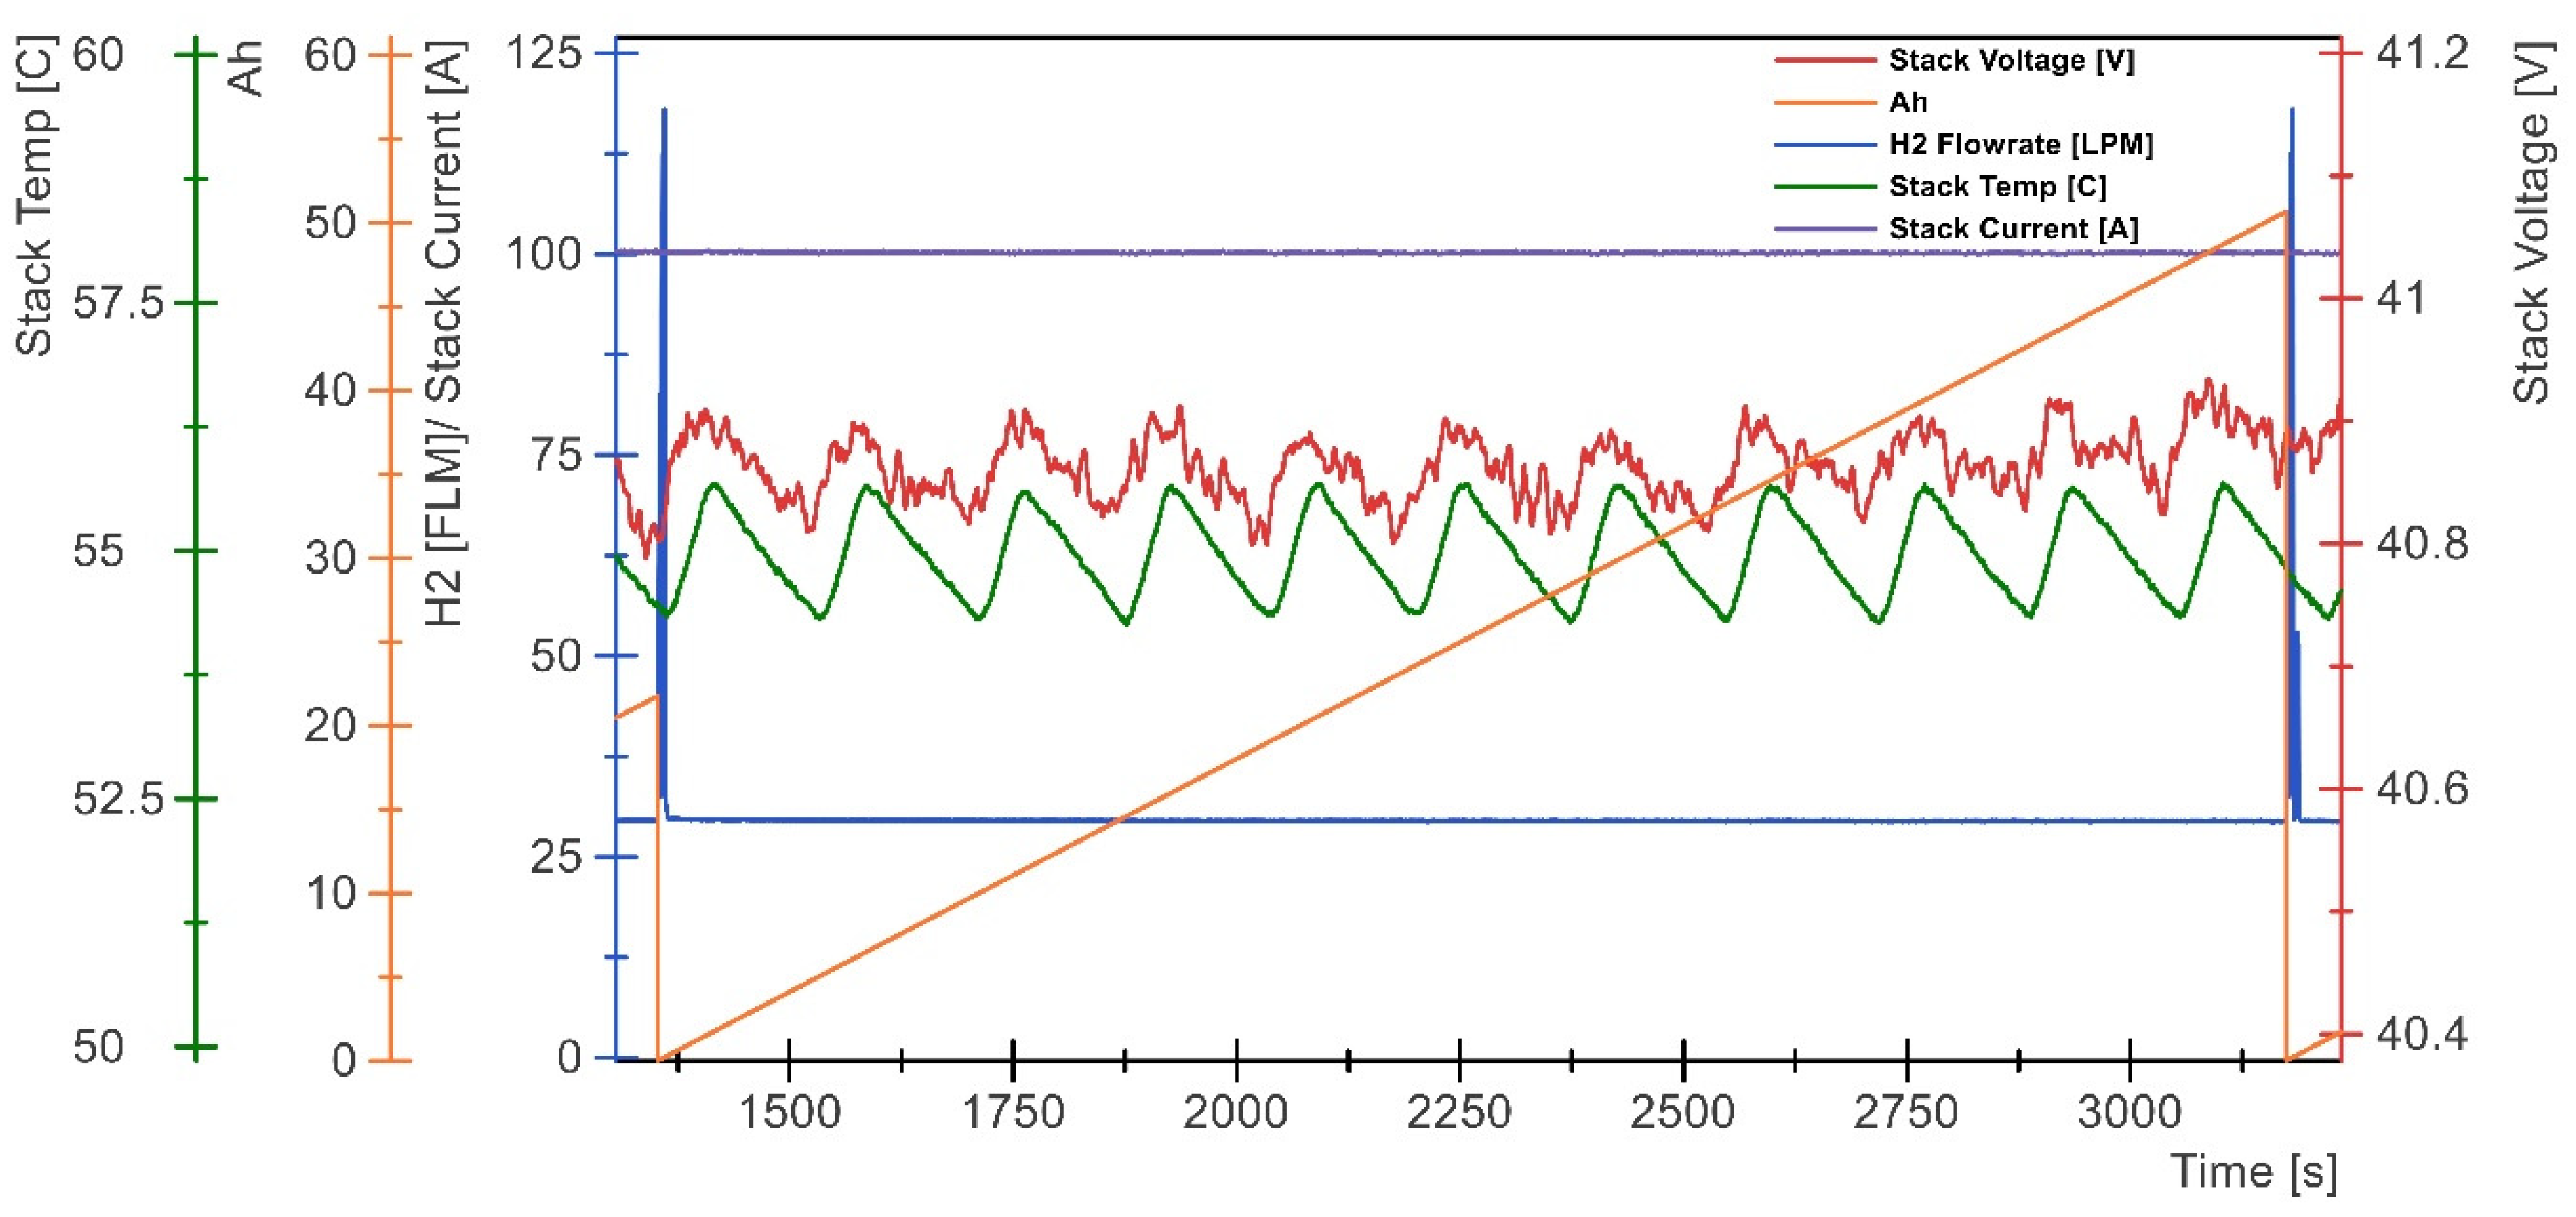
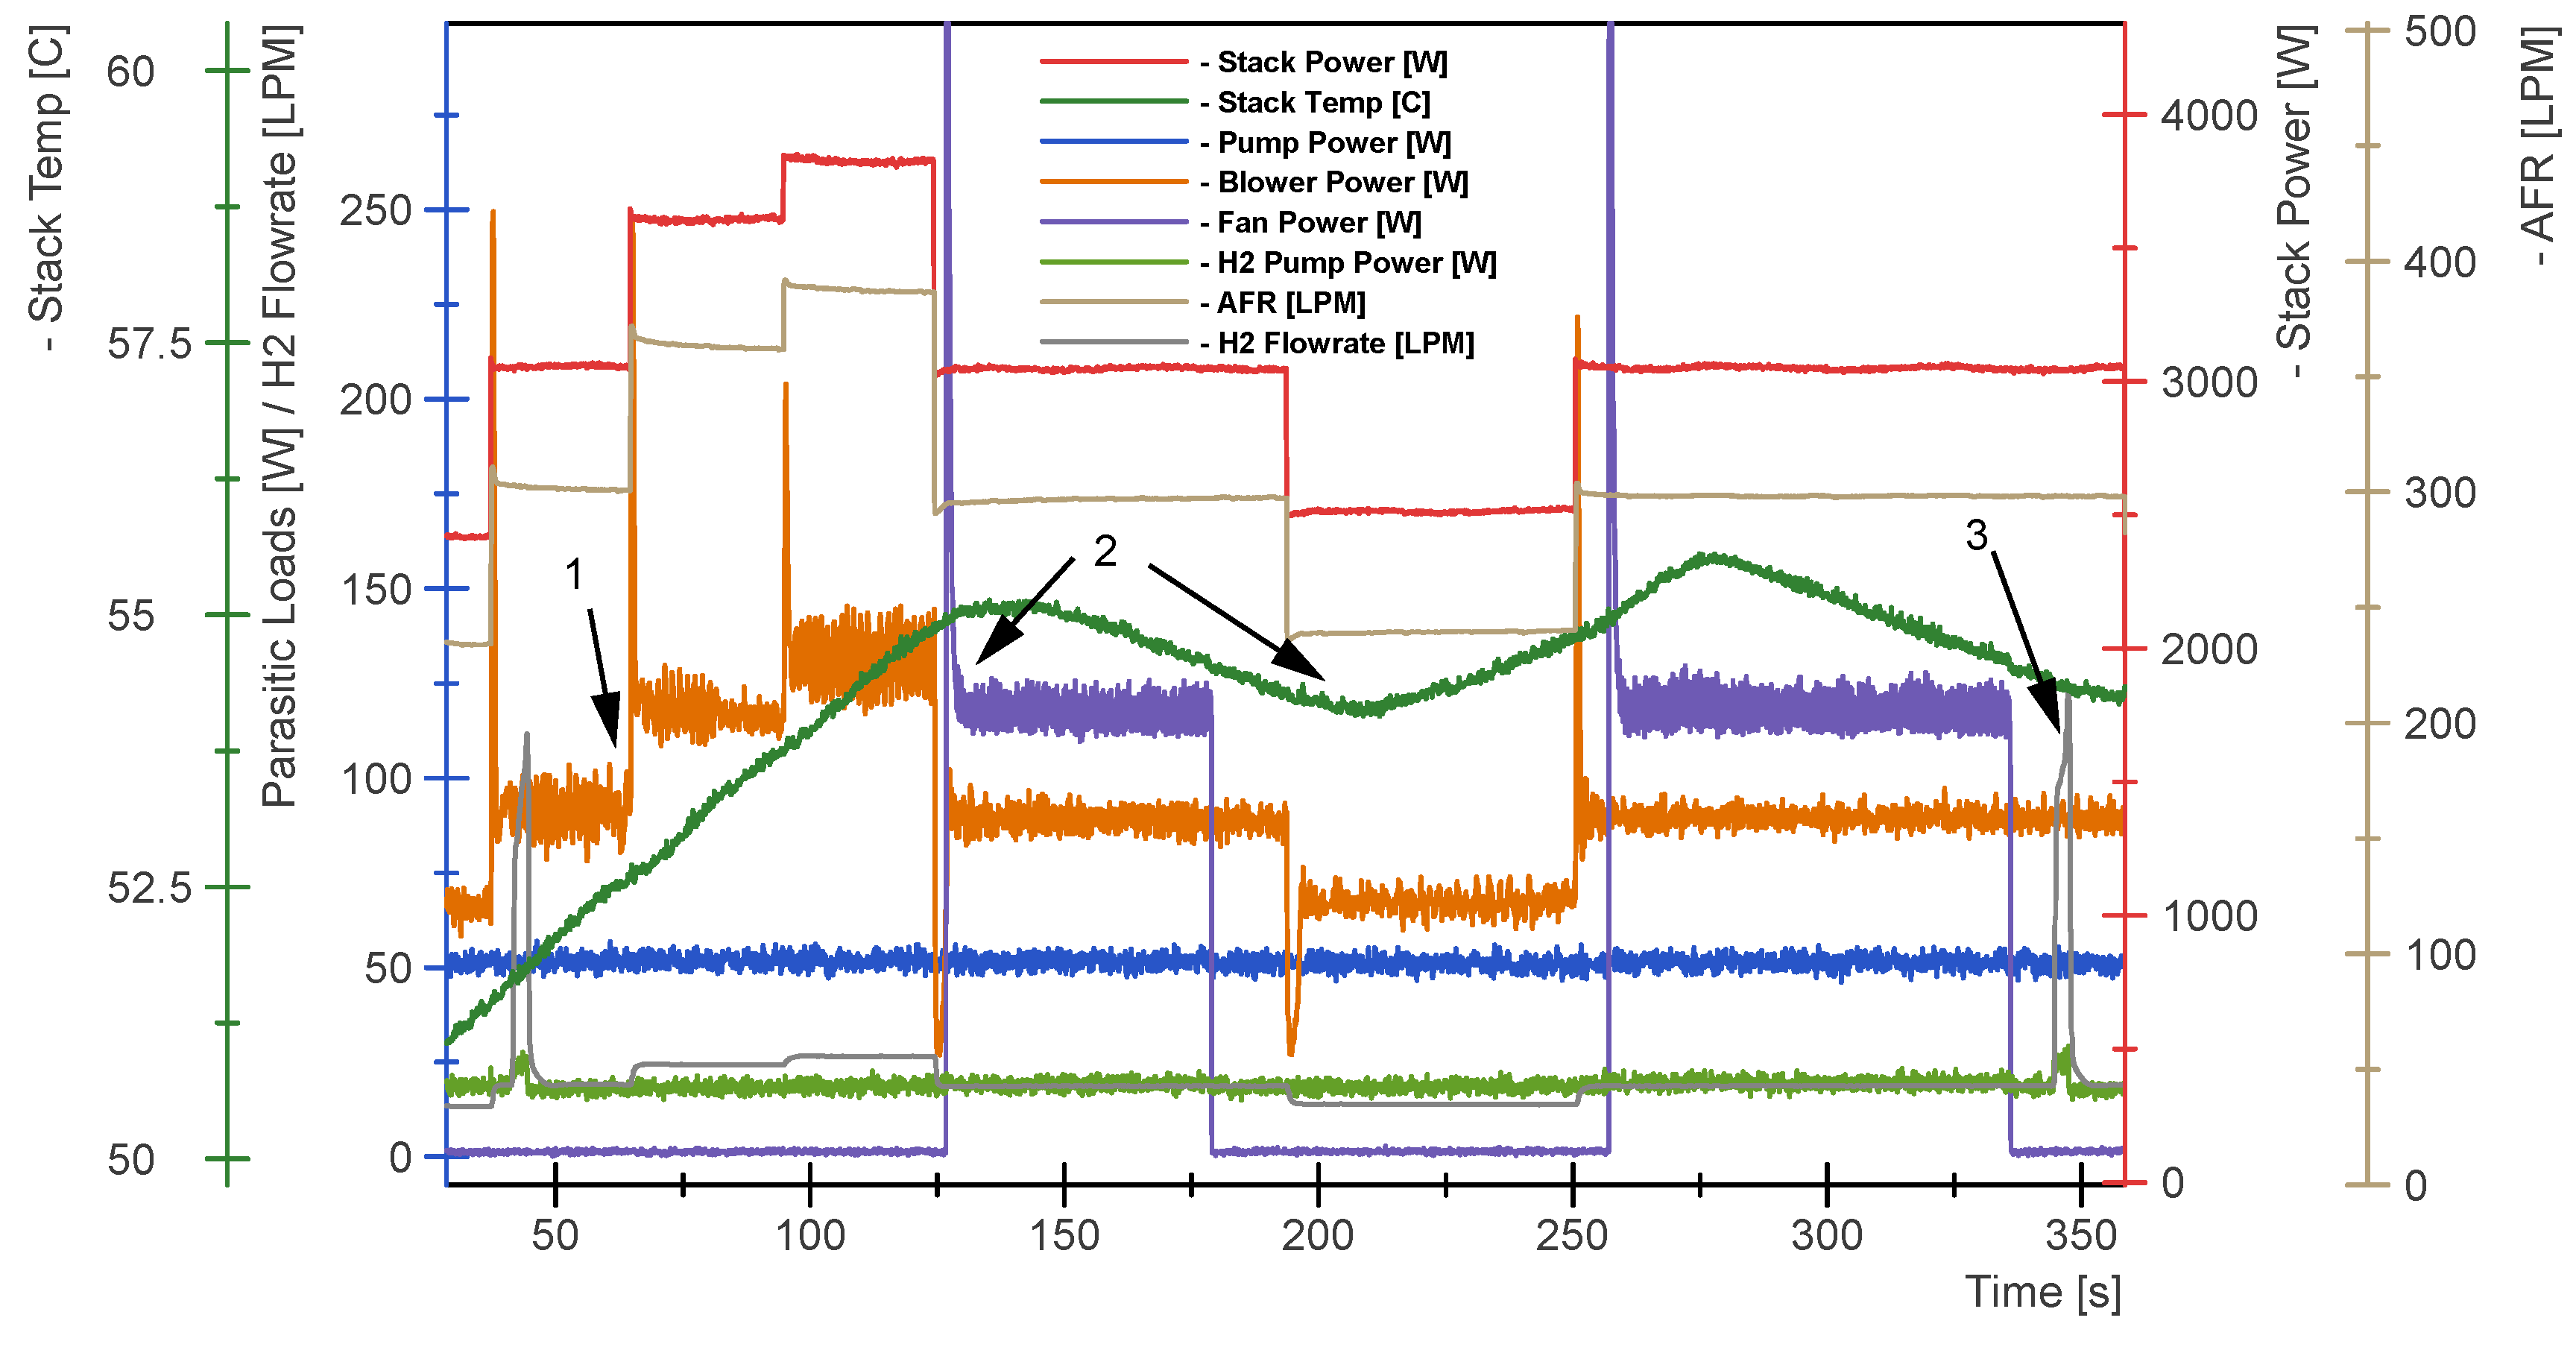
3.3. Hydrogen Purging Strategy

The voltage drop caused by the accumulation of inert gasses and water formation in the anode can be recovered by purging hydrogen. The frequency of this event depends on the design of the hydrogen anode subsystem—as evident from the results presented later in this paper. The rationale and need for purging hydrogen has already been discussed in earlier sections. This section describes the methodology adopted for determining when and precisely how to purge. Various purging strategies used in previous work by different authors involve complex models, additional sensing instruments, and components such as water separators. Here, we propose a novel method that makes use of the stack current rather than cell voltage or nitrogen concentration within the anode stream. As a result, the purging event can be triggered when a certain value of ampere-hour (Ah) is reached. The following Equation (4) can be used to determine the ampere-hour (Ah) value:
Ah =   I s t a c k   × T s 3600
This equation enabled us to purge solely based on the current produced by the stack instead of devising fixed purge cycles. The purging strategy slightly differed for dead-end and recirculation modes, mainly in terms of frequency. In the recirculation mode, the recirculation pump was stopped during the purging event so as to allow for a smoother passage for the exhaust gas stream. Figure 7 shows a flowchart highlighting the sequence of actions and processes concerning the anode purging strategy. The automated purging strategy involved constantly measuring and monitoring the stack current to be able to derive the Ah value and cumulate the value over every time interval. This Ah value, in real time, was reset once a pre-defined value was reached and after the purge duration was complete. The ‘purge operation’ began by changing the normally closed state of the solenoid purging valves to open, allowing for a path for accumulated gasses and water to leave the anode stream. The purge valve was reverted to its original position as soon as the maximum purging duration was reached. Based on the electrical load, the purge duration was kept in the range of 0.5–0.8 s. Several authors have experimentally validated the correlation between the electrical load and purge duration or purge cycles [7,19,20,49]. For example, Jian et al. [7] conducted experimental work on a PEMFC stack with different purging durations at various current density values. Amongst their findings were that with longer purge durations at higher current densities, a more stable voltage trend was seen. Longer purge durations offer larger windows for the flooded water to clear from the anode side. Similar findings were reported when long purge durations were considered [19]. One of the key findings in the aforementioned report was that the nitrogen content, as a result of back-mixing, can be trapped inside the water volume and require long purge durations to discharge through the purge valve.

3.4. Comparative Analysis

This sub-section presents a comparative analysis that shows a clear distinction between the two most common anode designs: dead-end anode with and without recirculation. Additionally outlined in this section are the key benefits in terms of hydrogen utilisation and costs.
The most useful output parameter in identifying the effect of uneven gas distribution and water flooding inside the stack is cell voltage. Furthermore, when drawing a constant resistive load, it is important to maintain the programmable electrical load in a current-controlled mode. Two separate experiments were carried out for each anode design in order to observe the aforementioned effect. For safety of the stack health and the avoidance of any undesired negative impacts, the dead-ended anode experiments were carried out using a relatively low electrical load. The discussed purging strategy was implemented in both cases. Furthermore, the stack was operated at around the recommended operating temperature and anode pressure of 60 °C and 1.3 bar, respectively. The dead-band temperature setting for the experiments was between 54.5 °C (lower threshold) and 55 °C (upper threshold). In order to avoid oxidant fuel starvation, the cathode blower was set to operate at a sufficiently high flow rate. The unregulated hydrogen flow rate was measured using a high capacity electronic MFM that was capable of measuring the maximum stack fuel flow rate of up to 75 slpm. The real-time monitoring system had a sampling time of 100 ms. Individual cell voltages were monitored and logged using an advanced cell voltage monitoring (CVM) unit. Without this device, it would not have been possible to clearly witness any of the stated effects while being certain of their locations. The purity of hydrogen used in the experiments was 99.999%.
In the case with no recirculation, the results clearly demonstrated the dire need for frequent purges. Figure 8 shows the results obtained from an experiment on the stack with the aforementioned design at a medium level electrical load of 2 kW. The stack voltage clearly dropped, either after a short period of time had passed or upon drawing a certain amount of Ah of charge. This, as described in the previous section, was a result of the accumulation of inert gases and water. When hydrogen was purged through the purging valve, indicated by a sharp spike in the flow rate measurement, the stack voltage reverted to its normal value. Thus, there were three instances during the experiments that showed different voltage drop levels based on different Ah values. For example, in the middle region of the experimental results, it can be seen that there was a voltage drop of 0.63 V after drawing 47A for approximately 6.5 min or 5 Ah. This implied a purging event at approximately every 5 Ah of charge accumulation. Similarly, two other instances showed smaller voltage drops of 0.28 and 0.48 V with relatively lower Ah values. In order to minimise the effect of temperature rise, the dead-band settings were such that a 1 °C difference was achieved.
In contrast to the abovementioned design, employing the hydrogen recirculation pump in the anode stream led to the observation of a significant difference in stack voltage. Figure 9 shows the results of an experiment conducted under the high electrical load of 4 kW—twice the value considered in the previous experiment. Similar configurations regarding the electronic load were used. The results depict almost no voltage drop between the two purges, even after drawing 100 A for a duration of 30 min or 50 Ah worth of charge drawn from the fuel cell stack. The fluctuations seen in stack voltage readings were evidently due to the rise and fall of the temperature. In terms of fuel utilisation, it becomes apparent from Figure 8 that the dead-end without recirculation design required at least ten additional purges compared to the design employing recirculation for the same length of experiment if operated at 4 kW electrical load. The operating cost of the small size recirculation pump, at a mean operating power of 25 W, would amount to 12.5 Wh or 0.0125 kWh. This amount of energy consumed from hydrogen fuel is significantly less compared to the frequently purged hydrogen. Thus, this set of experimental results clearly shows the frequency of purging events required in both scenarios, which may be used for further optimisation that can lead to improved fuel utilisation values.
A clearer observation could be made by visualising the behaviour at the cell level with the help of CVM. The compact CVM unit incorporated in the PEFC system was an advanced modular unit designed for fuel cell applications with a 12 bit or 1 mV resolution and a scan rate of up to 1 kHz. For the purpose of comparison, the experiments in Figure 10 had the exact same settings in terms of electrical load, purge duration, and intervals. Observations in each experiment were split into three parts: the stage after the first purge, the middle stage, and the recovery after the second purge. These comprised an entire purge cycle operation, which enabled us to view both negative effects and recovery.
The contrast between the two anode feed modes is apparent in Figure 10. The experiments were conducted at a 2 kW electrical load under same operating conditions. Figure 10a–c corresponds to dead-end conditions without recirculation, whereas Figure 10d corresponds to experiments including a recirculation pump. In the recirculation mode case, there was little discrepancy or fluctuation in cell voltages, whereas evidence of performance degradation was clearly visible in the absence of recirculation. For example, Figure 10b shows some of the cells experienced a voltage drop of up to 0.15 V. Moreover, irregularity as a result of water and inert gas accumulation started to appear in the cells. A full recovery after purging is apparent in Figure 10c. On the other hand, with the recirculation pump in operation, the voltage drop after the same amount of time or Ah value was minimal, as shown in Figure 10d. It can be noticed in Figure 10i that cell one experienced a relatively higher voltage drop due to flooding caused by excess water formation. This could also be attributed to the counter-flow channel design wherein cell one was on the opposite end from the cathode air inlet. Several authors in the literature have documented similar experiences, where an individual cell experiences irregularities as a direct result of flooding phenomena [15,50]. Figure 10ii illustrates the uniform distribution effect of hydrogen recirculation in the anode side, which resulted in a negligible voltage drop. In addition, it was evident that cell one offered a superior performance with an improved voltage level of 0.685 V as opposed to 0.426 V in the previous case. Labels a, b, c, and d correspond to instances where individual cell voltage measurements were taken.

3.5. PEFC System Control

The PEFC system required dedicated instrumentation and software–hardware interfaces for the purpose of implementing a control strategy. For the former, these included current and voltage transducers and relative humidity, hydrogen, and temperature sensors. For the latter, LabVIEW software with a robust hardware interface was implemented. With such a software–hardware interface in place, a sampling rate of 1 µs, as well as real-time data monitoring and logging, was possible. The control system could react to events such as changes in electrical load demand by adjusting the cathode air flow rate, react to hydrogen gas leaks by initiating emergency shut down, and react to thermal imbalance due to temperature rise and the build-up of inert gases or water in the anode stream through periodic purging. Figure 11 illustrates these events through an experiment conducted with the stack BoP connected to a 5 kW electronic load. In the figure, label ‘1′ depicts the cathode blower reacting to a step change in the electrical power of the stack by increasing the air flow rate. Similarly, label ‘2′ depicts the stage where the BoP reacted to a temperature rise by turning on the radiator fan and adhering to ‘dead band’ threshold values of 55 and 54 °C. Label ‘3’ shows the predetermined periodic purge cycles where the purging valve was opened for a set duration of time. The frequency of the purge cycle was based on the charge transfer of the stack (Ah value).

4. Conclusions

In this paper, a complete control system for a dedicated BoP was proposed and experimentally validated. The cathode air blower, which was evidently also the biggest contributor towards PEFC parasitic loads, was experimentally modelled with the goal of minimising its use. An appropriate air SR value was obtained through a sensitivity analysis. Most importantly, the rationale for using hydrogen recirculation was presented, and a novel purging strategy based on the cumulative current flow parameter was evaluated. Our findings are in agreement with similar work by previous researchers and suggest that having a recirculation pump is advantageous. A sensitivity analysis of a key parameter, the air stoichiometric ratio, was performed. Our specific findings are summarised below:
A PEFC BoP requires attention and programming in four different subsystems: anode feed, cathode feed, thermal management, and electrical subsystems. Each of these require appropriately sized and calibrated devices.
A uniform reactant gas distribution in the anode channel reduces the need for frequent purges, thereby significantly improving the fuel utilisation. Additionally, our findings suggest that, with hydrogen recirculation, negligible voltage drops occur. However, there are capital costs attached to this scenario depending on the size and type of hydrogen recirculation pump.
A novel purging strategy, which was based on the cumulative Ah value, was proposed. The Ah parameter was assessed from the stack current using high accuracy current transducers and was independent of the stack operation time. The automated purging strategy was presented and experimentally validated on the 5 kW PEFC system while considering both anode feeding modes: dead-end anode with and without recirculation. It is evident from our results that in the case of the former, a full recovery from stack voltage drop was achievable.
Parasitic loads have a direct effect on system efficiency, with the cathode air blower being the biggest contributor. It is therefore imperative to minimise its use while maintaining stable performance. In our work, we presented a ‘black box’ modelling approach to experimentally model and validate the blower’s functionality. Our findings suggest that an air SR value of 4 is most appropriate for avoiding oxidant fuel starvation while not significantly adding to the parasitic loads.

Author Contributions

Conceptualisation, experimental work, data acquisition, test rig design, original report writing: N.K.; conceptualisation, supervision, methodology, editing Y.A.-S.; supervision, resources, funding acquisition, text revision and editing R.S.-W. All authors have read and agreed to the published version of the manuscript.

Funding

This research was funded by the Engineering and Physical Sciences Research Council (UK), under grant number EP/L006707/1. This support is gratefully acknowledged.

Institutional Review Board Statement

Not applicable.

Informed Consent Statement

Not applicable.

Data Availability Statement

The data that support the findings of this study are available on request from the corresponding author N.K.

Conflicts of Interest

The authors declare no conflict of interest.

Nomenclature

ηEfficiency [-]
AFRAir flow rate [slpm]
AhAmp-hour
VcellCell voltage [V]
NCell number
PstackStack power [W]
λStoichiometry ratio [-]
IstackStack current [A]
TsSampling time [s]
SLPMStandard litres per minute

References

  1. Jayakumar, A. A comprehensive assessment on the durability of gas diffusion electrode materials in PEM fuel cell stack. Front. Energy 2019, 13, 325–338. [Google Scholar] [CrossRef]
  2. Dicks, A.; Larminie, J.; Dicks, A.; Larminie, J.; Dicks, A. Fuel Cell Systems Explained, 2nd ed.; Wiley: West Sussex, Englan, 2003; ISBN 047084857X. [Google Scholar]
  3. Matsuura, T.; Chen, J.; Siegel, J.B.; Stefanopoulou, A.G. Degradation phenomena in PEM fuel cell with dead-ended anode. Int. J. Hydrogen Energy 2013, 38, 11346–11356. [Google Scholar] [CrossRef]
  4. Abbou, S.; Dillet, J.; Spernjak, D.; Mukundan, R.; Borup, R.L.; Maranzana, G.; Lottin, O. High Potential Excursions during PEM Fuel Cell Operation with Dead-Ended Anode. J. Electrochem. Soc. 2015, 162, F1212–F1220. [Google Scholar] [CrossRef]
  5. Dumercy, L.; Péra, M.C.; Glises, R.; Hissel, D.; Hamandi, S.; Badin, F.; Kauffmann, J.M. PEFC stack operating in anodic dead end mode. Fuel Cells 2004, 4, 352–357. [Google Scholar] [CrossRef]
  6. Knobbe, M.W.; He, W.; Chong, P.Y.; Nguyen, T.V. Active gas management for PEM fuel cell stacks. J. Power Sources 2004, 138, 94–100. [Google Scholar] [CrossRef]
  7. Jian, Q.; Luo, L.; Huang, B.; Zhao, J.; Cao, S.; Huang, Z. Experimental study on the purge process of a proton exchange membrane fuel cell stack with a dead-end anode. Appl. Therm. Eng. 2018, 142, 203–214. [Google Scholar] [CrossRef]
  8. Koski, P.; Viitakangas, J.; Ihonen, J. Determination of fuel utilisation and recirculated gas composition in dead-ended PEMFC systems. Int. J. Hydrogen Energy 2020, 45, 23201–23226. [Google Scholar] [CrossRef]
  9. Koski, P.; Pérez, L.C.; Ihonen, J. Comparing Anode Gas Recirculation with Hydrogen Purge and Bleed in a Novel PEMFC Laboratory Test Cell Configuration. Fuel Cells 2015, 15, 494–504. [Google Scholar] [CrossRef]
  10. Xu, L.; Fang, C.; Li, J.; Ouyang, M.; Lehnert, W. Nonlinear dynamic mechanism modeling of a polymer electrolyte membrane fuel cell with dead-ended anode considering mass transport and actuator properties. Appl. Energy 2018, 230, 106–121. [Google Scholar] [CrossRef]
  11. Tsai, S.W.; Chen, Y.S. A mathematical model to study the energy efficiency of a proton exchange membrane fuel cell with a dead-ended anode. Appl. Energy 2017, 188, 151–159. [Google Scholar] [CrossRef]
  12. Jang, J.H.; Yan, W.M.; Chiu, H.C.; Lui, J.Y. Dynamic cell performance of kW-grade proton exchange membrane fuel cell stack with dead-ended anode. Appl. Energy 2015, 142, 108–114. [Google Scholar] [CrossRef]
  13. Yang, Y.; Zhang, X.; Guo, L.; Liu, H. Overall and local effects of operating conditions in PEM fuel cells with dead-ended anode. Int. J. Hydrogen Energy 2017, 42, 4690–4698. [Google Scholar] [CrossRef] [Green Version]
  14. Lee, Y.; Kim, B.; Kim, Y. An experimental study on water transport through the membrane of a PEFC operating in the dead-end mode. Int. J. Hydrogen Energy 2009, 34, 7768–7779. [Google Scholar] [CrossRef]
  15. Zhao, J.; Jian, Q.; Huang, Z.; Luo, L.; Huang, B. Experimental study on water management improvement of proton exchange membrane fuel cells with dead-ended anode by periodically supplying fuel from anode outlet. J. Power Sources 2019, 435, 226775. [Google Scholar] [CrossRef]
  16. Ahluwalia, R.K.; Wang, X. Buildup of nitrogen in direct hydrogen polymer-electrolyte fuel cell stacks. J. Power Sources 2007, 171, 63–71. [Google Scholar] [CrossRef]
  17. Siegel, J.B.; Soc, J.E.; Siegel, J.B.; Bohac, S.V.; Stefanopoulou, A.G. Nitrogen Front Evolution in Purged Polymer Electrolyte Membrane Fuel Cell with Dead-Ended Anode Nitrogen Front Evolution in Purged Polymer Electrolyte Membrane Fuel Cell with Dead-Ended Anode. J. Electrochem. Soc. 2010, 157, B1081. [Google Scholar] [CrossRef] [Green Version]
  18. Chen, B.; Zhou, H.; He, S.; Meng, K.; Liu, Y.; Cai, Y. Numerical simulation on purge strategy of proton exchange membrane fuel cell with dead-ended anode. Energy 2021, 234, 121265. [Google Scholar] [CrossRef]
  19. Steinberger, M.; Geiling, J.; Oechsner, R.; Frey, L. Anode recirculation and purge strategies for PEM fuel cell operation with diluted hydrogen feed gas. Appl. Energy 2018, 232, 572–582. [Google Scholar] [CrossRef]
  20. Nikiforow, K.; Karimäki, H.; Keränen, T.M.; Ihonen, J. Optimization study of purge cycle in proton exchange membrane fuel cell system. J. Power Sources 2013, 238, 336–344. [Google Scholar] [CrossRef]
  21. Hu, Z.; Yu, Y.; Wang, G.; Chen, X.; Chen, P.; Chen, J.; Zhou, S. Anode purge strategy optimization of the polymer electrode membrane fuel cell system under the dead-end anode operation. J. Power Sources 2016, 320, 68–77. [Google Scholar] [CrossRef]
  22. He, H.; Quan, S.; Wang, Y.X. Hydrogen circulation system model predictive control for polymer electrolyte membrane fuel cell-based electric vehicle application. Int. J. Hydrogen Energy 2020, 45, 20382–20390. [Google Scholar] [CrossRef]
  23. Xie, C.; Xu, X.; Bujlo, P.; Shen, D.; Zhao, H.; Quan, S. Fuel cell and lithium iron phosphate battery hybrid powertrain with an ultracapacitor bank using direct parallel structure. J. Power Sources 2015, 279, 487–494. [Google Scholar] [CrossRef]
  24. Wang, B.; Deng, H.; Jiao, K. Purge strategy optimization of proton exchange membrane fuel cell with anode recirculation. Appl. Energy 2018, 225, 1–13. [Google Scholar] [CrossRef]
  25. Karimäki, H.; Pérez, L.C.; Nikiforow, K.; Keränen, T.M.; Viitakangas, J.; Ihonen, J. The use of on-line hydrogen sensor for studying inert gas effects and nitrogen crossover in PEMFC system. Int. J. Hydrogen Energy 2011, 36, 10179–10187. [Google Scholar] [CrossRef]
  26. Okedi, T.I.; Meyer, Q.; Hunter, H.M.A.; Shearing, P.R.; Brett, D.J.L. Development of a polymer electrolyte fuel cell dead-ended anode purge strategy for use with a nitrogen-containing hydrogen gas supply. Int. J. Hydrogen Energy 2017, 42, 13850–13859. [Google Scholar] [CrossRef] [Green Version]
  27. Nishizawa, A.; Kallo, J.; Garrot, O.; Weiss-Ungethüm, J. Fuel cell and Li-ion battery direct hybridization system for aircraft applications. J. Power Sources 2013, 222, 294–300. [Google Scholar] [CrossRef]
  28. Liu, Z.; Li, L.; Ding, Y.; Deng, H.; Chen, W. Modeling and control of an air supply system for a heavy duty PEMFC engine. Int. J. Hydrogen Energy 2016, 41, 16230–16239. [Google Scholar] [CrossRef]
  29. Kim, B.J.; Kim, M.S. Studies on the cathode humidification by exhaust gas recirculation for PEM fuel cell. Int. J. Hydrogen Energy 2012, 37, 4290–4299. [Google Scholar] [CrossRef]
  30. Calili, F.; Ismail, M.S.; Ingham, D.B.; Hughes, K.J.; Ma, L.; Pourkashanian, M. A dynamic model of air-breathing polymer electrolyte fuel cell (PEFC): A parametric study. Int. J. Hydrogen Energy 2021, 46, 17343–17357. [Google Scholar] [CrossRef]
  31. Yang, D.; Pan, R.; Wang, Y.; Chen, Z. Modeling and control of PEMFC air supply system based on T-S fuzzy theory and predictive control. Energy 2019, 188, 116078. [Google Scholar] [CrossRef]
  32. Lee, H.Y.; Su, H.C.; Chen, Y.S. A gas management strategy for anode recirculation in a proton exchange membrane fuel cell. Int. J. Hydrogen Energy 2018, 43, 3803–3808. [Google Scholar] [CrossRef]
  33. Chen, B.; Cai, Y.; Yu, Y.; Wang, J.; Tu, Z.; Hwa, S. Gas purging effect on the degradation characteristic of a proton exchange membrane fuel cell with dead-ended mode operation II. Under different operation pressures. Energy 2017, 131, 50–57. [Google Scholar] [CrossRef]
  34. Shen, K.; Park, S.; Kim, Y. Hydrogen utilization enhancement of proton exchange membrane fuel cell with anode recirculation system through a purge strategy. Int. J. Hydrogen Energy 2020, 45, 16773–16786. [Google Scholar] [CrossRef]
  35. Brunner, D.A.; Marcks, S.; Bajpai, M.; Prasad, A.K.; Advani, S.G. Design and characterization of an electronically controlled variable flow rate ejector for fuel cell applications. Int. J. Hydrogen Energy 2011, 37, 4457–4466. [Google Scholar] [CrossRef]
  36. Zhang, Q.; Tong, Z.; Tong, S. Effect of cathode recirculation on high potential limitation and self-humidification of hydrogen fuel cell system. J. Power Sources 2020, 468, 228388. [Google Scholar] [CrossRef]
  37. Park, H. Effect of the hydrophilic and hydrophobic characteristics of the gas diffusion medium on polymer electrolyte fuel cell performance under non-humidification condition. Energy Convers. Manag. 2014, 81, 220–230. [Google Scholar] [CrossRef]
  38. Chen, X.; Xu, J.; Liu, Q.; Chen, Y.; Wang, X.; Li, W.; Ding, Y.; Wan, Z. Active disturbance rejection control strategy applied to cathode humidity control in PEMFC system. Energy Convers. Manag. 2020, 224, 113389. [Google Scholar] [CrossRef]
  39. Daud, W.R.W.; Rosli, R.E.; Majlan, E.H.; Hamid, S.A.A.; Mohamed, R.; Husaini, T. PEM fuel cell system control: A review. Renew. Energy 2017, 113, 620–638. [Google Scholar] [CrossRef]
  40. Zou, W.J.; Kim, Y.B. Temperature Control for a 5 kW Water-Cooled PEM Fuel Cell System for a Household Application. IEEE Access 2019, 7, 144826–144835. [Google Scholar] [CrossRef]
  41. Lee, H.S.; Cho, C.W.; Seo, J.H.; Lee, M.Y. Cooling performance characteristics of the stack thermal management system for fuel cell electric vehicles under actual driving conditions. Energies 2016, 9, 320. [Google Scholar] [CrossRef] [Green Version]
  42. Steiner, N.; Marra, D.; Sorrentino, M.; Pianese, C.; Wang, K.; Hissel, D.; Pe, M.C.; Monteverde, M.; Cardone, P.; Saarinen, J. A Review on solid oxide fuel cell models. Int. J. Hydrogen Energy 2011, 6. [Google Scholar] [CrossRef]
  43. O’Hayre, R.; Cha, S.; Colella, W.G.; Prinz, F.B. Fuel Cell Fundamentals, 3rd ed.; Wiley: Hoboken, NJ, USA; ISBN 9781119113805.
  44. Pei, P.; Chen, H. Main factors affecting the lifetime of Proton Exchange Membrane fuel cells in vehicle applications: A review. Appl. Energy 2014, 125, 60–75. [Google Scholar] [CrossRef]
  45. Chen, H.; Zhao, X.; Zhang, T.; Pei, P. The reactant starvation of the proton exchange membrane fuel cells for vehicular applications: A review. Energy Convers. Manag. 2019, 182, 282–298. [Google Scholar] [CrossRef]
  46. Liu, Z.; Yang, L.; Mao, Z.; Zhuge, W.; Zhang, Y.; Wang, L. Behavior of PEMFC in starvation. J. Power Sources 2006, 157, 166–176. [Google Scholar] [CrossRef]
  47. Palani, S.; Subramanian, S.C.; Chetty, R. Component sizing based on multi-objective optimization for a fuel cell hybrid vehicle. Proceedings of 2019 6th International Conference on Control, Decision and Information Technologies (CoDIT), Paris, France, 23–26 April 2019; pp. 434–439. [Google Scholar] [CrossRef]
  48. Ramos-paja, C.A.; Member, S.; Giral, R.; Martinez-salamero, L.; Romano, J.; Romero, A.; Spagnuolo, G.; Member, S. A PEM Fuel-Cell Model Featuring Oxygen-Excess-Ratio Estimation and Power-Electronics Interaction. IEEE Trans. Ind. Electron. 2010, 57, 1914–1924. [Google Scholar] [CrossRef]
  49. Lin, Y.F.; Chen, Y.S. Experimental study on the optimal purge duration of a proton exchange membrane fuel cell with a dead-ended anode. J. Power Sources 2017, 340, 176–182. [Google Scholar] [CrossRef]
  50. Migliardini, F.; Di Palma, T.M.; Gaele, M.F.; Corbo, P. Hydrogen purge and reactant feeding strategies in self-humidified PEM fuel cell systems. Int. J. Hydrogen Energy 2017, 42, 1758–1765. [Google Scholar] [CrossRef]
Figure 1. PEFC system P&ID diagram with the Balance of Plant.
Energies 15 00288 g001
Figure 2. (a) Anode subsystem experimental setup and (b) cathode subsystem design.
Energies 15 00288 g002
Figure 3. (a) Stack and system efficiency curves and (b) stack polarisation and power curves.
Energies 15 00288 g003
Figure 4. Example of parasitic load power consumption during step changes of stack power.
Energies 15 00288 g004
Figure 5. Cathode blower power consumption over stack power and air stoichiometry ratio.
Energies 15 00288 g005
Figure 6. Sensitivity analysis of the impact of air SR value: (a): SR = 2; (b): SR = 3; (c): SR = 4; (d): SR = 5; (e): full load test at SR = 4.
Energies 15 00288 g006
Figure 7. Flowchart describing the purging strategy’s operation.
Energies 15 00288 g007
Figure 8. Outcome of hydrogen purging experiments without recirculation.
Energies 15 00288 g008
Figure 9. Hydrogen purging experimental outcome with recirculation.
Energies 15 00288 g009
Figure 10. CVM data for the stack with anode recirculation: (d,ii); without recirculation: (ac,i).
Energies 15 00288 g010aEnergies 15 00288 g010b
Figure 11. Illustration of PEFC system control—1: blower reacting to higher air flow rate requirement; 2: dead band temperature control; 3: purging event based on a set Ah value.
Energies 15 00288 g011
Table 1. PEFC stack specifications.
ItemValue
PEFC StackNumber of cells58
Open circuit voltage (V)56.5
Nominal power (W)5000
Peak power (W)5600
Estimated active cell area (cm2)200
Flow field material (design)Graphite
Weight (kg)52
Stack voltage range (V)39–56.5
Peak stack current (A)130
Hydrogen/fuel supply subsystemControllable BLDC (*) diaphragm recirculation pump
Recirculation flow rate range (slpm)
24VDC, 2.5 A
0–66
Hydrogen feed pressure (bar)1.3
Purge solenoid valve (normally closed)24 VDC
Purge frequency at max power (DE mode)10 per hour
Purge frequency at max power (recirculation mode)2 per hour
Air feed subsystemControllable BLDC cathode air blower48 VDC, 400 W
Blower max. flow rate (slpm)2689
Blower range with stack geometry (slpm)0–675
Max required air flow rate (slpm)658
External/passive air humidifierShell and tube
Thermal management subsystemRadiatorAir-cooled, fin type
Coolant typeDe-ionised water
Coolant pump48 VDC, 1.5 A
Data Acquisition/Control SystemNational Instruments cRIO 9054
Maximum Sampling rate250 kS/s
Electronic LoadModular variable DC (I-mode, U-mode or G-mode)
Max voltage and current 800 V, 200 A
SensorsCell voltage monitoring (CVM) unit
Temperature sensor × 2
Current transducers × 6
Voltage transducers × 2
Pressure sensor × 1
Relative humidity sensor × 1
Mass flow meterHydrogen sensor × 1
(*) brushless direct current
Publisher’s Note: MDPI stays neutral with regard to jurisdictional claims in published maps and institutional affiliations.

