Review

A Review of Modelling of the FCC Unit–Part I: The Riser

Department of Chemical Engineering, Faculty of Engineering and Informatics, University of Bradford, Bradford BD7 1DP, UK
*
Author to whom correspondence should be addressed.
Energies 2022, 15(1), 308; https://doi.org/10.3390/en15010308
Submission received: 16 October 2021 / Revised: 6 December 2021 / Accepted: 28 December 2021 / Published: 3 January 2022
(This article belongs to the Section I1: Fuel)

Abstract

:
Heavy petroleum industries, including the fluid catalytic cracking (FCC) unit, are useful for producing fuels but they are among some of the biggest contributors to global greenhouse gas (GHG) emissions. The recent global push for mitigation efforts against climate change has resulted in increased legislation that affects the operations and future of these industries. In terms of the FCC unit, on the riser side, more legislation is pushing towards them switching from petroleum-driven energy sources to more renewable sources such as solar and wind, which threatens the profitability of the unit. On the regenerator side, there is more legislation aimed at reducing emissions of GHGs from such units. As a result, it is more important than ever to develop models that are accurate and reliable, that will help optimise the unit for maximisation of profits under new regulations and changing trends, and that predict emissions of various GHGs to keep up with new reporting guidelines. This article, split over two parts, reviews traditional modelling methodologies used in modelling and simulation of the FCC unit. In Part I, hydrodynamics and kinetics of the riser are discussed in terms of experimental data and modelling approaches. A brief review of the FCC feed is undertaken in terms of characterisations and cracking reaction chemistry, and how these factors have affected modelling approaches. A brief overview of how vaporisation and catalyst deactivation are addressed in the FCC modelling literature is also undertaken. Modelling of constitutive parts that are important to the FCC riser unit such as gas-solid cyclones, disengaging and stripping vessels, is also considered. This review then identifies areas where current models for the riser can be improved for the future. In Part II, a similar review is presented for the FCC regenerator system.

1. Introduction

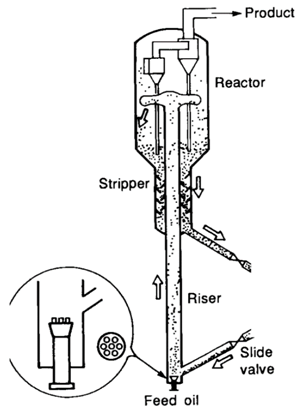
The aim of refinery operations is the transformation of the complex crude oil mixture into useful products. The crude oil is distilled into products such as liquefied petroleum gas (LPG), gasoline, kerosene, jet fuel, diesel and some fuel oils. The bottoms of the distillation products such as gas oil are usually heavy or high molecular weight products which are of low value. These bottoms are then sent to the fluid catalytic cracking (FCC) unit where they are catalytically cracked into lighter and more valuable products. Several configurations (such as the Exxon Models, Universal Oil Products (UOP) staked units and Kellogg’s Heavy Oil Cracker (HOC) unit) of the FCC unit have been developed and used commercially over the more than six decades that the unit has existed, but they are generally similar in that they are essentially a two-reactor system [1] consisting of the riser-reactor and the regenerator. Typical operating conditions of the riser are shown in Table 1. In the riser-reactor, hot porous catalyst particles from the regenerator are brought into contact with the gas oil feed and the lifting steam. Upon contact, the gas oil is vaporised and cracked into lower molecular weight compounds [2]. Additionally, coke is also produced as a by-product of the cracking reactions, which lowers the activity of the catalyst as it blocks access of the vaporised gas oil to the active site on the catalyst. The deactivated catalyst is sent to the regenerator where coke on the catalyst is burned off. The regenerator then has two main functions: to burn off the coke on the catalyst to regain the catalyst’s activity, and to provide the heat needed to drive the endothermic cracking reactions in the riser-reactor via the exothermic combustion reactions [2].
The ability to model the FCC unit has been the subject of a lot of research during the lifetime of the unit. The prediction of the behaviour of any chemical reactors requires that information on reaction stoichiometry, thermodynamics, heat and mass transfer, reaction kinetics and lastly flow or mixing patterns of the material inside the reactor be available [3,4]. Furthermore, the FCC unit is notoriously difficult to model due to the size of the process, complicated hydrodynamics, and complex reaction kinetics, especially in the riser [5,6]. Both the riser and the regenerator are fluidised bed reactors; Table 1 shows the normal operating conditions of the FCC riser. The regenerator operates in the bubbling/turbulent regime of fluidisation while the riser is a circulating fluidised bed vessel in fast fluidisation [7]. Flow in these regimes for Geldart group A particles has been investigated through experimental studies published in the literature [8,9,10,11,12]. Consequently, these studies inform the assumptions made during modelling of the unit [7]. Typically, two types of model of FCC units are seen in the literature [13]: (i) one or two dimensional (1D/2D) models from traditional reaction engineering approaches; and (ii) models employing computational fluid dynamics (CFD). In both cases, modelling involves development of differential equations for mass, momentum and thermal balances. In the former the flow field is usually averaged over the cross-sectional area or the volume to create a 1/2D system; however, the latter are much more involved and more computationally expensive describing flow at the micro- scale in all three dimensions (3D) compared to the former which are interested in the macro scale. For this reason, CFD techniques usually require specialist software such as Ansys Fluent. Nevertheless, both modelling approaches are being used in the present climate. Riser models published since the 1960s have varied in complexity and with varying objectives. Early papers on FCC riser modelling were mostly concerned with lumped reaction scheme kinetics [14,15,16,17,18]. In the 1990s, attention turned to the modelling of the FCC unit to investigate the bifurcation or multiplicity of the steady state [19,20] during steady state simulations. This is also the period when mechanistic kinetic models of FCC riser reactions were developed using understanding of the reaction chemistry of the complex riser mixture [21,22,23]. Post-2000 saw an explosion in the adoption of CFD to model and simulate the FCC riser and its constitutive parts in order to study flow patterns and yields in reactive CFD simulations. Recently, there have also been papers published on FCC riser optimisation to meet changing global demand trends [24,25,26], such as increased demand for propylene [27], and modelling of the riser using unconventional feeds such as bio-oils [28,29,30]. Evidently, the literature on the modelling and simulation of the riser is now vast and varied, and this is the subject of the present work.
There currently exist only a few reviews on the modelling of FCC units present in the literature. Grace [31] produced a review of the critical areas in fluid bed reactor modelling. They summarised different hydrodynamic models of reactor flow, and gas mixing in the dense phase of bubbling fluidised beds, an area they identified as needing further work since due to the lack of agreement about how it should be treated. They also reviewed the state of modelling of interphase gas mass transfer.
Table 1. Dimensions and operating conditions of fluid catalytic cracking (FCC) unit, [1,5,7,32,33].
Riser
Dimensions
Energies 15 00308 i001Height30–40 m
Diameter1–2 m
Operating Conditions
Gas oil inlet T150–300 °C
Catalyst inlet T675–750 °C
Solid circulation>250 kg/m2s
Catalyst to Oil (CTO)4–10 wt%
Dispersion steam 0–5 wt%
Pressure150–300 kPa
Solid Residence3–15 s
Catalyst Properties
Average size70 µm
Density 1200–1700 kg/m2s
Typical U mf 0.001   m/s
Geldart Group A
Berruti et al. [32] have produced a comprehensive review of gas–solid flow in circulating fluidised bed reactors such as FCC risers. They explain and analyse Harris and Davidson [34]’s Type 1 models that predict only axial variation of the solid suspension, and Type 2 models that predict only radial variation by assuming multiple regions in the flow e.g., core-annulus or clustering annular flow. Berruti et al. [32] have summarised Type 3 models in terms of CFD modelling of hydrodynamics of riser-type reactors. Godfroy et al. [35] have compared different models with axial and/or radial variation against experimental data. Gupta et al. [36] reviewed literature on kinetic models of the FCC riser. They have also briefly reviewed hydrodynamics of the riser and paid particular attention to the vaporisation section of the riser. Pinheiro et al. [13] produced a comprehensive review of the entire FCC process, focusing on developments in modelling and optimisation. They have also tackled the issue of steady state multiplicity in the FCC unit and its origin. Pinheiro et al. [13] have explained in detail the literature and theory of process control of the FCC process. Vashisth et al. [37] have reviewed the computational fluid dynamics modelling of the bubbling bed behaviour of FCC catalyst particles in terms of two fluid models and particle-fluid models. However, their analysis was only concerned with the hydrodynamics of the flow and not the reactive system. Shah et al. [7] summarised literature on gas-solid flow in riser type reactors and presented a critical review of CFD models of FCC risers then compared the model predictions against experimental results that are available in the literature. They have reviewed the impact on model predictions of different closure models that are employed in CFD problems such as drag models, viscous models and kinetic models. They have also summarised the linking of riser hydrodynamic models and lumped cracking kinetics in CFD modelling. Madhusudana Rao et al. [38] have reviewed the use of object-oriented modelling of the FCC unit in industry. They describe in detail the concept and the methodology of object-oriented process modelling in the multipurpose process simulator (MPROSIM) framework and review the application of this framework in the case of the FCC unit. Tuning of the model in MPROSIM and parameter optimisation are also covered in the paper. These papers are summarised in Table 2.
The work described in Table 2 shows that various aspects of modelling the FCC unit have already been thoroughly reviewed with such reviews available in the literature. However, a comprehensive review of traditional FCC unit modelling approaches is evidently lacking in the literature. Of note is the lack of reviews that link experimental findings of operations of FCC unit to the traditional modelling approaches and the simulation results obtained from said models. The current study presents a review of the riser modelling and analysis of the experimental data that have led to the assumptions made in modelling. The modelling has been divided in terms of kinetics, where treatments of reaction rate equations, rate constants and orders of reactions are considered, and in terms of hydrodynamics, where gas–solid mixing behaviour, flow, heat and mass transfer in the reactor are considered. The literature on the current understanding of carbenium ion reaction chemistry of the riser is also reviewed, and this leads to the development of exciting mechanistic kinetic models such as the single event kinetics that employ detailed explicit description of rection pathways, in contrast to the simple lumped kinetics methodology. Additionally, treatment of clusters and the subsequent flow heterogeneity in the riser reactor are also considered. Constitutive units such as the disengaging and stripping section that are important to the FCC reactor exit flows and dynamics are considered in terms of modelling. Finally, the deficiencies of current traditional modelling approaches are identified for each unit and recommendations for further work are made.

2. Fluid Catalytic Cracking (FCC) Riser

A review of the kinetic modelling of the FCC riser establishes three main aspects that govern the modelling approach. Firstly, the description or characterisation of the reaction mixture (feed and product). Kinetic modelling often requires an understanding of reacting species and reactions occuring, however, because of the complexity of the reacting mixture in the FCC riser some considerations are needed to describe the mixture. Secondly, the mechanism of reactions involved in the riser is generally well understood now, however for kinetic studies this is usually linked to the level of detail used in describing the reaction mixture. Lastly, the parameters resulting from the model, such as frequency factors and activation energies, are also important considerations, especially for lumped models in which these parameters are empirical and usually take values depending on the feed and catalyst used. In this chapter, we give a brief overview of these aspects of kinetic modelling and describe how they are relevant in different types of kinetic model.

2.1. Feed and Product Characterisation

Refineries process various types of crude oil depending on geological location. Additionally, market demands, and crude quality also fluctuates within a geological location which means that the conventional gas oil feed to the FCC unit will continuously change in feedstock quality [39]. Many sophisticated analytical techniques have been used by researchers to determine the physical and chemical properties of the gas oil feed and subsequent products, which is quite relevant to the modelling of the FCC riser. Behera et al., and Naik et al. [29,40] have reported 1H and 13C nuclear magnetic resonance (NMR) spectra of vacuum gas oil FCC feed, in each case various gas oil feeds from different refineries were investigated.
These spectra have given a closer look at the proton and carbon environments present in the different molecular components of gas oil. According to Behera, Naik and their teams [29,40] the peaks present in 1H NMR spectra can be divided into three different proton regions: aromatic hydrogens (chemical shift 6–9 ppm), aliphatic hydrogens (chemical shift 0–4.5 ppm) and olefinic hydrogens (chemical shift 4.5–6 ppm). Additionally, the 13C NMR spectra can be divided into aliphatic (0–50 ppm), alcoholic (50–110 ppm), aromatic carbons (110–150 ppm) and carboxylic carbons (150–200 ppm). The disadvantage of analysis of 1H and 13C spectra is the overlap of resonances, particularly for the CH , CH 2 and CH 3 in the case of 13C, and the minimal chemical shift dispersivity in 1H, which makes it different to distinguish certain groups. For example, Behera et al. [40] have found a strong overlap of naphthenic carbons in the aliphatic region corresponding to 20–44 ppm and 23–45 ppm). In order to circumvent this issue, researchers [40] have used distortionless enhancement by polarisation transfer (DEPT) to improve spectral assignments by identifying various substructures for more reliable quantitative interpretation. The result showed that there are a variety of resonances present in the region 25–50 ppm corresponding to the different CH n environments. Similar exercises could be undertaken for the proton regions to distinguish between different proton environments. Naik et al. [29] have further subdivided the hydrogen environments into H α (2–4.5 ppm), H β (1–2 ppm) and H γ (0.5–1 ppm). Further chemical shift assignment of the gas oil can be found in the work of Behera and colleagues [40] and references therein. This data from NMR studies paints a very clear picture of the complexity of the structures of the different chemical components of the FCC gas oil feed, and subsequently the product gas phase. Nevertheless, it is possible, based on these structural variations, that the components of the feed and products can be grouped into aliphatics, naphthenics and aromatics. Aliphatics are linear and/or open branched hydrocarbons, which can be subdivided into olefins (unsaturated) and paraffins (saturated). Naphthenes are ring-shaped alkanes while aromatics are based on unsaturated benzene rings [39]. This is the so called ‘PONA’ classification that is commonly used in petroleum refinery to characterise crude oil fractions [41]. Rodriguez et al. [42] have reported GC × GC analysis of vacuum gas oil to study the relative amounts of each group of compounds in typical FCC feed, they have found that the feed is 62.3   wt % aromatics, 29.2   wt % naphthenes, 8.5   wt % paraffins, and 5.5   wt %   sulphurous compounds. But of course, these values will be different for different crude oils. Although the above NMR data give some information on the structure of the hydrocarbon components of feed and products of the FCC riser, they give no information on the size of the hydrocarbon chains and is limited by the sheer number of molecular components present in the mixture [29].
The gas oil feed is made up of great number of hydrocarbon molecules, together with a relatively small quantity of impurities such as sulphur, nitrogen and metals, differing in molecular weight, chemical composition and structure [43]. Due to the complexity in the composition of the feed, it is impossible to analyse the individual components of the gas oil, hence often in refinery operations the composition of the mixture is characterised in terms of large distillation cuts that are based on boiling point range and carbon number: gasoline ( 30 215   ° C ,   C 5 C 12 ), kerosene ( 180 240   ° C ,   C 11 C 15 ), diesel ( 240 360   ° C ,   C 15 C 25 ), vacuum gas oil ( 360 540   ° C ,   C 25 C 45 ) and vacuum residuals ( > 540   ° C , > C 45 ) [43]. Other fractions may be defined depending on the existing refinery equipment capabilities (e.g., rectifiers and separators). Because the cuts are usually related to the final-end use, the composition of the cuts in the gas oil is usually of importance to both marketing and the economics of the process. FCC feed typically has a higher composition of the higher boiling point range which are converted to products mixture with a higher composition of the more useful and valuable lower boiling point range cuts. Typical compositions of FCC feed and products are shown in Table 3. A broader characterisation of the feed may be obtained from true boiling point (TBP) curves, which are a plot of the cumulative mass or volume distillation with increasing boiling point. The shape of the TBP curve depends on the volatility of the components in a given gas oil, such that this curve may be unique to the composition of a given FCC feed [44]. Figure 1 shows an example TBP plot for crude oil, showing a possible link between distillation cut and chemical composition. The TBP distillation is one of the most commonly used experimental procedure employed to characterise gas oil feeds [44], and researchers have used them as pseudo-component analysis where there are specific cuts in generative product distributions from the FCC unit [45], and therefore to influence the pricing of such feeds. From the TBP curve, information about the relative volatility and, therefore, size distribution, of the components of the gas oil mixture may be acquired. However, it is still impossible from this analysis to gain insight about individual components in the mixture.

2.2. Reactions in the FCC Riser

Catalytic cracking of hydrocarbons in the gas oil feed is generally believed to be a chain reaction that proceeds via carbenium ion theory [46,47] proposed by Whitmore et al. [48]. The mechanism involves three steps: initiation, propagation and termination. These reactions are thought to occur on the acid sites of the zeolite catalyst. The carbenium ions produced on the active sight can undergo several reactions such as isomerism, alkylation, β -scission and hydride transfer.
  • Initiation: this is the first step that kicks off the cracking reactions. It is characterised by attack of an active sight on a reacting molecule to produce an activated complex (i.e., a carbocation). Initiation in the case of an olefin molecule is thought to proceed via the direct attack of a Br ö nsted acid site on the reactant double bond to form a carbenium ion [47]. This is the mechanism that would be expected for gaseous olefins, such as the case in the FCC riser [49]. On the other hand, there is some debate over the exact mechanism in which paraffins are activated, early work [50,51] suggested that activation of paraffins required the existence, even in small quantities, of olefins. In this mechanism, carbenium ion from the olefins (via the method described above for olefins) would abstract a hydride ion on a nearby paraffin to generate an activated paraffin carbenium ion. For a while, this mechanism was essentially correct [47], but its insufficiencies in accounting for observed complex product distributions warranted concern [52]. However, later Haag and Dessau [53,54] proposed a direct protonation method of the paraffin (the so-called Haag-Dessau mechanism), that drew inspiration from the 1994 Chemistry Nobel Prize winning work of George A. Olah (for contributions to the chemistry of hydrocarbons in super-acidic solutions) and did not require the presence of olefins in the activation of paraffins. Via this mechanism, a Br ö nsted acid site directly protonates the paraffin reactant molecule forming a carbonium ion complex which collapses by bond scission to give a carbenium ion. The protonation produces a carbenium ion together with either an alkane (in the event of a C C bond scission) or hydrogen (in the event of a C H bond scission) [53,54]. The Haag–Dessau mechanism gained some acceptance as it was supported by some researchers [55,56,57,58]. Furthermore, activation of paraffins by Lewis sites has also been proposed [46,59] involving the abstraction of a hydride from an alkane by a Lewis site resulting in a carbenium ion formation. However, evidence from [60,61] has questioned the contribution of Lewis sites. Nevertheless, more paraffin activation mechanisms have been suggested [62,63,64,65]. Generally, all these mechanisms agree that the initiation step will produce a carbenium ion, the subsequent steps after that become relatively routine and generally agreed upon by most researchers. Initiation of both olefins and paraffins is shown in Figure 2a,b.
  • Propagation: this involves the transfer of a hydride ion from an adsorbed carbenium ion to a reactant molecule, and always results in the formation of another carbenium ion [47]. Simply put, a carbenium ion reacts with a paraffin or olefin so that another carbenium ion is formed in the process. In the case of a paraffin molecule interacting with a surface carbenium ion, it has been proposed that the chain propagation occurs when the carbocation abstracts a hydride ion on the reactant paraffin. The former carbocation then desorbs from the surface as a paraffin when the former paraffin is left adsorbed as a carbenium ion. The resulting carbenium ion can then either isomerise and/or crack further, which means the chain process continues. When the cracking occurs via protolytic attack or β -scission, the resulting product is an olefin or a paraffin, respectively. Additionally, it is also thought that adsorbed carbenium ions may undergo 1,2 hydrogen shift so that the positive charge can migrate across the molecule giving a possibility of branching [47]. See Figure 2c for possible propagation mechanisms in the riser.
  • Termination: this involves the desorption of the adsorbed carbenium ion to give an olefin, whilst restoring the active site to its initial state [47]. This step results in the termination of an active carbenium ion, thereby completing the chain.
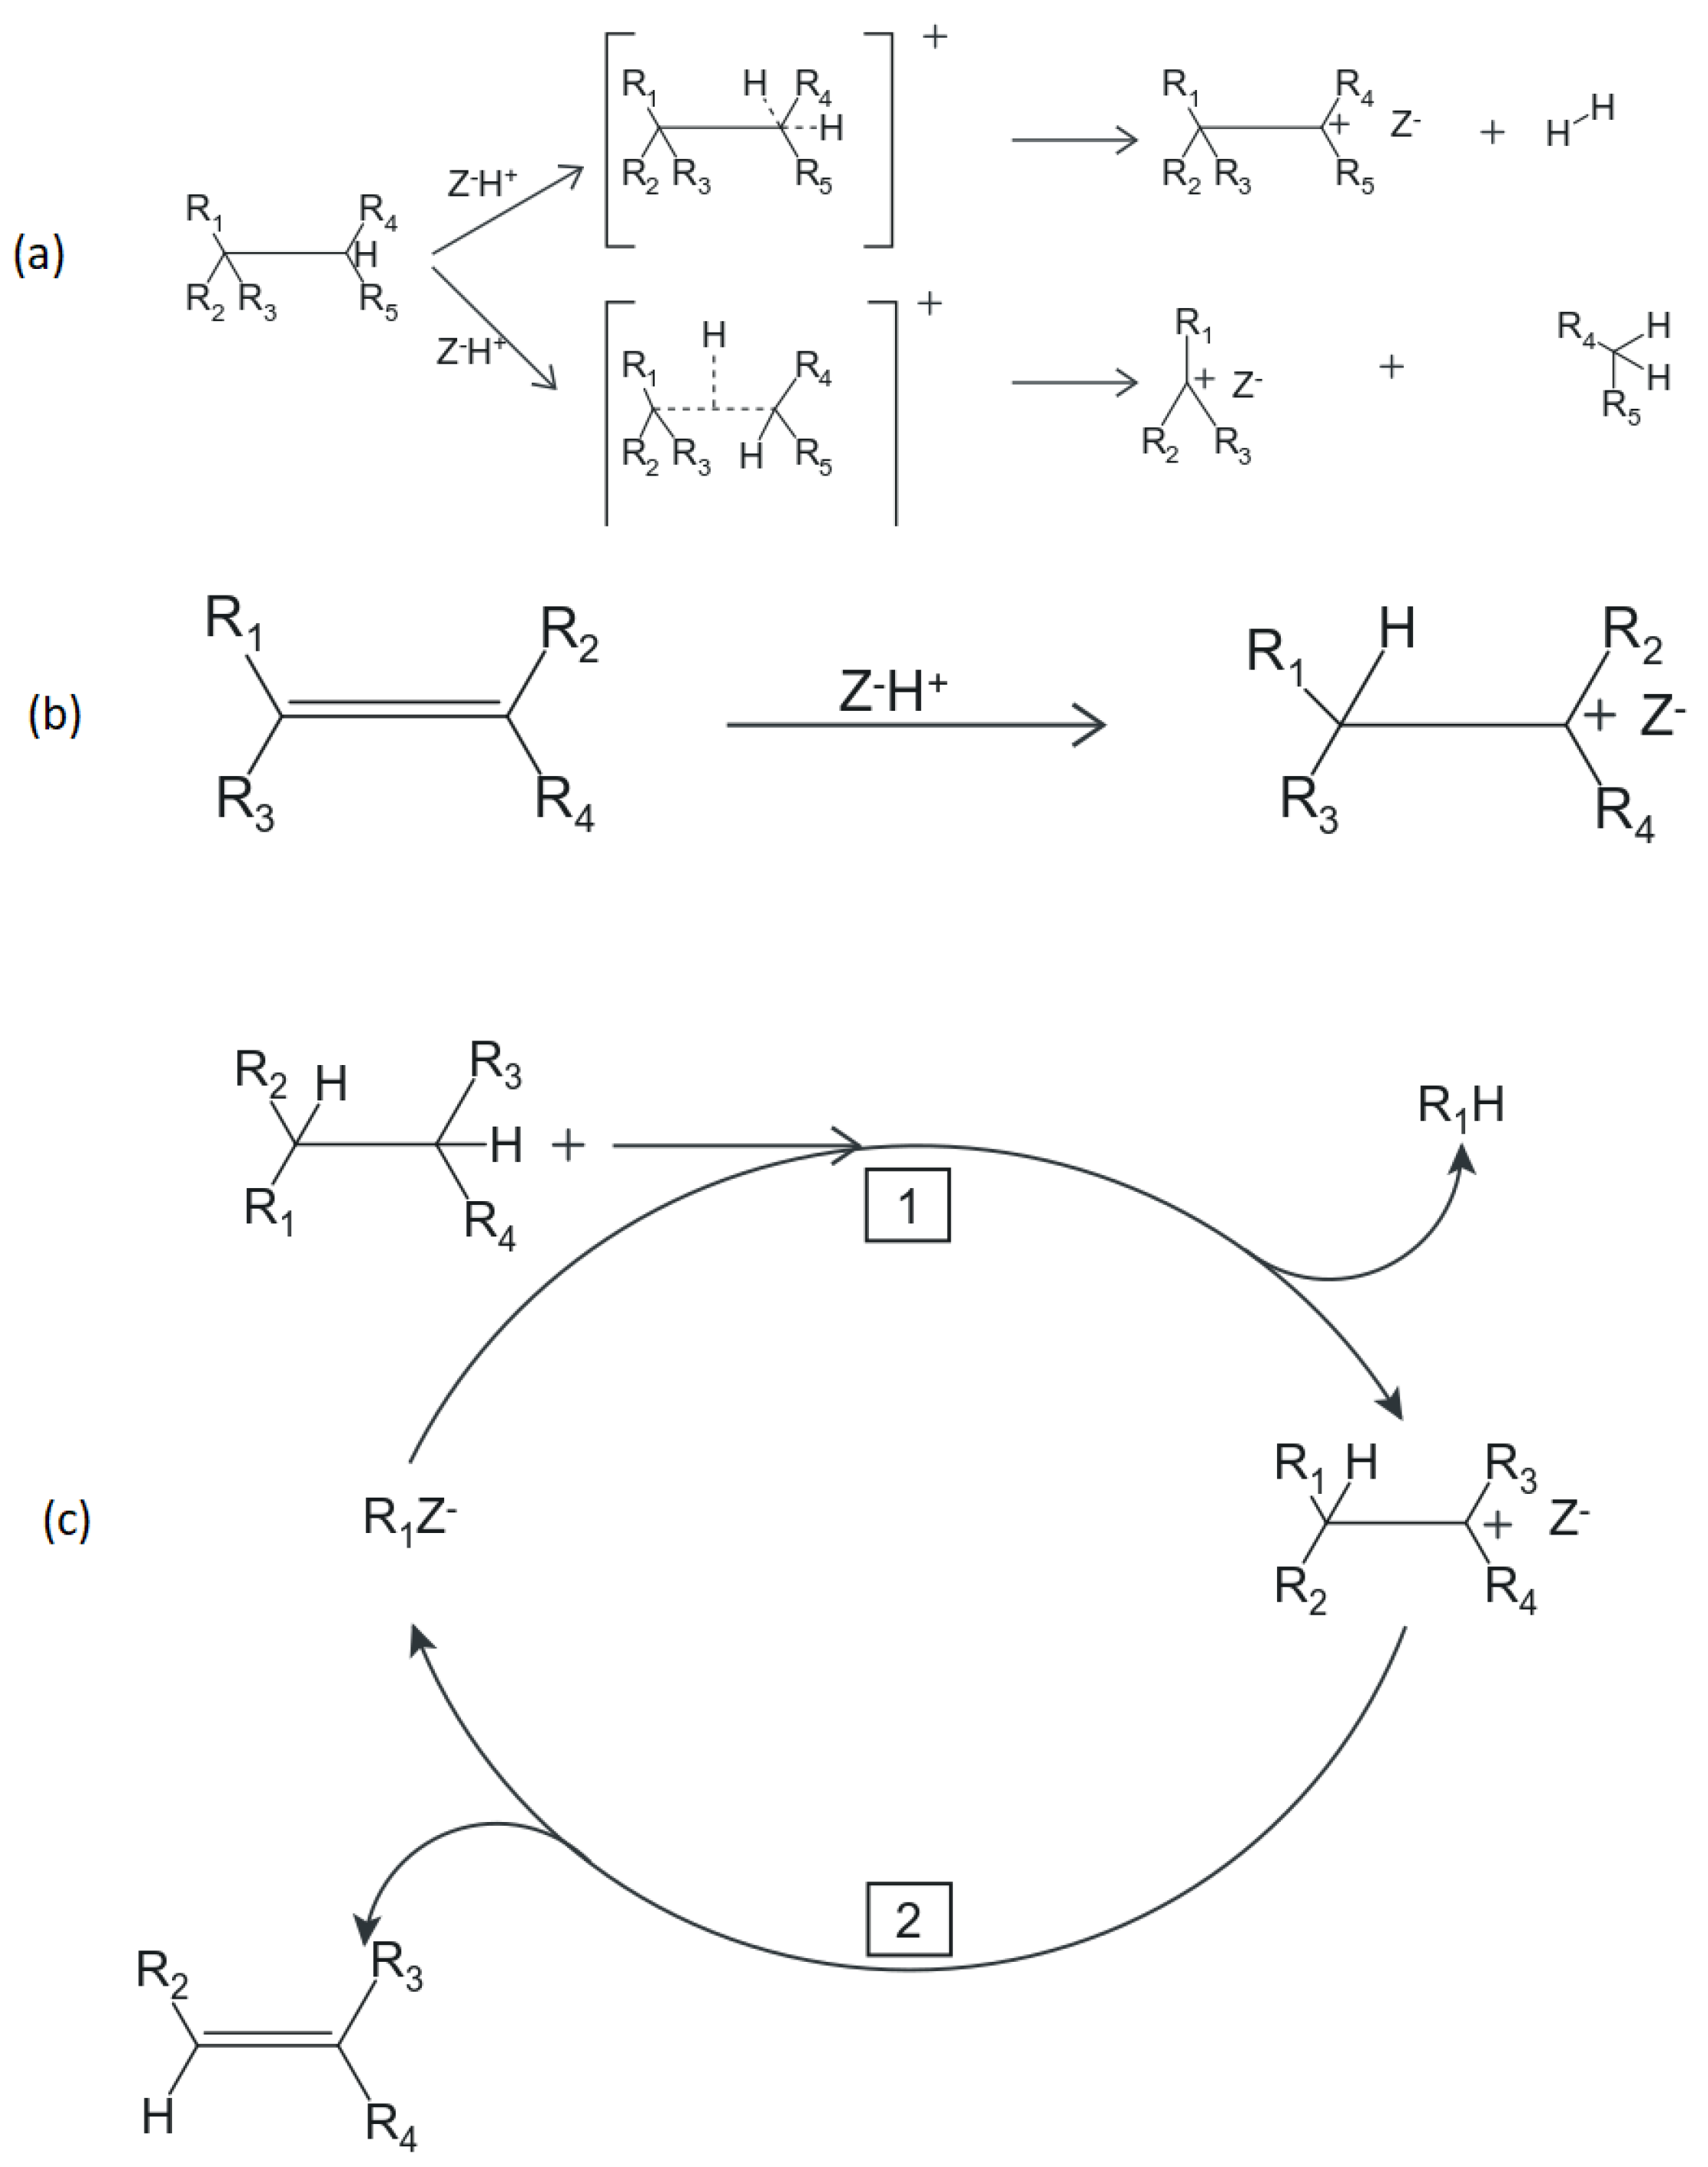
Figure 2. (a) Haag–Dessau mechanism for initiation of paraffin, (Adapted from [66]) (b) initiation mechanism of olefins, (c) propagation mechanism involving carbenium ions (1: Hydride transfer, 2: β-scission) (Adapted from [66]).
Energies 15 00308 g002
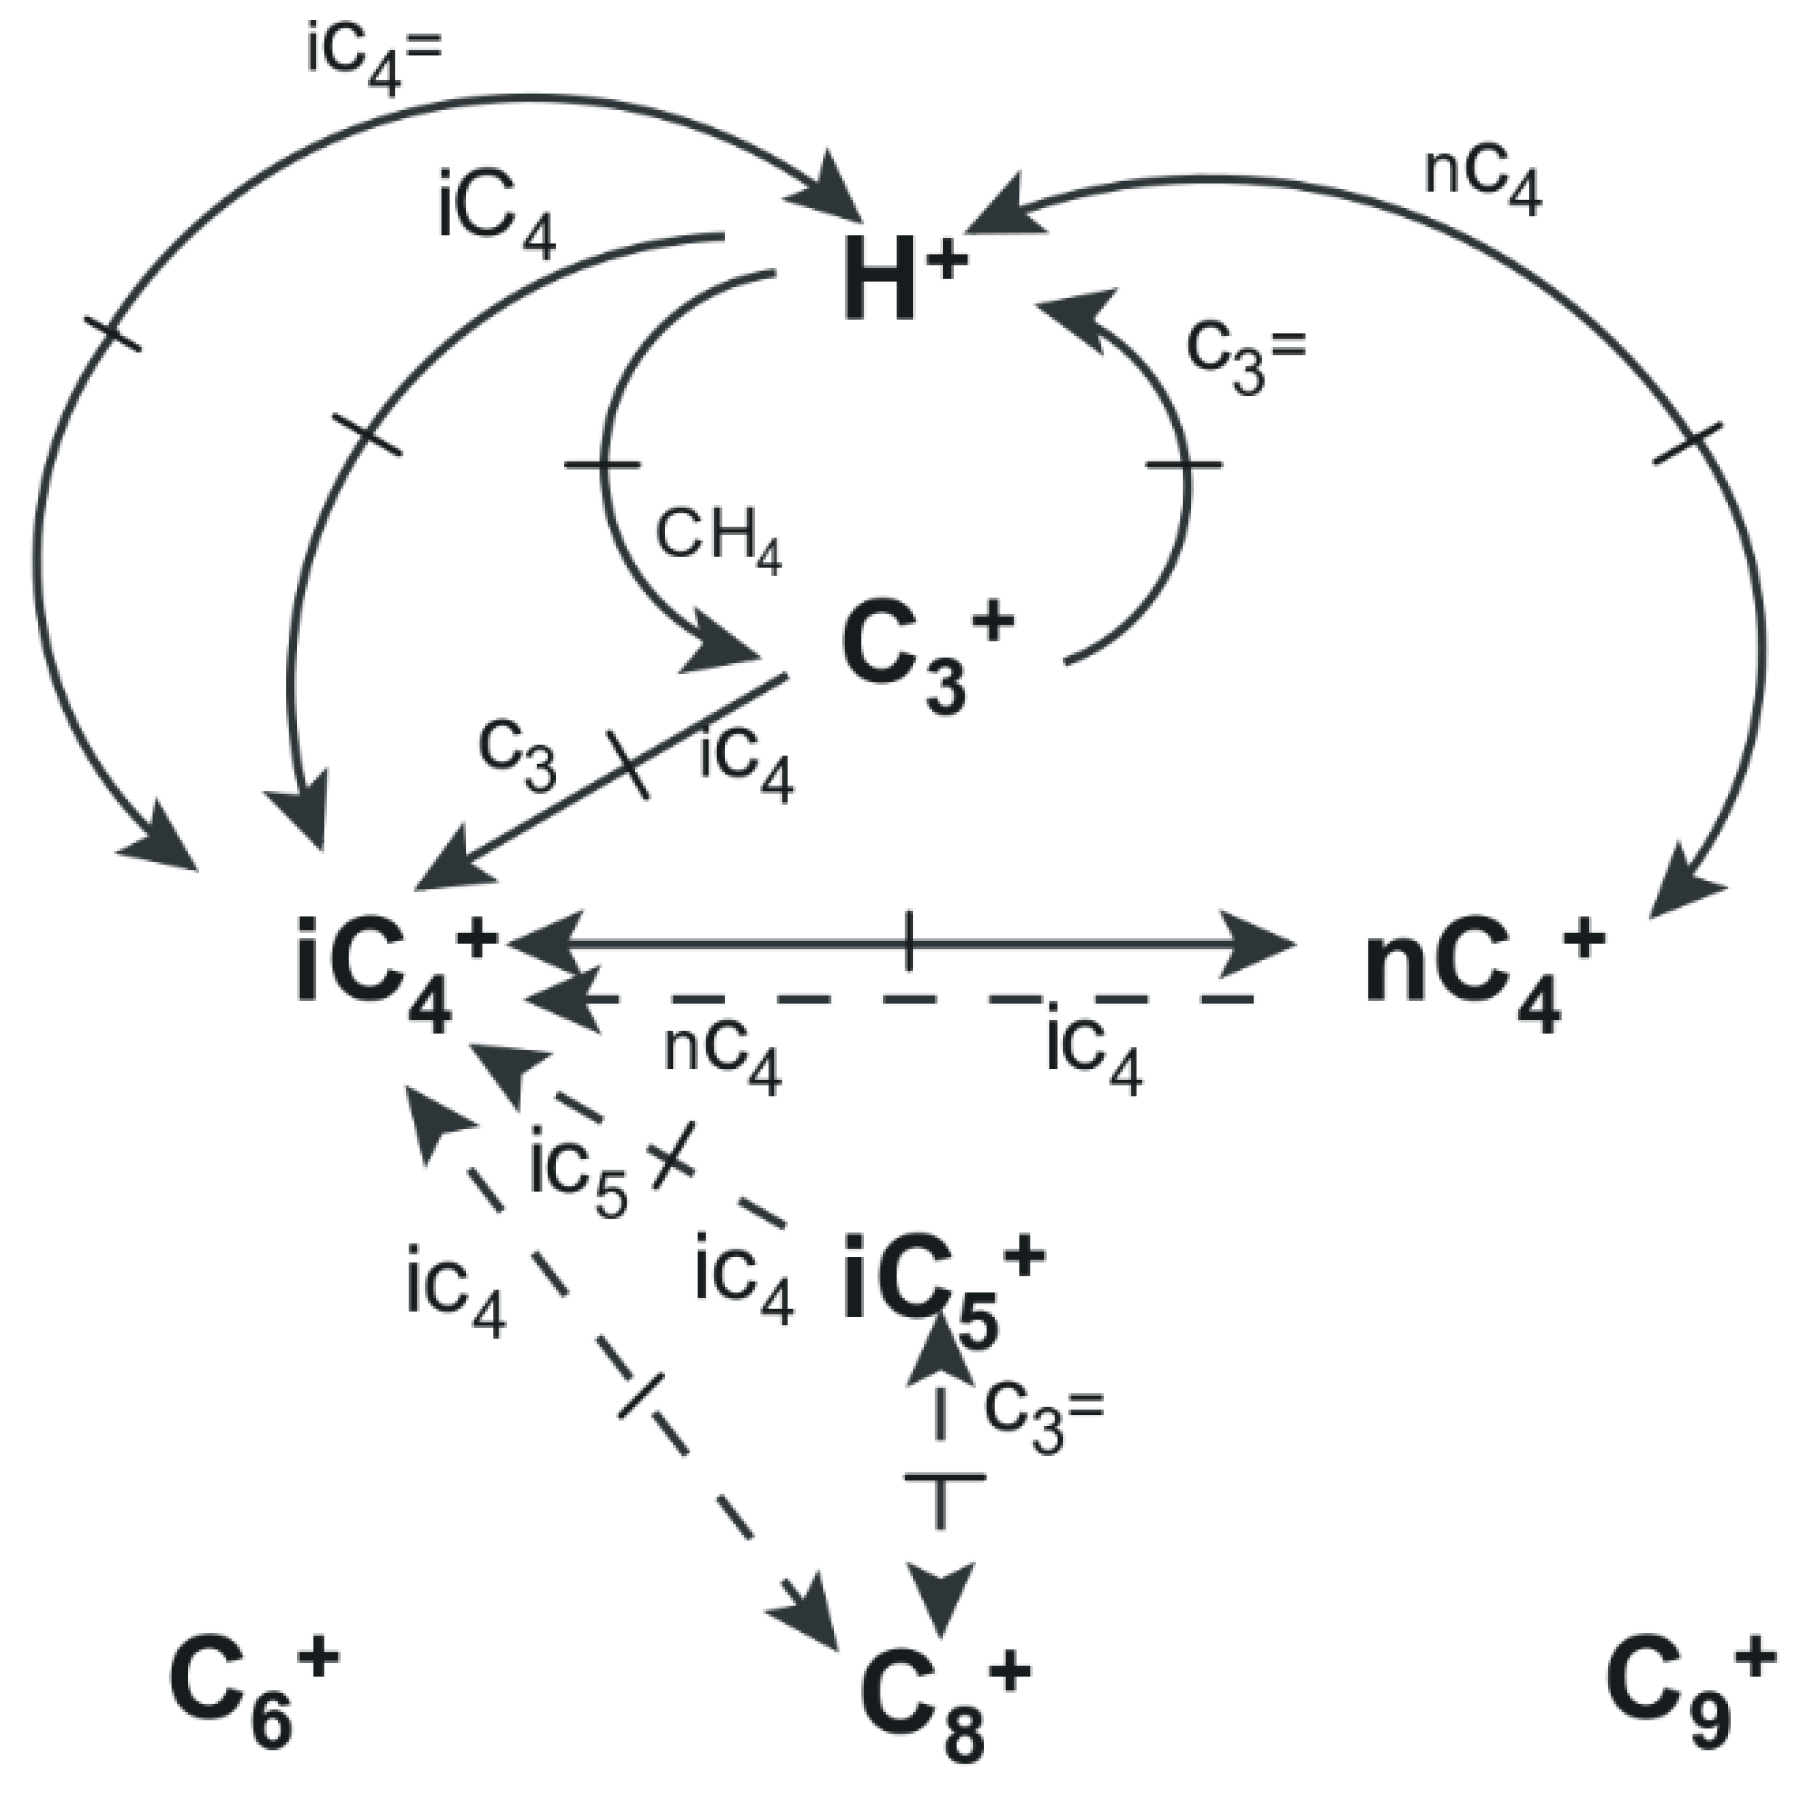
Additional to the main cracking mechanism discussed above, there are a number of acid catalysed reactions that are also occurring in the riser, and these include isomerisations, alkylations, branching, cyclisation and polymerisation [67]. By taking all these reactions into account, Cortright, Yaluris and co [68,69,70,71] have managed to work out the catalytic cycles for some alkanes taking place in the FCC riser. Figure 3 shows a simplified catalytic reaction network, consisting of several reaction step cycles, that was shown to account well for data representing the conversion of isobutane over zeolite Y catalyst. Each cycle is derived by starting from a surface ion species, following reaction lines that connect various surface ions until the reaction path returns to the original surface ion. From the reaction network, olefins are produced via a series of oligomerisation and/or β -scission elementary steps that produce carbenium ions, followed by deprotonation and desorption of the resulting carbenium ion. Paraffins may be formed together with a surface isobutyl carbenium ion from hydride transfer cycles. The various surface carbenium ions can undergo several other reactions such as isomerisation and β -scission to form other surface complexes and gaseous products. From this analysis, Yaluris et al., suggest that any particular reaction step in the cycle/network may be part of more than one catalytic cycle.
Evidently, once the reaction network is expanded to include cycles of all compounds present in the FCC gas oil feed, it becomes very complicated or even impossible to compute. However, the review on characterisation above already showed that for such mixtures in the FCC riser, it is near impossible to account for every single compound present in the mixture using currently available technology.
The short overviews about the feed characterisation and FCC reactions are presented here to highlight two important factors relevant to the kinetic modelling of the FCC riser:
  • Both the feed and the product mixture of the system are very complicated mixtures of compounds, and their modelling is, to some extent, limited by the characterisation techniques available to the process engineer,
  • The reaction network for the FCC system, using conventional gas oil feed, is too massive and too detailed to be modelled exactly. To some extent, modelling may be limited by computation power.
In the regenerator, for example, it was easy to use simple chemical reaction kinetics to describe the system mathematically because all the reacting species were known and can easily be characterised (when an approximation for coke composition is made). Additionally, both the numbers of reacting species and of reactions are small, and therefore the system/reaction network can be easily described mathematically. However, in the case of the riser this is not the case, for example when considering only the C 25 C 40 reacting species in the gas oil feedstock, the number of isomers in this group exceeds 10 14 , without even accounting for heteroatoms such as N, O, S and metals [72], which are also present in the feed molecules. Therefore, it is almost impossible to account for all the molecules present in the reacting system. This problem of high dimensionality and increased coupling in the reacting system is also encountered in systems such as polymerisation, hydrocracking, isomerisation, aromatisation, reforming, Fischer–Tropsch synthesis and in some biological processes [72]. Different kinetic models will be discussed in the next chapter that have been used in the literature to describe FCC cracking in the riser, in each case, the modelling is usually a compromise between the level of detail that is needed from the model by the end user and the capabilities of the analytical techniques available to the simulator to characterise and quantify the reaction mixture. In petroleum engineering, two classes of analytical technique are used in kinetic modelling: chemical separation techniques such as mass spectrometry (MS), liquid chromatography (LC), solvent extraction (SE), and physical separation techniques such as distillation [72].

2.3. Kinetic Models of the Riser

2.3.1. Discrete Lumping

These are a priori lumping techniques that reduce the complex feedstock and large reaction network of the FCC riser into a smaller network that groups reaction components into groups, or lumps. In this technique, the lumped components, which may be grouped based on chemical or physical similarity depending on the level of analytical characterisation available and the level of detail required, are a single reacting species. Consequently, such an approach does not describe the system exactly but aims to capture essential elements of the real system with sufficient predictive power [73]. In the case of the FCC unit, it is not usually important to obtain a complete description of the process, i.e., traditionally only the yield of gasoline distillation cut in the product from the riser was of importance. Once the lumps considered have been established, a simple reaction analysis may be used, where a reaction network is made by conversions between different lumps. Each conversion in the network has a reaction rate and, therefore, an associated reaction constant and activation energy. In the general case, this may be described mathematically as:
R i = d C i d t = i N K j i φ C j n K i j φ C i m                   for   i j
K i j = k i j exp ( E i j R T )   for   i j
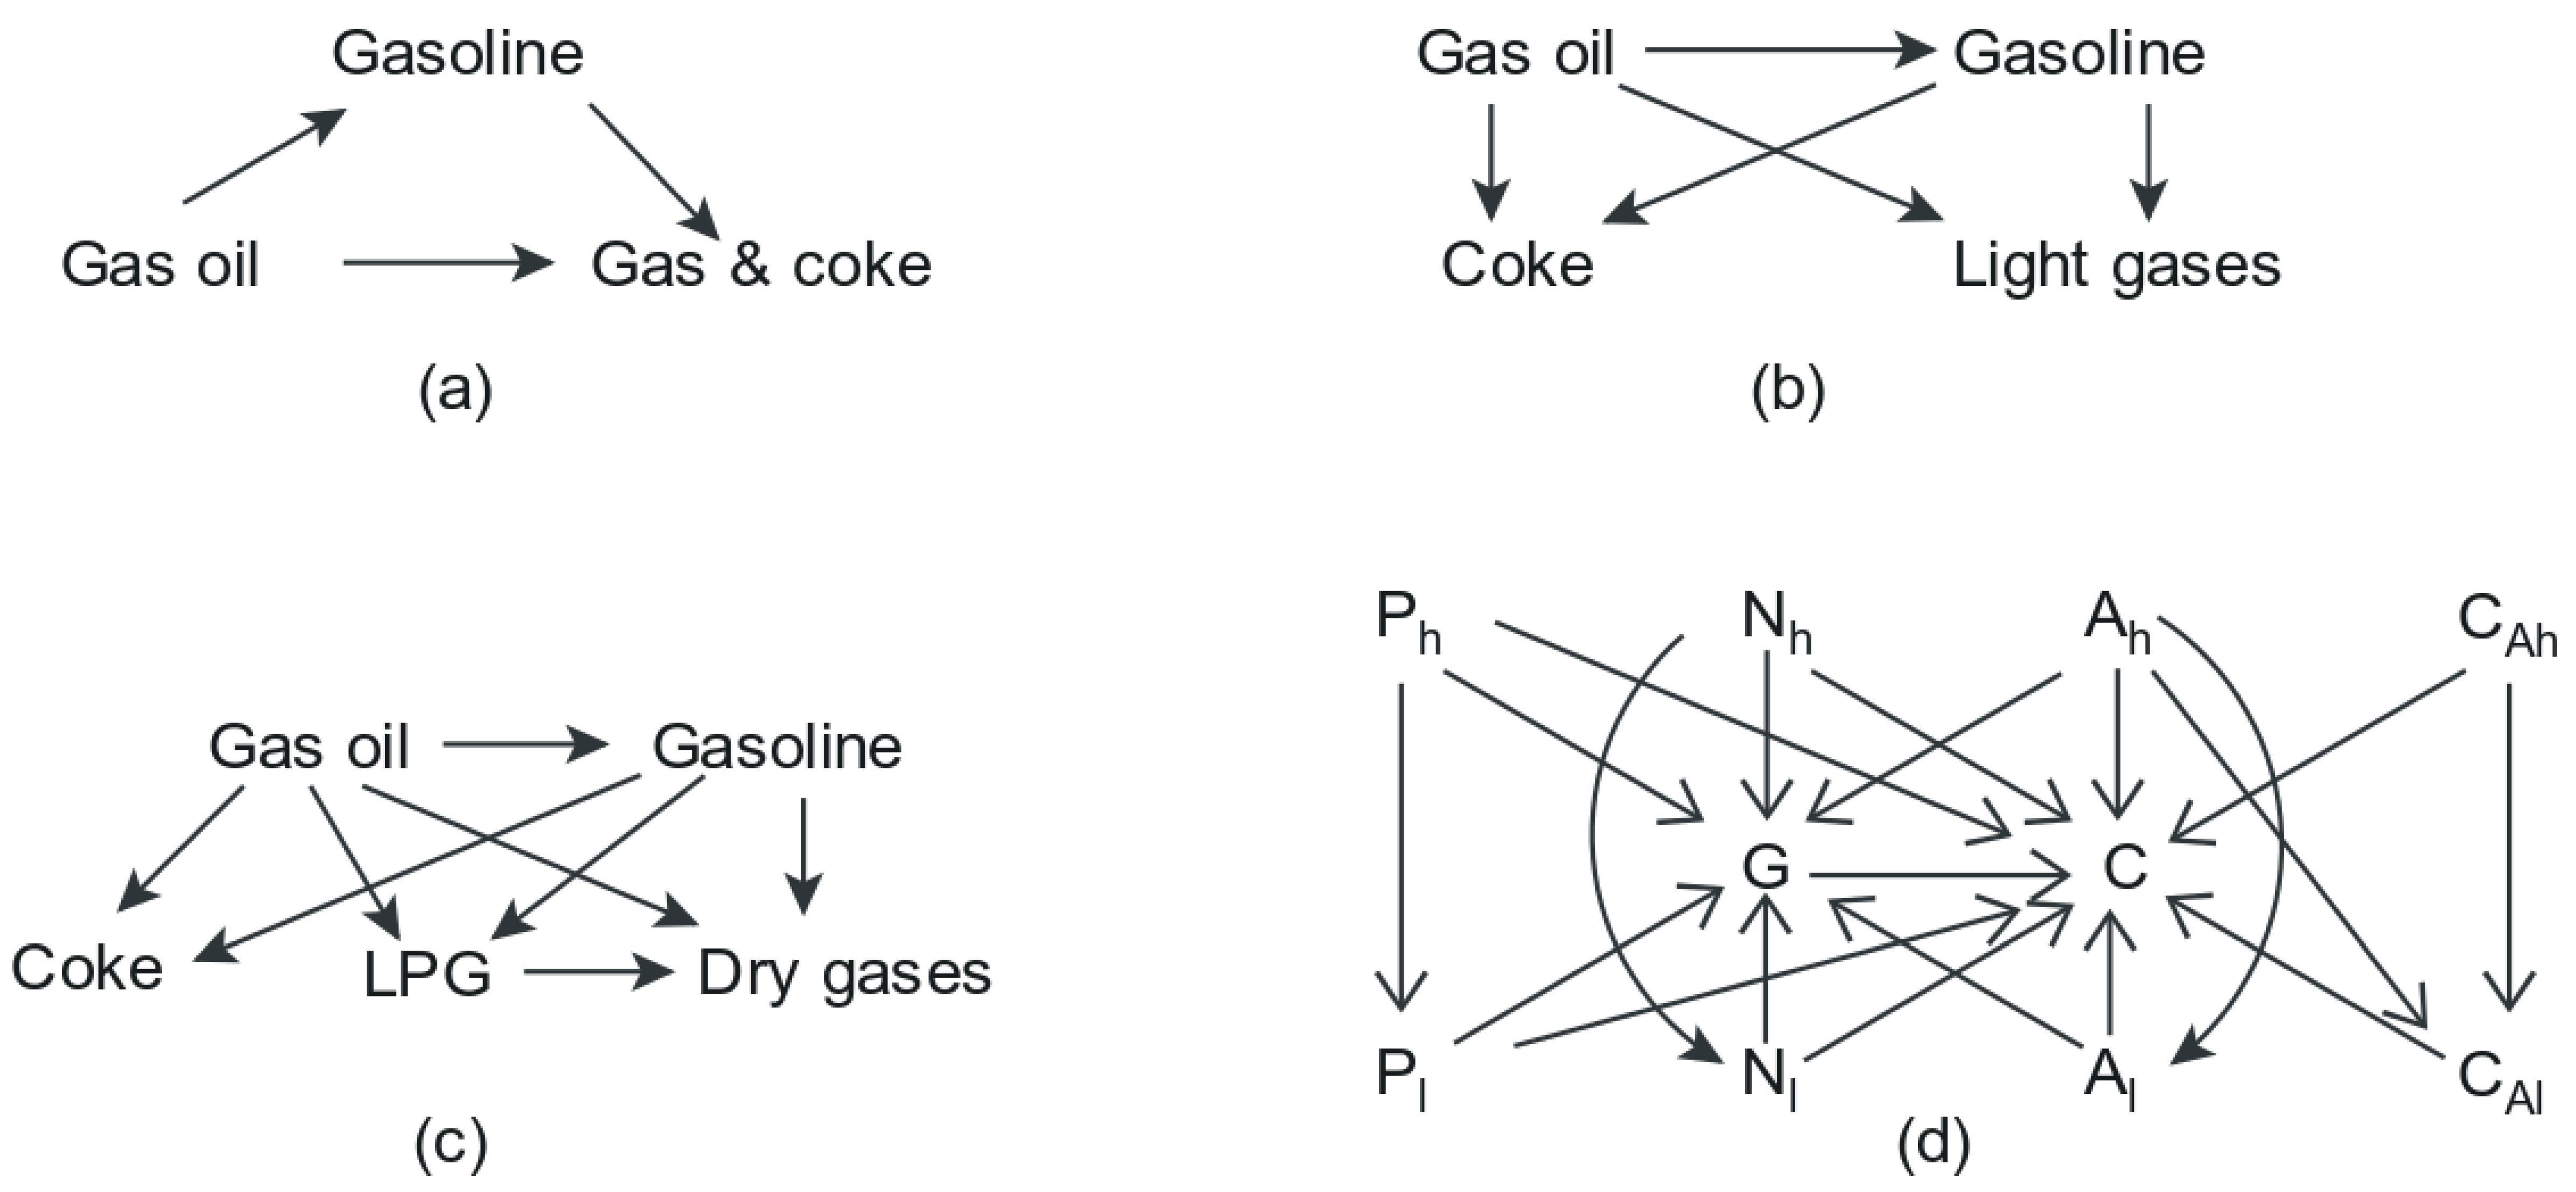
where R i is the rate of formation of lump i , C is the concentration, φ is a non-selective deactivation constant, n   &   m are the reaction orders, N is the total number of lumps and K i j is the reaction constant for the conversion between lumps i to j . The issue of deactivation will be discussed in a later section. The parameters of the kinetic model are then found in the Arrhenius form of the rate constant: k i j the pre-exponent factor (usually defined as the frequency factor) and E i j the activation energy of the conversion i j . The parameters are determined by fitting experimental data to the simple model described above. Therefore, it follows that for the required regression task and optimisation of the parameters, the characterisation methods available should be able to measure the evolution of the concentration of the lumps. Another simplification of this method is that chemical data of the lumps is not required, nor is the consideration of stoichiometry, conversions are assumed to be one-to-one between the lumps [45]. In the traditional lumping technique, the lumps are usually chosen according to the main refinery distillation cuts: gas oil, gasoline, LPG and light gases. Alternatively, lumping may be undertaken according to the PONA characterisation, depending on the analytical tools at the disposal of the process modeller.
One of the earliest applications of discrete lumping in the FCC process was by Weekman and Nace [74]. Their kinetic model consisted of a reaction scheme consisting of lumps for the gas oil feedstock, gasoline ( C 5 BP   of   220   ° C ) and a lump consisting of coke and light gases. Their reaction scheme posited that gas oil feed is converted to the two other lumps in two parallel competing reactions, and that gasoline lump subsequently over-cracks to the coke plus light gases lump. The reactions scheme assumes cracking of gas oil to be second order and that of gasoline to be first order. Their model was validated using experimental data from a laboratory moving bed reactor using a commercial grade catalyst. It is fair to say their work pioneered the kinetic lumping methodology in FCC modelling. In the years that followed, their model was expanded; Lee et al., and Yen et al. [75,76] have split the coke plus light gases lump from Weekman and Nace’s model into two separate lumps, creating a four-lump model, owing to the need to predict coke yields separately from any other lump. In the scheme, direct cracking of both gas oil and gasoline to light gases and to coke is added. Whereas the previous studies discussed have considered the gas oil feedstock as a single lump, it may also be divided into lumps, again as long as the analytic capabilities permit; Corella and Francés [77] have developed a model that splits the gas oil lump into light and heavy fractions, Larocca et al. [78] split the gas oil lump into its chemical compositions: aromatics, paraffins and naphthenics. Additionally, the rules for the connections between the lumps are also flexible, for example, the previous model of Weekman and the models derived from it assume that cracking of heavy lumps such as gasoline and gas oil also directly results in coke formation, however, Ancheyta-Juárez et al. [79] proposed a model including lumps for gas oil, gasoline, LPG, dry gas and coke in which only the cracking of the gas oil lump could lead to coking. In this way, the rules for reaction scheme are arbitrary and mean it is difficult to establish a universal lumping strategy for the FCC cracking reactions. Consequently, the empirical kinetic constants determined from kinetic studies are only comparable if the same reaction scheme is used to derive them. Regardless, the simplicity of the methodology has seen a number of publications for different number of lumped kinetic models for the FCC unit: four-lump models [79,80,81,82], five-lump models [79,80,83,84], six-lump models [85,86,87], seven-lump models [88], eight-lump models [89,90], nine-lump models [30], 10-lump model [17,18], 11-lump models [91], 12-lump models [92], and 14-lump models [93]. Figure 4 shows some lumped reaction schemes used for the FCC riser. Table 4 shows some kinetic parameters of discrete lumped models from various researchers. Table 4 also shows that the number of parameters increases with the number of lumps in the model, and that the parameters such as the frequency factors vary from model to model and for different feeds. The increase in the number of lumps in the models means that more information about the product slate is produced from the model, the obvious consequence to the regression exercise is that more model parameters must be estimated simultaneously resulting in convergence problems [28].
The models described above are plagued by the arbitrary nature of the reaction rules (i.e., reactions are not in line with what is expected of cracking instead a one-to-one conversion is assumed), and the non-specific nature of the determination of lumps. In view of this, Gupta et al. [45] developed a new method of discrete lumping where the lumps are characterised by TBP and in such a way that the lumps have a constant Watson characterisation factor [94]. The Watson factor is essentially a measure of a crude fraction’s aromaticity or paraffinicity. The difference from the previous discrete models is that the physio-chemical properties of the lumps are known and, therefore, lumps can be treated as pseudo-pure components. This model also has defined rules about conversions between the lumps that are based on an intuitive understanding of cracking. Via their proposed scheme, each lump on cracking gives two smaller lumps in one single reaction step, which is closer to what would be expected of a cracking reaction. The stoichiometry is such that when one mole of a given lump undergoes cracking, it gives one mole each of two smaller lumps and the balance mass is formed as coke. From our understanding of the cracking reaction mechanism from the previous section, a long chain paraffin for example, may underdo direct protonation forming a smaller paraffin and a smaller carbenium ion, and both can go on to undergo further reactions. Evidently, the present model by Gupta et al. [45] where one pseudo-component cracks to two others is at least consistent with part of the theory on cracking reaction mechanisms, unlike the first few models discussed here. Then the chemical reaction for a pseudo-component is given by:
P C i k i , m , n     P C m + P C n +   α i , m , n  
where i ,   m   and   n are pseudo-components and α is the amount of coke formed per mole of P C i that cracks. The mass balance for the coke formed per reaction:
α i , m , n = M W i ( M W m + M W n )       for   α i , m , n 0
In the scheme, P C i represents the several hundred compounds that have a molar mass of M W i . To calculate the molecular weights, the authors used the correlation by [95]:
M W i = 204.38 T b 0.118 S g 1.88 exp ( 0.00218 T b ) × exp ( 3.07 S g )
S g = 1.21644 ( T b 1 3 K w )
K w = M e A B P 1 3 S g
where S g is the specific gravity for each pseudo component, T b is the normal boiling point of each component and K w is the Watson characterisation factor. M e A B P is the mean average boiling point of the components. Therefore, to find these characteristics for each component, the TBP distillation curve for the feed and the entire fraction density is required. The next step is to determine a reaction rate for the cracking of the ith pseudo-component. For this, researchers [45] have assumed first order kinetics for each component, so that the rate equations for cracking in a small element of volume π D 2 4 × Δ z is given by:
r i , m , n = φ × k i , m , n C i × ( M c a t × Δ t )
where the r i , m , n is the rate of cracking of the i th component, k i , m , n is the rate constant of the cracking of i to give m   and   n pseudo-components, C i is the concentration of i in the control volume, M c a t is the mass flow rate of catalyst into the control volume and Δ t is the residence time of the catalyst in the control volume (which is found from Δ z u c where u c is the catalyst velocity). To estimate the kinetic constants in order to complete the model, the authors have produced a semi-empirical equation, given below:
k i , m , n = k 0 exp ( E 0 M W i v R T ) × ( exp ( α i , m , n τ ) exp ( M W i ) ) 1 exp ( M W i )
where k 0 ,   E 0 ,   v   and   τ are model parameters that are correlated to experimental data. The authors [45] state that these four parameters are constant for any feed and catalyst pair. Parameter τ is said to correlate to coke forming tendency while parameter v is said to correlate to activation energy of individual pseudo component in terms of its molecular weight. Gupta et al. [45] found that when the above kinetic model is combined with a suitable hydrodynamic model, they were able to predict well the overall gas oil conversion, product yields and temperature along the riser height. This model avoids the arbitrary nature of the reaction rules between the lumps and allows for the extension of lumps beyond just the wide boiling ranges of distillation, in their paper, the authors used 50 lumps to describe the system. The model is appropriate to use as long as the parameters for that particular feed and catalyst pair are known.
The simplicity of the lumping strategy discussed here makes it an attractive option for the kinetic modelling of the FCC riser, hence the vast amount of literature on the subject. Workers using this approach hardly have to think about such things as the reaction mechanisms and mass transfer limitations, and the system’s simplicity also requires very little computational power. However, despite these advantages, some disadvantages of the methodology should also be considered by the simulation engineer. Namely, the reactivity of the lumps may not be similar which means no global reaction rate constant may be established for any one lump [72], they are highly feed- and catalyst-specific which means they extrapolate very poorly to different pairs of feed and catalyst [87], and the description of the composition of the feed by boiling points and in some instances by a broad range of chemical similarities is too simplistic for any reliable model to be built with any kind of generalisation [23]. The use of a large number of lumps solves partially the problem of poor extrapolation of the models to different catalyst-feed pairs [87], and the pseudo-component model by Gupta solves partially the problem of stoichiometry and arbitrary reaction rules between the lumps; however, this model still suffers from reliance of model parameters on the feed–catalyst combination. More detailed methods are required in order to eliminate these problems.

2.3.2. Continuous Lumping

It was seen that in discrete lumping, the reacting mixture in the FCC riser was treated as a conventional mixture where it was possible to distinguish between a finite number of components or lumps. If the lumping assumption is again relaxed, then the gas oil system is again thought to be a complex mixture of an astronomically large number of chemical species. The foundations of the continuous lumping methodology come from the work of Aris and Gavalas [96] who postulate that such mixtures may be thought of as having an infinite number of chemical species. It is then no longer possible [96] or worthwhile [97] to speak of properties like mass, concentration and reactivity for individual species or lumps. Instead, only the distribution of such properties is considered. M ( x ) is then the mass distribution function such that M ( x ) dx is the mass of a cut of species A ( x ) dx for range ( x ,   x + dx ) . x is then identified as a characteristic index (such as boiling point temperature or chromatographic retention time in the case of the reactive FCC riser mixture such that A ( x ) dx is a sub-mixture whose index lies in the range ( x ,   x + dx ) . Similar definitions can be established for other properties such as concentrations for the cut of species. Any characteristic may be used as an index, the only requirement is that the characteristic unequivocally identifies the reactants [98]. In order to describe the kinetic model for a continuous system, as we did for the case of the discrete model, we follow the procedure by Laxminarasimhan et al. [97]. They use the TBP curve to characterise the cracking reaction mixture by converting the TBP curve into a continuous distribution such that for the components in the mixture the weight fraction is normalised in TBP, ( θ ). In this case C ( θ , t ) for any given time instance is the distribution function of component concentrations corresponding to normalised TBP. By definition, C ( θ ,   t ) d θ then corresponds to the fraction or proportion of species with a boiling point in the range θ ( θ + d θ ) . Using i to index the reacting mixture for any component, then it follows that C i ( t ) d i = C ( θ , t ) for the general case of i . Usually the model equations for the reactor are derived in the c   vs .   k reference frame [99] where k is the reaction rate constant, and then subsequently converted back to the C   vs .   θ coordinates. It is commonplace that the cracking rate constant is treated as being a monotonic function of normalised TBP such that high boiling point molecules crack faster than low boiling point molecules [100]. Therefore, accordingly from the continuous description of the components in terms of θ , it is reasonable to assume that the rate constants can also be treated as a continuous function of θ as well. Evidently, it is possible to extend this approach to develop a model with multiple characterisation variables, rather than just θ . However, for the present case, at any time instance:
C ( θ , t ) × d θ = c ( k , t ) × D ( k ) × d k
where the normalised temperature is given by:
θ = TBP TBP ( l ) TBP ( h ) TBP ( l )
Such that TBP ( h )   and   TBP ( l ) are the highest and lowest possible boiling point temperatures of the reactive mixture, corresponding to the highest molecular weight component and lowest molecular weight component in the continuous mixture, respectively.
D ( k ) is the species-type distribution function such that D ( k ) d k is the number of species with a reactivity in the range ( k ,   k + d k ). This approach is such that c ( k , t ) corresponds to the concentration of species with a reactivity k . The monotonic function of k   vs .   θ allows that an independent function of the two variables can be developed; for example, it may be taken as a simple power law type equation [97]:
k k m a x = θ 1 α
α is a model parameter, k m a x is the rate constant of the highest boiling point species, corresponding to θ = 1 . This power law equation makes it explicit that the rate constant for the lowest boiling point species is zero, that is k = 0   at   θ = 0 , which is a reasonable assumption in the FCC riser cracking mixture where the smallest chain molecules such as methane are not thought to crack any further. Of course, other forms of the k   vs .   θ relationships may be used if they are representative of results from experiments. The D ( k ) can be regarded as a Jacobian of i k coordinate transformation, so that by a chain rule:
D ( k ) = d i d k = ( d i d θ ) ( d θ d k )
If the total number of species in the reaction mixture is N (for N in a complex mixture), then d i d θ N , so that:
D ( k ) = N [ α k m a x α ] k α 1
As reported by Laxminarasimhan et al. [97], D ( k ) must satisfy:
1 N 0 k m a x D ( k ) d k = 1
With the established background, the mass balance for the species with reactivity k can be formulated in the k-plane as follows:
d c ( k , t ) d t = k c ( k , t ) + k k m a x p ( k , K ) K c ( K , t ) D ( K ) d K
The function p ( k , K ) is the yield function, which basically means it determines how much of a species with reactivity k is produced from species with reactivity K . The species-type distribution function (i.e., the Jacobian mapping), D ( K ) , in the integral accounts for the cracking of species with reactivity K , since the mass balance is carried out in the k   space. The integral then sums over the cracking of species up to species with the maximum reactivity k m a x , assumed here to be the heaviest hydrocarbon. It is worth noting that the form of the mass balance equation has previously been derived by McCoy and Wang [101] using particle breakage and molecular fragmentation theory where two or more fragments result from each fission or fragmentation event. This approach requires the consideration of stoichiometric coefficients of the scission events and the incorporation of linear or non-linear kinetics into the model. For the present case, the only term left for consideration is the yield function, which may take different forms depending on the specific reaction mixture. Laxminarasimhan et al. [97] have thoroughly discussed the form of the yield function and have noted that a skewed Gaussian-type distribution function is the best candidate for the yield function for cracking reactions. They explained that the skew of the distribution is due to the maximum yield of products from cracking of components with reactivity K occurs just below components with reactivity K , so that the peak of the distribution is biased towards K . Laxminarasimhan et al. [97] give the following function as the yield function:
p ( k ,   K ) = 1 S 0 2 π ( exp ( ( ( k K ) α 0 0.5 α 1 ) 2 ) A + B )
where:
A = exp ( ( 0.5 a 1 ) 2 )
B = δ ( 1 ( k K ) )
S 0 can be solved by substituting the yield function into the following mass balance criterion:
0 K p ( k ,   K ) D ( k ) d k = 1
  0 K 1 S 0 2 π ( exp ( ( ( k K ) α 0 0.5 α 1 ) 2 ) A + B ) D ( k ) d k = 1
From the kinetic model described above, the model parameters that must be estimated empirically from experimental data are k m a ,   α 0 ,   α 1 ,   and   δ . For the parameter estimation exercise, a suitable optimisation function must be established, but first the main mass balance equation must be discretised in order to solve numerically as analytical solutions are not possible. Laxminarasimhan et al. [97] recommend discretisation by dividing the K-plane into N nodes, so that the main balance equation may be written as a small difference equation for any i th node and small-time step Δ t . Δ t and N may be varied depending on the required accuracy and available computation power.
The analysis presented above uses simple first order cracking reactions, however, it is possible to incorporate higher order reactions. Cicarelli et al. [102] have analysed a system of cracking type reactions that were governed by non-linear cracking reactions using the continuous approximation, by combining basic continuum ideas from Aris and co-workers [96,103,104]. Their approach follows the fragmentation methodology assuming equal stoichiometric distribution of all crackates, and they also include considerations for the adsorption of species using the Langmuir-Hinselwood kinetics. The approach described here is formulated based on a single characterisation variable, but although often not addressed or attempted, an extension to multiple characterisation variables is also possible. Peixoto et al. [105,106] have already demonstrated this for the catalytic cracking process by having aromatic, paraffinic and naphthenic structures be continuously characterised by carbon number.
The continuous lumping methodology that was derived above can be seen to be an extension of the work of pseudo-component lumping by Gupta et al. [45]. However, it still suffers from the same limitations as those discussed in the discrete lumping section, model parameters are still dependent on feedstock composition and/or catalyst, therefore requiring refitting of parameters for different feedstock-catalyst pairs. From the model described above, it is also evident that the continuous model description is less trivial than in the discrete case, and therefore will be more computationally demanding. Another limitation of continuous approximation that is worth noting for the reader is that discussed by Ho and White [107] for long-time (or high-conversion) validity of the continuous approximation. At longer times or high conversion, the reaction mixture gradually becomes less crowded as great proportions of higher boiling point components are lost, and the validity of the continuum assumption begins to break down, especially for low order reactions in plug flow. Generally, the validity of the continuum approximation is dependent upon the kinetics, feed properties, reactor type and pore diffusion, and this is described in depth in the work of Ho and White [107].
For the mathematical description of continuous mixture approximation in the general case, the reader is directed to see the literature [14,96,99,103,104,107,108,109,110]. For continuous lumping in catalytic cracking the literature [102,105,111] is worth exploring.

2.3.3. Single Event Kinetics and Structure-Oriented Lumping

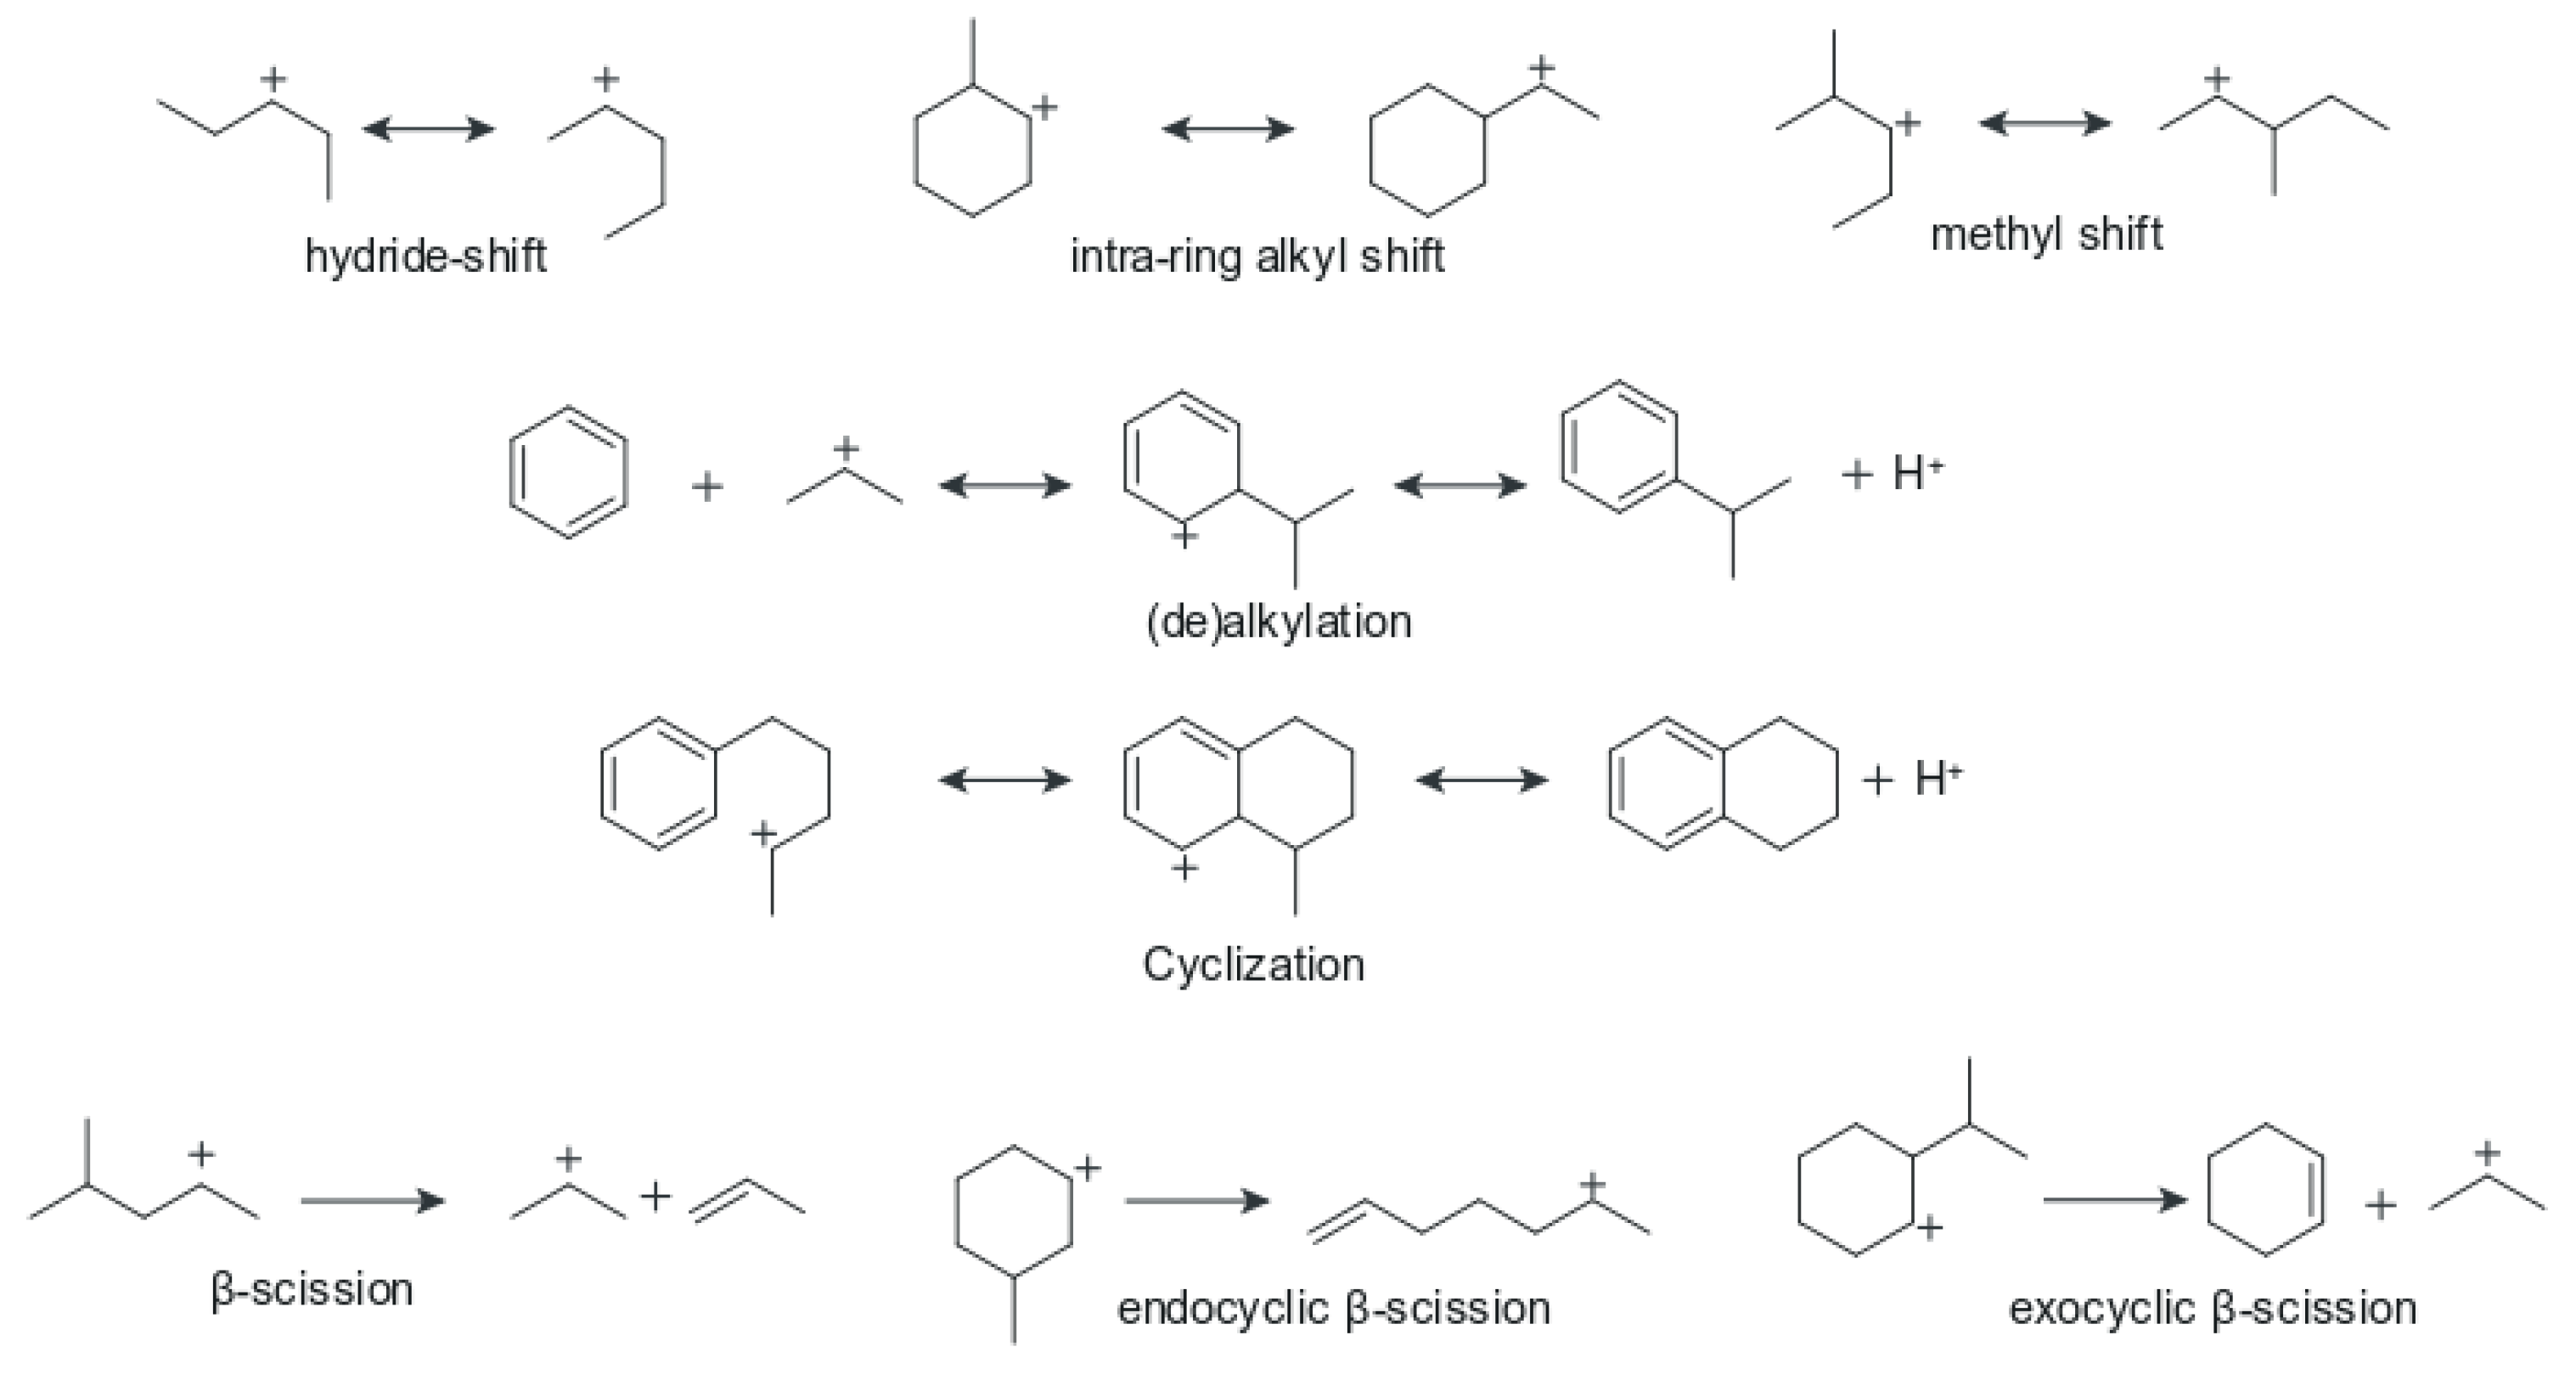
The single event kinetics approach to the modelling of acid-catalysed reactions in complex mixtures was developed through a series of publications [22,23,112,113,114,115]. The concept establishes the link between the reactivity of a chemical species in the mixture to its geometry and a limited number of intrinsic kinetic parameters, which are only dependent on the type of molecule and the type of reaction involved [72,116]. The methodology behind this modelling approach is in describing the kinetics of the elementary steps that occur in the complex reactive mixture, but it has already been established that the reaction network is massive and therefore the number of elementary steps occurring is also gigantic. However, what can be established from the carbenium mechanism described in the previous section, and what was noticed [23] is that although the number of steps is large, they belong to a limited number of types (i.e., exocyclic protolytic scissions, hydride abstractions, methyl shifts, β -scissions, aromatisation etc). Therefore, it becomes feasible to model the reactions in such complex mixtures (such as the FCC riser) by decomposing them into their elementary forms, in a similar fashion to the elementary radical chemistry (initiation, propagation, chain transfer and radical termination) kinetic modelling used in polymerisation [117,118]). In such a methodology, an understanding of the elementary steps occurring in the reactor is required, Figure 5 shows some elementary reactions occurring during cracking in the riser.
In order to determine the rate of any given elementary state, the transition state theory is used [113]:
k = k B T h exp ( Δ S 0 R Δ H 0 R T )
where k is the rate constant of the elementary step, k B and h are the Boltzmann and Planck constants respectively, Δ S 0   and   Δ H 0   are the standard change in entropy and change in enthalpy associated with the reaction of the reactant to form the transition/intermediate state. The change in standard entropy consists of contributions from translational, vibrational and rotational. If the rotational contribution is taken as representative of the structure and considering the possibility for chirality, then this contribution can be explained via global symmetry numbers. It can be written that:
S 0 = S ¨ 0 R l n ( σ )
where S ¨ 0 is the intrinsic entropy term and σ is the symmetry number of the species. The entropy change of reaction for the formation of the activated complex or transition state is then given by:
Δ S s y m 0 = R l n ( σ r σ )
To account for chirality, a global symmetry number is introduced using the number of chiral centres in the species, n :
σ g l = σ 2 n
Analysing for Δ S 0 leads to:
k = k B T h ( σ g l , r σ g l , ) exp ( Δ S 0 R Δ H 0 R T ) = n e k
where n e = σ g l , r σ g l , , n e is the number of the so-called single events. The rate of the elementary step k is therefore a multiple of that of a single event, k . In this way the number of single events has been separated from the rate coefficient for the elementary step and, therefore, the effect of the structure of the carbenium ion on the change of entropy can be accounted for. By way of the Polanyi equation [113], the effect of structure and carbon number on the Δ H 0 can be calculated for an exothermic step as follows:
E a = E 0 α | Δ H r |
and for the endothermic step:
E a = E 0 ( 1 α ) | Δ H r |
E a is the activation energy, and is related to the rate constant of a single event through an Arrhenius type expression for temperature dependency:
k = A exp ( E a R T )
Since the structure dependency has been taken out using the number of single events, the Polanyi parameters ( E a ,   α ) have unique values for any given type of elementary step. The rate constants are, therefore, invariant with respect to the structure of the carbenium ion for any single event or elementary step [22]. This is the fundamental advantage of this type of model, that the kinetic rate constants are effectively invariant for that elementary step for any complex mixture or feed. Δ H r   for a single event can be calculated from enthalpies of formation for both the reactant and the product.
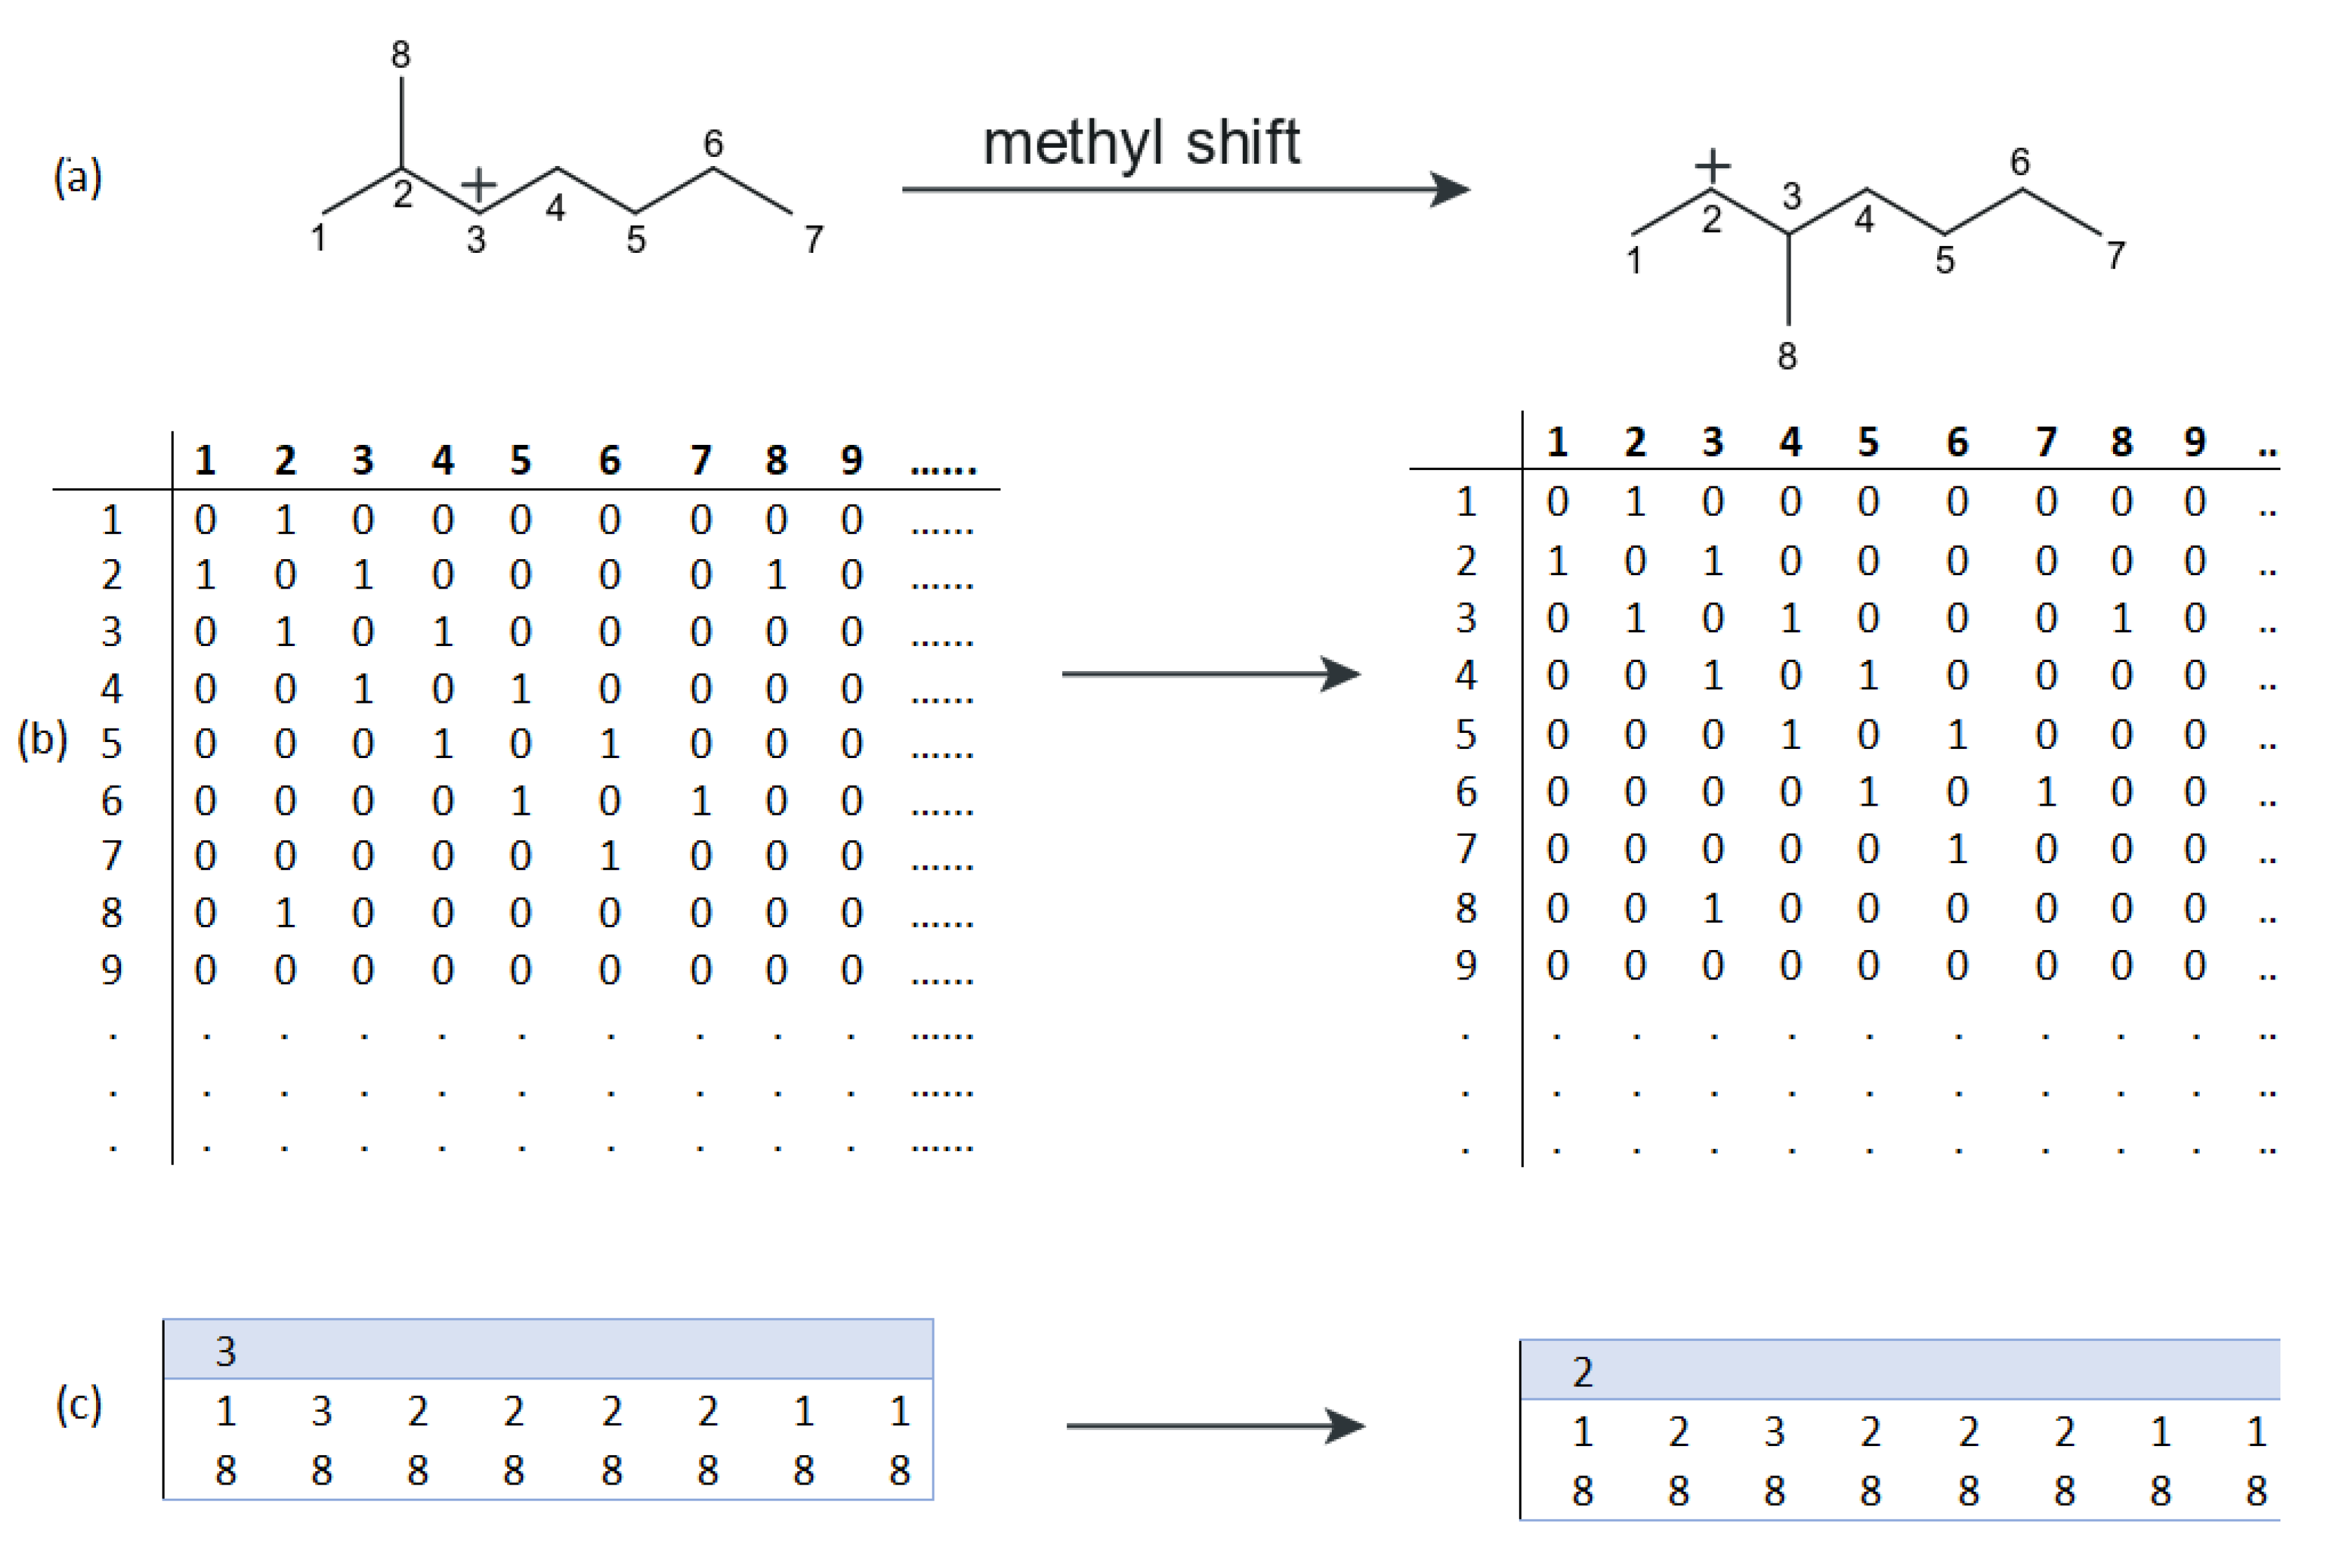
In order to carry out this analysis, a reaction network for the system must be established so that all the elementary steps and single events involved may be determined. It has already been established that the networks involved, especially for a mixture as complex as that of FCC gas oil feed, is gigantic; therefore, it can only be sufficiently generated by computer algorithms. This falls under the now well-established field of computer-assisted chemistry or computational chemistry. Generally, species involved in the reaction network are stored in the computer in the form of standardised labels, which can be broken down into three vectors: one vector of dimension 1 and two vectors of dimension C (where C is the number of carbon atoms in the molecule). The first vector contains the index of the carbon atom carrying the charge, the first C -dimension vector carries information about whether a carbon atom is primary (p), secondary (s), tertiary (t) or quaternary (q), and the last vector indicates the type of carbon atoms present in the species (i.e., saturated, unsaturated, cyclic etc.). The labelling is such that the encoding is unique for each species, and generally in a way that is consistent with the International Union of Pure and Applied Chemistry (IUPAC) naming rules. In order to numerically represent the elementary steps in the computer simulation, the vector representation of a reacting species is usually converted to a Boolean connectivity matrix form. In this way, Boolean matrix elements for a species m i j   and   m j i are 1 if there exists a bond between atoms i   and   j . If no bond exists, then the elements are 0 . Such a storage system allows the structure of a molecule to be easily computed. An auxiliary vector is used to store information about double bonds, and a scalar is used to tract the position of the charged carbon in the species. Figure 6 shows how Boolean connectivity matrices are used to compute elementary steps, by way of example, a methyl shift elementary step is shown. This representation and computation of reaction networks has been thoroughly reviewed elsewhere [23,112,115,116,119].
From the system described above, it should be clear that the generation and subsequent description of reaction networks is possible and can be automated via specialised computer programs, or algorithms could be written for unique cases. In catalytic cracking simulations, specialised automated reaction network generation algorithms have been used by various researchers [112,113,114,115,116,120,121,122,123,124,125,126,127,128]. Once the network has been generated, it follows that rate equations need to be determined so that they may be incorporated into a suitable hydrodynamic model for the reactor.
To determine the rate equation, the method of Froment [23] is followed here. Consider, by way of example, the rate equation for the β -scission elementary step of a paraffinic secondary carbenium ion R 1 + into an acyclic olefin and an acyclic paraffinic carbenium ion R 2 + , the rate equation for the step is written as:
r β = n e k β ( s ; s ) C R 1 +
The inaccessible concentration of R 1 +   is then written in terms of measurable partial pressures of paraffins and olefins, by assuming equilibrium or pseudo steady state balance between formation and disappearance. Hence all reactions resulting in the formation of the carbenium ion R 1 + are considered together with those resulting in the removal of R + from the reaction mixture. In the present example, the formation occurs by protonation of olefins the same length as R + , direct protonation of paraffins resulting in scission to give R 1 + and some other paraffin and hydride transfer between paraffin P 1 and adsorbed carbenium ions, and the disappearance occurs by deprotonation and hydride transfer from paraffins, therefore:
C R 1 + = 1 N ( ( k p r ( s ) ( 1 C B + ) j ( n e ) p r K ( O j O r ) p O j ) + k p r o t o l ( s ) ( 1 C B + ) J ( n e ) p r o t o l p P j        + k h t C B + ( n e ) h t p P 1 )
where N = ( n e ) a v . D e k D e ( s ) = k h t j ( n e ) p r o t o l p P j .
K is the equilibrium constant for isomerisation between O j   and   O r , ( n e ) a v . D e is the average number of deprotonation events of R 1 + , and C B + is the relative concentration of the Brönsted acid sites on the catalyst that the carbenium ions are adsorbed to, so that at equilibrium (steady-state):
C B + =   C R 1 +
Therefore, elimination of C R 1 + leads to the rate equation for the β -scission events in terms of the partial pressures of species in the gas phase, which importantly, can be measured.
The network, which is undeniably too large, can be reduced by disregarding the involvement of methyl and p type carbenium ions as they are less stable compared to those of p, t and q- ions [23]. Furthermore, the resulting network can be reduced further by introduction of some a posteriori lumping technique to group isomer species according to their carbon number and their degrees of branching without losing much information from the original network [72]. According to Froment [23], the lumps should be chosen in terms of the analytical capabilities that are available to the study, so that initial values of partial pressures required in the model described above are available or measurable. In this way, the rate equation for the transformation between some lump L 1 to another lump L 2   can be derived by summing the rates of all the elementary steps which convert all the species making up of L 1 (carbenuim ions and molecules) into species making up L 2 . As an example, the rate of isomerisation by protonated cyclopropane (PCP)-branching of some paraffinic lump L 1 to form a lump L 2 [23]:
r PCP ( L 1 L 2 ) = ( s , s C R i + ( s ) n e k PCP ( s ; s ) D ( s ) ) + ( s , t C R i + ( s ) n e k PCP ( s ; t ) D ( s ) ) + ( t , s C R i + ( t ) n e k PCP ( t ; s ) D ( t ) ) + ( t , t C R i + ( t ) n e k PCP ( t ; t ) D ( t ) )
where n e is the number of PCP single events for ( s ; s ) ,   ( s ; t ) ,   ( t ; s )   and   ( t ; t ) transformations and D ( s )   and   D ( t ) represents the fraction of s   or   t carbenium ions which desorb by hydride transfer. Using the quasi-steady state approximation for the carbenium ion concentration and accounting for the total site balance:
r PCP ( L 1 L 2 ) = ( LC ) PCP ( s ; s ) F PCP ( s ; s ) k PCP ( s ; s ) p L 1 + ( LC ) PCP ( s ; t ) F PCP ( s ; t ) k PCP ( s ; t ) p L 1 + ( LC ) PCP ( t ; s ) F PCP ( t ; s ) k PCP ( t ; s ) p L 1 + ( LC ) PCP ( t ; t ) F PCP ( t ; t ) k PCP ( t ; t ) p L 1
The F PCP ( i ; j ) contain the different single event rate coefficients, and ( LC ) PCP ( i ; j ) are the lumping coefficients that depend only on the network of elementary steps and choice of lumps but not on the single event rate constants [23]. The lumping coefficients, for global rate equations of the lumped model, can be calculated and stored for any given reaction network [113]. Expressions like those above have been shown for cracking [124] and for endocyclic β -scission [113]. Extension to other elementary reaction types is trivial and can be found in the work of Surla et al. [116]. In order to estimate rate constants, the kinetic model above is incorporated to a suitable transport model for the reactor, by way of example, for simple plug flow model is shown below:
d F i ( z ) d z = ρ b u l k A φ r i    
where F i ( z ) is the molar flow rate of some component or lump i at some axial coordinate z of the reactor, A is the reactor cross-sectional area, φ is the non-selective deactivation function, ρ b u l k is the bulk density of the reactor bed and r i is the rate equation for the lump i as defined in the kinetic model. From this point, the analysis is like that described for previous kinetic models, where the experimental data are fitted by regression to some optimisation function in order to find the kinetic parameters. The main advantage of the single event kinetic model is that the models produce kinetic parameters that extrapolate well, as the rates are independent of feedstock, an assumption that was proven by Standl et al. [126] who produced kinetic constants for the cracking of 1-pentene over ZSM-5 catalyst, and managed to use those parameters to reproduce the experimental data for the cracking of different olefins with impressive accuracy. This demonstrated one powerful observation, because the rates are only concerned with the type of elementary step and structure of the molecule, the rates can be calculated for cracking of simple molecules, which produce smaller reaction networks such as the case of Standl et al. [126], and extrapolated for models with more complex reaction schemes (such as that of gas oil cracking in FCC risers) without the need to recalculate the rate constants. Beirnaert et al. [129] have calculated rate constants for cracking of 2,24-trimethylpentane over USY zeolite, Quintana-Solórzano et al. [124] for cracking of hydrotreated gas oil over RE-USY equilibrium catalyst, Quintana-Solórzano et al. [123] for cracking of mixtures of 1-octene and cycloalkanes (cycloalkanes used: methylcyclohexane and n-butylcyclohexane) over RE-USY catalyst, Quintana-Solórzano et al. [130] for partially hydrotreated vacuum gas oil over RE-USY and Feng et al. [115] for cracking of n-decane over RE-Y catalyst (shown in Table 5).
Hopefully, what is evident from the above analysis of the single event kinetics is that this approach solves the two fundamental problems that were identified in the two previous classes of models; the transformations are no longer arbitrarily determined, and the reaction rate constants are no longer feed-dependent and therefore extrapolate well for other feeds. However, as with the other approaches, it carries its own disadvantages: the model is highly computationally demanding, and the level of feed characterisation required is more detailed than the previous models.
A short summary of the different modelling approaches is presented in Table 6. One other issue of note that has not been discussed here is the catalyst. The work described so far establishes that different catalysts have been used by various studies over the years as the FCC catalyst technology has evolved and developed. Each of the methods discussed here may be used with various catalysts, however, the values of the kinetic parameters may differ owing to the catalyst’s selectivity and activity. On the other hand, because of the fundamental nature of the single event model, kinetic parameters from this method have been shown to extrapolate well for various feeds as long as the catalyst used remains the same. This attribute is an indicator that these kinetic parameters are intrinsic reaction rate parameters that are catalyst specific but not feed specific for any given elementary step, as opposed to the empirical parameters founding from lumping. Therefore, for a lumped methodology, it is important to consider both the catalyst and feed characteristics before kinetic parameters are used for predictive purposes.

2.3.4. Catalyst Deactivation Function

Cerqueira et al. [131] have reviewed the phenomenon of catalyst deactivation of FCC catalysts and have divided deactivation in such heterogenous catalysts as being caused by physical or chemical means. The former includes phenomena such as sintering and occlusion, while the latter includes chemical degradation by materials such as alkaline metals, irreversible poisoning by permanent adsorption of impurities on the active sites and fouling by coke deposition. The work only focuses on deactivation by deposition of coke as this is the deactivation that is reversed in the regenerator and usually the primary source of deactivation [132,133]. Coke deposition occurs very rapidly in the FCC riser [134] and, therefore, the activity of the catalyst is quickly reduced in the lower height of the riser. Deactivation by coke is usually either by poisoning of acid sites where coke molecules block the acid sites directly, affecting the activity linearly and also possibly affecting the selectivity [135] or by pore blockage where the coke impedes reactants’ access to the reaction site [131,136]. The effect of pore blockage is much more significant [134,137]. Evidence of deactivation by coke has been showing by [42,138] by comparing the N 2 absorption-desorption data of clean and spent catalyst. They have found that spent catalysts underwent physical deterioration of physical properties associated with catalytic activity (e.g., Brunauer-Emmett-Teller (BET), meso- and micropore areas), with the deterioration being feed-type dependent. Changes in average pore diameter after coke deposition also confirms the suggestion that it influences selectivity. In terms of modelling this phenomenon, a difficulty arises in the mathematical description of the rate of deactivation [139]. In kinetic modelling, the effect of deactivation is incorporated by including the so-called deactivation function ( φ above), which is defined as follows [139]:
φ i = r i r i 0
φ C K = r C K r C K 0
where subscript 0 corresponds to the rate of reaction on clean catalyst, so that the presence of coke affects both the rate of production of reation i   and the further production of coke itself. The above accommodate the possibility that the deactivation function may be different for each reactant or product, which is called selective deactivation, or that the deactivation function is the same for all the reactions (non-selective deactivation). Appropriate mathematical functions for φ are such that they can describe the initially high catalyst activity that diminishes rapidly followed by a levelling off (see Table 7) e.g., the exponential function, A exp ( B t ) where A and B are parameters to be simultaneously estimated with the kinetic rate parameters, and t may be residence time or coke on catalyst. For the former, deactivation function is referred to as a time-on-stream (TOS) model and the latter are referred to as coke-on-catalyst (COC) models. In the case of lumping kinetics, the deactivation model parameters (i.e., A   &   B ) add to the number of kinetic parameters being estimated which can result in over-parameterization [83]. Bollas et al. [83] have compared different deactivation scenarios, non-selective deactivation, reactant-oriented deactivation and product-oriented deactivation, incorporated into a five-lump kinetic model and found out that non-selective deactivation was sufficient in describing the deactivation phenomena. This is consistent with what was reported by Corella [140]. In fact, the only case that Bollas found where substantial advantage was gained by using selective deactivation was in the case of product-oriented deactivation. However, the fact that non-selective deactivation is proven sufficient and also reduces model parameters has resulted in most deactivation models found in the literature being non-selective. Table 7 summarises some of the widely used types of deactivation functions in the literature.
Because of the empirical nature of the deactivation model parameters, these models suffer from being feedstock-catalyst pair dependent, which is expected according to data from Rodriguez et al. [42]. However, the extent of this dependence has yet to be fully studied in the literature to the same extent as that of the dependency of lumping kinetic parameters to the feedstock–catalyst combination. Therefore, the extrapolation of any model parameters to different feeds may be poor especially the differences in the rates of decay of activity between the two approaches to modelling deactivation in Table 7 [77]. To account for some of the variations in decay rates, Fernandes et al. [144] recommend the use of the first differential form of the deactivation function, d φ d x = α x φ d , where x   is either residence time or content of coke on catalyst ( wt % ). They have compared the model in both TOS and COC modes and have found similar profiles for open loop responses, for both approaches, with some minor differences. However, they have not compared their models against different experimental data to assess how well both models extrapolate to different feeds. Hence, the level to which the first order differential proposed accounts for the variations across different feeds is not yet known. Nevertheless, deactivation models in Table 7 have continued to produce satisfactory results.

2.4. Riser Hydrodynamics

The flow in the riser involves the gas and the solids moving up the riser height and exiting at the top where they are separated via the disengaging section. The solids are then sent to the regenerator for regeneration of deactivated catalyst and subsequently recycled back to the riser at the bottom. This arrangement is sometimes referred to as a circulating fluidised bed (CFB) arrangement. The riser is then operated in the fast fluidisation regime. Unlike in the bubbling/turbulent bed in the regenerator, the upper surface of fast fluid beds is more diffuse because of greater freeboard activity [145]. At higher gas velocities, there exists a transport velocity, V t , beyond which the rate of particle carry-over in the riser increases sharply so that if particles are not recycled at the bottom, then the bed would run empty very quickly [33,145]. Hence, the catalyst circulation rate is important in regulating the dilution of the flow inside the riser. In fact, Berruti et al. [32] and Kunii and Levenspiel [1] have shown that beyond the transition to turbulent flow, two modes of operation are present: (i) fixed inventory system (FIS) where the solid mass flux is a dependent variable, and (ii) variable inventory system (VIS) where the solid mass flux is an independent variable. In the FIS system, there is no controllable solid storage inventory in the riser; the solid inventory is established by setting the gas velocity and solid charge; whereas VIS systems vary the gas and the solid mass flux to achieve a certain solid inventory in the riser. As will also be seen in the regenerator, the understanding of the flow and gas–solid mixing characteristics is important in order to model the system. The gas–solid flow behaviour inside the FCC riser has been well studied using cold flow CFB setups at pilot scale, using a variety of measurement techniques such as pressure taps, high frame rate cameras, optical probes, radioactive tracers, laser Doppler anemometry (LDR) and positron emission particle tracking (PEPT). These studies have already been reviewed elsewhere [7,32,146,147] and will not be re-evaluated in this present work, only some of their conclusions will be discussed here.

2.4.1. Axial and Radial Profiles

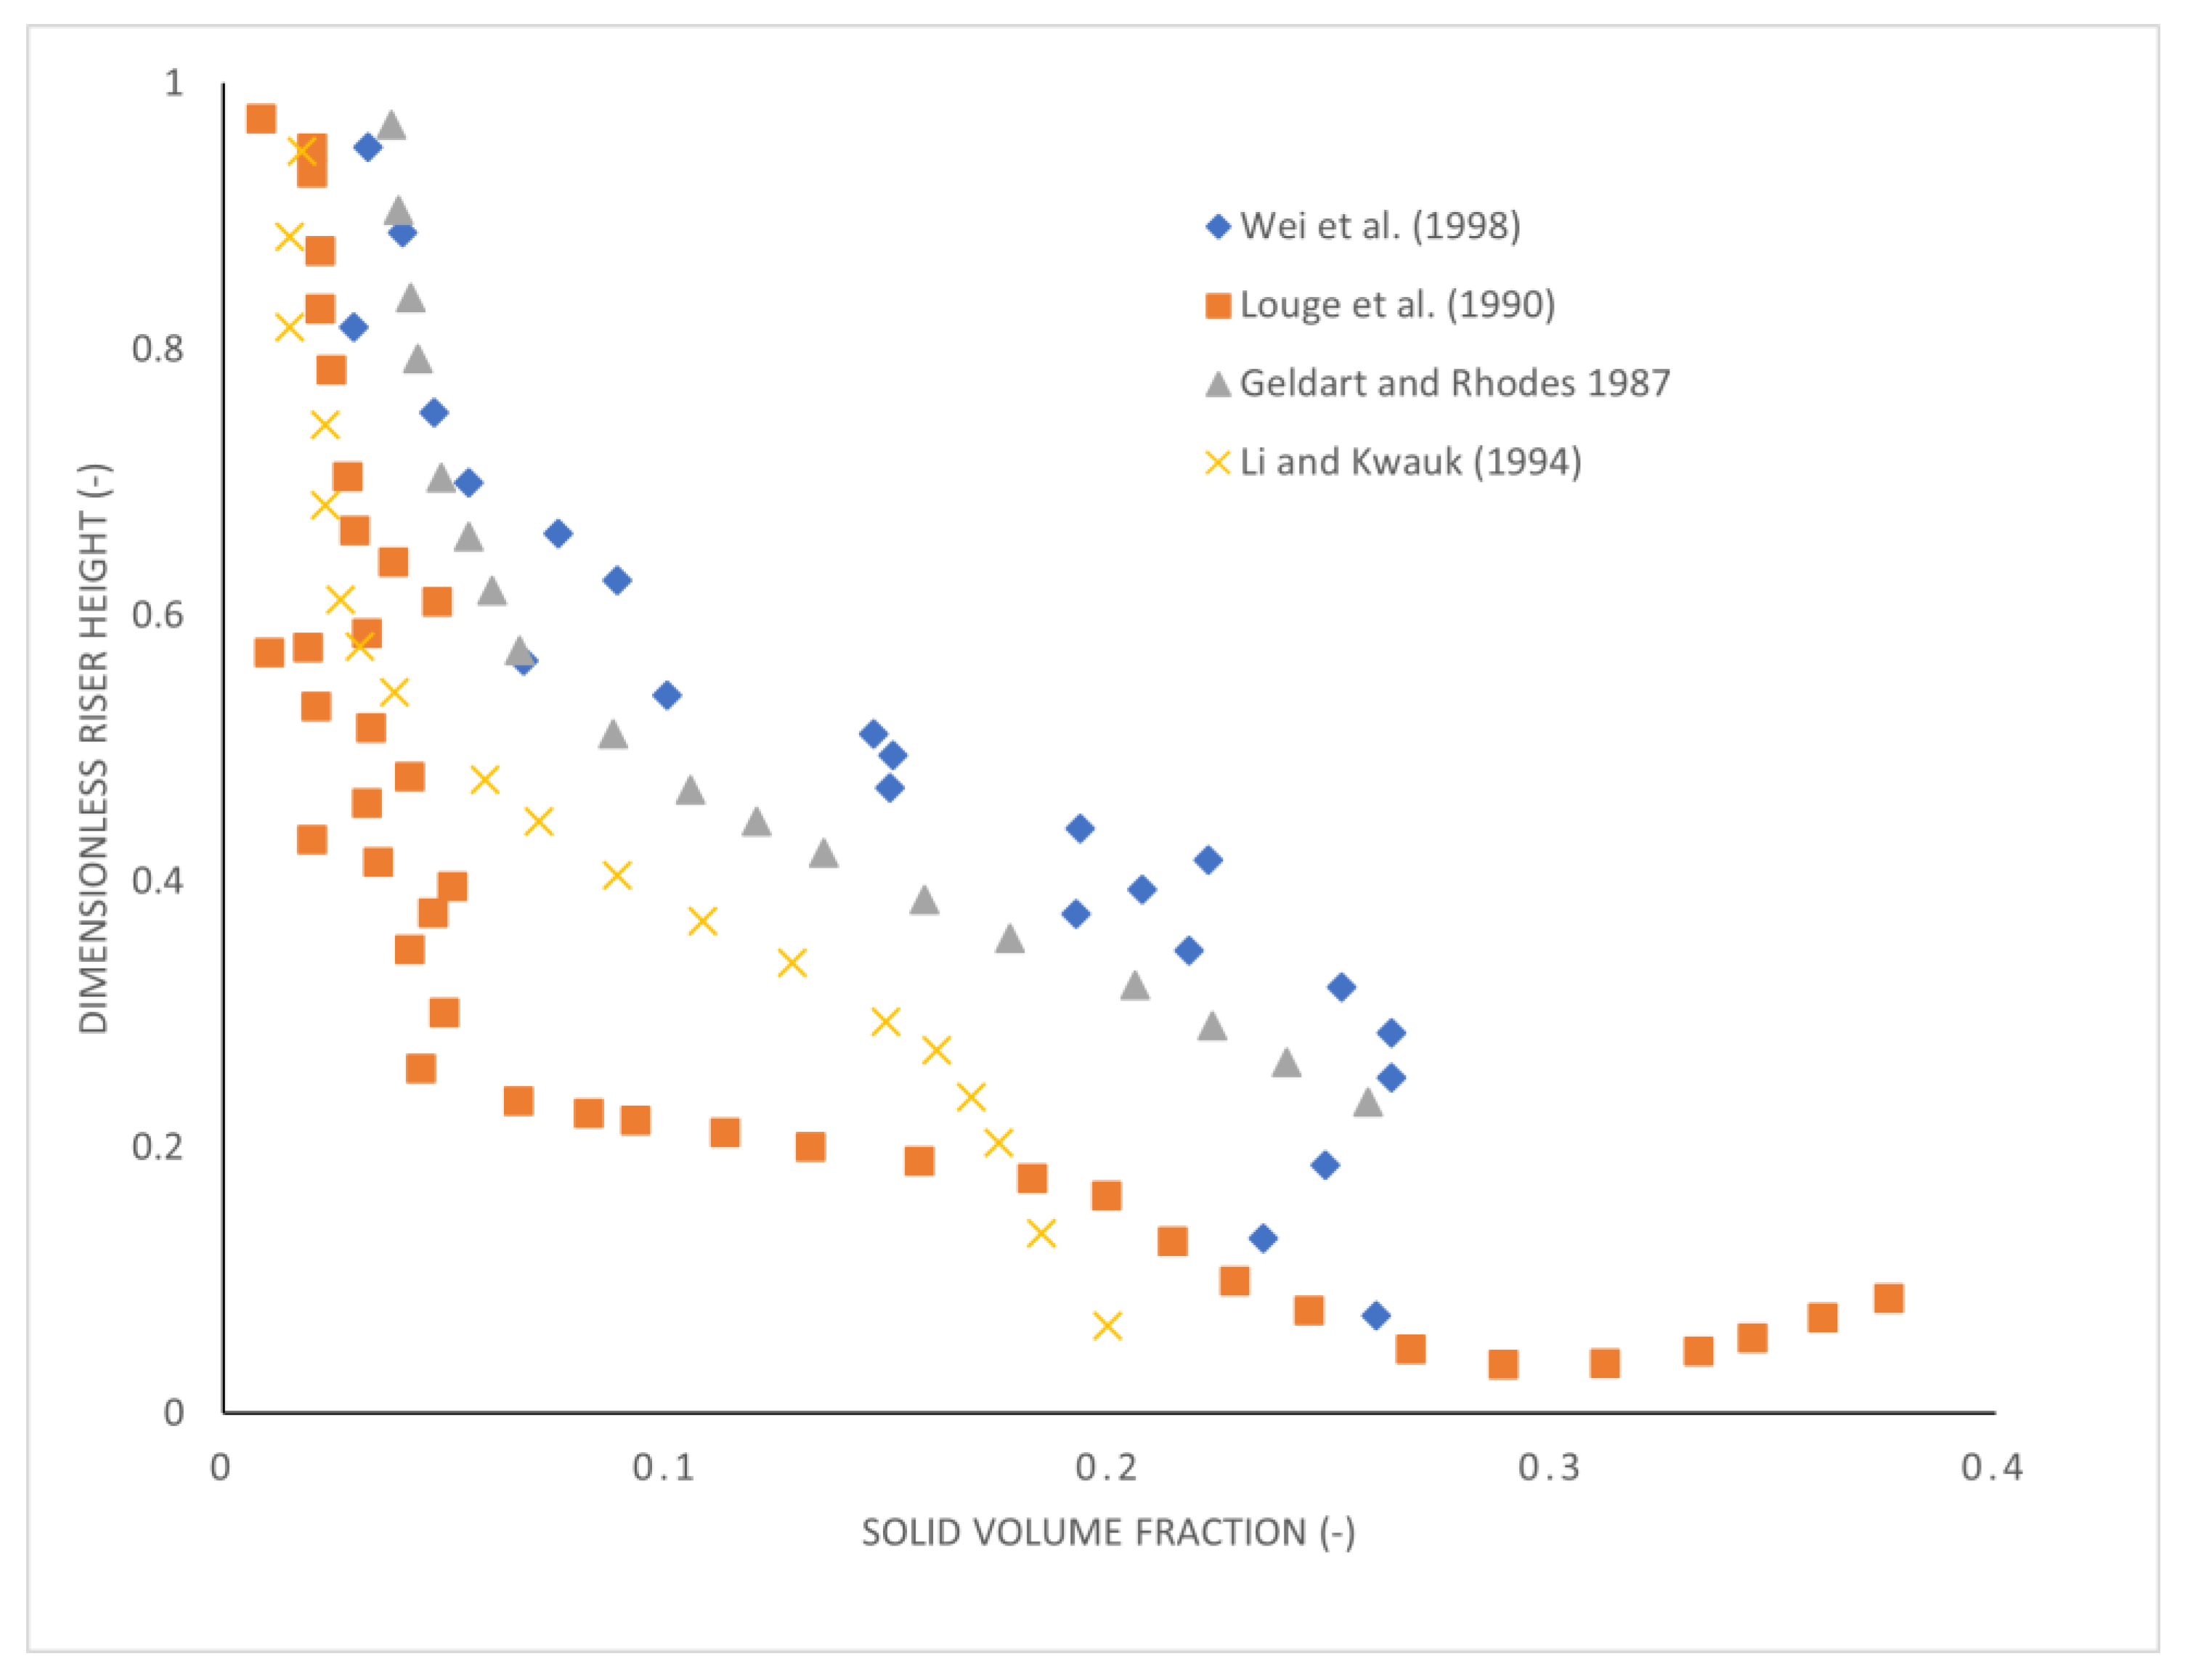
Pressure, velocity and axial profiles have been measured at different locations along the riser height and radial positions. Figure 7 shows the variation of solids volume fraction in the axial direction of the riser reported by researchers [148,149,150,151,152] and collated by Shah et al. [7]. Shah and colleagues [7] describe this axial profiles as having a characteristic ‘S-shape’. This sort of profile in solids fraction is discussed in greater detail in the regenerator; however, the profiles in Figure 7 show a smoother transition between the dense bottom and the lean freeboard region. In fact, from Figure 7 it can be concluded that the boundary between the dense bottom and the freeboard is more diffuse, unlike in the profiles for the regenerator, and may not be discernible by the naked eye. Although the experiments from which the axial profiles are measured are carried out at conditions dissimilar from those of an industrial FCC riser in normal operation, the results are nevertheless important for understanding of flow inside the FCC riser. What is also of note is that the collated data are also compiled from a variety of flow conditions and its general agreement (i.e., in terms of the ‘s-shape’ profile) does give confidence in this observed result. From the data in Figure 7 we can make a general observation that the bottom dense region solids volume fraction lies in the range 0.2–0.4, while the top dilute (‘lean’) region solids volume fraction is in the range 0–0.1. The transition region can be seen to occupy the region between 0.2–0.5 in terms of the dimensionless riser, which corresponds to about 30% of the riser height. However, these results will be influenced by gas velocity and catalyst circulation rates. Pärssinen and Zhu [152] have shown that at constant catalyst circulation rate, the decreasing the gas velocity resulted in a clearer distinction between the bottom dense region and the top freeboard. This is expected as lowering the gas velocity approaches the regime of regenerator operation. Higher velocity would then clearly lead to a smoother transition between the top and bottom regions.
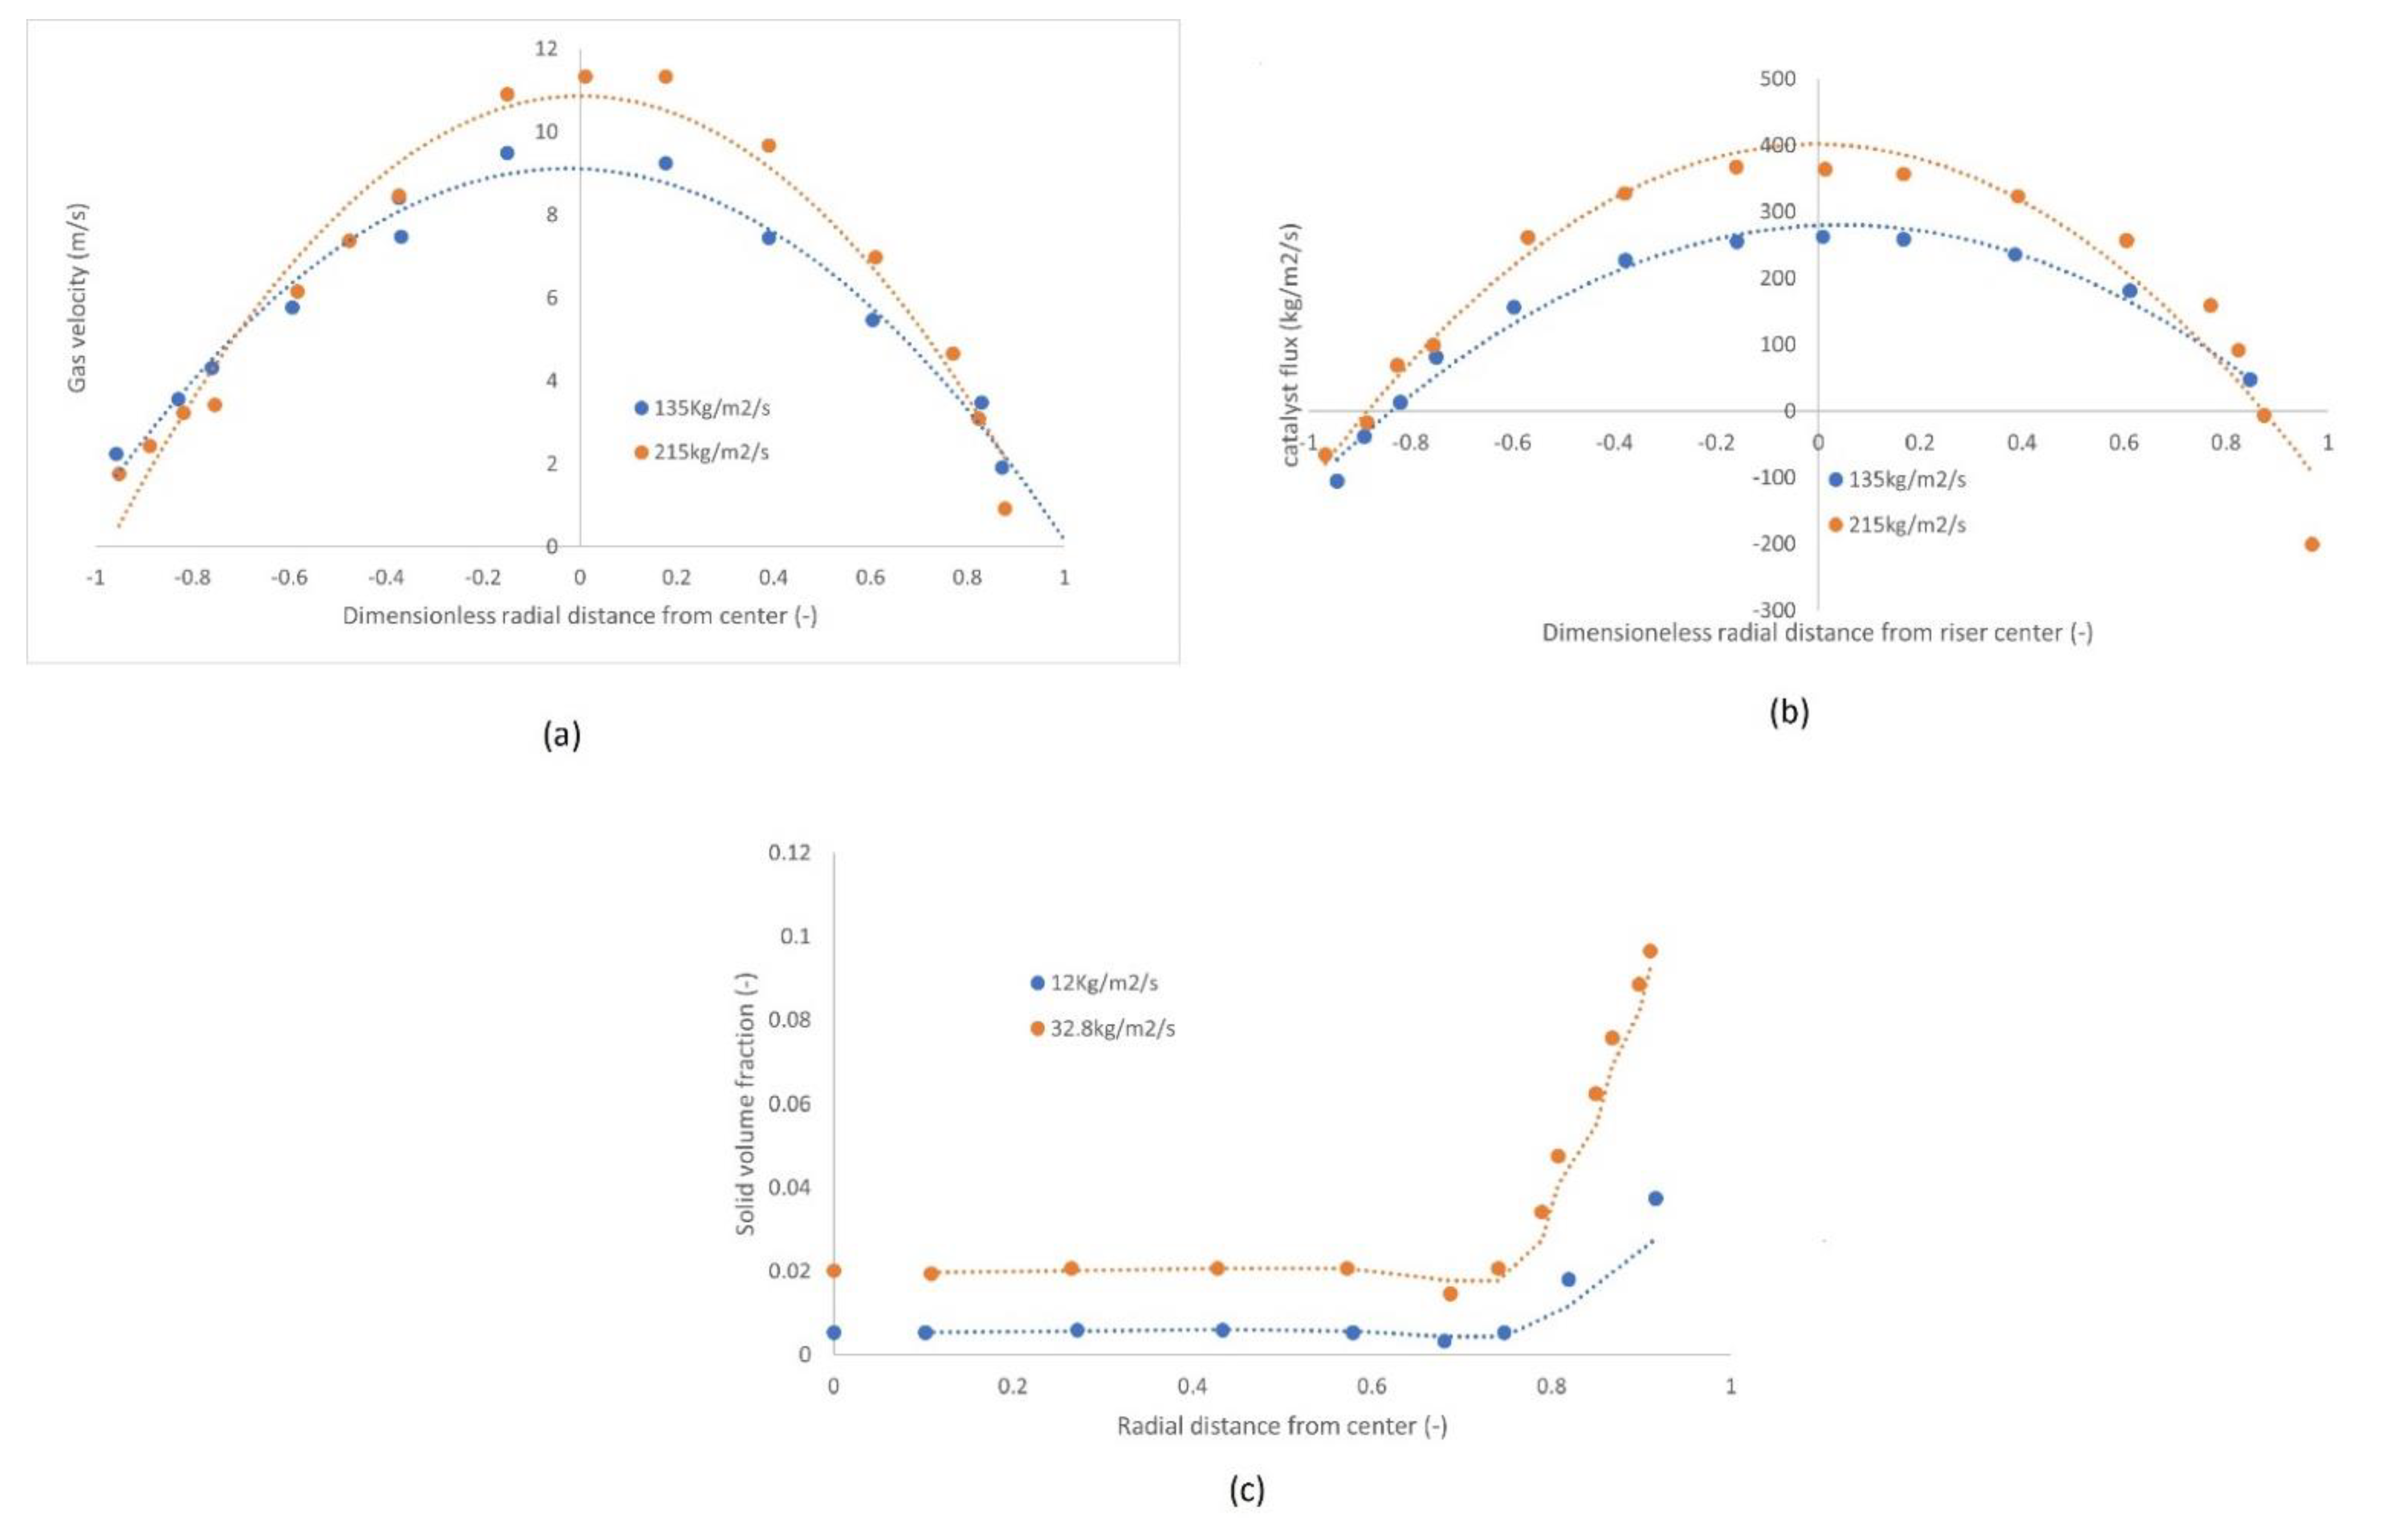
Derouin et al. [153] have reported radial variation of gas velocity and catalyst flux from cold flow of FCC catalyst in a CFB riser (Figure 8a,b respectively), and Miller and Gidaspow [154] have reported radial variation of solids volume fraction (Figure 8c). The radial solids profiles show a solid lean region in the centre of the riser and a solid rich region near the walls of the riser. This is the so-called core–annulus radial profile, which shows a solid lean core moving upward with the gas surrounded by a solid rich annus layer at the walls of the riser. These observations have also been made by various researchers [155,156,157,158]. The mean solids concentration is observed to decrease from bottom to the top of the riser [153], and higher gas velocities increase solids volume fraction at the same radial position and increases the solids concentration in the annulus [154] (see Figure 8c). The gas and solids in the core are seen to move faster than in the regions near the wall. The radial profiles are often described as being quadratic about the centreline [32], however, the observed symmetry is not always perfect [153]. Two reasons have been suggested for the two separate solids flows in the core and annulus region: (i) energy dissipation due to friction at the wall and particle collisions [7], (ii) and formations of clusters inside the suspension [154,159,160]. Yerushalmi and Cankurt [161] are some of the initial reported observations of clusters in CFB risers, where solids are seen moving in groups (or ‘strands’ and ‘ribbons’) within the rising gas. Recent studies [162,163] have also captured movement of clusters along the riser wall. They have found that clusters can vary dramatically in terms of size, from a few particles to length scales in the order of a few riser diameters. Horio and Kuroki [164,165] have also reported that clusters are not only confined to the riser wall but can be found in the core region. These clusters then present a flow inhomogeneity that is different from that observed in the regenerator where the voids are seen rising through the emulsion and, therefore, presents a different challenge with regards to modelling the flow. Figure 8b also shows that solids flow in the annulus can be negative i.e., downflow of solids instead of upward co-current flow with gas. This downward solid velocity has also been observed by various researchers [166,167]. Of course, downward flow of solids at the wall was also observed in solids back-mixing in bubbling/turbulent beds. The definition of the diameter of the core is somewhat debatable, the core–annulus boundary can be defined as the position where the radial velocity profile of the solids becomes negative or it can be defined as the position where the time-averaged particle velocity is zero, with the two different assumptions giving different results especially in terms of modelling [145]. Experiments have, however, shown that the core occupies about 60–80% of the riser diameter while the annulus occupies about 20–40% of the riser cross-section [7]. It is reasonable to assume that the ranges given are large enough that the choice of core diameter does not affect the result.

2.4.2. Gas and Solid Mixing

For gas mixing, a distinction can be made between mixing of gas at the macro and micro scales [145]. The former relates to gas-solid mixing patterns inside the riser unit at reactor scale, which greatly affect the vertical mixing phenomena, and to the turbulent eddy currents at the small scale [168]. On the other hand, micro-mixing is related to molecular transport phenomena such as diffusion in porous particles and is usually only of significance in cases of fast reactions where the reactions are mass transfer limited [169]. In cases of chemical reaction-limited processes, the concentration of gas at the reaction site in heterogenous systems is assumed to be the same as that of the bulk flow, so that only meso and macro mixing phenomena is important. At the meso-scale, gas mixing is influenced by various flow structures such as clusters, and by the existence of different regions (such as dense bottom and particle lean freeboard) at the macro-scale [33]. Therefore, it is clear that the gas mixing occurring in the riser is different in specific regions of the riser [170,171]. Because of variations in process conditions and their influence on gas mixing, it is expected that the concepts of mixing will be different depending on the process [172]. In processes such as the catalytic cracking in FCC risers, the product of the process is the gas therefore the back-mixing of gas is undesirable [33]. In these cases, process variables such as gas flow rate and catalyst circulation rate are optimised to minimise the level of gas back-mixing in the riser. Quantitative study of the mixing behaviour of gases in the CFB riser is usually carried out using gas tracer experiments. Experimental data (such as concentration of tracer gas at various positions in the riser) is plotted against a suitable mixing model (such as dispersion or residence time distribution (RTD). Schugerl [173] suggested that three dispersion coefficients are required to quantitatively describe mixing of a gas in gas-solid fluidised beds: D g a , which characterises the extent of axial back-mixing of gas, D g r , which characterises the extent of radial dispersion, and lastly D g which is the effective dispersion coefficient. Schugerl [173] reports that these coefficients are related by:
D g = D g a + β v 2 ( D 2 D g r )
where v is the gas velocity, D   is the vessel diameter and β is a dimensionless measure of the radial flow profile (i.e., parabolic flows have β = 1 192 ). D g a can be obtained from RTD data of the tracer gas, and D g r can be evaluated from tracer gas concentration measurements obtained at different lateral positions in the riser that are downstream of the tracer injection position. Grace et al. [33] have collated data from various researchers [171,174,175,176,177] and plotted the variation of the inverse Peclet number ( D g a D v ) with superficial gas velocity. Their plot showed that axial gas dispersion increases as solids mass flux increases (while gas flow rate is unchanged) and it increases as gas velocity decreases (while solid flux is unchanged). As gas velocity increases towards pneumatic transport regime, Li and Wu [171] reported that the spread of the RTD decreased showing that the amount of gas back-mixing also decreased. On the other hand, gas back-mixing increased when the solid density of the suspension increased, mainly as a result of the increased solid downflow that is observed at the wall wall region [176,177]. RTD comparison of solids and gases by Van Zoonen [175] revealed that axial dispersion of gas is lower compared to that of solids, but both RTD data show flow patterns that deviate from what is expected for plug flow. Bai [177] concluded that while the degree of axial dispersion of the gas is small compared to that of the solids, it still is significant enough that it should not be ignored. On the other hand, early data from researchers [161,167,178] suggested that back-mixing of gas decreased substantially beyond the turbulent regime towards fast and pneumatic fluidisation regimes, so that gas may be assumed to have substantial plug flow in that regime. However, that claim was questioned by Li and Weinstein [170] who reported considerable gas back-mixing in fast fluidisation regime, clearly in contrast to the earlier work. The results from Werther et al. [179] suggested that regions of the bed with low solid concentrations (such as the dilute upward moving core) may be sufficiently described using plug flow for gas mixing, which suggests the gas behaviour in the fast velocity risers is much better accounted for with a two-region model that have separate descriptions for gas mixing in each region (i.e., the so-called core-annular models). In this case, the plug flow of gas would be assumed in the lean core and dispersion accounted for in the solid rich annular region. According to Li and Weinstein [170], the complicated axial gas mixing characteristics are due to the presence of macroscopic flow structures (i.e., clusters) that form particle groups of various sizes, in both the vertical and lateral directions of the CFB risers. The result is both spatial and temporal distributed heterogeneity in the riser suspension. As a result, time-averaged measurements at some fixed position in the riser may not average over this observed heterogeneity [170]. Observations of clusters in CFB risers have already been described in the previous section.
On the other hand, some research groups [180,181] have found evidence of poor lateral mixing in industrial CFB risers. They reported three crucial observations about radial dispersion: (a) dispersion is maximum in the absence of solids, (b) dilute transport in the riser reduces D g r , and (c) increased solid density of the suspension increases turbulence and therefore an increase in gas mixing. These results show that solids can enhance or dampen gas turbulence in the riser depending on their concentration. Therefore, which effect solids have on the gas should be considered in modelling gas mixing. It is usually difficult to compare the results of gas dispersion coefficients from different researchers because of a wide variation of results, stemming from differences in such things as injection locations of tracer material, injection technique and models applied [146]. However, from the results discussed here it is evident that the gas mixing (both radial and axial) is highly influenced by the concentration of solids in the bed. The downflow of solids, which is usually observed at the walls of the bed, results in increased gas back-mixing, and this is affected by both the gas velocity and the solids flux. The poor lateral mixing of the gas is clearly a significant downside of the CFB risers especially in areas where a high level of gas-solid mixing is required such as the FCC riser. It is therefore important that models reflect this, hence the need for more 2/3D models of the FCC riser.
Generally, studies that investigate mixing of particles in CFB risers have been carried out in a similar manner to that used for gases: fitting experimental data to dispersion or RTD models. By studying pressure changes at the bottom dense zone of a cold flow CFB riser, Svensson et al. [182,183] found that this region is hydrodynamically quite similar to that of bubbling bed regime, like behaviour seen in the FCC regenerator. Most of the gas is seen passing through this region in the form of bubbles, or empty voids. Wei et al. [184] using FCC particles in a commercial scale 5.8   m diameter riser, reported data that suggest that the solid axial dispersion coefficient ( D s a ) was somewhat dependent on the riser diameter. This result suggests that wider riser reactors experience more solids back mixing compared to narrow beds. If only the riser diameter is changed without increasing the gas flow rate, then it is easy to see why this result would hold, as wider risers would have lower superficial gas velocities. Lee and Kim [185] have studied axial solid mixing in a turbulent bed using quasi steady state heat transport in the axial direction. They have correlated the axial solids Peclet number to the Archimedes number:
P e = 4.22 × 10 3 A r
In the turbulent regime it was shown that fine particles exhibited higher dispersion coefficients. The authors attribute this to differences in wake fractions, influence of turbulence and motion of solid clusters. Increase in gas velocity was shown to result in increase in both axial and radial solid dispersion coefficients. This may reasonably be explained by the fact that higher gas velocities increase the turbulence in the bed resulting in better heat and mass transfer.
This section has discussed some of the experimental studies into the mixing behaviour of gas and solid in CFB risers. It is evident that the mixing characteristic of the reacting suspension in the FCC riser is dependent upon solid concentration and gas–solid flow rates. There is some ambiguity in the literature about whether plug flow assumption is valid to describe the mixing of gas and solids, although researchers seem to lean towards plug flow only being suitable for dilute beds, or regimes of the bed. Solid mixing is more complex due to the observed core-annular profile and downflow near the wall, hence, to model the system more realistically these features must be considered. The next section reviews some of the common modelling approaches of the FCC riser, based on the lessons described here from the literature.

2.5. Hydrodynamic Models of Circulating Fluidised Bed (CFB) Risers

The distribution of gas and solids in the CFB riser has already been discussed, and most experimental data indicate that there is an uneven distribution of both the gas and the solids across the riser cross section. This observation is no doubt important to the performance of such riser reactors and, therefore, important to its modelling. Three macroscopic balance equations are fundamental to the modelling of the FCC riser; material balance of transport equation for species to describe the evolution of species concentration across the reactor, momentum balances for solids and gas to describe their velocities in the riser, and an energy balance to describe the evolution of temperature across the reactor. For material balances, a review of the literature on mixing in the riser reveals two types of models used to describe the system: (i) pseudo-homogenous models, and (ii) two-region or core–annulus models. The type (i) models are usually simple models that assume a single-phase suspension flowing up the riser and so they take no regard of the heterogeneity present in the riser. On the other hand, type (ii) models make a distinction between the annulus and flow in the core to account for the observed difference between these two regions in the riser. The modelling assumed here is that of the fully developed region of the riser which is downstream of the gas entry point. Of course, the bottom region of the FCC riser (the so-called vaporisation region) is more complicated as it is the region where gas oil feed and lifting steam meets the hot catalyst, and the feed is subsequently vaporised. There is then a simultaneous existence of solids, liquid and gas, which makes it more complex to describe in mathematical models. As a result, this region will be treated separately.
  • Pseudo-homogeneous models
    These assume that flow is turbulent, but non-isotropic so that variations present in the vertical directions may be different from those occurring horizontally [168], but no macroscopic flow heterogeneity in different regions of the bed is made, that is, at the macro scale flow is essentially similar through the bed. The mass balance equation will usually include dispersion coefficients for both axial and radial positions to account for mixing. Grace et al. [33] present the following general equation for simple homogeneous dispersion models:
    C t = U ε C z + D g a 2 C z + D g r r (   r C r   ) + S + R C
    where S   and   R C are the source term and the rate equation for the gas component as defined by the kinetic model. Note that here only the gas equation is shown as this is usually the important mass balance for the process with gaseous products. In the case of one-dimensional models [161,171,184,186,187] the radial term may be dropped so that the dispersion equation becomes:
    C t = U ε C z + D g 2 C z + S + R C
    Other possible simplifications include the assumption of steady state, which is quite common in FCC riser modelling due to the perceived insignificance of the riser dynamics compared to that of the regenerator [5]. If plug flow is assumed for the gas, D g = 0 , and if the gas is assumed to be well mixed, D g = .
  • Core–annulus models
    These models are based on the core–annular profile that was observed in fully developed CFB risers by various researchers. The generalised core equations are shown below, contributions for core-annulus interchange from [32] and contributions for dispersion from [179]:
    C t = U C z + D g a 2 C z + D g r r (   r C r   ) 2 k r c ( C c C a )
    Both axial and radial dispersion have been included, but for 1D models either one can be ignored. the transient term may also be ignored for steady-state simulation, which is a common assumption for modelling FCC risers. The gas in the core is usually assumed to be stagnant or be descending at relatively low velocity, hence convective flow terms may be ignored, the material balance equations for gas in this region are given by [32]:
    C t 2 k r c R 2 r c 2 ( C c C a ) = 0
    r c ,   R   are the core radius and the riser radius respectively, and subscripts a , c   are the annulus and the core regions respectively. The convective flow terms may be included for the solid phase in order to capture the effect of the downward flow of solids in the annular region that is shown in Figure 8b.
The material balance equations are coupled to the momentum equations via velocities of both solids and gases. Sometimes, especially in cases where velocity is considered constant or given empirically [188] researchers have found it sufficient to only consider the material balance equations. But in systems such as the FCC riser where considerable expansions are expected during vaporisation and, therefore, acceleration is expected, evolution of velocity is found via momentum equations.
For momentum balances, Tsuo and Gidaspow [189] have collapsed the Navier–Stokes equations to provide one-dimensional momentum balance equations for solids and gases along a CFB riser reactor. The 1-D equations are derived by averaging over the pipe radius, and the viscosity terms are replaced by Fanning friction-type coefficients ( f i   for   i = s , g ) in order to account for the energy loses within the flowing phase. All pressure drop is assumed to be on the gas phase, and a solid compressive stress modulus ( G ) term is introduced on the solids phase [189]:
For gases:
( ρ g ε g v g ) t + ( ρ g ε g v g v g ) z = P z + β ( v s v g ) + 2 f g ε g ρ g v g 2 D + ε g ρ g g
For solids:
( ρ s ε s v s ) t + ( ρ s ε s v s v s ) z = G ε s z + β ( v g v s ) + 2 f s ε s ρ s v s 2 D + ε s ρ s g
Above, the term with the β accounts for the friction between the two phases, and the bracketed term corresponds to the slip velocity between the phases. This slip velocity is important because the particles in the riser will generally have a longer residence time than the gases. Admittedly, Tsuo and Gidaspow [189] have reported that the 1-D momentum balance model is poor at predicting the cluster formation or solid reverse flow in CFB risers and, therefore, often poorly predicts the velocity and volume fractions. However, because reaction engineering models of the FCC risers are largely 1-D models, this equation (or its variants) is usually used [5,45]. Short reviews for the correlations for β   and   f i are available in the literature [7,190]. The above description uses what is commonly called two-fluid modelling or Eulerian-Eulerian (E-E) phase description where the continuum assumption is made [7,13,190,191,192]). Alternatively, the Eulerian-Langrangian (E-L) approach may be used where the continuum assumptions for the gas still holds but the particle are considered as a discrete phase [7]. For a cluster of particles, whose diameter d c l is known, a force balance is carried out around the cluster to determine the evolution of particle velocity in the riser [193,194,195]:
ρ π d c l 3 6 v s t = C D ( ρ g ( v g v c ) 2 ) 2 ( π d c l 2 4 ) + ρ g π d c l 3 g 6 ρ c π d c l 3 g 6
where C D is the gas–solid interphase coefficient or drag coefficient similar to β above in the E-E momentum equations. Corelations for d c l relative to the particle diameter exist in the literature [196]. Both E-E and E-L modelling approaches are now well established and have been thoroughly reviewed elsewhere [7,192].
A review of the literature on FCC riser models (Table 8) show that there are generally two approaches to describing the temperature of the riser: (i) thermal equilibrium being catalyst and gas phase, and (ii) considering the thermal resistance between the catalyst and the gas phase. In type (i) models, only one energy balance is made for the riser where it is assumed that both phases have the same temperature at any axial and/or radial position. The steady-state energy balance in this case for plug flow of gas and solids can be written as [197]:
T z = A R S ε c   Δ H i r i F c C p c +   F j C p j  
where i   is the lump-to-lump reaction iterator, and j is the lump iterator, Δ H i is the enthalpy change of reaction of lump-to-lump reaction i and r i is the rate of reaction i . For type (ii) models, separate equations for both catalyst and gas phase are developed so that exchange of energy between the two phases is considered:
T g z = A R S k a g s ( T c T g ) F g C p ¯ g
( T c z ) = A R S k a g s ( T g T c ) F g C p ¯ g + ρ c ε c   Δ H i r i
a g s is the effective heat transfer area per unit volume at the gas–solid interphase and h g s is the heat transfer coefficient between the gas and the catalyst, which is usually taken from Nusselt number correlations for the flow. Note that here the heat required for the cracking reactions is assumed to be from the catalyst side as reactions are assumed to be occurring on the catalyst surface; however, other researchers have used the gas side for the heat of cracking [5]. The boundary equations for the differential equations discussed here are such that conditions at z = 0 are equal to the conditions at the feed vaporisation section.

2.6. Feed Vaporisation

The vaporisation process occurs at the bottom of riser, where preheated atomised gas oil feed, atomising steam and the hot regenerated catalyst from the regenerator come into contact and mix. During this contact, the atomised feed droplets undergo intense mixing and vaporise almost instantly [198]. The heat and mass transfer processes occurring during this stage of the riser are very complex, which introduces a great challenge to the modelling of FCC risers. The heat from the catalyst provides both the sensible heat, the heat required for vaporisation of the feedstock and the heat to power the highly endothermic cracking reactions occurring in the FCC riser, hence the regenerated catalyst temperature is a crucial parameter in the FCC riser system. Because of a high degree of turbulence, large thermal gradients and high flow inhomogeneity in the vaporisation section, it makes it the most complex region to model in the entirety of the riser reactor [199]. Studies have also shown that the diameters of the atomised feed [200,201], the nozzle and particle wetting characteristics of particles [202,203,204,205] also play crucial roles in feed vaporisation, proving the complexity of the vaporisation section to modelling. However, according to plant data from Ali et al. [199], the entirety of the vaporisation process only occurs in 0.1 s, corresponding to only about 3% of the residence time of catalyst in the riser. For this reason, a large majority of researchers have assumed instant vaporisation of the feed gas oil; therefore, this section of the riser can be treated as a heat-transfer section (corresponding to z = 0 for the riser axial position) in which catalyst, steam and feed meet. This is described mathematically by for catalyst and gas respectively [5]:
T c = T c R G F G O F c C ¯ p c ( C ¯ p G O ( T G O T g F S ) + F s C ¯ p s F G O ( T g F S T s ) + Δ H v G O )
T g F S = B A log ( P × y G O ) C
where A, B and C are Antoine coefficients for the gas oil feed and P × y G O is the partial pressure of the gas oil after vaporisation. T ,   F ,   C are the temperature, mass flow rate and heat capacities respectively, with subscripts c, GO, s corresponding to catalyst, gas oil and dispersion steam and F S ,   R G corresponding to feed section and regenerator respectively. Δ H v G O   is the enthalpy change of vaporisation of gas oil, correlations for it are available in the literature. To account for vapor phase expansion after vaporisation, a simple gas law equation with compressibility factor is used:
v g = F s + F G O ρ g ( 1 ε c R G ) A R G
ρ g = P × M w ¯ g R T g F S Z g
where A R G ,   M w ¯ g ,   Z g   are the riser cross sectional area, average molar mass of the gas phase and the compressibility factor of the gas phase. The initial catalyst velocity may be calculated from the circulation rate:
F c = F c R G ρ c ε c R G A R G
The above describes the simple vaporisation section model (for z = 0 ) where instant vaporisation is assumed. Contrary to this, the vaporisation section may be described using more detailed models that account for the penetration length of the droplet phase through the bed. For this, momentum and material balance equations for the droplet phase are included so that they are coupled with those for the catalyst and the gaseous phase, using either E-E or E-L approaches. These models have been thoroughly reviewed elsewhere in the literature [7,198]. Table 8 summarizes the FCC riser models in the literature.
Table 8. Summary of FCC riser models in the literature.
Authors1/2DKinetic ApproachKinetic ModelDeactivation FunctionVaporisationMaterial BalanceMomentum Balance ApproachEnergy Balance
[2]1D10-lump model of [18]Parameters from [18]
Coking tendency by [18,142,206]
COC by [142] Pseudo-homogenous phase, plug flow of gas and solids.No slipThermal equilibrium
[113]1DSingle event kinetics 646 partially lumped components and reaction network with 44169 global reactions.COC by [18], N2 deactivation considered.Instant Pseudo-homogenous phase, plug flow of gas. Empirical coke formation from Jacob [17]N/A (gas-solid slip accounted for but not shown in equations)Thermal equilibrium
[5,6]1D4-lump modelGS, GS, LG, CK lumps considered, parameters from [80]COCInstantTwo-phase gas-solid flow, plug flow of gas and solids.E-EInterphase resistance considered
[45]1DPseudo-component model50 pseudo-components considered, rates characterised by normal boiling temp and MR.COC by [143]Instant
IG molar expansion
Compartments in series for gas and solids (pseudo-homogeneous).E-EThermal equilibrium
[207]1D6-lump model of Takatsuka [208]VGO, DO, LCO, GS, LPG, FG lumps consideredCOCInstant Pseudo-homogenous phase, plug flow of gas.E-LThermal equilibrium
[209,210]2D6-lump model of [211]VGO, LCO, GS, LPG, FG, CK lumps considered, inverse parameter estimation used for parametersCOCN/APseudo-homogenous phase, plug flow of gas and solids with axial and radial axis.E-EInterphase resistance considered.
[188]1D4-lump model of [80]GS, LG, GS, CK lumps considered, parameters from [80]TOS by [14]Instant Plug flow for gas and solid (pseudo-homogeneous).Empirical Slip factor correlation by Patience [212]Thermal equilibrium
[213]1DSemi-continuous model Kinetic parameters expressed using the beta distribution [214] as a function of boiling point tempCOC by [137]Instant Plug flow for gas and solid (pseudo-homogeneous).N/AThermal equilibrium
[88]1D4-lump modelGS, GS, LG, CK lumps considered, parameters form [188]TOS by [14]Instant Pseudo-homogenous phase, plug flow of gas and solids.N/AThermal equilibrium
[197]1D6-lump model of Takatsuka et al. [208]VGO, LCO, GS, LPG, FG, CK lumps consideredCOCinstantPlug flow for gas and solid (pseudo-homogeneous).E-EThermal equilibrium
[215]1DPseudo-component model42 pseudo components considered, rates characterised by normal boiling temp (ΔT = 30 °C) and densities.COC from [45] InstantPseudo-homogenous phase, plug flow of gas and solids.E-EThermal equilibrium
[216]1D4-Lump modelVGO, GS, LG, CK lumps considered, kinetic parameters of [75,143]COC by [143]instantCompartments or CSTR in series for gas and solids (pseudo-homogeneous).E-LThermal equilibrium
[217]1D3-lump model of [74]GO, GS, CK + LG lumps considered, parameters from [74]
Coking rate by Lee [218]
COCInstantPseudo-homogenous phase, plug flow of gas and solidsNo slipThermal equilibrium
[219]1DPseudo-component modelPseudo components considered; rates characterised by normal boiling temp (ΔT = 15–30 °C).COC by [143]InstantPseudo-homogenous phase, plug flow of gas and solidsE-EThermal equilibrium
[85]1D6-lump modelGO, DZ, GS, LPG, DG, CK lumps considered, parameter estimation for parameters.COC as defined by [6]InstantTwo-phase gas-solid flow, plug flow of gas and solids.E-EInterphase resistance considered
[220]1DHybrid structure-oriented model and bond-electron matrixFeed molecular reconstruction
Auto reaction generation similar to [221,222] Reaction network with 3827 molecules and 7572 reactions.
Adsorption and diffusion considered.
COC from [86] Deactivation by N2 and heavy aromatics from [86]InstantPseudo-homogenous phase, plug flow of gas and solidsN/AIsothermal reactor
Lumps: GO—Gas oil, VGO—Vacuum gas oil, LCO—Light cycle oil, GS—Gasoline, LG—Light gases, DZ—Diesel, CK—Coke, LPG—Liquid petroleum gas. Deactivation: COC—Coke-on-catalyst, TOS—Time-on-stream. Momentum equations phase description: E-E—Eulerian, E-L—Eulerian–Lagrangian. Pseudo-component modelling: Δ T —Temperature difference for the narrow cuts in True boiling point curve corresponding to a pseudo-component. N/A—Equation not included in the model, or not shown on the journal article. Material balance: Pseudo-homogeneous implies solid–gas suspension is treated as a single-phase ignoring core–annulus flow structure.

2.7. Riser Performance Prediction

The prediction of the models, employing different kinetic approaches, is compared against known experimental data available in the literature.
Figure 9 shows a comparison of model predicted profiles of gas oil conversion reported by various researchers [45,188,197,223] to the commercial data reported by Derouin et al. [153] and pilot scale plant data reported by Shah et al. [224]. All the simulation gas oil conversion profiles show similar trends to the measured data along the riser height. Both sets of data, model predictions and measured data, show a steep rise in the conversion within the first 20% of the riser height, then followed by a plateauing effect through to the rest of the riser. This is because the bottom of the riser is where the catalyst is most active, but it is quickly deactivated by the formation of coke, thereby resulting in slow reactions for the remainder of the reactor. This is also evident in the temperature profiles in Figure 10 reported by [6,219] showing steep temperature gradient in the first 20% of the riser followed by a levelling off. Figure 9 shows that typical gas oil conversion is in the range 45–80%. Shah et al. [7] have attributed the discrepancy in the final gas oil conversion of [153,224] to the flow conditions. The feed and the catalyst flow rates are 5–10 times higher in the case of Derouin than that of Shah, resulting in higher gas oil conversion in the case of Derouin. Therefore, the wide range in the gas oil conversion predicted by various researchers in Figure 9 can be attributed to differences in flow conditions. The impact of the catalyst to the final conversion is also noteworthy as data of Derouin and Shah are conducted two decades apart, and in that same period there was a switch from use of zeolite Y to ZSM-5 in the FCC unit which resulted in higher conversions [225]. The early 2000s saw another shift to hierarchical pore architecture zeolite catalyst (e.g., NaY, Meso Y) that further bumped up the conversion; therefore, it is reasonable to assume that some of the discrepancies in the gas oil conversion reported is attributable to the catalyst used, especially because lump kinetics are reliant of the catalyst and feed used.
In Figure 10 in the case where heat transfer resistance is considered between the catalyst and the gas, the vaporisation at the bottom of the riser is assumed to only heat up gas oil to the temperature at which it all turns to vapor; therefore, the gas continues to rise in temperature up the riser. In this period, the hot catalyst provides both this sensible heat and that heat required for cracking, hence catalyst temperature goes down while gas temperature increases. On the other hand, in the case of thermal equilibrium between catalyst and gas, the gas is vaporised and then heated to the same temperature as the catalyst in the vaporisation section, and then the catalyst–gas suspension provides the necessary heat for the cracking reactions hence its temperature decreases along the height of the riser. It may be reasonable to assume that vaporisation occurs so rapidly that it is instantaneous (as discussed earlier), as in both cases discussed here, but the subsequent sensible heat temperature gain of the gas is shown in the case of Han and Chung [6] that it takes about 20 %   of the riser height for gas to approach the catalyst temperature which casts doubt on the assumption of other cases where this is also assumed to occur instantaneously. Figure 10 shows that the exit temperature of the catalyst from the riser is in the range 780–800 K or 507–527 °C which is consistent with data on the spent catalyst entry temperature into the regenerator which we have shown in Part II of this paper.

2.8. Shortcomings and Future Recommendations

The following shortcomings have been identified from the review of FCC riser models:
(a)
Vaporisation: the vaporisation has mostly been assumed to be instantaneous (Table 8) to avoid complicating the model. The recent review by Nguyen et al. [198] showed that models that describe vaporisation of atomised droplets in fluidised beds show wide variations in vaporisation times depending on flow conditions and, therefore, even if the assumption of rapid vaporisation may be valid in some cases, it may not be in others. Hence, this section needs to be considered more rigorously in the models to distinguish between the two cases, as ignoring it may lead to inaccurate predictions in certain cases.
(b)
Gas and solid dispersion: experimental data from tracer studies considered in this work showed that plug flow of gas may only be assumed in the case where the concentration of solids in the riser is low. However, Table 8 shows that researchers almost always assumed plug flow of gas, which may cause some inaccurate predictions in some cases where the plug flow assumption is inadequate. Hence, it is recommended that dispersion be considered, especially since the literature on dispersion coefficients of both solids and gases in CFB risers is vast.
(c)
Cluster formation and core–annular phase inhomogeneity: the literature about the flow structure of CFB risers is now generally in agreement about the core–annulus pattern in the fully developed region of the riser. However, all the models discussed in Table 8 have ignored this phenomenon and assumed that no flow separation is observed (i.e., pseudo-homogeneous) and, therefore, cannot predict the core–annulus profile or its effect on riser performance. 1D momentum balance equations for the riser have also been shown by Tsuo and Gidaspow [189] to be poor at describing the effect of particle clusters on flow, hence more 2D models are required to better predict the riser performance.
(d)
Kinetic modelling: Table 8 shows that most workers have overwhelmingly used discrete lumping methodology for describing the reactions in the FCC riser. Several workers have reported the values for the kinetic parameters for the conversion between different lumps which are then used by secondary workers in their models without any recalibration. However, as was discussed before, the lump parameters are very feedstock and catalyst dependent, and as shown by Shah et al. [7], these lumped kinetic parameters failed to predict well the experimental data of Nace et al. [16]. This is a clear indication that such parameters are highly influenced by reaction conditions, and therefore are more error prone when extrapolated to different operating conditions. The world has now come to a point where the computational power is great enough that molecular and structure-oriented lumping techniques such as single event kinetics which have been proved to produce parameters that are feedstock independent, are now worth pursuing. The literature on such parameters has also grown; therefore, such models can be incorporated in FCC models without the need for new parameter estimation exercises.
(e)
Thermal balances: the majority of models in Table 8 assume that heat transfer resistance between the two phases may be ignored; however, as was shown by the model from [5], thermal equilibrium between the phases is not reached in the most significant region of the riser (first 20 % ) and, therefore, this would be expected to affect the model predictions. There is also a need to explore how the various heat transfer coefficients at the gas–catalyst interphase affect the model predictions as this is yet to be investigated.
(f)
Catalyst deactivation: various models for catalyst deactivation are available in the literature and have been used by resarchers for FCC riser simulations. However, the effect of these different deactivation models on the riser predictions is not yet fully understood, hence a comparative study of the effect off different deactivation models is required.

3. Modelling FCC Unit Constitutive Components

Disengager and Stripper

This disengaging and the stripping sections are riser termination devices forming the top part of the FCC reactor vessel; these sections, often modelled together as one unit [5,6,207], are where the catalyst is separated from the product gases. Because of this separation of gas and solid phases, it is commonplace to assume that no further cracking reactions occur in this unit [5]. Stripping steam is used to remove the product gas entrained with the catalyst and remove some unreacted hydrocarbons that may be adsorbed to the catalyst surface or within the catalyst pores. These hydrocarbons in/on the catalyst serve as coke precursors that eventually form the so-called catalyst-to-oil (CTO) coke [5,226]. From the regenerator point of view, the unreacted hydrocarbons behave just like coke in that their combustion releases heat that can be used to power the riser reactions; however, these hydrocarbons produce up to 3.7 times more heat compared to regular coke which can result in temperature swings in the regenerator [226], and therefore their removal from spent catalyst is of importance to the controlled operation of the FCC unit. The stripping steam displaces these unreacted hydrocarbons from the catalyst and pushes them up to be removed with the other product gases, so that CTO coke is removed from spent catalyst.
The major important variables in the disengaging/stripping section are the holdups of catalyst and gas, the flow rates and concentrations of exit flows (i.e., flows to the stack and deactivated catalyst flow to the regenerator) and the pressure drop. Hence, because the flow patterns in the unit are less important, only global conservation balances around the unit are required to calculate these important process variables. Before balances can be made for this section, the CTO coke needs to be considered together with the catalytic coke from the riser reactions. Han and Chung [5,6] have developed the following expression for unstripped CTO coke concentration ( wt %   of   catalyst ) , depending on the stripping steam rate and the CTO ratio:
C c k C T O = C c k C T O 0 + k s s exp ( ( E s s ( CTO ) F s s )
where F s s is the stripping steam rate, E s s   and   k s s are parameters of the stripping function, CTO is the ratio of catalyst flow rate to feed oil flow rate, C c k C T O 0 is the minimum coke content attainable by stripping and C c k C T O is the concentration of CTO coke unstripped from the catalyst. Alternatively, Fernandes et al. [207] developed an empirical function of stripper temperature based on pilot plant data to calculate the contribution of CTO coke to coke-on-catalyst concentration in the stripper:
C c k C T O = exp ( 5.2113 0.0144 T S T )
Both expressions of C c k C T O given above consist of a constant followed by an additional term which is exponential in some property of the flow (e.g., temperature or flow rate). In contrast, Arbel et al. [2] developed a correlation for C c k C T O where the additional term was a linear function of stripping steam flow rate:
C c k C T O = 0.0002 + 0.0018 ( 1 k F s s )
where k is the stripping coefficient ( k = 0.08 ) and F s s is the stripping steam flow rate. Ultimately, the correlations produced for C c k C T O are predicting the concentration of unstripped CTO coke on the catalyst surface, which is a quantity related to the efficiency of the stripper. The stripper efficiency is a measure of how well the stripper removes CTO residue from the spent catalyst surface. Garcia-Dopico and Garcia [226] have reviewed the literature data on stripper efficiency, their analysis found that the efficiency is dependent on temperature, pressure, steam flow rate and catalyst residence time. The correlations given above for C c k C T O , which can be treated here as a proxy for stripper efficiency, show the dependency on temperature and steam flow rate, while the pressure dependency is not included. Researchers [226] have explained that efficiency decreases at higher pressure because partial pressure for vaporising hydrocarbons is greater making stripping difficult. However, because of the pressure balance in the FCC unit, they explain that pressure cannot be changed in the stripper without affecting the entire unit operation, therefore the effect of pressure in the variation of efficiency may be assumed constant. Be that as it may, they have developed the following stripper efficiency function using data from the literature:
η S T = ( F C T O R S F C T O S T ) F C T O R S = 100 ( 1 ( 1.6 exp ( 9445 T S T 12.5 ) ( 0.225 P S T M s t e a m c a t a l y s t ) τ S T ) )
where ( F C T O R S F C T O S T ) F C T O R S translates to the mass of CTO removed by stripping steam as a fraction of the CTO residue entering the stripper unit, M s t e a m c a t a l y s t is the mass flow rate of steam per flow rate of catalyst through the stripper, P S T is the pressure inside the stripper and τ S T is the catalyst residence time in the stripper. The stripper efficiency correlation can be used to determine the C c k C T O using a simple balance equation for the CTO residue. However, this pathway requires knowledge of CTO residue concentration at the riser outlet, hence the kinetic model used in this analysis should be able to make a distinction between different types of coke produced in the riser so that CTO residue concentration at the riser outlet can be calculated. Such kinetic models have been produced and published in the literature [227]. In the absence of such models, the correlations for C c k C T O described above should be sufficient.
For the total concentration of coke-on-catalyst in the stripper to be a sum of the catalytic coke from the riser outlet and the CTO coke, the following calculation is used:
C c k S T = C c k C T O + C c k R S
Following the analysis of Han and Chung [5,6], the mass balances for the gas and catalyst phases over the disengage/stripping unit are as follows:
d w g d t = F g R S + F s s F g R T F c R S C c k S T
d w c d t = F c R S F c S V F c M F
In the gas equation, F g R S is the gas flow rate from the riser termination, F s s is the steam flow rate into the stripper, F g R T is the exit flow rate of gas flowing from the reactor unit to the main fractionator and the last term is the flow rate of CTO coke precursor gas entrained in the steam via the stripping process. In the catalyst equation, F c R S is the catalyst flow rate terminating from the riser, F c S V is the flow rate of spent catalyst through the slide valve in the transport line to the regenerator and the last term represents the flow rate of unseparated catalyst entrained with gaseous components to the main fractionating vessel. It is important to note at this point that most researchers [2,5,6,207,217] are in agreement that, contrary to the riser where a steady state balance was sufficient, the holdup and residence times of the stripper section are important to its operation and the FCC unit as whole, hence dynamic balances are required in this section. The coke balance over the disengage/stripper unit allows the determination of coke-on-catalyst concentration entering the regenerator. The balance, using the CST assumption and considering both catalytic and CTO coke is as follows [5]:
d C c k R T d t = F c R S w c ( C c k R S + C c k C T O C c k R T )
where C c k R T is the total coke-on-catalyst concentration in the disengager/stripper which is equal to the concentration of coke on spent catalyst leaving the reactor vessel to the regenerator and C c k C T O is the unstripped CTO coke concentration. Arbel et al. [2] have also included a term in their coke balance to account for coke that is a result of Conradson Carbon Residue (CCR). CCR coke is seldom explicitly included in many FCC models [5,6,207]. This type of residue is different from the coke described above and is formed when heavy hydrocarbons in the feed are thermally decomposed on the surface of the catalyst. Because of the non-catalytic nature of the residue, it will normally occur on non-active sites of the catalyst [2] and, therefore, has a reduced effect on catalyst deactivation. This, together with the limited data on differentiation of different types of coke produced in the FCC riser unit, could be the reason why it is not explicitly accounted for in most FCC models. Nevertheless, a lot of useful results have been produced even with its exclusion from modelling analysis.
Gas component balances over the disengage/stripper using the assumption of CST can be used to predict the evolution of product gas concentrations in the wet gas flowing to the main fractionating column:
d y i g d t = y R S i w g ( F g R S F c R S C c k R S j y j R S )   y i g w g ( F g R T   + d w g d t ) ; for   i , j = gas   lumps   considered
Temperature in the stripper can be predicted using a simple energy balance around the disengager/stripper unit, under the CST and gas–solid thermodynamic equilibrium assumptions [5,6,144,195]:
( w c C p c + w g C p g ) d T S T d t = F s s H s s F s s H w R T o u t + F c R S ( H c i n H c o u t ) + F g R S ( H g i n H g o u t ) F s s Δ H S T + Q l o s s
where H i j is the enthalpy of i   ( = catalyst   or   gas   phase   from   riser   outlet ) and j indicates the stream going in or out of the stripper. H can be calculated from:
H i = C p i ( T i R S T r e f )
where C p i is the average specific heat catalyst for i phase and T r e f is some reference temperature from which enthalpy is measured. Δ H S T is the change in enthalpy associated with the stripping process. Q l o s s is the heat lost from the system through the walls of the unit to the surroundings, the simple heat exchanger equation can be used to estimate this heat loss (i.e., Q l o s s = U . A e f f ( T S T T a i r ) where symbols have their usual definitions). The adiabatic assumption, where Q l o s s is assumed to be zero, is also a common simplification made for this system by various workers [2,217] with great utility. However, to the best of our knowledge, no paper has provided evidence that the adiabatic assumption affects the predictions in any significant way, and heat loss to the environment is still an important aspect of the energy considerations of the process, and therefore we recommend its inclusion in the models for completeness. Another common simplification is to assume that the stripping steam does not affect the energy balance in a significant way so that the F s s H s s   term disappears. However, this is usually only valid if the stripping steam flow rate is small compared to that of the catalyst and the riser outlet gases.
Pressure and pressure drop in the disengaging-stripper are the other important process variables which should be included in the model. This is because the difference in pressure between the stripping section and the regenerator dense bed determines the flow rate of spent catalyst (i.e., catalyst circulation rate) between the two units and, therefore, the interaction and coupling between the regenerator and the reactor system [5] Pressure along the disengaging-stripper section is estimated using the ideal gas equation, with deviation from ideal gas behaviour accounted for via the compressibility factor [5,6,144,196,197]:
P S T = w g R T S T Z g M w g V g S T
with Z g as the compressibility factor of the gas phase, M w g is the average molar mass of the gas phase and V g S T is the volume of the disengaging-stripping vessel occupied by gas. V g S T is calculated from subtracting the volume of solid holdup in the vessel from the overall vessel volume. The pressure at the base of the stripper, however, is higher than P S T due to the static pressure exerted by the catalyst bed [5]. This pressure can be estimated from:
P S T b o t t o m = P S T + w c g h S T V S T
The equations given in this section are the model for the disengaging-stripping section, predicting exit concentrations from the reactor system, coke-on-catalyst concentration on spent catalyst and the pressure at the bottom of the stripper which controls catalyst circulation rate. Although it was not explicitly stated, the boundary conditions of these equations are such that the entry conditions (concentrations, temperature etc.) into the disengaging-stripping unit are the same as the riser termination conditions. Therefore, in an integrated model of the FCC unit, these boundary conditions are constrained by the riser.

4. Conclusions

Overall, modelling of the FCC unit using traditional reaction engineering approaches has certainly come a long way. This is especially evident in the riser kinetics through the introduction and development of approaches such as continuous lumping and single event kinetics. Single-event kinetic models establish a more fundamental way to understand the reactions occurring in the riser using current knowledge of carbenium chemistry. Additionally, analytical technology has come a long way since the early 1960s when FCC modelling first began, with tools now able to provide more detailed characterisation of FCC reaction mixture, which has greatly advanced the fundamental approach to kinetic modelling. However, lumped modelling remains the most common methodology used by researchers because of their relative ease and low computational cost, which make them ideal for optimisation and control studies of the FCC unit. In terms of hydrodynamics, the regime of fluidisation of the FCC riser unit means there is significant flow heterogeneity during its normal operation. Clusters of catalyst particles are observed in the suspension and a core–annular profile consisting of a solid dense annulus and a lean core is observed in the fully developed region of the riser. In contrast, we demonstrate in Part II of this paper that the heterogeneity in the regenerator arises, instead, from bubbles rising through an emulsion phase and with radial profile showing a solid lean phase in areas of high bubble density. This heterogeneity is an important factor in the conversion in the vessel and has been modelled to varying degrees by researchers. In the riser, more work is still needed to incorporate the core–annular structure that has been observed experimentally, into the riser models. This requires that more models be developed in 2D so that the impacts of this observed flow structure to FCC yields can be better understood. Lastly, FCC models have mostly simplified the vaporisation section by assuming that this process is instantaneous. More detailed models of vaporisation have been developed in the last two decades that deal with the process in time scales that are comparable to those in the riser; therefore, we recommend that more work is done to incorporate these new vaporisation models into the riser so that more reliable and realistic models are developed.

Author Contributions

Conceptualization, T.W.S., R.P., I.M.M. and Y.M.J.; methodology, T.W.S. and Y.M.J.; software, T.W.S.; validation, T.W.S. and Y.M.J.; formal analysis, T.W.S., R.P., I.M.M. and Y.M.J.; investi-gation, T.W.S. and Y.M.J.; resources, T.W.S., R.P., I.M.M. and Y.M.J.; data curation, T.W.S.; writing—original draft preparation, T.W.S.; writing—review and editing, T.W.S., R.P., I.M.M. and Y.M.J.; visualization, T.W.S.; supervision, R.P., I.M.M. and Y.M.J. All authors have read and agreed to the published version of the manuscript.

Funding

This research received no external funding.

Institutional Review Board Statement

Not applicable.

Informed Consent Statement

Not applicable.

Acknowledgments

The main author (T.W.S.) would like to acknowledge the Government of Botswana for funding his PhD research studies.

Conflicts of Interest

There is no conflict of interest regarding the publication of this research.

References

  1. Kunii, D.; Levenspiel, O. Fluidization Engineering; Butterworth-Heinemann: Oxford, UK, 1991. [Google Scholar]
  2. Arbel, A.; Huang, Z.; Rinard, I.H.; Shinnar, R.; Sapre, A.V. Dynamic and Control of Fluidized Catalytic Crackers. 1. Modeling of the Current Generation of FCC’s. Ind. Eng. Chem. Res. 1995, 34, 1228–1243. [Google Scholar] [CrossRef]
  3. Kunii, D.; Levenspiel, O. Entrainment of solids from fluidized beds I. Hold-up of solids in the freeboard II. Operation of fast fluidized beds. Powder Technol. 1990, 61, 193–206. [Google Scholar] [CrossRef]
  4. Kunii, D.; Levenspiel, O. Fluidized reactor models. 1. For bubbling beds of fine, intermediate, and large particles. 2. For the lean phase: Freeboard and fast fluidization. Ind. Eng. Chem. Res. 1990, 29, 1226–1234. [Google Scholar] [CrossRef]
  5. Han, I.-S.; Chung, C.-B. Dynamic modeling and simulation of a fluidized catalytic cracking process. Part I: Process modeling. Chem. Eng. Sci. 2001, 56, 1951–1971. [Google Scholar] [CrossRef]
  6. Han, I.-S.; Chung, C.-B. Dynamic modeling and simulation of a fluidized catalytic cracking process. Part II: Property estimation and simulation. Chem. Eng. Sci. 2001, 56, 1973–1990. [Google Scholar] [CrossRef]
  7. Shah, M.; Utikar, R.P.; Pareek, V.K.; Evans, G.M.; Joshi, J.B. Computational fluid dynamic modelling of FCC riser: A review. Chem. Eng. Res. Des. 2016, 111, 403–448. [Google Scholar] [CrossRef]
  8. Zhang, X.; Zhou, Y.; Zhu, J. Enhanced fluidization of group A particles modulated by group C powder. Powder Technol. 2020, 377, 684–692. [Google Scholar] [CrossRef]
  9. Shaul, S.; Rabinovich, E.; Kalman, H. Typical Fluidization Characteristics for Geldart’s Classification Groups. Part. Sci. Technol. 2014, 32, 197–205. [Google Scholar] [CrossRef]
  10. Zhou, Y.; Xu, J.; Zhu, J. Different bubble behaviors in gas-solid fluidized bed of Geldart group A and group C+ particles. Powder Technol. 2021, 384, 431–441. [Google Scholar] [CrossRef]
  11. Kong, W.; Tan, T.; Baeyens, J.; Flamant, G.; Zhang, H. Bubbling and Slugging of Geldart Group A Powders in Small Diameter Columns. Ind. Eng. Chem. Res. 2017, 56, 4136–4144. [Google Scholar] [CrossRef]
  12. Lee, J.-R.; Lee, K.-S.; Hasolli, N.; Park, Y.-O.; Lee, K.-Y.; Kim, Y.-H. Fluidization and mixing behaviors of Geldart groups A, B and C particles assisted by vertical vibration in fluidized bed. Chem. Eng. Process. Process. Intensif. 2020, 149, 107856. [Google Scholar] [CrossRef]
  13. Pinheiro, C.I.C.; Fernandes, J.L.; Domingues, L.; Chambel, A.J.S.; Graça, I.; Oliveira, N.M.C.; Cerqueira, H.S.; Ribeiro, F.R. Fluid Catalytic Cracking (FCC) Process Modeling, Simulation, and Control. Ind. Eng. Chem. Res. 2011, 51, 1–29. [Google Scholar] [CrossRef]
  14. Weekman, V. Lumps, Models, and Kinetics in Practice; A.I.Ch.E. Monograph Series: New York, NY, USA, 1979; Volume 75, pp. 1–29. [Google Scholar]
  15. Weekman, V.W., Jr. Kinetics and Dynamics of Catalytic Cracking Selectivity in Fixed-Bed Reactors. Ind. Eng. Chem. Process. Des. Dev. 1969, 8, 385–391. [Google Scholar] [CrossRef]
  16. Nace, D.M.; Voltz, S.E.; Weekman, V.W., Jr. Application of a Kinetic Model for Catalytic Cracking. Effects of Charge Stocks. Ind. Eng. Chem. Process. Des. Dev. 1971, 10, 530–538. [Google Scholar] [CrossRef]
  17. Jacob, S.M.; Gross, B.; Voltz, S.E.; Weekman, V.W. A lumping and reaction scheme for catalytic cracking. AIChE J. 1976, 22, 701–713. [Google Scholar] [CrossRef]
  18. Gross, B.; Jacob, S.M.; Nace, D.M.; Voltz, S.E. Simulation of Catalytic Cracking Process. U.S. Patent No. US3960707A, 1 June 1976. [Google Scholar]
  19. Arbel, A.; Rinard, I.H.; Shinnar, R.; Sapre, A.V. Dynamics and Control of Fluidized Catalytic Crackers. 2. Multiple Steady States and Instabilities. Ind. Eng. Chem. Res. 1995, 34, 3014–3026. [Google Scholar] [CrossRef]
  20. Elshishini, S.; Elnashaie, S. Digital simulation of industrial fluid catalytic cracking units: Bifurcation and its implications. Chem. Eng. Sci. 1990, 45, 553–559. [Google Scholar] [CrossRef]
  21. Quann, R.J.; Jaffe, S.B. Structure-oriented lumping: Describing the chemistry of complex hydrocarbon mixtures. Ind. Eng. Chem. Res. 1992, 31, 2483–2497. [Google Scholar] [CrossRef]
  22. Vynckier, E.; Froment, G.F. Modeling of the kinetics of complex processes based upon elementary steps. In Kinetic and Thermodynamic Lumping of Multicomponent Mixtures; Elsevier: Amsterdam, The Netherlands, 1991; pp. 131–161. [Google Scholar]
  23. Froment, G. Kinetic modeling of acid-catalyzed oil refining processes. Catal. Today 1999, 52, 153–163. [Google Scholar] [CrossRef]
  24. Dave, D.; Zhang, N. Multiobjective optimisation of fluid catalytic cracker unit using genetic algorithms. Comput. Aided Chem. Eng. 2003, 14, 623–628. [Google Scholar] [CrossRef]
  25. Mora, R.L.; Pascual, M.P.; Miranda, M. Maximixing Propylene Production in a FCC Unit. In Proceedings of the 19th World Petroleum Congress, Madrid, Spain, 29 June–3 July 2008. [Google Scholar]
  26. Akah, A.; Al-Ghrami, M. Maximizing propylene production via FCC technology. Appl. Petrochem. Res. 2015, 5, 377–392. [Google Scholar] [CrossRef] [Green Version]
  27. John, Y.M.; Patel, R.; Mujtaba, I.M. Maximization of propylene in an industrial FCC unit. Appl. Petrochem. Res. 2018, 8, 79–95. [Google Scholar] [CrossRef] [Green Version]
  28. Naik, D.V.; Karthik, V.; Kumar, V.; Prasad, B.; Garg, M.O. Kinetic modeling for catalytic cracking of pyrolysis oils with VGO in a FCC unit. Chem. Eng. Sci. 2017, 170, 790–798. [Google Scholar] [CrossRef]
  29. Naik, D.V.; Kumar, V.; Prasad, B.; Behera, B.; Atheya, N.; Singh, K.K.; Adhikari, D.K.; Garg, M.O. Catalytic cracking of pyrolysis oil oxygenates (aliphatic and aromatic) with vacuum gas oil and their characterization. Chem. Eng. Res. Des. 2014, 92, 1579–1590. [Google Scholar] [CrossRef]
  30. Zhang, R.; Li, L.; Liu, Z.; Meng, X. Nine-Lump Kinetic Study of Catalytic Pyrolysis of Gas Oils Derived from Canadian Synthetic Crude Oil. Int. J. Chem. Eng. 2016, 2016, 9148925. [Google Scholar] [CrossRef] [Green Version]
  31. Grace, J.R. Fluidized Bed Reactor Modeling. In Chemical Reactors; ACS: Washington, DC, USA, 1981; Volume 22, pp. 3–18. [Google Scholar] [CrossRef]
  32. Berruti, F.; Pugsley, T.S.; Godfroy, L.; Chaouki, J.; Patience, G.S. Hydrodynamics of circulating fluidized bed risers: A review. Can. J. Chem. Eng. 1995, 73, 579–602. [Google Scholar] [CrossRef]
  33. Grace, J.R.; Avidan, A.A.; Knowlton, T.M. Circulating Fluidized Beds; Blackie Academic & Professional: Glasgow, UK, 1997. [Google Scholar]
  34. Harris, B.J. Modeling options for circulating fluidized beds: A core/annulus deposition model. In Circulating Fluidized Bed Technology IV; Elsevier: Amsterdam, The Netherlands, 1993; pp. 32–39. [Google Scholar]
  35. Godfroy, L.; Patience, G.S.; Chaouki, J. Radial Hydrodynamics in Risers. Ind. Eng. Chem. Res 1999, 38, 81–89. [Google Scholar] [CrossRef]
  36. Gupta, R.; Kumar, V.; Srivastava, V.K. Modeling and simulation of fluid catalytic cracking unit. Rev. Chem. Eng. 2005, 21, 95–131. [Google Scholar] [CrossRef]
  37. Vashisth, S.; Motlagh, A.H.A.; Tebianian, S.; Salcudean, M.; Grace, J.R. Comparison of numerical approaches to model FCC particles in gas–solid bubbling fluidized bed. Chem. Eng. Sci. 2015, 134, 269–286. [Google Scholar] [CrossRef]
  38. Rao, R.M.; Rengaswamy, R.; Suresh, A.; Balaraman, K. Industrial Experience with Object-Oriented Modelling: FCC case study. Chem. Eng. Res. Des. 2004, 82, 527–552. [Google Scholar] [CrossRef] [Green Version]
  39. Sadeghbeigi, R. Fluid Catalytic Cracking Handbook; Elsevier: Amsterdam, The Netherlands, 2012. [Google Scholar] [CrossRef]
  40. Behera, B.; Ray, S.S.; Singh, I. Structural characterization of FCC feeds from Indian refineries by NMR spectroscopy. Fuel 2008, 87, 2322–2333. [Google Scholar] [CrossRef]
  41. Tissot, B.P.; Welte, D.H. Kerogen: Composition and Classification. In Petroleum Formation and Occurrence; Springer: Berlin/Heidelberg, Germany, 1984; pp. 131–159. [Google Scholar] [CrossRef]
  42. Rodríguez, E.; Izaddoust, S.; Valecillos, J.; Bilbao, J.; Arandes, J.M.; Castaño, P.; Epelde, E.; Elordi, G. Lessening coke formation and boosting gasoline yield by incorporating scrap tire pyrolysis oil in the cracking conditions of an FCC unit. Energy Convers. Manag. 2020, 224, 113327. [Google Scholar] [CrossRef]
  43. Stratiev, D.S.; Marinov, I.; Nedelchev, A.; Velkov, I.; Stratiev, D.D.; Veli, A.; Mitkova, M.; Stanulov, K. Evaluation of approaches for conversion of ASTM into TBP distillation data of oil fractions. Oil Gas Eur. Mag. 2014, 4, 216–221. [Google Scholar]
  44. Behrenbruch, P.; Dedigama, T. Classification and characterisation of crude oils based on distillation properties. J. Pet. Sci. Eng. 2007, 57, 166–180. [Google Scholar] [CrossRef]
  45. Gupta, R.K.; Kumar, V.; Srivastava, V.K. A new generic approach for the modeling of fluid catalytic cracking (FCC) riser reactor. Chem. Eng. Sci. 2007, 62, 4510–4528. [Google Scholar] [CrossRef]
  46. Dwyer, J.; Rawlence, D.J. Fluid catalytic cracking: Chemistry. Catal. Today 1993, 18, 487–507. [Google Scholar] [CrossRef]
  47. Corma, A.; Orchillés, A. Current views on the mechanism of catalytic cracking. Microporous Mesoporous Mater. 2000, 35–36, 21–30. [Google Scholar] [CrossRef]
  48. Whitmore, F.C.; Schmerling, L.; Ipatieff, V.N. Advances in Catalysis; Academic Press: Cambridge, MA, USA, 1934; Volume 26. [Google Scholar]
  49. Hiraoka, K.; Kebarle, P. Stabilities and energetics of pentacoordinated carbonium ions. The isomeric protonated ethane ions and some higher analogs: Protonated propane and protonated butane. J. Am. Chem. Soc. 1976, 98, 6119–6125. [Google Scholar] [CrossRef]
  50. Pansing, W.F. The Catalytic Cracking of Hexadecane—Effects of Impurities, Olefins, and Steam. J. Phys. Chem. 1965, 69, 392–399. [Google Scholar] [CrossRef]
  51. Greensfelder, B.S.; Voge, H.H.; Good, G.M. Catalytic Cracking of Pure Hydrocarbons. Ind. Eng. Chem. 1945, 37, 1168–1176. [Google Scholar] [CrossRef]
  52. Kotrel, S.; Knözinger, H.; Gates, B. The Haag–Dessau mechanism of protolytic cracking of alkanes. Microporous Mesoporous Mater. 2000, 35-36, 11–20. [Google Scholar] [CrossRef]
  53. Haag, W.O.; Dessau, R.M. Duality of mechanism for acid-catalyzed paraffin cracking. In Proceedings of the 8th International Congress on Catalysis, Berlin, Germany, 2–6 July 1984; Volume 2, pp. 305–316. [Google Scholar]
  54. Haag, W.O.; Dessau, R.M.; Lago, R.M. Chemistry of Microporous Crystals. Stud. Surf. Sci. Catal. 1991, 60, 255–265. [Google Scholar]
  55. Narbeshuber, T.F.; Vinek, H.; Lercher, J.A. Monomolecular Conversion of Light Alkanes over H-ZSM- 5. J. Catal. 1995, 157, 388–395. [Google Scholar] [CrossRef]
  56. Lercher, J.A.; van Santen, R.R.; Vinek, H. Carbonium ion formation in zeolite catalysis. Catal. Lett. 1994, 27, 91–96. [Google Scholar] [CrossRef]
  57. Kwak, B.; Sachtler, W. Effect of Ga/Proton Balance in Ga/HZSM-5 Catalysts on C3 Conversion to Aromatics. J. Catal. 1994, 145, 456–463. [Google Scholar] [CrossRef]
  58. Krannila, H.; Haag, W.O.; Gates, B.C. Monomolecular and bimolecular mechanisms of paraffin cracking: N-butane cracking catalyzed by HZSM-5. J. Catal. 1992, 135, 115–124. [Google Scholar] [CrossRef]
  59. Tung, S.; Tung, S.E.; McIninch, E. Zeolitic aluminosilicate II. Surface oxide diffusion, dynamic (time variant) Lewis acids and catalytic activity with hexane on decationized Y. J. Catal. 1968, 10, 175–182. [Google Scholar] [CrossRef]
  60. Farneth, W.E.; Gorte, R.J. Methods for Characterizing Zeolite Acidity. Chem. Rev. 1995, 95, 615–635. [Google Scholar] [CrossRef]
  61. Abbot, J.; Guerzoni, F.N. Roles of Brønsted and Lewis sites during cracking of n-octane on H-mordenite. Appl. Catal. A Gen. 1992, 85, 173–188. [Google Scholar] [CrossRef]
  62. Kissin, Y.V. Primary Products in Hydrocarbon Cracking over Solid Acidic Catalysts under Very Mild Conditions: Relation to Cracking Mechanism. J. Catal. 1998, 180, 101–105. [Google Scholar] [CrossRef]
  63. Kissin, Y.V. Chemical Mechanism of Hydrocarbon Cracking over Solid Acidic Catalysts. J. Catal. 1996, 163, 50–62. [Google Scholar] [CrossRef]
  64. Kazansky, V.B.; Senchenya, I.N. Quantum chemical study of the electronic structure and geometry of surface alkoxy groups as probable active intermediates of heterogeneous acidic catalysts: What are the adsorbed carbenium ions? J. Catal. 1989, 119, 108–120. [Google Scholar] [CrossRef]
  65. Frash, M.V.; Solkan, V.N.; Kazansky, V.B. A quantum-chemical study of hydride transfer from alkanes to carbenium cations in the gas phase: A comparison with liquid- and solid-acid catalytic systems. J. Chem. Soc. Faraday Trans. 1997, 93, 515–520. [Google Scholar] [CrossRef]
  66. Caeiro, G.; Carvalho, R.; Wang, X.; Lemos, M.A.; Lemos, F.; Guisnet, M.; Ribeiro, F.R. Activation of C2–C4 alkanes over acid and bifunctional zeolite catalysts. J. Mol. Catal. A Chem. 2006, 255, 131–158. [Google Scholar] [CrossRef]
  67. Bartholomew, C.H.; Farrauto, R.J. Fundamentals of Industrial Catalytic Processes; John Wiley & Sons: Hoboken, NJ, USA, 2011. [Google Scholar]
  68. Yaluris, G.; Rekoske, J.E.; Aparicio, L.M.; Madon, R.J.; Dumesic, J.A. Isobutane Cracking over Y-Zeolites: I. Development of a Kinetic-Model. J. Catal. 1995, 153, 54–64. [Google Scholar] [CrossRef]
  69. Yaluris, G.; Rekoske, J.E.; Aparicio, L.M.; Madon, R.J.; Dumesic, J.A. Isobutane Cracking over Y-Zeolites: II. Catalytic Cycles and Reaction Selectivity. J. Catal. 1995, 153, 65–75. [Google Scholar] [CrossRef]
  70. Yaluris, G.; Madon, R.J.; Dumesic, J.A. 2-Methylhexane Cracking on Y Zeolites: Catalytic Cycles and Reaction Selectivity. J. Catal. 1997, 165, 205–220. [Google Scholar] [CrossRef]
  71. Cortright, R.D.; Dumesic, J.A.; Madon, R.J. Catalytic cycles for hydrocarbon cracking on zeolites. Top. Catal. 1997, 4, 15–26. [Google Scholar] [CrossRef]
  72. De Oliveira, L.P.; Hudebine, D.; Guillaume, D.; Verstraete, J.J. A Review of Kinetic Modeling Methodologies for Complex Processes. Oil Gas Sci. Technol. 2016, 71, 45. [Google Scholar] [CrossRef] [Green Version]
  73. Ho, T.C. Modeling of Reaction Kinetics for Petroleum Fractions. In Practical Advances in Petroleum Processing; Springer: New York, NY, USA, 2006; pp. 653–694. [Google Scholar] [CrossRef]
  74. Weekman, V.W.; Nace, D.M. Kinetics of catalytic cracking selectivity in fixed, moving, and fluid bed reactors. AIChE J. 1970, 16, 397–404. [Google Scholar] [CrossRef]
  75. Lee, L.-S.; Chen, Y.-W.; Huang, T.-N.; Pan, W.-Y. Four-lump kinetic model for fluid catalytic cracking process. Can. J. Chem. Eng. 1989, 67, 615–619. [Google Scholar] [CrossRef]
  76. Yen, L.C.; Wrench, R.E.; Ong, A.S. Reaction kinetic correlation equation predicts fluid catalytic cracking coke yields. Oil Gas J. 1988, 86, 2. [Google Scholar]
  77. Corella, J.; Francés, E. Analysis of the Riser Reactor of a Fluid Cracking Unit. ACS Symp. Ser. 1991, 452, 165–182. [Google Scholar] [CrossRef]
  78. Larocca, M.; Ng, S.; de Lasa, H. Fast catalytic cracking of heavy gas oils: Modeling coke deactivation. Ind. Eng. Chem. Res. 1990, 29, 171–180. [Google Scholar] [CrossRef]
  79. Ancheyta-Juárez, J.; López-Isunza, F.; Aguilar-Rodríguez, E. 5-Lump kinetic model for gas oil catalytic cracking. Appl. Catal. A Gen. 1999, 177, 227–235. [Google Scholar] [CrossRef]
  80. Ancheyta-Juárez, J.; López-Isunza, F.; Aguilar-Rodríguez, E.; Moreno-Mayorga, J.C. A Strategy for Kinetic Parameter Estimation in the Fluid Catalytic Cracking Process. Ind. Eng. Chem. Res. 1997, 36, 5170–5174. [Google Scholar] [CrossRef]
  81. Ancheyta-Juárez, J.; Murillo-Hernández, J.A. A Simple Method for Estimating Gasoline, Gas, and Coke Yields in FCC Processes. Energy Fuels 2000, 14, 373–379. [Google Scholar] [CrossRef]
  82. Dupain, X.; Gamas, E.D.; Madon, R.; Kelkar, C.P.; Makkee, M.; Moulijn, J.A. Aromatic gas oil cracking under realistic FCC conditions in a microriser reactor☆. Fuel 2003, 82, 1559–1569. [Google Scholar] [CrossRef]
  83. Bollas, G.M.; Lappas, A.A.; Iatridis, D.K.; Vasalos, I.A. Five-lump kinetic model with selective catalyst deactivation for the prediction of the product selectivity in the fluid catalytic cracking process. Catal. Today 2007, 127, 31–43. [Google Scholar] [CrossRef]
  84. Ancheyta-Juárez, J.; Sotelo-Boyás, R. Estimation of Kinetic Constants of a Five-Lump Model for Fluid Catalytic Cracking Process Using Simpler Sub-models. Energy Fuels 2000, 14, 1226–1231. [Google Scholar] [CrossRef]
  85. John, Y.M.; Mustafa, M.A.; Patel, R.; Mujtaba, I.M. Parameter estimation of a six-lump kinetic model of an industrial fluid catalytic cracking unit. Fuel 2019, 235, 1436–1454. [Google Scholar] [CrossRef] [Green Version]
  86. Xiong, K.; Lu, C.; Wang, Z.; Gao, X. Kinetic study of catalytic cracking of heavy oil over an in-situ crystallized FCC catalyst. Fuel 2015, 142, 65–72. [Google Scholar] [CrossRef]
  87. Souza, J.A.; Vargas, J.V.C.; von Meien, O.F.; Martignoni, W.P.; Ordonez, J.C. The inverse methodology of parameter estimation for model adjustment, design, simulation, control and optimization of fluid catalytic cracking (FCC) risers. J. Chem. Technol. Biotechnol. 2009, 84, 343–355. [Google Scholar] [CrossRef]
  88. Heydari, M.; Ebrahim, H.A.; Dabir, B. Modeling of an Industrial Riser in the Fluid Catalytic Cracking Unit. Am. J. Appl. Sci. 2010, 7, 221–226. [Google Scholar] [CrossRef]
  89. Wang, X.S.; Weng, H.X.; Mao, X.J.; Liu, F.Y.; Sha, Y.X.; Den, X.L. Investigation of the lumped kinetic model for catalytic cracking IV determination of kinetic parameters in heavy gas oil network. Acta Sin. 1988, 4, 11–17. [Google Scholar]
  90. Gao, H.; Wang, G.; Xu, C.; Gao, J. Eight-Lump Kinetic Modeling of Vacuum Residue Catalytic Cracking in an Independent Fluid Bed Reactor. Energy Fuels 2014, 28, 6554–6562. [Google Scholar] [CrossRef]
  91. Mao, X.; Weng, H.; Zhu, Z.; Wang, S.; Zhu, K. Investigation of the lumped kinetic model for catalytic cracking: III. Analyzing light oil feed and products and measurement of kinetic constants. Acta. Pet. Sin. 1985, 1, 11–18. [Google Scholar]
  92. Oliveira, L.L.; Biscaia, E. Catalytic cracking kinetic models. Parameter estimation and model evaluation. Ind. Eng. Chem. Res. 1989, 28, 264–271. [Google Scholar] [CrossRef]
  93. Sun, T.D.; Zhong, X.; Chen, Y.; Yu, B.T. Study and application of a lumping FCC kinetics model for vacuum residue. Petrol. Process. Petrochem. 2001, 32, 41–44. [Google Scholar]
  94. Watson, K.M.; Nelson, E.F. Improved Methods for Approximating Critical and Thermal Properties of Petroleum Fractions. Ind. Eng. Chem. 1933, 25, 880–887. [Google Scholar] [CrossRef]
  95. Edmister, W.C.; Lee, B.K. Applied Hydrocarbon Thermodynamics, 2nd ed.; Gulf Professional Publishing: Houston, TX, USA, 1984; Volume 1. [Google Scholar]
  96. Aris, R.; Gavalas, G.R. On the theory of reactions in continuous mixtures. Philos. Trans. R. Soc. Lond. Ser. A Math. Phys. Sci. 1966, 260, 351–393. [Google Scholar]
  97. Laxminarasimhan, C.S.; Verma, R.P.; Ramachandran, P.A. Continuous lumping model for simulation of hydrocracking. AIChE J. 1996, 42, 2645–2653. [Google Scholar] [CrossRef]
  98. Amhammed, M.M. Applications of Lumping Kinetics Methodology to Complex Reactive Mixtures. Ph.D. Thesis, Heriot-Watt University, Edinburgh, UK, 2013. [Google Scholar]
  99. Chou, M.Y.; Ho, T.C. Continuum theory for lumping nonlinear reactions. AIChE J. 1988, 34, 1519–1527. [Google Scholar] [CrossRef]
  100. Lababidi, H.M.S.; Alhumaidan, F.S. Modeling the Hydrocracking Kinetics of Atmospheric Residue in Hydrotreating Processes by the Continuous Lumping Approach. Energy Fuels 2011, 25, 1939–1949. [Google Scholar] [CrossRef]
  101. McCoy, B.J.; Wang, M. Continuous-mixture fragmentation kinetics: Particle size reduction and molecular cracking. Chem. Eng. Sci. 1994, 49, 3773–3785. [Google Scholar] [CrossRef]
  102. Cicarelli, P.; Astarita, G.; Gallifuoco, A. Continuous kinetic lumping of catalytic cracking processes. AIChE J. 1992, 38, 1038–1044. [Google Scholar] [CrossRef]
  103. Aris, R.; Astarita, G. Continuous lumping of nonlinear chemical kinetics. Chem. Eng. Process. Process. Intensif. 1989, 26, 63–69. [Google Scholar] [CrossRef]
  104. Astarita, G.; Ocone, R. Lumping nonlinear kinetics. AIChE J. 1988, 34, 1299–1309. [Google Scholar] [CrossRef]
  105. Peixoto, F.C.; de Medeiros, J.L. Reactions in multiindexed continuous mixtures: Catalytic cracking of petroleum fractions. AIChE J. 2001, 47, 935–947. [Google Scholar] [CrossRef]
  106. Peixoto, F.C.; Platt, G.M.; Pessoa, F.L.P. Vapor–liquid equilibria of multi-indexed continuous mixtures using an equation of state and group contribution methods. Chem. Eng. J. 2000, 77, 179–187. [Google Scholar] [CrossRef]
  107. Ho, T.C.; White, B.S. On the continuum approximation of large reaction mixtures. AIChE J. 2010, 56, 1894–1906. [Google Scholar] [CrossRef]
  108. Aris, R. Prolegomena to the rational analysis of systems of chemical reactions II. Some addenda. Arch. Ration. Mech. Anal. 1968, 27, 356–364. [Google Scholar] [CrossRef]
  109. Krambeck, F.J. Computers and modern analysis in reactor design. Inst. Chem. Eng. Symp. Ser. 1984, 87, 733. [Google Scholar]
  110. Chou, M.Y.; Ho, T.C. Lumping coupled nonlinear reactions in continuous mixtures. AIChE J. 1989, 35, 533–538. [Google Scholar] [CrossRef]
  111. McCoy, B.J. Continuous kinetics of cracking reactions: Thermolysis and pyrolysis. Chem. Eng. Sci. 1996, 51, 2903–2908. [Google Scholar] [CrossRef]
  112. Froment, G.F. Single Event Kinetic Modeling of Complex Catalytic Processes. Catal. Rev. 2005, 47, 83–124. [Google Scholar] [CrossRef]
  113. Dewachtere, N.V.; Santaella, F.; Froment, G.F. Application of a single-event kinetic model in the simulation of an industrial riser reactor for the catalytic cracking of vacuum gas oil. Chem. Eng. Sci. 1999, 54, 3653–3660. [Google Scholar] [CrossRef]
  114. Moustafa, T.M.; Froment, G.F. Kinetic Modeling of Coke Formation and Deactivation in the Catalytic Cracking of Vacuum Gas Oil. Ind. Eng. Chem. Res. 2003, 42, 14–25. [Google Scholar] [CrossRef]
  115. Feng, W.; Vynckier, E.; Froment, G.F. Single event kinetics of catalytic cracking. Ind. Eng. Chem. Res. 1993, 32, 2997–3005. [Google Scholar] [CrossRef]
  116. Surla, K.; Guillaume, D.; Verstraete, J.J.; Galtier, P. Kinetic Modeling using the Single-Event Methodology: Application to the Isomerization of Light Paraffins. Oil Gas Sci. Technol. 2011, 66, 343–365. [Google Scholar] [CrossRef] [Green Version]
  117. D’Hooge, D.R.; Reyniers, M.-F.; Marin, G.B. Methodology for Kinetic Modeling of Atom Transfer Radical Polymerization. Macromol. React. Eng. 2009, 3, 185–209. [Google Scholar] [CrossRef]
  118. De Rybel, N.; van Steenberge, P.H.M.; Reyniers, M.-F.; Barner-Kowollik, C.; D’Hooge, D.R.; Marin, G.B. An Update on the Pivotal Role of Kinetic Modeling for the Mechanistic Understanding and Design of Bulk and Solution RAFT Polymerization. Macromol. Theory Simul. 2017, 26, 1600048. [Google Scholar] [CrossRef]
  119. Clymans, P.J.; Froment, G.F. Computer-generation of reaction paths and rate equations in the thermal cracking of normal and branched paraffins. Comput. Chem. Eng. 1984, 8, 137–142. [Google Scholar] [CrossRef]
  120. Prickett, S.E.; Mavrovouniotis, M.L. Construction of complex reaction systems—I. Reaction description language. Comput. Chem. Eng. 1997, 21, 1219–1235. [Google Scholar] [CrossRef]
  121. Joshi, P.V. Molecular and Mechanistic Modeling of Complex Process Chemistries: A Generic Approach to Automated Model Building. Ph.D. Thesis, University of Delaware, Newark, DE, USA, 1998. [Google Scholar]
  122. Christensen, G.; Apelian, M.R.; Hickey, K.J.; Jaffe, S.B. Future directions in modeling the FCC process: An emphasis on product quality. Chem. Eng. Sci. 1999, 54, 2753–2764. [Google Scholar] [CrossRef]
  123. Solorzano, R.Q.; Thybaut, J.W.; Marin, G.B. A single-event microkinetic analysis of the catalytic cracking of (cyclo)alkanes on an equilibrium catalyst in the absence of coke formation. Chem. Eng. Sci. 2007, 62, 5033–5038. [Google Scholar] [CrossRef]
  124. Solorzano, R.Q.; Thybaut, J.W.; Galtier, P.; Marin, G.B. Simulation of an industrial riser for catalytic cracking in the presence of coking using Single-Event MicroKinetics. Catal. Today 2010, 150, 319–331. [Google Scholar] [CrossRef]
  125. Xue, G.; Huixin, W.; Thybaut, J.; Marin, G. Catalytic cracking of cycloparaffins admixed with olefins: 2. Single-event microkinetic (semk) assessment. China Pet. Process. Petrochem. Technol. 2014, 16, 84–90. [Google Scholar]
  126. Standl, S.; Tonigold, M.; Hinrichsen, O. Single-Event Kinetic Modeling of Olefin Cracking on ZSM-5: Proof of Feed Independence. Ind. Eng. Chem. Res. 2017, 56, 13096–13108. [Google Scholar] [CrossRef]
  127. von Aretin, T.; Standl, S.; Tonigold, M.; Hinrichsen, O. Optimization of the product spectrum for 1-pentene cracking on ZSM-5 using single-event methodology. Part 2: Recycle reactor. Chem. Eng. J. 2017, 309, 873–885. [Google Scholar] [CrossRef]
  128. Standl, S.; Kirchberger, F.M.; Kühlewind, T.; Tonigold, M.; Sanchez-Sanchez, M.; Lercher, J.A.; Hinrichsen, O. Single-event kinetic model for methanol-to-olefins (MTO) over ZSM-5: Fundamental kinetics for the olefin co-feed reactivity. Chem. Eng. J. 2020, 402, 126023. [Google Scholar] [CrossRef]
  129. Beirnaert, H.C.; Alleman, J.R.; Marin, G.B. A fundamental kinetic model for the catalytic cracking of alkanes on a USY zeolite in the presence of coke formation. Ind. Eng. Chem. Res. 2001, 40, 1337–1347. [Google Scholar] [CrossRef]
  130. Quintana-Solórzano, R.; Thybaut, J.W.; Marin, G.B.; Lødeng, R.; Holmen, A. Single-Event MicroKinetics for coke formation in catalytic cracking. Catal. Today 2005, 107–108, 619–629. [Google Scholar] [CrossRef]
  131. Cerqueira, H.S.; Caeiro, G.; Costa, L.; Ribeiro, F.R. Deactivation of FCC catalysts. J. Mol. Catal. A Chem. 2008, 292, 1–13. [Google Scholar] [CrossRef]
  132. Guisnet, M.; Magnoux, P. Deactivation by coking of zeolite catalysts. Prevention of deactivation. Optimal conditions for regeneration. Catal. Today 1997, 36, 477–483. [Google Scholar] [CrossRef]
  133. Guisnet, M.; Magnoux, P. Organic chemistry of coke formation. Appl. Catal. A Gen. 2001, 212, 83–96. [Google Scholar] [CrossRef]
  134. Reyes, S.C.; Scriven, L.E. Analysis of zeolite catalyst deactivation during catalytic cracking reactions. Ind. Eng. Chem. Res. 1991, 30, 71–82. [Google Scholar] [CrossRef]
  135. Froment, G.F. A Quantitative Approach of Catalyst Deactivation by Coke Formation; Elsevier: Amsterdam, The Netherlands, 1980; pp. 1–19. [Google Scholar] [CrossRef]
  136. Forzatti, P.; Lietti, L. Catalyst deactivation. Catal. Today 1999, 52, 165–181. [Google Scholar] [CrossRef]
  137. Froment, G.F. The Modeling of Catalyst Deactivation by Coke Formation; Elsevier: Amsterdam, The Netherlands, 1991; pp. 53–83. [Google Scholar] [CrossRef]
  138. Rodríguez, E.; Elordi, G.; Valecillos, J.; Izaddoust, S.; Bilbao, J.; Arandes, J.M.; Castaño, P. Coke deposition and product distribution in the co-cracking of waste polyolefin derived streams and vacuum gas oil under FCC unit conditions. Fuel Process. Technol. 2019, 192, 130–139. [Google Scholar] [CrossRef]
  139. Froment, G. Modeling of catalyst deactivation. Appl. Catal. A Gen. 2001, 212, 117–128. [Google Scholar] [CrossRef]
  140. Corella, J. On the Modeling of the Kinetics of the Selective Deactivation of Catalysts. Application to the Fluidized Catalytic Cracking Process. Ind. Eng. Chem. Res. 2004, 43, 4080–4086. [Google Scholar] [CrossRef]
  141. Farag, H.; Ng, S.; de Lasa, H. Kinetic modeling of catalytic cracking of gas oils using in situ traps (FCCT) to prevent metal contaminant effects. Ind. Eng. Chem. Res. 1993, 32, 1071–1080. [Google Scholar] [CrossRef]
  142. Krambeck, F.J. Continuous mixtures in fluid catalytic cracking and extensions. In Mobil Workshop on Chemical Reaction in Complex Mixtures; van Nostrand Reinhold: New York, NY, USA, 1991; pp. 42–59. [Google Scholar]
  143. Pitault, I.; Forissier, M.; Bernard, J.R. Determination of Kinetic Constants of Catalytic Cracking in Microactivity Test Modeling. Can. J. Chem. Eng. 1995, 73, 498–504. [Google Scholar] [CrossRef]
  144. Fernandes, J.L.; Domingues, L.H.; Pinheiro, C.I.C.; Oliveira, N.M.C.; Ribeiro, F.R. Influence of different catalyst deactivation models in a validated simulator of an industrial UOP FCC unit with high-efficiency regenerator. Fuel 2012, 97, 97–108. [Google Scholar] [CrossRef]
  145. Davidson, J.F.; Clift, R.; Harrison, D. Fluidization, 2nd ed.; Academic Press: Cambridge, MA, USA, 1985. [Google Scholar]
  146. Bi, H.T.; Ellis, N.; Abba, I.A.; Grace, J.R. A state-of-the-art review of gas–solid turbulent fluidization. Chem. Eng. Sci. 2000, 55, 4789–4825. [Google Scholar] [CrossRef]
  147. Lim, K.S.; Zhu, J.X.; Grace, J.R. Hydrodynamics of gas-solid fluidization. Int. J. Multiph. Flow 1995, 21, 141–193. [Google Scholar] [CrossRef]
  148. Rhodes, M.J.; Geldart, D. The hydrodynamics of re-circulating fluidized beds. In Circulating Fluidized Bed Technology, Proceedings of the First International Conference on Circulating Fluidized Beds, Halifax, NS, Canada, 18–20 November 1985; Elsevier: Amsterdam, The Netherlands, 1985; pp. 193–200. [Google Scholar] [CrossRef]
  149. Louge, M.; Chang, H. Pressure and voidage gradients in vertical gas-solid risers. Powder Technol. 1990, 60, 197–201. [Google Scholar] [CrossRef]
  150. Li, I.; Kwauk, M. Two-Phase Flow: The Energy-Minimization Multi-Scale Method; Metallurgy Industry Press: Beijing, China, 1994. [Google Scholar]
  151. Wei, F.; Lin, H.; Cheng, Y.; Wang, Z.; Jin, Y. Profiles of particle velocity and solids fraction in a high-density riser. Powder Technol. 1998, 100, 183–189. [Google Scholar] [CrossRef]
  152. Pärssinen, J.H.; Zhu, J.-X. Particle velocity and flow development in a long and high-flux circulating fluidized bed riser. Chem. Eng. Sci. 2001, 56, 5295–5303. [Google Scholar] [CrossRef]
  153. Derouin, C.; Nevicato, D.; Forissier, M.; Wild, G.; Bernard, J.-R. Hydrodynamics of Riser Units and Their Impact on FCC Operation. Ind. Eng. Chem. Res. 1997, 36, 4504–4515. [Google Scholar] [CrossRef]
  154. Miller, A.; Gidaspow, D. Dense, vertical gas-solid flow in a pipe. AIChE J. 1992, 38, 1801–1815. [Google Scholar] [CrossRef]
  155. Martin, M.P.; Turlier, P.; Bernard, J.R.; Wild, G. Gas and solid behavior in cracking circulating fluidized beds. Powder Technol. 1992, 70, 249–258. [Google Scholar] [CrossRef]
  156. Martin, M.P.; Derouin, C.; Turlier, P.; Forissier, M.; Wild, G.; Bernard, J.R. Catalytic cracking in riser reactors: Core-annulus and elbow effects. Chem. Eng. Sci. 1992, 47, 2319–2324. [Google Scholar] [CrossRef]
  157. Senior, R.C.; Brereton, C. Modelling of circulating fluidised-bed solids flow and distribution. Chem. Eng. Sci. 1992, 47, 281–296. [Google Scholar] [CrossRef]
  158. Wong, R.; Pugsley, T.; Berrut, F. Modelling the axial voidage profile and flow structure in risers of circulating fluidized beds. Chem. Eng. Sci. 1992, 47, 2301–2306. [Google Scholar] [CrossRef]
  159. Noymer, P.D.; Glicksman, L.R. Descent velocities of particle clusters at the wall of a circulating fluidized bed. Chem. Eng. Sci. 2000, 55, 5283–5289. [Google Scholar] [CrossRef]
  160. Pandey, P.; Turton, R.; Yue, P.; Shadle, L. Nonintrusive Particle Motion Studies in the Near-Wall Region of a Pilot-Scale Circulating Fluidized Bed. Ind. Eng. Chem. Res. 2004, 43, 5582–5592. [Google Scholar] [CrossRef]
  161. Cankurt, N.T.; Yerushalmi, J. Gas Backmixing in High Velocity Fluidized Beds. In Fluidization; Cambridge University Press: Cambridge, MA, USA, 1978; p. 387. [Google Scholar]
  162. Cocco, R.; Shaffer, F.; Hays, R.; Karri, S.B.R.; Knowlton, T. Particle clusters in and above fluidized beds. Powder Technol. 2010, 203, 3–11. [Google Scholar] [CrossRef]
  163. McMillan, J.; Shaffer, F.; Gopalan, B.; Chew, J.W.; Hrenya, C.; Hays, R.; Karri, S.R.; Cocco, R. Particle cluster dynamics during fluidization. Chem. Eng. Sci. 2013, 100, 39–51. [Google Scholar] [CrossRef]
  164. Horio, M.; Kuroki, H. Three-dimensional flow visualization of dilutely dispersed solids in bubbling and circulating fluidized beds. Chem. Eng. Sci. 1994, 49, 2413–2421. [Google Scholar] [CrossRef]
  165. Horio, M.; Nonaka, A. A generalized bubble diameter correlation for gas-solid fluidized beds. AIChE J. 1987, 33, 1865–1872. [Google Scholar] [CrossRef]
  166. Grace, J. High-velocity fluidized bed reactors. Chem. Eng. Sci. 1990, 45, 1953–1966. [Google Scholar] [CrossRef]
  167. Bader, R.; Findlay, J.; Knowlton, T.M. Gas/solids flow patterns in a 30.5-cm-diameter circulating fluidized bed. In Circulating Fluidized Bed Technology, Proceedings of the Second International Conference on Circulating Fluidized Beds, Compiégne, France, 14–18 March 1988; Elsevier: Amsterdam, The Netherlands, 1988; pp. 123–137. [Google Scholar] [CrossRef]
  168. Van Deemter, J.J. Mixing. Fluidization; Academic Press: New York, NY, USA, 1985; pp. 331–355. [Google Scholar]
  169. Stubington, J.F.; Chan, S.W. On the phase location and rate of volatiles combustion in bubbling fluidized bed combustors. Chem. Eng. Res. Des. 1990, 68, 195–201. [Google Scholar]
  170. Li, J.; Weinstein, H. An experimental comparison of gas backmixing in fluidized beds across the regime spectrum. Chem. Eng. Sci. 1989, 44, 1697–1705. [Google Scholar] [CrossRef]
  171. Li, Y.; Wu, P. A study on axial gas mixing in a fast fluidized bed. In Circulating Fluidized Bed Technology III; Basu, P., Ed.; Pergamon Press: Toronto, ON, Canada, 1991; pp. 581–586. [Google Scholar]
  172. Zhu, J.X.; Bi, H.T. Development of CFB and High Density Circulating Fluidized Beds. In Circulating Fluidized Bed Technology IV; Avidan, A.A., Ed.; AIChE: New York, NY, USA, 1993. [Google Scholar]
  173. Schugerl, K. Experimental Comparison of Mixing Processes in Two and Three Phase Fluidized Beds. In Proceedings of the International Symposium on Fluidization, Eindhoven, The Netherlands, 6–9 June 1967; pp. 782–794. [Google Scholar]
  174. Dry, R.J.; White, C.C. Gas residence-time characteristics in a high-velocity circulating fluidised bed of FCC catalyst. Powder Technol. 1989, 58, 17–23. [Google Scholar] [CrossRef]
  175. Van Zoonen, D. Measurements of diffusional phenomena and velocity profiles in a vertical riser. In Proc. Symp. on The Interaction between Fluids and Particles, 1962; Instn, Chem. Engrs: Rugby, UK, 1962; pp. 64–71. [Google Scholar]
  176. Brereton, C.M.H.; Grace, J.R.; Yu, J. Axial gas mixing in a circulating fluidized bed. In Circulating Fluidized Bed Technology, Proceedings of the Second International Conference on Circulating Fluidized Beds, Compiégne, France, 14–18 March 1988; Elsevier: Amsterdam, The Netherlands, 1988; pp. 307–314. [Google Scholar] [CrossRef]
  177. Bai, D.R. Residence time distributions of gas and solids in a circulating fluidized bed. In Fluidization VII; Engineering Foundation: New York, NY, USA, 1992; pp. 195–202. [Google Scholar]
  178. Helmrich, H.; Schugerl, K.; Janssen, K. Decomposition of NaHCO3 in laboratory and bench scale circulating fluidized bed reactors. In Circulating Fluidized Bed Technology, Proceedings of the First International Conference on Circulating Fluidized Beds, Halifax, NS, Canada, 18–20 November 1985; Elsevier: Amsterdam, The Netherlands, 1986; pp. 161–166. [Google Scholar] [CrossRef]
  179. Werther, J.; Hartge, E.U.; Kruse, M.; Potter, O.E.; Nicklin, D.J. Gas mixing and interphase mass transfer in the circulating fluidized bed. In Fluidization VII; Engineering Foundation: New York, NY, USA, 1992; pp. 257–264. [Google Scholar]
  180. Couturier, M.; Doucette, B.; Stevens, D.; Poolpol, S.; Razbin, V. Temperature, gas concentration and solid mass flux profiles within a large circulating fluidized bed combustor. In Proceedings of the Eleventh International Conference on Fluidized Bed Combustion, Montreal, QC, Canada, 21–24 April 1991; pp. 21–24. [Google Scholar]
  181. Zheng, Q.; Xing, W.; Lou, F. Experimental study on radial gas dispersion and its enhancement in circulating fluidized beds. In Fluidization VII; Engineering Foundation: New York, NY, USA, 1992; pp. 285–293. [Google Scholar]
  182. Svensson, A. Fluid Dynamics of the Bottom Bed of Circulating Fluidized Bed Boilers. Ph.D. Thesis, Chalmers University of Technology, Gothenburg, Sweden, 1995. [Google Scholar]
  183. Svensson, A.; Johnsson, F.; Leckner, B. Bottom bed regimes in a circulating fluidized bed boiler. Int. J. Multiph. Flow 1996, 22, 1187–1204. [Google Scholar] [CrossRef]
  184. Wei, F.; Lin, S.; Yang, G. Gas and solids mixing in a commercial FCC regenerator. Chem. Eng. Technol. 1993, 16, 109–113. [Google Scholar] [CrossRef]
  185. Lee, G.S.; Kim, S.D. Axial mixing of solids in turbulent fluidized beds. Chem. Eng. J. 1990, 44, 1–9. [Google Scholar] [CrossRef]
  186. Edwards, M.; Avidan, A. Conversion model aids scale-up of mobil’s fluid-bed MTG process. Chem. Eng. Sci. 1986, 41, 829–835. [Google Scholar] [CrossRef]
  187. Foka, M.; Chaouki, J.; Guy, C.; Klvana, D. Natural gas combustion in a catalytic turbulent fluidized bed. Chem. Eng. Sci. 1994, 49, 4269–4276. [Google Scholar] [CrossRef]
  188. Ahari, J.S.; Farshi, A.; Forsat, K. A mathematical modeling of the riser reactor in industrial FCC unit. Pet. Coal 2008, 50, 15–24. [Google Scholar]
  189. Tsuo, Y.P.; Gidaspow, D. Computation of flow patterns in circulating fluidized beds. AIChE J. 1990, 36, 885–896. [Google Scholar] [CrossRef]
  190. Gidaspow, D. Multiphase Flow and Fluidization: Continuum and Kinetic Theory Descriptions; Academic Press: Cambridge, MA, USA, 1994. [Google Scholar]
  191. Drew, D.A. Mathematical Modeling of Two-Phase Flow. Annu. Rev. Fluid Mech. 1983, 15, 261–291. [Google Scholar] [CrossRef]
  192. Lu, H.; Gidaspow, D.; Wang, S. Computational Fluid Dynamics and the Theory of Fluidization; Springer: Singapore, 2021. [Google Scholar]
  193. Pugsley, T.S.; Berruti, F. A predictive hydrodynamic model for circulating fluidized bed risers. Powder Technol. 1996, 89, 57–69. [Google Scholar] [CrossRef]
  194. Sabbaghan, H.; Sotudeh-Gharebagh, R.; Mostoufi, N. Modeling the acceleration zone in the riser of circulating fluidized beds. Powder Technol. 2004, 142, 129–135. [Google Scholar] [CrossRef]
  195. Fernandes, J.L.; Pinheiro, C.I.C.; Oliveira, N.M.C.; Inverno, J.; Ribeiro, F.R. Model Development and Validation of an Industrial UOP Fluid Catalytic Cracking Unit with a High-Efficiency Regenerator. Ind. Eng. Chem. Res. 2008, 47, 850–866. [Google Scholar] [CrossRef]
  196. Xu, G.; Kato, K. Hydrodynamic equivalent diameter for clusters in heterogeneous gas–solid flow. Chem. Eng. Sci. 1999, 54, 1837–1847. [Google Scholar] [CrossRef]
  197. Fernandes, J.L.; Pinheiro, C.I.C.; Oliveira, N.; Ribeiro, F.R. Modeling and simulation of an operating industrial fluidized catalytic cracking (FCC) riser. In Proceedings of the 2nd Mercosur Congress on Chemical Engineering and 4th Mercosur Congress on Process Systems Engineering, Rio de Janeiro, Brazil, 14–18 August 2005; pp. 1–4. [Google Scholar]
  198. Nguyen, T.T.B.; Mitra, S.; Pareek, V.; Joshi, J.B.; Evans, G. Comparison of vaporization models for feed droplet in fluid catalytic cracking risers. Chem. Eng. Res. Des. 2015, 101, 82–97. [Google Scholar] [CrossRef]
  199. Ali, H.; Rohani, S.; Corriou, J.-P. Modelling and Control of a Riser Type Fluid Catalytic Cracking (FCC) Unit. Chem. Eng. Res. Des. 1997, 75, 401–412. [Google Scholar] [CrossRef]
  200. Du, B.; Warsito, W.; Fan, L.-S. Flow dynamics of gas-solid fluidized beds with evaporative liquid injection. China Particuology 2006, 4, 1–8. [Google Scholar] [CrossRef]
  201. Gehrke, S.; Wirth, K.E. Evaporating liquid in a high-density riser. In Proceedings of the International Congress on Particle Technology, Nuremberg, Germany, 27–29 March 2007. [Google Scholar]
  202. Newton, D.; Fiorentino, M.; Smith, G.B. The application of X-ray imaging to the developments of fluidized bed processes. Powder Technol. 2001, 120, 70–75. [Google Scholar] [CrossRef]
  203. Bruhns, S.; Werther, J. An investigation of the mechanism of liquid injection into fluidized beds. AIChE J. 2005, 51, 766–775. [Google Scholar] [CrossRef]
  204. Ahmadi Motlagh, A.H.; Pougatch, K.; Maturi, A.; Salcudean, M.; Grace, J.R.; Grecov, D.; McMillan, J. CFD Study of Wet Agglomerate Growth and Breakage in a Fluidized Bed Containing Hot Silica Sand Particles with Evaporative Liquid Injection. Ind. Eng. Chem. Res. 2019, 58, 4396–4411. [Google Scholar] [CrossRef]
  205. Ahmadi Motlagh, A.H.; Grace, J.R.; Briens, C.; Berruti, F.; Farkhondehkavaki, M.; Hamidi, M. Experimental analysis of volatile liquid injection into a fluidized bed. Particuology 2017, 34, 39–47. [Google Scholar] [CrossRef]
  206. Voorhies, A. Carbon Formation in Catalytic Cracking. Ind. Eng. Chem. 1945, 37, 318–322. [Google Scholar] [CrossRef]
  207. Fernandes, J.L.; Verstraete, J.J.; Pinheiro, C.I.C.; Oliveira, N.M.C.; Ribeiro, F.R. Dynamic modelling of an industrial R2R FCC unit. Chem. Eng. Sci. 2007, 62, 1184–1198. [Google Scholar] [CrossRef]
  208. Takatsuka, T.; Sato, S.; Morimoto, Y.; Hashimoto, H. A reaction model for fluidized-bed catalytic cracking of residual oil. Int. Chem. Eng. 1987, 27, 107–116. [Google Scholar]
  209. Souza, J.A.; Vargas, J.V.C.; Von Meien, O.F.; Martignoni, W.; Amico, S.C. A two-dimensional model for simulation, control, and optimization of FCC risers. AIChE J. 2006, 52, 1895–1905. [Google Scholar] [CrossRef]
  210. Souza, J.A.; Vargas, J.V.C.; Von Meien, O.F.; Martignoni, W.P. Modeling and simulation of industrial fcc risers. Therm. Eng. 2007, 6, 19–25. [Google Scholar] [CrossRef] [Green Version]
  211. Petrobras Six. Riser Improvement Project; Internal Report; Springer: São Mateus do Sul, Brazil, 2001. (In Portuguese) [Google Scholar]
  212. Patience, G.S.; Chaouki, J.; Berruti, F.; Wong, R. Scaling considerations for circulating fluidized bed risers. Powder Technol. 1992, 72, 31–37. [Google Scholar] [CrossRef]
  213. Hernández-Barajas, J.R.; Vázquez-Román, R.; Félix-Flores, M.G. A comprehensive estimation of kinetic parameters in lumped catalytic cracking reaction models. Fuel 2009, 88, 169–178. [Google Scholar] [CrossRef]
  214. Gupta, P.L.; Gupta, R.C. The monotonicity of the reliability measures of the beta distribution. Appl. Math. Lett. 2000, 13, 5–9. [Google Scholar] [CrossRef] [Green Version]
  215. Zhang, J.; Wang, Z.; Jiang, H.; Chu, J.; Zhou, J.; Shao, S. Modeling fluid catalytic cracking risers with special pseudo-components. Chem. Eng. Sci. 2013, 102, 87–98. [Google Scholar] [CrossRef]
  216. Arya, D.; Gupta, R.K. Simulation Studies on Variable Cluster Size in FCC Riser Reactor. Part. Sci. Technol. 2014, 32, 144–150. [Google Scholar] [CrossRef]
  217. Boum, A.; Corriou, J.P.; Latifi, A. Comparison of model predictive control strategies for a fluidized catalytic cracker. Int. J. Eng. Technol. 2017, 6, 181–190. [Google Scholar] [CrossRef] [Green Version]
  218. Lee, E.; Groves, F.R., Jr. Mathematical model of the fluidized bed catalytic cracking plant. Trans. Soc. Comput. Simul. Int. 1985, 2, 219–236. [Google Scholar]
  219. Li, Y.; Chu, J.; Zhang, J. A new generic reaction for modeling fluid catalytic cracking risers. Chin. J. Chem. Eng. 2017, 25, 1449–1460. [Google Scholar] [CrossRef]
  220. Chen, Z.; Feng, S.; Zhang, L.; Wang, G.; Shi, Q.; Xu, Z.; Zhao, S.; Xu, C. Molecular-level kinetic modeling of heavy oil fluid catalytic cracking process based on hybrid structural unit and bond-electron matrix. AIChE J. 2020, 67, e17027. [Google Scholar] [CrossRef]
  221. He, S.; Lucio-Vega, J.; Zhang, L.; Shi, Q.; Horton, S.R.; Al-Khattaf, S.; Al-Jundi, I.; Elmutasim, O.; Zhao, S.; Klein, M.T. Integrating Visualization Methods with Chemical Kinetics Model Solution and Editing Tools. Energy Fuels 2017, 31, 9881–9889. [Google Scholar] [CrossRef]
  222. Chen, Z.; Feng, S.; Zhang, L.; Shi, Q.; Xu, Z.; Zhao, S.; Xu, C. Molecular-level kinetic modelling of fluid catalytic cracking slurry oil hydrotreating. Chem. Eng. Sci. 2019, 195, 619–630. [Google Scholar] [CrossRef]
  223. Zhu, C.; Jun, Y.; Patel, R.; Wang, D.; Ho, T.C. Interactions of flow and reaction in fluid catalytic cracking risers. AIChE J. 2010, 57, 3122–3131. [Google Scholar] [CrossRef]
  224. Shah, Y.T.; Huling, G.P.; Paraskos, J.A.; McKinney, J.D. A Kinematic Model for an Adiabatic Transfer Line Catalytic Cracking Reactor. Ind. Eng. Chem. Process. Des. Dev. 1977, 16, 89–94. [Google Scholar] [CrossRef]
  225. Shi, J.; Wang, Y.; Yang, W.; Tang, Y.; Xie, Z. Recent advances of pore system construction in zeolite-catalyzed chemical industry processes. Chem. Soc. Rev. 2015, 44, 8877–8903. [Google Scholar] [CrossRef] [PubMed]
  226. García-Dopico, M.; García, A.; Santos Garcíac, A. Modelling fluidized catalytic cracking unit stripper efficiency. Chem. Ind. Chem. Eng. Q. 2015, 21, 95–105. [Google Scholar] [CrossRef]
  227. García-Dopico, M.; García, A.; Garcíac, A.S. Modelling coke formation and deactivation in a FCCU. Appl. Catal. A Gen. 2006, 303, 245–250. [Google Scholar] [CrossRef]
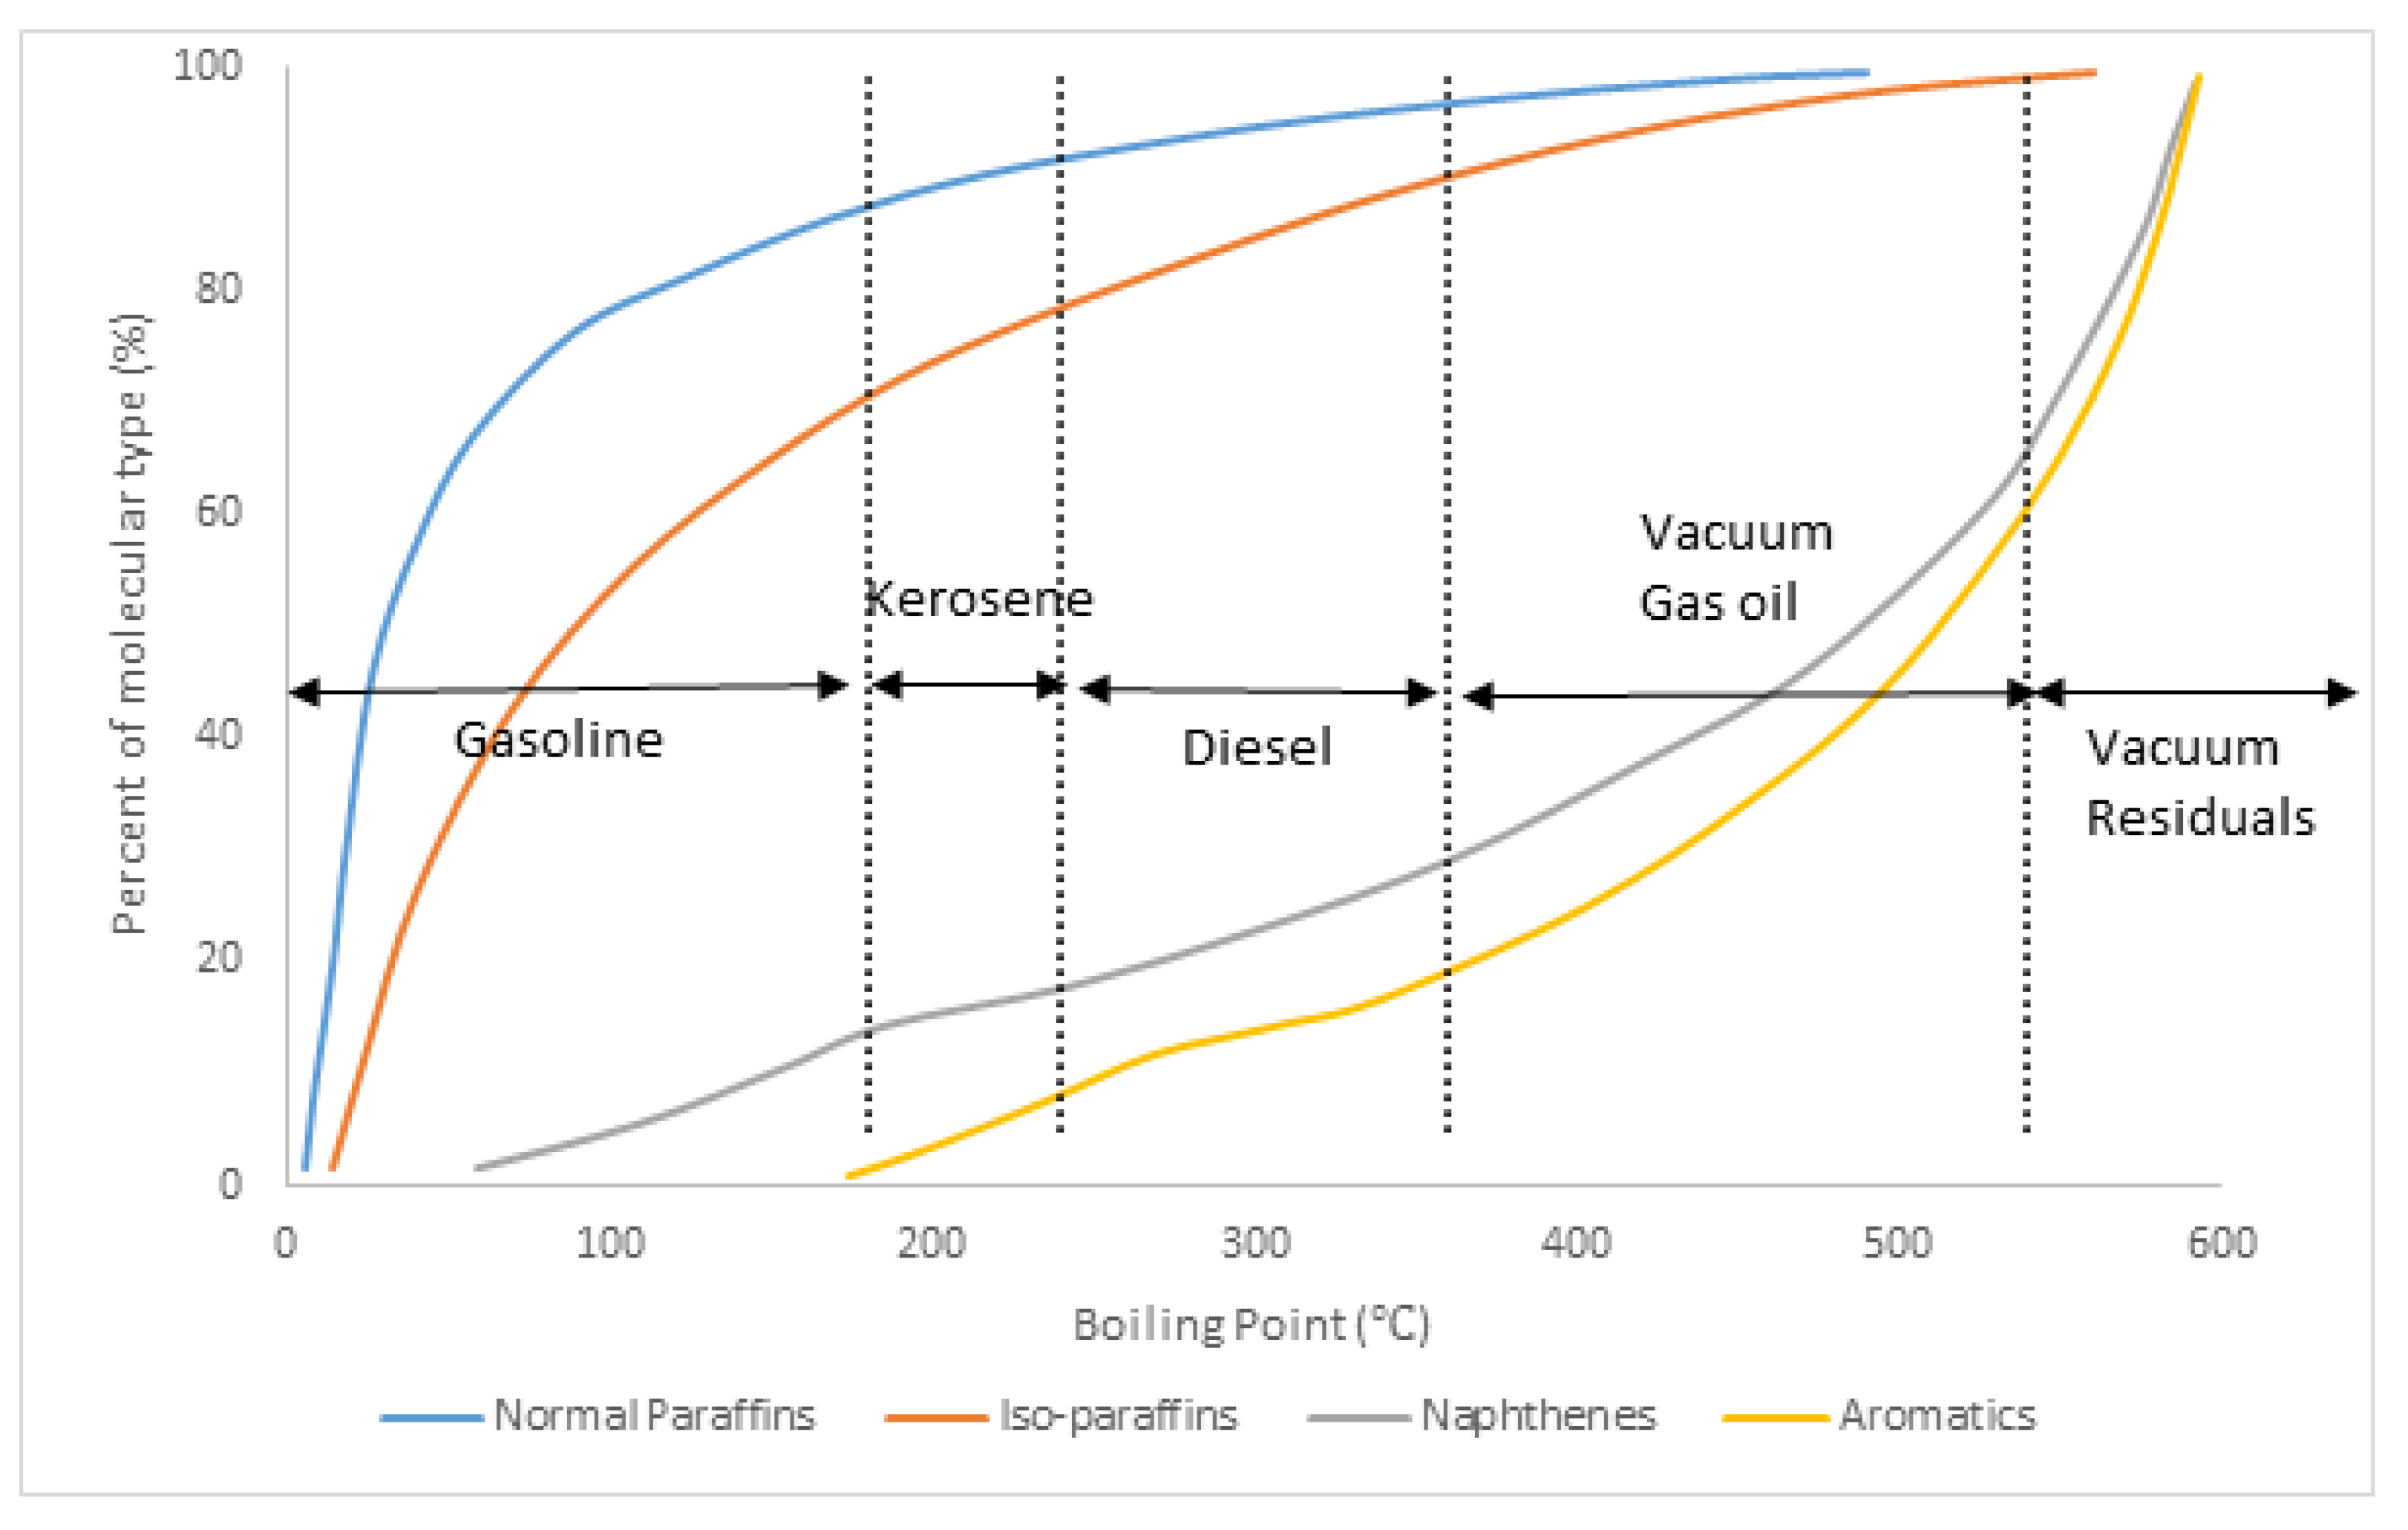
Figure 1. True boiling point (TBP) of a naphthenic crude oil (Redrawn from [44]).
Energies 15 00308 g001
Figure 3. Catalytic cycles for cracking of isobutane over zeolite USY at 773K in assumed plug flow; solid lines denotes fast reactions, dotted lines denote slow reactions.Bold species are surface complexes and species next to the reaction line are gaseous products or reactants. Reaction lines indicate various elementary steps. (Redrawn from Yaluris et al. [69]).
Energies 15 00308 g003
Figure 4. Lumped kinetic models: (a) 3-lump model of Weekman and Nace [74], (b) 4-lump model of Lee et al. [75], (c) 5-lump model of Ancheyta-juarez et al. [80], and (d) 10-lump model of Jacob et al. [17] ( P h ,   N h ,   A h ,   C Ah   for heavy fraction paraffins, naphthenics, aromatic substitutes and aromatic rings respectively, and P l ,   N l ,   A l ,   C Al for light fraction paraffins, naphthenics, aromatic substitutes and aromatic rings respectively, G for gasoline and C for light gases plus coke).
Energies 15 00308 g004
Figure 5. Some elementary steps of paraffins, olefins, naphthenes and aromatics in the FCC riser. (Adapted from [113]).
Energies 15 00308 g005
Figure 6. Representation of a methyl shift elementary step of a carbenium ion: (a) skeletal form, (b) Boolean matrix representation, (c) auxiliary vectors for the transformation (7 = unsaturated carbon, 8 = saturated carbon for vector 3), (Adapted from [23]).
Energies 15 00308 g006
Figure 7. Axial solid volume profiles along the riser height (Redrawn from Shah et al. [7] for various gas and solid flux).
Energies 15 00308 g007
Figure 8. (a) Radial gas velocity profiles, (redrawn with data from [153] for Ug = 5.2 m/s) (b) radial profiles of catalyst flux, (redrawn with data from [153] for Ug = 5.2 m/s) and (c) Radial solid volume profile (redrawn with data from [154] for Ug = 2.89 m/s), for different solid flux.
Energies 15 00308 g008
Figure 9. Comparison of gas oil conversion predicted profiles of FCC riser with measured data of Shah 1977 [224] and Derouin 1997 [153].
Energies 15 00308 g009
Figure 10. Comparison of predicted temperature profiles of models with gas–catalyst thermal equilibrium and with catalyst–gas interphase resistance.
Energies 15 00308 g010
Table 2. Summary of previous reviews in the literature relevant to FCC modelling.
ReviewAspect of FCC Modelling Covered/Reviewed
Grace [31]
  • Fluidised bed reactor models
  • Gas mixing in dense or emulsion phase
  • Interphase gas transfer
Berruti et al. [32]
  • Fluidised bed regime classification and applications
  • Harris and Davidson’s Type I, II and III models for Circulating Fluidised Bed (CFB) risers
Godfroy et al. [35]
  • Comparison of different models with axial and/or radial gradients against experimental data
Gupta et al. [36]
  • FCC Riser kinetic and hydrodynamic modelling
  • FCC Regenerator kinetic and hydrodynamic modelling
  • Catalyst deactivation
  • FCC unit control models
Pinheiro et al. [13]
  • History and evolution of the FCC unit
  • FCC modelling (both the riser and regenerator) in terms of kinetics and hydrodynamics
  • Riser-regenerator coupling
  • Steady state vs dynamic modelling
  • Control of the FCC unit
Shah et al. [7]
  • Experimental results literature from cold flow CFB risers
  • CFD models for cold flow gas-solid flow in CFB risers in terms of Eulerian and Eulerian–Langrangian frameworks
  • Effect of constitutive models (i.e., drag models, gas viscous models, KTGF closure models) on flow prediction
  • Reactive CFD models for FCC Risers
  • Modelling of the feed vaporisation section in FCC Risers
Madhusudana Rao et al. [38]
  • Object oriented modelling of the FCC unit in industry using the multipurpose process simulator (MPROSIM) environment
Table 3. Feed and product characterisation from an FCC riser pilot plant using vacuum gas oil feed and commercial equilibrium catalyst containing 15.5% zeolite [42].
FeedProducts
Elemental analysisDistillation boiling point cuts
C (wt%)86.60Dry gas ( C 1 C 2 ) (wt%)4
H (wt%)12LPG ( C 3 C 4 )   (wt%)4
N (wt%)0.23Gasoline ( C 5 C 12 ) (wt%)27
S (wt%)1.17Light cycle oil ( C 13 C 20 ) (wt%)28
PONA CompositionHeavy cycle oil ( > C 20 ) (wt%)18
Paraffins (wt%)62.3Coke (wt%)9
Naphthenes (wt%)29.3
Aromatics (wt%)8.5
Sulphur containing (wt%)5.5
Distillation boiling point cuts
Gasoline (wt%)1.5
Diesel ( wt % )3
> Diesel (wt%)95.5
Physical Properties
Density ( k g L   at   15   ° C )0.93
American Petroleum Institute (API) gravity (°API)21.1
Viscosity (cst at 100 °C)8.6
Mw (g/mol)405.3
HHV (Mj/kg)42
Mw—Number average molecular weight, HHV—High heating value, determined by differential scanning calorimetry.
Table 4. Some kinetic parameters of discrete lumping models.
4—Lump Parameters of Ancheyta-Juarez [80]
Transformation k i j E i j
( k J m o l 1 )
UnitsValue
VGO GS ( h 1 wt % 1 ) 699 57.3
VGO LG ( h 1 wt % 1 ) 125.28 52.7
VGO CK ( h 1 wt % 1 ) 50.4 31.8
GS LG ( h 1 wt % 1 ) 33.48 65.7
GS CK ( h 1 wt % 1 ) 72 × 10 6 66.6
Deactivation ( φ = e α t ) α   ( h 1 ) 315
6—Lump Parameters of Yakubu [85]
VGO DZ ( h 1 wt % 1 ) 2.86 × 10 7 53.9
VGO GS ( h 1 wt % 1 ) 5.20 × 10 7 57.1
VGO CK ( h 1 wt % 1 ) 1.45 × 10 5 32.4
VGO LPG ( h 1 wt % 1 ) 8.41 × 10 6 51.3
VGO DG ( h 1 wt % 1 ) 1.80 × 10 6 48.6
DZ CK ( h 1 wt % 1 ) 2.71 × 10 5 61.2
DZ GS ( h 1 wt % 1 ) 7.12 × 10 5 48.1
DZ LPG ( h 1 wt % 1 ) 1.26 × 10 4 67.8
DZ DG ( h 1 wt % 1 ) 1.22 × 10 4 64.3
GS LPG ( h 1 wt % 1 ) 7.88 × 10 3 56.2
GS DG ( h 1 wt % 1 ) 5.97 × 10 3 63.3
GS CK ( h 1 wt % 1 ) 7.31 × 10 3 61.8
LPG DG ( h 1 wt % 1 ) 1.23 × 10 4 55.5
LPG CK ( h 1 wt % 1 ) 2.16 × 10 3 52.5
DG CK ( h 1 wt % 1 ) 7.90 × 10 3 53.0
Lumps: VGO—Vacuum gas oil, GS—Gasoline, DZ—Diesel, LPG—Liquid petroleum gas, LG—Light gas, DG—Dry gas, CK—Coke. Subscripts: ij representing transformation of some lump i   to lump j ( i j ).
Table 5. Single-event rate kinetic parameters for cracking of paraffins over RE-Y catalyst by Feng et al. [115].
Parameter Value   at   450   ° C   ( mol . k g c a t 1 . s 1 ) E A
( k J . k m o l 1 )
k HA ( s ) 8459 97 , 870
k HA ( t ) 10.59 × 10 3 98 , 570
k HD ( s ) 3.766 × 10 2 34 , 520
k HD ( t ) 3.72 × 10 4 102 , 500
k Pr ( s ) 1.008 × 10 7 43 , 920
k Pr ( t ) 2.715 × 10 7 36 , 360
k De ( s ) 1.767 × 10 2 32 , 980
k De ( t ) 1.492 × 10 4 55 , 680
k HS ( s : s ) 1.292 × 10 12 117 , 800
k HS ( s : t ) 9.212 × 10 8 27 , 690
k HS ( t : t ) 1.331 × 10 12 59 , 720
k MS ( s : s ) 2.887 × 10 13 34 , 550
k MS ( s : t ) 2.204 × 10 8 45 , 960
k MS ( t : t ) 5.107 × 10 15 56 , 480
k PCP ( s : s ) 1.985 × 10 10 10 , 600
k PCP ( s : t ) 2.902 × 10 12 27 , 270
k PCP ( t : t ) 1.283 × 10 9 88 , 180
k Cr L ( s : s ) 1.093 23 , 860
k Cr L ( s : t ) 3.984 51 , 890
k Cr L ( t : s ) 8.188 × 10 1 51 , 030
k Cr L ( t : t ) 1.702 × 10 1 64 , 330
k Cr B ( s : s ) 7.163 × 10 3 56 , 820
k Cr B ( s : t ) 6.573 × 10 2 21 , 830
k Cr B ( t : s ) 7.383 × 10 2 13 , 450
k HT ( s ) 2.091 × 10 2 60 , 120
k HT ( t ) 3.557 × 10 2 25 , 570
Subscript: HA—Hydride abstraction, HD—Hydride donation, Pr—Protonation, De—Deprotonation, HS—Hydride shift, MS—Methyl shift, PCP—Protonated cyclopropane, Cr—Cracking (i.e., β -scission), HT—Hydride transfer. Superscripts: L—Lewis site, B—Bronsted site. Brackets: Type of carbenium ion: s—secondary, t—tertiary.
Table 6. Comparitive summary of the different kinetic modelling approaches in FCC riser unit.
ModelFeed and Product
Characterisation
Reaction ChemistryMain Features
Discrete
lumping
Components of the reaction mixture grouped into lumps based on boiling point range or carbon number and molecular structure.Reactions considered as one-to-one transformations between lumps, usually higher boiling point lumps to lower boiling point lumps, although the connections between the lumps have usually varied between different researchers. This approach is empirical and not representative of the carbenium ion chemistry that is known to govern cracking reactions.Model parameters are the frequency factors and activation energies of the lump-to-lump transformations.
These models are simple and less computationally demanding because the large complex reaction mixture has been reduced to a small number of lumps.
Continuous LumpingReaction mixture thought of as a continuous mixture of an infinite number of molecules, which are characterised by normalised TBP.Properties of individual components in the mixture such as reactivity can be indexed via normalised boiling point. The individual components in the mixture are assumed to all be involved in the same type of reaction, i.e., all assumed to be undergoing fragmentation or cracking; however, it is known that other types of reactions are also taking place in the riser due to carbenium ion chemistry (e.g., isomerisation, alkylation etc.)The model parameters are the parameters associated with the relationship between reactivity and normalised TBP (e.g., k m a x & α ) and parameters associated with the yield function.
Single event kineticsMolecular reconstruction methodsA computer algorithm creates a reaction network of elementary steps between the molecules in the reaction mixture based on carbenium ion theory. The algorithm uses the numerical representation of the reacting species together with the reaction rules to create a large network consisting of all intermediate carbenium ions.The parameters are the frequency factors and activation energies of the specific elementary steps.
Very detailed feed characterisation is required to determine the values of the kinetic parameters which makes this model very time consuming. However, because of the fundamental nature of the reaction chemistry, the parameters determined are intrinsic and will extrapolate well for changing feeds.
Table 7. Summary of types of deactivation catalysts used in the literature (Redrawn from [7]).
TOSWeekman [15]
  φ = exp ( α t c )
φ = t c n
α ,   n model parameters
Jacob et al. [17]
  φ = α ( p G O ) ( 1 + β t c γ )
α ,   β ,   γ are model parameters
COCFarag et al. [141]
  φ = exp ( K c C C K )
K c is a model parameter
Krambeck [142]
  φ = C C K 1 ( 1 b )
b is a model parameter
Pitault et al. [143]
  φ = B + 1 B + exp ( A · C C K )    
B ,   A   are model parameters
t c = residence time (s). C C K = coke on catalyst concentration (kg coke/ kg catalyst). p G O = partial pressure of oil at riser bottom.
Publisher’s Note: MDPI stays neutral with regard to jurisdictional claims in published maps and institutional affiliations.