
A Sensor Data Processing Algorithm for Wind Turbine Hydraulic Pitch System Diagnosis

 , and
, and 
Abstract
:1. Introduction
2. Materials and Methods
2.1. The Basic Algorithm
2.2. Synthetic Data
2.3. Data Processing
| Algorithm 1 Calculate , , , , and from a 10 min simulation. | |
| 1: for each blade do | |
| 2: | Calculate q via (10), with one-third of the nominal pump flow if the pumps are on, zero otherwise. |
| 3: | Calculate via (11). |
| 4: | Discard pairs corresponding to instants when the cylinders have not been moving in the same direction, at over 1 mm/s, for at least 3 s. ▷ This eliminates q values that are inaccurate due to large, fast variations in cylinder pressures. |
| 5: | Discard pairs corresponding to instants when the pumps have not been continuously on or off for at least 3 s. ▷ This eliminates values that are inaccurate due to large, fast variations in nitrogen temperature. |
| 6: | Discard pairs corresponding to instants in which the pumps are on and the accumulator pressures differ by more than 5 bar. ▷ This eliminates q values that are inaccurate due to the pump flow not being evenly distributed between blades. |
| 7: | Separate the remaining pairs into four groups, depending on whether the pumps are on or off and the cylinders are extending (x going ’up’) or retracting (x going ’down’). |
| 8: end for | |
| 9: do | |
| 10: | Fit a linear regression to each group of pairs, forcing the slopes of regressions corresponding to the same blade and the same pump state (on or off) to be mutually equal. |
| 11: | Discard pairs farther from their regression than 1.5 times the median of all pairs. |
| 12: while any pair was discarded | |
| 13: Take the regression parameters of each group as with and . | |
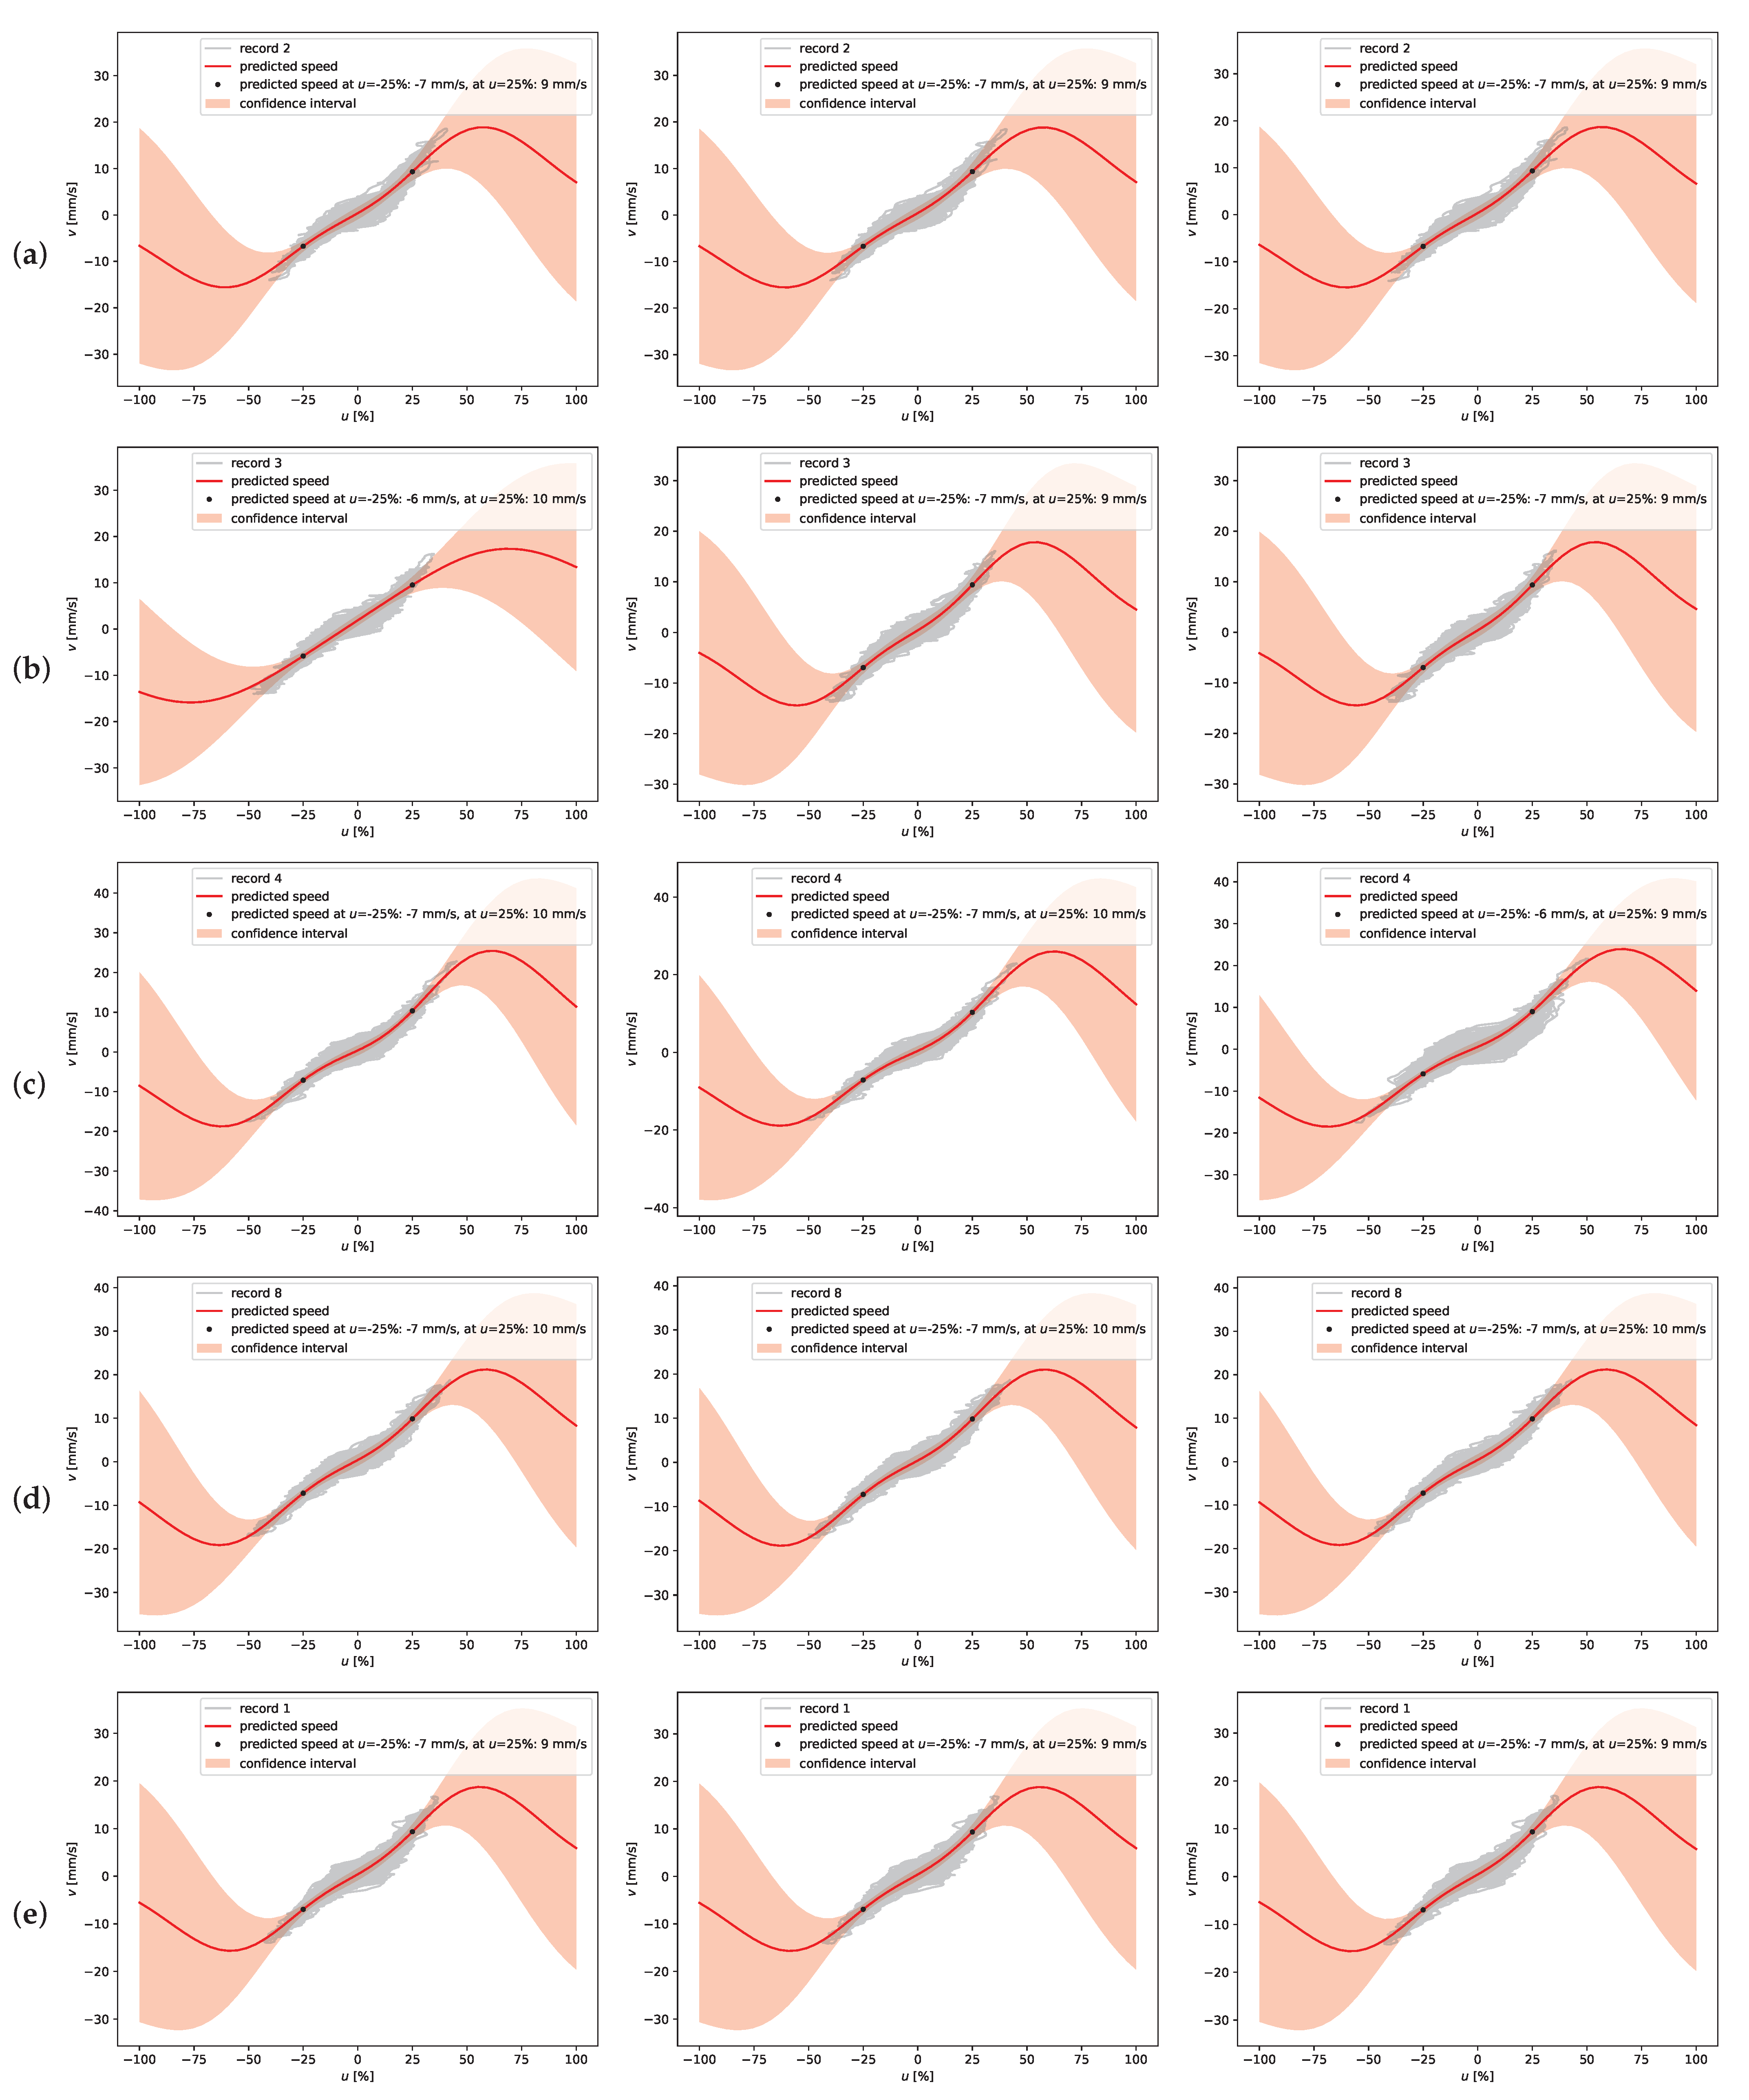
| Algorithm 2 Calculate and from a 10 min simulation. | |
| 1: for each blade do | |
| 2: | Take cylinder velocity and proportional valve opening u. |
| 3: | Discard pairs per steps 4–6 of Algorithm 1. |
| 4: | Fit a non-linear regression to the remaining pairs. |
| 5: | Use the fitted regression to predict cylinder velocity at () and (). |
| 6: end for | |
3. Results
4. Discussion
Author Contributions
Funding
Institutional Review Board Statement
Informed Consent Statement
Data Availability Statement
Conflicts of Interest
References
- Ghoshal, A.; Sundaresan, M.J.; Schulz, M.J.; Frank Pai, P. Structural health monitoring techniques for wind turbine blades. J. Wind. Eng. Ind. Aerodyn. 2000, 85, 309–324. [Google Scholar] [CrossRef]
- Rumsey, M.A.; Paquette, J.A. Structural health monitoring of wind turbine blades. In Smart Sensor Phenomena, Technology, Networks, and Systems 2008; Ecke, W., Peters, K.J., Meyendorf, N.G., Eds.; International Society for Optics and Photonics: Washington, DC, USA, 2008; Volume 6933, pp. 104–118. [Google Scholar] [CrossRef]
- Lu, B.; Li, Y.; Wu, X.; Yang, Z. A review of recent advances in wind turbine condition monitoring and fault diagnosis. In Proceedings of the 2009 IEEE Power Electronics and Machines in Wind Applications, Lincoln, NE, USA, 24–26 June 2009; pp. 1–7. [Google Scholar] [CrossRef]
- Liu, W.; Tang, B.; Jiang, Y. Status and problems of wind turbine structural health monitoring techniques in China. Renew. Energy 2010, 35, 1414–1418. [Google Scholar] [CrossRef]
- Guo, P.; Infield, D.; Yang, X. Wind Turbine Generator Condition-Monitoring Using Temperature Trend Analysis. IEEE Trans. Sustain. Energy 2012, 3, 124–133. [Google Scholar] [CrossRef] [Green Version]
- Feng, Y.; Qiu, Y.; Crabtree, C.J.; Long, H.; Tavner, P.J. Monitoring wind turbine gearboxes. Wind Energy 2013, 16, 728–740. [Google Scholar] [CrossRef]
- Yang, W.; Court, R.; Jiang, J. Wind turbine condition monitoring by the approach of SCADA data analysis. Renew. Energy 2013, 53, 365–376. [Google Scholar] [CrossRef]
- Yang, W.; Tavner, P.J.; Crabtree, C.J.; Feng, Y.; Qiu, Y. Wind turbine condition monitoring: Technical and commercial challenges. Wind Energy 2014, 17, 673–693. [Google Scholar] [CrossRef] [Green Version]
- Tchakoua, P.; Wamkeue, R.; Ouhrouche, M.; Slaoui-Hasnaoui, F.; Tameghe, T.A.; Ekemb, G. Wind Turbine Condition Monitoring: State-of-the-Art Review, New Trends, and Future Challenges. Energies 2014, 7, 2595–2630. [Google Scholar] [CrossRef] [Green Version]
- Luo, N.; Vidal, Y.; Acho, L. Wind Turbine Control and Monitoring; Springer: Berlin/Heidelberg, Germany, 2014. [Google Scholar]
- de Azevedo, H.D.M.; Araújo, A.M.; Bouchonneau, N. A review of wind turbine bearing condition monitoring: State of the art and challenges. Renew. Sustain. Energy Rev. 2016, 56, 368–379. [Google Scholar] [CrossRef]
- Nguyen, T.C.; Huynh, T.C.; Yi, J.H.; Kim, J.T. Hybrid bolt-loosening detection in wind turbine tower structures by vibration and impedance responses. Wind. Struct. 2017, 24, 385–403. [Google Scholar] [CrossRef]
- Oliveira, G.; Magalhães, F.; Cunha, Á.; Caetano, E. Continuous dynamic monitoring of an onshore wind turbine. Eng. Struct. 2018, 164, 22–39. [Google Scholar] [CrossRef]
- Stetco, A.; Dinmohammadi, F.; Zhao, X.; Robu, V.; Flynn, D.; Barnes, M.; Keane, J.; Nenadic, G. Machine learning methods for wind turbine condition monitoring: A review. Renew. Energy 2019, 133, 620–635. [Google Scholar] [CrossRef]
- Lebranchu, A.; Charbonnier, S.; Bérenguer, C.; Prévost, F. A combined mono- and multi-turbine approach for fault indicator synthesis and wind turbine monitoring using SCADA data. ISA Trans. 2019, 87, 272–281. [Google Scholar] [CrossRef]
- Carroll, J.; McDonald, A.; McMillan, D. Failure rate, repair time and unscheduled O&M cost analysis of offshore wind turbines. Wind Energy 2016, 19, 1107–1119. [Google Scholar] [CrossRef] [Green Version]
- Su, C.; Yang, Y.; Wang, X.; Hu, Z. Failures analysis of wind turbines: Case study of a Chinese wind farm. In Proceedings of the Prognostics and System Health Management Conference (PHM-Chengdu), Chengdu, China, 19–21 October 2016; pp. 1–6. [Google Scholar] [CrossRef]
- Dao, C.; Kazemtabrizi, B.; Crabtree, C. Wind turbine reliability data review and impacts on levelised cost of energy. Wind Energy 2019, 22, 1848–1871. [Google Scholar] [CrossRef] [Green Version]
- Liniger, J.; Soltani, M.N.; Pedersen, H.; Sepehri, N. Feasibility Study of a Simulation Driven Approach for Estimating Reliability of Wind Turbine Fluid Power Pitch Systems. In Safety and Reliability—Safe Societies in a Changing World, Proceedings of the European Safety and Reliability Conference 2018 (ESREL 2018), Trondheim, Norway, 17–18 June 2018, 1st ed.; Haugen, S., Barros, A., van Gulijk, C., Kongsvik, T., Vinnem, J., Eds.; CRC Press/Balkema: Boca Raton, FL, USA, 2018; pp. 2037–2044. [Google Scholar]
- Chen, W.; Wang, X.; Zhang, F.; Liu, H.; Lin, Y. Review of the application of hydraulic technology in wind turbine. Wind Energy 2020, 23, 1495–1522. [Google Scholar] [CrossRef]
- Lee, Y.B.; Lee, G.C.; Yang, J.D.; Park, J.W.; Baek, D.C. Failure analysis of a hydraulic power system in the wind turbine. Eng. Fail. Anal. 2020, 107, 104218. [Google Scholar] [CrossRef]
- Ryder, D.R. Redundant Actuator Development Study; Technical Report CR-114730; NASA, Ames Research Center: Moffet Field, CA, USA, 1973.
- Álvarez García, J.J. Flow Control Electro-Hydraulic Servovalve Assembly with In-Built Automatic Failure Detection and Compensation. In Proceedings of the 22nd International Congress of Aeronautical Sciences (ICAS), Harrogate, UK, 27 August 2000; p. 633. [Google Scholar]
- Andreev, M.; Kolesnikov, A.; Grätz, U.; Gundermann, J. Simulation-Based System Reliability Analysis of Electrohydraulic Actuator with Dual Modular Redundancy. In Proceedings of the 12th International Fluid Power Conference, Dresden, Germany, 9–11 March 2020; pp. 333–342. [Google Scholar] [CrossRef]
- Le, L.T. Oscillatory Failure Monitor. U.S. Patent US4826110A, 22 June 1987. [Google Scholar]
- Goupil, P. Method and Device for Detecting Oscillatory Failures in a Position Servocontrol Subsystem of an Aircraft Control Surface. U.S. Patent US20070124038A1, 20 November 2006. [Google Scholar]
- Cherepinsky, I.; Driscoll, J.T.; Kinkead, W.D.; Wengler, L.M.J. Control Surface Failure Detection for Fly-by-Wire Aircraft. U.S. Patent US20090012658A1, 29 November 2007. [Google Scholar]
- Fadiga, L.; Cazaurang, F.; Lavigne, L.; Goupil, P. Sequential probability ratio test using first Laplace distribution for oscillatory fault detection of an hydraulic actuator. IFAC Proc. Vol. 2011, 44, 4326–4331. [Google Scholar] [CrossRef]
- Schaeffer, J.M. Derived Rate Monitor for Detection of Degradation of Fuel Control Servo Valves. U.S. Patent US20130124016A1, 16 November 2011. [Google Scholar]
- Efimov, D.; Cieslak, J.; Zolghadri, A.; Henry, D. Actuator fault detection in aircraft systems: Oscillatory failure case study. Annu. Rev. Control 2013, 37, 180–190. [Google Scholar] [CrossRef]
- Márton, L.; Ossmann, D. Energetic Approach for Control Surface Disconnection Fault Detection in Hydraulic Aircraft Actuators. IFAC Proc. Vol. 2012, 45, 1149–1154. [Google Scholar] [CrossRef] [Green Version]
- Asmussen, M.F.; Liniger, J.; Pedersen, H.C. Fault Detection and Diagnosis Methods for Fluid Power Pitch System Components—A Review. Energies 2021, 14, 1305. [Google Scholar] [CrossRef]
- Brandt, C. Hydraulic Leak Detection System. U.S. Patent US5748077A, 13 May 1995. [Google Scholar]
- Watanabe, H.; Eiki, I. Failure Detection System for Hydraulic Pump. U.S. Patent US4489551A, 18 January 1984. [Google Scholar]
- Filho, J.; De Negri, V. Model-Based Fault Detection for Hydraulic Servoproportional Valves. In Proceedings of the 13th Scandinavian International Conference on Fluid Power, Linkoping, Sweden, 3–5 June 2013; pp. 389–398. [Google Scholar] [CrossRef] [Green Version]
- Liniger, J.; Stubkier, S.; Soltani, M.; Pedersen, H. Early Detection of Coil Failure in Solenoid Valves. IEEE/ASME Trans. Mechatron. 2020, 25, 683–693. [Google Scholar] [CrossRef]
- Wu, X.; Li, Y.; Li, F.; Yang, Z.; Teng, W. Adaptive Estimation-Based Leakage Detection for a Wind Turbine Hydraulic Pitching System. IEEE/ASME Trans. Mechatron. 2012, 17, 907–914. [Google Scholar] [CrossRef]
- Yao, J.; Yang, G.; Ma, D. Internal Leakage Fault Detection and Tolerant Control of Single-Rod Hydraulic Actuators. Math. Probl. Eng. 2014, 2014, 345345. [Google Scholar] [CrossRef] [Green Version]
- Wu, X.; Su, R.; Lu, C.; Rui, X. Internal leakage detection for wind turbine hydraulic pitching system with computationally efficient adaptive asymmetric SVM. In Proceedings of the 2015 34th Chinese Control Conference (CCC), Hangzhou, China, 28–30 July 2015; pp. 6126–6130. [Google Scholar] [CrossRef]
- Tutivén Gálvez, C.; Segui, Y.; Acho, L.; Rodellar, J. A fault detection method for pitch actuators faults in wind turbines. In Proceedings of the International Conference on Renewable Energy and Power Quality Journal (ICREPQ’15), La Coruña, Spain, 25–27 March 2015. [Google Scholar]
- Zhao, H.S.; Lian, S.S.; Shao, L. Fault Prediction of Pitch Actuator for Wind Turbines. In Vehicle, Mechanical and Electrical Engineering; Trans Tech Publications Ltd.: Durnten-Zurich, Switzerland, 2015; Volume 721, pp. 397–401. [Google Scholar] [CrossRef]
- Cho, S. Model-Based Fault Detection and Diagnosis of a Blade Pitch System in Floating Wind Turbines. Ph.D. Thesis, Norwegian University of Science and Technology, Trondheim, Norway, 2020. [Google Scholar]
- Wu, D.; Liu, W. A new fault diagnosis approach for the pitch system of wind turbines. Adv. Mech. Eng. 2017, 9, 1687814017703350. [Google Scholar] [CrossRef] [Green Version]
- Pujol-Vazquez, G.; Acho, L.; Gibergans-Báguena, J. Fault Detection Algorithm for Wind Turbines’ Pitch Actuator Systems. Energies 2020, 13, 2861. [Google Scholar] [CrossRef]
- Sun, X.; Wang, X.; Lin, S. Multi-Fault Diagnosis Approach Based on Updated Interacting Multiple Model for Aviation Hydraulic Actuator. Information 2020, 11, 410. [Google Scholar] [CrossRef]
- Dalla Vedova, M.; Bonanno, G.; Maggiore, P. Electrohydraulic Servomechanisms Affected by Multiple Failures: A Model-Based Prognostic Method Using Genetic Algorithms. WSEAS Trans. Electron. 2016, 7, 85–91. [Google Scholar]
- Dalla Vedova, M.; Bonanno, G.; Maggiore, P. A new genetic algorithm model-based prognostic approach applied to onboard electrohydraulic servomechanisms. WSEAS Trans. Environ. Dev. 2017, 13, 431–440. [Google Scholar]
- Dalla Vedova, M.D.; Berri, P.C.; Bonanno, G.; Maggiore, P. Fault Detection and Identification Method Based on Genetic Algorithms to Monitor Degradation of Electrohydraulic Servomechanisms. In Proceedings of the 2019 4th International Conference on System Reliability and Safety (ICSRS), Rome, Italy, 20–22 November 2019; pp. 304–311. [Google Scholar] [CrossRef]
- Dalla Vedova, M.; Borghetto, M. Optimization algorithms for prognostics of electrohydraulic on-board servomechanisms. Int. J. Mech. 2019, 13, 21–30. [Google Scholar]
- Vásquez, S.; Kinnaert, M.; Pintelon, R. Active Fault Diagnosis on a Hydraulic Pitch System Based on Frequency-Domain Identification. IEEE Trans. Control Syst. Technol. 2019, 27, 663–678. [Google Scholar] [CrossRef]
- Linaric, D.; Koroman, V. Fault diagnosis of a hydraulic actuator using neural network. In Proceedings of the IEEE International Conference on Industrial Technology, Maribor, Slovenia, 10–12 December 2003; Volume 1, pp. 108–111. [Google Scholar] [CrossRef]
- Quattrocchi, G.; Berri, P.C.; Dalla Vedova, M.D.L.; Maggiore, P. Innovative Actuator Fault Identification Based on Back Electromotive Force Reconstruction. Actuators 2020, 9, 50. [Google Scholar] [CrossRef]
- Yazdanpanah Goharrizi, A.; Sepehri, N. A Wavelet-Based Approach to Internal Seal Damage Diagnosis in Hydraulic Actuators. IEEE Trans. Ind. Electron. 2010, 57, 1755–1763. [Google Scholar] [CrossRef]
- Yao, Z.; Tang, J.; Rui, T.; Duan, J. A time–frequency analysis based internal leakage detection method for hydraulic actuators. Adv. Mech. Eng. 2017, 9, 1687814016685058. [Google Scholar] [CrossRef] [Green Version]
- Manyala, J.O.; Fritz, T.W. Signal-Based Actuators Fault Detection and Isolation for Gearbox Applications. SAE Int. J. Commer. Veh. 2014, 7, 315–323. [Google Scholar] [CrossRef]
- Pace, L.; Dalla Vedova, M.; Maggiore, P. Proposal of prognostic parametric method applied to an electrohydraulic servomechanism affected by multiple failures. WSEAS Trans. Environ. Dev. 2014, 10, 478. [Google Scholar]
- Simani, S.; Castani, P. Fault Diagnosis Techniques for a Wind Turbine System. In Fault Detection, Diagnosis and Prognosis; IntechOpen: Rijeka, Croatia, 2019; Chapter 4; pp. 1–20. [Google Scholar] [CrossRef] [Green Version]
- Berri, P.; Dalla Vedova, M.; Quattrocchi, G.; Maggiore, P. Model-based strategy and surrogate function for health condition assessment of actuation devices. In Proceedings of the 10th EASN International Conference, Salerno, Italy, 2–4 September 2020. [Google Scholar]
- Adams, S.; Beling, P.; Farinholt, K.; Brown, N.; Polter, S.; Dong, Q. Condition Based Monitoring for a Hydraulic Actuator. In Proceedings of the Annual Conference Of The Prognostics And Health Management Society, Denver, CO, USA, 3–6 October 2016. [Google Scholar]
- Huang, J.; Wang, X.; Wang, D.; Wang, Z.; Hua, X. Analysis of Weak Fault in Hydraulic System Based on Multi-scale Permutation Entropy of Fault-Sensitive Intrinsic Mode Function and Deep Belief Network. Entropy 2019, 21, 425. [Google Scholar] [CrossRef] [Green Version]
- Vos, D.W.; Motazed, B. Application of fault-tolerant controls to UAVs. In Navigation and Control Technologies for Unmanned Systems; Speigle, S.A., Ed.; International Society for Optics and Photonics: San Diego, CA, USA, 1996; Volume 2738, pp. 69–75. [Google Scholar] [CrossRef]
- Crepin, P.Y.; Kress, R. Model Based Fault Detection For An Aircraft actuator. In Proceedings of the International Council of the Aeronautical Sciences (ICAS), Harrogate, UK, 27 August–1 September 2000; p. 631. [Google Scholar]
- Batur, C.; Zhang, L. Sliding mode observer and controller design for a hydraulic motion control system. In Proceedings of the 2003 American Control Conference, Denver, CO, USA, 4–6 June 2003; Volume 2, pp. 1721–1726. [Google Scholar] [CrossRef]
- Garimella, P.; Yao, B. Fault Detection of an Electro-Hydraulic Cylinder Using Adaptive Robust Observers. In Proceedings of the ASME International Mechanical Engineering Congress and Exposition, Anaheim, CA, USA, 13–19 November 2004; Volume 11. [Google Scholar] [CrossRef] [Green Version]
- Garimella, P.; Yao, B. Model based fault detection of an electro-hydraulic cylinder. In Proceedings of the 2005, American Control Conference, Portland, OR, USA, 8–10 June 2005; Volume 1, pp. 484–489. [Google Scholar] [CrossRef]
- Khan, H.; Abou, S.C.; Sepehri, N. Nonlinear observer-based fault detection technique for electro-hydraulic servo-positioning systems. Mechatronics 2005, 15, 1037–1059. [Google Scholar] [CrossRef]
- Werlefors, M.; Medvedev, A. Observer-based leakage detection in hydraulic systems with position and velocity feedback. In Proceedings of the 2008 IEEE International Conference on Control Applications, San Antonio, TX, USA, 3–5 September 2008; pp. 948–953. [Google Scholar] [CrossRef]
- An, L.; Sepehri, N. Leakage fault detection in hydraulic actuators subject to unknown external loading. Int. J. Fluid Power 2008, 9, 15–25. [Google Scholar] [CrossRef]
- Márton, L.; Varga, A. Detection of overload generated faults in electro-hydrostatic actuators. In Proceedings of the 2011 19th Mediterranean Conference on Control Automation (MED), Corfu, Greece, 20–23 June 2011; pp. 767–772. [Google Scholar] [CrossRef] [Green Version]
- Gojny, M.; Carl, U.B.; Sachs, H. Device and Method for the Residual Analysis of a Residuum to Detect System Errors in the System Behaviour of a System of an Aircraft. U.S. Patent US9535419B2, 27 October 2011. [Google Scholar]
- Choux, M.; Tyapin, I.; Hovland, G. Leakage-detection in blade pitch control systems for wind turbines. In Proceedings of the 2012 Annual Reliability and Maintainability Symposium, Reno, NV, USA, 23–26 January 2012; pp. 1–7. [Google Scholar] [CrossRef]
- Ossmann, D.; van der Linden, F.L.J. Advanced sensor fault detection and isolation for electro-mechanical flight actuators. In Proceedings of the 2015 NASA/ESA Conference on Adaptive Hardware and Systems (AHS), Montreal, QC, Canada, 15–18 June 2015; pp. 1–8. [Google Scholar] [CrossRef] [Green Version]
- Liu, Y.; Patton, R.J.; Lan, J. Fault-tolerant Individual Pitch Control using Adaptive Sliding Mode Observer. IFAC-Pap. 2018, 51, 1127–1132. [Google Scholar] [CrossRef]
- Asmussen, M.F.; Pedersen, H.C.; Lilleengen, L.; Larsen, A.; Farsakoglou, T. Investigating Fault Detection and Diagnosis in a Hydraulic Pitch System Using a State Augmented EKF-Approach. In Proceedings of the ASME/BATH 2019 Symposium on Fluid Power and Motion Control, Longboat Key, FL, USA, 7–9 October 2019. [Google Scholar] [CrossRef]
- Sørensen, F.; von Benzon, M.; Klemmensen, S.; Schmidt, K.; Liniger, J. Estimation of prepressure in hydraulic piston accumulators for industrial wind turbines using multi-model adaptive estimation. In Proceedings of the ASME/BATH 2019 Symposium on Fluid Power and Motion Control, Longboat Key, FL, USA, 7–9 October 2019; American Society of Mechanical Engineers: New York, NY, USA, 2019. [Google Scholar] [CrossRef]
- IEC. Failure Modes and Effects Analysis (FMEA and FMECA): IEC 60812; International Electrotechnical Commission: Geneva, Switzerland, 2018. [Google Scholar]
- Liniger, J.; Soltani, M.; Pedersen, H.; Carroll, J.; Sepehri, N. Reliability Based Design of Fluid Power Pitch Systems for Wind Turbines. Wind Energy 2017, 20, 1097–1110. [Google Scholar] [CrossRef] [Green Version]
- Liniger, J.; Pedersen, H.C.; Soltani, M. Risk-based Comparative Study of Fluid Power Pitch Concepts. In Proceedings of the ASME/BATH 2017 Symposium on Fluid Power & Motion Control, Sarasota, FL, USA, 16–19 October 2017; American Society of Mechanical Engineers: New York, NY, USA, 2017. [Google Scholar] [CrossRef]
- Liniger, J. Design of Reliable Fluid Power Pitch Systems for Wind Turbines. Ph.D. Thesis, Aalborg Universitet, Aalborg, Denmark, 2018. [Google Scholar] [CrossRef]
- Liniger, J.; Pedersen, H.C.; Soltani, M. Model-based Estimation of Gas Leakage for Fluid Power Accumulators in Wind Turbines. In Proceedings of the ASME/BATH 2017 Symposium on Fluid Power and Motion Control, Sarasota, FL, USA, 16–19 October 2017; American Society of Mechanical Engineers: New York, NY, USA, 2017. [Google Scholar] [CrossRef]
- Poling, B.; Prausnitz, J.; O’Connell, J. The Properties of Gases and Liquids 5E; McGraw Hill Professional, McGraw-Hill Education: New York, NY, USA, 2000. [Google Scholar]
- Fitzpatrick, R. Thermodynamics and Statistical Mechanics: An Intermediate Level Course; Lulu: Tokyo, Japan, 2005. [Google Scholar]
- Canfield, F.B.; Leland, T.W.; Kobayashi, R. Compressibility Factors for Helium-Nitrogen Mixtures. J. Chem. Eng. Data 1965, 10, 92–96. [Google Scholar] [CrossRef]
- Bak, C.; Bitsche, R.; Yde, A.; Kim, T.; Hansen, M.; Zahle, F.; Gaunaa, M.; Blasques, J.; Døssing, M.; Heinen, J.J.; et al. Light rotor: The 10-MW Reference Wind Turbine. In Proceedings of the European Wind Energy Association (EWEA), Copenhagen, Denmark, 16–19 April 2012; Volume 1. [Google Scholar]
- Wind Energy. Available online: https://rwt.windenergy.dtu.dk/dtu10mw/dtu-10mw-rwt/-/tree/master/aeroelastic_models/fast/DTU10MWRWT_FAST_v1.00 (accessed on 17 August 2021).
- Github. Available online: https://github.com/OpenFAST/openfast/releases/tag/v2.3.0 (accessed on 12 July 2021).
- Elorza, I.; Calleja, C.; Pujana-Arrese, A. On Wind Turbine Power Delta Control. Energies 2019, 12, 2344. [Google Scholar] [CrossRef] [Green Version]
- Github. Available online: https://github.com/ielorza/OpenDiscon/tree/739288c3ff9a06d405d2cd8e3e2eb3c7a7439ec3 (accessed on 23 August 2021).
- Jenkins, N.; Burton, A.; Sharpe, D.; Bossanyi, E. Wind Energy Handbook; Wiley: Hoboken, NJ, USA, 2001. [Google Scholar]
- Rodriguez-Guerra, J.; Calleja, C.; Elorza, I.; Macarulla, A.M.; Pujana, A.; Azurmendi, I. A Methodology for Real-Time HiL Validation of Hydraulic-Press Controllers Based on Novel Modeling Techniques. IEEE Access 2019, 7, 110541–110553. [Google Scholar] [CrossRef]
- Eryilmaz, B.; Wilson, B. Modeling the Internal Leakage of Hydraulic Servovalves. In Proceedings of the International Mechanical Engineering Congress and Exposition, (ASME), Orlando, FL, USA, 5–10 November 2000. [Google Scholar]
- Nahian, S.A.; Truong, D.Q.; Chowdhury, P.; Das, D.; Ahn, K.K. Modeling and fault tolerant control of an electro-hydraulic actuator. Int. J. Precis. Eng. Manuf. 2016, 17, 1285–1297. [Google Scholar] [CrossRef] [Green Version]
- Cho, S.; Bachynski, E.E.; Nejad, A.R.; Gao, Z.; Moan, T. Numerical modeling of the hydraulic blade pitch actuator in a spar-type floating wind turbine considering fault conditions and their effects on global dynamic responses. Wind Energy 2020, 23, 370–390. [Google Scholar] [CrossRef]
- Quattrocchi, G.; Berri, P.; Dalla Vedova, M.; Maggiore, P. Back-EMF Reconstruction for Electromechanical Actuators in Presence of Faults. In Proceedings of the 30th European Safety and Reliability Conference and the 15th Probabilistic Safety Assessment and Management Conference (ESREL2020/PSAM15), Venice, Italy, 1–5 November 2020. [Google Scholar] [CrossRef]
- Berri, P.; Dalla Vedova, M. A review of simplified servovalve models for digital twins of electrohydraulic actuators. J. Phys. Conf. Ser. 2020, 1603, 012016. [Google Scholar] [CrossRef]
- Dalla Vedova, M.; Berri, P.; Corsi, C.; Alimhillaj, P. New Synthetic Fluid Dynamic Model For Aerospace Four-Ways Servovalve. Int. J. Mech. Control 2019, 20, 105–112. [Google Scholar]
- Dalla Vedova, M.; Alimhillaj, P. Novel fluid dynamic nonlinear numerical models of servovalves for aerospace. Int. J. Mech. 2019, 13, 39–51. [Google Scholar]
- Dalla Vedova, M.; Maggiore, P.; Riva, G. A new CFD-Simulink based systems engineering approach applied to the modelling of a hydraulic safety relief valve. Int. J. Mech. 2017, 11, 43–50. [Google Scholar]
- Dalla Vedova, M.; Maggiore, P.; Scanavino, M. Numerical modelling of sinusoidal brushless motor for aerospace actuator systems. WSEAS Trans. Circuits Syst. 2017, 12. [Google Scholar]
- Pace, L.; Dalla Vedova, M.; Maggiore, P.; Facciotto, S. Numerical methods for the electromagnetic modelling of actuators for primary and secondary flight controls. In Proceedings of the 18th International Conference on Automatic Control, Modelling & Simulation (ACMOS ’16), Venice, Italy, 29–31 January 2016. [Google Scholar]
- Rakoto, L.; Schorsch, J.; Kinnaert, M. Modelling hydraulic pitch actuator for wind turbine simulation under healthy and faulty conditions. IFAC-Pap. 2015, 48, 577–582. [Google Scholar] [CrossRef]
- Narayanan, V.L.; Ramakrishnan, R. Design and implementation of an intelligent digital pitch controller for digital hydraulic pitch system hardware-in-the-loop simulator of wind turbine. Int. J. Green Energy 2021, 18, 17–36. [Google Scholar] [CrossRef]
- ISO. Hydraulic Fluid Power—Electrically Modulated Hydraulic Control Valves—Part 1: Test Methods for Four-Port Directional Flow-Control Valves; ISO 10770-1; International Organization for Standardization: Geneva, Switzerland, 2009. [Google Scholar]
- Moran, M.J.; Shapiro, H.N.; Boettner, D.D.; Bailey, M.B. Fundamentals of Engineering Thermodynamics, 7th ed.; Wiley: Hoboken, NJ, USA, 2011. [Google Scholar]
- Otis, D.R.; Pourmovahed, A. An Algorithm for Computing Nonflow Gas Processes in Gas Springs and Hydropneumatic Accumulators. J. Dyn. Syst. Meas. Control 1985, 107, 93–96. [Google Scholar] [CrossRef]
- IEC. Wind Turbines—Part 1: Design Requirements; IEC 61400-1; International Electrotechnical Commission: Geneva, Switzerland, 2007. [Google Scholar]


Publisher’s Note: MDPI stays neutral with regard to jurisdictional claims in published maps and institutional affiliations. |
© 2021 by the authors. Licensee MDPI, Basel, Switzerland. This article is an open access article distributed under the terms and conditions of the Creative Commons Attribution (CC BY) license (https://creativecommons.org/licenses/by/4.0/).
Share and Cite
Elorza, I.; Arrizabalaga, I.; Zubizarreta, A.; Martín-Aguilar, H.; Pujana-Arrese, A.; Calleja, C. A Sensor Data Processing Algorithm for Wind Turbine Hydraulic Pitch System Diagnosis. Energies 2022, 15, 33. https://doi.org/10.3390/en15010033
Elorza I, Arrizabalaga I, Zubizarreta A, Martín-Aguilar H, Pujana-Arrese A, Calleja C. A Sensor Data Processing Algorithm for Wind Turbine Hydraulic Pitch System Diagnosis. Energies. 2022; 15(1):33. https://doi.org/10.3390/en15010033
Chicago/Turabian StyleElorza, Iker, Iker Arrizabalaga, Aritz Zubizarreta, Héctor Martín-Aguilar, Aron Pujana-Arrese, and Carlos Calleja. 2022. "A Sensor Data Processing Algorithm for Wind Turbine Hydraulic Pitch System Diagnosis" Energies 15, no. 1: 33. https://doi.org/10.3390/en15010033
APA StyleElorza, I., Arrizabalaga, I., Zubizarreta, A., Martín-Aguilar, H., Pujana-Arrese, A., & Calleja, C. (2022). A Sensor Data Processing Algorithm for Wind Turbine Hydraulic Pitch System Diagnosis. Energies, 15(1), 33. https://doi.org/10.3390/en15010033