Review

Physicochemical Properties of Torrefied and Pyrolyzed Food Waste Biochars as Fuel: A Pilot-Scale Study

Department of Environmental Research, Korea Institute of Civil Engineering and Building Technology, 283 Goyang-daero, Ilsanseo-gu, Goyang-si 10223, Gyeonggi-do, Korea
*
Author to whom correspondence should be addressed.
Energies 2022, 15(1), 333; https://doi.org/10.3390/en15010333
Submission received: 3 November 2021 / Revised: 31 December 2021 / Accepted: 2 January 2022 / Published: 4 January 2022

Abstract

:
Food waste is an important constituent of municipal solid waste, and research has been conducted to develop various methods for treating food waste and recycling it (e.g., fuel, landfilling, composting, conversion into animal feed, drying, and carbonization). Among these, the drying and carbonization techniques can change food waste into fuel; however, they need more energy than fermentation and anaerobic digestion procedures. In this study, we investigated the physicochemical properties of food waste biochar produced under torrefaction (270 °C) and pyrolysis (450 °C) conditions to establish its applicability as fuel by comparing temperatures, residence times, and conditions before and after demineralization. The higher heating value increased after the demineralization process under both temperature conditions (270 °C and 450 °C), and the chlorine level was lower at 270 °C temperature demineralization than at 450 °C. During the demineralization process, Na and K were better removed than Ca and Mg. Additionally, Cr, Hg, Cd, and Pb levels were lower than those according to the European Union and Korean domestic bio-SRF recovered fuel criteria, confirming the applicability of biochar as fuel.

1. Introduction

Food waste (FW) is a major component of municipal solid waste (MSW), and research has been conducted to develop various methods to treat FW and recycle it as fuel [1,2,3]. Landfill, composting through fermentation-extinction treatment, anaerobic digestion (where FW is decomposed by microorganisms), and conversion into animal feed have all been used to treat FW. Composting and anaerobic digestion are the most widely used of these methods, but both require long residence times and effective biological management because these processes require microorganisms [4]. Drying and carbonization methods are useful technologies for utilizing large amounts of food as fuel because they can treat FW within a short period of time and use it as fuel. However, they require more energy than fermentation extinction and anaerobic digestion processes [5,6].
In South Korea, 14,000 tons of FW is generated per day on average, accounting for approximately 27.4% of MSW [7]. Some of this FW is dried and converted into feed, and some is subjected to composting for treatment. However, due to outbreaks of African swine fever and avian influenza in South Korea in 2019, FW can no longer be used as feed [8,9]. In addition, FW features limitations as a soil conditioner because its high salt concentration hardens soil [10]. Thus, a new method to treat FW is required. As the salt contained in FW generates dioxins or toxic substances during incineration, sufficient demineralization is essential during the production of biochar [11,12].
Heat treatment methods for converting FW into fuel can be divided into drying, torrefaction, pyrolysis, or gasification processes, according to the temperature used [13]. Torrefaction is a heat treatment technique that is performed under anaerobic conditions at 200–300 °C [14,15], whereas pyrolysis involves the thermal decomposition of biomass in the absence of oxygen at temperatures between 400 and 800 °C, thereby producing bio-oil, various gaseous components, and biochar [16,17,18].
The efficiency of the pyrolysis process for FW varies depending on its composition and operating variables. Most previous studies on the pyrolysis of FW have focused on investigating the pyrolysis of single components [2,6,19,20]. Furthermore, studies on the pyrolysis of FW have only focused on yields obtained at various pyrolysis temperatures. Moreover, investigations on the demineralization of FW have mostly been performed using synthetic samples at a laboratory scale, with batch-type residence times [7,21]. Therefore, more studies are required regarding the continuous treatment of mixed FW, which is generated in large cities.
The European Union (EU) waste renewable fuel standards for converting FW into fuel present criteria for various components, based on solid recovered fuel (SRF). In particular, the grades for net calorific value (NCV), Cl content, and Hg content are determined using five classes. South Korea’s SRF criteria are similar to those of the EU, but different criteria are applied for SRF and bio-SRF [22,23].
In this study, therefore, the physicochemical properties of FW biochar were investigated according to the temperature, residence time, and demineralization, using a pilot plant-scale continuous reactor that produced approximately one ton of biochar per day. In addition, the criteria necessary for biochar to be used as fuel were examined.

2. Materials and Methods

2.1. Materials

The dried FW used in the experiment comprised dry feed, which is used as feed for livestock such as chickens and ducks and was pretreated at the Gimpo Resource Recycling Center, Korea, using a dryer. In the pretreatment process, FW was added, sorted, crushed, and dried to obtain dry feed samples. Here, samples were sterilized and used as raw materials for the animal feed. Table 1 shows the properties of the dried FW used in the experiment.

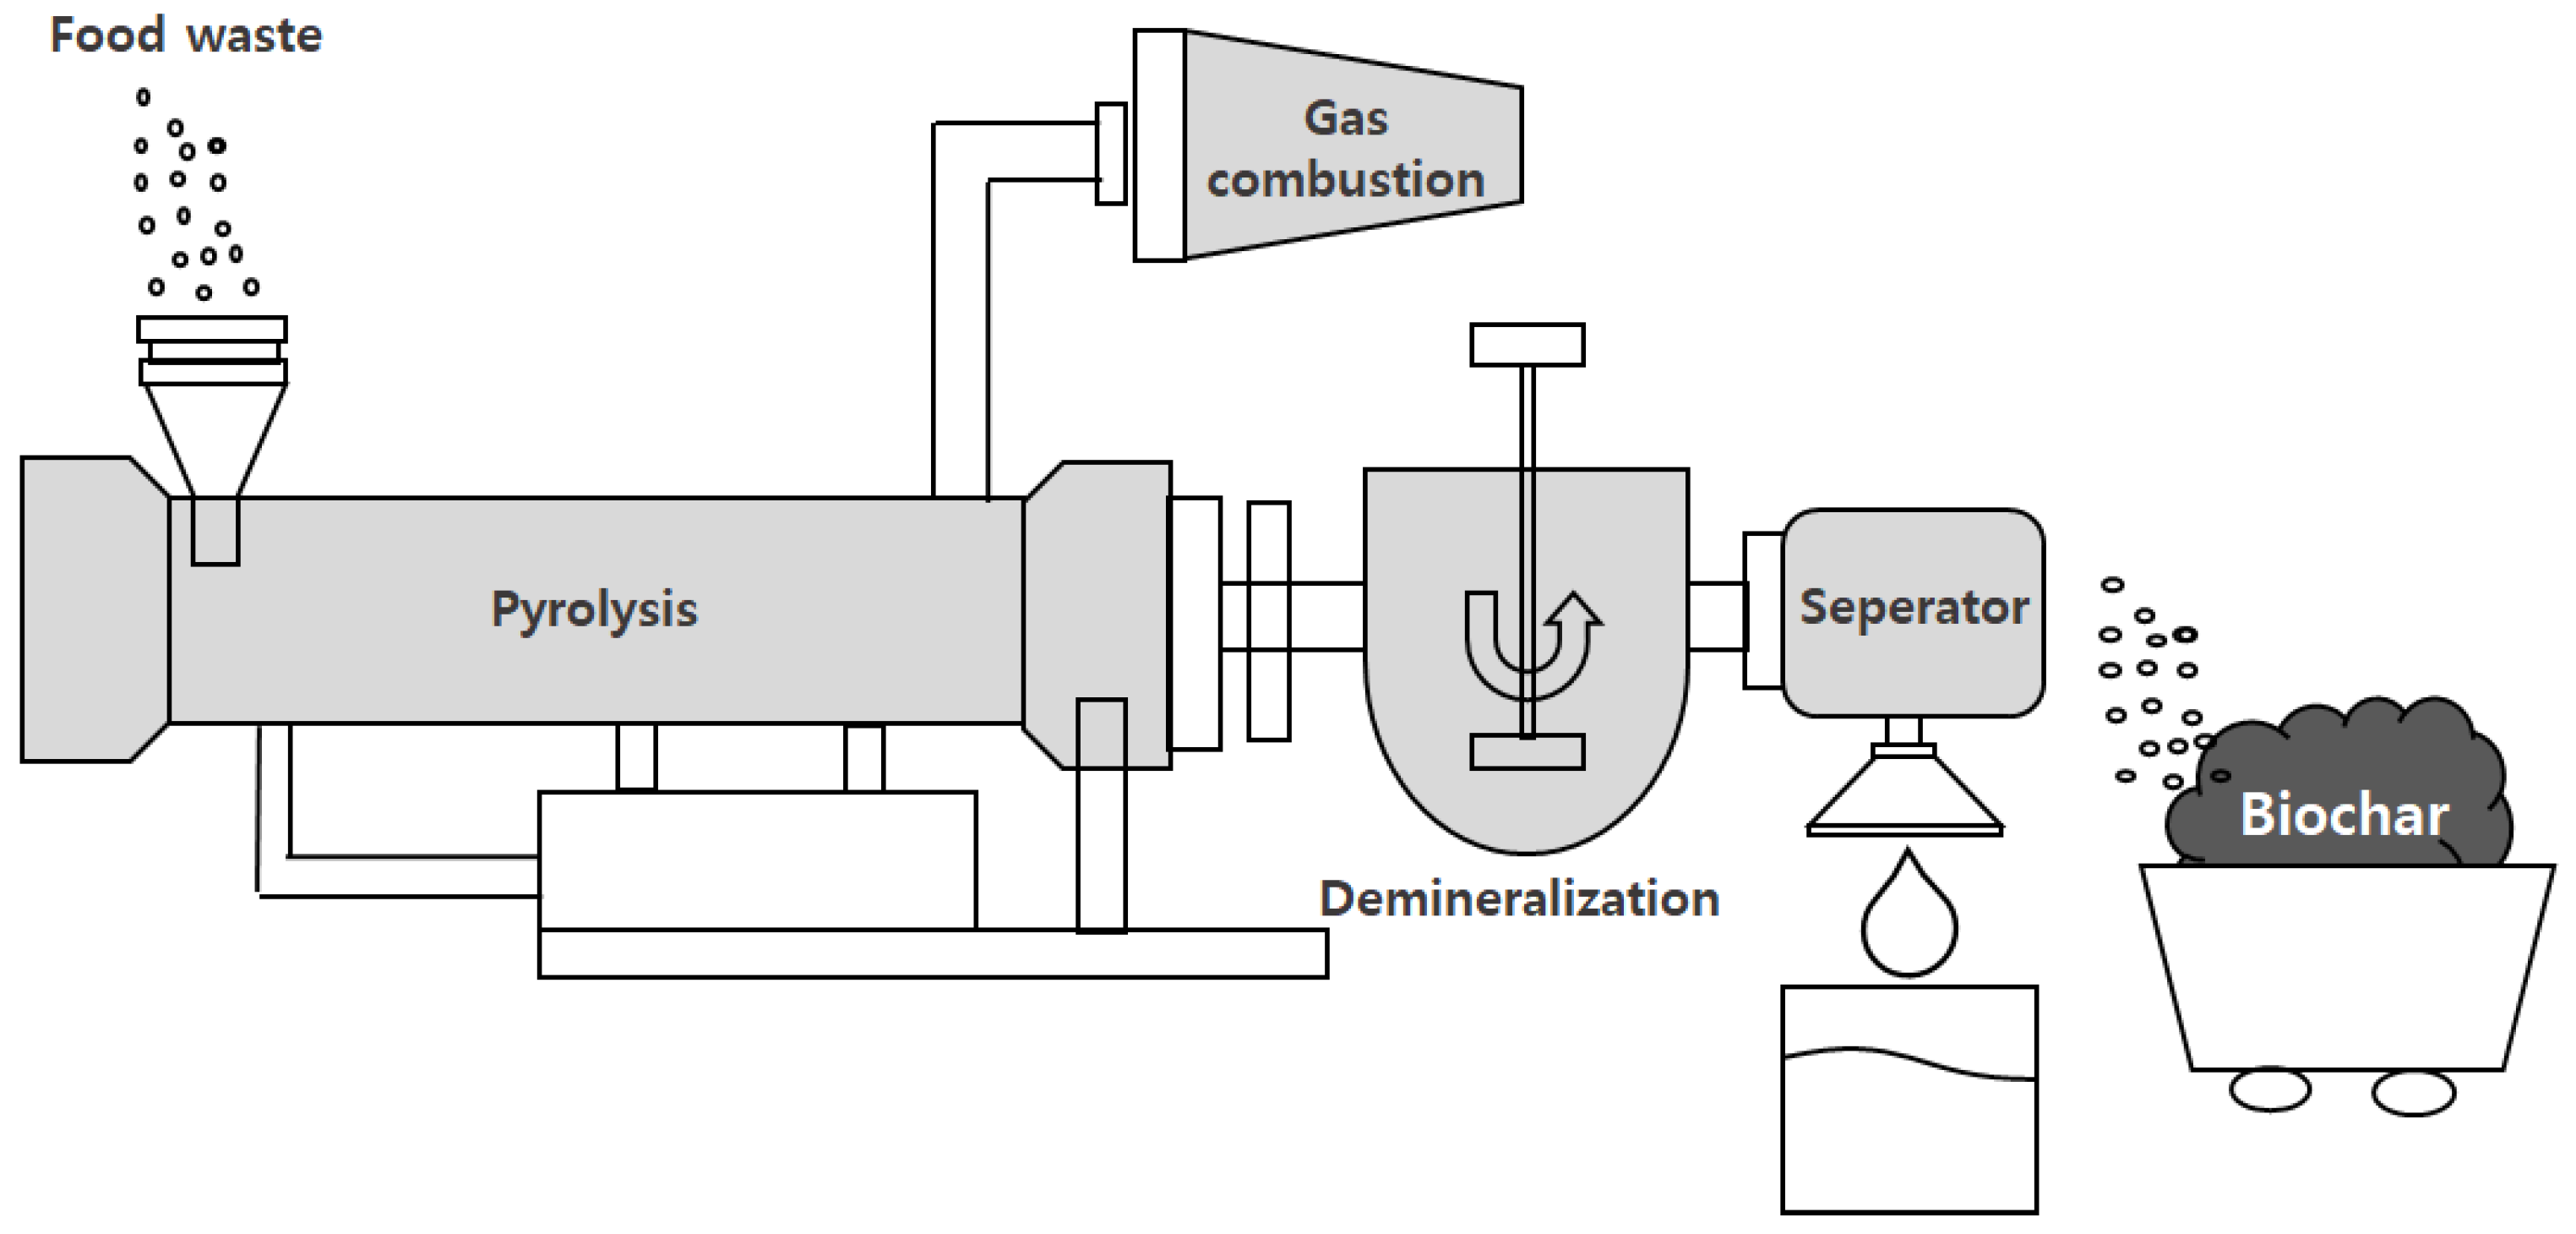
2.2. Pyrolysis Furnace

Figure 1 shows the continuous pyrolysis device (HM Corp., Hwansung-si, Korea, electric furnace) used in the experiment. Its maximum internal temperature was 550 °C, and the heating rate was set to 8 °C·min−1. In addition, the pyrolysis time could be adjusted from 10 to 50 min.
The pyrolysis device featured a closed structure, except for the sample inlet and outlet. The average input amount of the sample was 150 kg·h−1, which was determined according to the residence time. In the experiment, biochar was produced through torrefaction at 270 °C and pyrolysis at 450 °C.

2.3. Sample Analysis

The NCV of the biochar was measured using a bomb calorimeter before and after demineralization for the carbonized samples (6400 Automatic Isoperibol Calorimeter, Parr, Moline, IL, USA). Ion chromatography (AQF,-2100H, Mjitsubishi Chemical Analytech Co. Ltd., Kanagawa, Japan) was used to determine the Cl content. Inductively coupled plasma-optical emission spectrometry (Agilent 720, Agilent, Santa Clara, CA, USA) was used to analyze the ion components of the biochar before and after demineralization. An inductively coupled plasma-optical emission spectrometer, a Cary 650 ultraviolet/visible (UV/Vis) spectrophotometer (Agilent, USA), and an M7600 mercury analyzer (Teledyne, Mason, OH, USA) were used to examine the alkali and alkali earth metals (AAEMs) and heavy metals. A Hitachi S-3400N scanning electron microscope (SEM) was also used for visual analysis.

2.4. Pyrolysis and Demineralization Process

In the experiment, dry feed samples were inserted through the inlet of the pyrolysis furnace and the residence time was set as 10, 20, or 30 min at either 270 or 450 °C to produce the biochar. The quality characteristics of the biochar produced as fuel before and after demineralization were analyzed. The demineralization reactor, which featured an effective volume of approximately 20 L, mixed the produced biochar and water well for demineralization. After mixing 1 kg of biochar with 10 L of water and stirring the mixture for 20 min, suction was performed using a filtered pump and the biochar was dried in a dryer and stored at room temperature. The samples were analyzed thrice or more to ensure precision.

2.5. Statistical Analyses

The experimental data were statistically analyzed using Microsoft Excel 2016. The means and standard deviations of the higher heating value (HHV), Cl, AAEM, heavy metals, water, proximate analysis, and ultimate analysis in the biochar were calculated and expressed in each figure and table.

3. Results and Discussion

3.1. NCV and Chloride Ion Analysis

Figure 2 shows changes in the HHV before and after demineralization at different pyrolysis temperatures. Under the torrefaction temperature conditions (270 °C), the HHV before demineralization gradually increased as the residence time increased. Under the pyrolysis temperature conditions (450 °C), however, the HHV before demineralization slightly decreased at a residence time of 20 min. The NCV of the biochar increased with increasing temperature and residence time due to increases in the C content and salt removal. However, the NCV decreased at temperatures above 400 °C due to the pyrolysis reaction [5,7,24]. The differences in HHV before and after demineralization were 1.88, 1.53, and 1.25 MJ·kg−1 for residence times of 10, 20, and 30 min, respectively. At 450 °C, the differences in HHV before and after demineralization were 1.10, 1.67, and 0.77 MJ·kg−1 for residence times of 10, 20, and 30 min, respectively. Under both temperature conditions, NCV was higher after demineralization than before. The NCV increased if the C content in the elemental component surged because it was closely related to the C content; the NCV also increased due to the removal of salt from the biochar [5,25,26].
Figure 3 shows changes in the Cl content before and after demineralization at different pyrolysis temperatures. At 270 °C, the Cl content ranged from 1.50 to 1.62% before demineralization and from 0.28 to 0.34% after demineralization, confirming a reduction in the Cl content. At 450 °C, the Cl content before demineralization ranged from 2.66 to 2.92%; these values were higher than those obtained at 270 °C due to the higher temperature. After demineralization, the Cl content ranged from 0.56 to 1.24%, showing that a relatively large amount of Cl was removed at the higher temperature. At 450 °C, the removed Cl content increased to 1.68, 1.93, and then 2.26% as the residence time increased; i.e., more Cl was removed than at 270 °C. This appears to be because the crystal structure of the chloride ions changed into a structure that can dissolve well in water due to the higher temperature. The Cl content of the dry feed was 1.62%, and the Cl content before demineralization was lower at 270 °C than at 450 °C, which could be because many substances were volatilized as gas by pyrolysis as the pyrolysis temperature increased, whereas Cl remained in a crystal structure without being volatized and became more concentrated [6]. The chloride ion removal efficiency ranged from 77.3 to 81.2% at 270 °C and from 57.5 to 79.8% at 450 °C. The Cl concentration after demineralization at 270 °C was 0.3% or less, which was lower than at 450 °C.

3.2. AAEM Component Analysis and Removal Efficiency
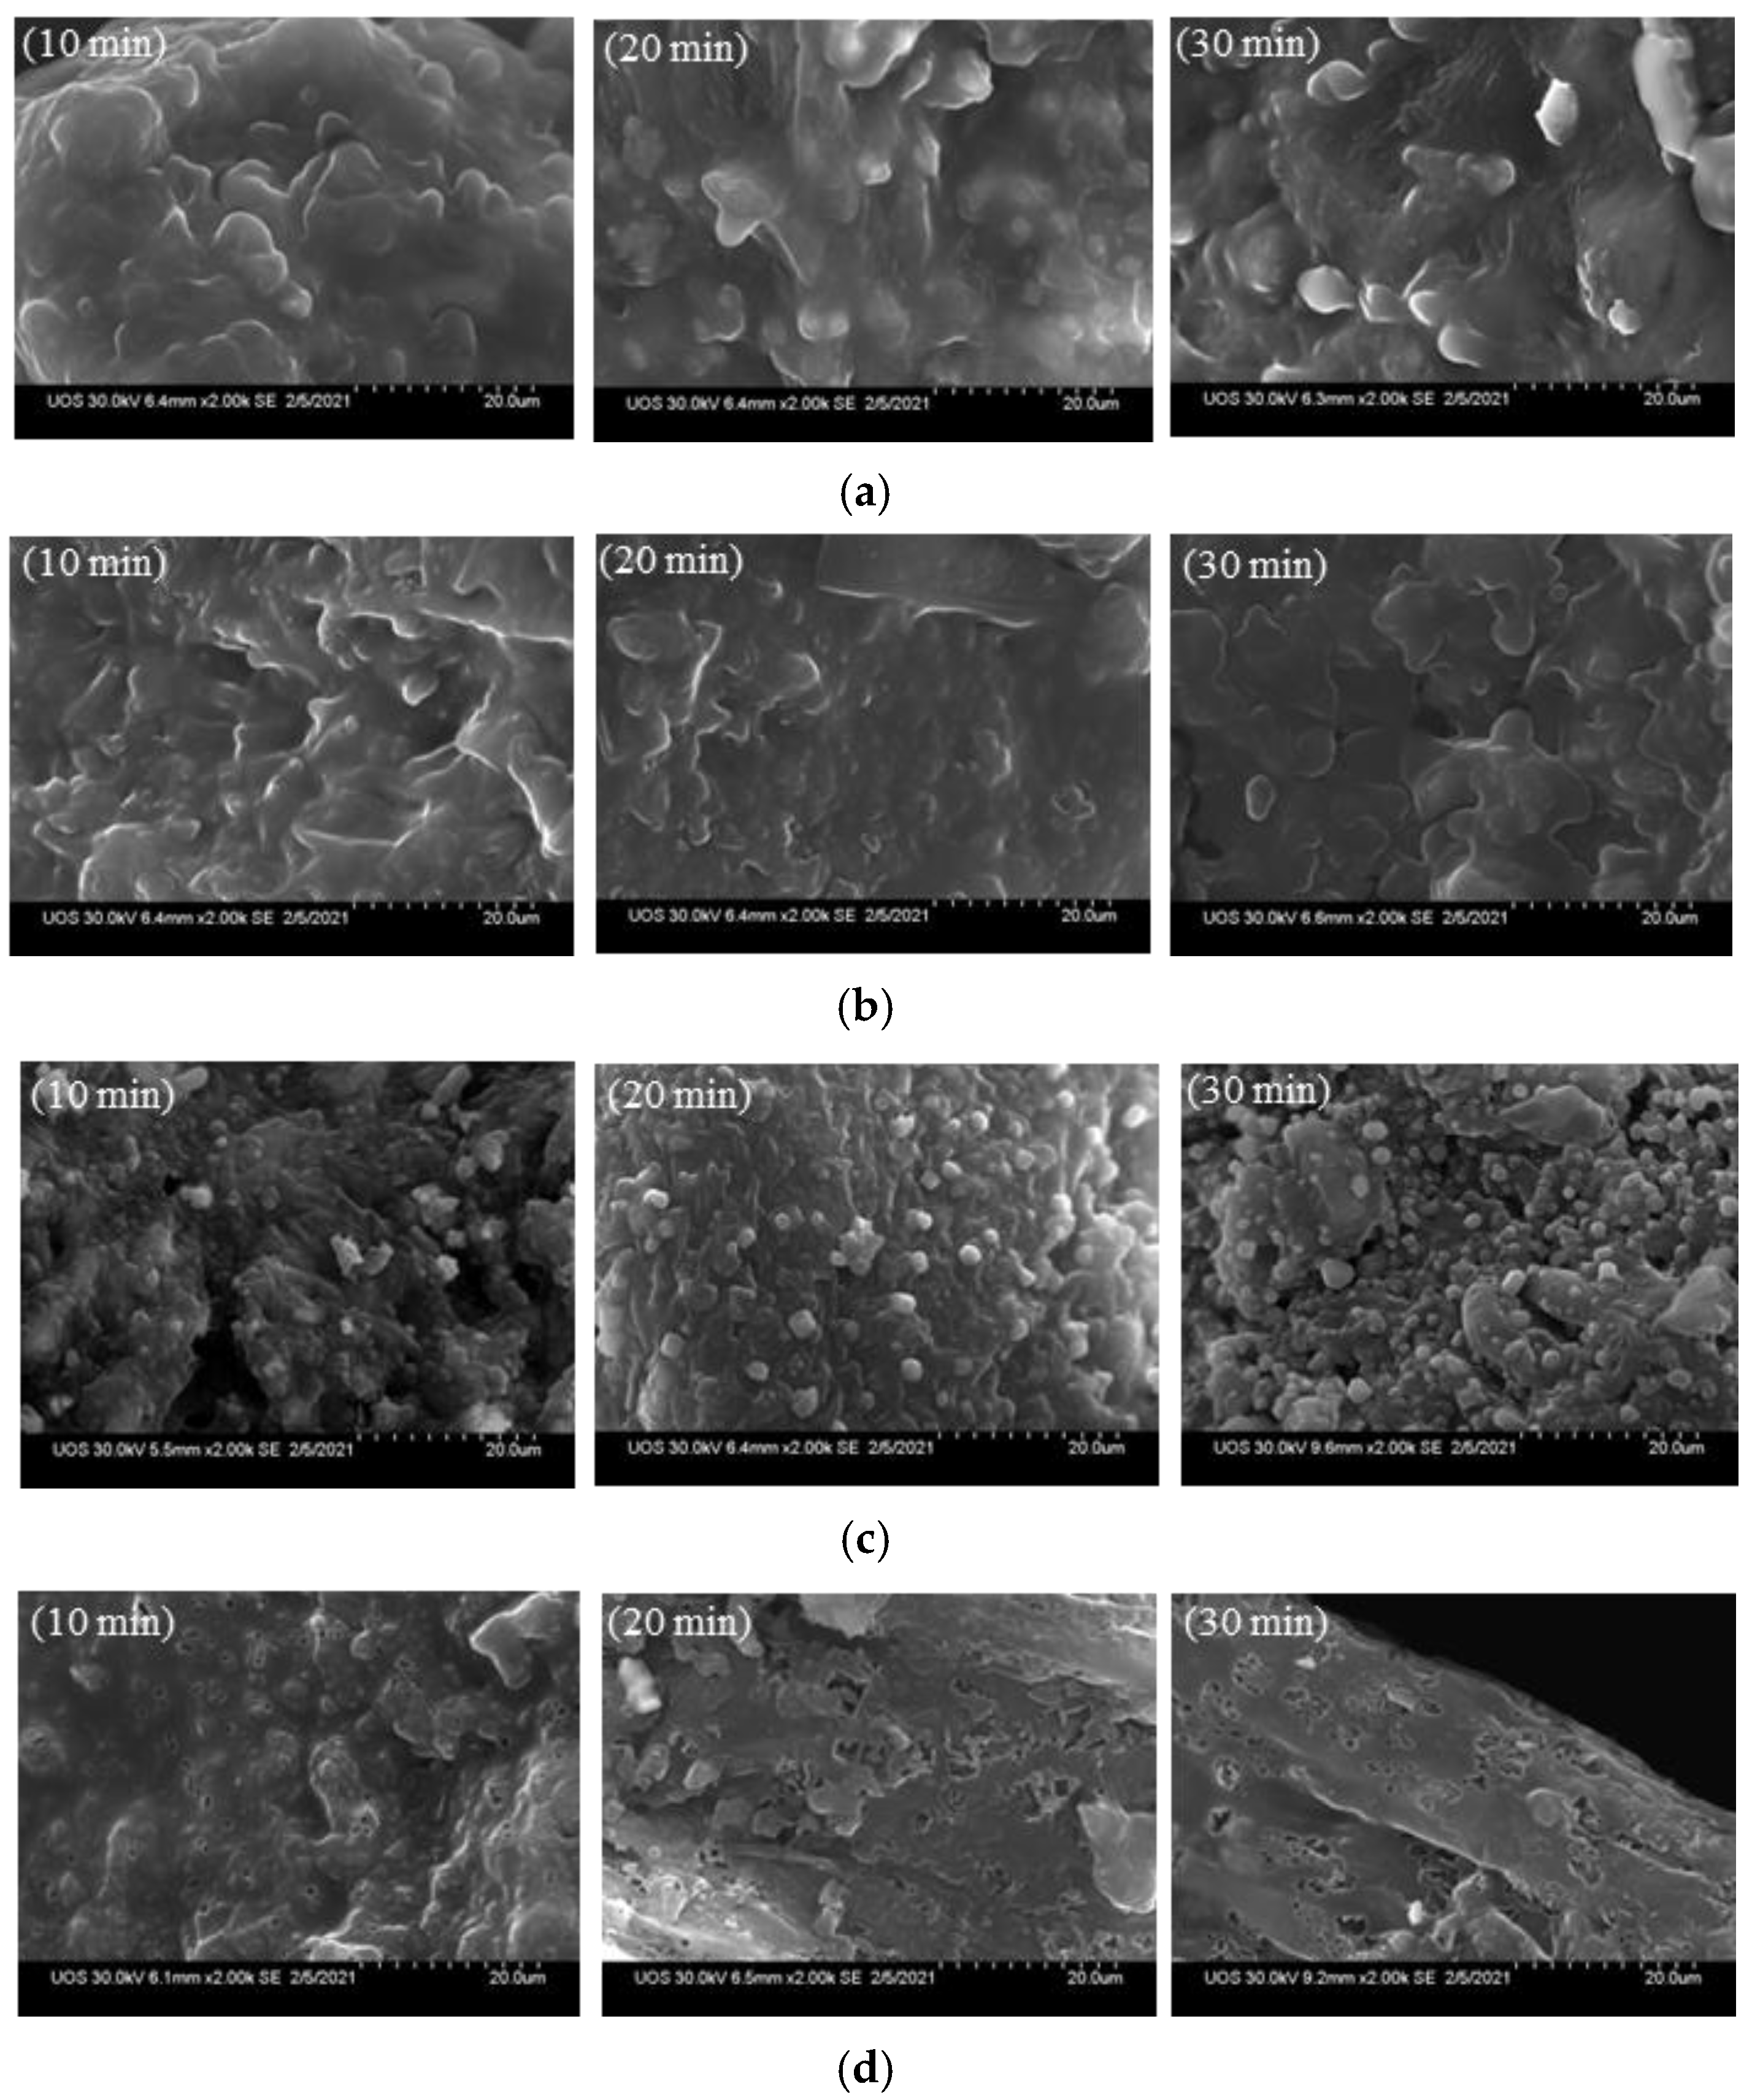
Among the components of biochar, Na, K, Ca, and Mg, which are collectively called AAEMs, are constituent components of ash. The failure to sufficiently remove these components may lead to slagging caused by ash, the generation of fine particulate matter, and a reduction in heat transfer efficiency [27]. Figure 4 shows the analysis results for the AAEMs in the biochar. At both 270 °C and 450 °C, the contents of Na, K, and Ca were higher than the content of Mg. The contents of the alkali metals (Na and K) decreased both before and after demineralization. Among the alkali earth metals, the Ca content increased after demineralization, whereas the Mg content decreased at a low temperature (270 °C) but increased at a high temperature (450 °C). The AAEM content was lower than the raw material at 270 °C but higher at 450 °C due to the concentration of AAEM. It is easy to remove Na and K, which are water-soluble substances, but Ca and Mg are more difficult to remove because they are water-insoluble [28]. Increases in AAEM content according to temperature have been discussed by several researchers [29,30,31]. Here, as the pyrolysis temperature increased, the AAEM content in the biochar increased, thereby decreasing the removal efficiency at high temperatures.

3.3. SEM Analysis

Figure 5 shows SEM images of the biochar before and after demineralization. At 270 °C, as the residence time increased from 10 to 20 and then 30 min, crystalline particles were observed on the surface of the biochar before demineralization; the surface became smooth after demineralization. More crystal structures were observed at 450 °C than at 270 °C, with more crystals being formed on biochar surfaces as the residence time increased. Lee et al. [32] formed hexagonal crystal structures on biochar surfaces using a synthetic sample; however, the present study confirmed that hexagonal crystal structures were not formed at 270 °C, but they were observed at a higher temperature, of 450 °C. After demineralization, the crystals on the biochar surface were removed as they were dissolved in water.

3.4. Analysis of Heavy Metals

The EU standards for SRF classify NCV, Cl, and Hg into five grades [22,33]. In South Korea, the domestic bio-SRF criteria are 3000 kcal·kg−1 or higher for NCV; 0.5 wt.% or lower for Cl; and 5.0, 100.0, 70.0, and 0.6 mg·kg−1 or lower for the heavy metals Cd, Pb, Cr, and Hg, respectively [23,34]. Table 2 shows heavy metal contents in biochar before and after demineralization. The analysis results for Cd, Pb, Cr, and Hg are shown here. No Cr or Hg was detected before or after demineralization; however, the contents of Cd (0.26–0.60 mg·kg−1) and Pb (0–3.01 mg·kg−1) were lower than the EU and the domestic bio-SRF criteria for both Cd and Pb. The contents of heavy metals in the source of FW were lower than those in sewage sludge, in which the characteristics of the EU and the domestic bio-SRF criteria were less than the concentration limits appeared.

3.5. Analysis of Demineralized Water

Figure 6 shows the analysis of the Cl and AAEM contents in demineralized water remaining after the demineralization of the biochar. The Cl concentration gradually decreased at 270 °C as the residence time increased, but it gradually increased at 450 °C, demonstrating that more chloride ions were eluted as the residence time increased. Na and K, which are alkali metals, were eluted in larger quantities than alkali earth metals because of their water solubility. The elution amount decreased as the residence time increased to 270 °C, but subsequently increased as the residence time increased to 450 °C. It appears that the elution amount increased with the surge in pyrolysis temperature because the relative proportions of water-soluble Na and K increased [35]. As shown in the SEM images, we found that biochar at 450 °C has a clear crystal structure due to pyrolysis at a higher temperature than 270 °C and an increase in the residence time demineralizes a large amount of salt (see Figure 5).

3.6. Proximate and Ultimate Analyses

Table 3 shows the results of the proximate and ultimate analyses before and after demineralization for a residence time of 20 min at 270 and 450 °C. Important parameters for biochar to be used as fuel include fixed carbon (FC), moisture, particle size, and heating temperature [36]. Increasing the temperature diminished the volatile components, increased the ash, and, accordingly, increased the FC. With increasing temperature, the C increased, but the H, N, O, and S decreased. Furthermore, with the increase in temperature, the FC increased and the volatile matter (VM) decreased due to a surge in the reactivity of the devolatilization and pyrolysis reactions, thereby increasing the FC/VM and decreasing the FC + VM [25,37,38]. As the temperature increased, the C/N increased, but the H/C and O/C decreased. This indicates that the biochar gradually became carbonaceous [36,39].

4. Conclusions

In this study, the physicochemical properties of biochar and the criteria for it to be used as fuel were examined under torrefaction (270 °C) and pyrolysis (450 °C) conditions for dry feed produced from a feed conversion facility using FW. HHV increased after demineralization, and the chloride ion removal efficiency after demineralization ranged from 77.3 to 81.2% at 270 °C and from 57.5 to 79.8% at 450 °C. The AAEM analysis results showed that the AAEM content in the biochar increased as the pyrolysis temperature increased and that the removal efficiency decreased at high temperatures. When the heavy metals in the biochar were analyzed, no Cr or Hg was detected, and the contents of Cd and Pb were lower than those defined by the EU and Korean domestic bio-SRF criteria. In the demineralized water remaining after the demineralization of the biochar, the elution contents of water-soluble Cl, Na, and K were higher than those of Ca and Mg. The biochar prepared at 270 °C showed a lower NCV than that prepared at 450 °C due to its lower C content. However, the difference in NCV was not significant, and the Cl concentration in the biochar at 270 °C was low after demineralization, thereby confirming its applicability as fuel. To turn food waste into fuel, additional research on temperature conditions, environmental standards, and energy reduction is needed.

Author Contributions

Conceptualization, K.-H.A.; validation, K.-H.A., D.-C.S. and I.-T.K.; formal Analysis, Y.-E.L., Y.J.; data curation, K.-H.A., D.-C.S.; investigation, K.-H.A.; resources, D.-C.S., K.-H.A. and J.J.; visualization, K.-H.A.; project administration, K.-H.A.; writing—original draft preparation, K.-H.A.; writing—review and editing, K.-H.A., Y.-E.L., Y.J. and I.-T.K.; supervision, I.-T.K. All authors have read and agreed to the published version of the manuscript.

Funding

This research was funded by the Korea Institute of Civil Engineering and Building Technology (KICT), grant number 20210105-001.

Institutional Review Board Statement

Not applicable.

Informed Consent Statement

Not applicable.

Data Availability Statement

Not applicable.

Conflicts of Interest

The authors declare no conflict of interest.

References

  1. Yang, Z.; Koh, S.K.; Ng, W.C.; Lim, R.C.J.; Wang, C.-H. Potential application of gasification to recycle food waste and rehabilitate acidic soil from secondary forests on degraded land in Southeast Asia. J. Environ. Manag. 2016, 172, 40–48. [Google Scholar] [CrossRef]
  2. Opatokun, S.A.; Yousef, L.F.; Strezov, V. Agronomic assessment of pyrolysed food waste digestate for sandy soil management. J. Environ. Manag. 2017, 187, 24–30. [Google Scholar] [CrossRef]
  3. Jia, Y.; Wang, Y.; Zhang, Q.; Rong, H.; Liu, Y.; Ziao, B.; Guo, D.; Laghari, M.; Ruan, R. Gas-carrying enhances the combustion temperature of the biomass particles. Energy 2022, 239, 121956. [Google Scholar] [CrossRef]
  4. Mir, M.A.; Hussain, A.; Verma, C. Design considerations and operational performance of anaerobic digester: A review. Cogent Eng. 2016, 3, 1181696. [Google Scholar] [CrossRef]
  5. Poudel, J.; Ohm, T.-I.; Oh, S.C. A study on torrefaction of food waste. Fuel 2015, 140, 275–281. [Google Scholar] [CrossRef]
  6. Elkhalifa, S.; Al-Ansari, T.; Mackey, H.R.; McKay, G. Food waste to biochars through pyrolysis: A review. Resour. Conserv. Recycl. 2019, 144, 310–320. [Google Scholar] [CrossRef]
  7. Lee, Y.-E.; Jo, J.-H.; Kim, S.-M.; Yoo, Y.-S. Recycling possibility of the salty food waste by pyrolysis and water scrubbing. Energies 2017, 10, 210. [Google Scholar] [CrossRef] [Green Version]
  8. Jori, F.; Bastos, A.D.S. Role of wild suids in the epidemiology of African swine fever. Ecohealth 2009, 6, 296–310. [Google Scholar] [CrossRef] [PubMed] [Green Version]
  9. Shi, W.; Gao, G.F. Emerging H5N8 avian influenza viruses. Science 2021, 21, 784–786. [Google Scholar] [CrossRef] [PubMed]
  10. Lee, J.-H.; Kang, Y.-G.; Luyima, D.; Park, S.-J.; Oh, T.-K.; Lee, C.H. Characteristics of food waste: Water and salinity contents. Korean J. Agric. Sci. 2020, 47, 375–380. [Google Scholar]
  11. Williams, P.T. Dioxins and furans from the incineration of municipal solid waste: An overview. J. Energy Inst. 2005, 78, 38–48. [Google Scholar] [CrossRef]
  12. Katami, T.; Yasuhara, A.; Shibamoto, T. Formation of dioxins from incineration of foods found in domestic garbage. Environ. Sci. Technol. 2004, 38, 1062–1065. [Google Scholar] [CrossRef]
  13. Knapczyk, A.; Francik, S.; Jewiarz, M.; Zawi´slak, A.; Francik, R. Thermal treatment of biomass: A bibliometric analysis—The torrefaction case. Energies 2021, 14, 162. [Google Scholar] [CrossRef]
  14. van der Stelta, M.J.C.; Gerhauser, H.; Kiel, J.H.A.; Ptasinski, K.J. Biomass upgrading by torrefaction for the production of biofuels: A review. Biomass Bioenergy 2011, 35, 3748–3762. [Google Scholar] [CrossRef]
  15. Chen, D.; Zheng, Z.; Fu, K.; Zeng, Z.; Wang, J.; Lu, M. Torrefaction of biomass stalk and its effect on the yield and quality of pyrolysis products. Fuel 2015, 159, 27–32. [Google Scholar] [CrossRef]
  16. Chen, W.-H.; Wang, C.-W.; Ong, H.C.; Show, P.L.; Hsieh, T.-H. Torrefaction, pyrolysis and two-stage thermodegradation of hemicellulose, cellulose and lignin. Fuel 2019, 258, 116168. [Google Scholar] [CrossRef]
  17. Chen, W.-H.; Lin, B.-J. Characteristics of products from the pyrolysis of oil palm fiber and its pellets in nitrogen and carbon dioxide atmospheres. Energy 2016, 94, 569–578. [Google Scholar] [CrossRef]
  18. Cui, B.; Chen, Z.; Guo, D.; Liu, Y. Investigations on the pyrolysis of microalgal-bacterial granular sludge: Products, kinetics, and potential mechanisms. Bioresour. Technol. 2021, 23, 126328. [Google Scholar] [CrossRef]
  19. Opatokun, S.A.; Strezov, V.; Kan, T. Product based evaluation of pyrolysis of foodwaste and its digestate. Energy 2015, 92, 349–354. [Google Scholar] [CrossRef]
  20. Opatokun, S.A.; Kan, T.; Al Shoaibi, A.; Srinivasakannan, C.; Strezov, V. Characterization of food waste and its digestate as feedstock for thermochemical processing. Energy Fuels 2016, 30, 1589–1597. [Google Scholar] [CrossRef]
  21. Jo, J.-H.; Kim, S.-S.; Sim, J.-W.; Lee, Y.-E.; Yoo, Y.-S. Pyrolysis characteristics and kinetics of food wastes. Energies 2017, 10, 1191. [Google Scholar] [CrossRef] [Green Version]
  22. BS EN 15359; Solid Recovered Fuels—Specifications and Classes; BSI Standards Publication: London, UK, 2011.
  23. Jeong, Y.; Lee, Y.-E.; Kim, I.-T. Characterization of sewage sludge and food waste-based biochar for co-firing in a coal-fired power plant: A case study in Korea. Sustainability 2020, 12, 9411. [Google Scholar] [CrossRef]
  24. Uemura, Y.; Omar, W.N.; Tsutsui, T.; Yusup, S.B. Torrefaction of oil palm wastes. Fuel 2011, 90, 2585–2591. [Google Scholar] [CrossRef]
  25. Samad, N.A.F.A.; Jamin, N.A.; Saleh, S. Torrefaction of municipal solid waste in Malaysia. Energy Procedia 2017, 138, 313–318. [Google Scholar] [CrossRef] [Green Version]
  26. Wannapeera, J.; Fungtammasan, B.; Worasuwannarak, N. Effects of temperature and holding time during torrefaction on the pyrolysis behaviors of woody biomass. J. Anal. Appl. Pyrolysis 2011, 92, 99–105. [Google Scholar] [CrossRef]
  27. Wang, Y.; Tan, H.; Wang, X.; Du, W.; Mikulčić, H.; Duić, N. Study on extracting available salt from straw/woody biomass ashes and predicting its slagging/fouling tendency. J. Clean. Prod. 2017, 155, 164–171. [Google Scholar] [CrossRef]
  28. Yu, J.; Guo, Q.; Gong, Y.; Wang, J.; Yu, G. A review of the effects of alkali and alkaline earth metal species on biomass gasification. Fuel Process. Technol. 2021, 214, 106723. [Google Scholar] [CrossRef]
  29. Ma, Z.; Yang, Y.; Ma, Q.; Zhou, H.; Luo, X.; Liu, X.; Wang, S. Evolution of the chemical composition, functional group, pore structure and crystallographic structure of bio-char from palm kernel shell pyrolysis under different temperatures. J. Anal. Appl. Pyrolysis 2017, 127, 350–359. [Google Scholar] [CrossRef]
  30. Cao, X.; Harris, W. Properties of dairy-manure-derived biochar pertinent to its potential use in remediation. Bioresour. Technol. 2010, 101, 5222–5228. [Google Scholar] [CrossRef] [PubMed]
  31. Magdziarz, A.; Dalai, A.K.; Koziński, J.A. Chemical composition, character and reactivity of renewable fuel ashes. Fuel 2016, 176, 135–145. [Google Scholar] [CrossRef]
  32. Lee, Y.-E.; Jo, J.-H.; Kim, I.-T.; Yoo, Y.-S. Influence of NaCl concentration on food-waste biochar structure and templating effects. Energies 2018, 11, 2341. [Google Scholar] [CrossRef] [Green Version]
  33. Iacovidou, E.; Hahladakis, J.; Deans, I.; Velis, C.; Purnell, P. Technical properties of biomass and solid recovered fuel (SRF) co-fired with coal: Impact on multi-dimensional resource recovery value. Waste Manag. 2018, 73, 535–545. [Google Scholar] [CrossRef]
  34. Ministry of Environment. Enforcement Rule of the Act on the Promotion of Saving and Recycling of Resources; Ministry of Environment: Sejong City, Korea, 2020.
  35. Jeong, Y.; Lee, Y.-E.; Shin, D.-C.; Ahn, K.-H.; Jung, J.; Kim, I.-T. Demineralization of food waste biochar for effective alleviation of alkali and alkali earth metal species. Processes 2021, 9, 47. [Google Scholar] [CrossRef]
  36. Lampropoulos, A.; Kaklidis, N.; Athanasiou, C.; Montes-Morán, M.A.; Arenillas, A.; Menéndez, J.A.; Binas, V.D.; Konsolakis, M.; Marnellos, G.E. Effect of olive kernel thermal treatment (torrefaction vs. slow pyrolysis) on the physicochemical characteristics and the CO2 or H2O gasification performance of as-prepared biochars. Int. J. Hydrogen Energy 2021, 46, 29126–29141. [Google Scholar] [CrossRef]
  37. Chen, R.; Sheng, Q.; Dai, X.; Dong, B. Upgrading of sewage sludge by low temperature pyrolysis: Biochar fuel properties and combustion behavior. Fuel 2021, 300, 121007. [Google Scholar] [CrossRef]
  38. Deng, J.; Wang, G.-J.; Kuang, J.-H.; Zhang, Y.-L.; Luo, Y.-H. Pretreatment of agricultural residues for co-gasification via torrefaction. J. Anal. Appl. Pyrolysis 2009, 86, 331–337. [Google Scholar] [CrossRef]
  39. Angın, D. Effect of pyrolysis temperature and heating rate on biochar obtained from pyrolysis of safflower seed press cake. Bioresour. Technol 2013, 128, 593–597. [Google Scholar] [CrossRef] [PubMed]
Figure 1. Food waste (FW) pyrolysis furnace experimental setup for biochar production.
Energies 15 00333 g001
Figure 2. Higher heating value (HHV) before and after demineralization at different temperatures. Error bars represent standard deviation (n = 3), (a) 270 °C, (b) 450 °C.
Energies 15 00333 g002aEnergies 15 00333 g002b
Figure 3. Cl concentration before and after demineralization and removal efficiency at different temperatures. Error bars represent standard deviation (n = 3), (a) 270 °C, (b) 450 °C.
Energies 15 00333 g003
Figure 4. Alkali and alkali earth metal (AAEM) contents in biochar according to temperature, (a) 270 °C, (b) 450 °C.
Energies 15 00333 g004
Figure 5. Scanning electron microscope (SEM) analysis before and after the demineralization of the biochar (×2000), (a) 270 °C, before demineralization, (b) 270 °C, after demineralization, (c) 450 °C, before demineralization, (d) 450 °C, after demineralization.
Energies 15 00333 g005
Figure 6. Ultimate analysis of demineralized water.
Energies 15 00333 g006
Table 1. Ultimate and proximate analyses of the dry feed used in the experiment.
PropertiesValues
Elements (wt.%, dry)C43.10
H6.91
N3.14
O38.45
S0.62
Cl1.62
Others6.16
Moisture (%, wet) 9.91
Volatile matter (%, wet) 70.19
Ash (%, wet) 8.78
Fixed C 11.13
HHV (MJ·kg−1) 18.8
Table 2. Analysis of heavy metals in biochar before and after demineralization. (N.D.; not detected).
MetalRaw270 °C450 °C
10 min20 min30 min10 min20 min30 min
BeforeAfterBeforeAfterBeforeAfterBeforeAfterBeforeAfterBeforeAfter
Cd
(mg·kg−1)
0.26 ± 0.040.39 ± 0.030.43 ± 0.020.35 ± 0.040.51 ± 0.030.36 ± 0.040.43 ± 0.020.48 ± 0.030.58 ± 0.020.48 ± 0.030.55 ± 0.010.54 ± 0.020.60 ± 0.02
Pb
(mg·kg−1)
N.D.2.61 ± 0.162.32 ± 0.17N.D.N.D.1.74 ± 0.24N.D.N.D.1.51 ± 0.271.53 ± 0.162.50 ± 0.373.01 ± 0.182.30 ± 0.29
Cr6+
(mg·kg−1)
N.D.N.D.N.D.N.D.N.D.N.D.N.D.N.D.N.D.N.D.N.D.N.D.N.D.
Hg
(mg·kg−1)
N.D.N.D.N.D.N.D.N.D.N.D.N.D.N.D.N.D.N.D.N.D.N.D.N.D.
Table 3. Proximate and ultimate analyses before and after demineralization.
SampleProximate Analysis (wt.%)Ultimate Analysis (wt.%)Ratios
MoistureVolatile MatterAshFixed CarbonCHNOSFC/VMFC + VMC/NH/CO/C
Raw9.91
± 0.06
70.19
± 0.15
8.78
± 0.22
11.13
± 0.03
43.10
± 0.22
6.91
± 0.43
3.14
± 0.11
38.45
± 0.09
0.62
± 0.06
0.1681.3213.730.160.89
270 °C 20 min Before3.51
± 0.06
69.89
± 0.12
12.52
± 0.38
14.08
± 0.24
50.31
± 0.00
6.45
± 0.06
4.84
± 0.89
28.44
± 0.29
0.69
± 0.05
0.2083.9710.390.130.57
270 °C 20 min After1.53
± 0.02
74.01
± 0.27
9.39
± 0.39
15.07
± 0.28
53.06
± 0.28
6.65
± 0.26
4.34
± 0.19
26.94
± 0.02
0.69
± 0.01
0.2089.0812.230.130.51
450 °C 20 min Before3.30
± 0.08
45.48
± 0.51
25.81
± 0.14
25.41
± 0.25
55.98
± 0.12
4.71
± 0.07
4.22
± 0.18
14.42
± 0.04
0.28
± 0.39
0.5670.8913.270.080.26
450 °C 20 min After1.53
± 0.02
48.10
± 0.21
23.12
± 0.75
27.25
± 1.20
59.30
± 0.00
4.82
± 0.02
4.11
± 0.15
13.99
± 0.37
0.27
± 0.38
0.5775.3514.430.080.24
Publisher’s Note: MDPI stays neutral with regard to jurisdictional claims in published maps and institutional affiliations.

