Abstract
This article deals with options for how to express the luminous flux from outdoor electrical substations of the electric transmission system. Processing of the models of light emissions before and after refurbishment of lighting systems was motivated by setting out rules for the design and erection of refurbished lighting systems in outdoor electrical substations, which are most commonly built in inhabited rural areas with low luminance of the background. The proposed model and calculations are based on requirements of international standards and recommendations for lighting of outdoor workplaces as well as on internal regulations of the ČEPS (Czech Transmission System Operator). These requirements are implemented in real electrical substations and lighting models that are extended by the calculation space of the software goniophotometer. The software goniophotometer was used to evaluate light distribution characteristics of entire electric stations in various situations. This article assesses the impact of different lighting systems installed at electrical substations from the perspective of both direct and total luminous flux directed to the upper hemisphere. It takes into account three outdoor electrical substations (420 kV) of a transmission network and their lighting systems before and after refurbishment. The aim of this article is to determine to what extent the electrical substations contribute to emissions of luminous flux to the upper hemisphere. Results from calculations on models show reduced radiation to the upper hemisphere up to 52.3% after refurbishment of obsolete lighting systems, although total installed flux actually increased due to a change in the ratio of direct and reflected luminous flux after refurbishment of lighting systems.
1. Introduction
Electrical substations as nodes of the electric transmission network are very good examples for creating a model for distribution of light emissions in the framework of geographical locality. In the Czech Republic, there are a total of 32 outdoor electrical substations of the transmission network with a total area of 2.57 mil. m2. In the Slovak Republic, 19 substations represent a total area of 1.2 mil. m2. The average area of one electrical substation in both the Czech and Slovak Republic is then 73,906 m2 and the total area is 3.77 mil. m2. Electrical substations of the transmission system work in principle in two modes. Only luminaires of the perimeter, some of the major communications and entrances to the buildings, are running all night long. Such systems can be compared to road-lighting systems in cities and villages. All other luminaires are operated occasionally (in a control or emergency mode), and thus are comparable to lighting systems of outdoor workplaces or sport facilities. Average horizontal illuminance of all areas of such outdoor workplaces is in the range of several tens of lux. In collaboration with the Czech Transmission System Operator (ČEPS) on the design of lighting systems for electrical substations of the transmission system, it is possible to compare models of the emission of three electrical substations (TR Prosenice, TR Nošovice and TR Slavětice) within this case study. Models of the mentioned substations were created for an optimized lighting system so that these could be compared with the TR Prosenice electrical substation modelled in the stage before refurbishment.
Lighting recommendations for outdoor workplaces were established in CIE S 015/E:2005 Lighting of Outdoor Workplaces with further guidelines in CIE 129-1998 Guide for lighting exterior work areas. Lighting requirements for safety and security of outdoor workplaces are specified in ISO/CIE 8995-3:2018 Lighting of workplaces. These international standards and recommendations are implemented in national or regional standards; for example, in the European Union, the scope of the EN 12464-2 covers both safety/security and application-specific aspects. From a safety point of view, a very low risk level poses min. 5 lx of maintained illuminance, low-risk areas need at least 10 lx, medium risks require 20 lx or more and high-risk workplaces, including the investigated electric switchyards, shall be illuminated to a min. 50 lx. The uniformity must be at least 0.25 for very low risks and 0.40 otherwise. Photometric parameters required for selected workplaces in electrical substations are shown in Table 1.

Table 1.
Photometric requirements for specific power- and electricity-related outdoor workplaces [1].
We are focusing on electric substations because commissioning of these led to refusal of getting approval from the authorities due to excessive light emissions upwards. In the International Commission on Illumination, CIE, the problems of obtrusive light are in the scope of three Technical Reports: CIE 126-1997 Guidelines for minimizing sky glow, CIE 001-1980 Guidelines for minimizing urban sky glow near astronomical observatories, and the CIE 150:2017 Guide on the limitation of the effects of obtrusive light from outdoor lighting installations, Second Edition. In addition to CIE documents on obtrusive light, requirements for the mitigation of adverse effects of outdoor lighting installations are included as self-standing sections in application standards such as CIE S 015, CIE 129 and EN 12464-2. In contradiction to the presumed higher contribution of the lighting of outdoor workplaces, very little is known about particular figures of radiation emission characteristics to the upper hemisphere and there is huge gap in peer-reviewed studies focused on this kind of obtrusive light.
In road lighting, the highest lighting class for pedestrians and slow traffic P1 requires illuminance of 15 lx, and in C classes (conflict zones) the highest class C0 specifies 50 lx. In comparison to road lighting there is a considerable distinction when it comes to outdoor workplaces. First of all, light levels are significantly higher than for road lighting. Values in Table 1 indicate that for rough visual tasks such as overall inspection 50 lx is required and for more visually demanding work this can be as high as 100 or 200 lx. To compare these figures with road lighting, lighting classes for pedestrians range from 2 lx (class P6) to 15 lx (class P1) and the highest class for conflict areas (class C1) recommends an illumination level of 50 lx. Required illuminance for outdoor workplaces is of course that for common illuminance in indoor workplaces for comparable work tasks, but outdoors this is applied in large areas and leads to a huge amount of the needed luminous flux to satisfy the required luminous parameters. Moreover, having no walls and ceilings outdoors, there is no indirect component helping to satisfy the needs and no physical barrier to hinder the light from reaching the adjacent surroundings. In this respect the illuminance levels and the necessary luminous flux associated with these levels and the illuminated areas must be treated as very high. High light levels in combination with illumination of large areas result in a number of adverse effects and light pollution is just one of the aspects. More light means increased energy consumption, which is chained with climate changes and remarkable carbon footprints from a long-term perspective [2]. It is crucial to design the illumination of outdoor workplaces aiming for the maximum possible efficiency, localizing the lighting to the task area where it is needed and tailoring the operation time only to periods when the particular task is carried out.
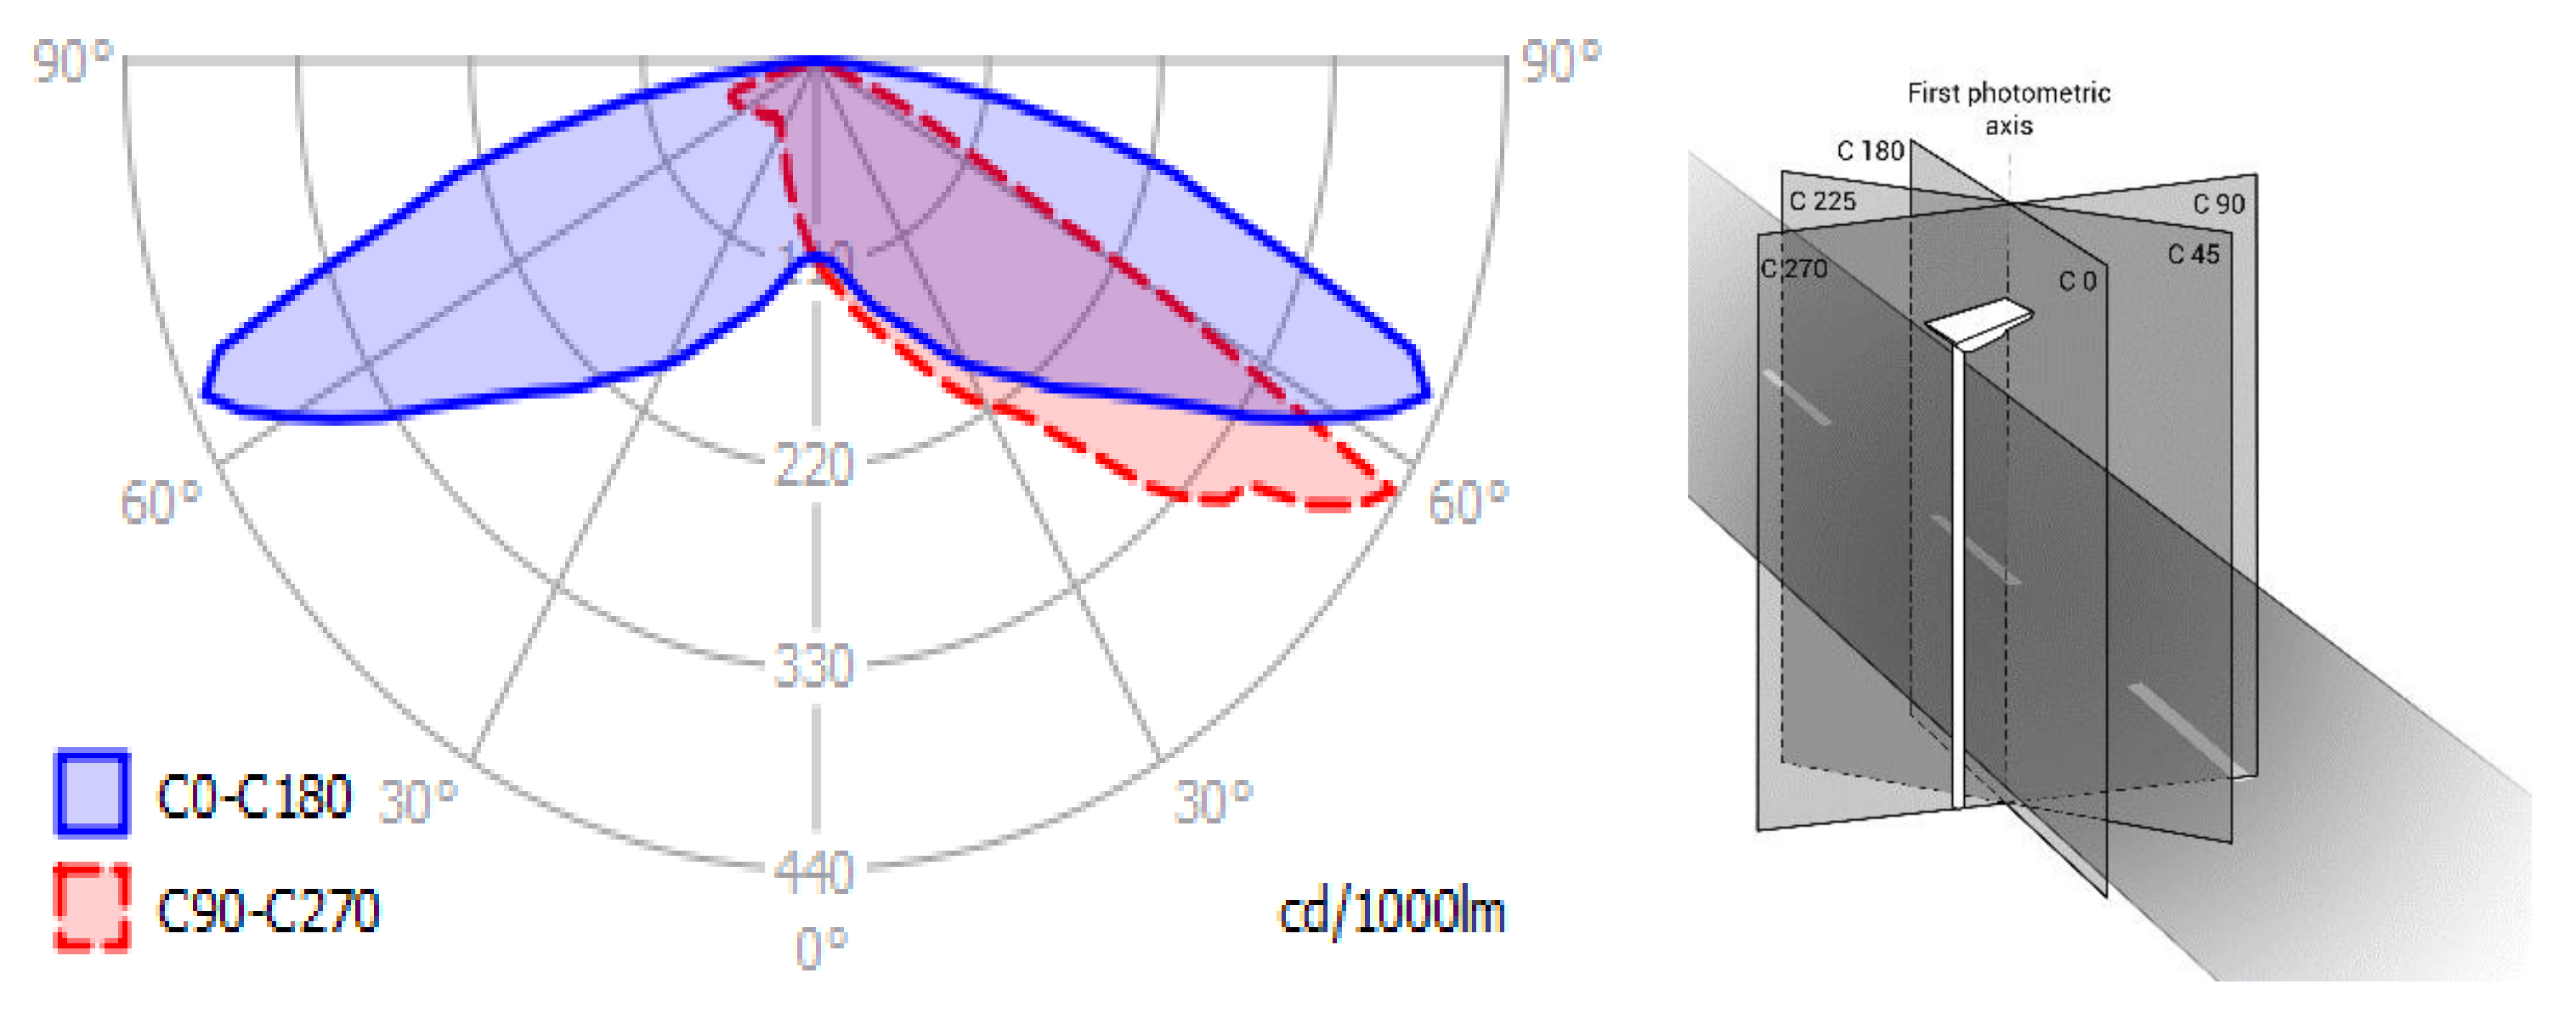
Luminaires for illumination of outdoor workplaces and for public lighting in residential areas have typical luminous intensity distribution curves (LIDC) in e.g., C-planes where the direction is described by the pair of angles (C, γ) [3] and orientation of selected C-planes, and an example of LIDC curves of a road-lighting luminaire in two principal C-planes is depicted in Figure 1.
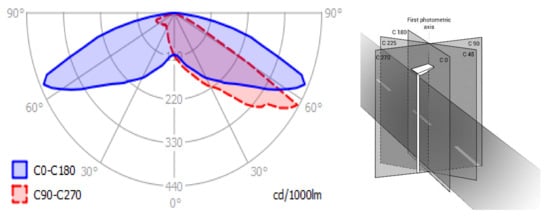
Figure 1.
Orientation of selected C-planes for an outdoor lighting luminaire.
The paper is based on the results of previous investigation of large light-source models [4,5] and from the setting of lighting calculations that are used to evaluate the radiation of large lighting systems in the upper hemisphere [6]. Outcomes of this article are intended to demonstrate the change in luminous flux before and after refurbishment of lighting systems and comparison of radiation in the upper hemisphere between similar large sources. Knowledge of these changes can help to assess the behaviour of emissions of outdoor workplaces and potential for the mitigation of these emissions in both time and space.
2. Description of the Illumination of Electrical Substations
Illumination of electrical substations of the transmission system is respecting requirements of the standard EN 12464-2—Light and Lighting—Lighting of workplaces—Part 2: Outdoor workplaces. More detailed requirements are specified in the in-house standard ČEPS TN/59—Outdoor lighting in electrical substations of the transmission system. Because the investigated substations are located in Czech Republic, all relevant national standards were also taken into account where applicable.
2.1. Surveillance Lighting
This lighting installation should work all night long like the classical road lighting installation does. Annual operation time can be thus estimated to ca. 4100 h. For optimization of the operation time, it is suitable to associate this lighting system with requirements of the surveillance security cameras so that during dusk and dawn any situations when the surveillance system is unable to provide necessary information from security cameras [7,8] are fully avoided.
For the purpose of surveillance lighting, common road lighting luminaires are normally used. Luminous flux distribution of these luminaires (primarily constructed for road lighting) can perform well in the area of corridors covered by security cameras and safeguard sufficient camera component of illumination needed for quality imaging of the security cameras, and at the same time satisfy requirements for the horizontal component in order to warn potential intruders that the area is under permanent monitoring. The luminaires are equipped with flat glass and are not tilted. Flat glass is recommended in order to minimize the luminance observed by the security cameras and also to limit the emission of direct luminous flux into the upper hemisphere. In the role of light sources, the LED lamps are used, having correlated colour temperature (CCT) of ca. 3000 K (warm white colour of light) and colour rendering index better than 70 due to sensitivity of the security cameras to higher wavelengths [9].
2.2. Road Lighting
The road-lighting installation is designed to ensure safe drive-through for inspection workers. For this lighting system, operation time is only a few tens of hours per year and is assumed when it comes to situations of common monitoring, inspection, maintenance and servicing of equipment of the electrical substation. For this purpose, again ordinary road lighting luminaires can be used. Circular internal roads in electrical substations do not have properties of roads. On the other hand, such properties within workspaces have specific sections of roads near transformers, buildings of secondary equipment and the central building, and roads along switchers where values of maintained illuminance level Ēm ≥ 5 lx for pedestrians and Ēm ≥ 10 lx for slowly moving vehicles is stated according to standard EN 12464-2 (see Table 1) are required [1]. The European Standard EN 13201 and document CIE 115:2010 are not implemented at electrical substations.
2.3. Distribution Fields (Operational Lighting)
The lighting installation for illumination of distribution fields is designed to safeguard safe inspection of devices in fields of the distribution substation. For illumination of distribution fields, luminaires with asymmetrical light distribution curves are used. Such luminaires can uniformly illuminate large areas without glaring from high mounting heights because it is not necessary to tilt the luminaires. Flat glass is needed in order to limit the emission of direct luminous flux into the upper hemisphere. For illumination of outdoor workplaces in electrical substations, values of maintained illuminance level Ēm ≥ 50 lx for overall inspection visual task according to EN 12464-2 (see Table 1) are required.
2.4. Transformers, Shunt Reactors and Terciars Lighting Systems
The lighting installation for illumination of transformers (shunt reactors, terciars) is designed to safeguard safe inspection of devices placed on transformers and read the key indicators by the camera system. For illumination of transformers, luminaires with asymmetrical light distribution curves are used. Such luminaires can uniformly illuminate both vertical and horizontal areas without glaring from high mounting heights (fireproof walls) because it is not necessary to tilt the luminaires. It is necessary to illuminate all surfaces of the transformers (shunt reactors, terciars), in particular their upper parts including bushings of power transformers. For safety reasons, it is indispensable to obey requirements for horizontal and vertical maintained illuminance Ēm ≥ 50 lx (see Table 1).
2.5. Lighting Systems of Buildings and Drive-Ins
The lighting installation for illumination of buildings and drive-ins is designed to safeguard safe inspection of drive-ins and entrances of buildings by means of a camera system. For this lighting system, operation time of only a few tens of hours per year is assumed when it comes to situations of common monitoring, inspection, maintenance and servicing of equipment of the electrical substation. For illumination of vertical surfaces, in particular, luminaires with asymmetrical light distribution curves are used. In surroundings of the luminaire observed by cameras, such luminaires can ensure sufficient horizontal as well as camera component of lighting for quality imaging of the security cameras. Flat glass is recommended in order to minimize the luminance observed by the security cameras and also to limit the emission of direct luminous flux into the upper hemisphere. Illumination of buildings and drive-ins is part of the surveillance lighting.
3. Materials and Methods
Methodology and basic principles of the proposed model on selected case studies of electrical substations are described in the following two sections to clarify what approach was used to achieve results for reducing obtrusive light and reduction of power consumption of refurbished lighting systems while respecting normative documents with appropriate visual conditions for employers of electrical substations.
3.1. Methods
The shape of the LIDC for different luminaires depends on particular lighting application and the target exterior area to be lit [1] comprising the task area and other associated areas that should be illuminated according to the relevant lighting standards. From the spatial distribution of the luminous intensity, it is possible to calculate the total luminous flux of a luminaire using the Formula (1).
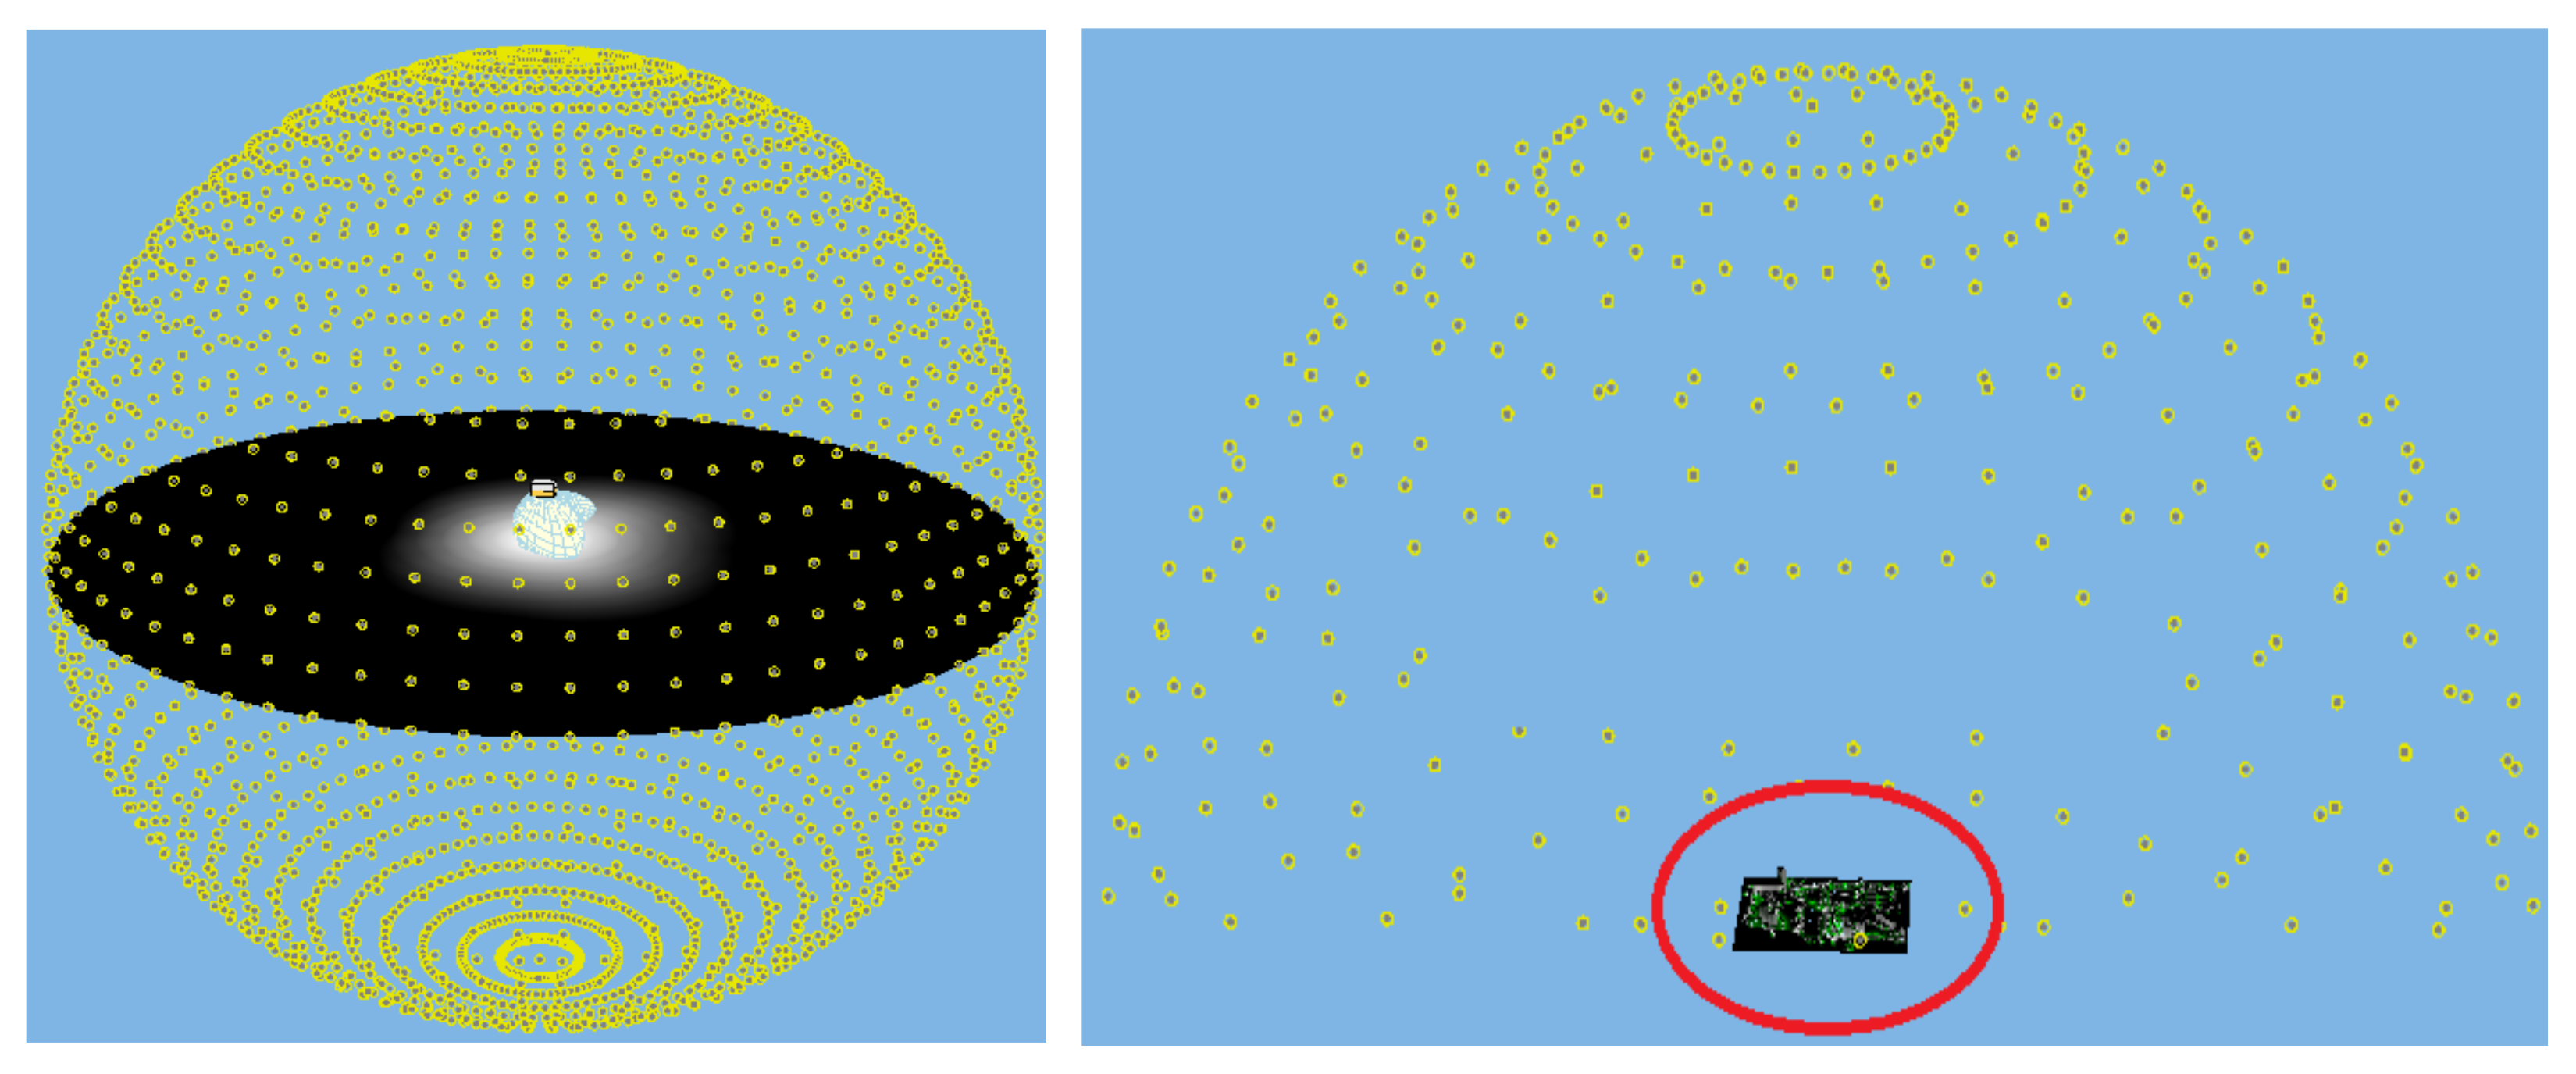
In practice, the total luminous flux is measured by means of goniophotometers that differ in construction and measurement principle. The far-field goniophotometer is one of the common types based on longer photometric distance with which the inverse square law for a point source can be applied to calculation of luminous intensity in a given direction [9,10]. The measured data are then stored in photometric exchange file formats (e.g., CEN, LDT, IEC, CIE etc.) for given angular intervals of the pair of angles (C, γ) [6]. For the purpose of this article, the total luminous flux emitted by an outdoor lighting installation is calculated using a software goniophotometer created in the WILS lighting calculation software. Furthermore, this software goniophotometer was validated by means of goniophotometry with known LIDC of real luminaire [11]. Graphically, it is presented in Figure 2, which respects theoretical principles of the goniophotometry of luminaires, where from sufficient distance the outdoor lighting installation with areas of specified reflectance can be deemed as a point light source placed in a photometric center and by which it is possible to compose a LDT exchange file format, similarly as for luminaires including both the direct and reflected component of a light directed in the upper hemisphere which represents a basement for determination of quantitative parameters of obtrusive light of a sky [12,13] in vicinity of illuminated outdoor workplaces or public lighting in residential areas. Thus, the normal illuminance EN which is determined in each calculation point of a software goniophotometer can be expressed by Formula (2),
where l is the distance between the modelled object and the grid of calculation points. The software goniophotometer then by calculation transforms the normal illuminance in individual calculation points into the luminous intensity Iγ coming out from the middle of the model (point source). Usual lighting calculation software, which can work with measured LIDC in the form of photometric files of real luminaires, can work only with Lambertian surfaces. In real surroundings the mirror reflection is negligible and all surfaces are very close to the Lambertian surface.
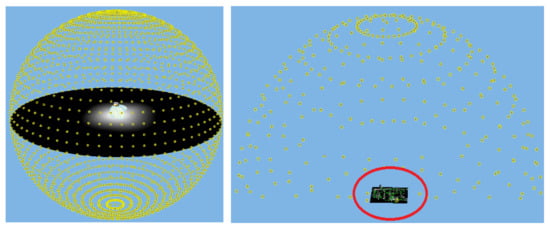
Figure 2.
The grid of calculation points of a software goniophotometer for calculation of emission characteristics of outdoor lighting systems [4,11].
3.2. Modelling of Emission Characterestics of Case Studies
Calculation of individual luminous intensities in given directions (calculation points of the software goniophotometer are depicted in Figure 2 by yellow colour dots) is used for composition of the luminous intensity distribution curves, not only of primary light sources (luminaires) but also for generation of emission characteristics of large entities (e.g., lighting systems of electrical substations). In result there is the emission characteristic with the calculated efficiency related to the total luminous flux of a lighting systems either only for the direct component or for combination of the direct and the reflected component of the luminous flux. Comparison was made from the viewpoint of verifying the shape of the luminous intensity curve and from the viewpoint of the total luminous flux that is generated in the space from the obtained LDT data [11].
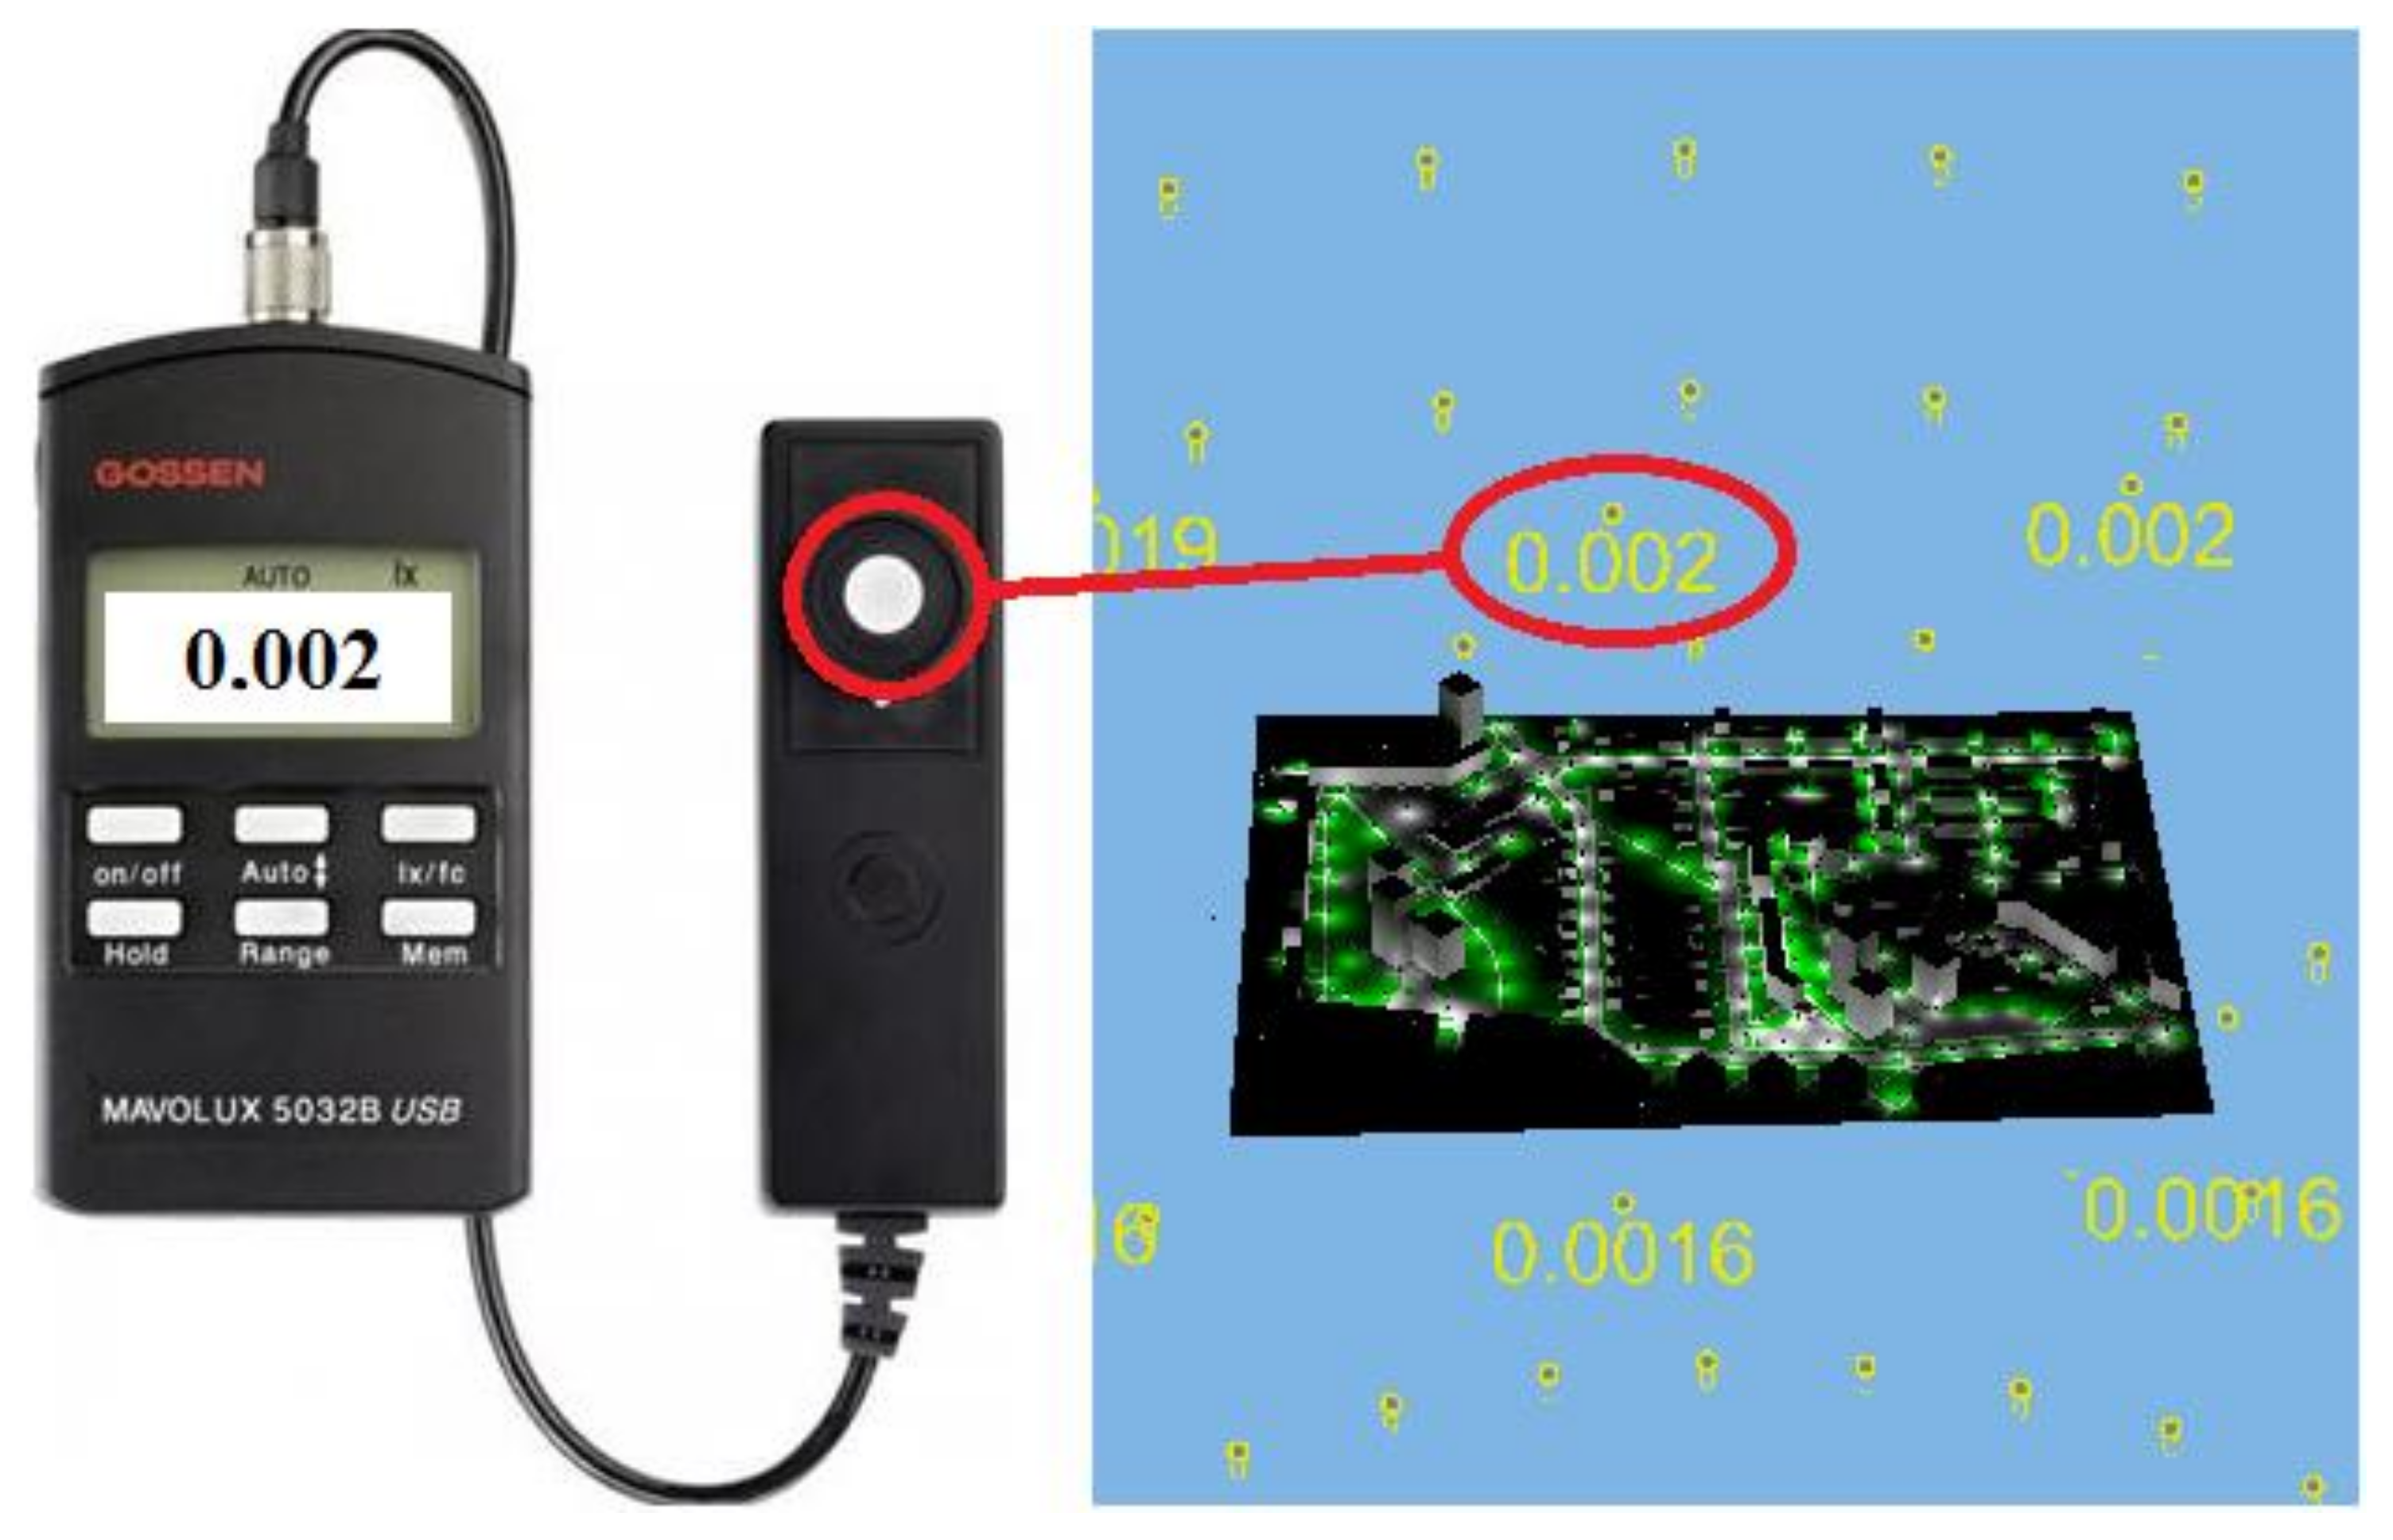
Object in the red circle (see Figure 2) is an enclosed area representing the light source which can be, e.g., an urban quarter, neighbourhood, industrial yard or other large area under investigation. For modelling purposes, the area is supposed to be a point source with a given spatial luminous flux distribution. Detail of area in the red circle is depicted in Figure 3. The direct component is that part of luminous flux which is directly emitted from luminaires and spreads out in the upper hemisphere. The reflected component is part of the luminaire’s flux which hits the target area of illumination as well as any other surrounding areas where it is partly reflected upwards, thus also spreading in the upper hemisphere. The calculation grid displayed normal illuminance in direction to the middle of sphere and represents virtual luxmeter sensors [11], depicted in Figure 3.
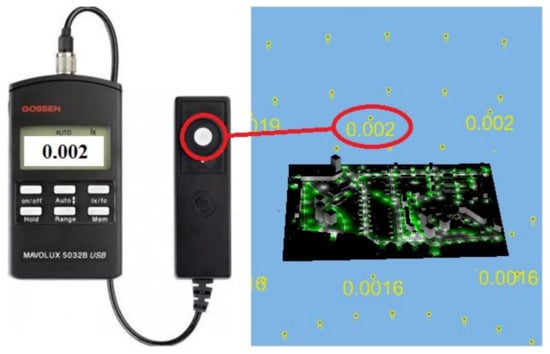
Figure 3.
Calculation grid showing normal illuminance of the software goniophotometer [11].
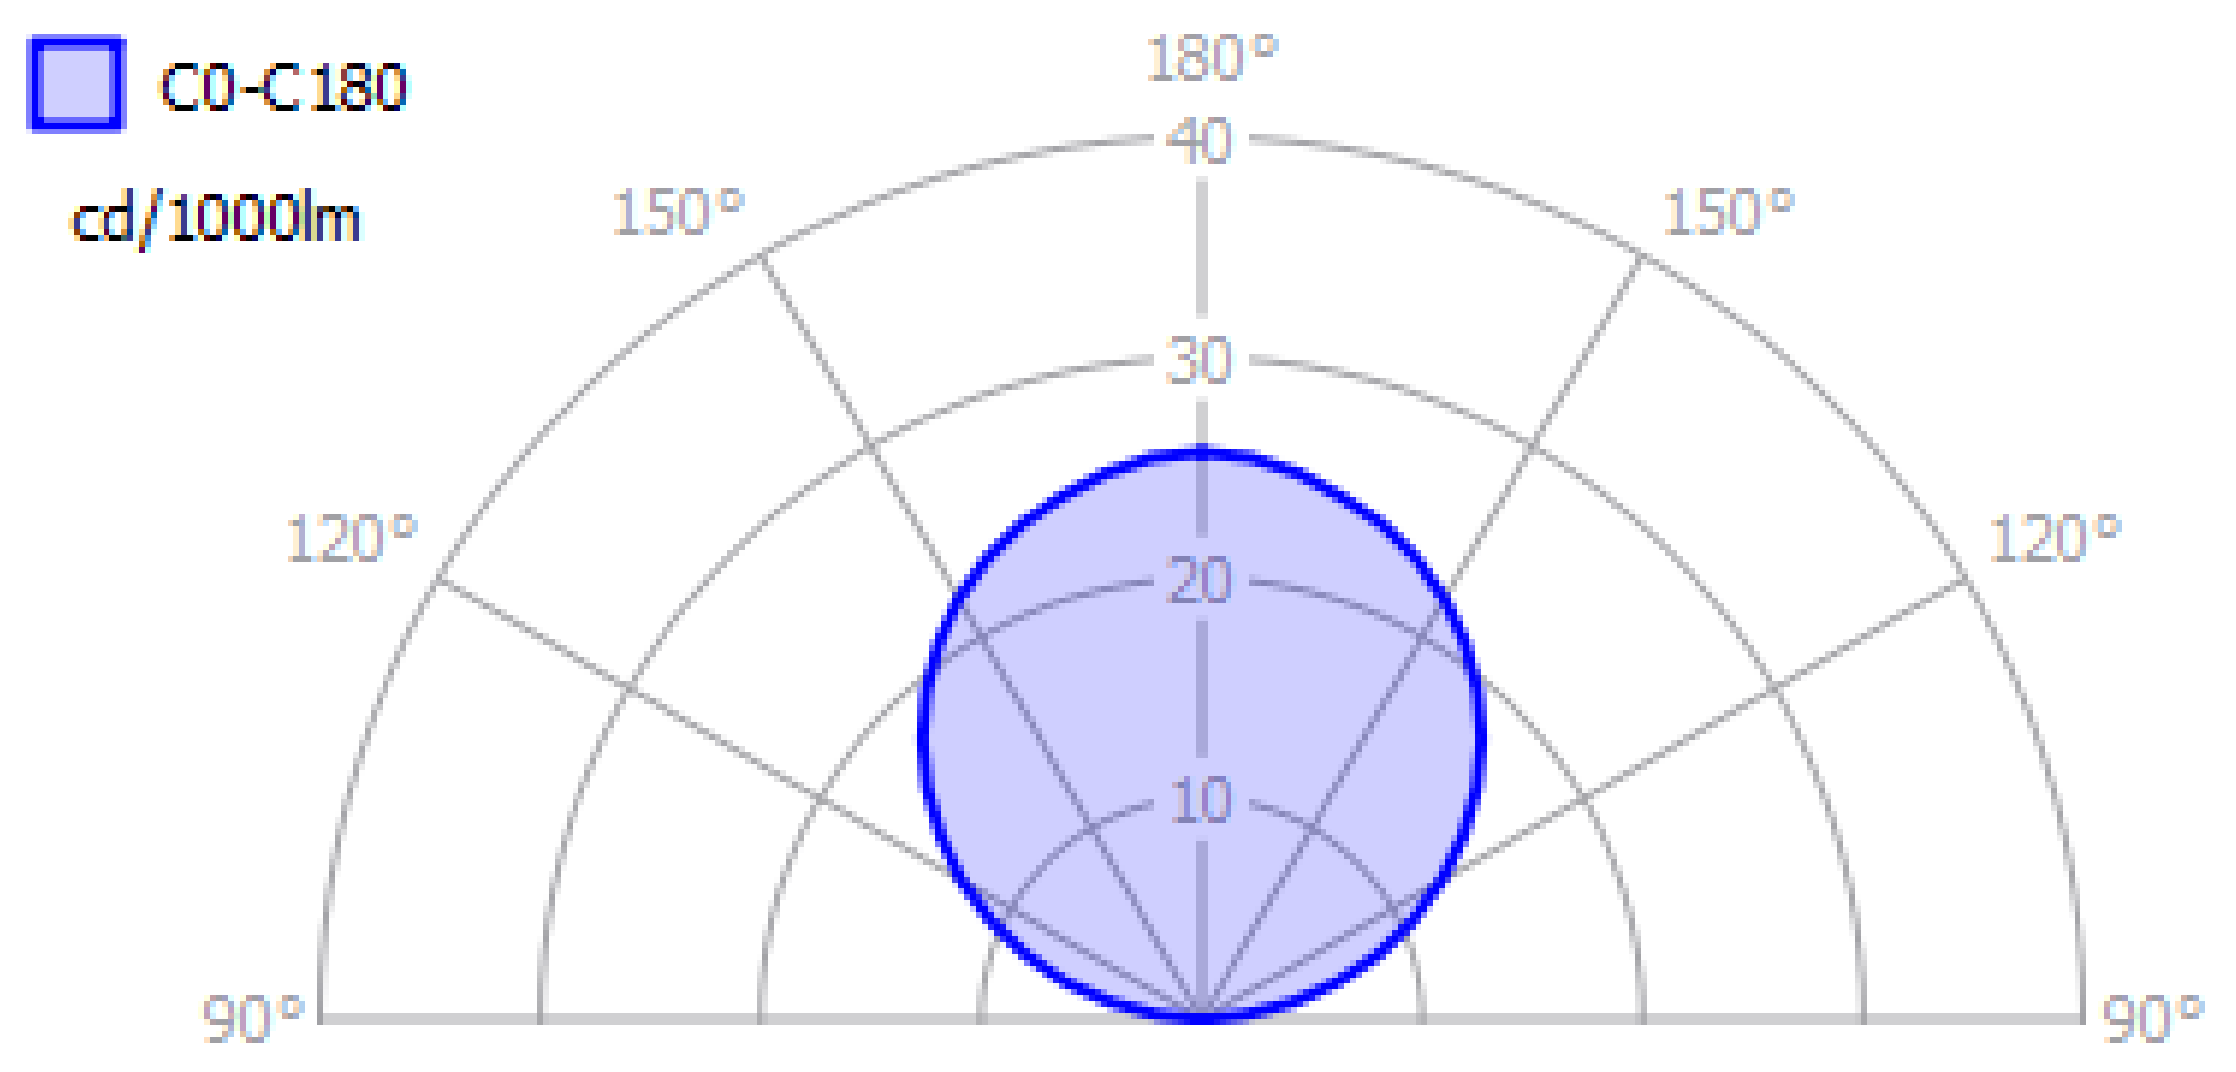
Common surfaces that can be found in outdoor workplaces have usually diffuse (matt) finishing with a certain reflectance [11]. As secondary sources of light these surfaces can be described by the Lambertian luminous intensity distribution curve as depicted in Figure 4. Then, assumed LIDCs of reflected parts of light from the ground are rotational symmetric according to axis of normal luminous intensity directions.
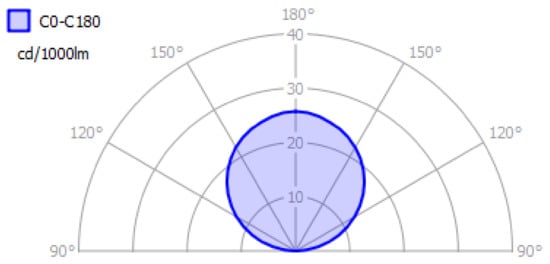
Figure 4.
Spatial distribution of the reflected component from outdoor lighting installations.
These spatial characteristics recorded in form of photometric exchange file formats represent light emissions from outdoor lighting installations. These files serve as input data for calculation of obtrusive light parameters such as the total luminous flux to the upper hemisphere by means of lighting calculation software. The upward luminous flux can be used, e.g., for comparison of lighting systems before and after refurbishment. Obtrusive light represents a total luminous flux that spreads to the upper hemisphere and therefore increases sky glow. It is formed by direct and indirect (reflected) luminous flux from the terrain and particular objects. The most important thing is the evaluation of the luminous flux that is distributed directly to the upper hemisphere by non-dimensional parameter ULR, defined by equation [14]:
where:
- ULR—proportional direct luminous flux radiated to the upper hemisphere
- ULOR—luminous flux radiated directly from the luminaire to the upper hemisphere
- DLOR—luminous flux reflected from the surfaces of the surrounding objects
- ULOR + DLOR—total luminous flux radiated to the upper hemisphere.
Results of the modelling of spatial emission characteristics by means of the software goniophotometer can be used also for the design of outdoor lighting installations as a practical tool for lighting designers instead of application of more expensive and time-consuming measuring systems for determination of the extent of sky glow [15,16]. Modelling of the luminous flux emissions is based on an application of the software goniophotometer [11,14] into a standard lighting calculation software in which it is possible to work and calculate with real luminous intensity curves of discrete luminaires, where it is also possible to insert any arbitrary distribution curves (windows, car headlights) [4,6] and which enables calculation of the reflected component based on behaviour of a Lambertian surfaces. This kind of modelling has been proved [11] on implementation of known luminous intensity curves into a lighting software and consequent evaluation after calculation by the software goniophotometer. The software goniophotometer enables insertion of a grid of calculation points as a sphere where calculation points represent normal illuminance aiming into the centre of the sphere. Thus, the designed system is emulating the function of a real goniophotometer. Hence, the software goniophotometer fulfills the same function, and the only difference is that instead of virtual insertion of a luminaire described by its calculation data it is possible to insert directly entire models such as part of a city or an electrical substation assuming true dimensions and the given calculation data. The software goniophotometer also enables to choosing any density of calculation points in angular steps according to the normally used C, γ-planes for measurement of luminaires. Density of calculation points has, of course, significant influence on the computing time and accuracy of the results.
Due to the fact that calculation of obtrusive light is not yet standardized and assessment of lighting designs from this point of view is not yet unified, it is necessary to look at this calculation from a different vantage point. In addition, the boundary conditions for modelling of obtrusive light must respect these specific aspects.
- The most important boundary condition is setting of the total maintenance factor to 1. It means carrying out calculations for lighting systems in the condition when they are new because new installations have the highest light emissions [17] and thus also the upward component of these emissions;
- The second boundary condition is based on consensus for reflectance of surfaces so that these are as close as possible to their true reflectance and at the same time these are mutually comparable within evaluation of the impact of individual lighting installations [4,6]. In a flat area what corresponds to the case of electrical substation it is to take only a few reflections into account because other interreflections between buildings and luminaires are negligible. In the town areas or residential zones, it is necessary to assume for calculation higher orders of reflections, but it is a time-consuming calculation for usual computers used in the practice of lighting designers;
- The third boundary condition is that the modelled object must behave like a point source. This means that the object has neglectable dimensions with respect to the grid of calculation points of the software goniophotometer used for the calculation. This ratio is usually more than 5 and such light source (model of a lighting installation) can be then deemed as a point source [11].
3.3. Example of Background on the Model before Refurbishment of Outdoor Lighting System in the Electrical Substation
Processing of the results of light emissions in the upper hemisphere before refurbishment of the electrical substation was divided into two principal operation modes so that these modes could be compared with the situation after refurbishment and with other lighting installations. Light-emission characteristics of the model for both principal operational modes of the electrical substations are presented in Section 5. Besides the characteristics themselves (direct and total emission), the luminous flux of the lighting systems is figured out as well.
The calculated light emission of the direct luminous flux from the surveillance lighting corresponds to the light emission characteristics of the used luminaires equipped with high-pressure sodium lamps and with a convex cover of the optical chamber with a luminous intensity distribution curve suitable for road lighting. A major part of light emissions to the upper hemisphere is, however, formed by the reflected component of the surveillance lighting system, which is in good correlation with the resulting emission characteristics shape, which is close to the cosine function.
On the other hand, the electrical substation with fully operated lighting systems has a completely reversed behaviour. From the calculated luminous intensity distribution, it follows that the direct component of luminous flux to the upper hemisphere is clearly dominant. This is caused by usage of symmetrical-beam and yet tilted luminaires illuminating distribution fields and the transformers. While assessing the emission characteristics of both direct and reflected components of the luminous flux to the upper hemisphere it is evident that the reflected component (the cosine shape of part of the emission characteristics) is proportionally and significantly lower than, e.g., the sole surveillance lighting.
3.4. Example of Background on the Model after Refurbishment of Outdoor Lighting System in the Electrical Substation
For processing of the results of upward light emissions, electrical substations have been divided into two essential operation modes the same as before refurbishment. In the first step the light emission of the electrical substation in the mode of surveillance lighting (all night operation) was evaluated. It means that the lighting is provided predominantly around the station’s perimeter, along major communications and drive-ins to the buildings. To fulfill safety requirements, these lighting installations are operated all night long, i.e., 4100 h annually. Such lighting systems, the parameters of which (luminaire types, mounting heights, spacings, illuminance on the target area) are similar to road-lighting installations and can be compared with light emissions from classical road-lighting systems, in particular in sparsely inhabited areas (low number of shading elements). The second part of the analysis is again taking into account the whole electrical substation in full lighting mode for potential failure in the substation. It means that all lighting installations of the electrical substation are on. Operation time of this mode is at most only a few tens of hours per year. In this operation mode the substation is comparable with other outdoor workplaces (storage areas, sewing yards, transhipments etc.) and eventually with less-occupied shopping centres.
Light emission characteristics of the model for both principal operational modes of the electrical substations are presented in Section 5. Besides the characteristics themselves (direct and total emission), the luminous flux of lighting systems is figured out as well. Shape and magnitude of luminous intensities of the calculated emission characteristics for the model of the electrical substation correspond to the assumptions. The calculated luminous intensity distribution curve for the direct component is zero thanks to light distribution characteristics and no tilt of luminaires. Hereby it is necessary to emphasize that the light distribution and zero tilt of luminaires belonged to key requirements laid on the design and erection of refurbished lighting systems so that no direct component of the luminous flux is emitted in the upper hemisphere. Hence, the calculated luminous intensity distribution curves correspond solely to the reflected component of the flux and their shape even approaches the cosine function. Deviations from the cosine function are caused by vertical obstructions in the model (buildings, fireproof walls, transformers) that lead to deformation of the cosine curve.
4. Case Study on Particular Outdoor Lighting of the Electrical Substations of the Transmission Network (420 kV)
The first part of this section is describing outdoor lighting system of the electrical substation TR Prosenice and boundary conditions that are necessary for calculations needed to estimate emission of radiation in the upper hemisphere. This part of the section treats examples of modelled lighting systems in TR Prosenice before and after refurbishment and shows basic information about installed power, radiated luminous flux and average initial illuminance overall area of electrical substation. The second part of this section describes new outdoor lighting systems of electrical susbtations TR Slavětice and TR Nošovice after refurbishment.
4.1. Description of Outdoor Lighting Systems TR Prosenice
In the framework of lighting refurbishment, the electrical substation TR Prosenice was classified to the environmental zone E2 (represents low district brightness areas, such as industrial or residential rural areas) according to EN 12464-2. It means that for this installation a maximum 5% of the luminous flux from all luminaires of the installation is allowed to be directed upwards. A model of light emission in the upper hemisphere for the electrical substation TR Prosenice was constructed in variants as for the electrical substations TR Nošovice and TR Slavětice.
4.1.1. Surveillance Lighting
Surveillance lighting is installed along the whole outer fencing including entrances to buildings of secondary equipment, the central building, drive-ins and along the operational fencing. The surveillance lighting is safeguarding correct sensing of the cameras that monitor the surveillance perimeter, and this is common for the entire electrical substation. The surveillance lighting is in operation all night long regardless of any lighting control [18]. Before refurbishment of the electrical substation TR Prosenice, common road-lighting luminaires with high-pressure sodium lamps 70 W, system power 81 W and luminous flux 3.77 klm were used for surveillance lighting. In the first part of the installation, luminaires were mounted 8 m above the ground, in amount of 11 pcs. Luminous flux from the luminaires was directed from fences towards fields of the distribution substation. After extension of the substation, the surveillance lighting also was prolonged. Seventeen luminaires of the same type were installed in mounting height of 6 m. Spacing between luminaires was reduced from 47 m to 19 m and the luminaires were rotated by 180° so that their light was then directed from the fields towards the fence. The extension of the installation also comprised an additional 5 luminaires installed at a height of 8 m, used for road lighting and simultaneously as part of the surveillance lighting. In total, 28 luminaires, were directed from fencing towards the distribution fields.
Within refurbishment (reconstruction) of lighting of the electrical substation, all luminaires were replaced. The luminaires equipped with high-pressure sodium lamps were replaced by LED luminaires with input power 52 W, flat glass, CCT 3000 K, luminous flux 7.45 klm and wide beam angle for road lighting. A total of 46 luminaires were used for surveillance lighting, directed towards the fencing. At the same time the mounting height of luminaires was unified to 7 m and the spacing of luminaires was unified to 26 m. The distance between the installed luminaires and the fence of the facility equals 4 m. This distance is needed for marking out the surveillance perimeter, which is used for surveillance cameras so that these are able to detect persons attempting to intrude the locality of the electrical substation. This lighting system is turned on for the whole night after sunset, an operational time corresponding to 4100 h per year, like the usual road lighting systems.
4.1.2. Operational Lighting
Operational lighting is used for illumination of technological elements to provide good visual conditions for overall verification of the equipment and its parts. Operational lighting illuminates fields of the distribution substation and the site of the transformers and the shunt reactors.
Within refurbishment of the operational lighting, a former lighting system consisting of symmetrical-beam luminaires with input power 2280 W and luminous flux 147 klm equipped with metal halide lamps with 2000 W wattage and CCT 4200 K in the amount of 18 pcs installed at a height of 24 m and tilted to 50° was replaced by asymmetrical-beam luminaires with input power 1100 W, luminous flux 97 klm equipped with high-pressure sodium lamps with 1000 W wattage in the amount of 17 pcs installed at a height of 23 m. The installed power was significantly reduced to ca. 50% after refurbishment. The new lighting system utilizes solely asymmetrical luminaires with zero tilt angle, i.e., no luminous flux is emitted directly to the upper hemisphere. This lighting system is turned on only a few hours per year according to the need to use it during malfunctions and tests of the electric power substation.
4.1.3. Road Lighting
Road lighting is used to illuminate important internal communications such as roads and footpaths in outdoor areas of the electrical substation for safe operation, movement of persons and mechanical vehicles at reduced visibility. With respect to the importance level of internal communications, major roads are illuminated (the drive-in road from the gate to the central building and the road between the central building, buildings for secondary equipment and sites of the transformers and the shunt reactors). The former lighting installation utilized common road-lighting luminaires with high-pressure sodium lamps 70 W with system power 81 W and luminous flux 3.77 klm installed in the amount of 21 pcs at a mounting height of 6 m and identical luminaires with 150 W sodium lamps with system power 165 W and luminous flux 9.42 klm in the amount of 5 pcs at an 8 m mounting height. After refurbishment the new lighting system now consists of 64 LED luminaires with wattage of 68 W, flat glass, CCT 3000 K, luminous flux 7.17 klm and wide-beam light distribution suitable for road lighting purposes, installed at a mounting height of 6 m. The operation time of road lighting is turned on in order of tenth hours per year. It serves only for maintenance of the electric power substation systems.
4.1.4. Lighting of the Transformers and Shunt Reactors
Before refurbishment the lighting was provided only for 1 transformer and consisted of 8 symmetrical-beam luminaires with input power 440 W and luminous flux 25.6 klm, equipped with 400 W metal halide lamps. Luminaires were installed at a 9 m height and tilted to 40°. For security reasons and for the sake of sensitivity of camera systems, the new lighting covers all sites of the transformers and the shunt reactors including upper parts with bushings, as required. At areas where important equipment and displays are placed, the normal illuminance is designed to 50 lx. Here, asymmetrical LED luminaires with input power 68 W, luminous flux 7.17 klm and CCT 3000 K were installed. A total of 41 luminaires were mounted at a height of 5 m, and their tilt angle is zero. The operational time is the same as it was stated in the Section 4.1.2 for operational lighting.
4.1.5. Model of Light Emissions from the Electrical Substations (Case Studies)
This section presents boundary conditions, models and parameters of the electrical substation TR Prosenice before and after refurbishment of outdoor lighting by replacing old luminaires for LED luminaires. The total reflectance of diffuse surfaces was chosen as follows:
- reflectance of the grass vegetation—10%;
- reflectance of the communications—10%;
- reflectance of the building facades and the fireproof walls—30%;
- reflectance of the surfaces of transformers and shunt reactors—30%;
- reflectance of the walkable concrete ground surface—25%.
4.1.6. TR Prosenice before Refurbishment
- Model of the electrical substation before refurbishment is based on the project documentation from 2013;
- The electrical substation before refurbishment covered total area of 83,000 m2;
- The maintenance factor used for calculations was set to fm = 1;
- Rules for LIDC calculation are the same as for luminaires. Plane C0 is perpendicular to the longer dimension of the electrical substation;
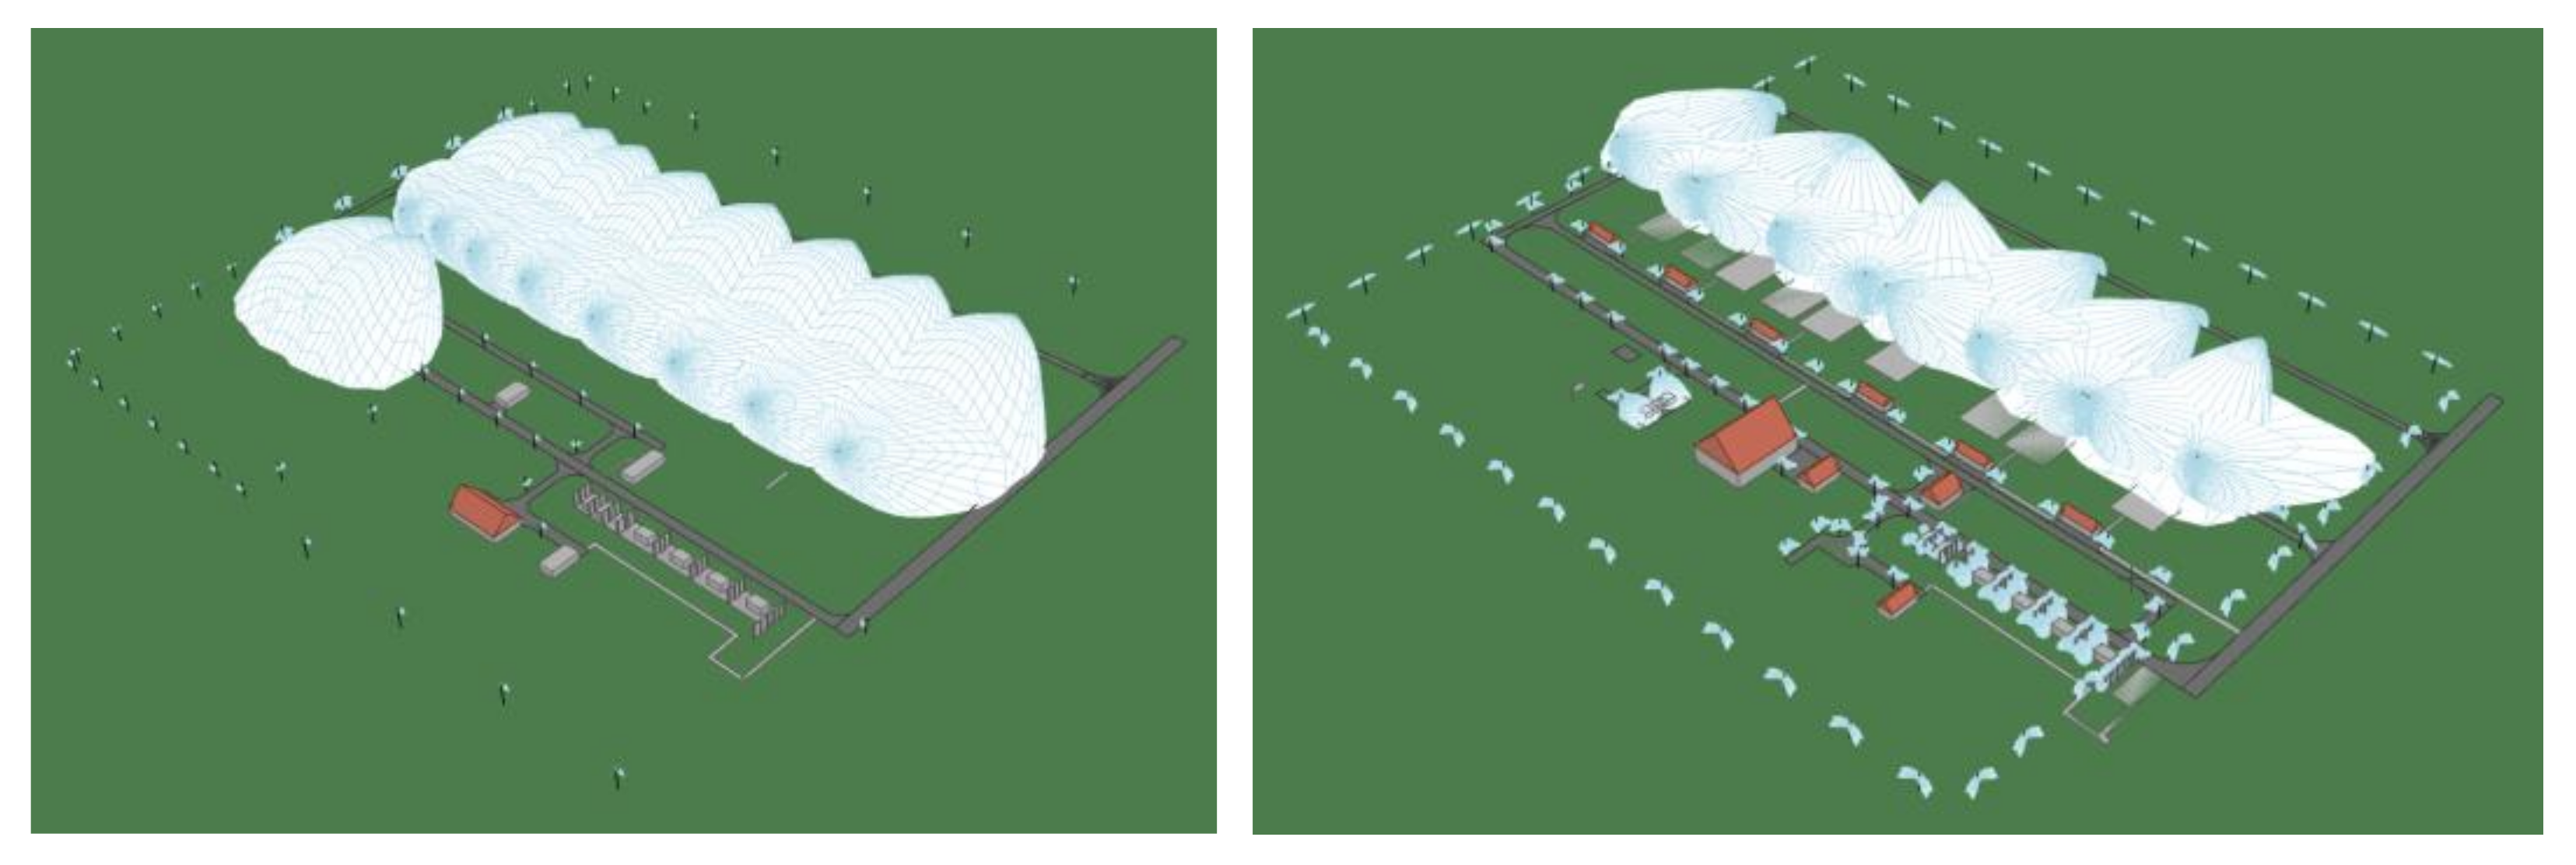
- The final 3D model of emission characteristics before refurbishment of outdoor lighting luminaires is shown in Figure 5.
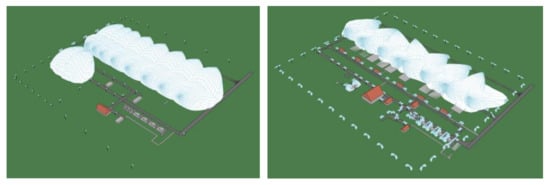 Figure 5. 3D models of light emissions from the electrical substation TR Prosenice before (left-hand side) and after (right-hand side) refurbishment.
4.1.7. TR Prosenice after Refurbishment
- Model of the electrical substation after refurbishment is based on the project documentation from 2018;
- The electrical substation after refurbishment covers a total area of 94,000 m2;
- The maintenance factor fm = 1 and reflectance of surfaces have been selected identically as for the case before refurbishment;
- The final 3D model of emission characteristics after refurbishment of outdoor lighting luminaires is shown in Figure 5.
4.1.8. Comparison of the Old and New Lighting System in TR Prosenice
For assessment of behavior of all lighting systems before and after refurbishment in TR Prosenice (see Table 2), a comparison of the total installed input power and the initial horizontal illuminance on the entire area of the electrical substation was performed.

Table 2.
Comparison of key parameters of the model of lighting installation in TR Prosenice before and after refurbishment.
4.2. Description of Outdoor Lighting Systems of the Electrical Substations TR Nošovice and TR Slavětice
To compare behavior of other electric stations of the transmission network, models of electric stations TR Nošovice and TR Slavětice have been also analyzed. These models were established on the similar principle as the model for the electrical substation TR Prosenice (maintenance factor, reflectances). Because these models were prepared for the needs of the ČEPS as a document to prove the limitation of the luminous flux emissions to the upper hemisphere, the models were been constructed only for new lighting systems and not the older systems before refurbishment. It means that in this section, only models for the new systems are presented.
4.2.1. Parameters and Emissions from the Electrical Substation TR Nošovice
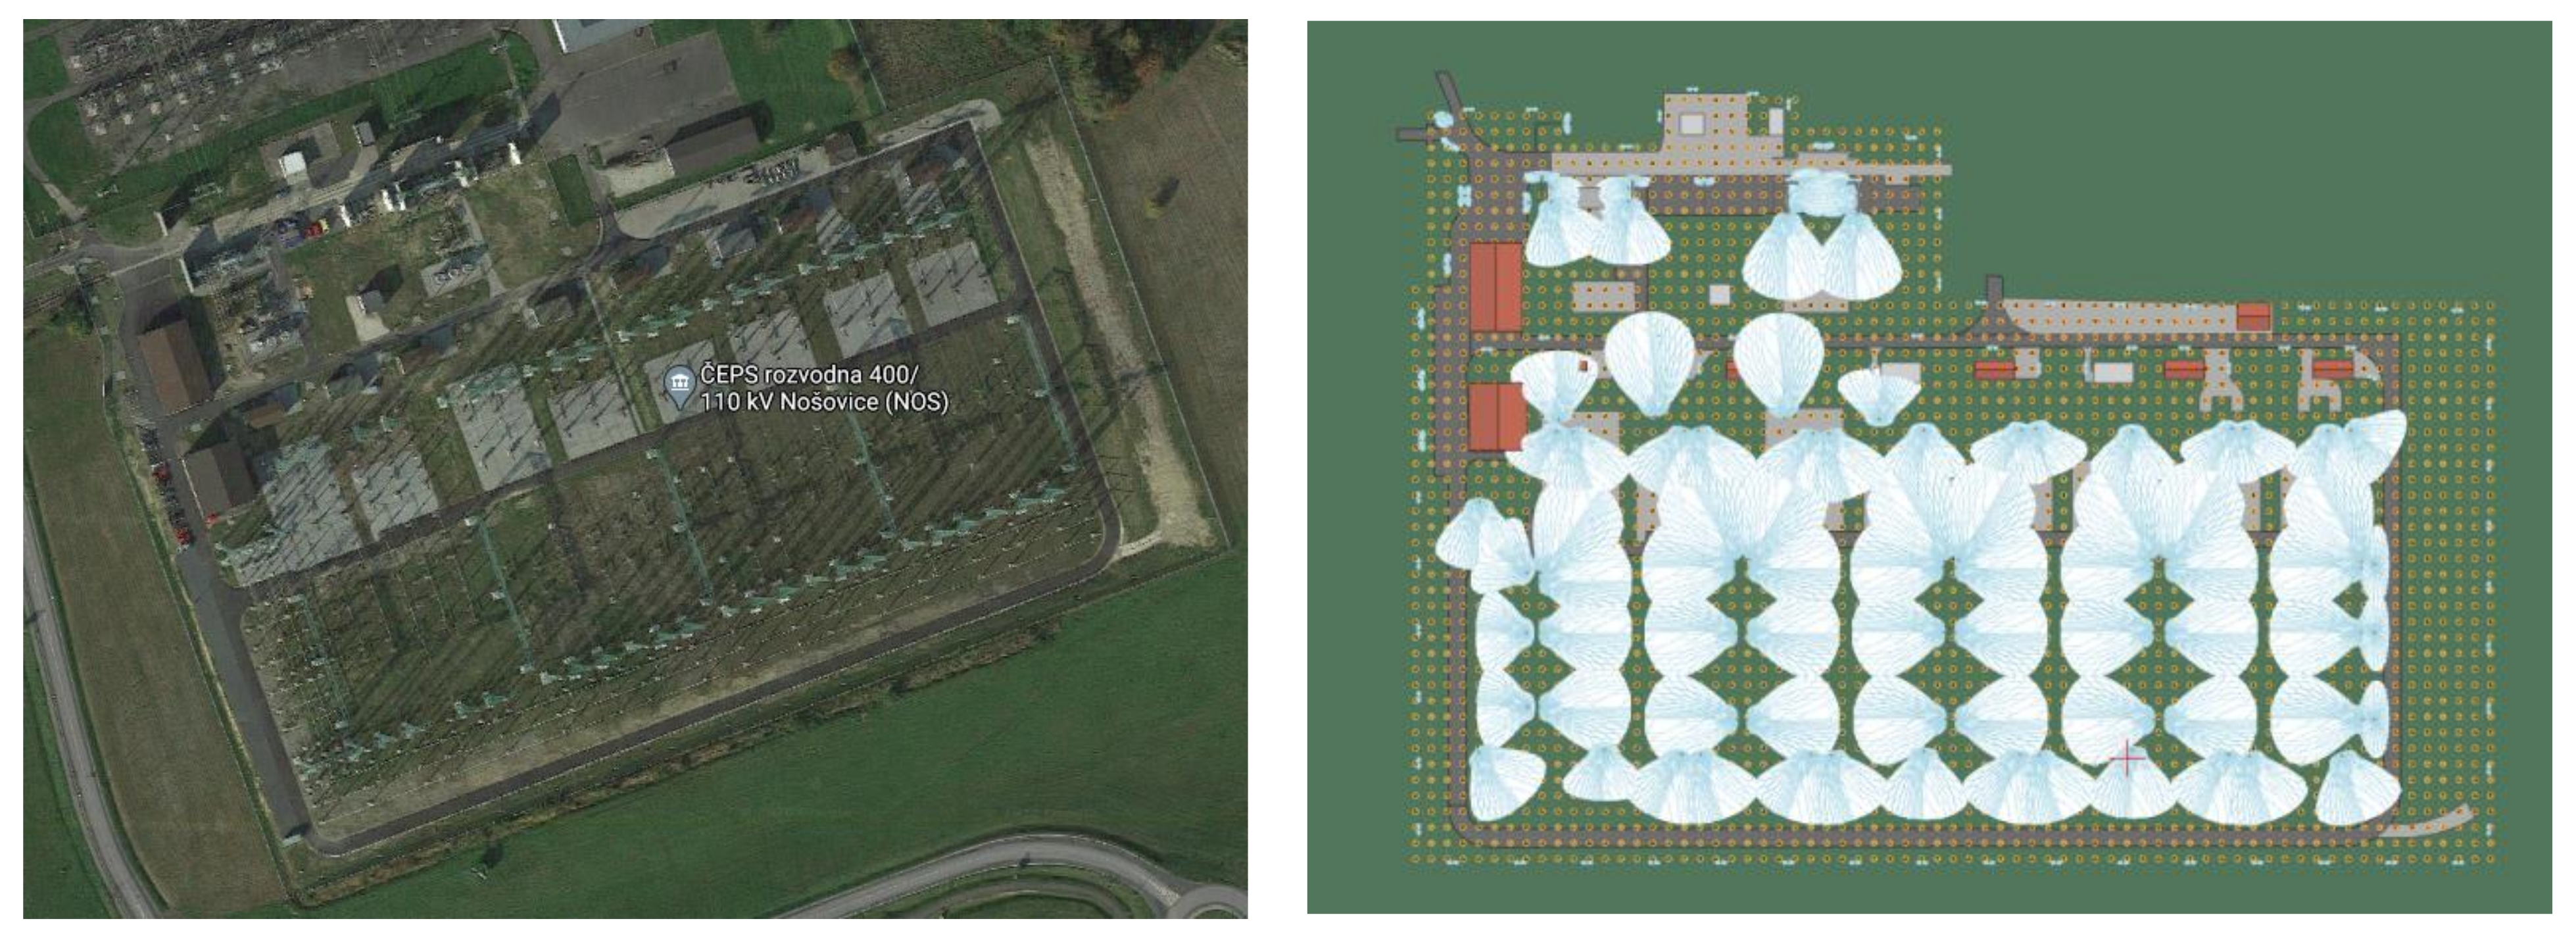
Figure 6 below shows the layout of the TR Nošovice and its lighting model based on the 172 pcs luminaires. The average horizontal illuminance of the entire area of this station with all lighting systems is calculated in Table 3 with other relevant key parameters. Lighting systems both for surveillance purposes and for road lighting are optimized for camera-system sensing requirements, utilizing LED luminaires with flat glass and emission characteristics corresponding to road lighting luminaires. Zero tilt is obvious.
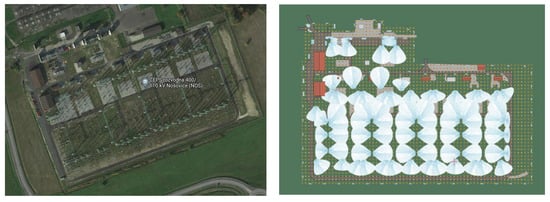
Figure 6.
Layout of the electrical substation TR Nošovice; the area for modelling is marked.

Table 3.
Key parameters of the model of new lighting installation in TR Nošovice after refurbishment.
Other lighting systems (for distribution fields, transformers) comprise luminaires with slightly asymmetric light distribution, equipped with metal halide and high-pressure sodium lamps, unavoidably tilted to the maximum value of 55°.
The model for light emissions to the upper hemisphere for the electrical substation TR Nošovice was again constructed for two variants. Only with direct component of the luminous flux and combination of direct and reflected components. Calculations for these variants have been carried out for the surveillance lighting system and for all lighting systems too.
4.2.2. Description of Parameters and Emissions from the Electrical Substation TR Slavětice
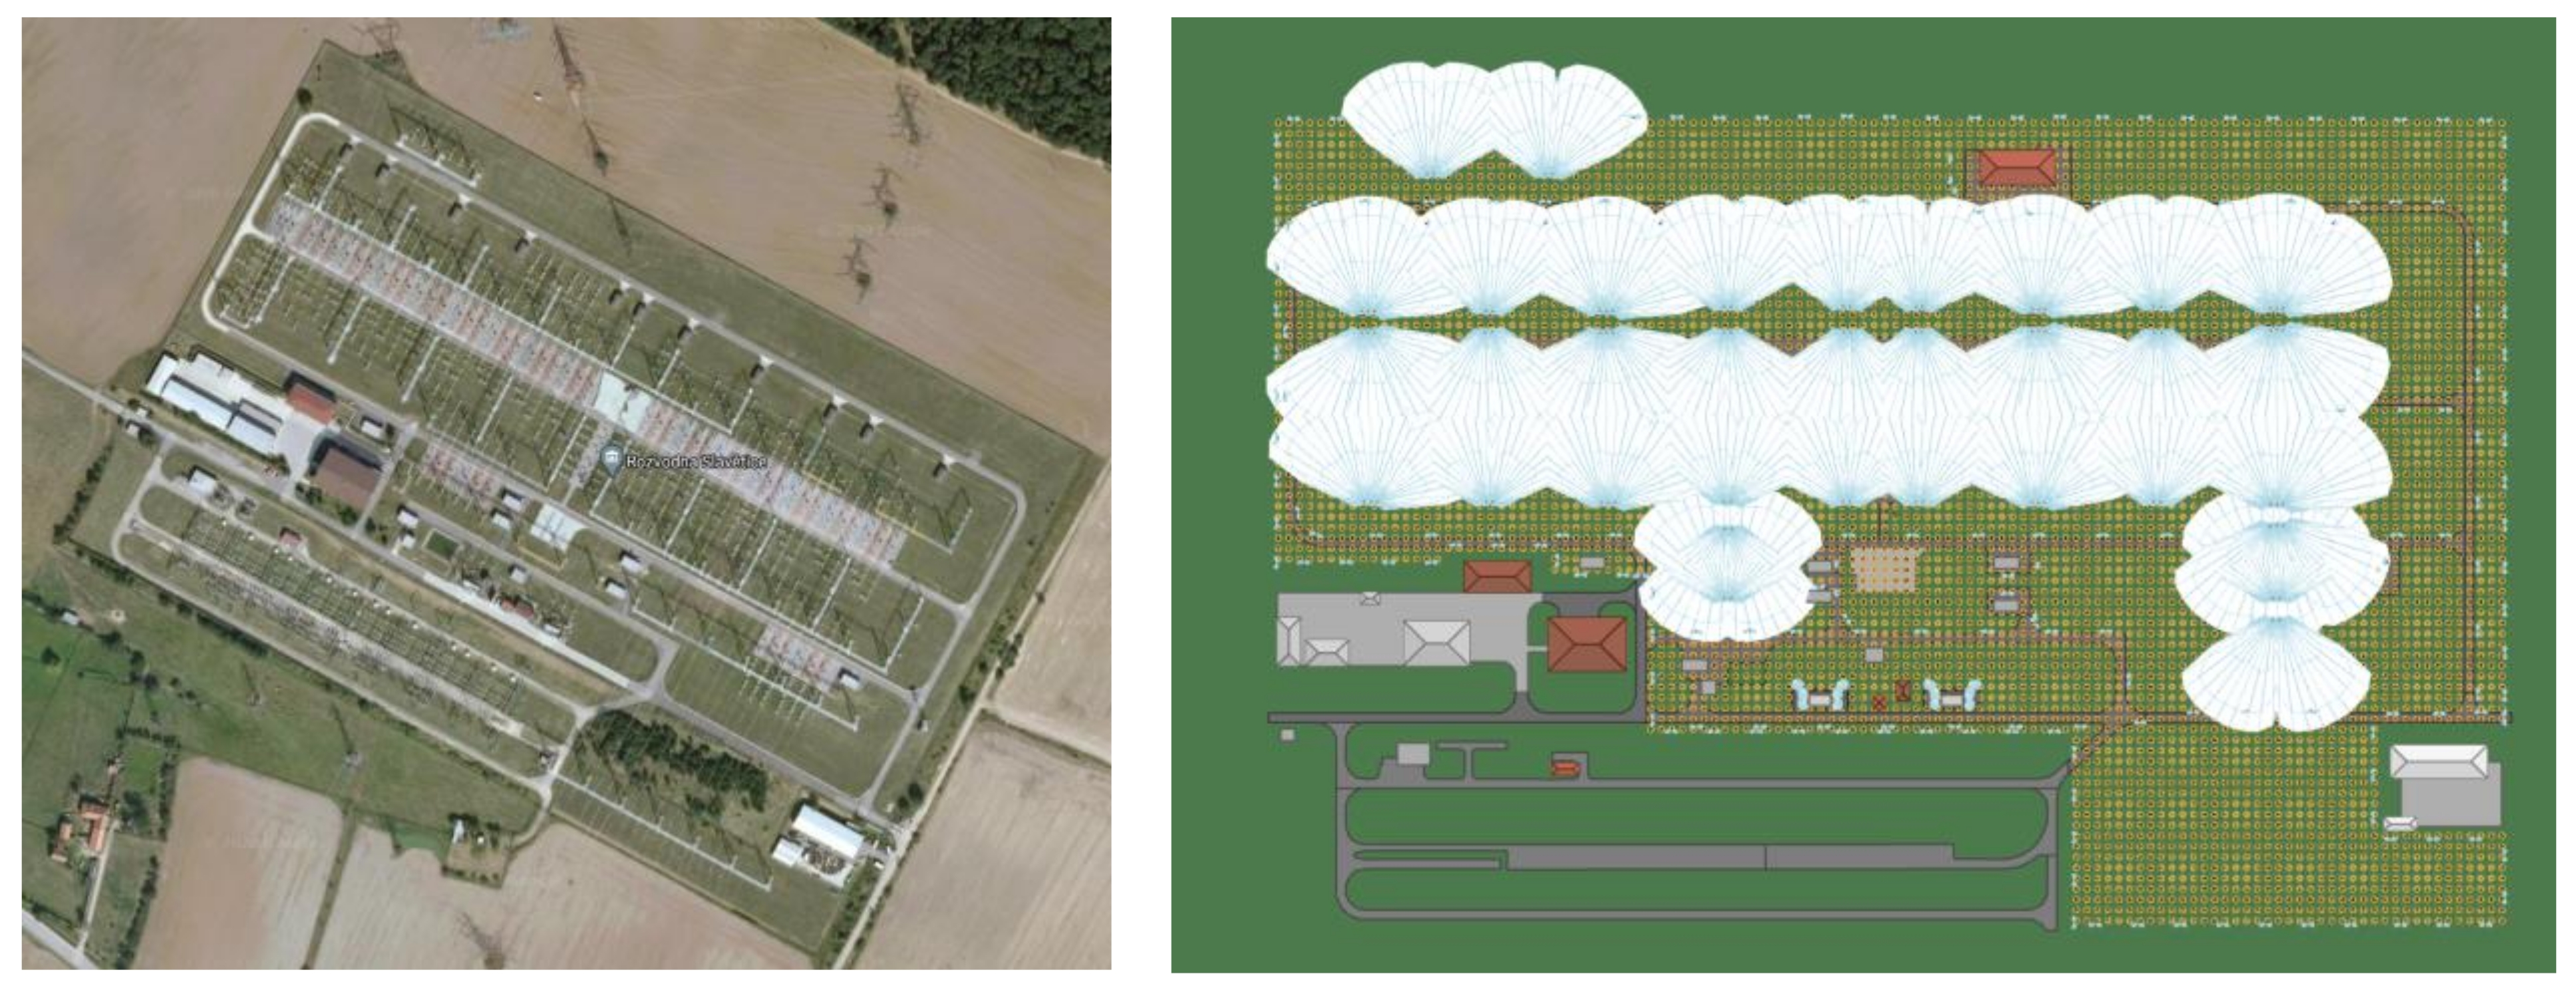
The Figure 7 below shows the layout of the TR Slavětice and its lighting model. The average horizontal illuminance of the entire area of this substation with all lighting systems is presented in Table 4 with other key parameters. Lighting systems consist of 319 pcs of luminaires both for surveillance purposes and for road lighting. They are also optimised for camera system sensing requirements, utilizing LED luminaires with flat glass and emission characteristics corresponding to road lighting luminaires and asymmetrical-beam luminaires for illumination of the entrances to the buildings of secondary equipment. Zero tilt is obvious.
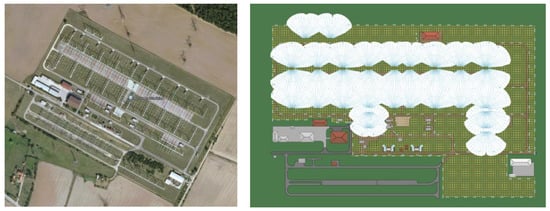
Figure 7.
Layout of the electrical substation TR Slavětice, the area for modelling is marked.

Table 4.
Key parameters of the model of new lighting installation in TR Slavětice after refurbishment.
Other lighting systems (for distribution fields, transformers) comprise luminaires with asymmetric light distribution, equipped with metal halide and high-pressure sodium lamps, with zero tilt angle.
5. Results
LIDCs describe emission of the radiation in the upper hemisphere from electric susbtations areas in different modes are presented in the section. Evaluation and comparison of results for each case study is shown in figures and tables.
5.1. Results Acquired from the Model of Light Emissions in TR Prosenice before Refurbishment
The ratio of the total, i.e., the sum of the direct and reflected luminous flux to the upper hemisphere, from the surveillance lighting was calculated by the means of software goniophotometer to 4.1% of the total luminous flux of all light sources of the surveillance lighting installation and corresponds to the value of 15.1 klm. The direct component of the luminous flux to the upper hemisphere equal to 1.48 klm corresponds to 0.4% of the total luminous flux of all light sources of the surveillance lighting installation. In the case of the overall lighting of the electrical substation the direct component of luminous flux 251 klm corresponds to 5.4% of the total luminous flux of all light sources of all lighting installations. When considering both direct and reflected components of the luminous flux emitted to the upper hemisphere, the luminous flux equals 432 klm and corresponds to 9.3% of the total luminous flux of all light sources of all lighting installations (see Table 5).

Table 5.
Light emission characteristics of two operational modes of the electrical substation TR Prosenice before refurbishment.
From model calculations it follows that the overall illumination of the electrical substation TR Prosenice is able to generate almost 29 times more luminous flux in the upper hemisphere than in the mode of surveillance lighting only. The model also gave evidence that the former lighting installation did not obey requirements to the environmental zone E2 to which this lighting system was historically classified, i.e., the directly emitted luminous flux to the upper hemisphere did not fall into the range of a maximum 5% of the total luminous flux from all luminaires, according to the standard EN 12464-2. Because the percentual comparison leading to 5.4% is related to the luminous flux of light sources, it is obvious that percentual expression related to the luminous flux emitted from luminaires will be higher, 8.1% in particular.
5.2. Results Acquired from the Model of Light Emissions in TR Prosenice after Refurbishment
The ratio of the total luminous flux to the upper hemisphere was calculated by the means of software goniophotometer to 7.4% of the total luminous flux of all light sources of the surveillance lighting installation and corresponds to the value of 59.3 klm. In the case of the overall lighting of the electrical substation the total luminous flux to the upper hemisphere corresponds to the value of 233 klm and equals 6.9% of the total luminous flux of all light sources of all lighting installations (see Table 6).

Table 6.
Light emission characteristics of two operational modes of the electric station TR Prosenice after refurbishment.
From verification it follows that the overall illumination of fully switched on refurbished electrical substation TR Prosenice generates almost four times more luminous flux to the upper hemisphere than in the mode of surveillance lighting only. Based on the software model it is also possible to show that the refurbished lighting is complying with the requirements of the E2 environmental zone. Because the electric substation is located outside inhabited areas, this classification can be assigned only on the basis of quantification of the direct emission of light into the upper hemisphere.
5.3. Comparison of the Modeling Results before and after Refurbishment of Lighting Installations in the TR Prosenice Electrical Substation
When comparing the surveillance lighting systems it can be concluded that in respect to the standard EN 12464-2 the new outdoor lighting has the direct emission of luminous flux to the upper hemisphere mitigated to zero, but considering both the direct and the reflected component of the luminous flux it is increased four times because the surveillance-lighting installation was optimized to respect requirements for lighting of the camera systems [19] as is presented in Table 7.

Table 7.
Comparison of the operational modes of the TR Prosenice electric station before and after refurbishment.
Thanks to optimization of the lighting of the distribution fields and the transformers, the luminous flux emitted from these lighting systems was considerably reduced. The direct luminous flux in the upper hemisphere was eliminated and the total luminous flux emitted from the electric station in the upper hemisphere then dropped to almost half. By means of usage of modern luminaires and light sources, the installed power of the lighting of the electrical substation was significantly reduced by 40%, although area of the station was extended by 12%.
5.4. Results of the Modeling of Lighting Installations in the TR Nošovice Electrical Substation
From results of the modelling of luminous flux emitted to the upper hemisphere, it follows that the surveillance lighting generates no direct luminous flux in the upper hemisphere (see Table 8). The reflected luminous flux 43.8 klm corresponds to 8.6% of the luminous flux emitted by the surveillance lighting system.

Table 8.
Light emission characteristics of two operational modes of the electrical substation TR Nošovice.
When taking into account all lighting systems in the electrical substation TR Nošovice, the impact of the direct emission to the upper hemisphere is clearly visible (see Table 9). It is caused by tilted luminaires, respecting that the tilting is necessary in order to fulfill the lighting task. The value of the direct luminous flux 113 klm is, however, still very low and corresponds to only 2% of the total luminous flux emitted from all luminaires. Thus, this electric station can be classified to the environmental zone E2.

Table 9.
Overview of the operational modes of TR Nošovice electrical substation.
5.5. Results of the Modeling of Lighting Installations in the TR Slavětice Electrical Substation
From results of modelling of the luminous flux emitted to the upper hemisphere it follows that the surveillance lighting generates no luminous flux in this direction (see Table 10). The reflected luminous flux 47.1 klm corresponds to 5.6% of the luminous flux emitted by the surveillance lighting system.

Table 10.
Light emission characteristics of two operational modes of the electrical substation TR Slavětice.
When taking into account all lighting systems in the electrical substation TR Slavětice, nil impact of the direct emission to the upper hemisphere is clearly visible. It is caused by asymmetrical-beam luminaires with zero tilt angle from the horizontal plane. Zero direct component of the luminous flux thus confirms the previous classification of this electrical substation to the environmental zone E2 (see Table 11). With respect to direct emission to the upper hemisphere, this electrical substation is in compliance with requirements of the environmental zone E1.

Table 11.
Overview of the operational modes of TR Slavětice electrical substation.
5.6. Final Comparison of Results of the Modeling of Lighting Installations in Chosen Electrical Substations
From Table 12 it follows that thanks to simple refurbishment of lighting installations and by implementing rules for proper lighting design aimed at the most efficient and the least obtrusive lighting, there is huge potential to reduce the installed power of lighting and at the same time to significantly mitigate the upward luminous flux.

Table 12.
Final comparison of the light emissions from lighting of outdoor workplaces versus light emissions from road-lighting systems.
Another important factor having an essential impact on the reduction of obtrusive light is the operation time of individual lighting systems. To satisfy appropriate luminous conditions for the operation of camera systems it is sufficient to keep running all night long only the surveillance lighting, which makes only a few tens of percent of the total upward luminous flux generated within the entire electrical substation while other lighting systems shall be operated only in case of emergency situations or equipment monitoring activities for what is annually only a few hours in total (see Table 12).
6. Discussion—Comparison of the Results of Modelling of Upward Light Emissions from Large Entities
Models of light emissions from large entities described above can help to estimate the extent of the total as well as direct luminous flux emitted to the upper hemisphere. Potential reduction of light emissions can be derived from comparison of lighting systems before and after refurbishment. In the overall context it is also possible to apply the models to similar systems of outdoor lighting [20] because constructing an accurate model dedicated to a particular lighting installation is very demanding on time and working capacity.
The model can be used also for comparison of light emissions from outdoor workplaces with light emissions from road-lighting systems and urban settlements [21,22]. The model can be easily extended and supplemented by further light sources such as luminous advertisement, car headlights or interior lighting passing out through windows. This case study can also establish a base for a database of specific luminous fluxes emitted from unit areas of various types of illuminated spaces as is described in Table 13.

Table 13.
Final comparison of the area-related specific upward light emissions from lighting installations.
For future comparisons of radiation in the upper hemisphere it would be interesting to check not only luminous flux, but luminous exitance (lm/m2). This parameter can be helpful to recognise if the lighting system (luminaires [23] and reflected areas) is from a point of view of obtrusive light generation appropriate or not.
Author Contributions
Conceptualization, T.N. and P.B.; methodology, T.N.; software, P.B.; validation, R.D. and J.R.; formal analysis, D.G.; investigation, R.D.; resources, R.D.; data curation, P.V.; writing—original draft preparation, T.N. and D.G.; writing—review and editing, R.D. and P.V.; visualization, J.U.; supervision, T.N. and D.G.; project administration, P.V.; funding acquisition, T.N. All authors have read and agreed to the published version of the manuscript.
Funding
This research was funded by VSB-TU Ostrava grant number SP2021/107 of the Student Grant System and by Ministry of Education Youth and Sports of the Czech Republic grant number EF17_049/0008425.
Institutional Review Board Statement
Not applicable.
Informed Consent Statement
Not applicable.
Data Availability Statement
The data presented in this study are available on request from the corresponding author. The data are not publicly available due to usage of specific file format.
Acknowledgments
This paper was elaborated in the framework of the project SP2021/107 of the Student Grant System VSB-TU Ostrava and the project EF17_049/0008425 of the Ministry of Education Youth and Sports of the Czech Republic.
Conflicts of Interest
The authors declare no conflict of interest.
References
- EN 12464-2; Lighting of Work Places. Part 2: Outdoor Work Places. European Committee for Standardization: Brusel, Belgium, 2014.
- Jägerbrand, A.K. New Framework of Sustainable Indicators for Outdoor LED (Light Emitting Diodes) Lighting and SSL (Solid State Lighting). Sustainability 2015, 7, 1028–1063. [Google Scholar] [CrossRef] [Green Version]
- CIE Commission Internationale de l’Éclairage. CIE 121. In The Photometry and Goniophotometry of Luminaires; International Commission on Illumination: Vienna, Austria, 1996. [Google Scholar]
- Pollard, N. Sky-glow conscious lighting design. Int. J. Light. Res. Technol. 1994, 26, 151. [Google Scholar] [CrossRef]
- Novak, T.; Gasparovsky, D.; Becak, P.; Sokansky, K. Modelling of Large Light Sources Radiation to the Upper Hemisphere—Obtrusive Light. In Proceedings of the 29th CIE SESSION, Washington, DC, USA, 14 June 2019; pp. 1684–1693. [Google Scholar] [CrossRef]
- Kyba, C.C.M.; Haenel, A.; Hoelker, F. Redefining efficiency for outdoor lighting. Energy Environ. Sci. 2014, 7, 1806–1809. [Google Scholar] [CrossRef]
- Ullman, J.; Novak, T.; Sebesta, J.; Ullman, I. Fence Lighting System in Transmission System Substations—Night Visibility. In Proceedings of the 21st International Scientific Conference on Electric Power Engineering (EPE), Prague, Czech Republic, 19–21 October 2020; IEEE: Piscataway, NJ, USA; pp. 1–4. [Google Scholar] [CrossRef]
- Bos, P.; Baleja, R.; Sokansky, K.; Novak, T.; Ullman, I. Selection of Lighting Systems in Outdoor Electrical Stations Working Together with Camera Systems. In Proceedings of the 2016 IEEE Lighting Conference of the Visegrad Countries, Lumen V4, Karpacz, Poland, 13–16 September 2016; IEEE: Piscataway, NJ, USA; pp. 1–6. [Google Scholar] [CrossRef]
- EN 13032-1 + A1; Light and Lighting. Light and Lighting. Measurement and Presentation of Photometric Data of Lamps and Luminaires. Measurement and File Format. DIN: Berlin, Germany, 2012.
- EN 13032-2; Light and Lighting. Measurement and Presentation of Photometric Data of Lamps and Luminaires. Part 2: Presentation of Data for Indoor and Outdoor Work Places. European Committee for Standardization: Brusel, Belgium, 2017.
- Becak, P.; Novak, T.; Baleja, R.; Sokansky, K. Testing of the Software Goniophotometer in Wils—Building Design Computational Programme. In Proceedings of the 19th International Scientific Conference on Electric Power Engineering (EPE), Brno, Czech Republic, 16–18 May 2018; IEEE: Piscataway, NJ, USA; pp. 1–5. [Google Scholar] [CrossRef]
- Elsahragty, M.; Kim, J.L. Assessment and Strategies to Reduce Light Pollution Using Geographic Information Systems. Procedia Eng. 2015, 118, 479–488. [Google Scholar] [CrossRef] [Green Version]
- Bouroussis, C.A.; Topalis, F.V. Assessment of outdoor lighting installations and their impact on light pollution using unmanned aircraft systems—The concept of the drone-gonio-photometer. J. Quant. Spectrosc. Radiat. Transf. 2020, 253, 107155. [Google Scholar] [CrossRef]
- Becak, P.; Wlosokova, J.; Picha, J.; Novak, T.; Sokansky, K. Modeling of Luminous Flux Radiation to the Upper Hemisphere from Real Model of Town. In Proceedings of the 20th International Scientific Conference on Electric Power Engineering (EPE), Kouty nad Desnou, Czech Republic, 15–17 May 2019; pp. 164–168. [Google Scholar] [CrossRef]
- Becak, P.; Novak, T.; Baleja, R.; Sokansky, K. Radiation of the Luminous Flux into the Upper Half-Space in Wils—Building Design. In Proceedings of the 7th Lighting Conference of the Visegrad Countries (LUMEN V4), Trebic, Czech Republic, 18–20 November 2018; IEEE: Piscataway, NJ, USA; pp. 1–5. [Google Scholar] [CrossRef]
- Petržala, J.; Kómar, L. Data regression on sphere for luminance map creation from sky scanner measurements. Sol. Energy 2015, 117, 203–212. [Google Scholar] [CrossRef]
- Gasparovsky, D. Measurement of Daylight Illuminance Levels in Transient Periods for Public Lighting Control. Prz. Elektrotech. 2013, 89, 320–323. [Google Scholar]
- Bouroussis, C.; Lowenthal, J.; Bara, S.; Jägerbrand, A.; Jechow, A.; Longcore, T.; Motta, M.; Sanhueza, P.; Schlangen, L.; Schroer, S. Bio-Environment Report. In On-Line Workshop Dark and Quiet Skies for Science and Society Report and Recommendations. Procedings of the On-Line Workshop Dark and Quiet Skies for Science and Society Report and Recommendations, Paris, France, 9 December 2020; International Astronomical Union: Paris, France; pp. 92–117. [Google Scholar]
- Bos, P.; Baleja, R.; Sokansky, K.; Novak, T. Outdoor Power Stations CCTV Systems that Work Synergistically with the Security Lighting. In Proceedings of the 2017 17th IEEE International Conference on Environment and Electrical Engineering and 2017 1st IEEE Industrial and Commercial Power Systems Europe, EEEIC/I and CPS Europe 2017, Milan, Italy, 6–9 June 2017; IEEE: Piscataway, NJ, USA; pp. 1–5. [Google Scholar] [CrossRef]
- Hold-Geoffroy, Y.; Athawale, A.; Lalonde, J. Deep Sky Modeling for Single Image Outdoor Lighting Estimation. In Proceedings of the IEEE Conference on Computer Vision and Pattern Recognition, Long Beach, CA, USA, 15 June 2019; IEEE: Piscataway, NJ, USA; pp. 6920–6928. [Google Scholar] [CrossRef] [Green Version]
- Walczak, K.; Gyuk, G.; Garcia, J.; Tarr, C. Light Pollution Mapping from a Stratospheric High-Altitude Balloon Platform. Int. J. Sustain. Lighting (IJSL) 2021, 23, 20–32. [Google Scholar] [CrossRef]
- Xing, G.; Zhou, X.; Peng, Q.; Liu, Y.; Qin, X. Lighting Simulation of Augmented Outdoor Scene Based on a Legacy Photograph. Comput. Graph. J. 2013, 32, 101–110. [Google Scholar] [CrossRef]
- Gasparovsky, D.; Smola, A.; Macha, M.; Janiga, P. New Approach to Determination of Luminaire Maintenance Factor Curves for Various Conditions. Light Eng. 2012, 20, 17–26. [Google Scholar]
Publisher’s Note: MDPI stays neutral with regard to jurisdictional claims in published maps and institutional affiliations. |
© 2022 by the authors. Licensee MDPI, Basel, Switzerland. This article is an open access article distributed under the terms and conditions of the Creative Commons Attribution (CC BY) license (https://creativecommons.org/licenses/by/4.0/).

