Article

Design and Structural Simulations of a Custom Li-Po Accumulator for Low Range, Lightweight, Single-Seater, Open Cockpit, and Open-Wheeled Racecar

1
Department of Mechanical Engineering, Symbiosis Institute of Technology, Symbiosis International (Deemed University), Pune 412115, India
2
Industrial Engineering Department, College of Engineering, King Saud University, Riyadh 11421, Saudi Arabia
3
Department of Mechanical Engineering, Campus Universitário de Santiago, University of Aveiro, 3810-193 Aveiro, Portugal
4
Vel Tech Rangarajan Dr.Sagunthala R&D Institute of Science and Technology, Avadi, Chennai 600062, India
*
Author to whom correspondence should be addressed.
Energies 2022, 15(1), 363; https://doi.org/10.3390/en15010363
Submission received: 30 September 2021 / Revised: 2 December 2021 / Accepted: 6 December 2021 / Published: 5 January 2022

Abstract

:
Electric, hybrid, and fuel cell vehicles are the future of the automobile industry, and power source design is one of the most crucial steps in designing these vehicles. This paper aims to design and structurally simulate a custom accumulator—which powers an electric vehicle, for a lightweight, single-seater formula-style racecar. The work is dependent on the model-based design and CAD model approach. Mathematical modeling on SCILAB is used to model equations to get the characteristics of the accumulator, such as the energy, capacity, current, voltage, state of charge, and discharge rates. The output of this model gives the configuration of the battery pack as several cells in series and parallel to adequately power the tractive system. An accumulator container is designed to safeguard the cells from external impacts and vibrational loads, which otherwise can lead to safety hazards. Following this, the Finite Element Analysis (FEA) performed on the accumulator resulted in maximum peak deformation of 0.56 mm, ensuring the safety check against various external loads. Further, the finer stability of the battery pack was virtually validated after performing the vibrational analysis, resulting in a deformation of 3.5493 mm at a 1760.8 Hz frequency.

1. Introduction

With climate change becoming a severe issue, the world is embracing renewable energy sources and accepting the different sustainable transportation modes. Growing concerns over carbon emission have lately sparked worldwide interest in more efficient and cleaner transportation systems. To mitigate pollution, the world is shifting to electric vehicles as better alternatives to fuel-based automobiles. To support this movement, the Government of India has pledged to make India an all-electric vehicle nation by 2030 [1]. This project is aligned with the global agenda of manufacturing zero-emission vehicles hence enforcing stricter Environmental Protection Acts worldwide. This paper discusses the design and structural simulations of a custom accumulator for use in a lightweight, single-seater formula-style racecar, which will encourage motorsports teams and companies to shift from the traditionally used internal combustion engines to an EV powertrain for use in racing events [2]. The high manufacturing cost, increased weight, increased volume, and need for proper thermal management of Li-ion battery cells are currently the main deterrents to prolific demand for electric vehicles [3,4,5]. Despite the challenges, the demand and production of electric vehicles continue to increase.
Various papers have discussed the design procedure for an accumulator for similar applications. Jongerden and Haverkort [6] discuss the various battery models used for battery performance estimation. Kalmakov and Andreev [7] discuss the battery pack sizing equations and the design procedure. Tokosch and Hake [8] and Bolstad Lars [9] elaborate on integrating the low voltage circuit, BMS, motor controller, and shutdown circuit with the battery pack. These papers only discuss the battery pack design from the cell selection and battery sizing but do not discuss how these designs can be used in real-world scenarios as they do not have an enclosure to house the cells.
Papers that discuss the mechanical design of the accumulator either ignore the mathematical modeling for cell configuration [2] or do not include vibrational analysis of the container [10,11,12], which can have a significant effect on the accumulator design. This paper builds on using a lap time simulator and mathematical modeling to select battery configuration and then design the accumulator container around it. Structural and vibrational analyses are carried out on this container to ensure its safe use. The paper also uses the Emrax 188 medium voltage motor, which was revised in 2021 with changes in its performance and has not been used for a similar application.

2. Methodology

The accumulator or the battery pack, which powers the electric vehicle, is a custom-built battery pack that includes all the cells, busbars, maintenance plugs, Battery Management System (BMS), Accumulator Isolation Relay (AIRs), fuses, and cooling system to manage the battery and the power distribution for the motor controller. This paper discusses the design of a safe, high-performance accumulator that could provide the maximum power of 52 kW to the tractive system and store sufficient energy to allow the car to travel up to 22 km in one charge. As the battery pack is intended to be used in motorsport applications, performance and safety are paramount. The research demonstrated uses several tools. Drive cycle data with speed at closely spaced time steps are acquired from a lap time simulation software (Optimum Lap) for the vehicle model as its primary input. Mathematical modeling on SCILAB is then used to model the various equations governing the resistive forces, speed, torque, and power delivered by the propulsion system, which in our case is the electric motor, and then ultimately the characteristics of the accumulator such as the energy, capacity, current, voltage, state of charge and discharge rates. The output of this model gives the configuration of the battery pack giving us the number of cells in series and parallel to power the tractive system adequately. As the accumulator would be mounted on the vehicle, it needs to withstand the static and vibrational loads encountered in regular use. Keeping this in mind, the accumulator is designed on CAD software (Fusion 360) and simulated structurally (on Simscale) to handle these loads using finite element analysis. Since the battery packs operate at voltages over 200 V, which can be dangerous, the containers also protect the individuals who work around them from electrical shocks. The materials and components selected for the design considered safety the main feature to be satisfied, and then a lightweight and reliable container was designed that can efficiently run the vehicle. Figure 1 shows the flow chart of the methodology followed. The accumulator is also designed to be easily accessible and serviceable to facilitate easy maintainability. Further, the finer stability of the battery pack was virtually validated after performing the vibrational analysis using ANSYS. The car under consideration is a single-seater, lightweight, formula-style car that can compete in amateur racing competitions such as Formula Society of Automotive Engineers (FSAE) events held worldwide [12].

2.1. Cell Selection

In an electric vehicle, cell selection dictates the design of the accumulator [8]. Hence, choosing the right type of cell for the design to start the design is a crucial step. This decision, taken very early in the design process, affects the tractive system design and the efficiency of the entire vehicle. The most common type of cells used in automobile applications is lithium-based cells, which have lithium metal oxides as positive electrodes and lithium salts as electrolytes for the transfer of electrons. As the accumulator is designed for lightweight vehicles, energy density by weight and volume become important factors. Cells with specific energy densities are preferred as they would result in a smaller and lighter battery pack. As the vehicle is an open cockpit, thermal management of the cells becomes difficult, especially in tropical climates. Cells that can withstand higher temperatures are referable as some cell chemistries tend to decrease charge holding capacities at higher temperatures. This cell selection method is not easy to produce, as cells come in several different chemistries and different types of packaging, manufactured by different manufacturers, each with its advantages and disadvantages. Various cell chemistries are available today; each cell chemistry was studied and analyzed for our application. Table 1 shows the comparison of some of the shortlisted cell chemistries.
Based on the above comparison, lithium phosphate cell chemistry was selected as it had the highest energy density and was economical. It can also provide a high operating current (1–5 C) and has good performance even at temperatures near the top of its operating limits. They also have good overcharge capabilities and long life cycles, ideal for use in small-range vehicles. They also have a high tolerance to abuse due to their relatively moderate energy density. Internationally, there are many manufacturers of cells, including A123 systems, Kokam, EIG, K2 Energy, Thundersky, and Melasta [9]. Based on carefully examining the data sheets received from each vendor, pricing, availability, and packaging interpretations, A123 systems were selected. A123 systems are a worldwide leader in lithium-ion energy storage. They provide cells and cell modules for use in automotive applications [10]. Cells are mainly available in three types of enclosures or geometries—cylindrical cells, prismatic cells, and pouch cells. Cylindrical cells are enclosed in a cylindrical outer shell, which allows them to maintain their shape against the expansion during charging. Prismatic cells also have a metal external enclosure. This makes the cells heavier and reduces the energy density per unit weight of the cell.
Considering the various types of cell geometry, we chose the A123 pouch cell with 3.2 V and 20 Ah capacity. Using a pouch cell reduces the weight of the accumulator considerably, hence aiding the vehicle performance. The electrodes in pouch cells lay parallel to each other in a single plane, forming a flat rectangular shape with the terminals at the same edge of the cell. Lithium-ion pouch cells need to be under pressure to operate at peak performance [10]. However, the electrical, mechanical, and thermal integration of cells into packs and packs into electric vehicles is paramount to ensure long and safe operation [11,12].

2.2. Lap Time Simulations

Optimum Lap is a lap-time simulation software that uses a point mass model of the car and simulates its run around a user-defined track. The car’s specifications, like weight, torque, rpm, suspension characteristics, etc., can vary as per the user input [13]. The track considered for the simulation is used in many motorsport races and Formula Bharat events at Kari Motor Speedway, Coimbatore, India. For the car’s inputs, a typical light formula-style racecar used in FSAE events was taken as a reference with a weight of 300 Kg, powered by an Emrax 188 motor with a peak power of 52 kW and peak torque of 90 nm [14]. Figure 2 shows the variation of speed on the simulated track. To calculate the motor torque and speed, the final reduction ratio of the transmission setup had to be fixed. The track was carefully mapped, and simulations were run for varying final drive ratios (FDR) for the car to achieve the fastest possible times. An FDR of 5 was chosen for further discussion as it provides good results in both full lap and acceleration runs and would also be easy to package mechanically.

2.3. SCILAB Modeling and Simulations—Powertrain Sizing

Models can be classified according to the different modeling approaches used [15]. The major categories are mathematical models, electrochemical models, and electrical equivalent circuit networks [16]. For our application, the mathematical modeling approach is used using SCILAB. SCILAB uses a numerically oriented programming language to simulate mathematical models. The powertrain sizing model, modeled using SCILAB, gives the total number of cells, the number of cells in series and parallel, and battery pack volume based on various input parameters like drive-cycle data, wheel radius, and all the forces acting under total tractive effort load. Apart from the drive cycle data given to the model, these parameters are shown below in Table 2.
The powertrain-sizing model consists of five main system blocks—Chassis, Transmission, Motor, Motor Controller, and Battery in Figure 3. The input parameters like drive-cycle data, wheel radius, and all the forces acting under total tractive effort given to the Chassis system block result in wheel speed and wheel torque. The formulae used for this calculation are mentioned below in Equations (1) and (2).
N W = ( v × 60 ) / ( 2 × π × R W )
where,
R W = R a d i u s   o f   t h e   w h e e l   ( m )
v = V e h i c l e   v e l o c i t y   ( m / s )
N W = W h e e l   s p e e d   ( r p m )
T W = T T E × R W
where,
T W = W h e e l   t o r q u e   ( N m )
T T E = T o t a l   t r a c t i v e   e f f o r t   ( N )
R W = R a d i u s   o f   t h e   w h e e l   ( m )
The output of the transmission system, i.e., motor speed and motor torque, is used to calculate motor power in the motor system block. The battery power obtained as an output from the motor controller system block is used to calculate the total number of cells, cells in series and parallel in the last battery system block. The range of output values of each system block can be seen in the above figure. Figure 4 shows the graphs obtained as an output from these system blocks.
At any instant, the maximum resistive force will be the summation of peak values from each of the above graphs. Here, it is evident that Aerodynamic peak force = 200 N, Acceleration peak force = 1000 N, Gradient peak force = 0 N, Rolling peak force = 44 N. Hence the maximum instantaneous resistive load that our motor should be able to handle is calculated as the sum of the four forces (peak) which is equal to 1245 N (approximately). The rolling force here is constant because rolling resistance depends on the product of weight of the object and coefficient of rolling resistance. In our case, we consider the weight of the car to be constant throughout and coefficient is a constant.
Figure 5 represents the speed and torque for wheels and motor, respectively, and Figure 6 depicts the required motor power. These serve as the minimum requirements that must be sought while sizing our components. We can surmise from the above graphs and relations that any deviation in the values obtained from resistive forces directly impacts the motor power calculation, which will eventually affect the battery sizing, as we will see from the relations further on. The battery system block shown in Figure 7 is divided further into various sub-systems. Each sub-system contains its calculation related to the battery. The various calculations are completed using the following Equations (3)–(9).
B P = M P / M C e f f i c i e n c y
where,
B P = B a t t e r y p o w e r i n   k W
M C e f f i c i e n c y = M o t o r   c o n t r o l l e r   e f f i c i e n c y
E n e r g y p e r k m = ( B P ) / ( D × 3.6 × 10 6 )
where,
D = D r i v e   c y c l e   r a n g e i n   k m
T o t a l e n e r g y = E n e r g y p e r k m × D
B C r a t e = I / B C
where,
B C r a t e = B a t t e r y   D i s c h a r g e   r a t e
B C = B a t t e r y   n o m i n a l   c a p a c i t y i n   A h
S O C = 100 × [ ± ( I B C × 3600 ) d t ]
where,
S O C = B a t t e r y   s t a t e   o f   c h a r g e
N p a r a l l e l = B C / ( C e l l c a p a c i t y )
where,
N p a r a l l e l = N o .   o f   p a r a l l e l   s t a c k s
N s e r i e s = B V / V
where,
N s e r i e s = N o .   o f   c e l l s   i n   s e r i e s
B V = B a t t e r y   v o l t a g e   ( V o l t s )
V = C e l l   n o m i n a l   v o l t a g e   ( V o l t s )
The battery power, voltage, current, c-rate, and SOC are calculated under this system to ensure that the cell configuration achieved from them successfully powers the vehicle to complete the distance in a single charge. Figure 7 shows the battery system block modeled in Scilab software.
Figure 8 shows the battery power and battery current graphs obtained from these sub-system blocks, which helps determine the battery pack capacity using the relations mentioned above.
Another critical application of a battery model is to estimate battery states, such as state of charge and state of health, that are key battery operating states yet not directly measurable, using model-based estimation methods [17,18].
The simulated battery discharge C rates and state of charge curve are depicted in Figure 9. A discharge rate curve helps us understand the usage of our cells. It helps us determine how much current over the continuous and peak rating of the individual cell are we drawing from the accumulator. The results show that the continuous discharge rate is 3 C while peak discharge is at 5.3 C. However, the datasheet of 20 Ah A123 cells suggests that the usable continuous discharge current can go up to 200 A, which is 10 C, and the usable peak discharge current can go up to 600 A, which is 30 C. This can be seen in the image below (Table 3).
The battery pack sizing model gives us the required total energy, which, when divided by the required motor operating voltage, gives the required pack capacity in Ah. This is then divided by the chosen cell capacity to obtain the number of cells in parallel. Several cells in series are found by dividing the pack voltage known by a single shortlisted cell voltage.
Hence, our usage is well within safe operating limits and bolsters our belief that despite the undulating high and low discharge rates, the battery pack charge does not fall below 20% at the end of the 2500 s endurance instance. The motor power obtained from the output graph of Scilab’s transmission system model is in the range between nominal power and the peak power of the chosen motor. Hence, we can conclude that the battery pack would provide sufficient power to the motor during its operation, even during the 22 km of the car’s endurance.
The number of cells obtained in series is 90, and the number of cells obtained in parallel is 1. Hence, a 90S1P was selected as the best cell configuration to get the best performance out of the accumulator for dynamic events.

2.4. CAD Modeling

The cells and cell configuration obtained from the previous steps must be arranged and packaged in an accumulator box for safe use. As there are no guides for the mechanical design of an accumulator, the rulebook from Formula Student Germany was used as a guide for the design [19]. This document provides a set of rules that must be followed to ensure the safe use of the accumulator under racing conditions.
The rules state that one accumulator segment cannot exceed a maximum voltage of 120 V DC, the maximum energy of 6 MJ, and a mass of 12 kg. To facilitate this, the accumulator was divided into six smaller “modules,” containing 15 in 3 columns of 5 cells each, as shown in Figure 10. The cells were connected in series. The modules were designed to enclose the cells to provide structural stability. The individual modules were connected electrically in series to achieve the required 90S1P configuration. The six modules were placed inside an external accumulator box and the maintenance plugs and other necessary components. The accumulator box must protect the cells under lateral, longitudinal, and vertical loading. The accumulator must also be electrically insulated. As the design uses pouch cells, constant pressure is applied to the face of the cells for maximum efficiency. The design must also provide easy assembly, accessibility, and ease of maintenance.
Several iterations of the accumulator box and modules were made, each an improvement over the other. The goal was to maximize the structural strength of the accumulator without increasing the weight too much.
Neoprene rubber foam, a heat retardant, and insulating material were used to maintain pressure on each cell face while providing the necessary electrical insulation. To maintain the series connection, busbars and clamps were designed according to the cell orientation. Positive locking through double tab washers was used to safeguard against the motor vibrations acting on the module. Considering the active cooling system, the module container was designed with slots for fans to vent the air in and out of the system using. Handles were designed for easy access to the module containers. A 2.5 mm thick aluminum 7075-T6 material was chosen for the box, considering its strength to weight ratio [20].
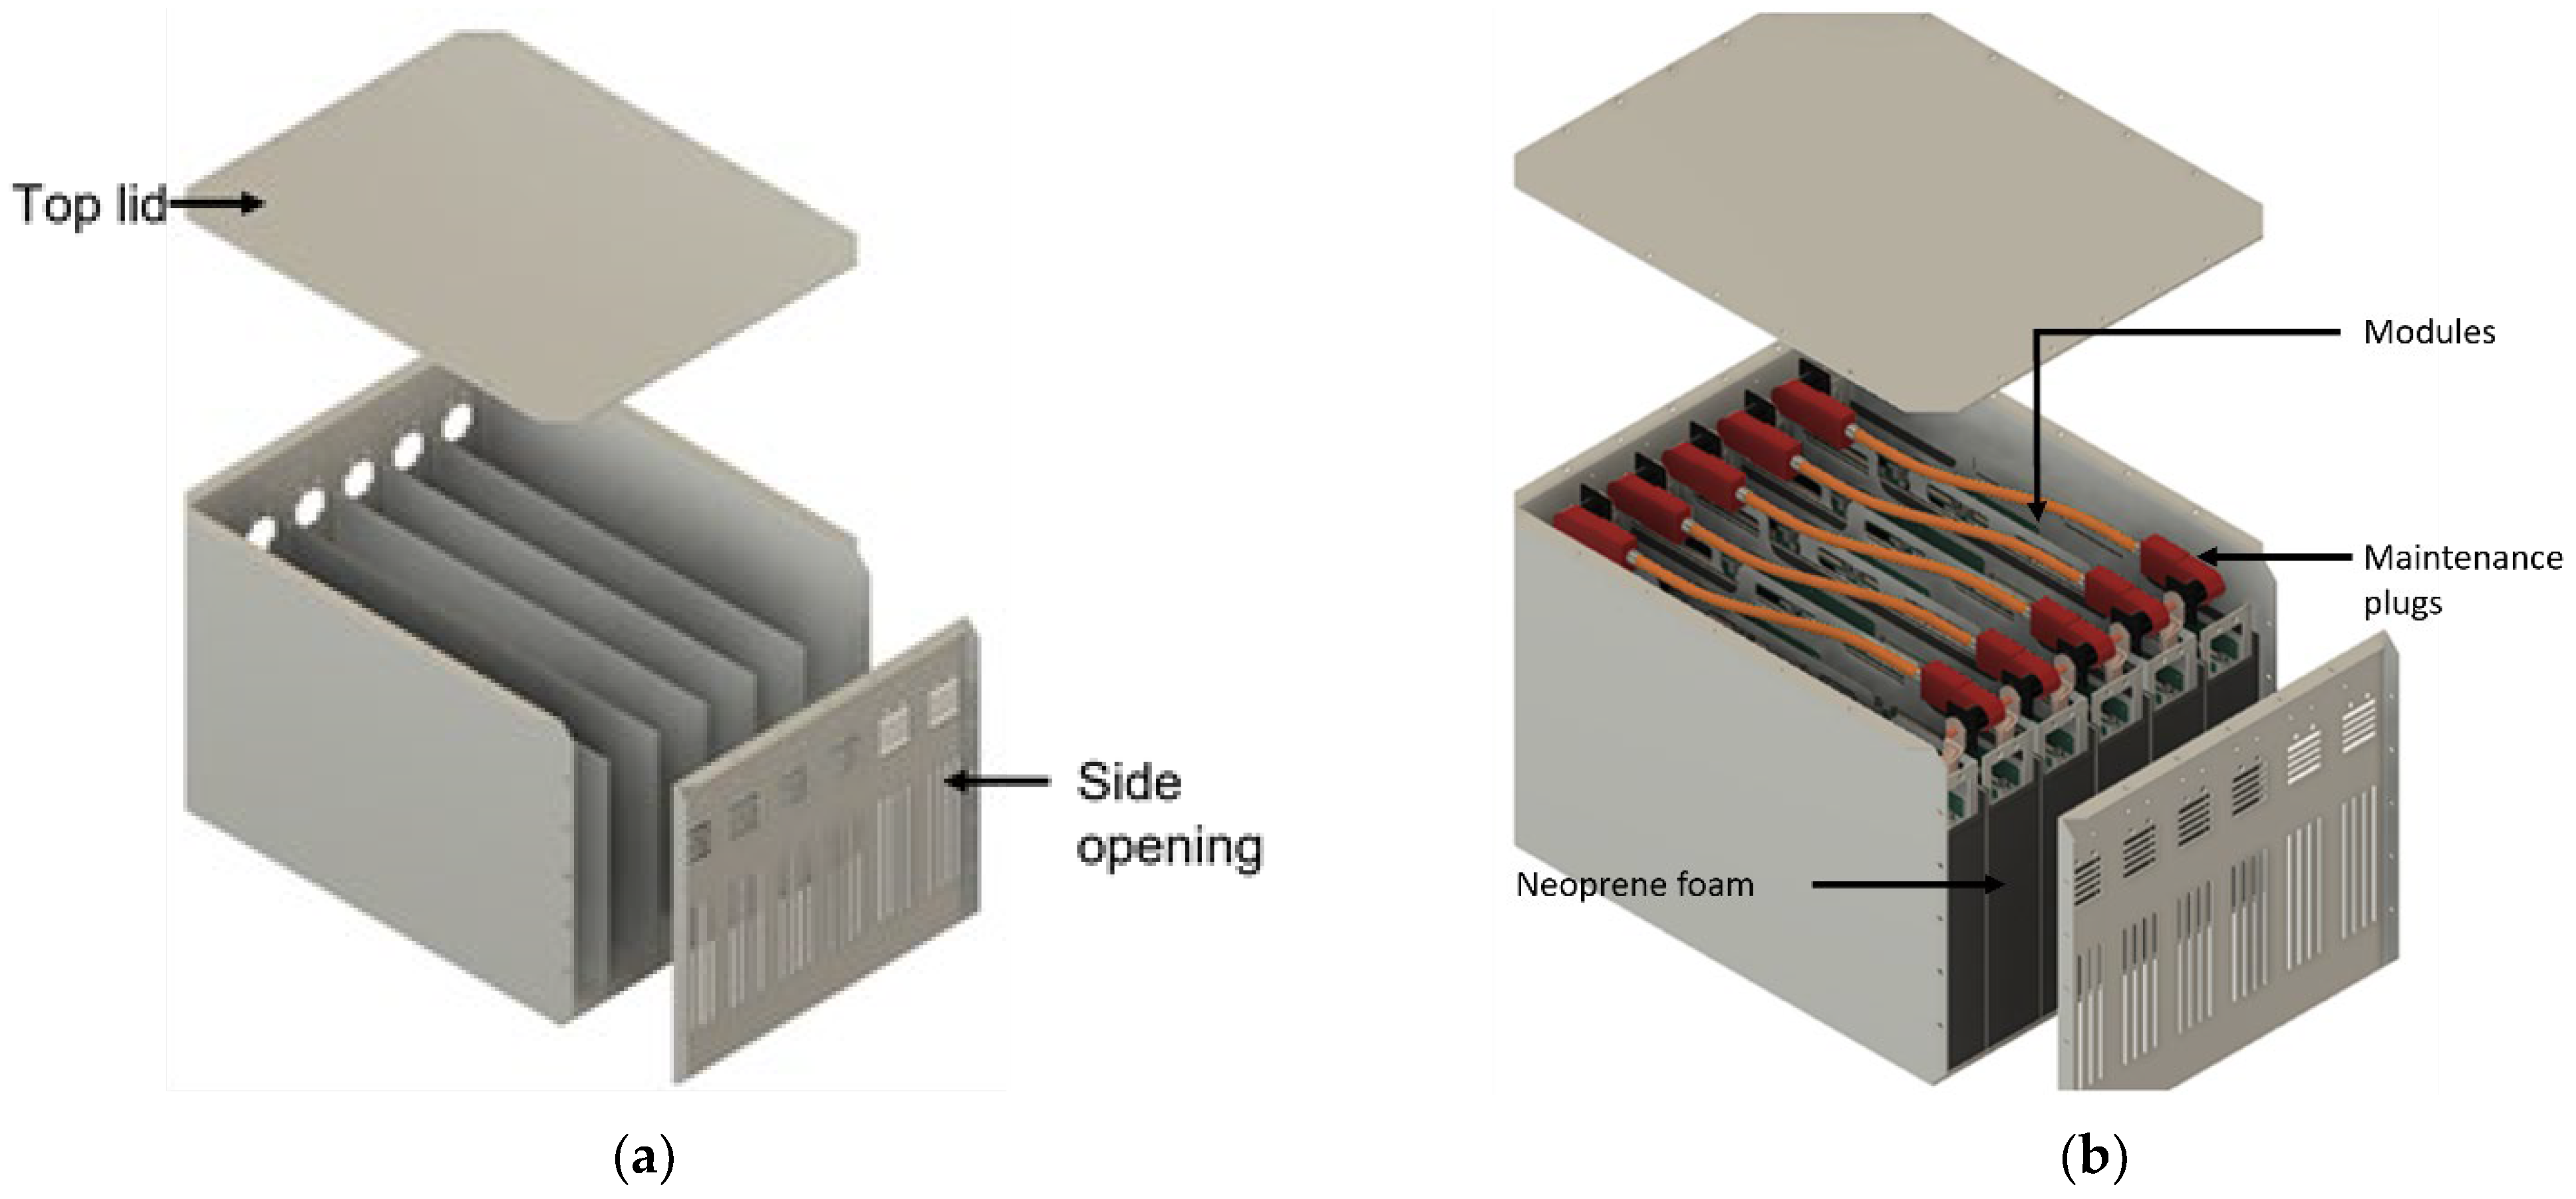
A maintenance plug for 3/0 AWG gauge wire was used with a latching connector and a plug terminal on the other end to connect the modules in series. The lug terminal sides of the maintenance plug are connected to cell tabs, and the two latching connectors are used to connect and disconnect two adjacent modules, making it safe to disconnect for maintenance. An accumulator container was designed around these modules. For ease of assembly and disassembly, one side opening is provided apart from the top opening, as seen in Figure 11. The thickness of the base plate is 3.5 mm, while the thickness of the vertical walls is 2.5 mm. The mass of the whole accumulator system was 75.3 kg considering all the PCBs for monitoring cell temperature and voltage, maintenance plugs, fasteners, and brackets for mounting the accumulator container, and it was acceptable. Figure 12 clearly shows this assembled accumulator configuration.

2.5. Finite Element Analysis

FEA and finite element modeling (FEM) are numeric techniques that use computational power to approximate the solution to stress and strain estimation equations. They are used when the shapes or forces are too complicated to be solved by analytical methods [21,22]. Simscale, an online cloud computing Computer-Aided Engineering (CAE) software, is used for structural simulations to provide access to higher computational power. Following the rulebook, the container, the mounting of the accumulator container to the chassis, and the mounting of the cells to the container must be designed to withstand the following accelerations with mounting points as fixed support:
  • 40 g in the longitudinal direction (forward/aft),
  • 40 g in the lateral direction (left/right),
  • 20 g in the vertical direction (up/down),
  • Gussets attaching the accumulator to the chassis should withstand the load of 20 kN in all directions.
For analysis of ductile materials with complex geometries, Von Mises equivalent stress is used. Von Mises stress, σv, is given below in Equation (10):
σ v = 1 2 [ ( σ 1 σ 2 ) 2 + ( σ 2 σ 3 ) 2 + ( σ 3 σ 1 ) 2 ]
σ v = V o n M i s e s s t r e s s
σ 1 = P r i n c i a l s t r e s s i n x
σ 2 = P r i n c i a l s t r e s s i n y
σ 3 = P r i n c i a l s t r e s s i n z
For the design to be safe, the maximum value of the σv should be less than the material’s yield point. Figure 12, Figure 13 and Figure 14 show the deformations and Von Misses stresses generated for longitudinal, lateral, and vertical forces applied. Simulations are carried out for the individual module, brackets, and entire accumulator container. The red arrow shows the direction of the force.

2.6. Vibrational Analysis

One typical approach to characterize the observed dynamic behavior of a mechanical system is performing modal analysis [23]. Modal analysis or structural vibrational analysis is the study of the dynamic properties of a body under natural vibrational frequency conditions. This would simulate the displacement or deformation of the part when subjected to vibration and loads during its lifetime [24]. This technique can explain a structure in terms of its natural characteristics. The natural characteristics are natural frequency, damping, and mode shapes [25]. The modal model of the system is formulated mathematically, and the modal data is the characteristic information of the system. Modal analysis is mostly dispensed to seek out the system’s natural frequency and for different mode shapes at different eigenvalues [26]. The modal analysis relies on expressing the response of a linear time-invariant dynamic system as a linear simple harmonic motion set of natural vibrations. The damping factor is defined by the solver depending upon the material properties and the part’s dimensions. Examples of strategies for modal analysis range from phase-retrieval combined with direct mode projection, correlating the modes with spectral or temporal degrees of freedom, combining principal component analysis after adapting the detection system with a training data set, to performing a coordinate transformation that converts the beam into a more convenient basis [27]. The fundamental of modal analysis using measured frequency response function data is curve fitting the data using a predefined mathematical model of the measured structure. This model assumes the number of Degrees of Freedom (DoFs) of the structure, its damping type, and possibly the number of vibration modes within the measured frequency range. These assumptions dictate the mathematical expression of each Frequency Response Function (FRF) curve from measurement and a curve-fitting process trying to derive all modal parameters in a mathematical formula of an FRF using measurement data [28]. The analysis is carried out with a flow structure of Static Structural → Modal → Random Vibrations → Lifespan estimation.
Modal analysis is carried out for frequencies ranging from 20 to 2000 Hz. This includes all the possible frequencies generated by the motor and vibrations.

2.6.1. Static Structural Analysis

The analysis is carried out on ANSYS Mechanical. The CAD model is imported into the software, and certain prerequisites are determined and set. The given CAD model meshes in ANSYS Meshing, where the body is divided into several elements suitable for mathematical analysis. The material for the accumulator is defined to be Aluminum Alloy 7075-T6 grade. Remote points were defined on the module walls on which the pouch cells are mounted. The mass of the modules is defined as point masses with remote attachments to said remote points. The weight of each pouch cell was taken to be 496 g [29], and the weight of one module is defined to be 7.44 kg. The accumulator’s mounting holes are defined as the fixed points in static structural analysis to calculate the total deformation due to the weight of the pouch cells. The total deformation in the static condition is shown in Figure 15.

2.6.2. Modal Analysis

The results of the static structural analysis are linked to the modal frequency analysis to correlate the results. For frequencies between 20 and 2000 Hz [30], the number of modes must be analyzed. Each mode denotes a particular natural frequency, modal damping factor, and displacement pattern, and mode shape [23]. Due to these natural modes, the vibrations are determined by the properties of the vibration source and mode shapes of the system. The mode v/s frequency graph is shown in Figure 16.
The total deformation is calculated for modes 1–650, ranging from 17.895 to 1767.3 Hz. The minimum to maximum total deformation experienced by the accumulator ranges from 0.4890 to 3.5493 mm for 17.85–1760.8 Hz, respectively. The deformation results can be seen in Figure 17.

2.6.3. Random Vibrations

The mode shapes are extracted from the total deformation results as the solution to modal analysis. The solution of modal analysis is used as an input to the setup of random vibrations. The Segalman–Reese method is used for the dynamic analysis. The displacement response PSD (Power Spectral Density) can be simplified for a single base excitation [30]. A log-log plot between Actual Spectral Density (ASD) and frequency is used for performing random vibration analysis. The extracted modes are used as precursors to the setup of random vibrations. The power spectral density acceleration graph is defined in the setup. The ASD (G2/Hz) V/s frequency (Hz) graph is shown in Figure 18, and the input values are shown in the table. The software will hence interpolate the values for G2/Hz for the frequencies for each mode.
The input data determines the directional deformation values for scale factors sigma 1, sigma 2, and sigma 3. Maximum directional deformation was observed in the X direction, with negligible deformation in the Y and Z directions. The equivalent stresses under Von Mises stress are calculated for the scale factors. Table 4 shows scale factor values, respective probability, and maximum directional deformation.
As the probability of the sigma 3 scale factor is the highest, it is hence considered for total directional deformation and equivalent Von Mises stress. The results of directional deformation of scale factors sigma 3 are shown in Figure 19.

2.6.4. Lifespan

Steinberg’s Formula (Equation (11)) is used to calculate life via the fatigue tool in random vibrations in ANSYS. Steinberg formulation utilizes all three stress occurrences (1σ, 2σ, 3σ) and their rate of occurrence along with Miner’s rule to compute fatigue damage of the system.
D = n 1 σ N 1 σ + n 2 σ N 2 σ + n 3 σ N 3 σ
where,
n 1 σ = a c t u a l   n u m b e r   o f   c y c l e s   a t   o r   b e l o w   1 σ   l e v e l
n 2 σ = a c t u a l   n u m b e r   o f   c y c l e s   a t   o r   b e l o w   2 σ   l e v e l
n 3 σ = a c t u a l   n u m b e r   o f   c y c l e s   a t   o r   b e l o w   3 σ   l e v e l
n 1 σ , n 2 σ a n d n 3 σ = a n   A l l o w a b l e   n u m b e r   o f   c y c l e s   ( f r o m   f a t i g u e   c u r v e )   a t   1 σ , 2 σ ,   a n d   3 σ   s t r e s s   l e v e l s
The analysis resulted in a total lifespan of 1.047 × 1026 h, which is exceptionally high. The significant damage throughout this time is observed at the mounting holes of the accumulator while the rest of the accumulator sustained low to no damage at all.

3. Discussion

From most of the results, we comprehend that there is still much scope for further improving the results. Our state of charge curve shows that only 20% of the charge is left in the cell at the end of the drive cycle run. Implementing a regeneration concept and conjugating its model with our existing mathematical model can further help us bring down the battery pack capacity by 1.5–2 Ah, depending upon the level of regeneration we want to achieve. A detailed study of the charging and discharging characteristics of the cell can help develop its charging technology, and the independent SOC study of each cell can help increase the lifespan of these energy storage devices. Physical testing of the pouch cell on cell testing rigs can help us establish a Battery Management System (BMS). A BMS enables and assists in keeping the charge, voltage, and current balanced and uniform among all the energy device cells. This concept can help downsize our accumulator by heightening the SOC limits towards the lower ends. Our mathematical model can further incorporate a heat generation model so that heat rejection within the energy storage device can be simulated and analyzed to improvise the accumulator’s material selection, orientation, and configuration. Software like IPG carmaker and Carsim can further model the intricacies and integration of the energy storage device with the rest of the car and estimate the differences in lap times and overall efficiency. Generative design can optimize the topology of the energy system containers making them more reliable and cost-effective for alternative applications.

4. Result

The final accumulator model was successfully designed against all the predetermined objectives of the project. With a final drive reduction of 5, the total lap time was determined as 1 min 45 s per lap. The resistive force value of 1224 N helped estimate the motor power required in the range of 20–30 kW (continuous), which helps in sizing the powertrain and justifies the selection of the Emrax 188 motor. The battery sizing models provide a 90S1P cell configuration for the selected LFP pouch cells; this configuration helps us safely use the accumulator for the desired period without running out of power with approximately 20% charge left at the end of the run. The accumulator module experiences a peak deformation of 0.56 mm along the longitudinal axis. The accumulator brackets generate peak Von Mises stress of 150 MPa and experience a peak deformation of 0.18 mm. The accumulator container experiences a peak deformation of 3 mm. All the stresses generated in the container are below the ultimate tensile stress for the material, with a safety factor ranging from 0.1 to 0.5. For the vibrational analysis, the total deformation experienced by the accumulator is 3.5493 mm at 1760.8 Hz. The accumulator design is hence safe to use in electric Formula Student racecars.

5. Conclusions

The methodology described in the paper can be used to design the accumulators for passenger cars and public transport. Even though each application is different and will follow other safety and design requirements, the underlying design methodology used in this paper can be applied. The driving conditions and the driver psychology while driving different segment vehicles are very diverse; hence by interpreting these attributes carefully, designers can tune their electric motors with suitable battery performance maps to get close to the optimal driving experience. This idea can be extended to all X-EVs and other electric mobility platforms by modifying them as needed.

Author Contributions

Conceptualization, Y.A. and A.B.; methodology, D.K.; software, A.B., D.K., S.C. and Y.A.; formal analysis, S.C.; investigation, Y.A.; resources, A.B.; data curation, D.K.; writing—original draft preparation, D.K. and S.C.; writing—review and editing, A.B. and Y.A.; visualization, N.K., E.A.N., J.P.D. and S.S.; supervision, N.K., E.A.N., J.P.D. and S.S.; project administration, N.K., E.A.N., J.P.D. and S.S.; funding acquisition, N.K., E.A.N., J.P.D. and S.S. All authors have read and agreed to the published version of the manuscript.

Funding

The authors extend their appreciation to King Saud University for funding this work through Researchers Supporting Project number (RSP-2021/164), King Saud University, Riyadh, Saudi Arabia.

Institutional Review Board Statement

Not applicable.

Informed Consent Statement

Not applicable.

Data Availability Statement

Data is contained within the article.

Acknowledgments

We would like to thank our college Symbiosis Institute of Technology, and Symbiosis International University, for providing us with the opportunity to work on and present on this project. The authors extend their appreciation to King Saud University for funding this work through Researchers Supporting Project number (RSP-2021/164), King Saud University, Riyadh, Saudi Arabia.

Conflicts of Interest

The authors declare no conflict of interest.

References

  1. Mandela, K.C. What is The Future of Electric Vehicles in India by 2030, Electric Vehicles. Available online: https://electricvehicles.in/what-is-the-future-of-electric-vehicles-in-India-by-2030/ (accessed on 20 February 2021).
  2. Mehta, H.; Soni, R.; Shaikh, P.; Bhanushali, R.; Abraham, J.; Birajdar, D. Design of an Accumulator Container for a Formula Student Electric Race Car. In Proceedings of the International Conference on Intelligent Manufacturing and Automation, Mumbai, India, 27–28 March 2020; Springer: Singapore, 2020; pp. 825–836. [Google Scholar]
  3. Arora, S.; Kapoor, A. Experimental Study of Heat Generation Rate during Discharge of LiFePO4 Pouch Cells of Different Nominal Capacities and Thickness. Batteries 2019, 5, 70. [Google Scholar] [CrossRef] [Green Version]
  4. Young, K.; Wang, C.; Wang, L.Y.; Strunz, K. Electric vehicle battery technologies. In Electric Vehicle Integration into Modern Power Networks; Springer: New York, NY, USA, 2013; pp. 15–49. [Google Scholar] [CrossRef] [Green Version]
  5. Koniak, M.; Czerepicki, A. A method of computer modelling the lithium-ion batteries aging process based on the experimental characteristics. IOP Conf. Ser. Mater. Sci. Eng. 2017, 211, 012006. [Google Scholar] [CrossRef] [Green Version]
  6. Jongerden, M.R.; Haverkort, B.R. Battery Modeling; TR-CTI; Centre for Telematics and Information Technology, University of Twente: Enschede, The Netherlands, 2008. [Google Scholar]
  7. Kalmakov, V.A.; Andreev, A.A.; Salimonenko, G.N. Development of formula student electric car battery design procedure. Procedia Eng. 2016, 150, 1391–1395. [Google Scholar] [CrossRef] [Green Version]
  8. Tokosch, A.; Hake, D.; Meah, K.; Maier, J. Design and Implementation of a Drivetrain for an FSAE Electric Vehicle. In Proceedings of the 2019 IEEE International Conference on Environment and Electrical Engineering and 2019 IEEE Industrial and Commercial Power Systems Europe, Genova, Italy, 11–14 June 2019; pp. 1–4. [Google Scholar]
  9. Bolstad, L.H.; Fjøsne, A.; Haukali, M.; Thiagarajah, D. Electronic systems for a formula student racing car. ATZextra Worldw. 2017, 22, 50–53. [Google Scholar] [CrossRef]
  10. West, L.; Shepherd, B.; Karabon, N.; Howell, J.; Pyrtko, M. Design Report of the High Voltage Battery Pack for Formula SAE Electric; Department of Mechanical Engineering, University of Wisconsin-Madison: Madison, WI, USA, 2016. [Google Scholar]
  11. Ashish, U.; Raj, B.; Kumar, A. Design and fabrication of an accumulator container/battery pack for a Formula Student vehicle. Int. J. Res. Eng. Technol. 2016, 5, 20–29. [Google Scholar]
  12. Munir, F.; Ratnapalasari, C.; Kartasasmita, W. MUR5: Accumulator Design for an FSAE Electric Car; The University of Melbourne: Melbourne, Australia, 27 October 2017; Available online: https://www.academia.edu/35563442/MUR5_Accumulator_Design_for_an_FSAE_Electric_Car (accessed on 12 February 2021).
  13. Optimum Lap. Available online: https://optimumg.com/product/optimumlap/ (accessed on 12 February 2021).
  14. Emrax 188 Datasheet. Available online: https://emrax.com/e-motors/emrax-188/ (accessed on 27 January 2021).
  15. Fotouhi, A.; Auger, D.J.; Propp, K.; Longo, S.; Wild, M. A review on electric vehicle battery modeling: From Lithium-ion toward Lithium–Sulphur. Renew. Sustain. Energy Rev. 2016, 56, 1008–1021. [Google Scholar] [CrossRef] [Green Version]
  16. Shafiei, A.; Momeni, A.; Williamson, S. Battery modeling approaches and management techniques for plug-in hybrid electric vehicles. In Proceedings of the IEEE Vehicle Power and Propulsion Conference, Chicago, IL, USA, 6–9 September 2011. [Google Scholar]
  17. Rao, R.; Vrudhula, S.; Rakhmatov, D.N. Battery modeling for energy-aware system design. Computer 2003, 36, 77–87. [Google Scholar]
  18. Pedram, M.; Wu, Q. Design considerations for battery-powered electronics. In Proceedings of the 36th Annual ACM/IEEE Design Automation Conference, New Orleans, LA, USA, 21–25 June 1999; ACM: New York, NY, USA, 1999; pp. 861–866. [Google Scholar]
  19. FSG Rulebook 2021. Available online: https://www.formulastudent.de/fsg/rules/ (accessed on 27 January 2021).
  20. Aluminum 7075 T6 Datasheet. Available online: http://www.matweb.com/search/DataSheet.aspx?MatGUID=4f19a42be94546b686bbf43f79c51b7d&ckck=1 (accessed on 20 February 2021).
  21. Dar, F.H.; Meakin, J.R.; Aspden, R.M. Statistical methods in finite element analysis. J. Biomech. 2002, 35, 1155–1161. [Google Scholar] [CrossRef]
  22. Palermo, A.; Toso, A.; Heirman, G.H.K.; Cerdá, R.; Gulinelli, M.; Mundo, D.; Desmet, W. Structural coupling and non-linear effects in the experimental modal analysis of a precision gear test rig. In Proceedings of the International Gear Conference 2014, Lyon, France, 26–28 August 2014; Woodhead Publ. Ltd.: Sawston, UK, 2014; Volume 2014, pp. 1049–1059. [Google Scholar]
  23. Uttamchandani, D. Optical MEMS using commercial foundries. In Guided Wave Optical Components and Devices Basics, Technology, and Applications; Pal, B.P., Ed.; Academic Press: Cambridge, MA, USA, 2006; pp. 353–370. [Google Scholar] [CrossRef]
  24. Siva, I.; Selvan, M.C.P.; Senthilkumar, K.; Sivakumar, D.; Arulraj, P.; Amico, S.C. Tribological studies and modal analysis on biocomposite/PVC core sandwich panels. In Elsevier Series on Tribology and Surface Engineering; Elsevier: Amsterdam, The Netherlands, 2021; pp. 301–319. [Google Scholar] [CrossRef]
  25. Srinivasan, T.; Sharavanan, S.; Naveen, E.; Sethuvelappan; Ramanan, P. Modal Analysis of Electrical Motor Casing. (December 2020). In IOP Conference Series: Materials Science and Engineering; IOP Publishing: Baghdad, Iraq, 2021; Volume 1112, p. 012013. [Google Scholar]
  26. Martin, L.; Larson, W.D.; Kondakci, H.E.; Mardani, D.; Shabahang, S.; Jahromi, A.K.; Malhotra, T.; Vamivakas, A.N.; Atia, G.K.; Abouraddy, A.F. Hilbert-Space Analyzers: Basis-Neutral Modal Analysis via Generalized Optical Interferometry. In Frontiers in Optics; Optical Society of America: Washington, DC, USA, 2016. [Google Scholar] [CrossRef]
  27. He, J.; Fu, Z.-F. Modal analysis methods—Frequency domain. In Modal Analysis; Elsevier: Amsterdam, The Netherlands, 2001. [Google Scholar] [CrossRef]
  28. Random Vibration Specification Magnitude Equation. Available online: https://femci.gsfc.nasa.gov/random/randomequations.html (accessed on 26 February 2021).
  29. A123 LFP Cells. Available online: http://www.a123systems.com/automotive/products/cells/ (accessed on 15 January 2021).
  30. Estimating Structural Response to Random Vibration. Available online: https://www.padtinc.com/blog/wp-content/uploads/2017/11/PADT-ANSYS-Random-Vib-Reaction-Forces-2017_11_22-1.pdf (accessed on 11 March 2021).
Figure 1. Methodology flowchart.
Energies 15 00363 g001
Figure 2. The output of lap-time simulation from optimum lap shows the speed at each instant on the track. Note that due to the lack of long straight lines the top speed of the vehicle is around 77 kmph.
Energies 15 00363 g002
Figure 3. Powertrain sizing mathematical model.
Energies 15 00363 g003
Figure 4. (a) Rolling force, (b) gradient force, (c) aerodynamic force, (d) acceleration force.
Energies 15 00363 g004
Figure 5. (a) Motor speed. (b) Motor torque for the entire run.
Energies 15 00363 g005
Figure 6. Motor power throughout the entire run.
Energies 15 00363 g006
Figure 7. Battery sizing math model.
Energies 15 00363 g007
Figure 8. (a) Battery power and (b) battery current.
Energies 15 00363 g008
Figure 9. (a) Battery discharge C-rate and (b) SOC for the entire run.
Energies 15 00363 g009
Figure 10. Cell connection using cell tabs. (a) Cell connection in series. Double tab washers are used to make sure that the bolts do not loosen due to vibration; (b) connections of cell tabs are made by bending the cell tabs over a standard bus bar. This eliminates the need to punch holes in the cell tabs, which might damage the cell tabs.
Energies 15 00363 g010
Figure 11. (a) Accumulator container without the modules. (b) Assembled accumulator container with the modules.
Energies 15 00363 g011
Figure 12. (a) Longitudinal deformation. (b) Lateral deformation. (c) Vertical deformation. The base of the modules is considered as fixed points and load is applied to the module walls.
Energies 15 00363 g012
Figure 13. (a) Equivalent Von Mises stress for the bracket (MPa). (b) Total deformation (mm) for the bracket. The base of the brackets is taken as fixed support, and the forces are applied to the walls of the brackets.
Energies 15 00363 g013
Figure 14. Total deformation for accumulator container (mm).
Energies 15 00363 g014
Figure 15. Static structural simulation due to cell weight under gravity results in negligible deformation of 2.47 × 10⁻⁵ mm on the modules.
Energies 15 00363 g015
Figure 16. Mode (X-axis) v/s frequency. Each mode has a respective frequency for analysis.
Energies 15 00363 g016
Figure 17. (a) Minimum deformation for modal analysis at 17.895 Hz frequency is 0.489 mm. (b) Maximum deformation for modal analysis 1760.8 Hz frequency is 3.5 mm.
Energies 15 00363 g017
Figure 18. ASD vs. frequency curve (log-log).
Energies 15 00363 g018
Figure 19. Directional deformation (mm) for 3 Sigma scale factor. The maximum deformation is 0.45 mm towards the top of the accumulator module.
Energies 15 00363 g019
Table 1. Cell chemistry comparison [3,5,6].
PropertiesVRLAC-ZnNiMHNiCdLi-IonLFP
Specific Energy (Wh/kg)33–423660–8040–6090–133150–260
Specific Energy Density (Wh/L)60–11092140–30050–150250–676250–730
Specific Power (W/kg)18010–27250–1000150250–340300–350
Life Cycle500–800N/A1500–20001500–20001500–3000600–800
Charge–Discharge Efficiency (%)50–9550–606670–9080–9080–95
Table 2. Model input: the inputs used to define the characteristics of the car.
Vehicle Dynamics Parameters
Radius of the wheel (m)0.203
Coefficient of rolling resistance0.015
Gross vehicle mass (kg)325
Gravitational acceleration (m/s2)9.81
Frontal area (m2)0.875
Drag coefficient0.7
Transmission Parameters
Gear ratio5
Transmission efficiency0.85
Table 3. Datasheet of A123 cells considered for the design.
SpecificationsValueNotes/Comments
Nominal Capacity20 Ah
Minimum Capacity19.5 Ah25 °C, 6A Discharge
Nominal Voltage3.3 VAt 50% SOC
Voltage Range2.0–3.6 VFully discharged to fully charged
Recommended maximum charge voltage3.6 V
Recommended end of discharge cut-off2.0 V
Table 4. Scale factor values, probability of occurrence, and maximum directional deformation result for random vibration analysis.
Scale Factor ValueProbabilityMaximum Directional Deformation
Sigma 168.26%0.15 mm
Sigma 295.45%0.30 mm
Sigma 399.73%0.45 mm
Publisher’s Note: MDPI stays neutral with regard to jurisdictional claims in published maps and institutional affiliations.

