Article

Influence of the Auxiliary Air-Duct Outlet and the Brattice Location on the Methane Hazard—Numerical Simulations

by
Adam P. Niewiadomski
1,*,†,
Grzegorz Pach
1,†,
Zenon Różański
1,†,
Paweł Wrona
2,†,
Dariusz Musioł
1,†,
Pavel Zapletal
3,† and
Marian Sofranko
4,†
1
Department of Geoengineering and Raw Materials Extraction, Faculty of Mining, Safety Engineering and Industrial Automation, Silesian University of Technology, 44-100 Gliwice, Poland
2
Department of Safety Engineering, Faculty of Mining, Safety Engineering and Industrial Automation, Silesian University of Technology, 44-100 Gliwice, Poland
3
Department of Mining Engineering and Safety, Faculty of Mining and Geology, Technical University of Ostrava, 708-00 Ostrava, Czech Republic
4
Institute of Earth Resources, Faculty Of Mining, Ecology, Process Control and Geotechnologies, Technical University of Kosice, 042-00 Kosice, Slovakia
*
Author to whom correspondence should be addressed.
These authors contributed equally to this work.
Energies 2022, 15(10), 3672; https://doi.org/10.3390/en15103672
Submission received: 25 April 2022 / Revised: 9 May 2022 / Accepted: 16 May 2022 / Published: 17 May 2022

Abstract

:
The article presents the results of research into the influence of the location of auxiliary ventilation devices on the distribution of methane concentrations at the outlet of the longwall in an underground mine. Since this area is crucial from the point of view of explosion risk, the existence of an optimal arrangement of these devices could lead to improved safety of the crew working in the area. The aim of conducted study was to examine if the impact of this devices placement is significant. The research was carried out with the use of computational fluid dynamics (CFD) modeling—Ansys Fluent. The analyses took into account the location of the two most commonly used devices: a brattice and an auxiliary air-duct. The numerical model has been prepared and validated based on in situ measurements. Thirty-two cases of device configurations were analysed. The length and position of the brattice, as well as the height and position air-duct outlet along tailgate, were modified. It has been shown that although the presented solutions are an effective risk mitigation method, contrary to the common opinion of many practitioners, the impact of their exact placement, provided it is compliant with the regulations, is not significant for the registered methane concentration distribution at a longwall outlet.

1. Introduction

The methane hazard is common during the exploitation of energy resources. At the same time, taking into account the flammable and explosive properties of methane, this threat should be considered as one of the most important [1,2,3,4,5,6]. The uncontrolled increase in methane concentration in the workspace may lead to loss-generating downtime or to events that threaten the health and life of employees in the area where it occurs. To limit the possibility of activating potentially dangerous events, the ventilation services of mines are obliged to control and combat dangerous accumulations of this gas [7,8,9]:
  • Active methane prevention methods by ensuring adequate ventilation of the endangered area, methane drainage from the deposit and the use of auxiliary ventilation devices;
  • Passive methane prevention methods, including constant monitoring of the methane content in the air with the use of properly arranged sensors and automatic anemometers.
In relation to the specific character of hazards occurring in underground mining and their mutual interactions, it is necessary in many cases to conduct simulation studies. Research published in recent years have successfully utilized the possibilities offered by computational fluid dynamics (CFD) to investigate and design this particularly hazardous regions [10].
These methods are particularly applied in the study of methane hazard. Many aspects related to the methods of limiting and controlling this hazard curently are the subject of research. In the field of methane drainage, Botao et al. [11] and Qin et al. [12] examined the effectiveness of selected drainage pressures on the return air methane concentrations and fire hazard, while Zapletal and Kosowski [13] analyzed selected methane collector diameters, Cao and Li [14] and Skotniczy [15] studied the distribution of methane concentrations in the mining-induced fracture zone in terms of its extraction and Wang et al. [16] researched methane concentration distribution in goafs and its interaction with the fire hazard. The research subject are also dynamic phenomena, such as methane explosion initiation and development [17].
Another area of studies are the ventilation parameters and hazard level with or without auxiliary ventilation equipment in working faces and longwall areas. Hasheminasab et al. [18] and Zhou et al. [19] studied the effect of selected auxiliary equipment on methane distribution in drilling faces, Liu et al. [2] proposed a way to reduce energy consumpion in these workings and Mishra et al. [20] present the results of a model study of methane distribution and dispersion in the tailgate. The effectiveness of CFD simulations in predicting methane concentration distributions in working faces was also subject of research by Daloglu et al. [21] and Kurnia et al. [22]. An important contribution are also the proposed methodologies for conducting model studies and validation with real measurements presented by Wierzbinski [23] for U-ventillated areas and by Janoszek et al. [24] for Y-ventillated longwall areas.
Among the indicated prevention measures, auxiliary ventilation devices are an extremely effective method of local limitation of hazardous methane accumulations at the longwall outlet. Their basic tasks are to dilute the air–methane mixture to the level of permissible concentrations and to direct the stream flowing from the longwall towards the part of the excavation being liquidated, thus moving the dangerous concentrations away from the working zone of the longwall and the crossing with the tailgate. The configuration of these devices should be adjusted to the recognized hazard level. The basic element is a brattice with a ventilation air-duct. If necessary, the system of auxiliary ventilation devices can be additionally extended with other elements, such as auxiliary air-ducts, jets and cyclones or directional vents [8,9,18,25].
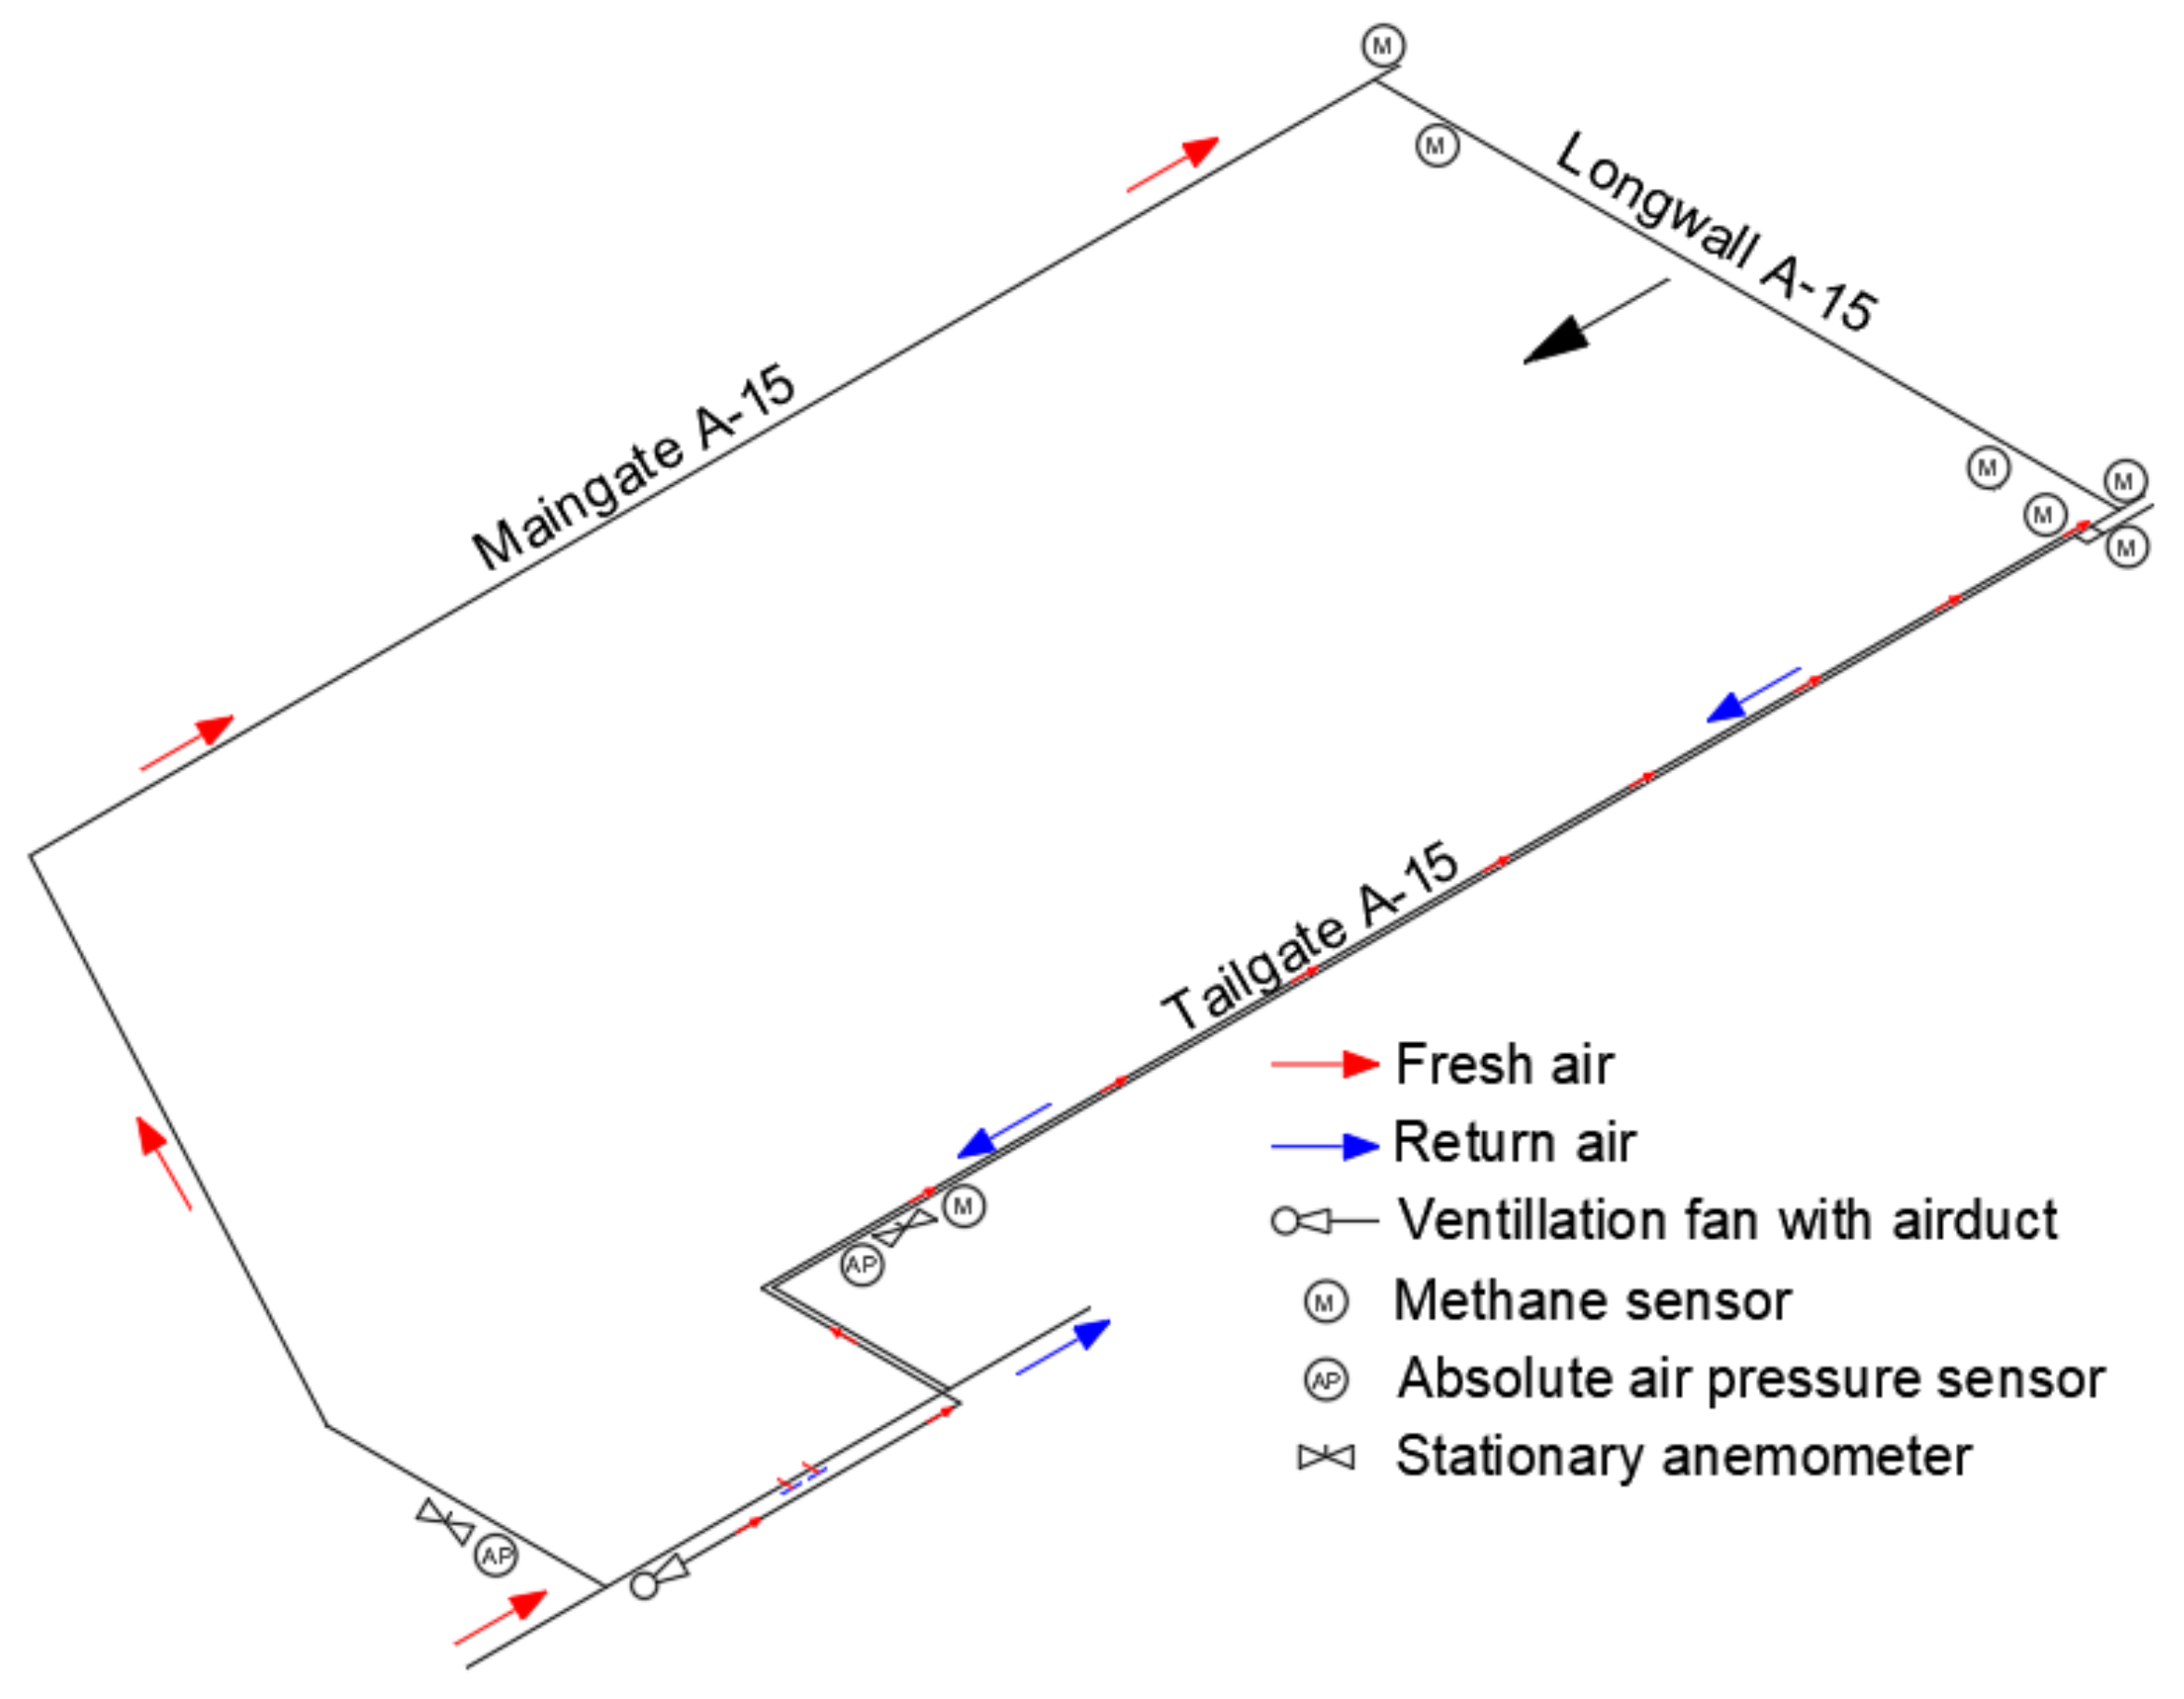
Statistics provided in the literature [26] indicate the great popularity of these solutions. In over 70% of longwalls in the analyzed mines in the given period, auxiliary ventilation devices were used. Moreover, it should be noted that when the ventilation methane capacity exceeds 5 m3/min, the most widely used variant was the brattice and one auxiliary air-duct configuration. This variant is shown in Figure 1 covering the last section of the longwall with the location of the scraper chain conveyor with its drive. The brattice and the auxiliary air-duct are located in the tailgate near the intersection with longwall. The hatched area indicates the goaf zone. The red color indicates the fresh air path and the blue color indicates the return air path. The given ranges of methane sensor locations result from legal regulations.
Legal regulations and guidelines in many cases do not indicate detailed recommendations, leaving the decision to the investor [9,27,28,29] or include only general recommendations for their placement, indicating that the cross-sectional area between the brattice and the opposite side of the excavation cannot be smaller than 6 m2 [30,31]. On the other hand, the detailed definition of the scope and parameters is the responsibility of the mining ventilation services, based on the opinion of experts, in such a way that “their location and operating parameters take into account the local conditions of methane hazard” [31]. In addition, the system should be made under the principles of consistency of the ventilation system and operational stability to effectively reduce the level of risk. In practice, there is a conviction among the employees of ventilation services that the appropriate arrangement of the brattice and the outlet of the air-duct in the tailgate geometry is of key importance for the effectiveness of this prevention method. This claim is unjustified because this subject has not been sufficiently researched, both in the in situ and model-based studies.
The subject of the conducted research was to verify the mentioned thesis to possibly indicate the optimal range of distribution. This article presents the results of simulation studies of the influence of selected variants of the distribution of auxiliary ventilation devices on the recorded methane concentrations. The most commonly used variant was analyzed (Figure 1).

2. Methods

The Ansys Fluent software [32] was used in the research work to perform model tests of air flows and methane emissions at the intersection of the longwall with the tailgate. It is currently one of the most popular software environments for CFD calculations and simulations [2,11,14,16,18,23].
The model used in the research was prepared based on an actual longwall carried out in a underground coal mine, in which a high methane hazard was determined. The longwall was ventilated in a U system along the coal seam, i.e., the maingate supplementing the fresh air and the tailgate as a return air way (Figure 2). The average methane content in this part of coal seam was 15.1 m3CH4/Mg.
To prepare and validate the model, the following details were collected:
  • Detailed meaurements of the geometry of workings in the area of the longwall and tailgate crossing, geometry and location of auxiliary ventilation devices;
  • Methane concentrations recorded continuously for 3 months in six locations: in the liquidated part of the tailgate A-15; at the inlet to longwall, up to 10 m from the crossing with the maingate A-15; in the crossing area of the longwall and tailgate, above the longwall scraper conveyor drive; at the brattice location, at a distance of 4 to 6 m from the tailgate cave line; behind the brattice, as well as at the outlet from the longwall area;
  • Measurements of pressure, air temperature and volumetric air flow in the maingate and tailgate in the given period.
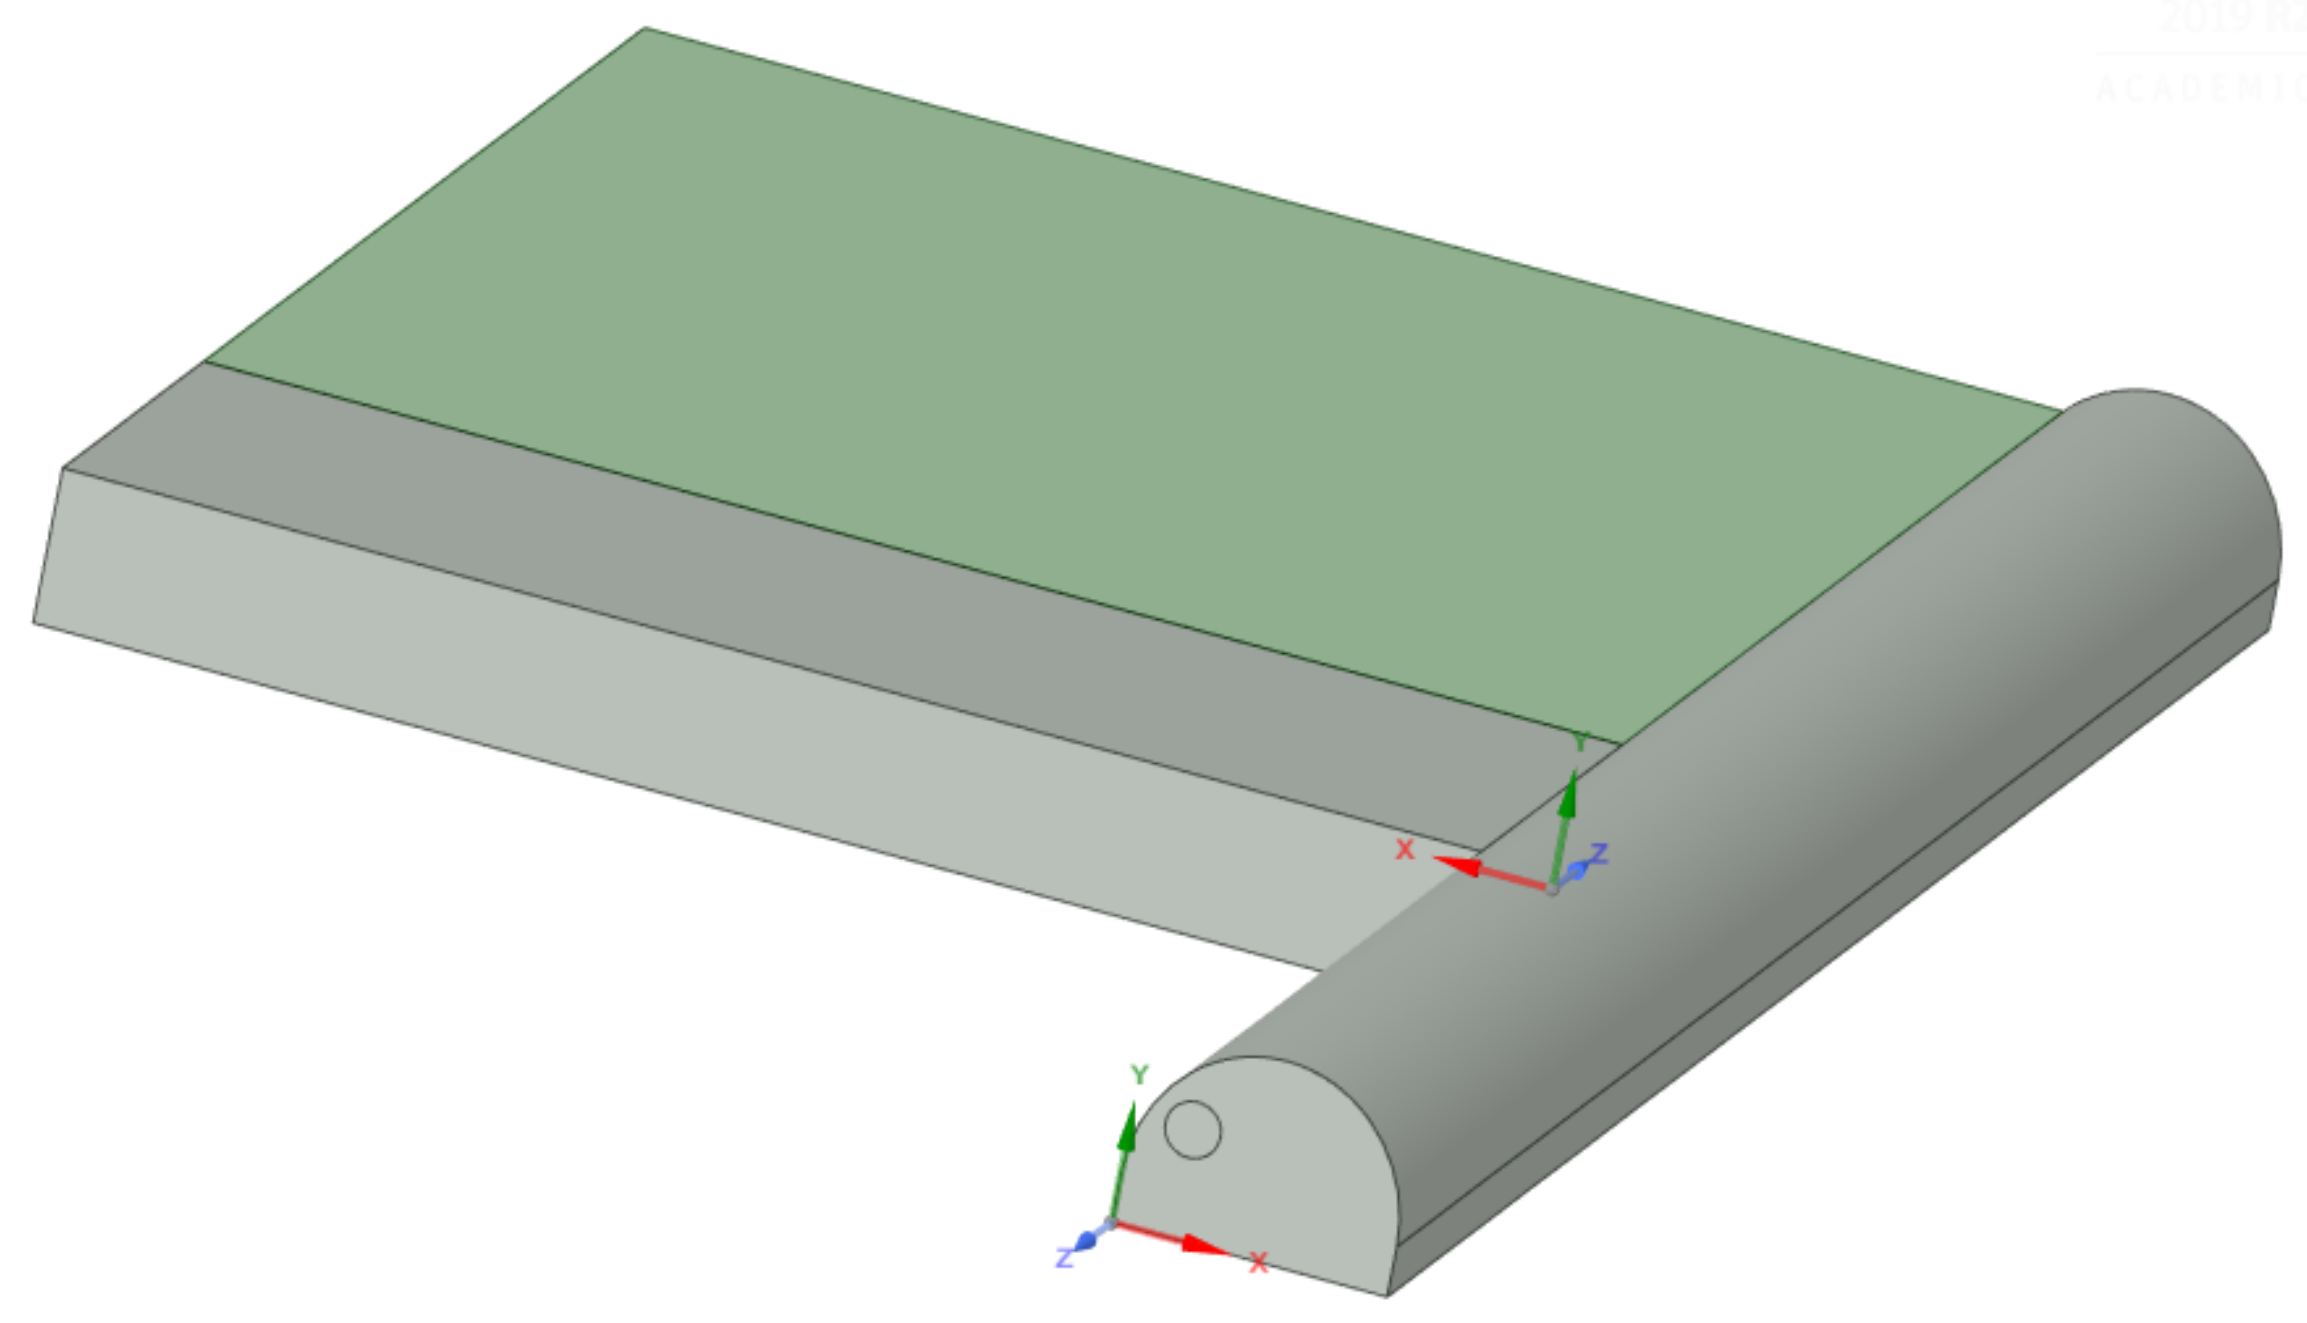
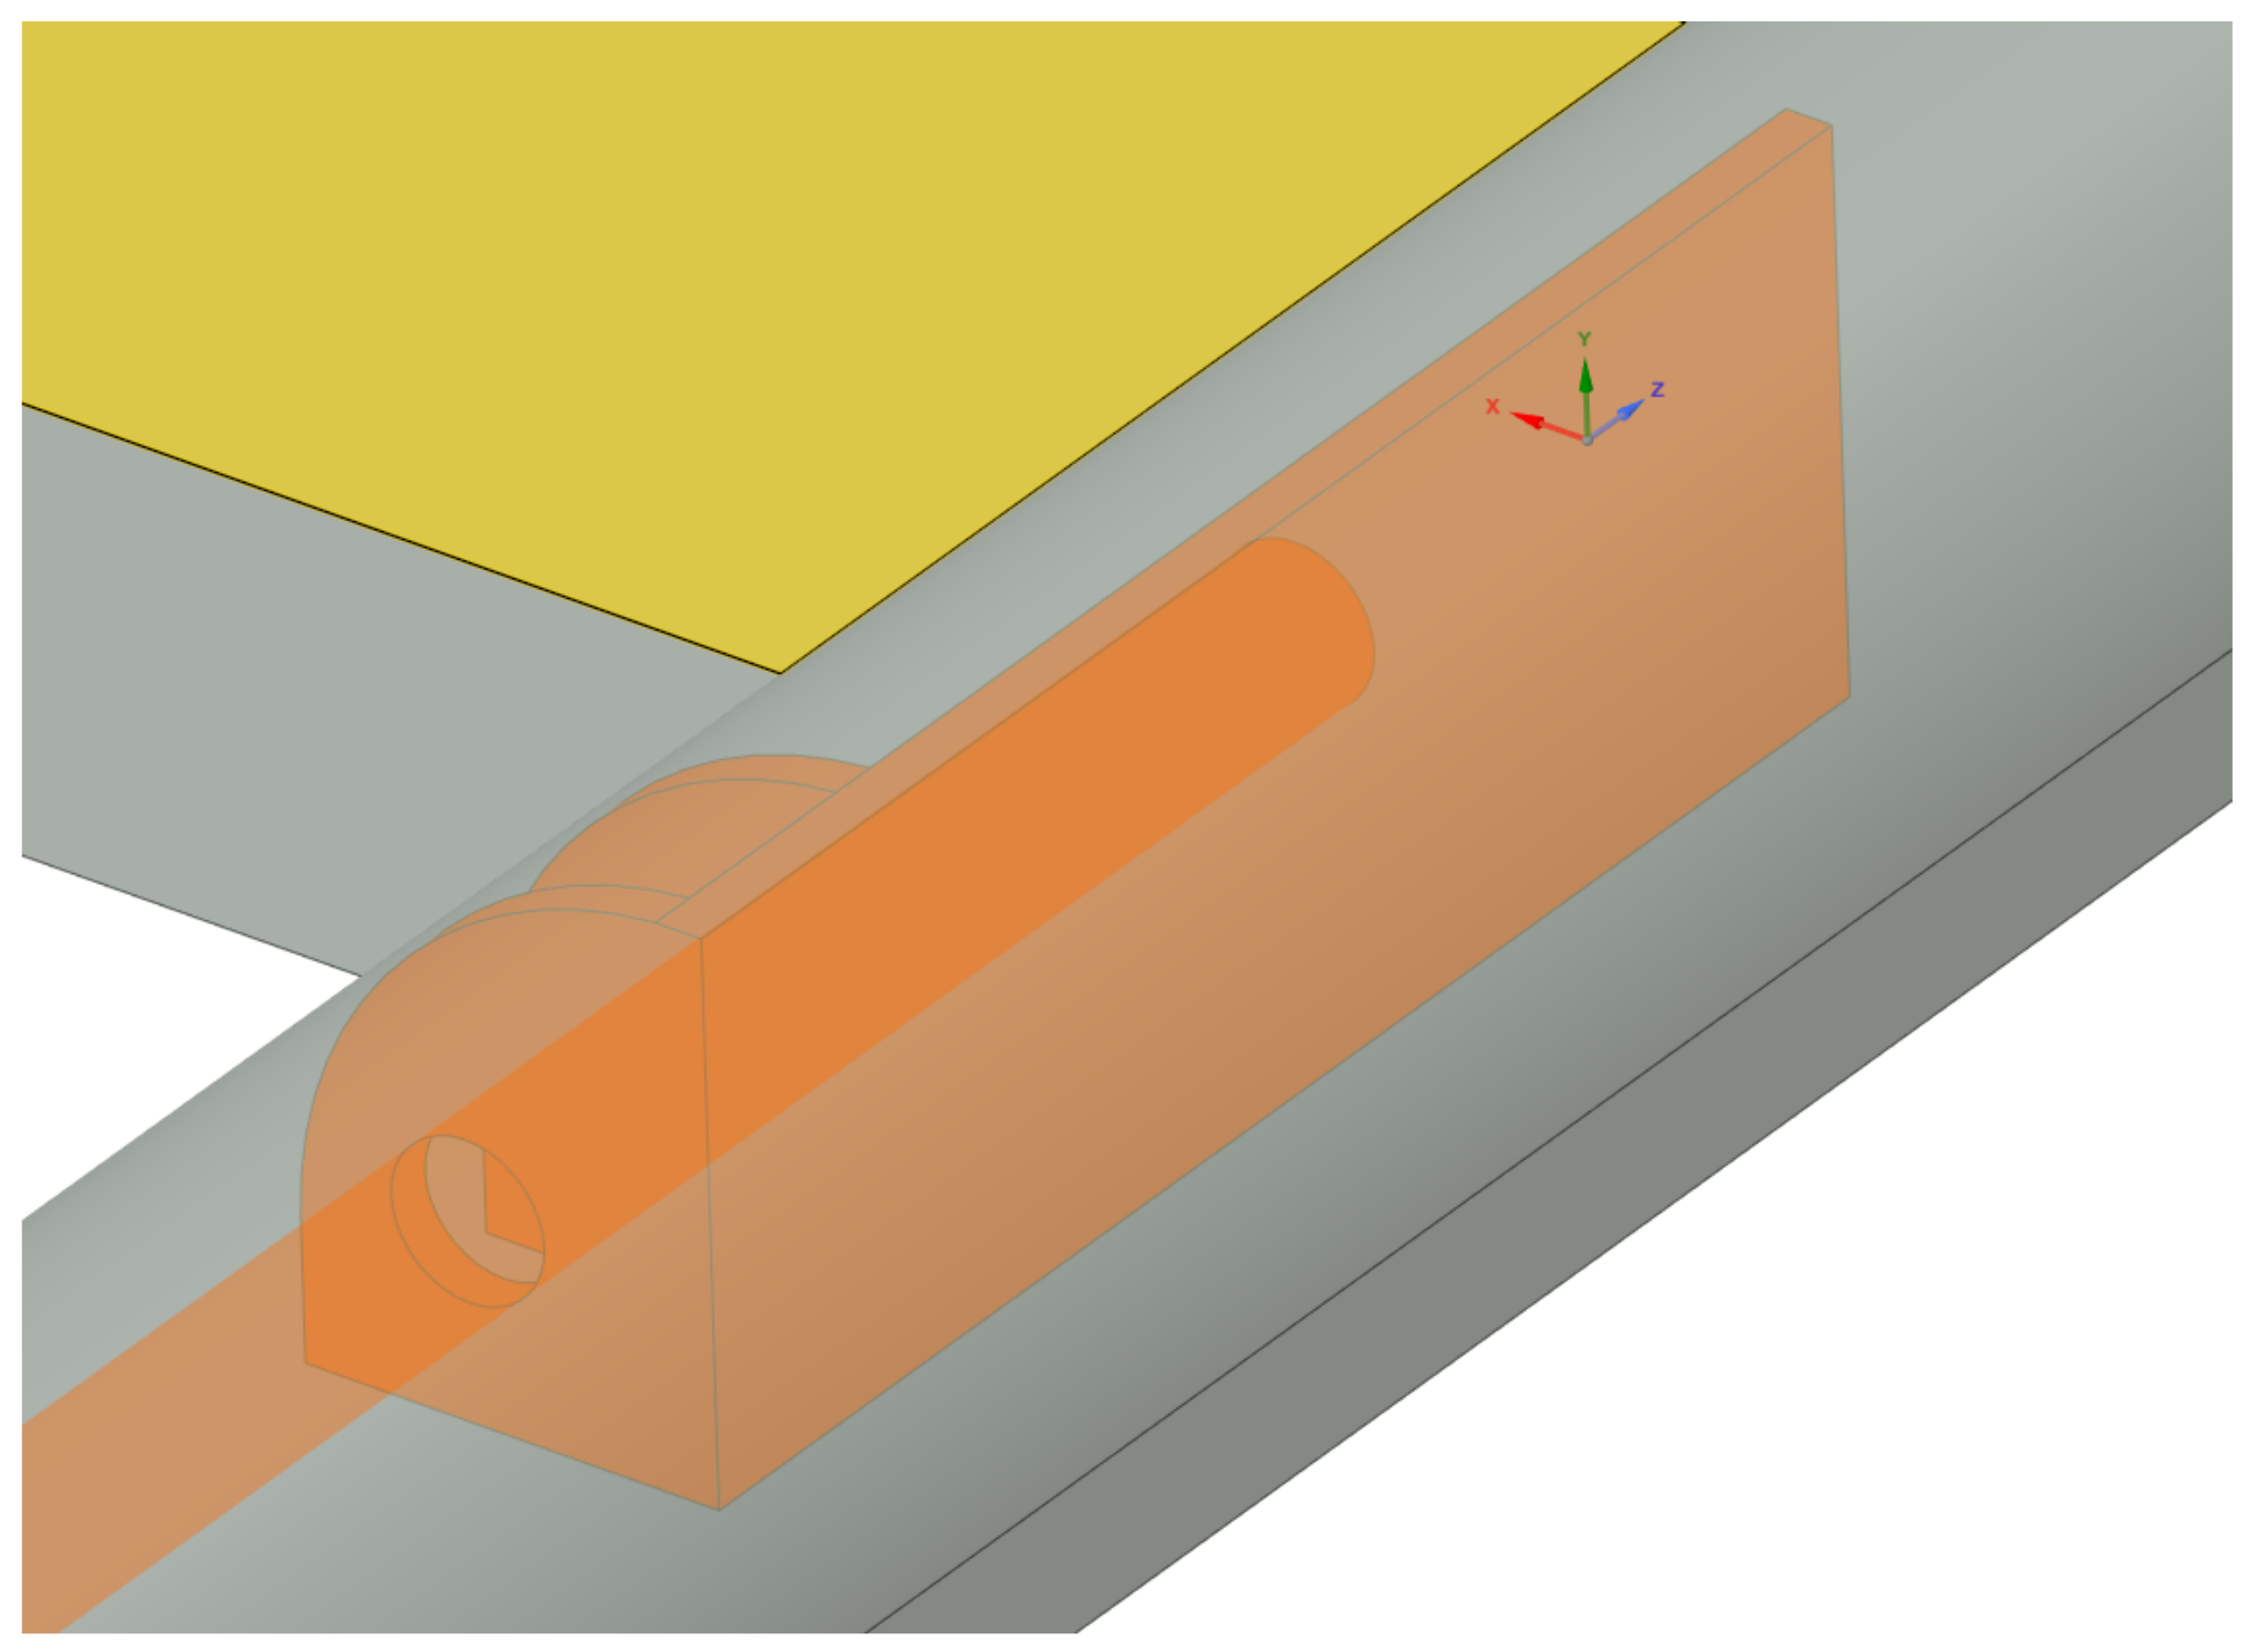
The prepared geometric model parameters included (Figure 3 and Figure 4):
  • A section of the tailgate with an assumed length of 30 m and a 20 m liquidated section with the characteristics of the goaf area with a cross-section of 15.2 m2;
  • Longwall excavation 25 m long, 3 m high, 8 m wide and with an inclination of 0o, the floor of the longwall was 1 m below the floor of the tailgate. This was due to the uplift of the tailgate floor as a result of a high-stress concentration;
  • A section of goafs with an assumed length of 20 m, a height equal to the height of the longwall and a width of 25 m, modeled as a porous medium [33,34,35] (based on tests, it was shown that it is reasonable to assume the height of the goafs to be equal to the height of the longwall);
  • A 10 m long brattice, located 4 m from the cave line in the tailgate;
  • An auxiliary air-duct, 21 m long and diameter of 1 m, located 0.9 m from the excavation floor, with an outlet located 0.5 m from the longwall;
  • A zone filled with sealing foam material from the side of goafs in the liquidated part of the tailgate.
The selection of the most advantageous mesh was based on the evaluation of different mesh quality (Table 1). The authors adopted a tetrahedral grid. The quality parameter values of the adopted mesh are 0.20834 (good) for orthogonal quality and 0.79166 (good) for skewness [32]. The adopted simplifications of the model in relation to the real conditions did not significantly affect the quality of their reproduction, which was confirmed by experimentation and validation of the results based on the actual data.
The primary solver settings are summarized in Table 2.
Based on the measurements and previous experience [35,36,37], the boundary conditions of the model were established. The inflow to the model is indicated in the following planes:
  • inlet_duct—fresh air inlet through a air-duct, velocity inlet—8 m/s,
  • inlet_longwall—an inlet of methane–air mixture inflow to the longwall, velocity inlet—2.5 m/s, CH4—0.01,
  • inlet_longwall_goaf—an inlet of methane–air mixture in the goaf, located parallel to the line of the longwall working, velocity inlet—0.5 m/s, CH4—0.02,
  • inlet_top_goaf—an inlet of methane inflow from the above-laying layers located in the goaf ceiling, velocity inlet–0.03 m/s, CH4—0.04,
  • inlet_bot_goaf—an inlet of methane inflow from below-laying layers located in the bottom of the goaf velocity inlet—0.01 m/s, CH4—0.04.
Due to the short section of the modeled longwall, as a result of the tests performed, it was decided to omit the parameter of methane inflow from the face of the exposed seam. The estimated value of this inflow has been included in the inlet_longwall boundary condition.
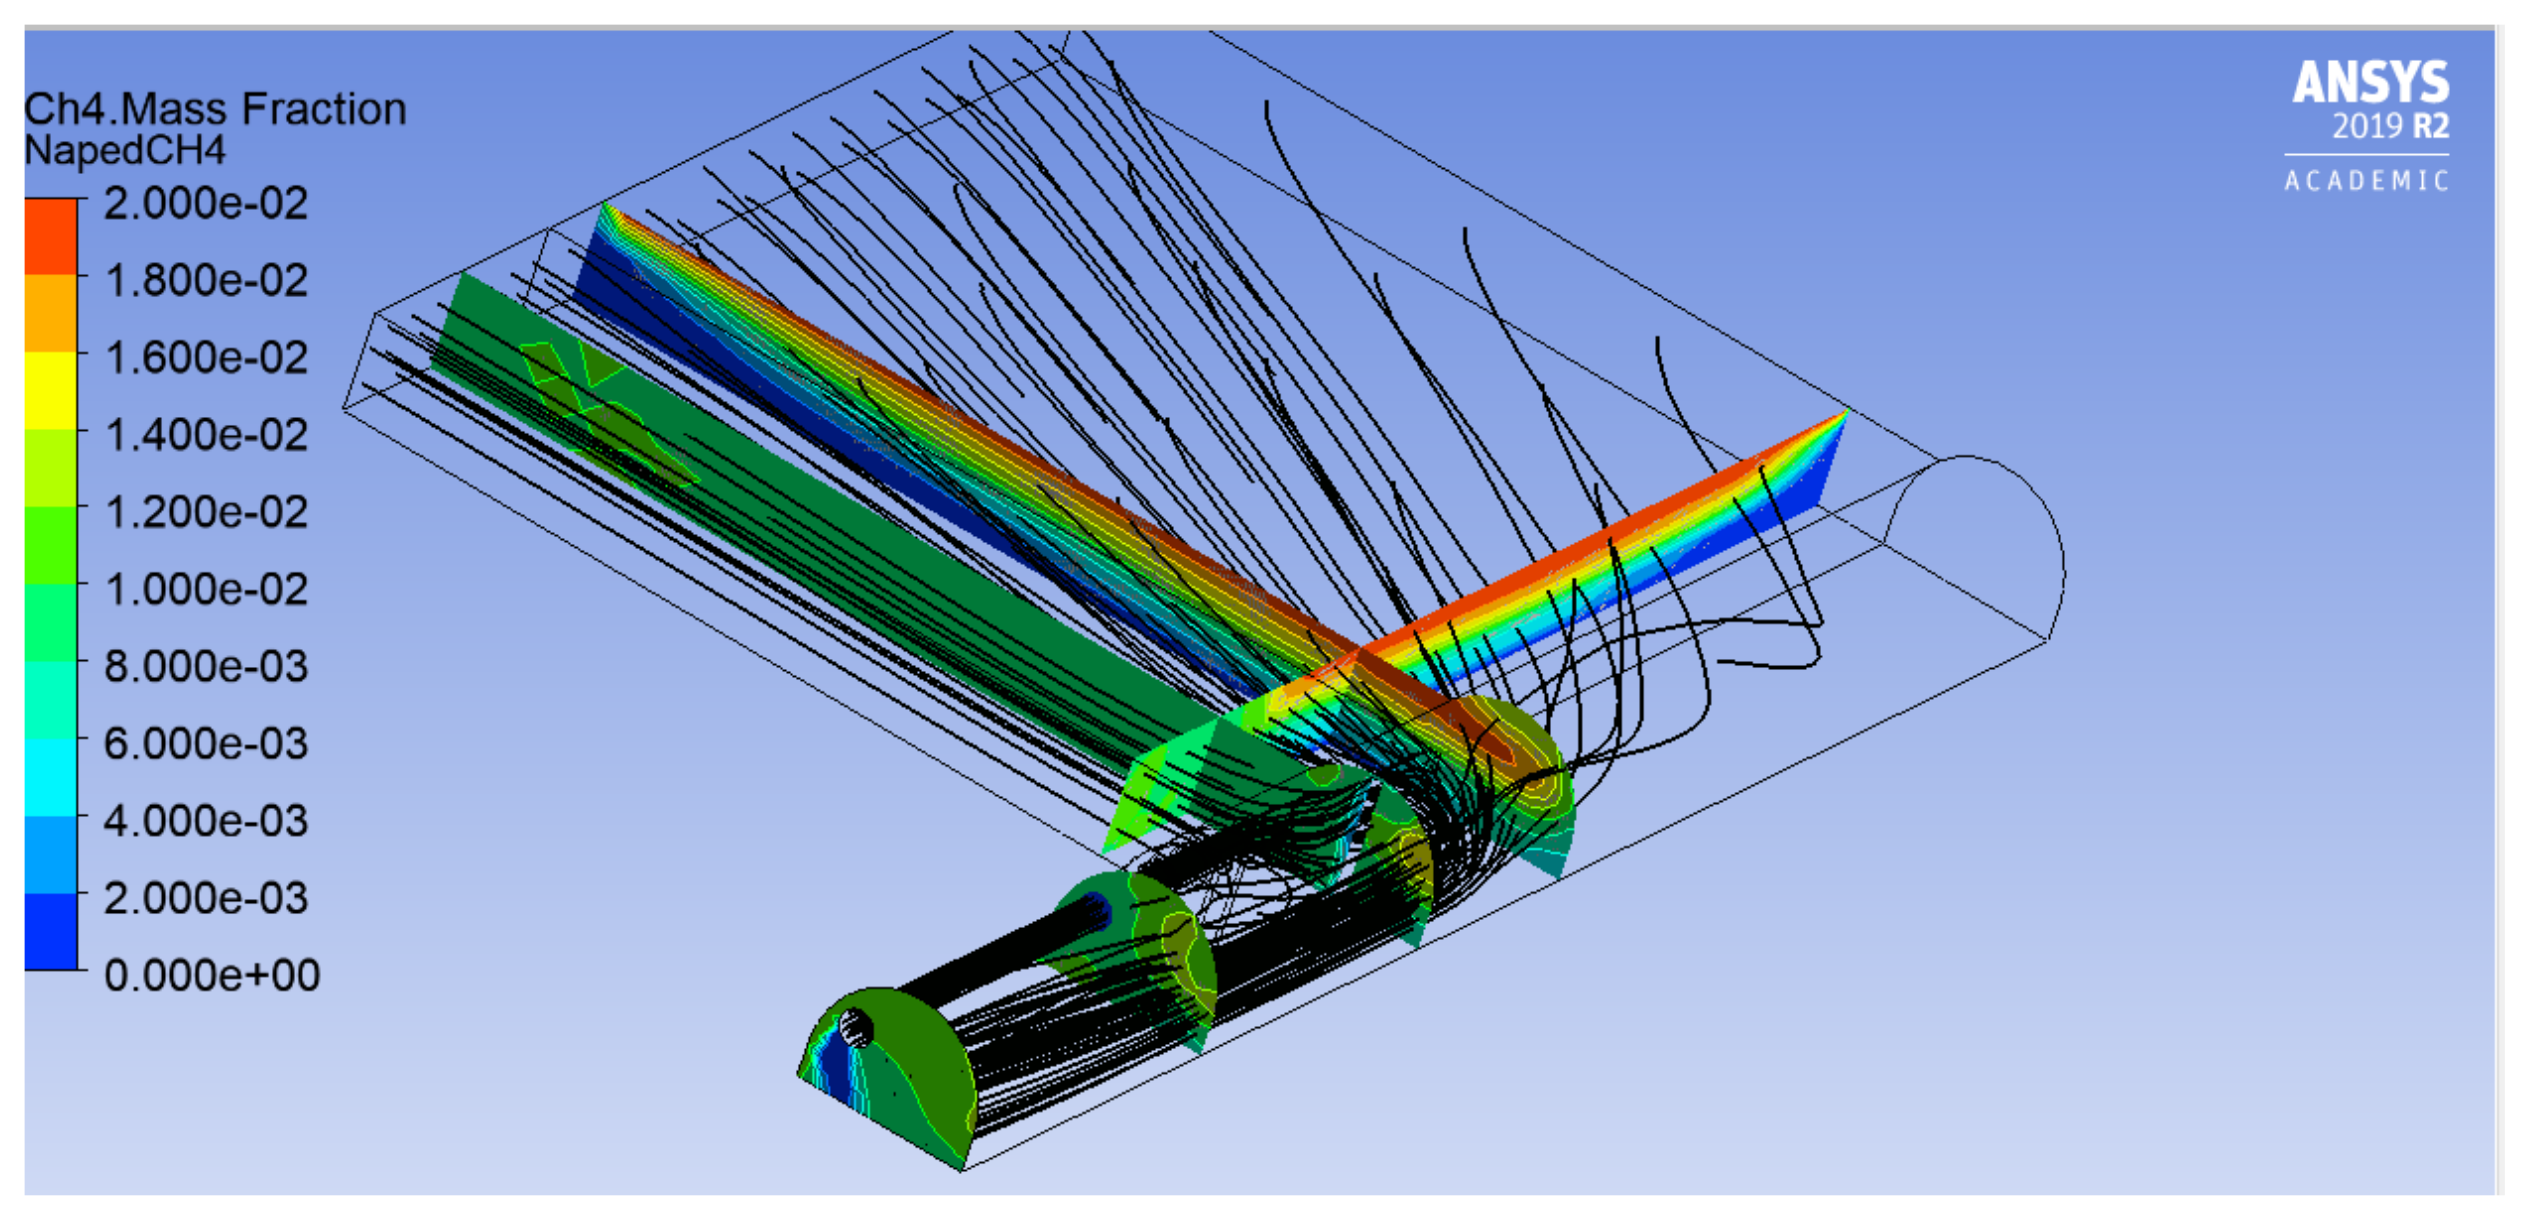
The model calculations made for the geometric configuration and the longwall ventilation parameters obtained as a result of measurements are shown in Figure 5.
The next step was model validation by determining the error values of the modeled concentrations with the actual measurement values in three specific time periods selected from the whole dataset. These periods included data with different ventilation parameters. An additional criterion when selecting the data to be compared with the results of the model tests was that the production volume on a given day and on the preceding days should be as similar as possible. This was to eliminate the influence of this parameter on the distribution of methane concentrations. The verification was performed for the measurements obtained in three locations showing the actual placement of the sensors along the prepared methane concentration result planes (Figure 6):
  • In the longwall: under the ceiling, in the place where the highest concentrations of methane were registered—location above the conveyor drive (sensor A on the AA plane);
  • In the tailgate: under the ceiling, next to the excavation caving line in the mixing zone (sensor B on the BB plane);
  • In the tailgate: opposite to the longwall outlet (sensor C on the CC plane).
The plane located in the tailgate behind the ventilation partition (DD ) was omitted at this stage because the high heterogeneity of the methane–air mixture [37] in this location, which may result in high errors.
The obtained error values for the selected three time periods in the final model were acceptably low. They are presented in Table 3.
To determine the impact of auxiliary ventilation devices placement in the selected configuration variant for the distribution of methane concentrations at the longwall outlet, a model study of thirty-two selected variants was carried out (Table 4). Four selected parameters were modified, while the geometric arrangement of auxiliary ventilation devices constituting the reference point was given above in the assumptions of the model:
  • Δ lp—an increase in the length of the brattice;
  • Δ xp—a change in the position of the brattice along the axis of the tailgate run;
  • Δ hl—an increase in the height of the outlet of the air-duct;
  • Δ xl—a change in the position of the outlet of the air-duct along the axis of the tailgate run.

3. Discussion

Table 4 presents the results of simulated methane concentrations at selected measurement points for the analyzed variants of the location of auxiliary ventilation devices. Indicated results were given for the four analyzed locations of the actual methane sensors (A–D) along the result planes shown on Figure 6. The results are given for two heights in the axis of the excavation (max—under the roof and ½—half of the excavation height).
Firstly, attention should be paid to the slight variability of the results received at the location of the sensors in the longwall above the conveyor drive (sensor A), in the tailgate opposite to the longwall outlet (sensor C) and behind the brattice (sensor D). The obtained results, depending on the variant used, are not regular, and the fluctuations of their values does not exceed the previously determined (Table 1) maximum absolute error of mapping the actual measurements. This confirms a slight influence, contrary to common opinion, of the changes in the geometric parameters of selected for the analysis ventilation devices on the distribution of methane concentrations at the longwall outlet. The influence on this distribution should be sought in terms of the selection and number of auxiliary ventilation devices applied or the possibility of potential failure states occurrence, rather than their geometric arrangement (provided that they were properly placed regarding the mining practice).
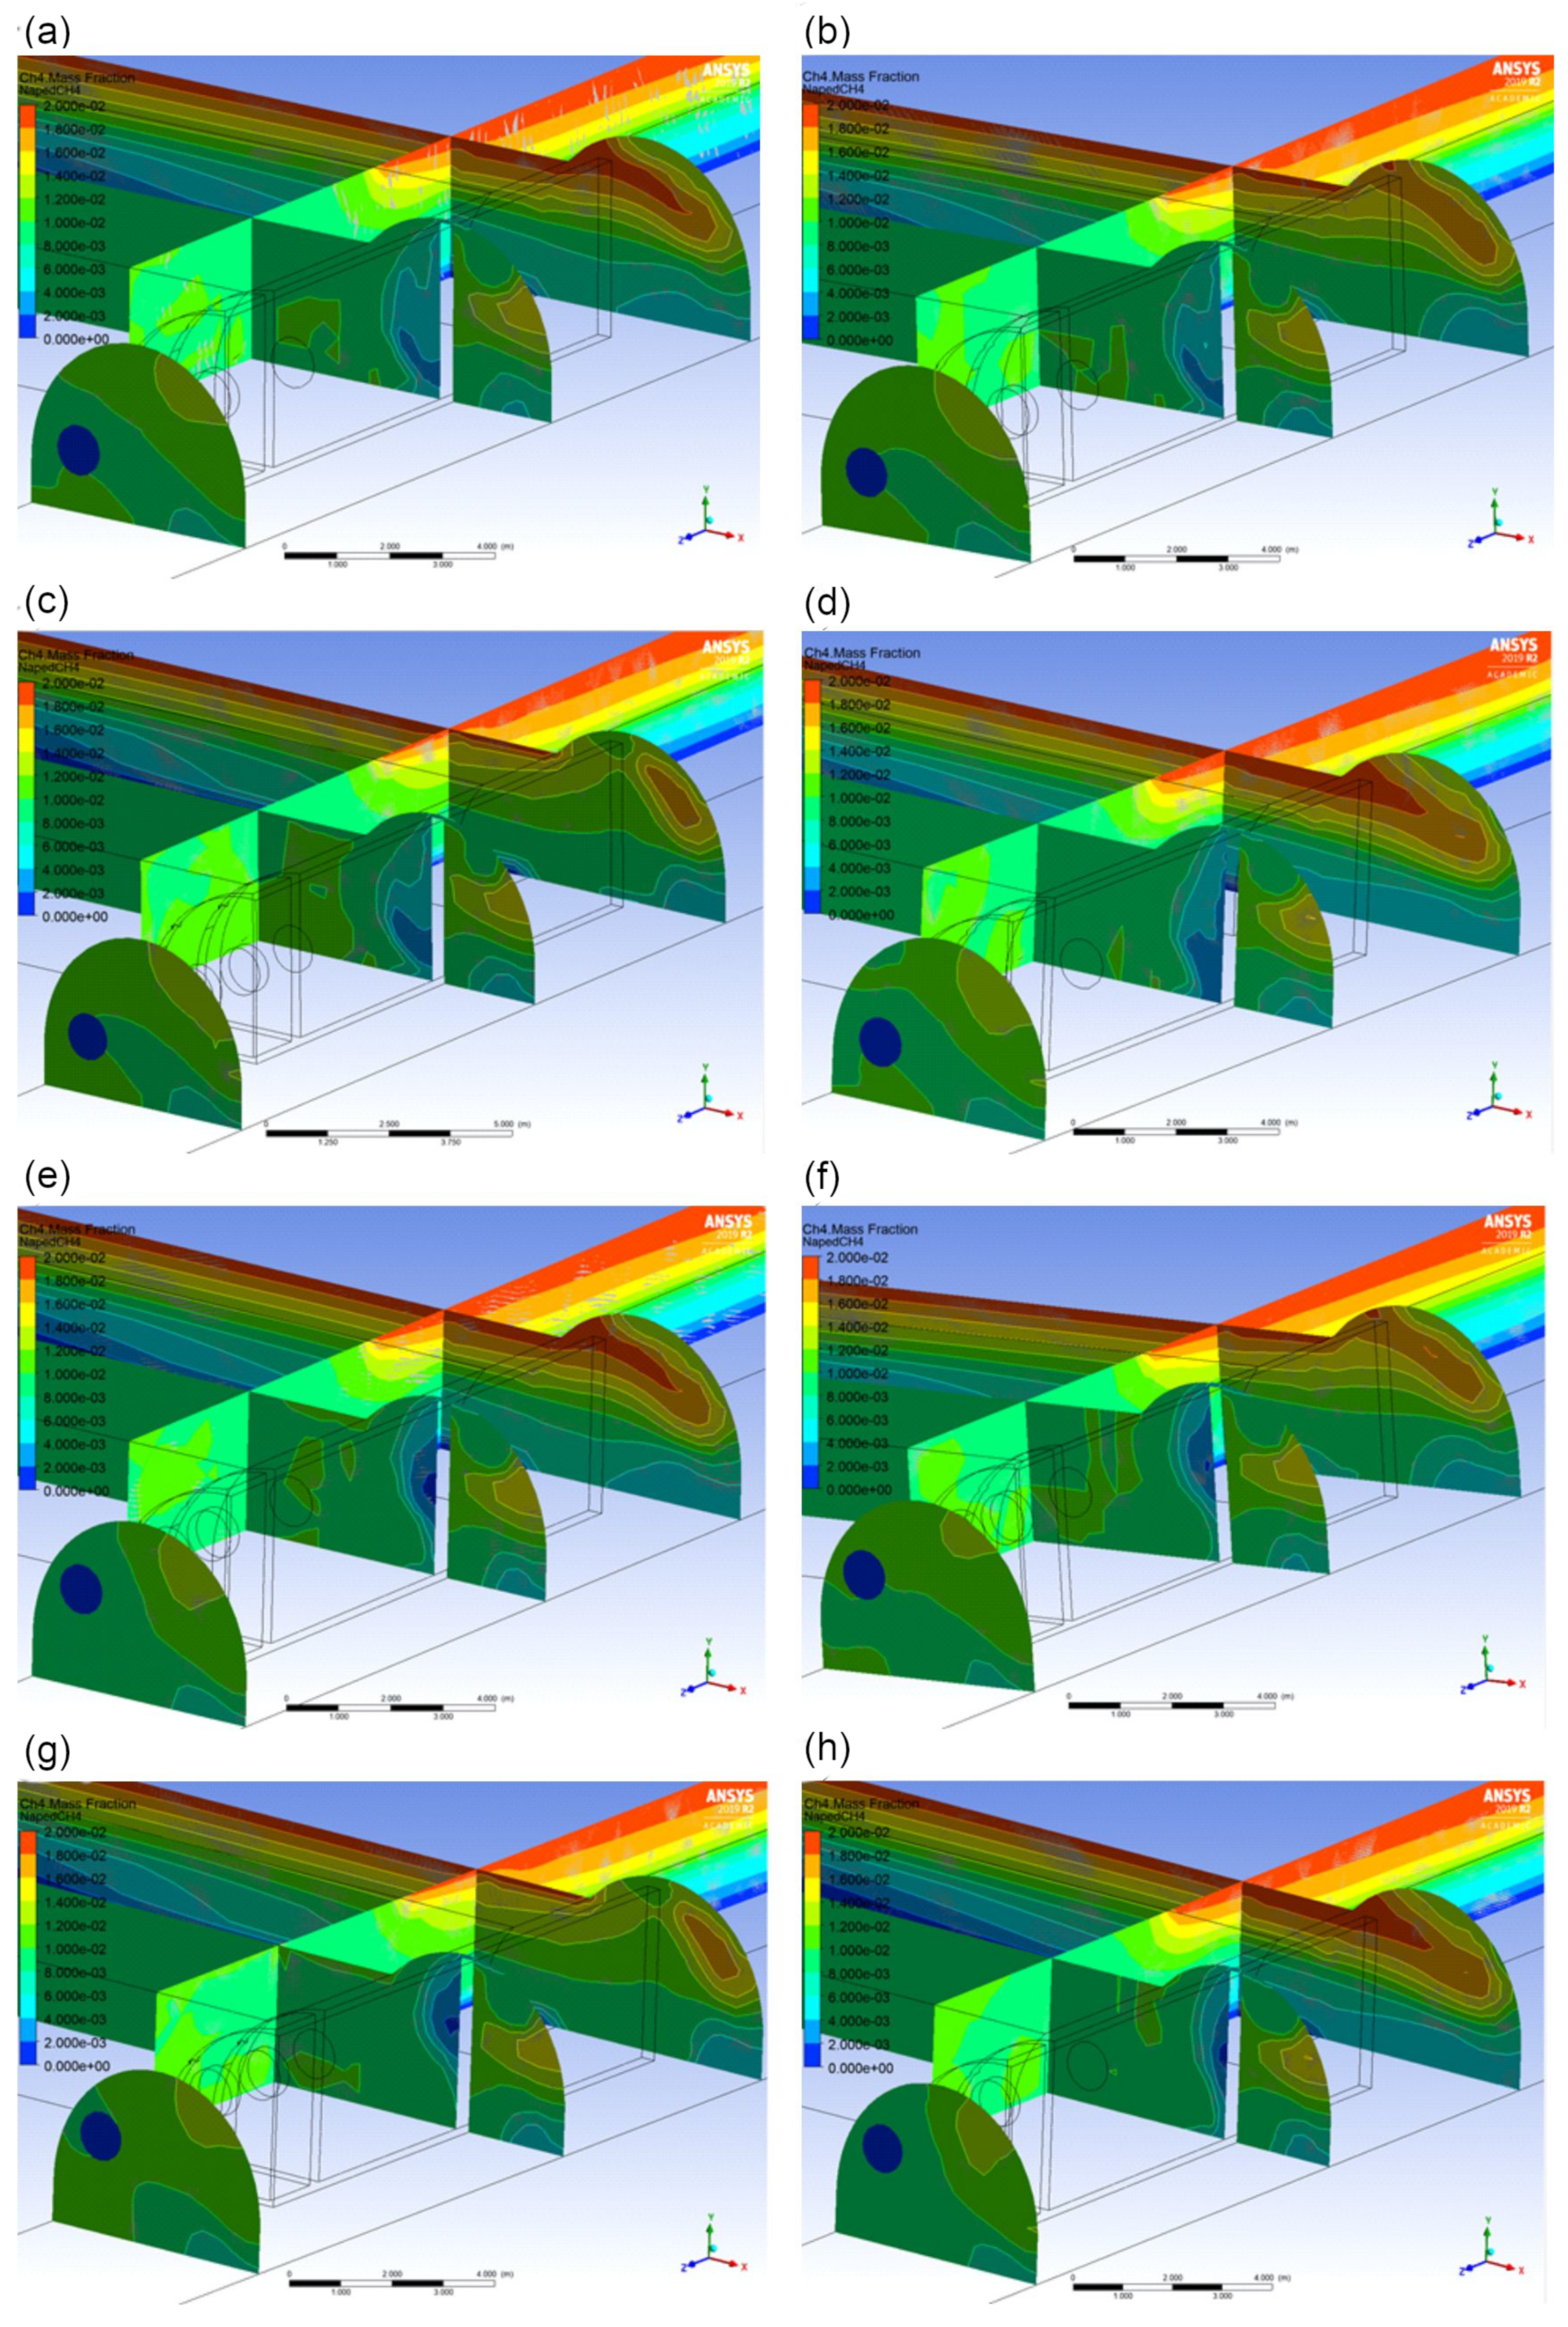
The only significant variation in the simulated methane concentrations was recorded on the result plane in the location of the methane sensor B, i.e., in the so-called mixing zone, near the tailgate caving line (Figure 7). The minimum and maximum values of the simulated concentrations in the set are bolded in Table 5. This is the result of moving the end of brattice towards the liquidated part of the tailgate, which is also associated with the shift of the mixing zone itself. Regrettably, such action may cause an increased outflow of methane from the goafs in the final section of the longwall from behind the powered support section, due to the increased aerodynamic drag in the tailgate.
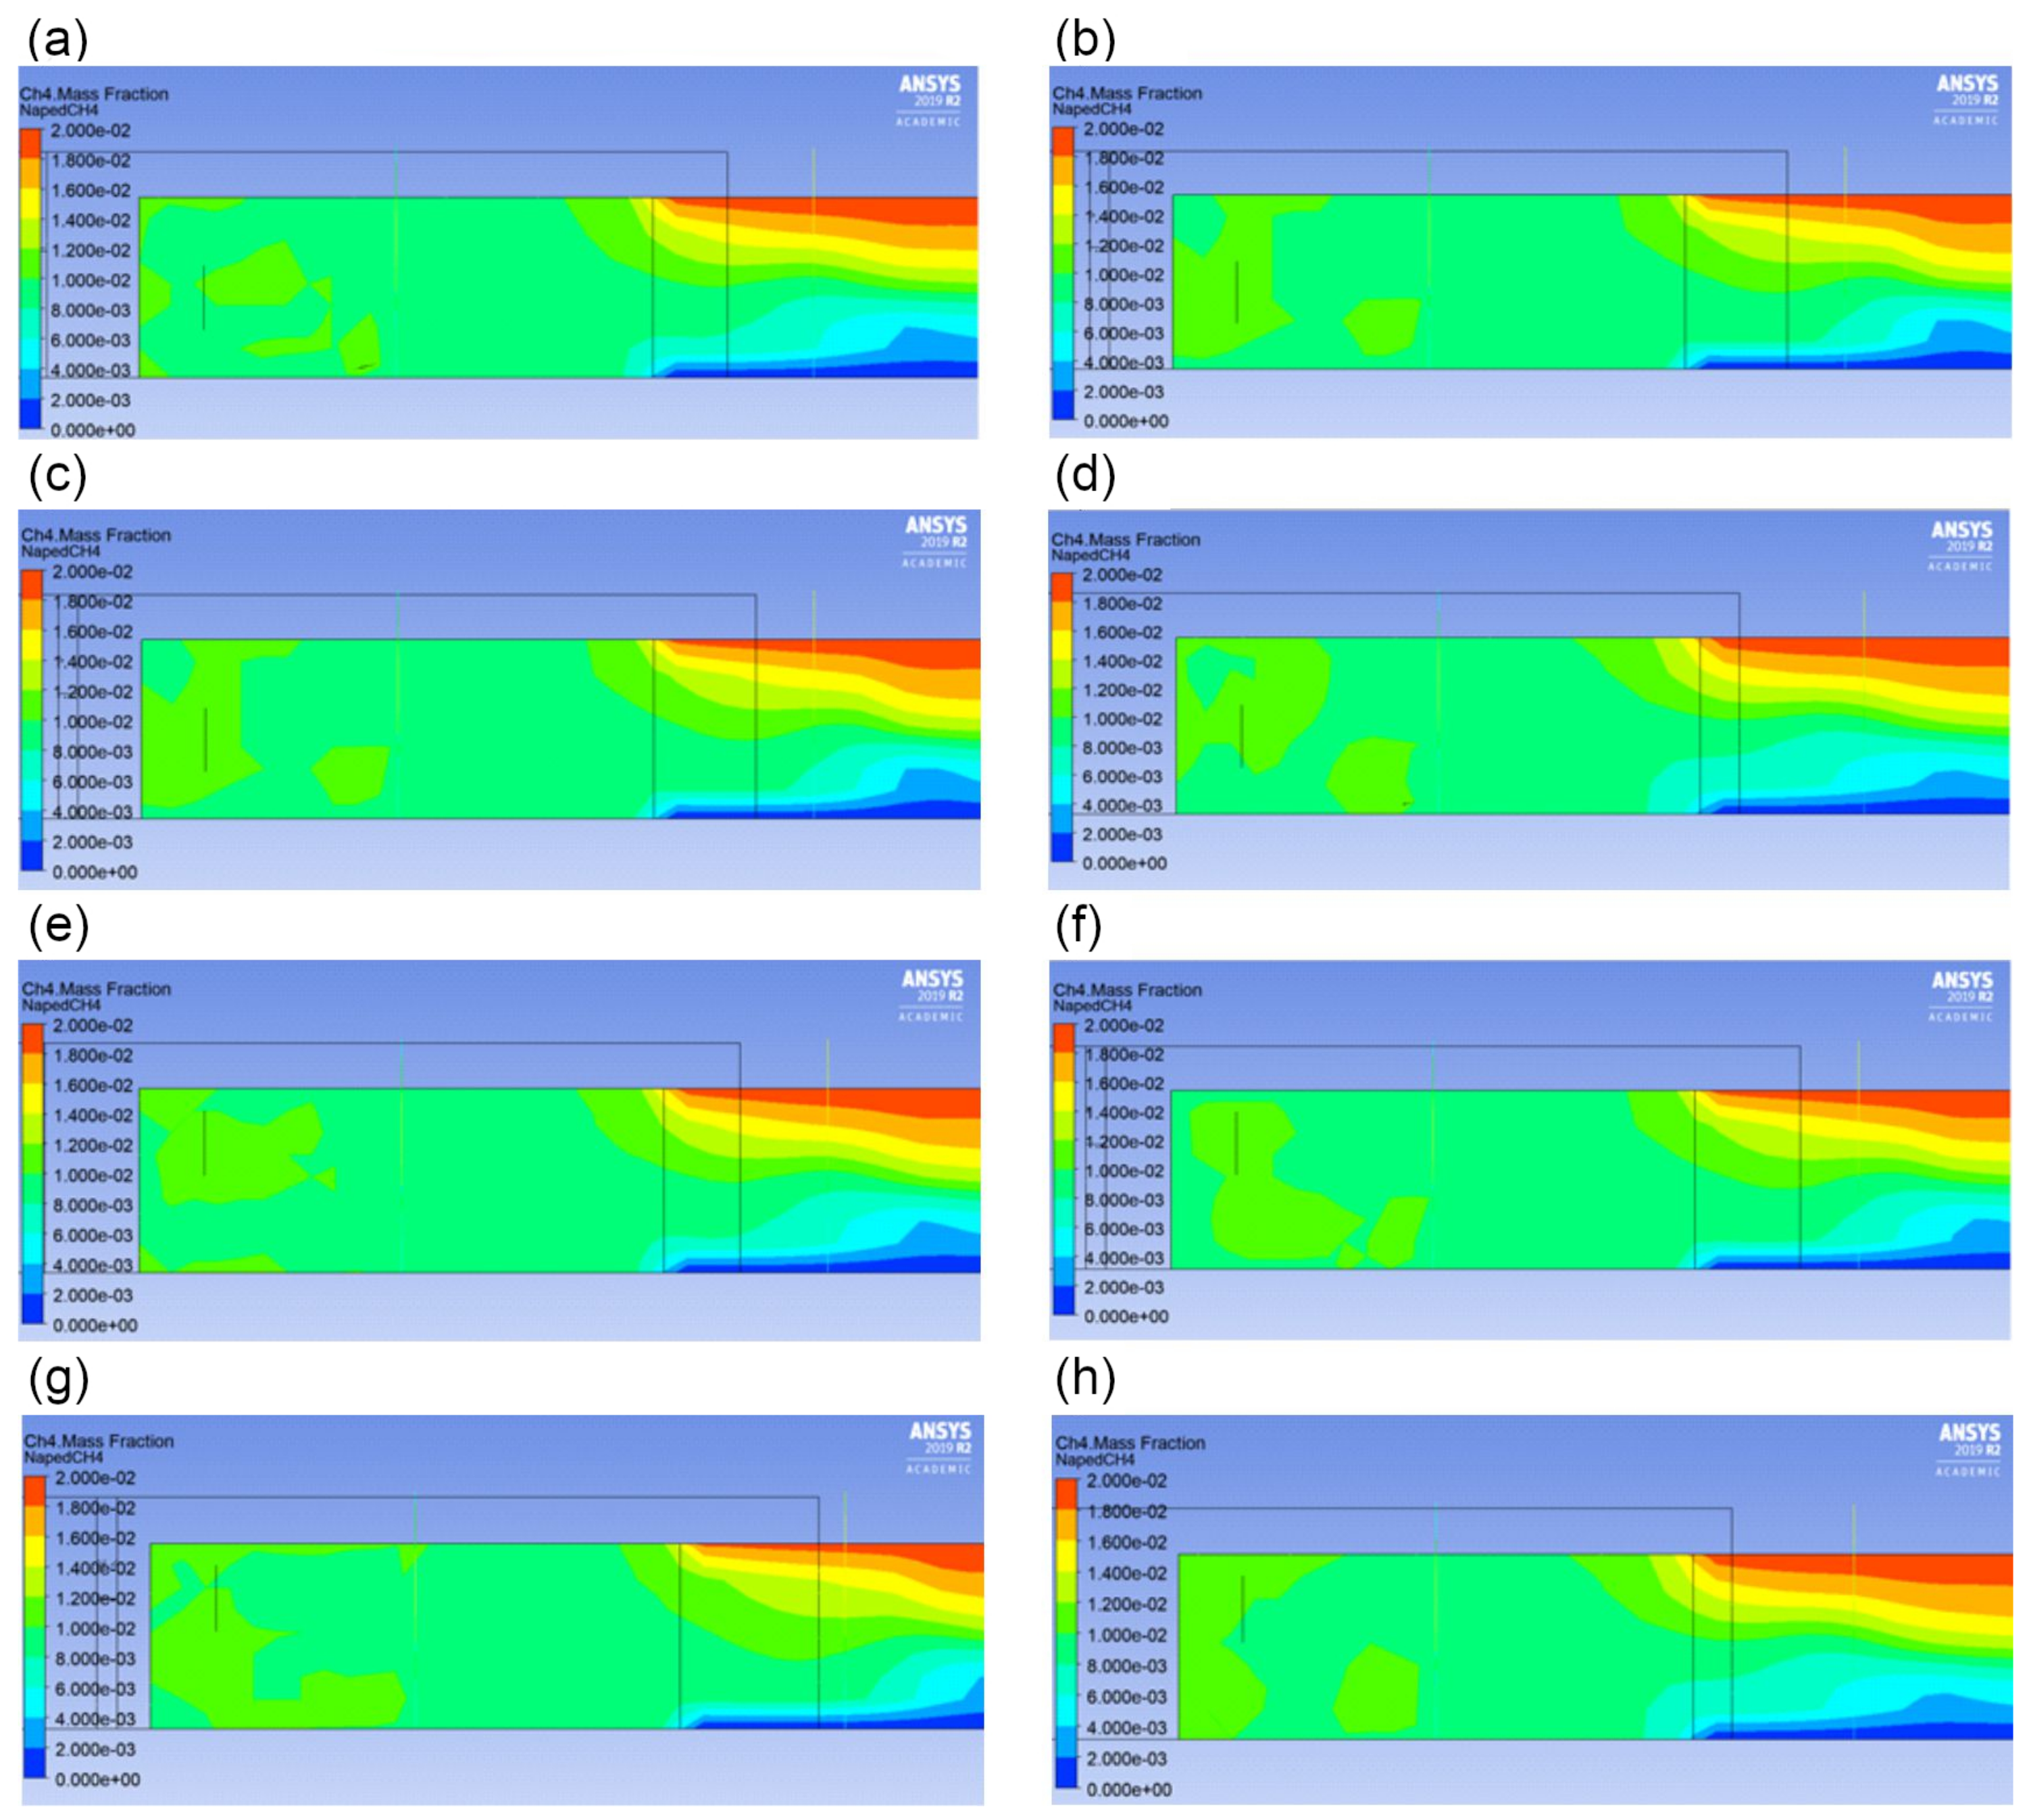
Result planes for selected variants are presented on Figure 7 and Figure 8. Cross-sections of the remaining variants due to their number are available in the external repository Supplementary Materials.
Despite the lack of research on the impact of the auxiliary devices’ location in the tailgate on the methane concentration distribution, the obtained results are consistent with suspected distribution. The general distribution coincides with the previously conducted in situ tests performed in a similar working equipped with a brattice and air-duct [37]. The greatest accumulation of methane occurs in the zones where methane sensors are usually located, i.e., under the ceiling in the mixing zone and on the tailgate wall opposite to the longwall outlet. It is also consistent with the results of in situ and model studies on methane concentration distribution in tailgates, in which no auxiliary ventilation devices were used [20,23].
However, it should be recognized that the model studies carried out are subject to certain simplifications both from the perspective of equipment and workings geometry and initial conditions. In particular, it concerns the goaf section, where due to its nature it is not possible to perform detailed measurements of methane concentration distribution. Hence, it is necessary to rely on theoretical distributions. In spite of these limitations, as shown by other research carried out in the longwall areas, the obtained results are characterised by a sufficient accuracy and make it possible to observe phenomena that are interesting for research purposes and further application. The methane hazard itself may also be highly dynamic, and with this in mind, the authors of this publication have conducted research for steady conditions in ventilationally stable periods.

4. Conclusions

The application of auxiliary ventilation devices, in particular a brattice and an auxiliary air-duct, is an undoubtedly effective method of mitigation the level of methane hazard in a longwall outlet. The cross-sections with simulated methane concentrations show a clear separation of dangerous methane accumulations from crucial working areas. These include, first of all, the outlet of the longwall excavation, by the sidewall, where the driver of the scraper conveyor is located. Nevertheless, the subject of this study was to verify the thesis that the arrangement of these elements in the crossing geometry had a significant impact on the effectiveness of methane hazard prevention. The conducted analyzes clearly show that, despite the common opinions, this thesis cannot be confirmed. The greater effectiveness of methane hazard prevention may be potentially achieved by supplementing the devices configuration with additional elements, thus increasing the aerodynamic drag of the longwall working at its end section. Such actions, however, require a more extensive examination, as too high resistance at longwall outlet cause undesirable migration of methane to the working in its earlier section. A slight undesirable influence of the parameters and the arrangement was demonstrated only in the configurations described M_9, M_12, M_13 and M_16. This variants concerned the extension of the brattice without changing its location or moving it away from the tailgate caving line without changing the position of the air-duct outlet in the working axis at the same time. Such actions reduced the effectiveness of the auxiliary air-duct operation. It should also be pointed out that the models M_11 and M_15, indicating a slight decrease in the simulated concentrations, may, however, be unfavourable from the point of view of fire prevention. Increasing the airflow path and shifting the mixing zone further towards the tailgate caving line may cause re-migration of air to the goaf and the risk of endogenous fire.

Supplementary Materials

The following supporting information can be downloaded at: https://www.mdpi.com/article/10.3390/en15103672/s1, Figure S1: Methane concentration distribution at the AA plane: configuration M_1; Figure S2: Methane concentration distribution at the AA plane: configuration M_2; Figure S3: Methane concentration distribution at the AA plane: configuration M_3; Figure S4: Methane concentration distribution at the AA plane: configuration M_4; Figure S5: Methane concentration distribution at the AA plane: configuration M_5; Figure S6: Methane concentration distribution at the AA plane: configuration M_6; Figure S7: Methane concentration distribution at the AA plane: configuration M_7; Figure S8: Methane concentration distribution at the AA plane: configuration M_8; Figure S9: Methane concentration distribution at the AA plane: configuration M_17; Figure S10: Methane concentration distribution at the AA plane: configuration M_18; Figure S11: Methane concentration distribution at the AA plane: configuration M_19; Figure S12: Methane concentration distribution at the AA plane: configuration M_20; Figure S13: Methane concentration distribution at the AA plane: configuration M_21; Figure S14: Methane concentration distribution at the AA plane: configuration M_22; Figure S15: Methane concentration distribution at the AA plane: configuration M_23; Figure S16: Methane concentration distribution at the AA plane: configuration M_24; Figure S17: Methane concentration distribution at the AA plane: configuration M_25; Figure S18: Methane concentration distribution at the AA plane: configuration M_26; Figure S19: Methane concentration distribution at the AA plane: configuration M_27; Figure S20: Methane concentration distribution at the AA plane: configuration M_28; Figure S21: Methane concentration distribution at the AA plane: configuration M_29; Figure S22: Methane concentration distribution at the AA plane: configuration M_30; Figure S23: Methane concentration distribution at the AA plane: configuration M_31; Figure S24: Methane concentration distribution at the AA plane: configuration M_32; Figure S25: Methane concentration at selected result planes: configuration M_1; Figure S26: Methane concentration at selected result planes: configuration M_2; Figure S27: Methane concentration at selected result planes: configuration M_3; Figure S28: Methane concentration at selected result planes: configuration M_4; Figure S29: Methane concentration at selected result planes: configuration M_5; Figure S30: Methane concentration at selected result planes: configuration M_6; Figure S31: Methane concentration at selected result planes: configuration M_7; Figure S32: Methane concentration at selected result planes: configuration M_8; Figure S33: Methane concentration at selected result planes: configuration M_17; Figure S34: Methane concentration at selected result planes: configuration M_18; Figure S35: Methane concentration at selected result planes: configuration M_19; Figure S36: Methane concentration at selected result planes: configuration M_20; Figure S37: Methane concentration at selected result planes: configuration M_21; Figure S38: Methane concentration at selected result planes: configuration M_22; Figure S39: Methane concentration at selected result planes: configuration M_23; Figure S40: Methane concentration at selected result planes: configuration M_24; Figure S41: Methane concentration at selected result planes: configuration M_25; Figure S42: Methane concentration at selected result planes: configuration M_26; Figure S43: Methane concentration at selected result planes: configuration M_27; Figure S44: Methane concentration at selected result planes: configuration M_28; Figure S45: Methane concentration at selected result planes: configuration M_29; Figure S46: Methane concentration at selected result planes: configuration M_30; Figure S47: Methane concentration at selected result planes: configuration M_31; Figure S48: Methane concentration at selected result planes: configuration M_32.

Author Contributions

Conceptualization, A.P.N., G.P., Z.R., P.W. and D.M.; methodology, A.P.N.; validation, A.P.N., G.P., Z.R., P.W., D.M., P.Z. and M.S.; formal analysis, A.P.N., G.P., Z.R., P.W. and D.M.; investigation, A.P.N.; data curation, A.P.N.; writing—original draft preparation, A.P.N.; writing—review and editing, A.P.N., G.P., Z.R., P.W. and D.M.; visualization, A.P.N., G.P., Z.R., P.W. and D.M. All authors have read and agreed to the published version of the manuscript.

Funding

This research was funded by the Department of Mining, Silesian University of Technology, grant number 06/050/BKM18/0061.

Data Availability Statement

Not applicable.

Conflicts of Interest

The authors declare no conflict of interest.

References

  1. Li, H.; Deng, J.; Chen, X.; Shu, C.M.; Kuo, C.H.; Zhai, X.; Wang, Q.; Hu, X. Qualitative and quantitative characterisation for explosion severity and gaseous–solid residues during methane–coal particle hybrid explosions: An approach to estimating the safety degree for underground coal mines. Process Saf. Environ. Prot. 2020, 141, 150–160. [Google Scholar] [CrossRef]
  2. Liu, H.; Mao, S.; Li, M. A Case Study of an Optimized Intermittent Ventilation Strategy Based on CFD Modeling and the Concept of FCT. Energies 2019, 12, 721. [Google Scholar] [CrossRef] [Green Version]
  3. Niewiadomski, A.P.; Badura, H.; Pach, G. Recommendations for methane prognostics and adjustment of short-term prevention measures based on methane hazard levels in coal mine longwall. E3S Web Conf. 2021, 266, 08001. [Google Scholar] [CrossRef]
  4. Ray, S.K.; Khan, A.M.; Mohalik, N.K.; Mishra, D.; Mandal, S.; Pandey, J.K. Review of preventive and constructive measures for coal mine explosions: An Indian perspective. Int. J. Min. Sci. Technol. 2022, in press. [Google Scholar] [CrossRef]
  5. Shi, L.; Wang, J.; Zhang, G.; Cheng, X.; Zhao, X. A risk assessment method to quantitatively investigate the methane explosion in underground coal mine. Process Saf. Environ. Prot. 2017, 107, 317–333. [Google Scholar] [CrossRef]
  6. Szlązak, N.; Korzec, M.; Piergies, K. The Determination of the Methane Content of Coal Seams Based on Drill Cutting and Core Samples from Coal Mine Roadway. Energies 2022, 15, 178. [Google Scholar] [CrossRef]
  7. Cygankiewicz, J.; Prusek, S. Zagrożenia aerologiczne w kopalniach węgla kamiennego – profilaktyka, zwalczanie, modelowanie, monitoring; Wydawnictwo Głównego Instytutu Górnictwa: Katowice, Poland, 2013. [Google Scholar]
  8. Konopko, W. Bezpieczeństwo pracy w kopalniach węgla kamiennego. Tom 2: Zagrożenia naturalne; Wydawnictwo Głównego Instytutu Górnictwa: Katowice, Poland, 2013. [Google Scholar]
  9. WorkSafe New Zeland. Ventilation in Underground Mines and Tunnels. Approved Code of Practice. New Zeland Goverment. Available online: https://worksafe.govt.nz/dmsdocument/140-acop-ventilation-in-underground-mines-and-tunnels (accessed on 10 January 2022).
  10. Salamonowicz, Z.; Krauze, A.; Majder-Lopatka, M.; Dmochowska, A.; Piechota-Polanczyk, A.; Polanczyk, A. Numerical Reconstruction of Hazardous Zones after the Release of Flammable Gases during Industrial Processes. Processes 2021, 9, 307. [Google Scholar] [CrossRef]
  11. Botao, Q.; Lin, L.; Dong, M.; Yi, L.; Zhong, X.; Jia, Y. Control technology for the avoidance of the simultaneous occurence of a methane explosion and spontaneous coal combustion in a coal mine: Case study. Process Saf. Environ. Prot. 2016, 103, 203–211. [Google Scholar]
  12. Qin, J.; Qu, Q.; Guo, H. CFD simulations for longwall gas drainage design optimisation. Int. J. Min. Sci. Technol. 2017, 27, 777–782. [Google Scholar] [CrossRef]
  13. Zapletal, P.; Kosowski, M. Selection of methane collector diameter based on computer simulationof fluid mechanics in mining and geological conditions JSW S.A. Prz. Gor. 2020, 76, 34–38. [Google Scholar]
  14. Cao, J.; Li, W. Numerical simulation of gas migration into mining-induced fracture network in the goaf. Int. J. Min. Sci. Technol. 2017, 27, 681–695. [Google Scholar] [CrossRef]
  15. Skotniczy, P. Three-dimensional numerical simulation of the mass exchange between longwall headings and goafs, in the pressence of methane drainage in U-type ventillated longwall. Arch. Min. Sci. 2013, 58, 705–718. [Google Scholar]
  16. Wang, G.Q.; Shi, G.Q.; Wang, Y.M.; Shen, H.Y. Numerical study on the evolution of methane explosion regions in the process of coal mine fire zone sealing. Fuel 2021, 289, 119744. [Google Scholar] [CrossRef]
  17. Juganda, A.; Strebinger, C.; Brune, J.F.; Bogin, G.E., Jr. Computational Fluid Dynamics Modeling of a Methane Gas Explosion in a Full-Scale, Underground Longwall Coal Mine. Min. Metall. Exploaration 2022, 39, 897–916. [Google Scholar] [CrossRef]
  18. Hasheminasab, F.; Bagherpour, R.; Aminossadati, S.M. Numerical simulation of methane distribution in development zones of underground coal mines equipped with auxiliary ventilation. Tunn. Undergr. Space Technol. 2019, 89, 68–77. [Google Scholar] [CrossRef]
  19. Zhou, L.; Pritchard, C.; Zheng, Y. CFD modeling of methane distribution at a continuous miner face with various curtain setback distances. Int. J. Min. Sci. Technol. 2015, 25, 635–640. [Google Scholar] [CrossRef]
  20. Mishra, D.P.; Kumar, P.; Panigrahi, D.C. Dispersion of methane in tailgate of a retreating longwall mine: A computational fluid dynamics study. Env. Earth Sci 2016, 75, 475. [Google Scholar] [CrossRef]
  21. Daloğlu, G.; Önder, M.; Parra, T. Modeling of Methane and Air Velocity Behavior in an Auxiliary Ventilated Coal Heading. Arch. Min. Sci. 2021, 66, 69–84. [Google Scholar]
  22. Kurnia, J.C.; Sasmito, A.P.; Majumdar, A.S. CFD simulation of methane dispersion and innovative methane management in underground mining faces. Appl. Math. Model. 2014, 38, 3467–3484. [Google Scholar] [CrossRef]
  23. Wierzbiński, K. Wykorzystanie metod CFD w prognozowaniu przestrzennym rozkładu koncentracji metanu w chodniku wentylacyjnym–opracowanie i walidacja modeli numerycznych 3D. Przegląd Górniczy 2016, 72, 44–55. [Google Scholar]
  24. Janoszek, T.; Krawczyk, J. Methodology Development and Initial Results of CFD Simulations of Methane Distribution in the Working of a Longwall Ventilated in a Short “Y” Manner. Arch. Min. Sci. 2022, 67, 3–24. [Google Scholar]
  25. Borowski, M.; Kuczera, Z. Comparison of Methane Control Methods in Polish and Vietnamese Coal Mines. E3S Web Conf. 2018, 35, 01004. [Google Scholar] [CrossRef] [Green Version]
  26. Wierzbiński, K. Geometria skrzyżowań ścian z chodnikami wentylacyjnymi – konfiguracja pomocniczych urządzeń wentylacyjnych. Przegląd Górniczy 2016, 72, 66–79. [Google Scholar]
  27. Regulation—Code of Federal Regulations. Title 30 Mineral Resources. Office of the Federal Register, US (ver. 01/28/2022). Available online: https://www.ecfr.gov/current/title-30 (accessed on 10 January 2022).
  28. Regulation—Occupational Health and Safety Regulations. Part XXIX Underground Operations 2012. Government of Newfoundland and Labrador, Canada (ver. 01/03/2020). Available online: https://www.gov.nl.ca/dgsnl/ohs/guide/ (accessed on 10 January 2022).
  29. Regulation—Work Health and Safety (Mines and Petroleum Sites) 2014. New South Wales Government, Australia (ver. 12/11/2021). Available online: https://legislation.nsw.gov.au/view/html/inforce/current/sl-2014-0799 (accessed on 10 January 2022).
  30. Krause, E.; Łukowicz, K. Instrukcja Głównego Instytutu Górnictwa nr 17 – Zasady prowadzenia ścian w warunkach zagrożenia metanowego.; Wydawnictwo Głównego Instytutu Górnictwa: Katowice, Poland, 2004. [Google Scholar]
  31. Regulation—Rozporządzenie Ministra Energii z dnia 9 czerwca 2017r. w sprawie szczegółowych wymagań dotyczących prowadzenia ruchu podziemnych zakładów górniczych (Dz.U. 2017 poz. 1118 z późn. zm.). Available online: https://isap.sejm.gov.pl/isap.nsf/DocDetails.xsp?id=WDU20170001118 (accessed on 10 January 2022).
  32. Ansys Inc. Ansys Fluent User’s Guide; Ansys Inc.: Canonsburg, PA, USA, 2012. [Google Scholar]
  33. Fernández-Alaiz, F.; Castañón, A.M.; Gómez-Fernández, F.; Bernardo-Sánchez, A.; Bascompta, M. Determination and Fire Analysis of Gob Characteristics Using CFD. Energies 2020, 13, 5274. [Google Scholar] [CrossRef]
  34. Li, Z.; Xu, Y.; Liu, H.; Zhai, X.; Zhao, S.; Yu, Z. Numerical analysis on the potential danger zone of compound hazard in gob under mining condition. Process Saf. Environ. Prot. 2021, 147, 1125–1134. [Google Scholar] [CrossRef]
  35. Szlązak, J.; Szlązak, N. The Numerical determination of methane concentration in goaf space. Arch. Min. Sci. 2004, 49, 587–599. [Google Scholar]
  36. Niewiadomski, A.P.; Badura, H. Evaluation of a one-day average methane concentrations forecast at the outlet from the longwall ventilation region as tool of supporting selection of methane prevention measures. In Proceedings of the Topical Issues of Rational Use of Natural Resources 2019, St. Petersburg, Russia, 13–17 May 2019. [Google Scholar]
  37. Niewiadomski, A.P.; Badura, H.; Ivanova, T.N.; Repko, A.; Yury, N.R. Analysis of Methane Concentration Distribution at U-Ventilated Longwall Outlet—Case Study. New Trends Prod. Eng. 2020, 3, 149–168. [Google Scholar] [CrossRef]
Figure 1. The longwall and tailgate crossing with a built-in brattice and auxiliary air-duct (own elaboration).
Energies 15 03672 g001
Figure 2. Diagram of selected for testing longwall area (own elaboration).
Energies 15 03672 g002
Figure 3. Geometric model of the A-15 longwall and the goaf section part.
Energies 15 03672 g003
Figure 4. Design of the brattice and location of the auxiliary air-duct outlet.
Energies 15 03672 g004
Figure 5. Model of the distribution of methane concentrations at the longwall and tailgate crossing based on parameters obtained as a result of in situ measurements.
Energies 15 03672 g005
Figure 6. Result planes in the modeled excavation.
Energies 15 03672 g006
Figure 7. Distribution of methane concentration at result planes in the actual sensor locations: (a) configuration M_9; (b) configuration M_10; (c) configuration M_11; (d) configuration M_12; (e) configuration of M_13; (f) configuration M_14; (g) configuration M_15; (h) configuration M_16.
Energies 15 03672 g007
Figure 8. Result plane of methane concentration distribution at the line of conveyor drive location (AA ): (a) configuration M_9; (b) M_10 configuration; (c) configuration M_11; (d) configuration M_12; (e) configuration of M_13; (f) configuration M_14; (g) configuration M_15; (h) configuration M_16.
Energies 15 03672 g008
Table 1. Values of skewness and orthogonal quality parameters for different numbers of computational cells.
Number of Computational CellsSkewness ValueOrthogonal Quality Value
1320490.868620.13138
1721130.829030.17097
4878950.791660.20834
16074310.799910.20009
48133950.798060.20194
Table 2. Primary solver settings.
solverpressure-based
time discretizationsteady state
sub-modelsturbulent flow (k-epsilon standard), species transport (methane–air mixture)
computational schemecoupled
scheme of the analysisall sub-models as second-order
initialization methodhybrid
Table 3. Values of errors in the simulation of methane concentrations.
The CaseSensorMeasured Methane Concentration Value, %CH4Modeled Methane Concentration Value,%CH4Absolute Error, %CH4
1A1.51.60.1
B1.11.20.1
C1.21.20.0
2A1.21.40.2
B1.11.20.1
C1.11.40.3
3A1.61.80.2
B1.31.40.1
C1.21.40.2
Table 4. Parameters of the tested auxiliary ventilation devices’ location variants.
Model Δ lp Δ xp Δ hlxl
M_10000
M_20+0.500
M_30+100
M_40−0.500
M_500½ hl0
M_60+0.5½ hl0
M_70+1½ hl0
M_80−0.5½ hl0
M_9+2.50½ hl0
M_10+2.5+0.5½ hl0
M_11+2.5+1½ hl0
M_12+2.5−0.5½ hl0
M_13+2.5000
M_14+2.5+0.500
M_15+2.5+100
M_16+2.5−0.500
M_17+2.500+3
M_18+2.5+0.50+3
M_19+2.5+10+3
M_20+2.5−0.50+3
M_21+2.50½ hl+3
M_22+2.5+0.5½ hl+3
M_23+2.5+1½ hl+3
M_24+2.5−0.5½ hl+3
M_25000+3
M_260+0.50+3
M_270+10+3
M_280−0.50+3
M_2900½ hl+3
M_300+0.5½ hl+3
M_310+1½ hl+3
M_320−0.5½ hl+3
Table 5. Simulated methane concentrations at given points for the placement variants of selected devices.
ModelAmax, %CH4A½, %CH4Bmax, %CH4B½, %CH4Cmax, %CH4C½, %CH4Dmax, %CH4D½, %CH4
M_11.01.61.41.81.21.21.21.2
M_21.01.61.41.81.21.21.21.2
M_31.01.61.41.81.21.21.21.2
M_41.01.61.41.81.01.01.21.0
M_51.01.61.41.81.01.01.21.2
M_61.01.61.41.81.21.21.21.2
M_71.01.61.41.81.01.01.21.2
M_81.01.61.41.81.01.01.21.0
M_91.01.61.62.01.01.01.21.0
M_101.01.61.61.81.01.21.21.2
M_111.01.61.21.21.21.21.21.0
M_121.01.61.61.81.21.21.21.0
M_131.01.61.62.01.21.01.21.0
M_141.01.61.61.81.21.01.21.2
M_151.01.61.21.21.21.21.21.2
M_161.01.61.61.81.21.21.21.0
M_171.01.61.41.81.21.01.21.0
M_181.01.61.41.61.21.21.21.0
M_191.01.61.41.21.21.21.21.0
M_201.01.61.41.81.01.21.21.0
M_211.21.61.41.81.21.21.21.0
M_221.21.61.41.61.01.21.21.0
M_231.21.61.41.21.21.21.21.0
M_241.21.61.41.81.21.01.21.0
M_251.01.61.41.81.01.01.21.0
M_261.01.61.41.81.21.01.21.0
M_271.21.41.41.41.01.01.21.0
M_281.01.61.41.81.21.21.01.0
M_291.21.61.41.81.21.21.01.0
M_301.21.61.41.81.21.21.21.0
M_311.21.61.41.81.21.21.21.0
M_321.21.61.41.81.01.01.21.0
Publisher’s Note: MDPI stays neutral with regard to jurisdictional claims in published maps and institutional affiliations.