Review

Expectations for Coal Demand in Response to Evolving Carbon Policy and Climate Change Awareness

by
Horacio Andres Aguirre-Villegas
1,* and
Craig H. Benson
2
1
Biological Systems Engineering, University of Wisconsin-Madison, 460 Henry Mall, Madison, WI 53706, USA
2
Geological Engineering, University of Wisconsin-Madison, 1415 Engineering Drive, Madison, WI 53706, USA
*
Author to whom correspondence should be addressed.
Energies 2022, 15(10), 3739; https://doi.org/10.3390/en15103739
Submission received: 27 April 2022 / Revised: 12 May 2022 / Accepted: 17 May 2022 / Published: 19 May 2022
(This article belongs to the Special Issue Sources and Markets of Coal, Oil, Gas, and Renewable Energy)

Abstract

:
Increasing awareness of climate change has induced demand for action most notably. As public demand for action on climate change increases, conversion to energy sources with lower greenhouse gas (GHG) intensity will accelerate. Experience during the COVID-19 pandemic provided insight into how atmospheric conditions will respond to lower GHG emissions. A low-carbon future will require decarbonization of the energy supply mix for electrical production and industrial processes. Coal demand likely will decrease more rapidly than other fossil energy sources, replaced by natural gas and renewable energy sources that have lower GHG intensity and that will be available readily and economically. This decline will accelerate as China focuses on its carbon neutrality goals, the U.S. re-engages in the Paris Agreement, and India moves to a lower carbon future. However, perturbations in the decline will inevitably occur in response to global issues (e.g., pandemic, military conflict). Carbon capture, utilization, and storage (CCUS) technologies can reduce GHG emissions from coal as an energy source, but the capital and operation costs of CCUS remain high, which translates to slow commercial deployment. In this study, a literature review and interviews with industry experts and business leaders were conducted to understand the current and projected role of fossil fuels, primarily coal, in the global energy matrix; present their contributions to GHGs; analyze the effects of social expectations and climate policy on energy choices and coal demand; and describe the expected impacts on coal production for decades to come.

1. Introduction

Greenhouse gas (GHG) emissions from natural and anthropogenic activities are the primary contributors to global warming, the long-term temperature rise on earth. Sustained increases in the earth’s temperature for years are anticipated to have catastrophic effects, such as glacier and ice sheet melt, which lead to habitat loss and sea-level rise, larger and more intense storms, flooding, loss of land, extreme droughts, species loss, and/or famine. Anecdotal evidence of climate change is apparent today: unprecedented wildfires, supertyphoons, record floods, and record-high temperatures were recorded in 2020 and 2021 [1]. These changes in climate have important economic and social implications as they can affect prosperity and quality of life.
GHG emissions responsible for climate change are a global problem, as emissions from one geographic region affect the entire world. Strategies for mitigating GHGs need the participation of all countries, sectors, and industries, starting at the national level, proceeding to the regional level, and ultimately reaching the household level. Policies have been implemented across the globe to avoid the impacts of climate change. Nevertheless, GHG emissions continue to increase unabatedly, with an unprecedented rate of increase post-1950 (480% from 1950 to 2020) [2].
Carbon dioxide (CO2) emitted from combustion of fossil fuels and industrial processes is the predominant source of anthropogenic GHG emissions. Electricity and heat generation, related to primary energy consuming activities, account for 75% of the increase in GHG emissions in the past decade. Energy production and consumption (electricity, heat, and transport) are responsible for 73% of the annual GHG emissions globally, with electricity and heat accounting for the largest portion of these emissions (Figure 1) [3,4]. When the energy sector is partitioned into energy supplies that deliver final energy to end-use sectors (e.g., energy extraction, conversion, storage, transmission, distribution) and energy end use (industry, buildings), energy production remains the major contributor to emissions with nearly 35% of the total anthropogenic GHG emissions [5,6].
Population and economic growth have been the primary factors responsible for the systematic increases in CO2 emissions from fossil fuels, despite reductions in CO2 emission intensity that have occurred due to technology improvements, transitions in the mix of energy sources, and enhanced efficiency (Figure 2). The rate of increase in CO2 emissions has been relatively steady since 1970. This increase is predominantly due to economic growth relative to population growth [5], as illustrated by the impact of GDP shown in Figure 2. Sustained economic growth and infrastructure expansion in developed countries account for most of this increase in emissions. As countries transition from low income to moderate income to high income, the predominant sources of GHGs shift from agriculture, forestry, and other land use (AFOLU) to energy supply, transportation, and industry, the latter having much greater GHG intensity. GHG emissions associated with consumed goods are assigned to the country consuming the goods, even if the goods are manufactured primarily in low-income countries. For this reason, moderate- and high-income countries emit nearly nine times the GHG emissions per capita (13 Mg CO2-eq/person/yr) relative to low-income countries (1.4 Mg CO2-eq/person/yr) [5].
Developing countries have had an important role in the rate of increase in annual GHG emissions in recent decades, but for different reasons. Developing countries focus on eradicating poverty, building infrastructure, adopting technology, creating industries, and expanding access to energy. These activities lead to higher CO2 emissions if they are conducted using fossil-based energy sources. Reducing emissions in developing countries is a greater challenge, as they face a difficult choice between controlling emissions and promoting economic growth, quality of life, and stability. Developing countries also are less prepared to address the impacts of climate change, despite having contributed less to the problem [5].
The majority of GHG emissions globally are emitted by a modest number of countries, with the top 20 emitters accounting for 75% of global emissions and the top 5 countries (China, U.S., India, Russia, and Japan) accounting for more than 50% of global emissions [5]. Populated developing countries with high total emissions have much lower GHG emissions on a per capita basis (e.g., China’s per capita emissions are 40% of those in the U.S.; India’s per capita emissions are 11% of those in the U.S.). In contrast, emissions on a per GDP basis (a measure of converting energy into economic value) are greater in developing countries (e.g., India, China) as they depend more heavily on extractive industries that consume significant amounts of energy for economic growth. As countries become more developed, technological efficiencies improve and value-added industries with higher economic return and lower emissions become more predominant [5]. The combined effects of economic growth and population are evident in the context of total GHGs. From 1990 to 2010, emissions from China increased by 6.9 Gt CO2-eq, which is five times the increase from India, 9 times the increase from Indonesia, and 12 times the increase from the U.S. [5]. China’s dramatic economic growth since 1990 is responsible for its much greater increase in emissions.
Growing societal awareness regarding the importance of GHG emissions and their impact on climate change has accelerated, including greater urgency for actions that reduce GHG emissions and mitigate climate change. The Paris Agreement is the most prominent, signed in 2015 as part of the United Nations Framework Convention on Climate Change (UNFCCC), with 190 member states. More recently, China made a commitment to eliminate sales of conventional fossil-fuel vehicles by 2035 to electrify its transportation fleet and to become carbon neutral by 2060 [7]. The U.S. is rejoining the Paris Agreement and is introducing legislation to mitigate climate change [8], and the European Union (E.U.) has committed to reduce GHG emissions by 55% by 2030 [9]. BP, Total, Shell, and ExxonMobil, four of the largest oil and gas companies in the world, have made commitments to become carbon neutral by 2050; and ExxonMobil, under pressure from activist investors, created a new business unit to commercialize low-carbon technologies and is developing a carbon capture, utilization, and storage (CCUS) hub in Texas [10,11]. The Rockefeller Foundation, based on wealth from the oil industry, committed to complete divestiture from fossil fuel investments and made a USD 1 billion investment to a sustainable future [12]. GM, one of the largest automotive companies in the world, has committed to a complete phase-out of fossil-fuel automobiles by 2035 [13], Volvo reports that electric vehicles now constitute more than one-third of their automobiles sold in the E.U. [14], and sports car manufacturer Aston Martin has committed to manufacturing electric automobiles in the UK [15]. These policies and commitments are a harbinger of the future, as society demands reductions in GHG emissions and embraces decarbonization. These policies and commitments likely will have a larger and more rapid impact on the coal industry than on other fossil fuel industries.
This paper conducts a literature review of scientific journal articles, government and commercial websites and reports, and newspaper articles. Furthermore, the information and data collected in the review process are complemented by information collected by interviewing industry experts and business leaders of energy companies. The objectives are to (i) describe coal in the global energy supply, including production and the effect of COVID-19 on coal demand, and provide an outlook on the future trends; (ii) analyze the GHG emissions from coal-based energy and the strategies used to mitigate these emissions; (iii) analyze the effects of current and future GHG emission and renewable energy policies on coal production; and (iv) put forward inferences on how societal behaviors and environmental policies will impact coal production in the short, medium, and long terms.

2. Coal in the Global Energy and Industrial Supply

2.1. Proportion of Global Energy Supply

The majority (75%) of the global primary energy supply is converted to other forms of energy (e.g., electricity, heat, refined oil products, coke, natural gas) for use in industry, transportation, buildings, and households [5]. Coal is the second largest energy source in the world following oil (Figure 3a) and was the largest source for electricity generation in 2018 (38% of the global electricity generation,) followed by natural gas (23%) (Figure 3b). Industry is the most important consumer of these converted energy products, consuming 84% of coal, 40% of electricity, and 47% of natural gas. In contrast, the transportation sector is the major consumer of liquid fuels (62%), and buildings are the major consumers of renewable energy (76%). Low conversion efficiencies (only 37% of fossil fuel energy used in electrical production is converted to electricity, and 38% for heat) associated with losses during conversion, transmission, and distribution exacerbate the amount of energy consumed and the GHG emitted to meet energy production demands.
Coal consumption increased considerably over the last two decades (Figure 3a), with the growth almost entirely in Asia (China, India, Indonesia, and other countries in South and Southeast Asia). China is the main consumer and producer of coal, accounting for nearly 48% of global coal production globally. China is followed by India, the U.S. (which fell from second to third place in 2019), Indonesia, and Australia [16]. Conversely, coal consumption has been decreasing steadily in advanced economies in response to new environmental policies, competitive prices for renewable energy, and low natural gas prices. GHG emissions from the energy sector reflect these trends, which continue to increase more rapidly in the last two decades than in previous decades. These increases in coal consumption and GHG emissions reflect increasing electricity demand from economic growth in developing Asian countries (especially China) and a growing share of coal in the global electricity mix. Steady reductions in the carbon intensity of energy production occurred between 1970 and 2000, but the increased use of coal versus other energy sources (especially in Asia) between 2000 and 2010 contributed to an increase in CO2 emission intensity from energy production for the first time since 1970 (Figure 2). Coal alone contributed nearly 44% of the growth in total energy consumption during this period, with the electricity generation sector being the main coal consumer [5].
Despite a steady increase in coal demand in recent years and a record-high demand for coal-fired power generation in 2018, total coal demand dropped by 1.8% in 2019, with a 3.3% reduction of coal consumption for electricity generation [17]. The decrease in coal demand in 2019 was driven by much lower cost of natural gas (30% relative to 2018), which accelerated the conversion of coal to gas-fired electrical generation. However, natural gas prices have recently spiked to their highest level in more than a decade due to the uncertainties of external shocks, such as the military conflicts in Ukraine [18], which challenge the degree of coal conversion to natural gas, and the rapid reinstatement of industrial capacity to support elevated consumption postpandemic. The modest increase in electricity demand (1%) in 2019 also contributed to the lower coal demand, which was exacerbated by the emergence of other energy sources and more competitive renewable energy systems [17]. Larger drops in coal demand occurred in the U.S. and the E.U., which were compensated in part by greater coal demand in China and Southeast Asia.
Coal is the primary fuel for the power and industry sectors in China and India. Outside of Asia, however, natural gas has become an increasingly larger fraction of the energy mix [5]. Natural gas, especially gas from unconventional sources (shale gas, coal-bed methane, and biogas/renewable natural gas or RNG), is an increasing fraction of the global energy mix in place of coal (Figure 3a). In the U.S., for example, unconventional gas production more than doubled from 2015 to 2020, mostly due to the availability of shale gas but also due to an increasing number of RNG sources. Low natural gas prices have contributed to the growth of natural gas demand across regions along with the expansion of infrastructure for the transport of liquefied natural gas (LNG). Increased capabilities to import and export LNG, combined with additional investments in gas pipelines and low gas prices, position natural gas as the most important fossil fuel source for growth in energy demand in developed and developing countries. Greater prominence of GHG emission policies and corporate GHG reduction strategies will exacerbate the replacement of coal by gas, as natural gas has more than 50% lower life-cycle GHG emissions when compared with coal [19].
The lower energy density of natural gas, which increases the intensity of transportation and storage costs, could constrain the rate at which gas replaces coal in the global energy mix. Disruptions in supply due to military conflict may also affect the rate of replacement.

2.2. The Effect of Recent External Shocks on Coal Demand

2.2.1. The 2020 COVID-19 Lockdown

The coal industry faced greater challenges in 2020 due to the economic contractions associated with the COVID-19 pandemic. The International Energy Agency (IEA) indicates a global coal demand reduction of 4.4% in 2020, the largest drop since World War II, with coal use declining in every region and sector in the world [17,20]. In 2020, coal-fired power generation dropped by 4.2% (3.6% for steam coal, 13% for lignite), and coal exports by 11% (mostly thermal coal), with the reductions for thermal coal coming primarily from Indonesia, Australia, and the U.S. Nearly two-thirds of the global coal production is for the electricity sector, which has seen a 1.5% decrease in global annual demand and short-term reductions in demand of more than 18% during the 2020 lockdown in the U.S. [17,20,21]. In the U.S., the combined effects of the pandemic, low natural gas prices, and additional availability of renewable energy resulted in a share of coal in the electricity mix less than 20% for the first time in the 21st century [20]. Coal demand in the E.U. was estimated to be 19% lower in 2020 as a result of mild winter weather, reduced demand due to lockdowns, inexpensive natural gas, increased availability of renewable energy, and a reduction in CO2 emissions permitted from coal-fired power plants [20]. India’s coal demand is estimated to have decreased by 8% on top of a slight decrease in 2019 [21]. Even Southeast Asia, the region currently having the greatest impact on the growth of coal consumption in recent years, reported an annual decrease in consumption for 2020 [20]. China, the world’s largest coal consumer, experienced large reductions in coal consumption due to strict lockdowns early in the pandemic, which affected industrial and residential energy consumption. However, China’s strong recovery driven by significant and diversified monetary and fiscal stimuli compensated for the early reductions, with the overall annual change in coal demand estimated to increase by 0.5% in 2020 [17].
The drops in coal demand illustrate the larger magnitude of industrial and commercial electricity consumption relative to residential electricity consumption over similar time periods. The reduction in electricity demand in 2020 affected coal more than other fuel sources (e.g., renewables and nuclear energy) that have priority dispatch in the electricity system (Figure 4). Moreover, natural gas prices, which dropped even further during the pandemic, induced additional conversion of electrical power plants from coal to natural gas in the U.S. and E.U., which should have a long-term effect on coal demand and GHG emissions. Lockdowns also constrained industrial energy use, including the cement and steel sectors, which demand most of the coal not used for electricity generation. The constraint on economic growth caused by the pandemic had an equally important effect on energy demand and related CO2 emissions. COVID-19 induced a 4.4% global economic contraction [22], especially in important coal-consuming countries.

2.2.2. A Fast Economic Recovery after the Global Lockdown

Although coal-fired power generation appeared to have peaked in 2018, the sharp rebound in 2021 when many of the COVID-19 lockdowns were removed resulted in growth in electricity demand that significantly outpaced the availability of low-carbon energy supply. Consequently, coal-fired power generation increased by 9% in 2021, and the overall coal demand increased by 6% globally [21]. Moreover, the IEA predicts that coal demand will continue to grow after 2021 (albeit at a slower pace), reaching its highest ever by 2024 (Figure 4). Coal’s share of the global electricity mix is anticipated to be 36% for 2021, with 20% growth in the U.S. and E.U., 9% in India, and 12% in China [21]. This increase in coal-based electricity (and electricity overall) was expected as a result of the economic rebound after the COVID-19 pandemic, similar to what happened in 2010 after the global financial crisis. However, the increase in coal demand is higher than previously expected due to three main reasons: (i) rapid global economic recovery (5.8% GDP growth), (ii) more extreme and unpredictable climatic events (e.g., extreme heat, extreme cold, drought) that increased demand and limited supply, and (iii) all-time higher prices of natural gas that decelerated the conversion of coal-fired plants to gas plants [21].

2.2.3. The War in Ukraine

Military conflict always affects energy demand and pricing, as consumers seek energy supplies with less risk of disruption due to conflict while also abandoning supplies that provide direct or indirect support of military aggressors or enemies. This is evident in the abrupt increases in coal demand and cost pricing due to the invasion of Ukraine in February 2022. For example, the UK has ramped up utilization of coal-fired electricity-generating plants to reduce disruptions and consumer energy costs due to embargos on fossil fuels, most notably gas, from Russian suppliers. Other European countries that are heavily reliant on Russian fossil fuels are seeking new contracts for energy supplies sourced from other nations, putting upward price pressure on coal and other commodities. These impacts are layered on the spike in energy demand associated with surging postpandemic consumer demand for goods and services [24,25].
These perturbations are caused by shocks to global energy supplies and are not anticipated to persist. Similar perturbations will inevitably occur in the future as well. A more likely long-term outcome is an accelerated transition to renewable energy sources as nations recognize the fragility of peace in the developed world for the past 75 years (post–World War II). This acceleration will be driven as much by a quest for energy independence using local renewable energy sources as addressing carbon emissions contributing to climate change [25,26,27]. Spikes in March 2022 in renewable energy costs and equity prices are examples of this demand [28].

2.3. Global CO2 Emissions from Coal

As with other historic economic shocks, record declines in energy demand during the pandemic lockdown in 2020 were accompanied by record declines in CO2 emissions (Figure 5). This reduction in annual CO2 emissions in 2020 were twice as large as any other declines since World War II [20]. Estimates indicate that CO2 emissions were 6% lower in 2020 compared with 2019, with the largest reductions associated with oil (60%), coal (30%), and natural gas (10%) in China, the E.U., and the U.S., which experienced the greatest reduction in energy demand [20]. This experience, while unique to the pandemic shock, has provided tangible evidence that substantial reductions in GHG emissions can be achieved by changing human behavior and altering how energy is used for electricity production, industrial operations, and transportation. As with coal demand, global CO2 emissions from energy rose again by nearly 5% in 2021 with coal now accounting for 47% of this increase [29].

2.4. Long-Term Outlook for Coal

Coal demand for 2021 increased by 6%, with the greatest increases in China, India, and the U.S. Coal-fired power generation also increased in 2021 by 9%, compared with 2020, but the share of coal in global electricity production is expected to be 36% in 2021 which is still lower than its 2007 peak [21]. Increases in natural gas prices and electricity demand in the E.U. and U.S., combined with sharp postpandemic increases in consumer demand, are resulting in increases in coal demand [17]. The military conflict in Europe is also affecting coal demand. However, these perturbations are not likely to be permanent, and coal demand in the E.U. and U.S. is predicted to decline steadily after the near-term effects of the pandemic and military conflicts diminish. Conversions to natural gas that occurred in response to conditions during the pandemic likely will accelerate the decline in coal demand in the E.U. and the U.S. over the long term.
China still dominates the global coal trends as this country consumes more than half of the coal demanded globally, and its electricity production accounts for one-third of the global coal consumption [21]. Despite that the COVID-19 lockdowns reduced coal energy demand during the first quarter of 2020, China was one of the few countries that actually saw an increase in coal demand in 2020 and a strong 4% increase in 2021 (9% for coal electricity production), reaching an all-time record. As with global demand, it is expected that China will continue to grow its coal demand, but at a slower pace (1.1% per year) after the 2021 rebound [21]. In 2021, China experienced a severe shortage of thermal coal as producers could not meet the rising demand. This was explained in part by the rigid electricity tariff in China. As coal prices rose, electricity prices remained fixed, leaving coal producers with no incentives to produce more coal [21]. These types of imbalances put pressure on China to start looking for alternative fuel sources that reduce their coal dependence.
Global coal demand is predicted to level out over the next 5 years as coal-fired electricity-generating plants are decommissioned or converted to natural gas in response to lowering prices past 2021, the levelized cost of renewable energy systems diminishes, and societal demands and policies for reductions in GHG emissions become more predominant [17]. Moreover, China’s mandate to achieve carbon neutrality before 2060 will have a major impact on the energy mix, the consumption of coal, and global GHG emissions. Even if other major coal consumers in Asia return to pre-COVID consumption behavior, the impact of environmental policies in other regions will induce a long-term trend of decarbonization for the global energy portfolio.

3. Managing GHG Emissions from Coal

Coal is the fossil fuel with the highest life-cycle GHG emissions per unit of energy produced, also known as GHG intensity (Figure 6). Life-cycle GHG emissions from coal include all components of the supply chain, including mining, processing (e.g., crushing, coking), transportation (to processing and power plants), and combustion during final use. Direct CO2 emissions from coal combustion represent most of the GHG emissions associated with coal-fired electricity production. Fugitive methane emissions from coal can also be important, accounting for 5–20% of the total GHG emissions [5,30] and nearly 30% of the GHG emissions associated with coal produced at a mine [31].
Life-cycle assessment studies indicate that GHG emissions at electricity-generating plants can be reduced by half by shifting from coal-fired production to modern natural gas combined-cycle production due to higher efficiencies and the lower carbon content of natural gas relative to coal [30]. CCUS, addressed later in this report (Figure 6), can achieve even greater reductions in GHG from coal-fired power plants. During mining, GHG emissions can be reduced by oxidizing fugitive methane from the coal bed or by capturing coal-bed methane and using it on-site as a fuel source for coal drying or boilers. Alternatively, coal-bed methane can be compressed for use as transportation fuel or liquefied and transported to other markets [5].
Despite that power generation from coal is a major source of GHG emissions, it is only one of the different contributors to climate change. According to the IEA [33], coal represents 42% of the global GHG emissions from energy generation, but oil, natural gas, and biofuels and wastes still account for the remaining 58% (34%, 22%, and 2%, respectively). Moreover, AFOLU activities contribute 18% of global GHG emissions (Figure 1) and are the major source of methane and nitrous oxide emissions, which are potent GHGs [34]. As a result, GHG mitigation strategies need to consider all sectors to achieve significant reductions.

3.1. Strategies to Mitigate CO2 Emissions

According to the IPCC, there is no single mitigation scenario or pathway to stabilize CO2 concentrations in the atmosphere. Multiple strategies are needed to achieve GHG emission reductions. The magnitude of these reductions depends on factors such as the emission reduction technology, the coordination of strategies among countries, the implementation of climate policies, and the integration of climate policies with other developmental policies [5]. The IPCC has evaluated nearly 300 baseline scenarios and 900 mitigation scenarios that predict atmospheric CO2 equivalent (CO2-eq) concentrations in 2100. The predictions indicate that regardless of the mitigation strategies adopted, concentrations are already at about 430 ppm CO2-eq and may exceed 720 ppm CO2-eq in 2100 [5]. Greater increases in global temperature are associated with higher CO2-eq concentrations, with predicted increases in temperature ranging from 1.5 to 4.0 °C. Delaying the implementation of mitigation strategies past 2030 will limit the likelihood of maintaining temperature increases below 1.5 °C, and could substantially increase the costs of mitigation [5].
A summary of mitigation options to reduce GHG emissions in the energy supply sector compiled by the IPCC [5] is in Table 1. Decarbonization of the energy supply sector is a major component of almost every mitigation scenario, with some suggesting that complete decarbonization of the energy supply will be needed by 2100 to avoid CO2-eq concentrations beyond 580 ppm [5]. This will be a slow process, as the current energy matrix heavily depends on fossil fuels. Consequently, improvements in energy efficiency and reductions in energy intensity will be necessary in the near term to achieve CO2 emission reductions. Efficiency improvements at every step of the energy supply chain play a major role to achieve important reductions in GHG emissions. Improvements in technology to reduce transmission and distribution losses (e.g., transformers, cables), which can reach 20% in developing countries, can also be important. Limiting energy demand has many advantages, but reducing energy demand can have negative economic impacts and may only be possible in developed countries that already have high energy consumption levels.
Technological improvements and strategies to reduce and capture fugitive methane emissions during extraction can also have important near-term impacts (e.g., methane from coal mining, reduction in methane losses from pipelines). All these strategies will need to be complemented with changes in behavior, lifestyle, and culture at the household and individual levels.

3.2. Carbon Capture, Utilization, and Storage (CCUS)

One of the most important technologies for reducing emissions from the fossil fuel energy generation sector is carbon capture, utilization, and storage (CCUS), which has been implemented in a limited number of applications. [35,36,37]. CCUS captures CO2 from large point sources (>100,000 Mg CO2/year) and directly from the air in a process known as direct air capture (DAC). The captured CO2 is compressed to a dense-phase state, which is injected into deep geologic repositories for permanent storage or used in place of virgin applications of CO2, such as enhanced oil recovery or for dry ice. Another disposition pathway is coupling bioenergy production with CCUS using the captured CO2 to support the growth of biomass [5].
While these applications are possible, many challenges exist regarding implementation at scale and uncertainty regarding long-term effectiveness. Success to date has been mixed, and the cost of implementation has been high [35,36]. For example, applications of CCUS at electricity-generating stations have been much more costly than anticipated. At the Kemper electricity-generating station in Mississippi (U.S.), the cost of construction exceeded USD 7.5 billion, more than 200% of the original estimate [38]. Similarly, at the Petra Nova generating station in South Texas, the energy required to power the CCUS system required the construction of a supplemental generating station fired by natural gas. Carbon dioxide from the CCUS at the Petra Nova plant was used for enhanced oil production. When the price of oil dipped in 2020, the plant was shuttered as uneconomical. Uncertainties also exist regarding the effectiveness of perpetual containment in deep geologic storage (e.g., CO2 leaks, pressure buildup due to multiple storage sites in a specific area) and the environmental and health effects if carbon, along with some other captured components, is inadvertently released to the atmosphere.
Lack of economic incentives that support the capital investment and long-term operations and maintenance costs with sequestered CO2 is another challenge [5]. Schmelz et al. [38] indicate that the anticipated cost of implementing CCUS at electricity-generating stations in the U.S. ranges from USD 50 to USD 90 per Mg CO2 or USD 0.03–0.06/kWh of electrical production. In 2021, this cost of CCUS is one-quarter to one-third of the current cost of electricity in the U.S., which is impractical without an incentive or regulatory requirement. The high costs also make electrical generation by renewable energy sources more attractive. Despite these challenges, fossil fuel suppliers, such as ExxonMobil and Aramco, are investing substantial resources to develop CCUS technologies that can be implemented at scale. ExxonMobil recently announced the formation of a new business unit specifically focused on low-carbon technologies, such as CCUS [39]. Thus, the costs of implementing and maintaining CCUS likely will decrease over time. However, the costs of renewable energy sources are also diminishing rapidly, which may make CCUS impractical even as the cost of implementation decreases.
Despite that the majority of CCUS projects are in the U.S. (12 vs. 8 in the rest of the world, [37]), stronger incentives and climate targets in other regions, such as Europe, are building new momentum around CCUS. The European Union Emissions Trading System (EU ETS), the world’s first major carbon market, enables the delivery of CO2 credits for captured emissions [40]. Moreover, there are different funding mechanisms to support CCUS in terms of transport networks, carbon exchanges, research and pilot-scale CCUS, and funding to communities facing economic challenges from the transition to climate neutrality [41], which have promoted that CCUS projects expand to more regions and applications.

3.3. Decarbonization of the Energy Supply

Decarbonization of the global energy supply will take time and will have to be implemented in stages. In the short term, significant GHG emission reductions can be achieved by replacing coal-fired power plants with modern and efficient natural gas combined cycle or combined heat and power (CHP) plants. This will only be feasible where natural gas is available and sustainable. In the long term, however, a phase-out of high-emitting fossil fuels and replacement with low-carbon fuels is necessary. Increasing alternative energy sources, as much as by four times, will be key to decarbonize the energy supply sector. These alternative energy sources include zero- and low-carbon renewable energy, bioenergy, nuclear energy, and fossil energy with CO2 capture and storage [5].
Alternatives to replace electricity production from fossil fuels (e.g., coal) are summarized in Table 2, along with related environmental, social, and economic benefits, as well as concerns or uncertainties regarding implementation. High diversification levels are possible in the electricity sector, which has many low-carbon alternatives that can replace energy-intensive fossil fuels. The transportation sector, in contrast, has a limited number of practical low-carbon energy sources. Renewable energy systems have been shown to reduce GHG emissions significantly, while also being cost competitive with fossil fuels. Wind, hydropower, and solar are mature renewable energy sources that have been adopted broadly in some countries (Germany, UK, Sweden, etc.). Renewable energy systems can be more competitive in rural and isolated regions that are not connected to national or regional electrical grids. Despite these advances in adoption, many renewable energy technologies still depend on direct or indirect economic support to be competitive. Nuclear energy is another mature and low-emission energy source, but its implementation still faces many challenges at different levels, including risks and safety concerns from the extraction of uranium, operational risks at the plant and management of waste, and rejection by a broad fraction of the population [5]. Consequently, the share of the global energy supply mix supplied by nuclear energy is expected to continue declining [16].

3.4. Effect of GHG Mitigation Strategies on Coal Production

When analyzing the effects of GHG emission mitigation policies specifically on coal, the IEA modeled current coal production levels by region and projected these consumption levels to 2030 and 2040 under two scenarios: (i) global stated policies, which consider existing policy frameworks, announced policy intentions, and unchanged energy demand, and (ii) sustainable development, which considers reduced energy demands and a major transformation of the energy sector to achieve the goal set by the Paris Agreement: ensure that the global average temperature remains no greater than 2 °C above preindustrial levels. Some of the stimulus packages implemented for recovery from COVID-19 have incorporated sustainable development scenarios [16]. Under these more aggressive policies, the global use of coal is projected to decrease 60% by 2040, which translates to a 10% coal share in the primary energy mix (Figure 7).
These reductions come mostly from electricity production (e.g., coal replaced by other sources of energy), with the fraction of coal in the electricity matrix projected to decrease from 38% in 2010–2018 to 25% (Scenario i—stated policies) or 4% under sustainable development policies (Scenario ii—sustainable development) over the period 2019–2040 (Figure 8) [42]. Even with these reductions in coal production, coal will remain an important commodity for the industrial sector under either scenario, especially for the production of iron, steel, cement, and chemicals.

3.5. Effects of Alternative and Renewable Energy Sources

Increasing the supply and availability of alternative sources of energy will also result in other benefits, such as local employment creation, additional income generation, and developing local capacity. Alternative and renewable energy sources will also promote energy security by diversifying the energy supply and improving the resiliency of the energy system at the global and regional levels, making national energy systems less vulnerable to price changes and political perturbations, such as military conflict [5]. Gains in the alternative energy sector will come at the expense of traditional fossil fuels. Most IPCC-modeled mitigation scenarios consider aggressive reduced consumption of coal and oil (and thus revenues from these fuels). At the same time, these reductions will open opportunities for other cleaner fossil fuels, such as natural gas, that could supply part of the gap in demand left by coal and oil, leading to increased revenues from these fuels. The implementation of CCUS is crucial to position coal at a competitive level under GHG mitigation scenarios and to offset these revenue losses. Predictions shown in Figure 9 illustrate how coal and natural gas technologies will get implemented under low and high energy demands in 2050 [5]. High energy demand in 2050 (which is the most likely scenario) may result in the elimination of coal and gas as energy sources if no abatement measures are implemented but may also allow coal with CCUS technologies to be competitive.
Despite the progress that has been made to implement low-carbon energy technologies globally, there are still many barriers that limit their adoption. One of the most important barriers is the costs for manufacturers (and thus higher prices for consumers) that limit their competitiveness when compared with fossil fuels. These higher costs can be especially important for low-income countries that have other development goals to fulfill (education, access to food, infrastructure development, etc.). Carbon (e.g., trading and taxes) and energy policies (e.g., feed-in tariffs, quotas, and tendering bidding) play an important role in capturing the market externalities of carbon and promoting the implementation of low-carbon energy technologies. However, the creation and implementation of these policies still face many challenges at the global, regional, and country levels, including existing financial barriers, lack of capacity building initiatives, inexistent legal frameworks, and limited regulatory stability [5]. Shocks due to unanticipated factors, such as global health crises, and major military conflicts, may also impede transitions in the near term, but may also accelerate transitions in the long term so as to provide greater resilience to future shocks. In addition, there are other environmental challenges from the end of life of alternative and renewable energy technology that need to be quantified and understood. For example, PV panels use electronic components that can have negative environmental and health impacts if not repaired, recycled, reused, or disposed of properly [43]. Moreover, the impacts of PV waste might be greater when considering that some solar PV panels require replacement before the anticipated end of service life [44]. Majdi et al. [45] indicate that the most expedient solution to address failed solar panels is replacement rather than repair, which exacerbates waste. This problem will be more evident as penetration of solar PV increases globally [46], demanding clear and feasible recycling/repair and reclaiming programs to avoid further environmental and health impacts.

4. Long-Term Prognosis for Coal

Despite the increase in coal demand after the 2020 COVID-19 global lockdown due to a rapid economic recovery and high natural gas prices, the long-term profitability of coal is being challenged by multiple factors that affect coal’s share of the global energy matrix. Disinvestment in fossil fuel companies and deliberate reductions or replacement of fossil fuels for energy production to meet societal demands, such as GHG reductions, are particularly influential. Banks, insurance companies, institutional and private investors, and utilities have been reducing or eliminating financial investments in fossil fuels, and coal in particular [42]. For example, the Rockefeller Foundation, for which the original endowment was created from a gift derived from profit associated with the Standard Oil Corporation, has made a formal commitment to divest from fossil fuels [12]. Commitments to reduce coal consumption (e.g., Korea and Japan), downsize planned coal projects (Vietnam, Bangladesh, Philippines), cancel coal plant projects (e.g., Egypt), close coal plants (E.U.), and replace coal with natural gas for electrical generation are becoming more common [17], and during COP26, 45 countries signed the Global Coal to Clean Power Transition Statement [47]. Even with higher coal prices, coal companies around the world are reopening coal mines that have been closed due to low coal prices rather than investing in new projects [21].
The decrease in demand for coal is reflected in the declining coal prices in 2019, which were exacerbated by the impacts of COVID-19 in 2020. The IEA [17] indicates that coal mines have been struggling financially, although postpandemic demand and military conflicts have created lucrative near-term opportunities for some miners [48]. A long-term reduction in profitability will limit future investments in the coal sector. Investments in coal have decreased systematically since 2012 (despite the slight increase in 2018). This decline is projected to continue from USD 80 billion in 2018 to USD 60 billion in the next decade under existing policies (Figure 10), and could decline to USD 20 billion under sustainable development policy scenarios (averaged for the decade), according to [17]. Investments in coal for future years is anticipated to come from sectors where social issues do not constrain financing and investment policy.
Coal’s share of the investment in electrical production is projected to decrease from USD 76 billion in 2010–2018 to USD 41 billion in the period 2019–2040 under existing policies and to USD 7 billion under sustainable development policies. In contrast, investment in metallurgical coal is expected to continue, as metallurgical coal has remained in the list of critical raw materials in countries with strong climate targets and is less affected by climate change policies and public opposition than thermal coal [17]. Investments in metallurgical coal production are ongoing in Australia, Russia, and South Africa with an expectation for export [17]. Over this same period, investments in the electrical power sector are expected to increase by 27% under existing policies and 62% under sustainable development policies in the years 2019–2040 (Figure 11) to support increasing demand for electricity [42].
The future of the coal industry will greatly depend on the actions of China and, to lesser extent, India and other countries in Southeast Asia, as this region is the main coal consumer globally. Two major coal companies were created in China in 2020 along with the Coal Trading Centre, with the objective of producing more than 1 billion Mg of coal per year and expanding the inventory of coal-fired power plants [17]. India and other countries in South and Southeast Asia are forecasted to increase coal use through 2025 and invest in new coal-fired power plants. Countries in the Association of Southeast Asian Nations (ASEAN) are projected to become the third largest coal consumers in the world [17].
Despite these initiatives to maintain a steady coal supply, government policies have reduced coal’s share of the Chinese energy mix over the last decade, directly or indirectly. Perhaps the most important is the announcement by the Chinese government to achieve carbon neutrality by 2060, which will accelerate the adoption of energy efficiency measures and renewable energy technologies. Other important policies and initiatives include investments in high-technology industries (e.g., 5G networks) that shift resources from traditional lower-margin energy-intensive industries and enhanced air pollution targets that have led to millions of households switching to natural gas for heating and decommissioning small and inefficient coal boilers [17]. For these reasons, the coal sector is not expected to see an increase in demand, unless other unforeseen factors become apparent primarily in China, India, and other ASEAN countries.

5. Conclusions

This study consisted of a literature review and interviews with industry experts and business leaders regarding the anthropogenic processes responsible for climate change and the role of fossil fuels and resources in generating greenhouse gas (GHG) emissions that contribute to climate change. The effects of social expectations and climate policy on energy choices have been described, and inferences have been made regarding anticipated impacts for decades to come. The key findings from the study are summarized as follows:
  • There is increasing awareness of climate change in society and increasing demand for action. Unprecedented commitments to a lower-carbon future are becoming more common, such as China’s commitment to vehicle electrification, China’s commitment to carbon neutrality, commitments by GM and other manufacturers to vehicle electrification, and commitments by BP, Total, Shell, and ExxonMobil to carbon neutrality. The U.S. is re-engaging in the Paris Agreement and is introducing aggressive legislation to mitigate climate change, and the E.U. has made commitments to reduce GHG emissions by 55% by 2035. Many of these initiatives would have been unlikely 5 years ago but are now expectations. More change and movement towards GHG reductions and climate change moderation should be expected, including additional governmental policy and consumer societal expectations and choices that affect GHG emissions and climate change. The rate of change will also be affected by shocks, such as global health issues, political instabilities, and military conflict.
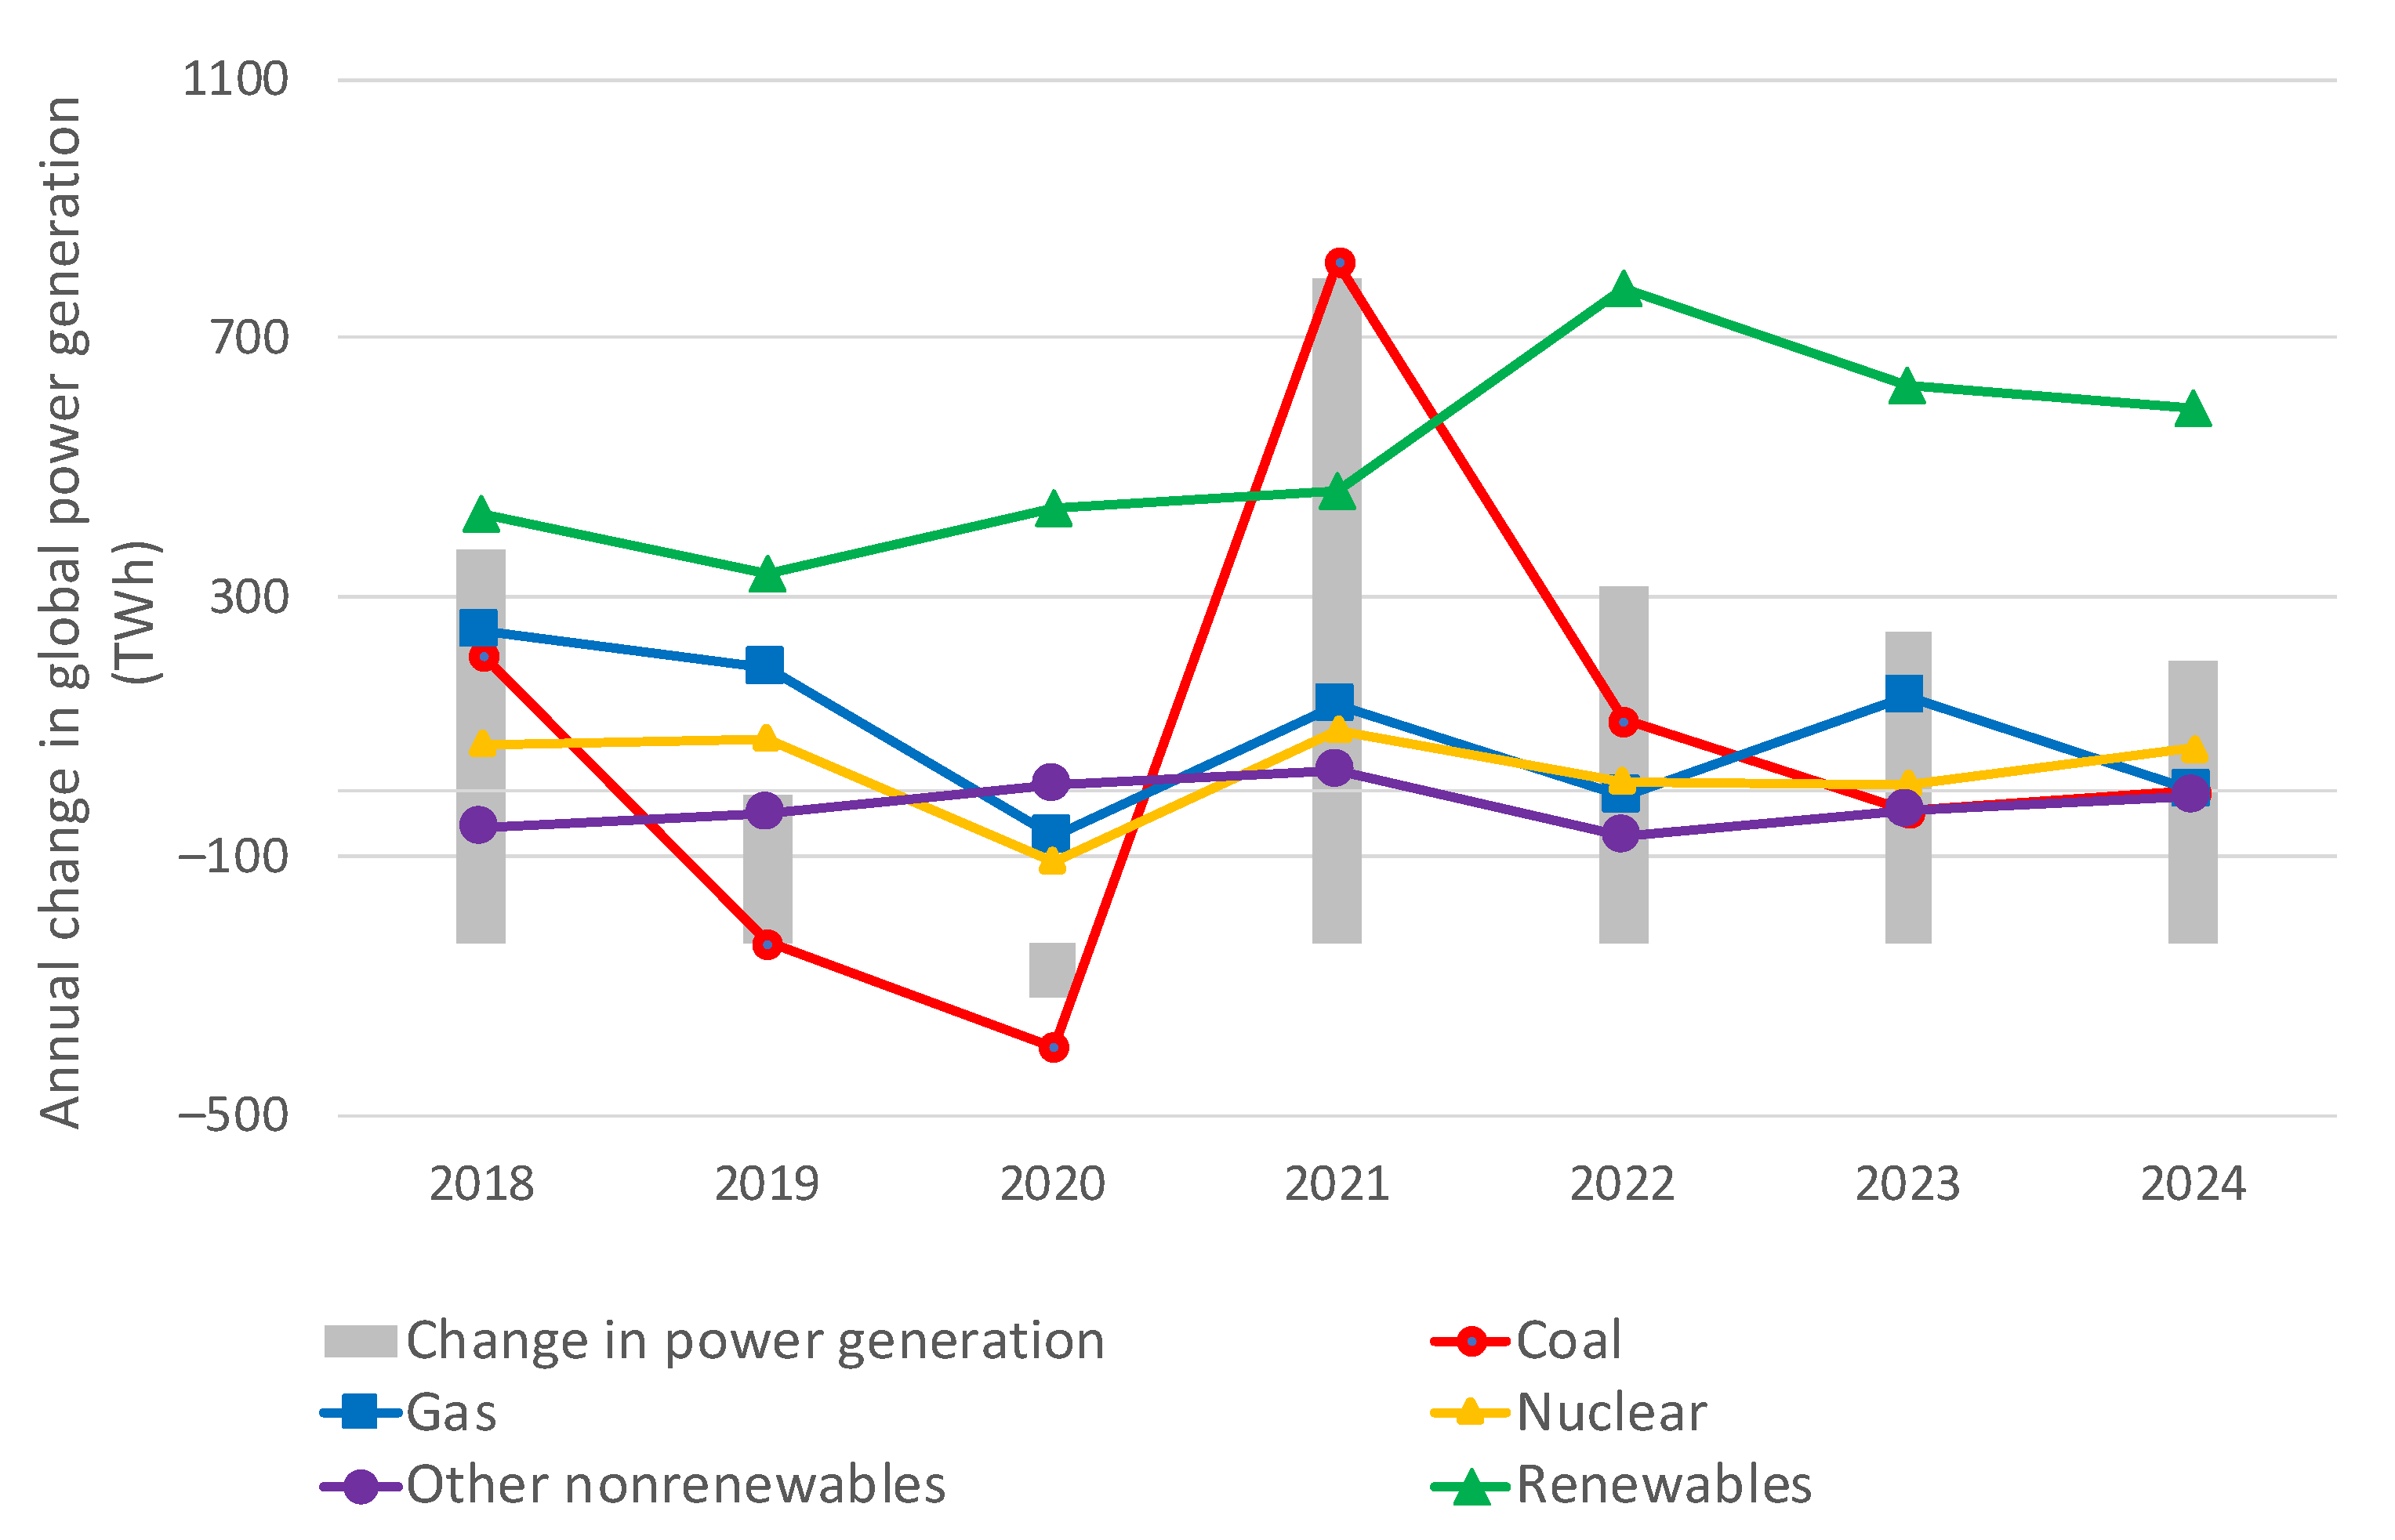
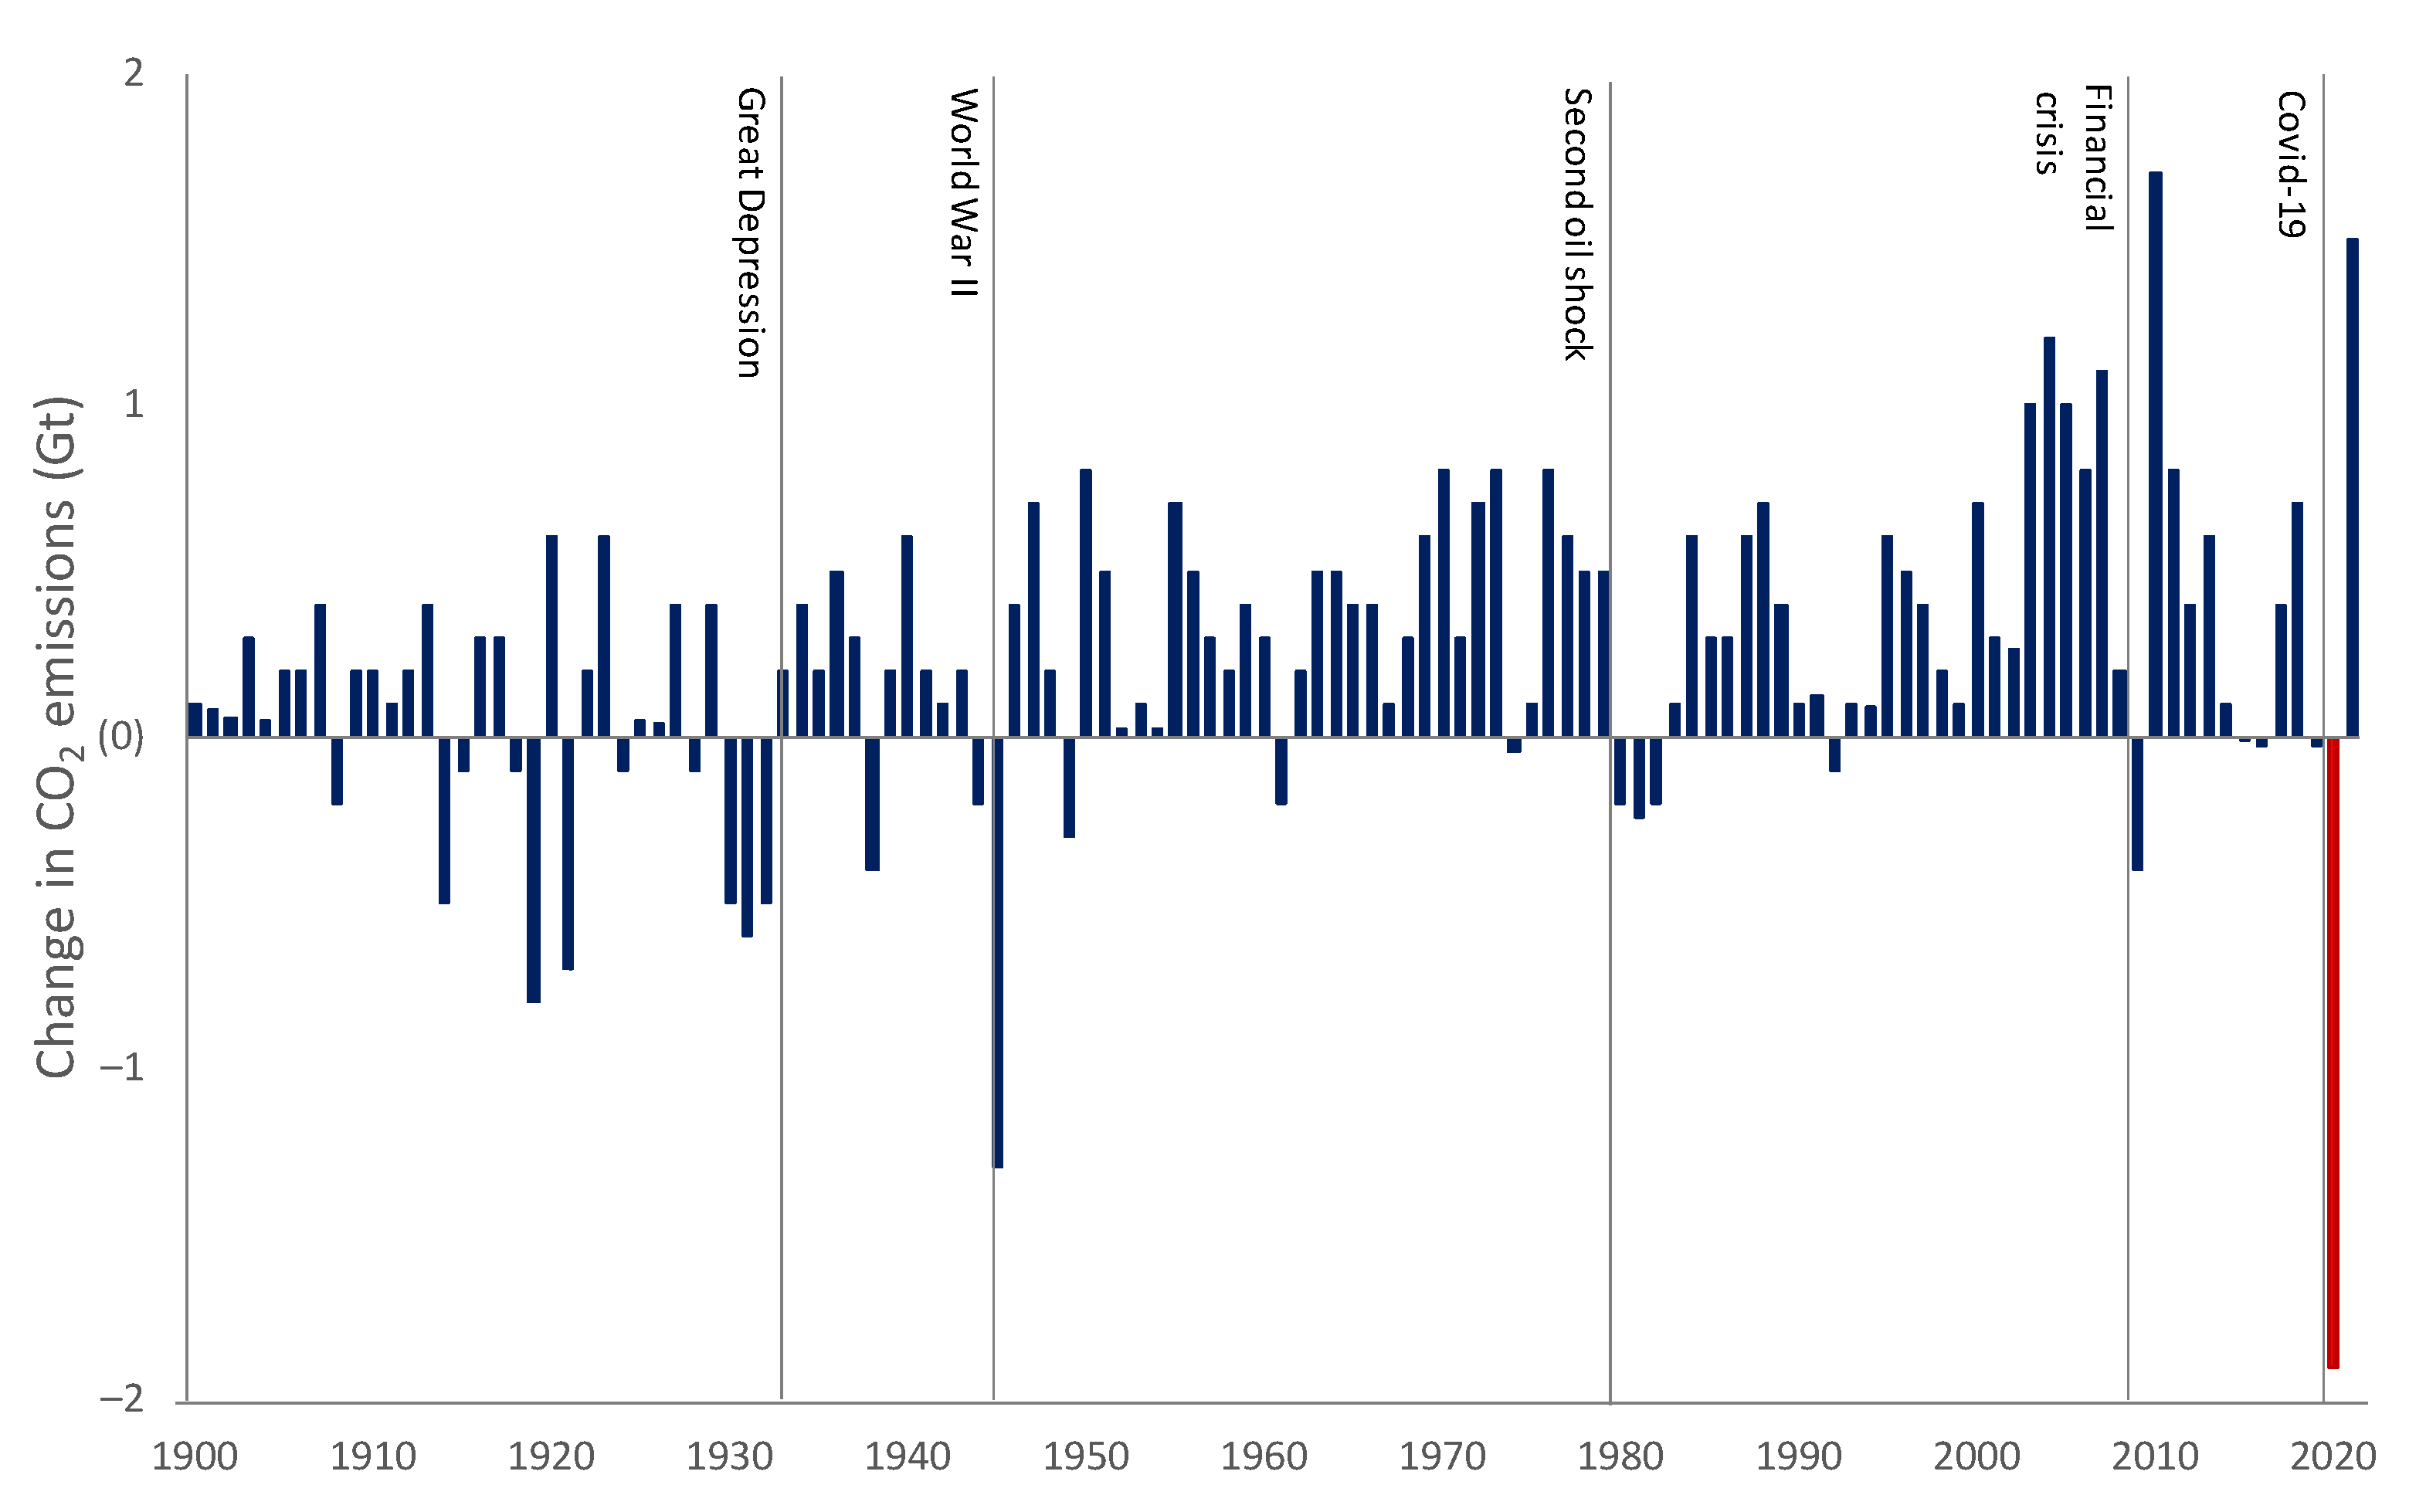
  • The COVID-19 pandemic has provided insight into what will likely happen in energy markets as climate policy evolves and public demand for climate action accelerates. The public has observed that rapid reductions in GHG emissions can be achieved by altering society’s use of energy for industry and transportation. This tangible outcome provides an understanding of what is practical by changing technologies, altering energy sources, and changing human behavior. As public demand for climate action increases, conversion to energy sources with lower GHG intensity will accelerate, and the share of renewable energy sources in the energy portfolio will increase rapidly. However, the increase in demand for coal in 2021, with projected increases to last until 2024 and reductions afterwards, has put the net zero by 2050 trajectory further.
  • Commitments to a low-carbon future will require decarbonization of the energy supply mix for electrical production and industrial processes. Replacing coal with less-GHG-intensive energy supplies is now practical and attractive, with natural gas being an abundant alternative that has lower cost and lower GHG intensity. Conversion from coal to gas will accelerate as LNG transport and distribution becomes more widespread and common. This transformation has already begun in the U.S. and the E.U., as coal plants are being replaced by gas-fired plants at an unprecedented pace. This will accelerate in developing countries as LNG becomes more readily available.
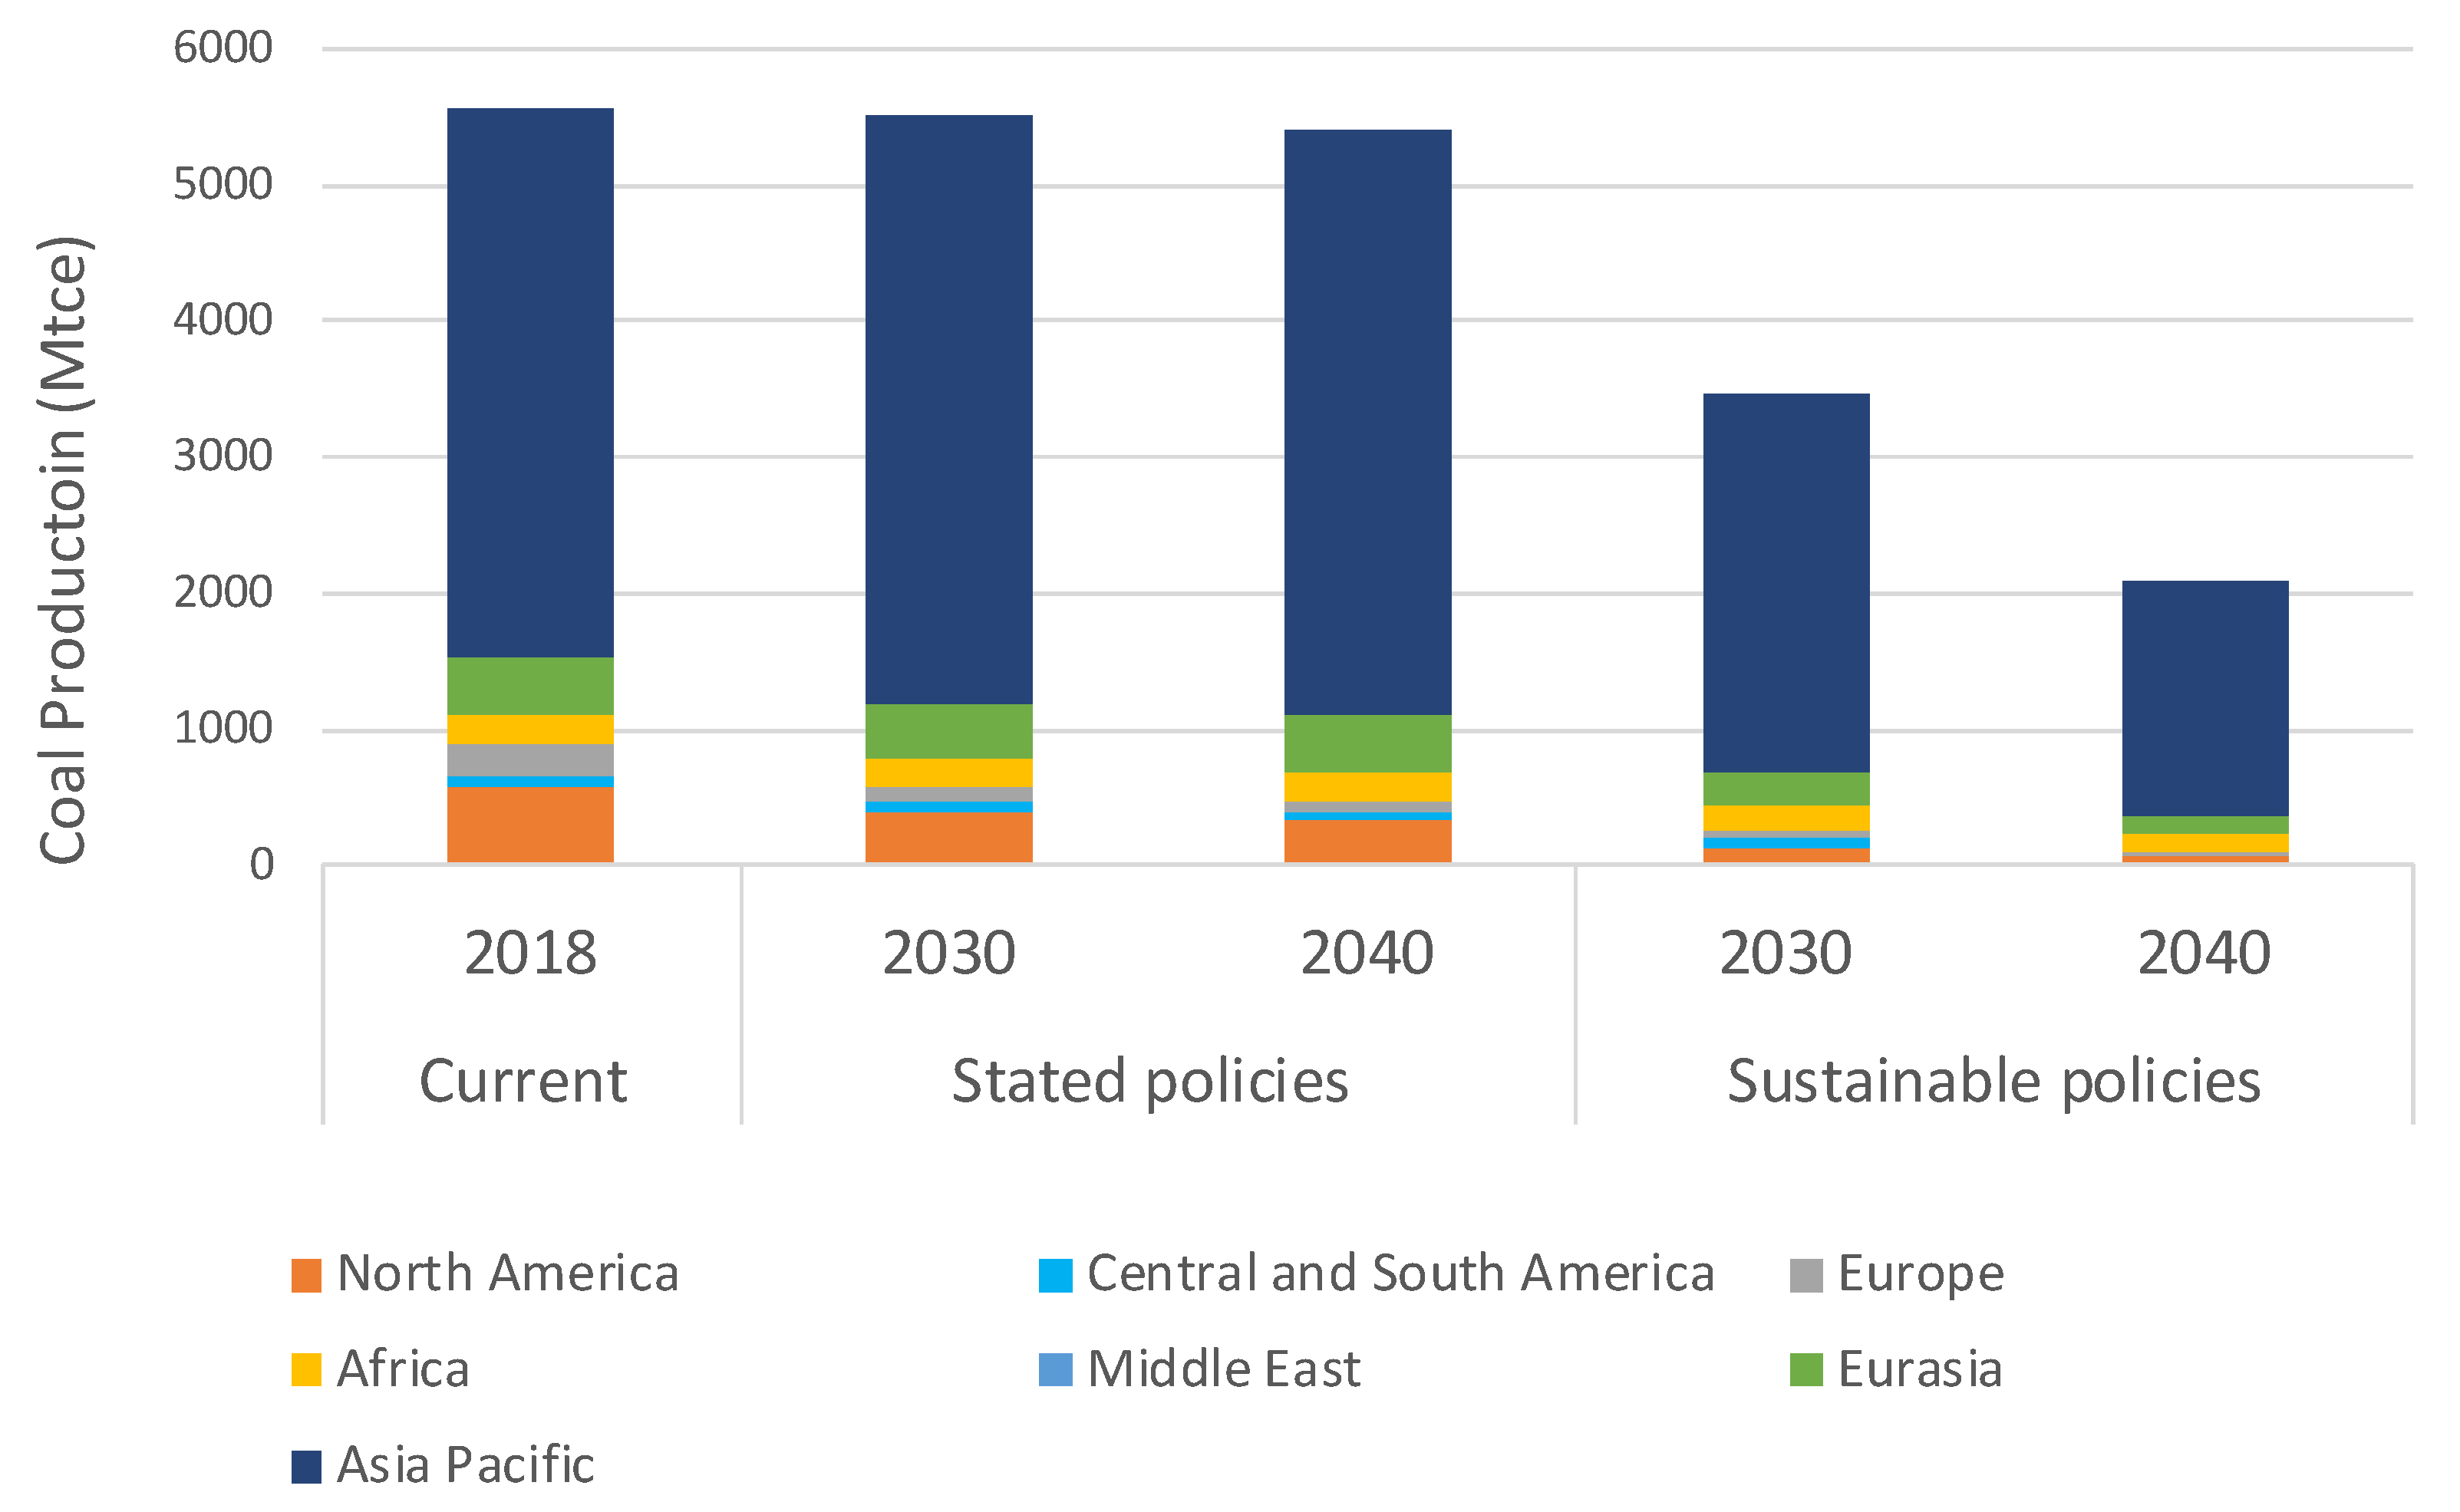
  • Coal’s predominance in the energy matrix has reached a peak, and a decline in coal demand is expected after 2024 and will continue in the future. The decline of coal’s share will accelerate as China focuses on carbon neutrality goals, the U.S. re-engages in the Paris Agreement and implements new climate legislation, the E.U. progresses towards its emission reduction targets, and India moves to a lower-carbon future. Coal demand should diminish greatly by 2060, when China meets its carbon neutrality goal.
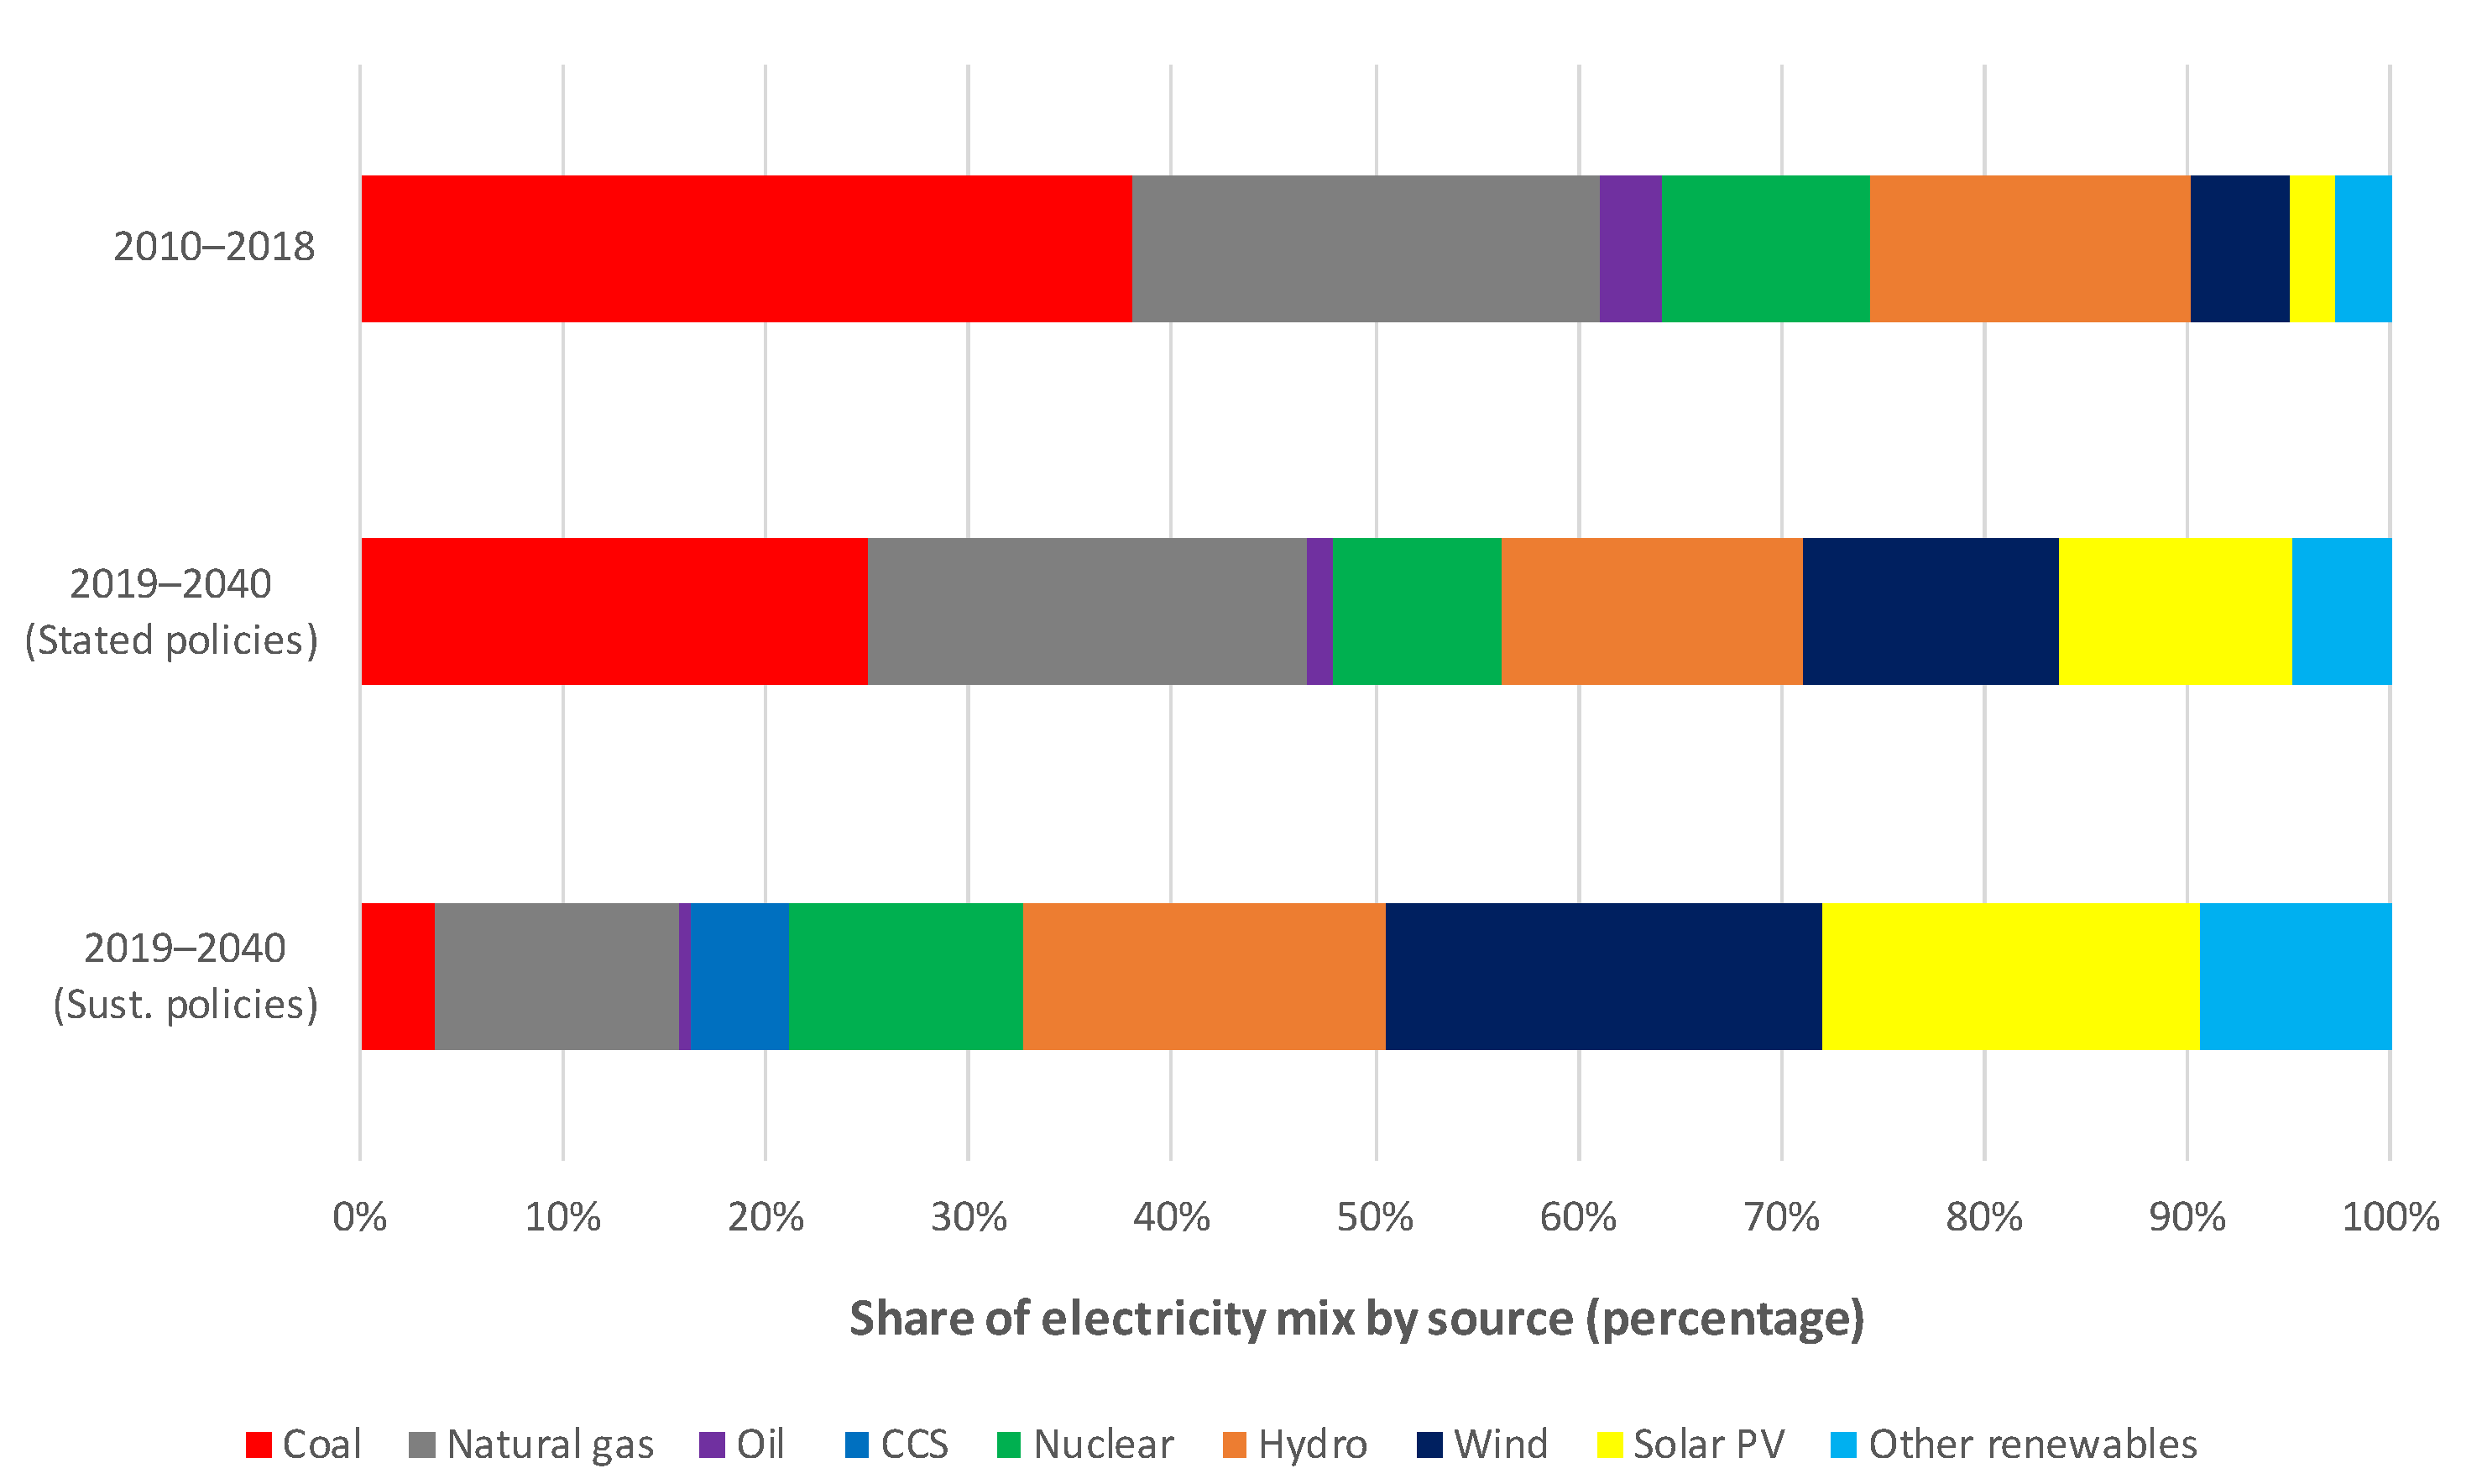
  • Renewable energy sources play a major role in the future of global energy supply. The levelized cost of energy for renewables has been dropping rapidly, making broad adoption of renewable energy sources (e.g., solar, wind) practical and economical. This reduction in cost, combined with increasing societal expectations for action to affect climate change, will accelerate decarbonization of the global energy mix. Coal demand likely will decrease more rapidly than other fossil energy sources, replaced by natural gas and renewable energy sources that have lower GHG intensity and will be available readily and economically.
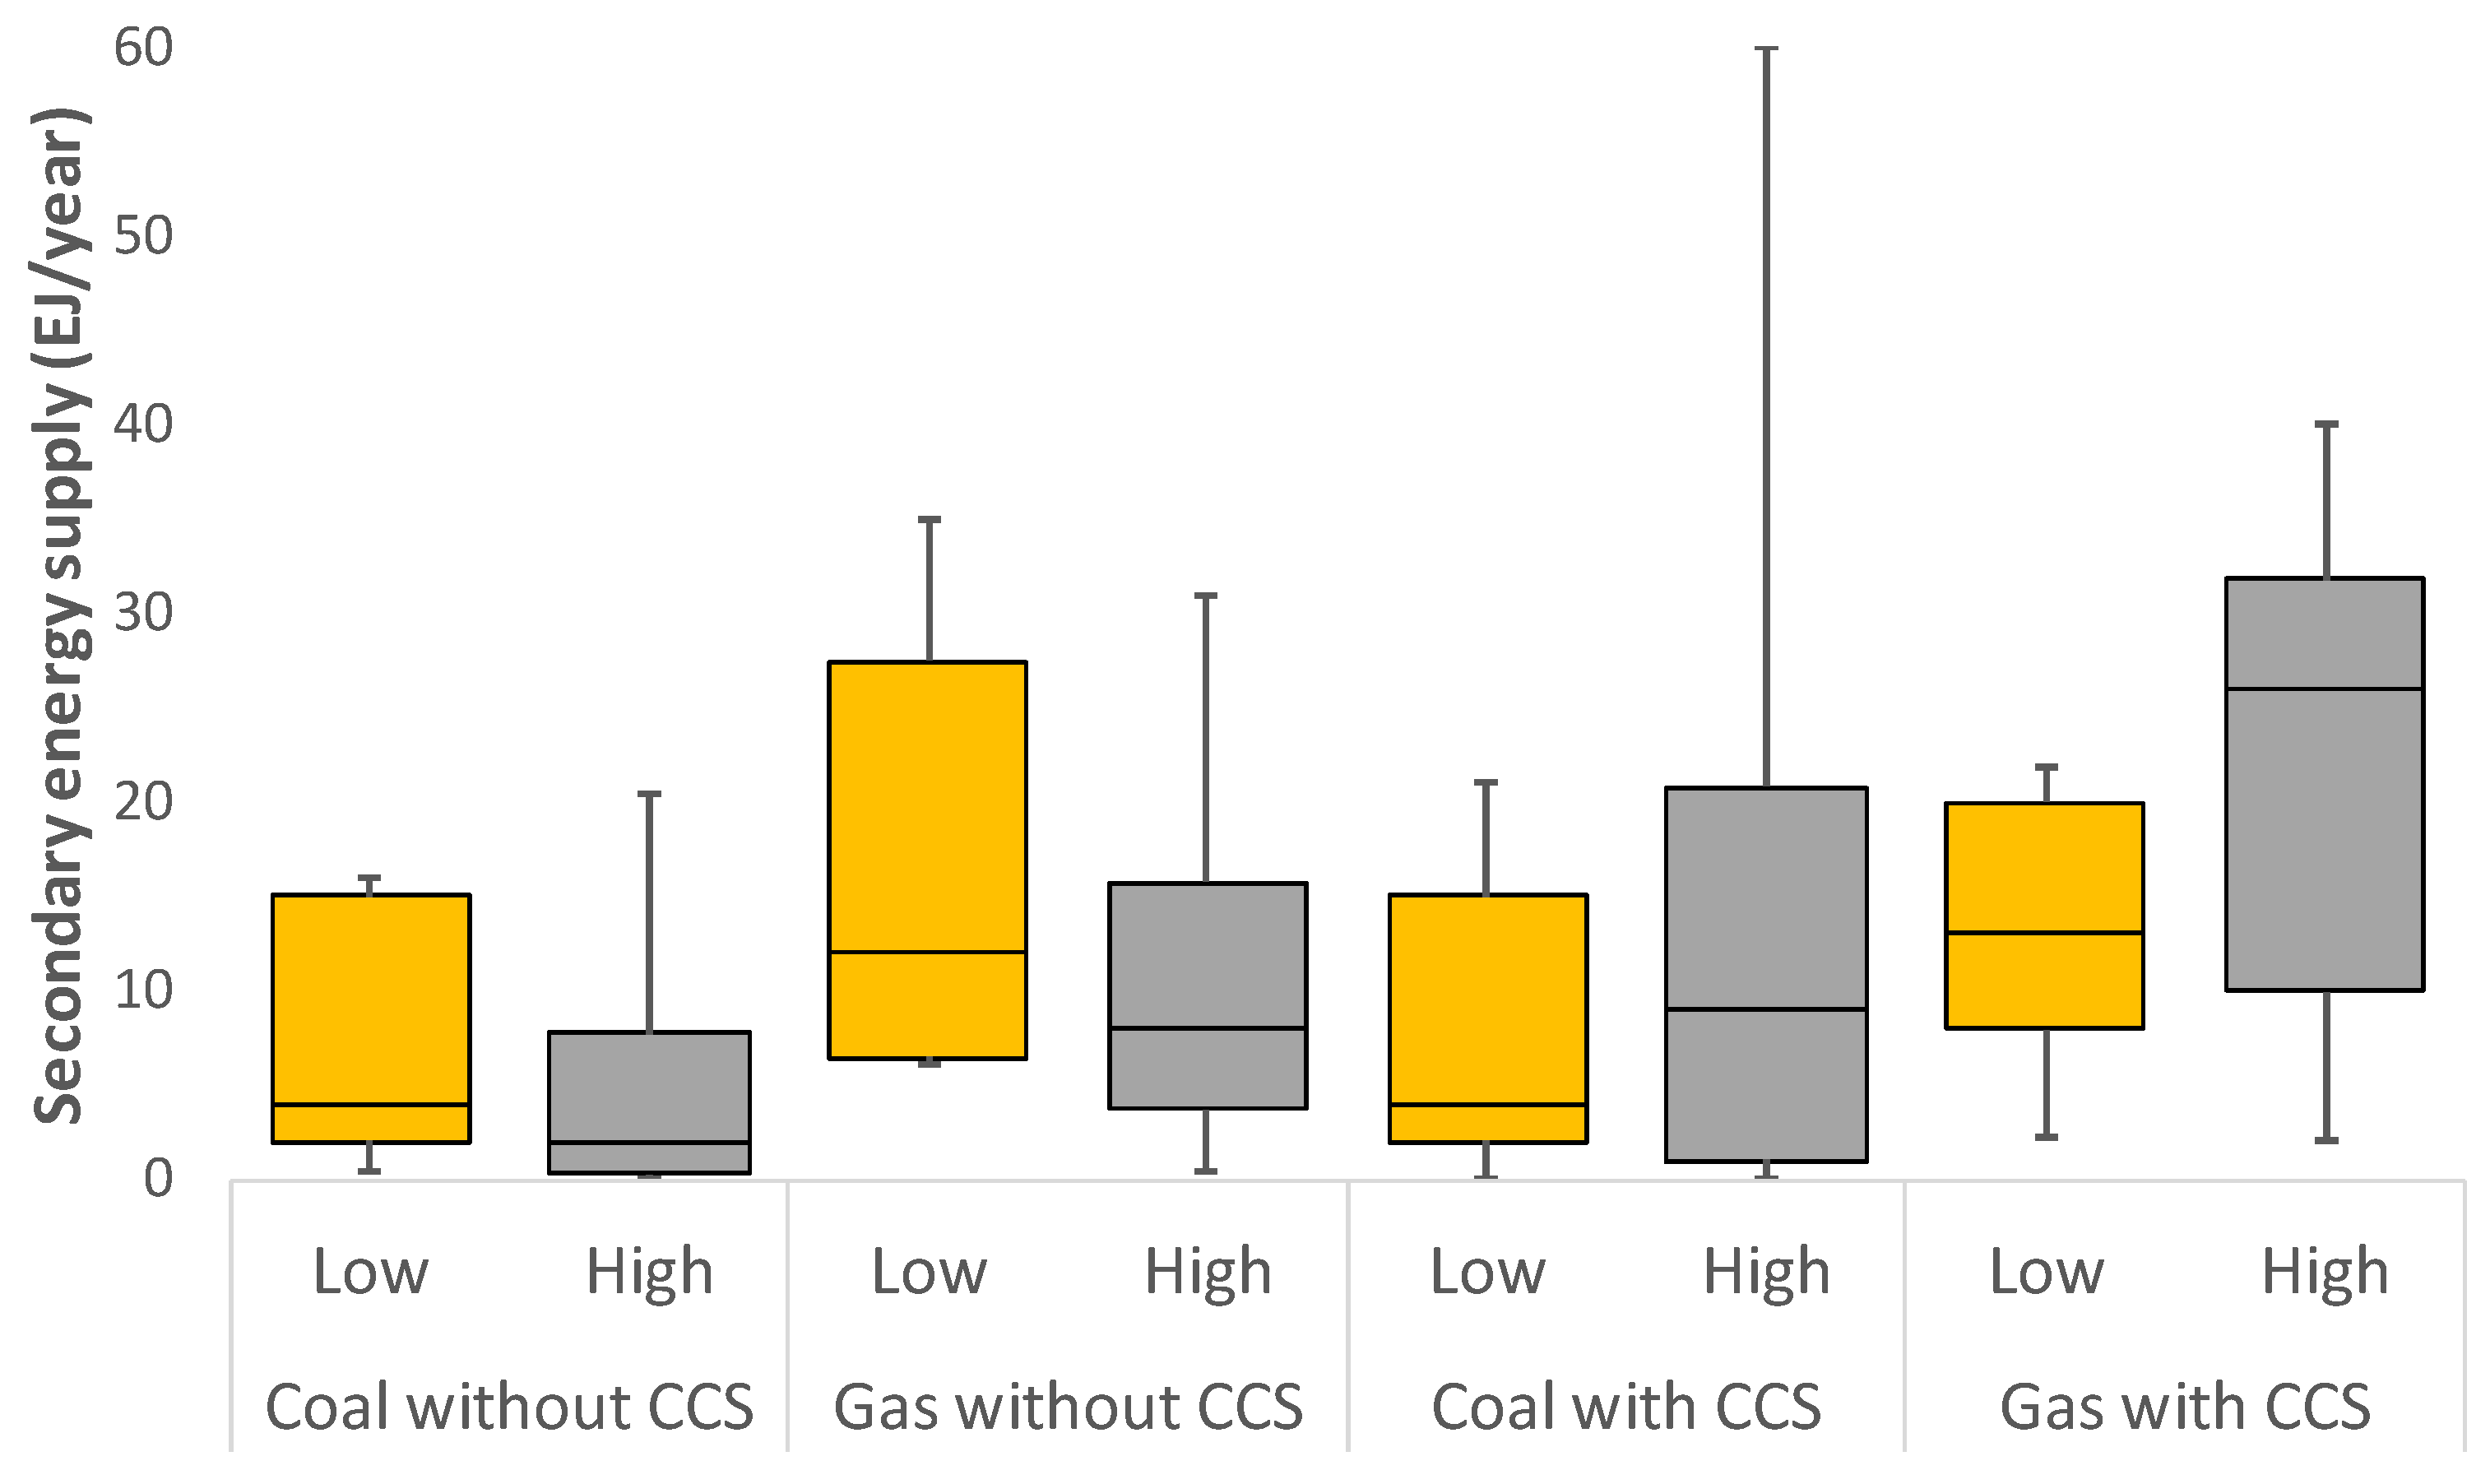
  • Carbon capture and storage technologies can reduce GHG emissions from coal as an energy source. These technologies are now viable, but they have high capital cost and high operating cost. These costs have been much higher than anticipated during planning and design. The success of CCUS operations has been mixed, with some CCUS plants being decommissioned due to high operating costs. The higher costs of CCUS were practical when coal was a lower-cost energy source. They may not be practical with the low cost and low GHG intensity of gas and the rapidly dropping cost of renewable energy sources.
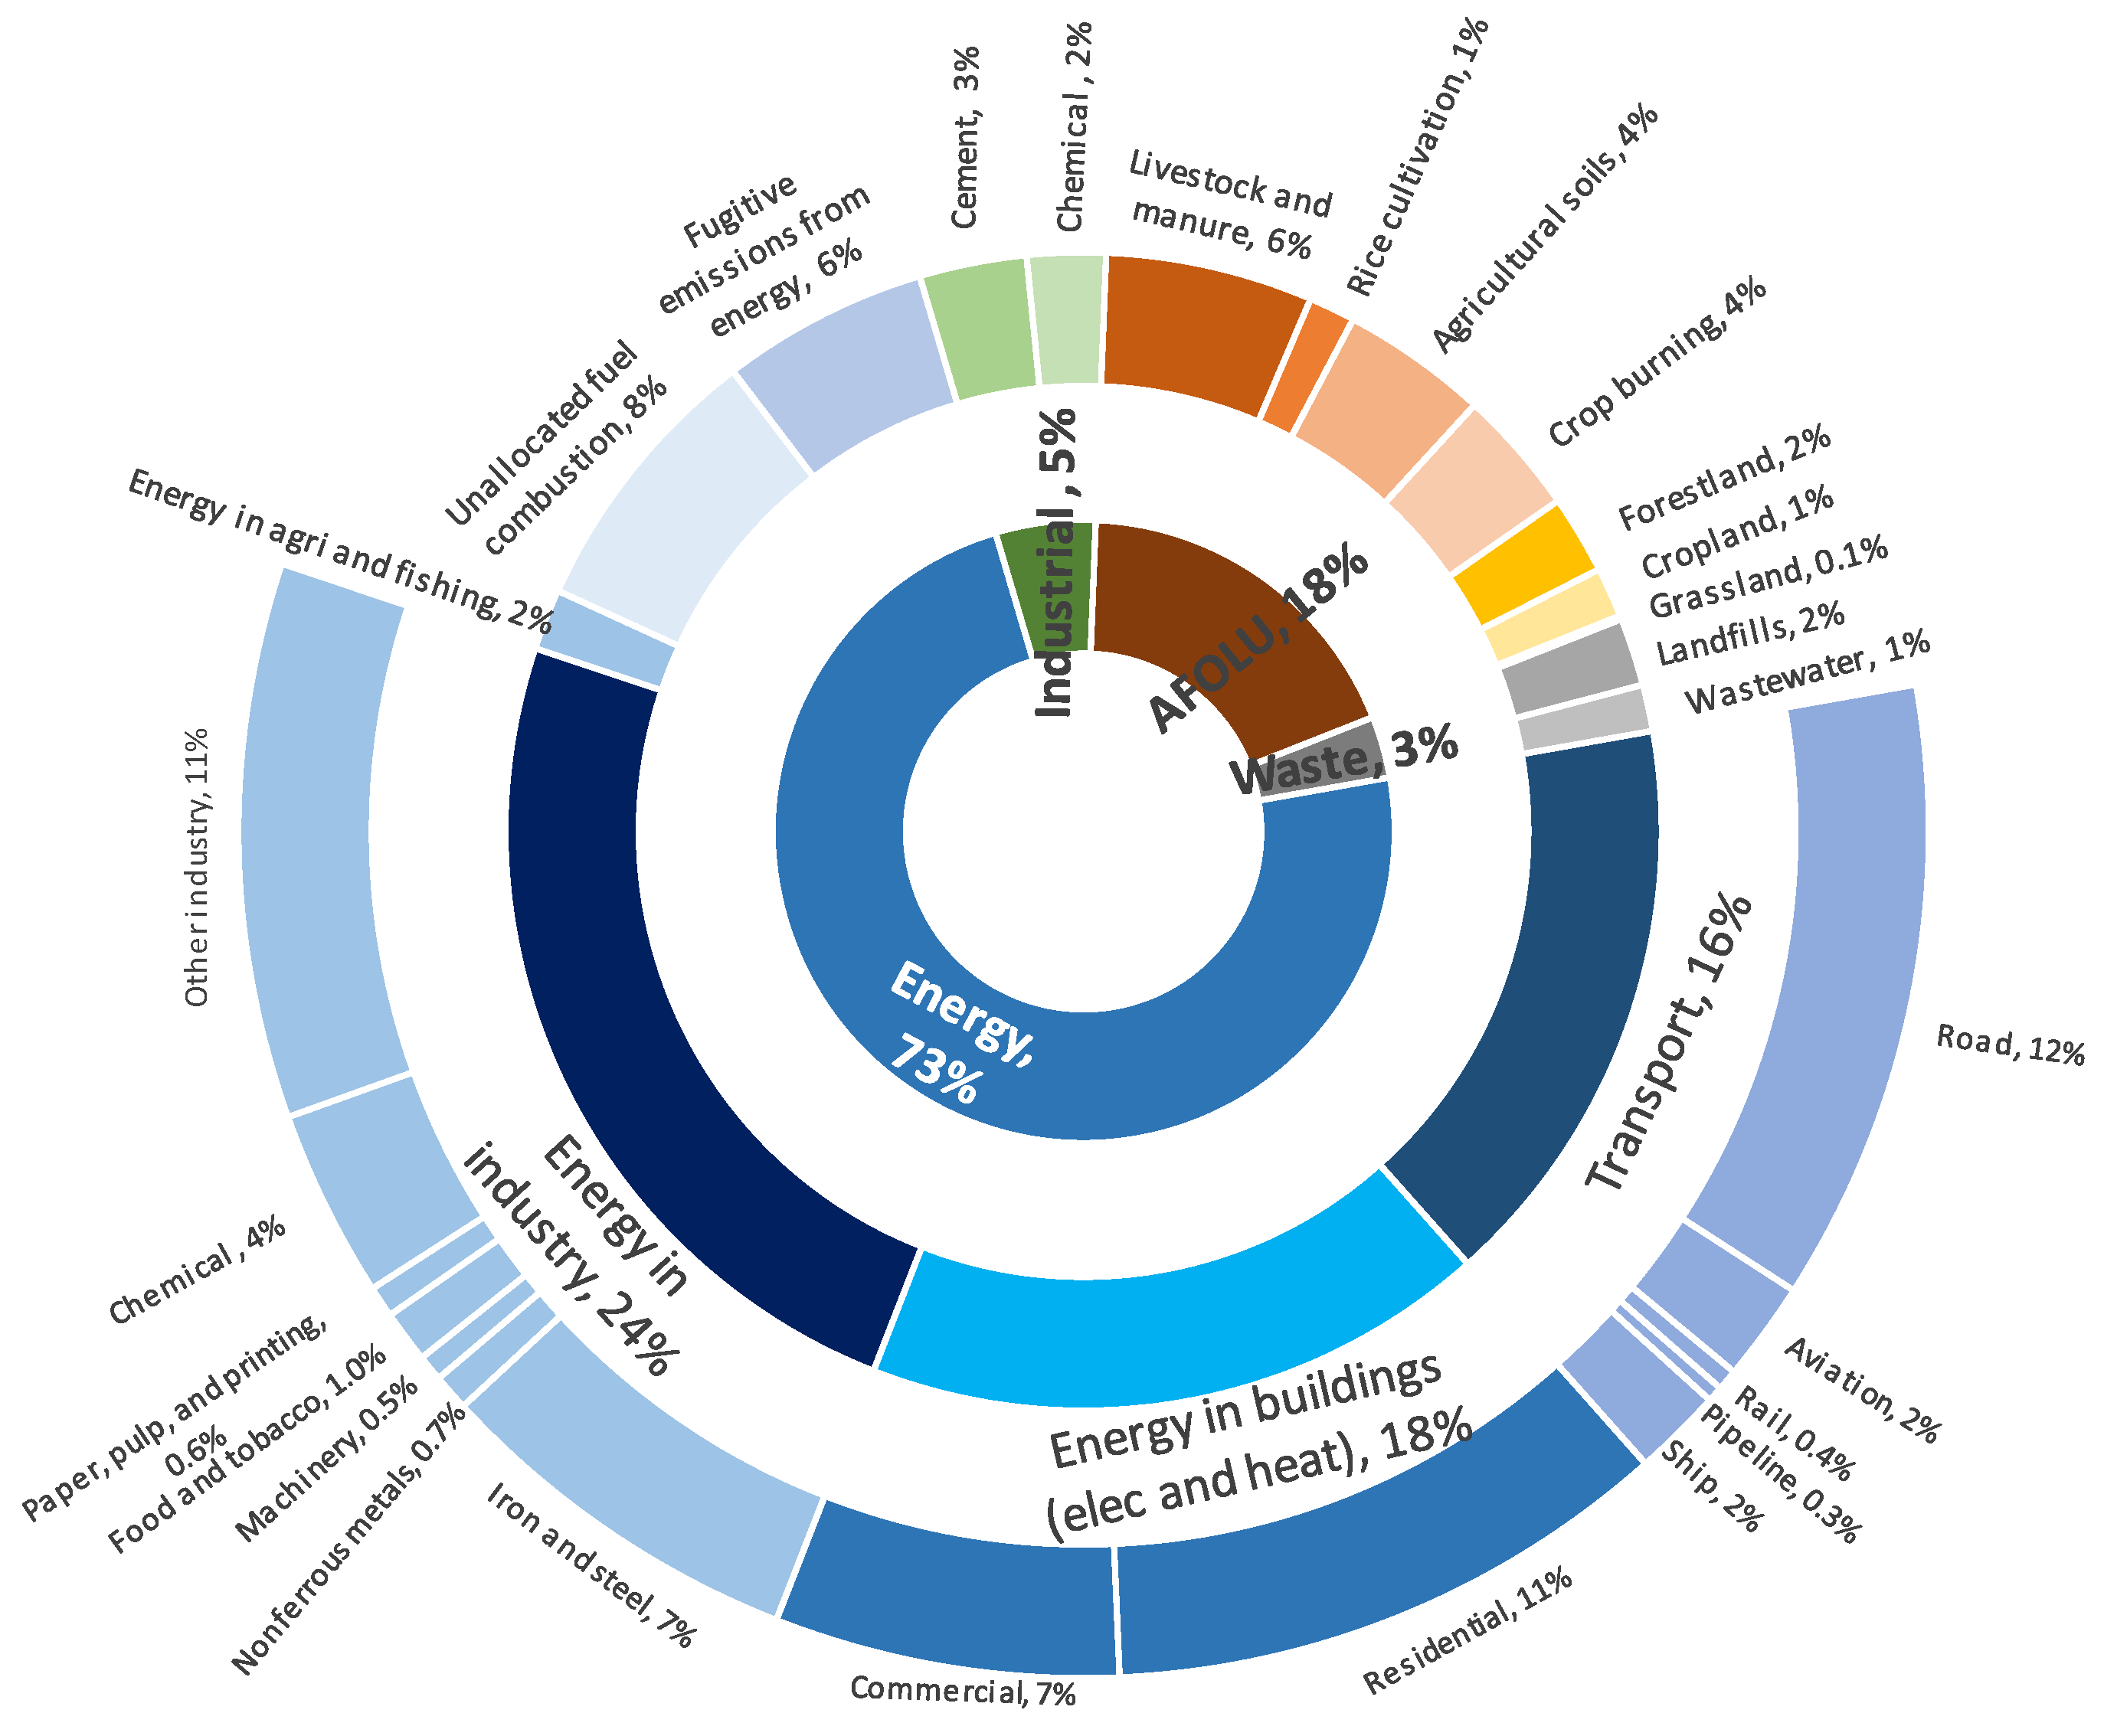
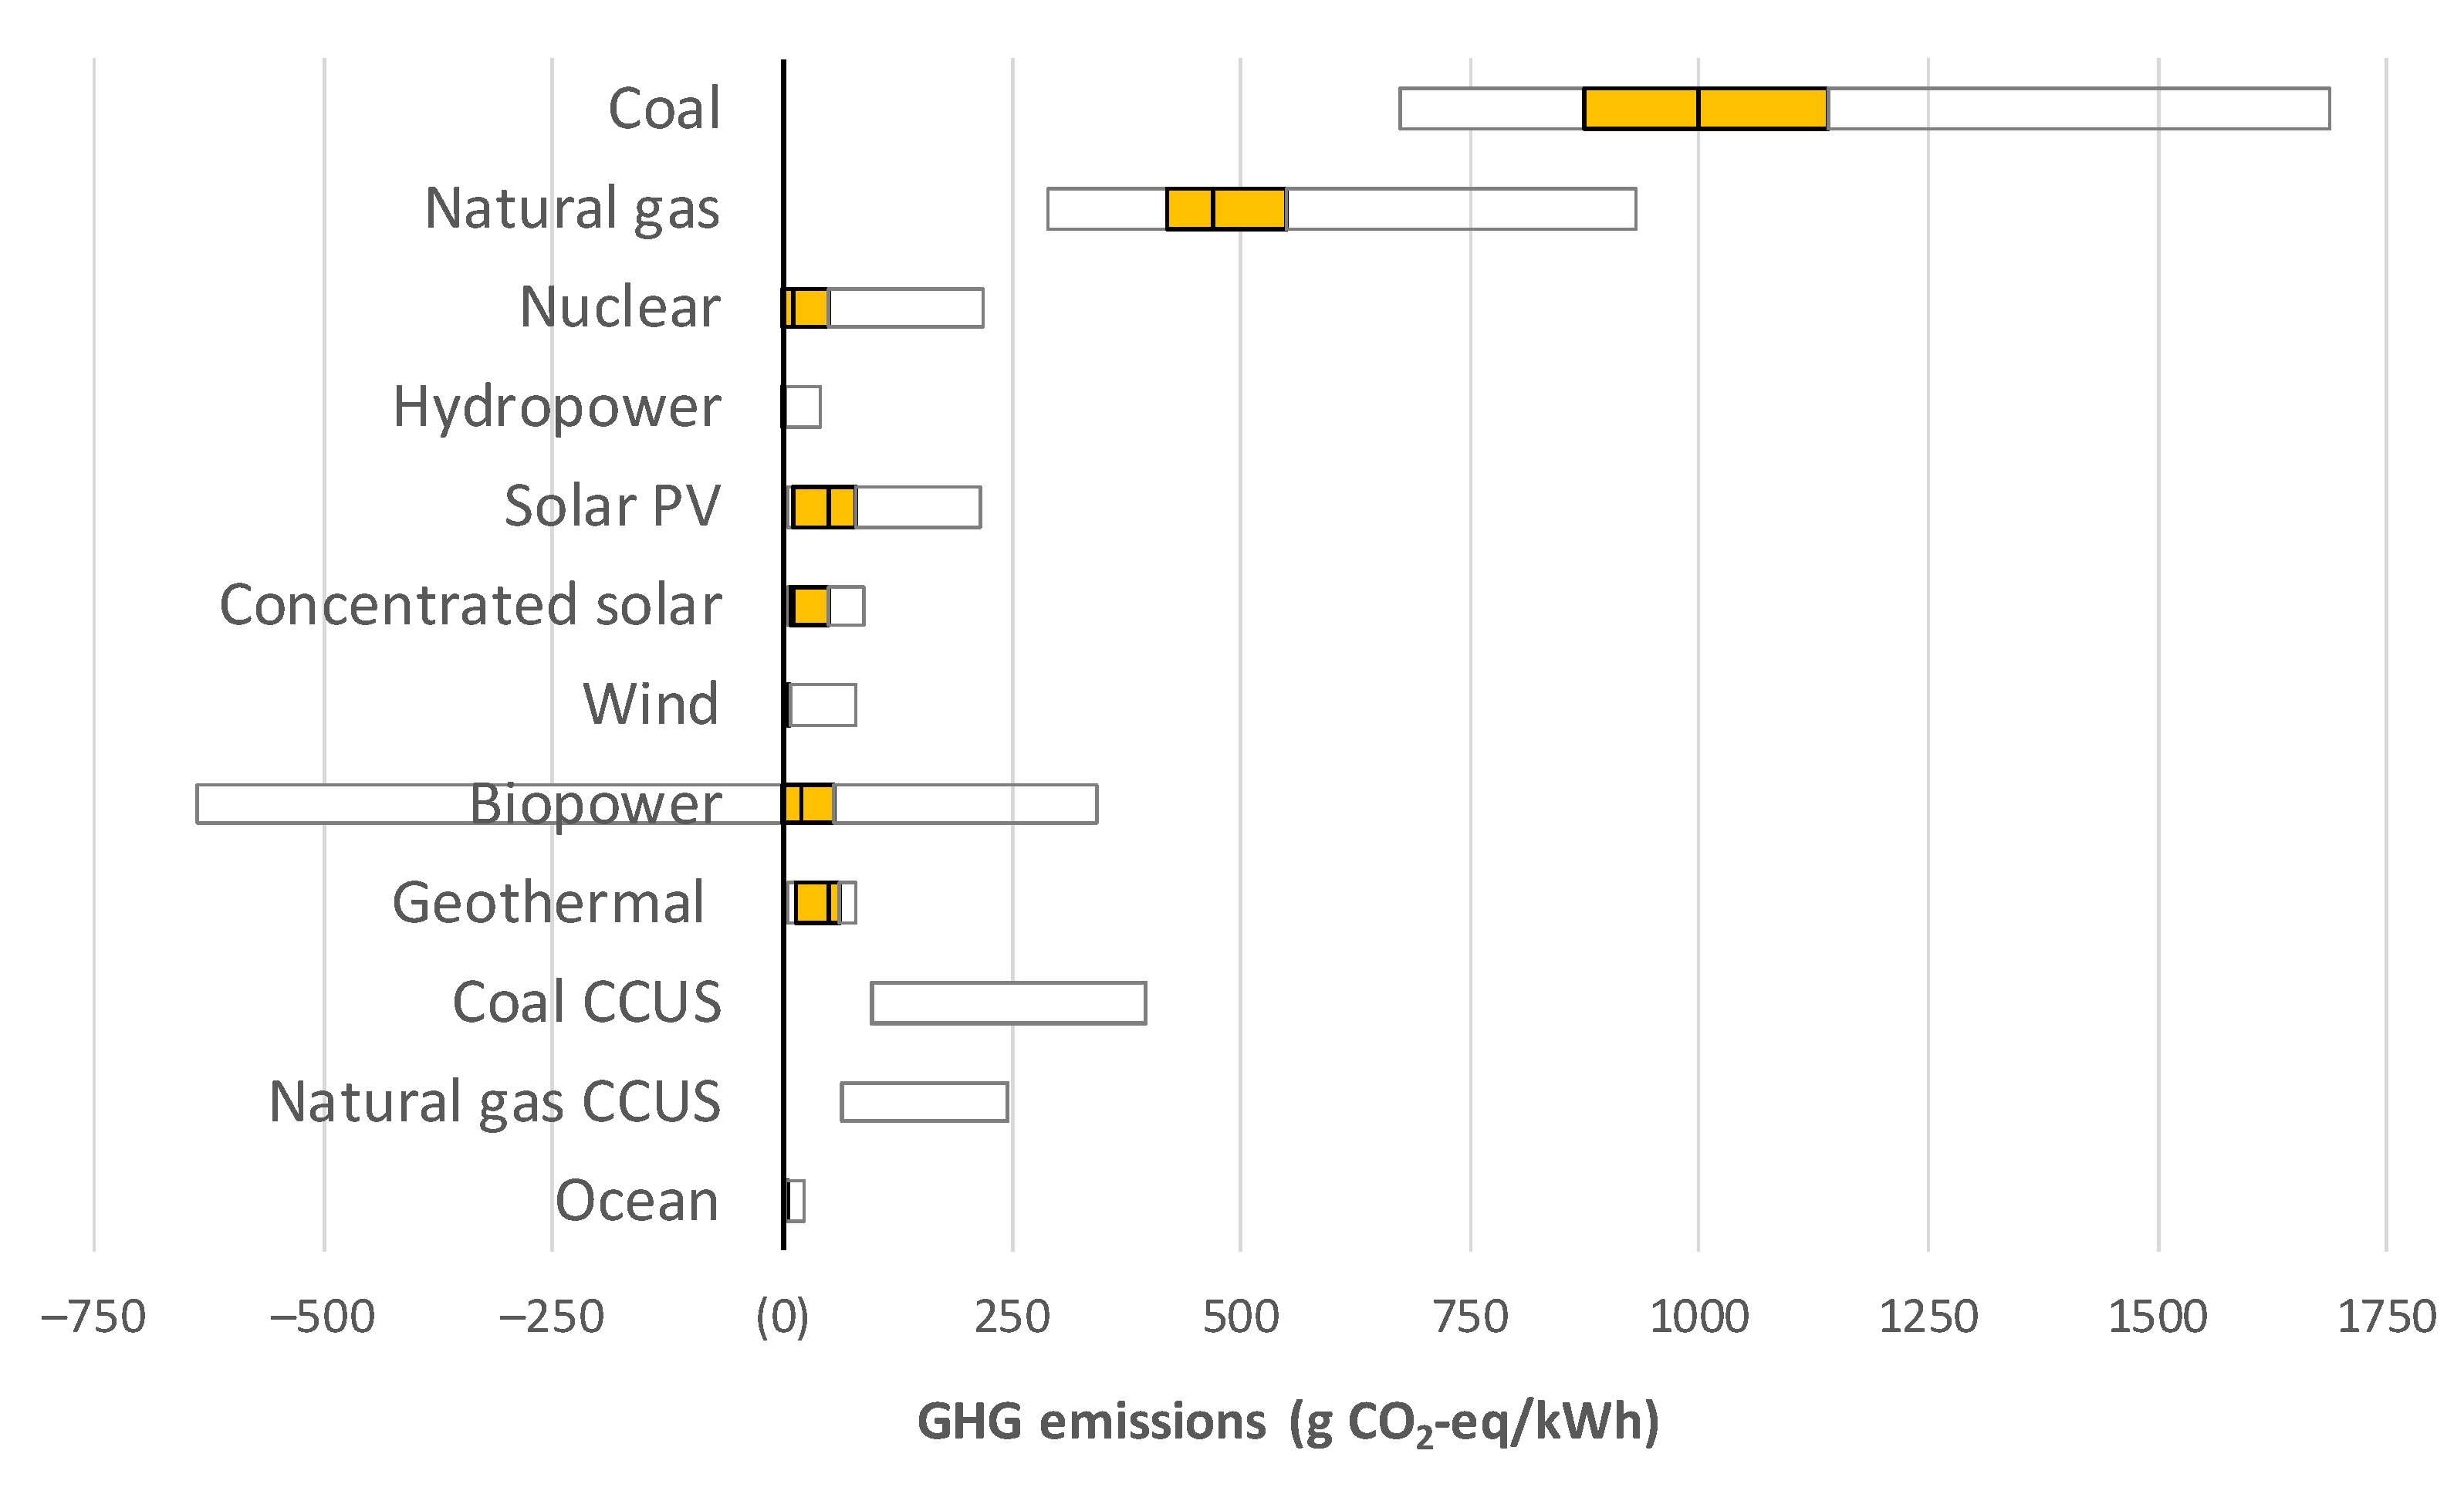
  • Power generation from coal is a major source of GHG emissions, but is one of the several contributors to climate change. Emissions associated with combustion of other fossil fuels, for transportation and energy generation (such as natural gas and oil), are higher than the overall emissions from coal-power generation. Moreover, agriculture, forestry, and other land-use activities are also important as they are the main sources of methane and nitrous oxide, which are potent GHGs. Achieving substantial global emission reductions will need interventions and change of practices in all sectors to effectively mitigate GHGs.

Author Contributions

Literature review and writing of original draft—H.A.A.-V.; interviews, funding acquisition, writing, and supervision—C.H.B. All authors have read and agreed to the published version of the manuscript.

Funding

Financial support for this study was provided by VCC, an organization that invests in businesses that produce sources of fossil energy.

Institutional Review Board Statement

Not applicable.

Informed Consent Statement

Not applicable.

Data Availability Statement

Not applicable.

Conflicts of Interest

The authors declare no conflict of interest.

References

  1. National Oceanic and Atmospheric Administration (NOAA). Global Climate Report-Annual 2021. Available online: https://www.ncei.noaa.gov/access/monitoring/monthly-report/global/202113 (accessed on 26 April 2022).
  2. Ritchie, H.; Roser, M. CO₂ and Greenhouse Gas Emissions. Available online: https://ourworldindata.org/co2-and-other-greenhouse-gas-emissions#how-have-global-co2-emissions-changed-over-time (accessed on 3 March 2022).
  3. Climate Watch. Historical GHG Emissions. Available online: https://www.climatewatchdata.org/ghg-emissions (accessed on 12 January 2021).
  4. Ritchie, H. Sector by Sector: Where do Global Greenhouse gas Emissions Come from? Available online: https://ourworldindata.org/ghg-emissions-by-sector (accessed on 12 January 2021).
  5. Intergovernmental Panel on Climate Change (IPCC). Climate Change 2014: Mitigation of Climate Change. Contribution of Working Group III to the Fifth Assessment Report of the Intergovernmental Panel on Climate Change; Edenhofer, O., Pichs-Madruga, R., Sokona, Y., Farahani, E., Kadner, S., Seyboth, K., Adler, A., Baum, I., Brunner, S., Eickemeier, P., et al., Eds.; Cambridge University Press: Cambridge UK; New York, NY, USA, 2014. [Google Scholar]
  6. U.S. Environmental Protection Agency (U.S. EPA). Inventory of U.S. Greenhouse Gas. Emissions and Sinks: 1990–2019; United States Environmental Protection Agency: Washington, DC, USA, 2021. [Google Scholar] [CrossRef]
  7. Tabeta, S. China Plans to Phase out Conventional Gas-Burning Cars by 2035. Nikkei Asia. 27 October 2020. Available online: https://asia.nikkei.com/Business/Automobiles/China-plans-to-phase-out-conventional-gas-burning-cars-by-2035 (accessed on 5 March 2022).
  8. NPR. U.S. Officially Rejoins Paris Agreement on Climate Change. Environment NPR. 19 February 2021. Available online: https://www.npr.org/2021/02/19/969387323/u-s-officially-rejoins-paris-agreement-on-climate-change (accessed on 5 March 2022).
  9. Meredith, S. Big Oil CEO Says Going Green ‘Will Have a Cost for Everybody’—and Governments Need to Explain That. CNBC. 3 February 2021. Available online: https://www.cnbc.com/2021/02/03/oil-total-ceo-says-going-green-will-have-a-cost-for-everybody.html (accessed on 5 March 2022).
  10. Matthews, C.M. Exxon to Create ‘Low Carbon’ Business Unit as It Faces Activists. Wall Street J. 1 February 2021. Available online: https://www.wsj.com/articles/exxon-to-create-low-carbon-business-unit-as-it-faces-activists-11612219400 (accessed on 5 March 2022).
  11. Fleeson, W. ExxonMobil Unveils Vision for $100-bil Texas Carbon Capture Hub. Available online: https://cleanenergynews.ihsmarkit.com/research-analysis/exxonmobil-unveils-vision-for-100billion-carbon-capture-hub.html (accessed on 26 April 2022).
  12. McDonald, M. Rockefeller Foundation Plans to Divest Fossil Fuel Holdings. Bloom. N. 18 December 2020. Available online: https://www.bloomberg.com/news/articles/2020-12-18/rockefeller-foundation-plans-to-divest-fossil-fuel-holdings (accessed on 19 February 2022).
  13. Wayland, M. General Motors Plans to Exclusively Offer Electric Vehicles by 2035. CNBC. 28 January 2021. Available online: https://www.cnbc.com/2021/01/28/general-motors-plans-to-exclusively-offer-electric-vehicles-by-2035.html (accessed on 5 March 2022).
  14. Boston, W. Electric Vehicles Make Up More Than a Third of Volvo’s Sales in Europe. Wall Street J. 4 February 2021. Available online: https://www.wsj.com/articles/electric-vehicles-make-up-more-than-a-third-of-volvos-sales-in-europe-11612448847 (accessed on 5 March 2022).
  15. Campbell, P. Aston Martin Promises to Make Electric Models in UK. Financ. Times. 6 March 2021. Available online: https://www.ft.com/content/6127125e-fbe5-4900-bd8d-54cc01d8922b (accessed on 26 April 2022).
  16. International Energy Agency (IEA). Data and Statistics. 2020. Available online: https://www.iea.org/ (accessed on 24 January 2021).
  17. International Energy Agency (IEA). Coal 2020. Available online: https://www.iea.org/reports/coal-2020 (accessed on 19 November 2021).
  18. Slav, I.U.S. Natural Gas Prices Get Caught Up in Perfect Storm. Oil Price. 9 May 2022. Available online: https://oilprice.com/Energy/Gas-Prices/US-Natural-Gas-Prices-Get-Caught-Up-In-Perfect-Storm.html (accessed on 11 May 2022).
  19. National Renewable Energy Laboratory (NREL). Life Cycle Greenhouse Gas Emissions from Electricity Generation: Update. Available online: https://www.nrel.gov/analysis/life-cycle-assessment.html (accessed on 5 October 2021).
  20. International Energy Agency (IEA). Global Energy Review. 2020. Available online: https://www.iea.org/reports/global-energy-review-2020 (accessed on 19 November 2021).
  21. International Energy Agency (IEA). Coal 2021. Available online: https://www.iea.org/reports/coal-2021 (accessed on 27 April 2022).
  22. International Monetary Fund (IMF). World Economic Outlook: A Long and Difficult Ascent; International Monetary Fund: Washington, DC, USA, 2020. [Google Scholar]
  23. International Energy Agency (IEA). Electricity Market Report-January 2022. Available online: https://www.iea.org/reports/electricity-market-report-january-2022 (accessed on 5 May 2022).
  24. Hook, L.; Hume, N. Will the Ukraine War Derail the Green Energy Transition? Financ. Times. 8 March 2022. Available online: https://www.ft.com/content/93eb06ec-ba6c-4ad2-8fae-5b66235632b2 (accessed on 9 May 2022).
  25. Strasburg, J.; Dvorak, P. Ukraine War Drives Countries to Embrace Renewable Energy–but Not Yet. Wall Street J. 4 April 2022. Available online: https://www.wsj.com/articles/oil-gas-russia-renewable-energy-solar-wind-power-europe-11649086062 (accessed on 9 May 2022).
  26. Curry, A. How the Ukraine War Is Accelerating Germany’s Renewable Energy Transition. Natl. Geogr. 6 May 2022. Available online: https://www.nationalgeographic.com/environment/article/how-the-ukraine-war-is-accelerating-germanys-renewable-energy-transition (accessed on 9 May 2022).
  27. Tollefson, J. What the War in Ukraine Means for Energy, Climate and Food. Nature 2022, 604, 232–233. [Google Scholar] [CrossRef] [PubMed]
  28. Campbell, M. Renewable Energy Prices Soar as Ukraine War Is the “Last Straw” for the Sector. Eur. N. 13 April 2022. Available online: www.euronews.com/green (accessed on 9 May 2022).
  29. International Energy Agency (IEA). Global Energy Review. 2021. Available online: https://www.iea.org/reports/global-energy-review-2021/co2-emissions (accessed on 26 April 2022).
  30. Burnham, A.; Han, J.; Clark, C.E.; Wang, M.; Dunn, J.B.; Palou-Rivera, I. Life-Cycle Greenhouse Gas Emissions of Shale Gas, Natural Gas, Coal, and Petroleum. Environ. Sci. Technol. 2012, 46, 619–627. [Google Scholar] [CrossRef] [PubMed]
  31. Aguirre-Villegas, H.A.; Benson, C.H. Case History of Environmental Impacts of an Indonesian Coal Supply Chain. J. Clean. Prod. 2017, 157. [Google Scholar] [CrossRef]
  32. Bruckner, T.; Bashmakov, I.A.; Mulugetta, Y.; Chum, H.; Navarro Ad Edmonds, J.; Faaij, A.; Fungtammasan, B.; Garg, A.; Hertwich, E.; Honnery, D. 2014: Energy Systems. In Climate Change 2014: Mitigation of Climate Change. Contribution of Working Group III to the Fifth Assessment Report of the Intergovernmental Panel on Climate Change; Edenhofer, O., Pichs-Madruga, R., Sokona, Y., Farahani, E., Kadner, S., Seyboth, K., Adler, A., Baum, I., Brunner, S., Eickemeier, P., et al., Eds.; Cambridge University Press: Cambridge, UK; New York, NY, USA, 2014. [Google Scholar]
  33. International Energy Agency (IEA). Greenhouse Gas Emissions from Energy Data Explorer. Available online: https://www.iea.org/articles/greenhouse-gas-emissions-from-energy-data-explorer (accessed on 5 December 2021).
  34. Roser, M.H.R. Greenhouse Gas Emissions. Available online: https://ourworldindata.org/greenhouse-gas-emissions (accessed on 5 December 2021).
  35. Gonzales, V.; Krupnick, A.; Dunlap, L. Carbon Capture and Storage 101. Available online: https://media.rff.org/documents/CCS_101.pdf (accessed on 3 July 2021).
  36. Taft, M. Available online: https://gizmodo.com/the-only-carbon-capture-plant-in-the-u-s-just-closed-1846177778 (accessed on 3 July 2021).
  37. International Energy Agency (IEA). About CCUS. Available online: https://www.iea.org/reports/about-ccus (accessed on 5 October 2021).
  38. Schmelz, W.J.; Hochman, G.; Miller, K.G. Total Cost of Carbon Capture and Storage Implemented at a Regional Scale: Northeastern and Midwestern United States. Interface Focus 2020, 10, 20190065. [Google Scholar] [CrossRef] [PubMed]
  39. ExxonMobil. ExxonMobil Low Carbon Solutions to Commercialize Emission-Reduction Technology. 2021. Available online: https://corporate.exxonmobil.com/News/Newsroom/News-releases/2021/0201_ExxonMobil-Low-Carbon-Solutions-to-commercialize-emission-reduction-technology (accessed on 25 January 2022).
  40. European Commission. EU Emissions Trading System (EU ETS). Available online: https://ec.europa.eu/clima/eu-action/eu-emissions-trading-system-eu-ets_en (accessed on 5 October 2021).
  41. European Commission. Carbon Capture, Use and Storage. Available online: https://ec.europa.eu/clima/eu-action/carbon-capture-use-and-storage_en (accessed on 5 October 2021).
  42. International Energy Agency (IEA). World Energy Outlook. 2019. Available online: https://www.iea.org/reports/world-energy-outlook-2019 (accessed on 25 January 2021).
  43. Curtis, T.L.; Buchanan, H.; Heath, G.; Smith, L.; Shaw, S. Solar Photovoltaic Module Recycling: A Survey of U.S. Policies and Initiatives; National Renewable Energy Laboratory: Golden, CO, USA, 2021. [Google Scholar]
  44. Cross, J.; Murray, D. The Afterlives of Solar Power: Waste and Repair off the Grid in Kenya. Energy Res. Soc. Sci. 2018, 44, 100–109. [Google Scholar] [CrossRef]
  45. Majdi, A.; Alqahtani, M.D.; Almakytah, A.; Saleem, M. Fundamental Study Related to the Development of Modular Solar Panel for Improved Durability and Repairability. IET Renew. Power Gener. 2021, 15, 1382–1396. [Google Scholar] [CrossRef]
  46. Lai, C.S.; Jia, Y.; Lai, L.L.; Xu, Z.; McCulloch, M.D.; Wong, K.P. A Comprehensive Review on Large-Scale Photovoltaic System with Applications of Electrical Energy Storage. Renew. Sustain. Energy Rev. 2017, 78, 439–451. [Google Scholar] [CrossRef]
  47. Ware, J. End of Coal in Sight at COP26. United Nations Clim. Chang. 4 November 2021. Available online: https://unfccc.int/news/end-of-coal-in-sight-at-cop26 (accessed on 5 March 2022).
  48. Thomas, H. Glencore’s ‘Deadly Addiction’ Will Keep Causing Problems. Financ. Times. 19 April 2022. Available online: https://www.ft.com/content/74e67088-0ca5-4f17-a557-6bb7389f522e (accessed on 9 May 2022).
Figure 1. Global GHG emissions by sector, where AFOLU is agriculture, forestry, and other land use, adapted from [4].
Energies 15 03739 g001
Figure 2. Change in total annual CO2 emission from fossil fuel combustion by year, adapted from IPCC (2014) Figure 1.8, page 47 [5].
Energies 15 03739 g002
Figure 3. Components of global energy supply (a), energy sources for electrical generation (b), and electricity consumption by sector (c). Source: IEA (2020), World Energy Balances 2020. All rights reserved [16].
Energies 15 03739 g003
Figure 4. Annual change in global power generation by energy source for the period 2018–2024. Source: IEA (2020), Electricity Market Report – January 2022. All rights reserved adapted from [23].
Energies 15 03739 g004
Figure 5. Annual change in global CO2 emissions from energy. Source: IEA (2020 and 2021), Global Energy Review 2020. All rights reserved [20,29].
Energies 15 03739 g005
Figure 6. Life-cycle GHG emissions from electricity produced by each fuel source and projected emissions for technologies with carbon capture, utilization, and storage (CCUS), adapted from IPCC (2011) Figure 7.6, page 539 [32].
Energies 15 03739 g006
Figure 7. Current and projected regional coal production under stated policies and sustainable policies. Source: IEA (2020), World Energy Balances 2020. All rights reserved [16].
Energies 15 03739 g007
Figure 8. Current (2010–2018) and projected (2019–2040) electricity generation mix under stated policy and sustainable development policy scenarios. Source: IEA (2019), World Energy Outlook 2020. All rights reserved [42].
Energies 15 03739 g008
Figure 9. Modeling results of mitigation scenarios reaching 450–500 ppm CO2-eq concentrations by 2100 showing the influence of energy demand (low energy demand: <20% growth; high energy demand: >20% growth in 2050 compared with 2010) on coal and natural gas technologies in 2050, adapted from IPCC (2014) Figure 4.2, page 100 [5].
Energies 15 03739 g009
Figure 10. Regional investment in coal supply. Source: IEA (2020), Coal 2020. All rights reserved adapted from [17].
Energies 15 03739 g010
Figure 11. Current (2010–2018) and projected (2019–2040) investments in the power sector under stated policy and sustainable development policy scenarios. Source: IEA (2019), World Energy Outlook 2020. All rights reserved [42].
Energies 15 03739 g011
Table 1. Mitigation strategies of the energy sector (adapted from Table TS.3 from [5]).
Mitigation StrategyMitigation Impacts
GHG emission intensity reductionGreater deployment of renewable energy, nuclear energy, and bioenergy with carbon capture, utilization, and storage (BECCUS); fuel switching within the group of fossil fuels; reduction of fugitive (methane) emissions in the fossil fuel chain
Energy intensity reduction by improving technical
efficiency
Extraction, transport, and conversion of fossil fuels; electricity/heat/fuel transmission, distribution, and storage; Combined heat and power (CHP) or cogeneration
Production and resource
efficiency improvement
Energy embodied in the manufacturing of energy extraction, conversion, transmission, and distribution technologies
Structural and systems
efficiency improvement
Addressing integration needs
Activity change (final
energy use)
Behavioral change (e.g., thermostat setting, appliance use); lifestyle change (e.g., per capita dwelling size, adaptive comfort); reduced demand for, for example, products such as clothing; alternative forms of travel leading to reduced demand for car manufacturing
Table 2. Summary of potential benefits (green) and negative side effects (red) of the most important mitigation strategies in the energy supply sector (> denotes higher impact or benefit, and < denotes reduced impact or benefit) (source: Table TS.4, adapted from [5]).
Energy Source Replacing CoalEffects
EconomicSocialEnvironmentalOther
Nuclear energy> Energy security (reduced exposure to fuel price volatility)
> Local employment (but uncertain net effect)
> Legacy cost of waste and abandoned reactors
Health impact via
< Air pollution and coal mining accidents
> Nuclear accidents and waste treatment, uranium mining and milling
> Safety and waste concerns
Ecosystem impact via
< Air pollution and coal mining
> Nuclear accidents
Proliferation risk
Renewable energy *> Energy security (resource sufficiency, diversity in the near/medium term)
> Local employment impact (but uncertain net effect)
> Irrigation, flood control, navigation, water availability (for multipurpose use of reservoirs and regulated rivers)
> Extra measures to match demand (for PV, wind, and some concentrated solar)
Health impact via
< Air pollution (except bioenergy)
< Coal mining accidents
> Contribution to (off-grid) energy access
> Project-specific public acceptance concerns (e.g., visibility of wind)
> Threat of displacement (for large hydro)
Ecosystem impact via
< Air pollution (except bioenergy)
< Coal mining
> Habitat impact (for some hydro)
> Landscape and wildlife impact (for wind)
< Water use (for wind and PV)
> Water use (for bioenergy, concentrated solar, geothermal, and reservoir hydro)
Higher use of critical metals for PV and
direct drive wind
turbines
Fossil fuels with CCUS> Preservation and
> lock-in of human and physical capital in the fossil industry
Health impact via
> Risk of CO2 leakage
> Upstream supply-chain activities
> Safety concerns (CO2 storage and transport)
> Ecosystem impact via upstream supply-chain activities
> Water use
Long-term monitoring of CO2
storage
* Renewable energy includes wind, PV, concentrated solar, hydro, geothermal, and bioenergy.
Publisher’s Note: MDPI stays neutral with regard to jurisdictional claims in published maps and institutional affiliations.

