Abstract
Non-renewable-resource consumption and global greenhouse-gas (GHG) emissions are critical issues that pose a significant threat to sustainable development. Solar energy is a promising source to generate renewable energy and an appealing alternative electricity source for households. The primary goal of this research is to detect the rooftops that have no solar photovoltaic (PV) system deployed on them but that receive moderate to high solar-energy radiation using the Geographic Information System (GIS) and deep-learning techniques. Although various studies have been conducted on this subject, not many addressed these two issues simultaneously at a residential level. Identifying the installed solar PV systems in a large area can be expensive and time-consuming work if performed manually. Therefore, the deep-learning algorithm is an emerging alternative method to detect objects using aerial images. We employed the Single-Shot-Detector (SSD) model with the backbone of residual neural network 34 (ResNet34) to detect the solar PV systems and used GIS software to compute solar isolation and calculate the electricity production estimate (EPE) of each rooftop. Our results show that the SSD model detected 6010 solar panels on 4150 properties with an accuracy of 78% and observed that there were 176 Statistical Area 1s (SA1s) that had no rooftops with solar PV systems installed. Moreover, the total electricity production from the suitable area was estimated at over 929.8 Giga Watt-hours (GWhs) annually. Finally, the relation between solar-PV-system density and EPE was also identified using the bivariant correlation technique. Detecting the existing solar PV systems is useful in a broad range of applications including electricity-generation prediction, power-plant-production management, uncovering patterns between regions, etc. Examination of the spatial distribution of solar-energy potential in a region and performing an overlay analysis with socio-economic factors can help policymakers to understand the explanation behind the pattern and strategize the incentives accordingly.
1. Introduction
1.1. Greenhouse-Gas Emissions and Electricity Demand
Conventional fossil fuels have been substantially utilized since the industrial revolution in the 18th and 19th centuries [1,2], and as a result, numerous GHGs (e.g., CO2, CH4, etc.) have been discharged into the atmosphere. Despite reducing emissions in certain nations, GHG emissions are continuing to rise. Between the years 2009 and 2018, annual emissions increased by around 1.5% [3]. Carbon-dioxide (CO2) emissions account for more than 72% of global GHG emissions, and electricity generation is the largest sector of CO2 emissions, contributing almost 36% [4]. In 2019, there were more than a total of 30 billion tons of CO2 emissions produced by non-renewable resources [5]. In general, electricity demand has grown at an incredible rate all over the world, particularly in developing countries. For instance, between 1970 and 2005, electricity demand in the United Kingdom increased by 2.4% each year, reaching a peak of 357 TWh [6]. It is evident that our standard of life, particularly in urban areas, is heavily reliant on electricity, and the emission of GHGs is a major contributor to global warming and climate change, raising a significant threat to sustainable development.
Furthermore, according to the Department of Industry, Science, Energy and Resources, Australia also has a similar history of increasing electricity demand and fossil-fuel usage for electricity generation [7]. It is also viewed that electricity has an important social and economic function, both in terms of the standard of life of all Australians and as an intermediate input for all sectors, but coal has long been the primary source of electricity generation [8]. Despite the fact that renewable energy generation has grown in recent years, fossil-fuel sources still contributed 79% of Australian electricity generation in 2019 (coal 56%; gas 21%), with renewable-energy sources only accounting for 21% [6]. Furthermore, in territorial emissions per capita, Australia ranked 12th for having 16 t CO2/person in 2019 [9]. Therefore, it is critical to migrate to alternative methods for electricity generation and it would also benefit the Australian government to achieve its goal of reducing the Australian GHG emissions to 26–28% by 2030 as well as attaining net-zero emissions by 2050 [10].
1.2. Necessity of Renewable Energy and Solar Photovoltaic Systems
Concerns from scientists and the general public about the persistent consumption of fossil fuels and its intrinsic relation to accelerated global climate change have encouraged the current political discussion and policymaking [11,12]. It has been suggested that renewable energy can be seen as a viable option for Australia to solve these concerns; thus, renewable-energy potential, renewable-energy output, and laws and incentives must all be extensively researched and planned as a top priority [13]. Renewable energy is defined as energy derived from non-depletable sources that emit minimal greenhouse gases [14,15,16]. Given that an average of 1.6 MWh/m2 of solar energy is yearly cast onto the Earth’s surface, solar energy has the potential to meet the complete yearly global energy needs [13]. As per the Australian Renewable Energy Agency, if only 0.1% of incoming radiation could be transformed into useful energy at a 10% efficiency, solar energy could provide all of Australia’s energy demands [17].
Moreover, the development of equipment capable of capturing such resources is critical to successfully harnessing these renewable-energy possibilities [13,18,19]. The solar photovoltaic system is a viable electric power system designed to directly convert sunlight into direct-current electricity using photovoltaic cells. There were about 4.1 million small-scale renewable installations in Australia as of 30 April 2021, including over 2.8 million solar-power systems [7]. Photovoltaic systems are ideal for off-grid energy generation and when the cost of power generation from conventional sources is too high, such as in remote communities [17,20,21]. Technologies to convert solar into electricity are perhaps not extremely efficient at the current time, but these innovations are certainly sustainable and most likely to improve in the future. The average panel conversion efficiency has increased from 15% to well over 20% [22]. As the efficiency is rising, the cost is plummeting. The price of solar PV modules lowers by 28% every time the installed solar PV capacity doubles, according to an analysis of more than 40 years of data on solar PV modules. [23]. The government’s support to incentivize and promote solar PV installation through policies can significantly boost the process [24,25,26]. Hartner et al. suggested in their study the need to increase awareness about the need for policy incentives such as subsidy programs or tariff rules to avoid possible cost inefficiencies in integrating PV into the energy grid [27]. Furthermore, the Maltese government developed a subsidy system with the goal of stimulating residential PV installation, and the plan quickly attained the targeted adoption levels [24].
1.3. Related Works
A considerable amount of studies have been published on the importance of renewable sources, the role of solar energy, suitable PV-panel site selection, and the use of deep learning for object detection. Particularly in recent years, solar-energy-potential evaluation has become a high priority and widespread research issue, primarily due to a focus on alternative energy sources. The GIS has evolved into a critical and effective tool for assessing renewable-energy possibilities. Some of the most relevant studies on the utilization of the GIS and deep-learning technologies for the exploitation of solar energy are thoroughly reviewed and listed in Table 1, which includes reference, country title, and main findings.

Table 1.
Studies on assessment of solar-energy potential using GIS and deep learning.
The development of geospatial software and techniques has resulted in more efficient and affordable solutions for mapping and analyzing real-world problems. Suitable sites can effectively be selected using the GIS alone. For example, Al Garni and Awasthi used a GIS-AHP based approach for the site selection of solar PV power plants in Saudi Arabia [30]. The major purpose of this study was to use the GIS and a multi-criteria decision-making (MCDM) approach to analyze and select the optimal location for utility-scale solar PV installations. The methodology successfully produced a land-suitability index for possible areas where utility-scale grid-connected PV power facilities would be optimal. The superimposed result map revealed that 16% of the study region (300,000 km2) is promising and appropriate for building utility-scale PV power plants. The most favorable locations are in Saudi Arabia’s north and northwest [30]. Similarly, artificial intelligence (AI) has grown quickly in recent years, and in certain cases, it has equaled or even surpassed human accuracy and effectiveness. All of the existing literature provides valuable insight into the potential of GIS and deep-learning technologies along with the importance of renewable energy, particularly solar energy. The requirement to switch to renewable-energy sources for future suitability is undeniable. Such an undertaking would increase the possibility of the entire world to develop prudently. So, in this study, these effective and successful methodologies were considered and improved in order to generate useful results.
1.4. Aim and Objectives
The growing volume of energy consumption, the upsurge in fuel prices, the significant rise in GHG emissions, and climate change are the main factors for switching to renewable-energy sources. The above-mentioned issues can be tackled by adequately utilizing, monitoring, and promoting solar energy through solar PV systems. In addition, such use of renewable energy will not only help build a more vibrant, sustainable, and livable society but also improve the health and wellbeing of inhabitants. Many research papers have been published on solar-radiation assessment and site selection for solar PV systems, but this study took a different approach by combining the GIS and deep learning to gain deeper insight into solar-energy radiation and solar PV systems’ potential.
This project aims to demonstrate the advantages and potential of applying deep-learning algorithms and spatial analytical techniques to determine the most suitable rooftops to optimize the use of solar energy in Ballarat. The ultimate goal was to accelerate the migration towards renewable and sustainable energy by encouraging the use of solar PV systems.
The objectives of this research are:
- To detect the existing solar PV systems installed in the study area;
- To compute and examine the intensity and spatial distribution of the solar energy;
- To calculate the EPE for each property;
- To identify the areas with a lesser amount of solar PV systems but relatively high solar-power potential.
2. Materials and Methods
2.1. Study Area and Datasets
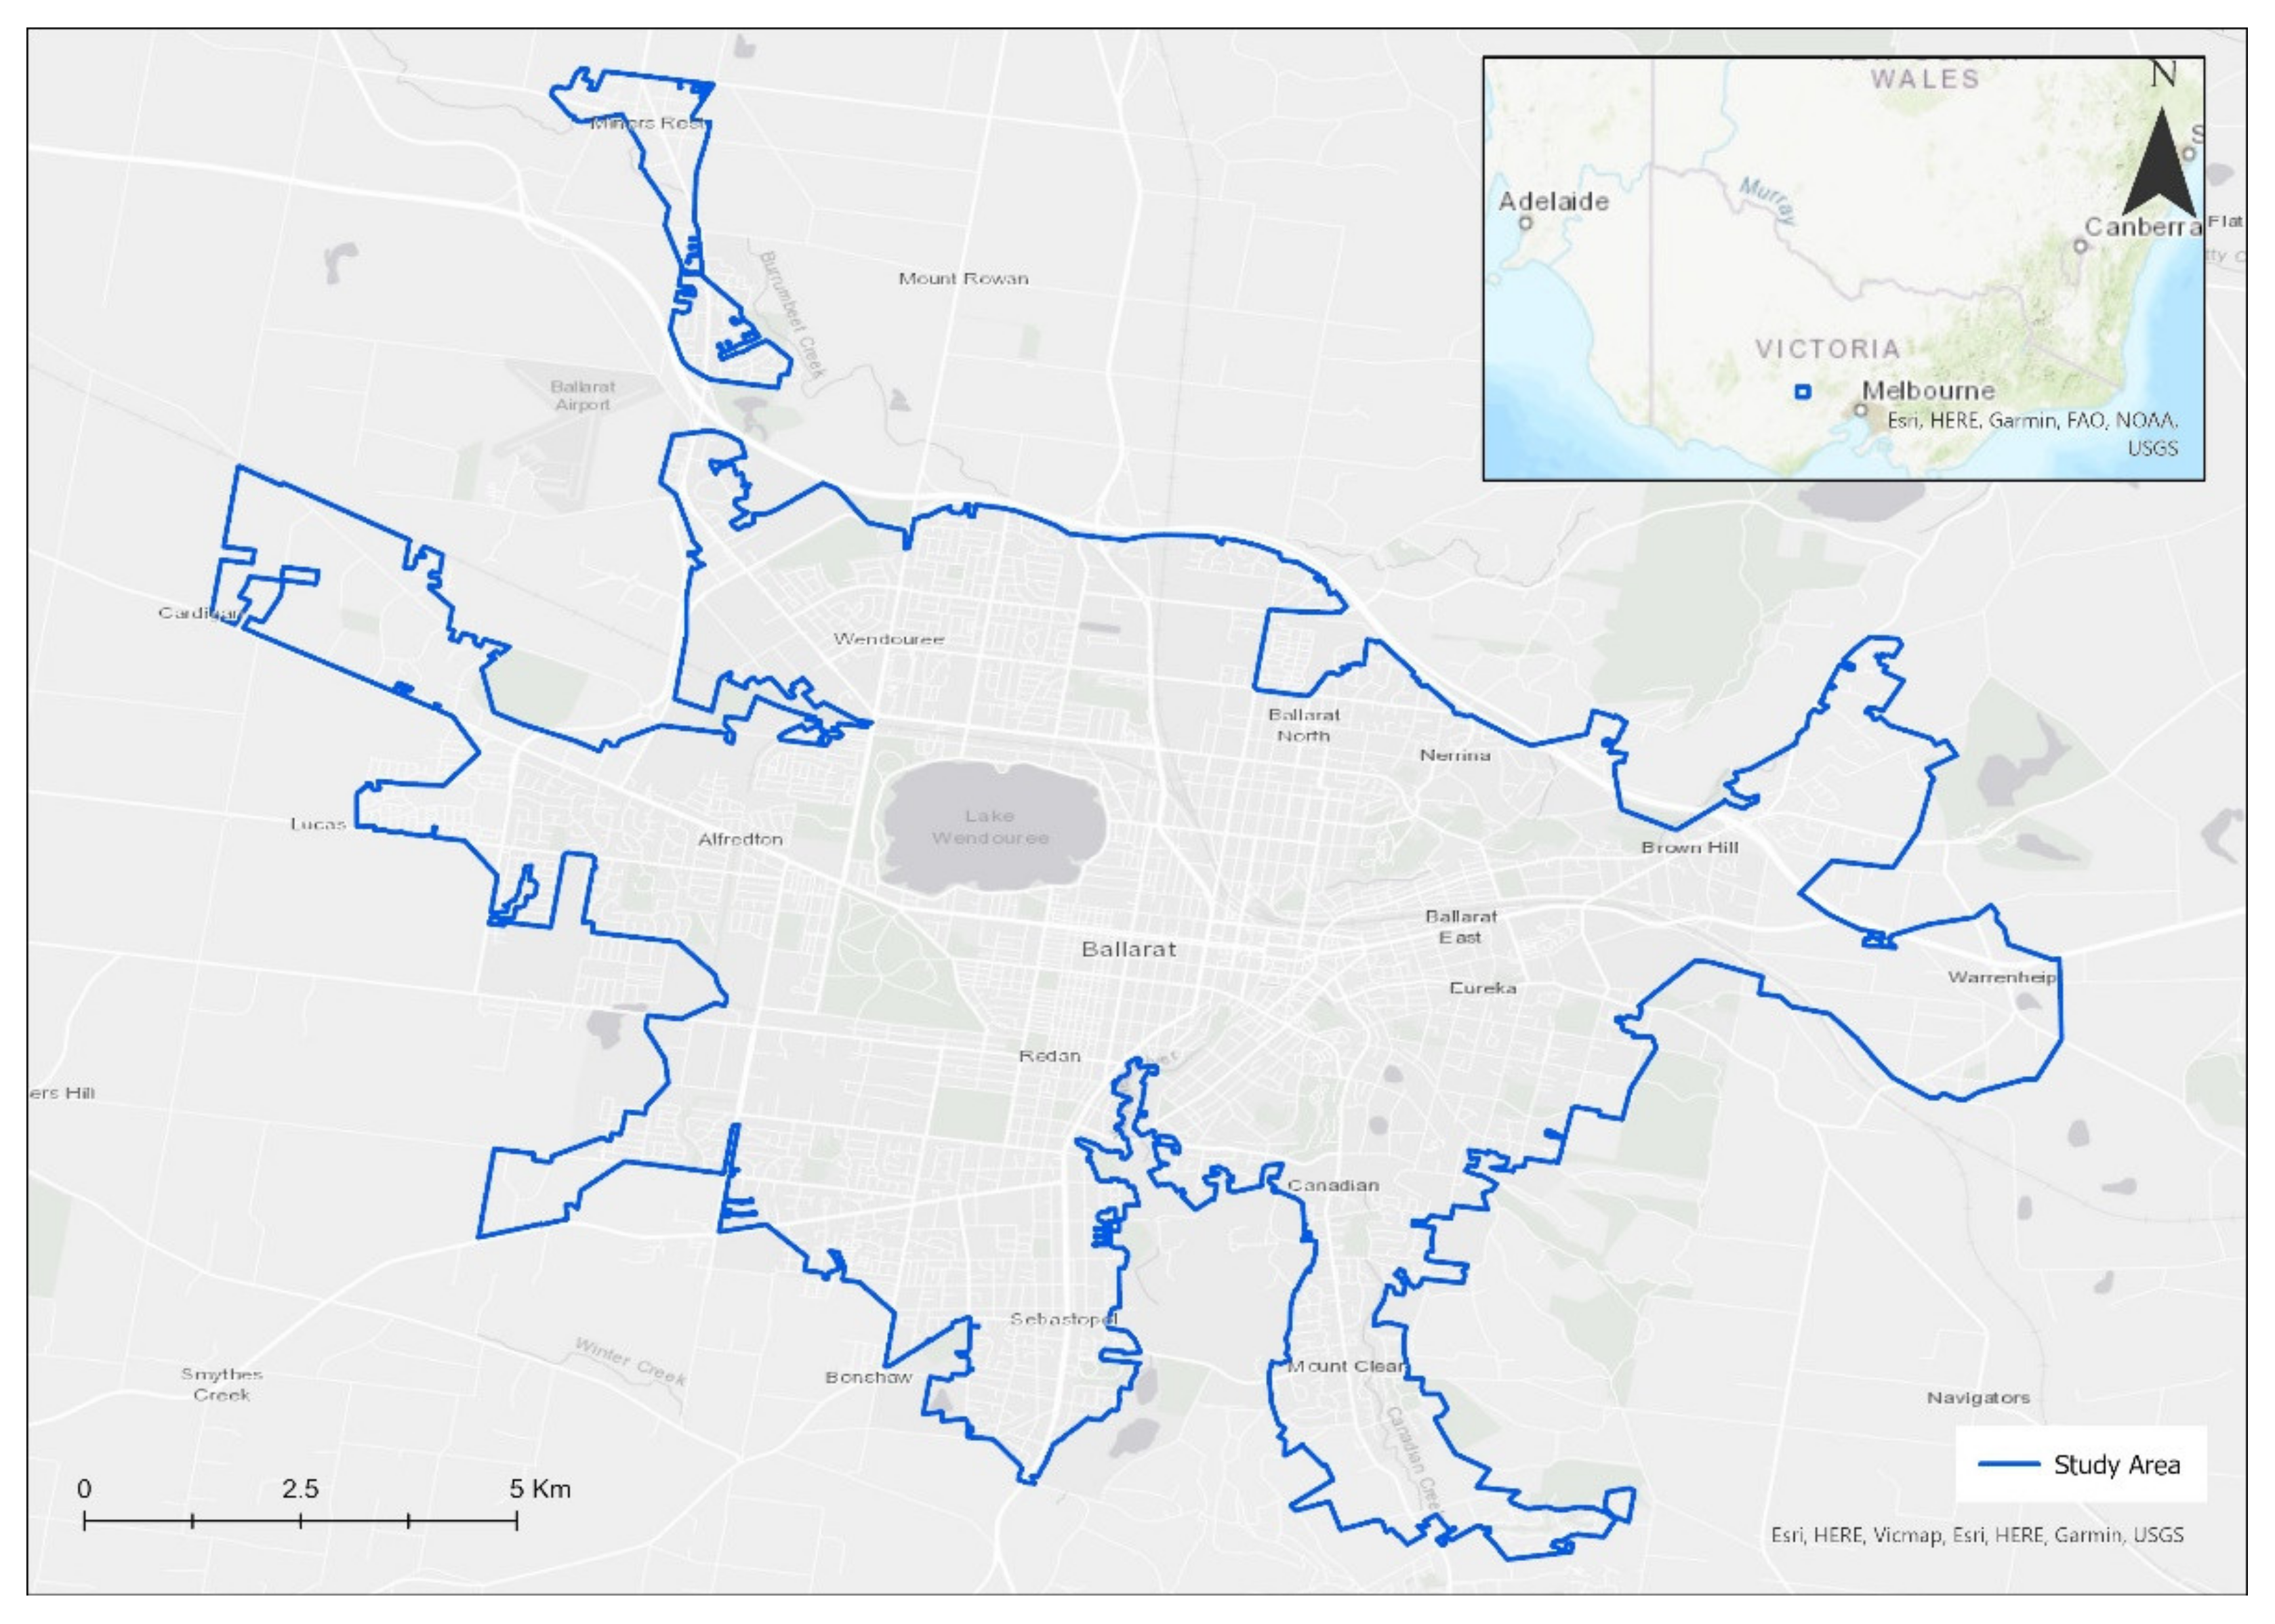
The study area selected for this research falls in Ballarat Local Government Area (LGA), which is located 110 km northwest of Melbourne, Australia with an area of approximately 4652 km2 (Figure 1). In 2019, the Ballarat LGA population was recorded to have exhibited an annual growth of 1.85% over the past 5 years. Ballarat is Victoria’s largest inland city [31]. Additionally, PV capacity in Ballarat LGA is higher than its surrounding LGAs, whereas the current PV density is lower than its surrounding LGAs (less than 10%) [32]. Because of its appropriate size, population, and an indication of high solar potential, this particular LGA is a suitable site for this research. Lastly, the boundary of the study area was finalized by spatially intersecting the areas of all the acquired datasets.
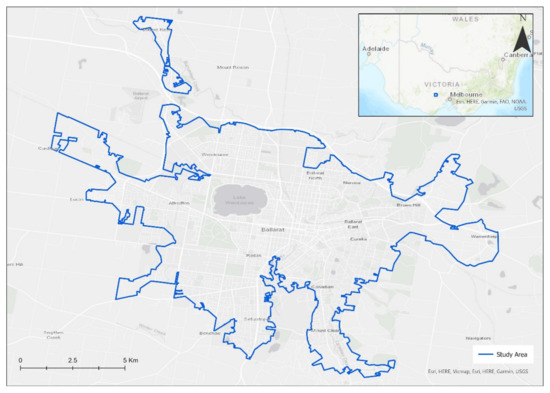
Figure 1.
Study area: Ballarat city, Victoria, Australia.
The backbone of geospatial, as well as statistical analysis, is the accuracy of the data, whilst the solar-radiation analysis is mainly dependent on data availability. Fortunately, Australia has relatively decent data sources on the government sites, allowing us to conduct this study. So, all the open-source datasets for this project were gathered from several different government websites (Table 2) and then enabled in the GIS software for further analysis.
Table 2.
Summary of datasets used in the research study.
2.2. Deep Learning and Single Shot Detector
Deep learning is a subset of machine learning and artificial intelligence (AI) that mimics how humans acquire knowledge. Deep learning, in contrast to more traditional machine learning and feature-engineering methods, has the advantage of potentially providing a solution to data-analysis and learning challenges that accompany large amounts of data [33]. To take advantage of advanced deep-learning algorithms, a Single-Shot-Detector (SSD) model is utilized to map the solar panels’ locations. The SSD model uses a single deep neural network. It was first proposed by Lui et al., and the researchers described it as a method that discretizes the output space of bounding boxes into a collection of default boxes for each feature map location, using different aspect ratios and scales [34]. Simply put, the SSD is mostly utilized to address the target-detection (location + categorization) problem. During the training, SSD only requires input images and true tag boxes for each item, the model evaluates the default set of small sets of different aspect ratios with various scales, and then the shape offsets and confidence levels for all object categories are predicted for each default box [34], as seen in Figure 2. Liu et al. and Jeong concluded in their paper that even with a lower input-image size, the SSD provides substantially greater accuracy and speed than other single-stage methods, which is why the SSD was considered to be the most appropriate choice for this study [35,36]. The model was used through ArcGIS software. It has tremendous built-in capabilities with all the machine-learning packages, from scikit-learn and TensorFlow in Python to caret in R to IBM Watson and Microsoft AI—and it still has spatial validation, geoenrichment, and result visualization [37].
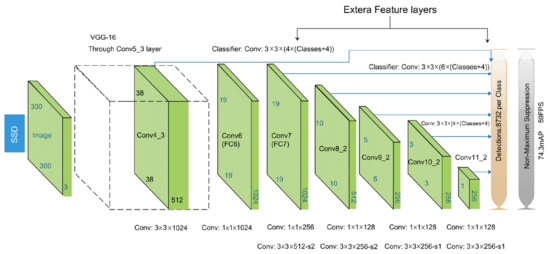
Figure 2.
SSD architecture adapted from Liu et al. and Bahaghighat et al. [34,38].
2.3. Measuring the Solar PV Potential
Numerous papers have been published—and a few of them are mentioned in Table 1—that studied the solar-energy-generation method because sun irradiation changes based on the location, time, and weather patterns of the subject region. One of the fundamental prerequisites for both large-scale and small-scale solar PV implementation is the rough calculation of the area’s solar-energy potential, which can be calculated by carefully modeling the solar insolation on the roof surface [39,40]. This solar insolation modeling approach using the Solar Analyst Module was adapted from an “Estimate solar power potential” lesson available on the ESRI website and written by Delphine Khanna [41]. We chose ArcGIS Pro software to conduct this analysis due to its comprehensive set of analytical methods and powerful spatial algorithms. The solar-radiation-analysis-tool function is based on methods from the hemispherical viewshed algorithm developed by Rich et al. and further developed by Fu and Rich to determine insolation throughout a landscape or for individual areas [42]. The tool calculates the global radiation (Globaltot), which is the summation of the direct and diffuse radiation of all the sun-map and sky-map sectors, respectively [43]. The direct radiation from the sun-map sector (Difθ,α) with a centroid at the zenith angle (θ) and the azimuth angle (α) was calculated using the following equation:
where SConst is the solar flux outside the atmosphere at the mean earth–sun distance, known as the solar constant, β is the transmissivity of the atmosphere for the shortest path, m(θ) is the relative optical path length, SunDurθ,α is the time duration represented by the sky sector, SunGapθ,α is the gap fraction for the sun-map sector, and lastly, AngInθ,α is the angle of incidence between the centroid of the sky sector and the axis normal to the surface. On the other hand, the diffuse radiation for each sky sector (Difθ,α) at its centroid (Dif) is calculated, integrated over the time interval, and corrected by the gap fraction and angle of incidence using the following equation:
where Rglb is the global normal radiation, Pdif is the proportion of global normal radiation flux that is diffused, Dur is the time interval for analysis, SkyGapθ,α is the gap for the sky sector, Weightθ,α is the proportion of diffuse radiation originating in a given sky sector relative to all sectors, and AngInθ,α is the angle of incidence between the centroid of the sky sector and the intercepting surface.
Dirθ,α = SConst × βm(θ) × SunDurθ,α × SunGapθ,α × cos(AngInθ,α)
Difθ,α = Rglb × Pdif × Dur × SkyGapθ,α × Weightθ,α × cos(AngInθ,α)
Globaltot = Σ Dirθ,α + Σ Difθ,α
The total of both direct and diffuse insolation values was calculated from Equations (1) and (2) for each location on the topographic surface and their summation gave the total global insolation map for an entire geographic area (see Equation (3)). The toolset considers every surface and environmental variable, which makes it a useful and credible choice to derive incoming solar radiation from a raster surface.
2.4. Research Methodological Framework
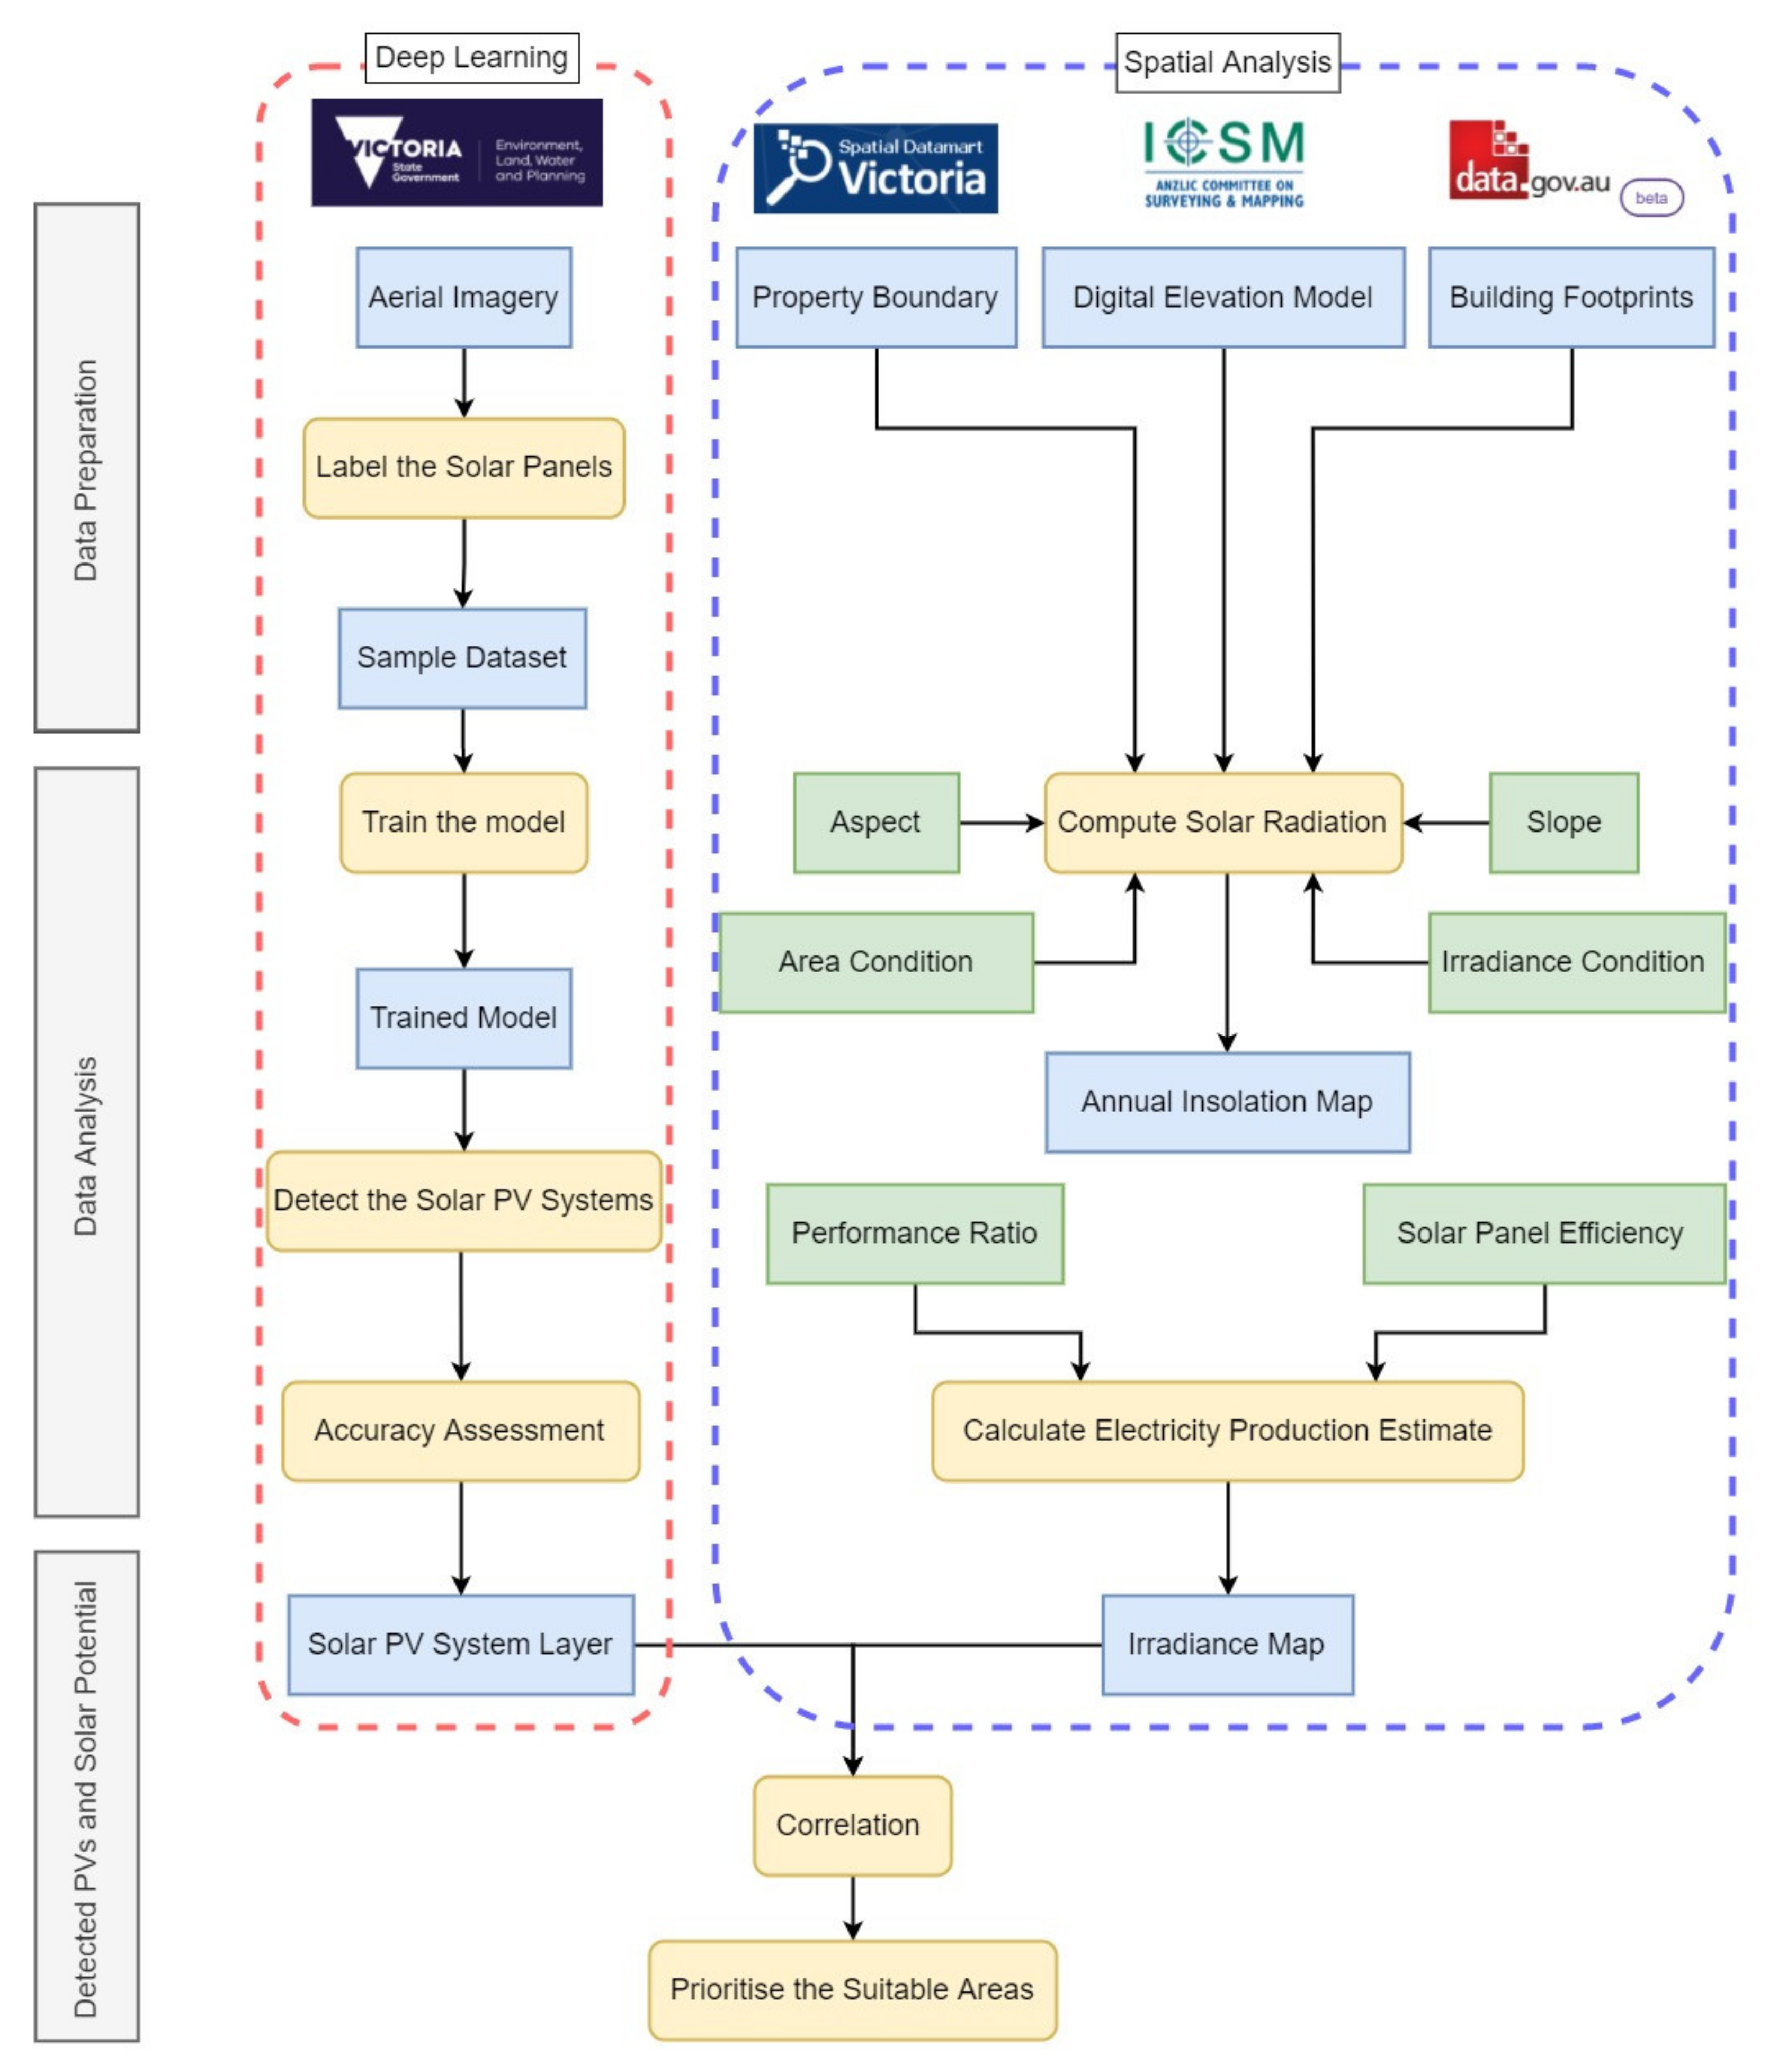
This study focused on developing an effective methodology for interrogating the installation gap and potential of solar PV systems in Ballarat. As shown in Figure 3, the study framed the methodological workflow into three steps. All three steps were performed both for deep learning and spatial analysis. Step one involved the acquisition and preparation of the datasets. Thereafter, in step two, collected data were analyzed with the help of algorithms and geoprocessing tools. Additionally, an annual estimate of electricity production was generated for each rooftop. Lastly, in step three, using the outcome of the analysis in step two, solar-PV-system density (PV density) and EPE were mapped and a correlation was derived between them to identify the most suitable areas. Throughout the analysis, ESRI ArcGIS Pro software was used with an Image Analyst extension license and a consistent Geographic and Projected Coordinate System was maintained, i.e., GDA2020 and MGA2020, respectively. Thus, this framework will help with strategies to realistically interrogate the installation gap and potential of solar PV systems.
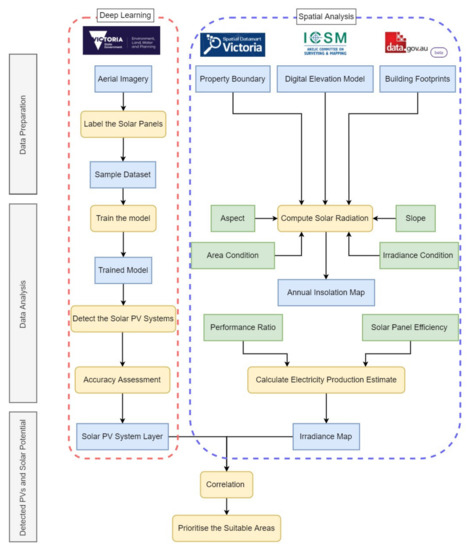
Figure 3.
Research methodological framework.
2.4.1. Deep-Learning Process
- Step 1:
- Data Preparation
The true color composite of the aerial image provided by DELWP was used as the input for labelling the sample data. There were approximately 550 solar panels labeled manually using the geoprocessing tool called “Label objects for deep learning” and then exported into training data with the size of 448 × 448 pixels. The generated training dataset contained images in TIF format and labels in XML format along with Esri Model Definition (.emd) file, which was later utilized to train the model in the next step. The .emd file is a JSON file that specifies the deep-learning model that has been trained. It provides the model-defining parameters needed to run the inference tools. As a well-labeled dataset acts as a foundation of any deep-learning model, we attempted to classify several solar-panel layouts concerning a variety of roof materials in order to make the model effective.
- Step 2:
- Data Analysis
This step required a proper environment setup and decent computational power. Using the “Train Deep Learning Model” geoprocessing tool, the training samples were accessed by importing the .emd file in order to determine what combinations of pixels in a given image represent solar panels. We used the SSD model with the backbone of ResNet34 (34 layers Residual Network) for core processing. Additionally, through trial and error, the batch-size value was finalized at a maximum of up to 40 samples. To avoid issues such as overfitting, and considering the size of the training samples, the best-suited epoch value was decided to be 30.
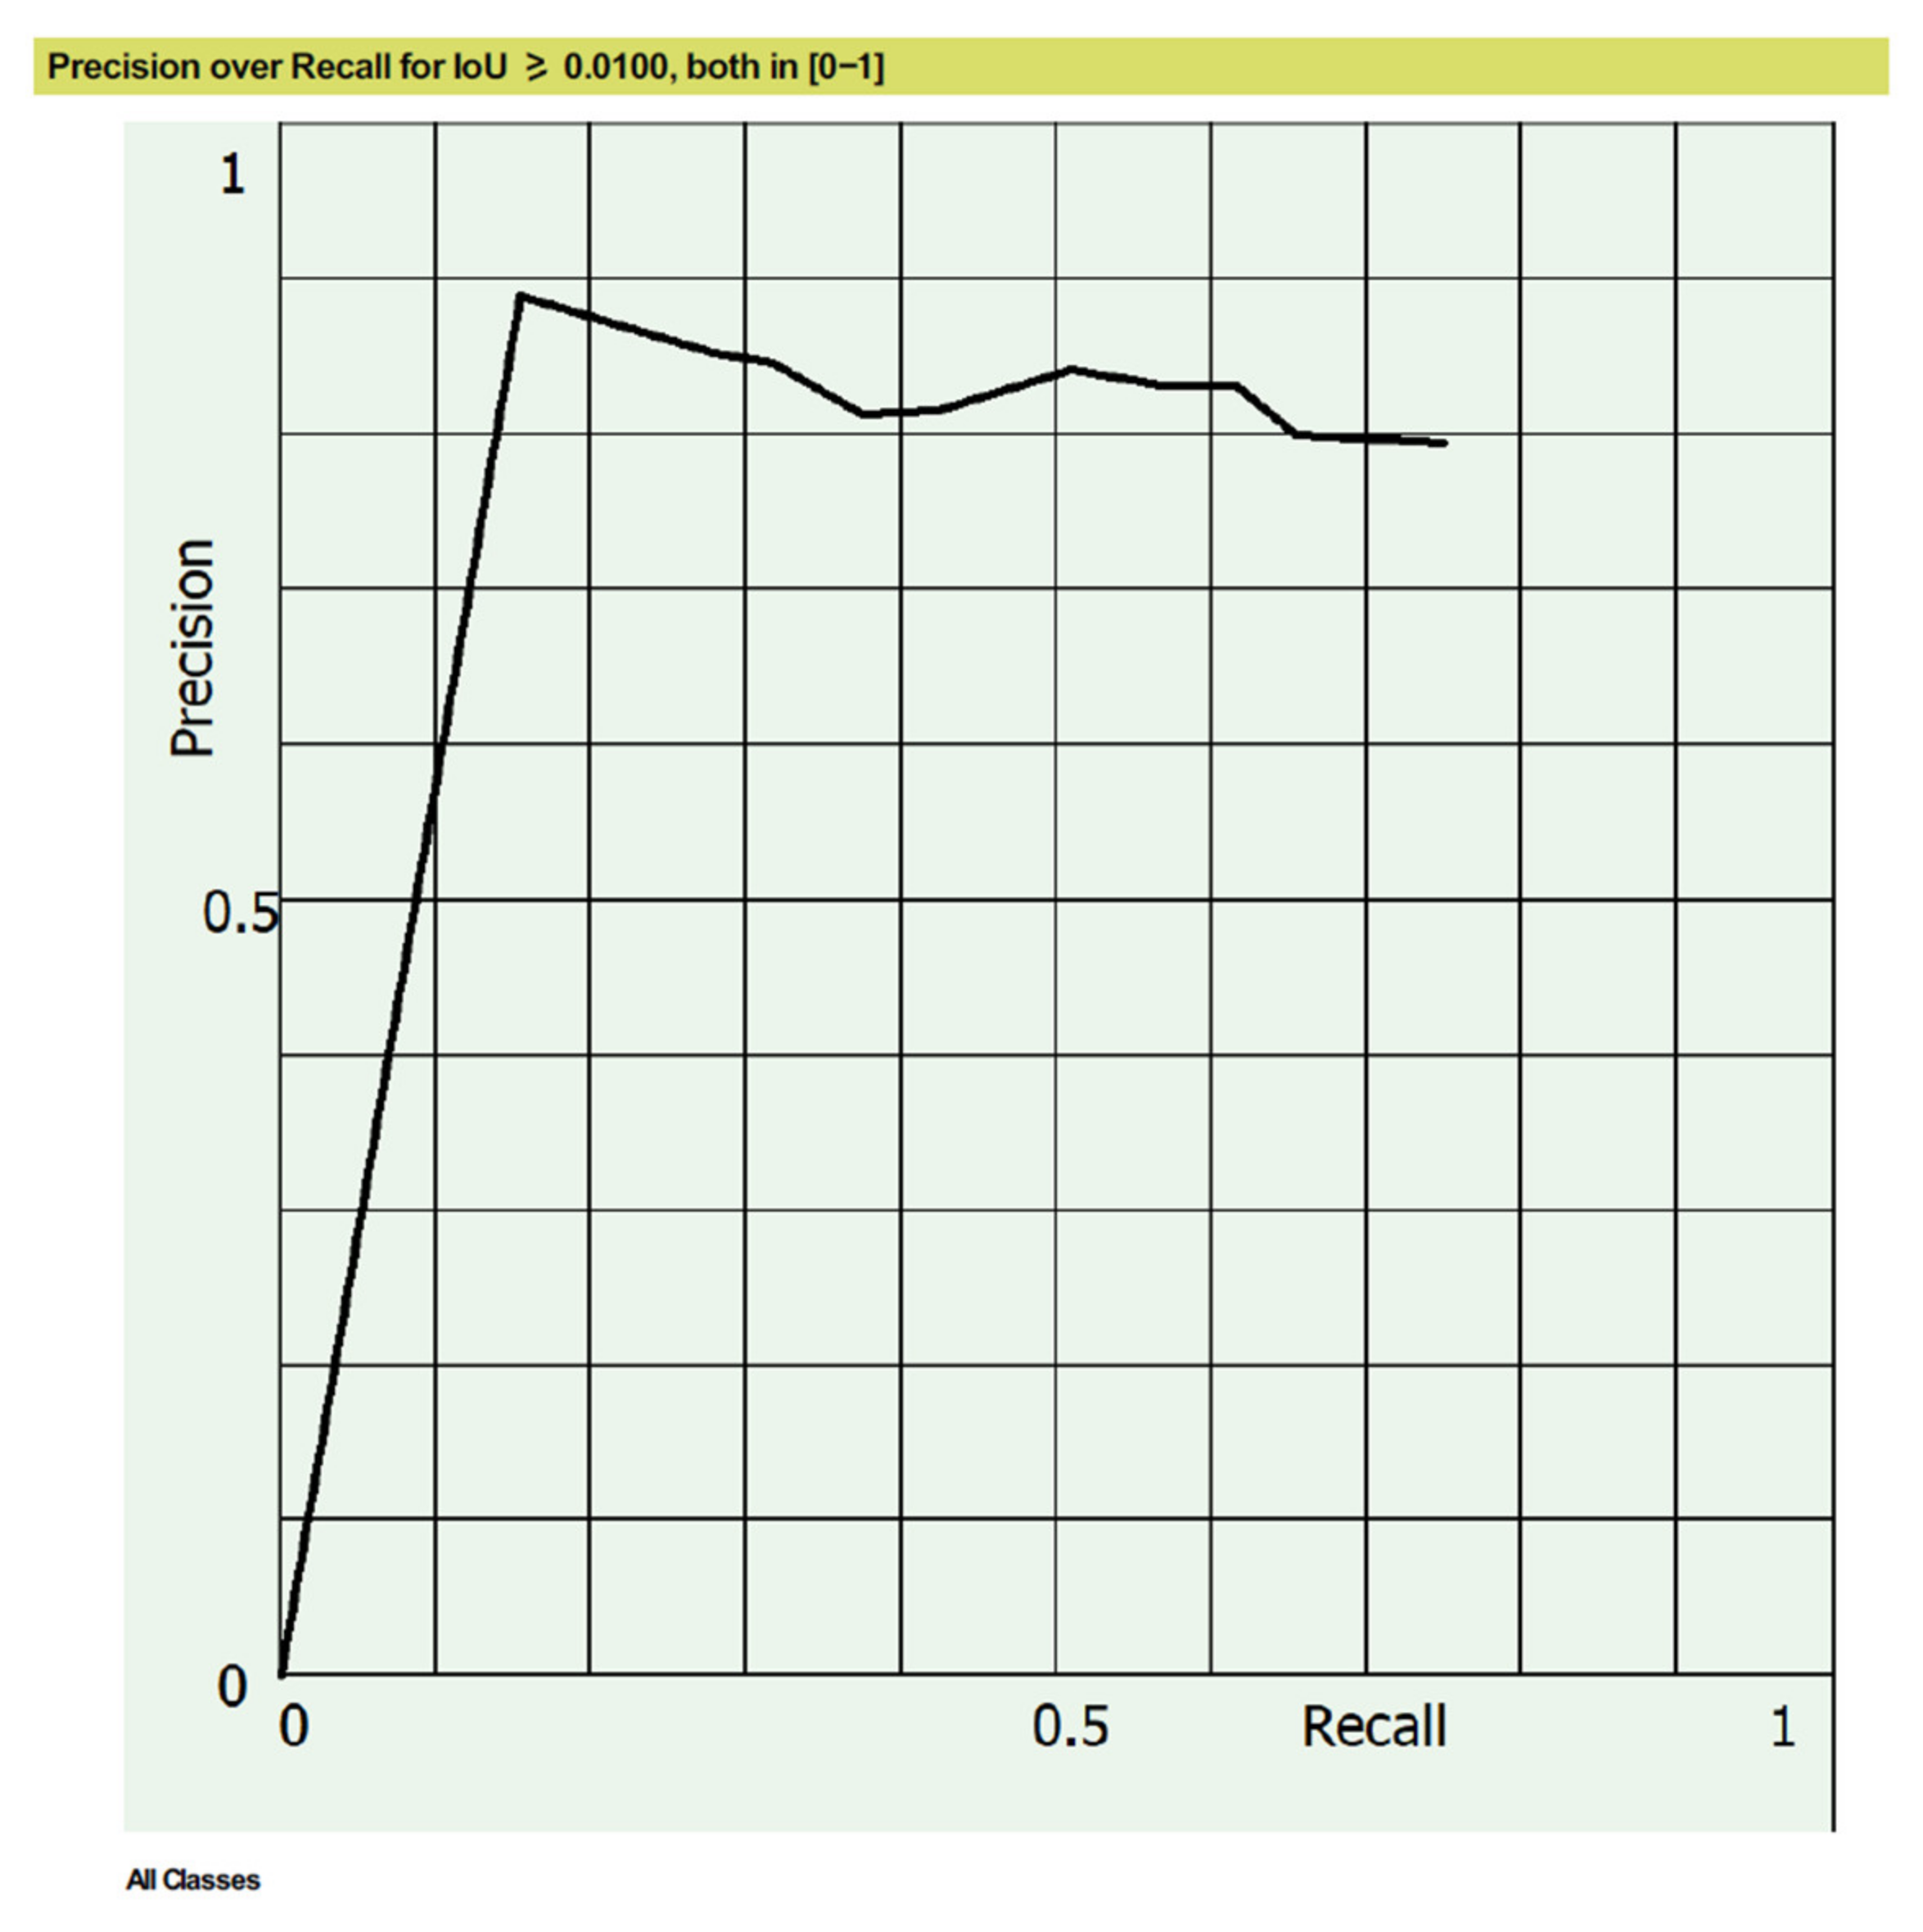
Once the model was ready, an accuracy assessment was performed using ground-truth samples that contained nearly 100 labeled solar panels (see Table 3). ArcGIS Pro provides an inbuilt tool to generate the model-assessment details as a PDF file. Figure 4 shows the change in precision as the recall increased. The confidence range of the detected features was (50.412,762, 99.901,557). When the satisfactory accuracy and precision value were achieved, the model was finalized and used for further analysis.
Table 3.
Accuracy Assessment Report.
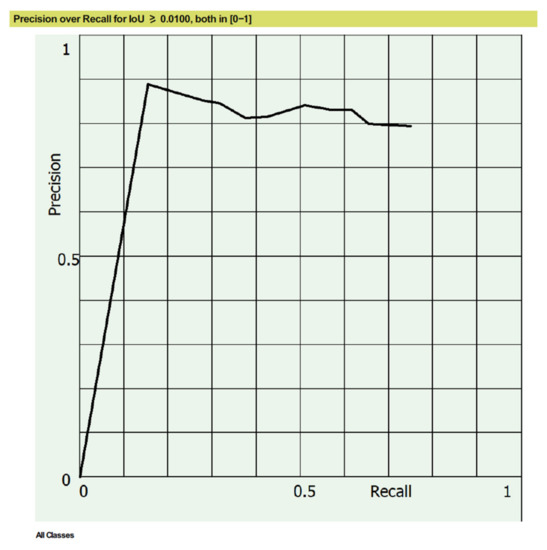
Figure 4.
Precision over recall for IoU graph.
- Step 3:
- Detect the Solar Panels
Once the model was trained, it was then used to detect the solar panels on the entire aerial image, but before that, multiple tests were performed using the “Detect Objects Using Deep Learning” tool in a small section of the image to achieve the best results. The argument’s value mentioned in Table 4 allowed the model to perform best, and the detection was extended to the entire image.
Table 4.
Arguments used for detecting the solar.
Finally, the outcome of the detection process was the bounding boxes containing solar panels, which were then intersected with the building footprint to reduce the false-positive value.
2.4.2. Calculating the Solar-Energy Potential
- Step 1:
- Data Preparation
A DSM was acquired from the ICSM website. A DSM is a raster layer that depicts the ground elevation as well as the elevation of objects on the ground such as houses and trees. The downloaded DSM was in Tiff format and had a resolution of 1 m with the currency of October 2020. Additionally, the building footprint and property boundary were collected from the Australian Government and Spatial DataMart websites, respectively.
- Step 2:
- Data Analysis
In this step, the solar radiation for each pixel within the building rooftop area was calculated using the Area Solar Radiation tool. This tool was utilized to identify which rooftop locations were both geographically and practically suitable for solar-energy production. The analysis was conducted for the entire year of 2020. Since this algorithm required high computational resources, the mask of building polygon was chosen to reduce the processing duration. The outcome was a raster file where each cell value represented the amount of solar radiation in watt-hours per square meter (Solarmean) in 2020. In addition, once the solar-insolation layer was generated, suitable rooftops were filtered out based on the following four factors to gain accurate results:
- The rooftops should have a slope of 45 degrees or less because steeper slopes receive less sunlight.
- The rooftops should receive at least 800 kilowatt-hours per square meter (KWh/m2) of solar radiation annually in order for it to be considered economical.
- The aspect of the roof should not be facing south, as south-facing rooftops in the southern hemisphere receive less sunlight.
- The minimum area of the roof should be more than 30 square meters because rooftops with a roof surface of less than 30 square meters are, generally, not suitable for solar-panel installation.
Thereafter, the raster file was converted into a table using the zonal statistics tool and joined with the building footprint for further analysis. Additionally, the total amount of solar radiation received per year (Solartot) on the entire PV-suitable rooftop area (AreaPV) was calculated and the unit was changed to megawatt-hours per square meter (MWh/m2) using Equation (4).
Solartot = AreaPV × Solarmean
In addition, there was an analysis model built using ModelBuider in ArcGIS Pro to automate the process (Figure 5). The model can be used for future studies to obtain coherent results and reduce time consumption. The model input is a DSM file. It includes all the tools, parameters and environment settings to compute the output, which would be a raster file in TIFF format depicting the solar radiation over building rooftops in KWh/m2.
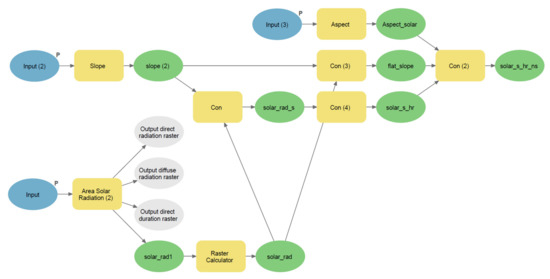
Figure 5.
The analysis model built using the ArcGIS Pro ModelBuilder.
- Step 3:
- Insolation Map
The estimate of how much electric power each rooftop could generate if every suitable building was equipped with solar panels was calculated using Equation (5). To calculate the potential electric power production potential, the efficiency (e) of 15% and performance ratio (Pr) of 86% were assumed, and this assumption was based on the conservative best estimate provided by The United States Environmental Protection Agency [44].
EPE = Solartot × Pr × e
2.4.3. Identifying the Relationship
The outcome of both processes was correlated with the assistance of a bivariant geoprocessing tool and created a bivariate choropleth map with bivariate color symbology. It showed the quantitative relationship between both the variables and emphasized the high and low values in the variables which helped to visually compare, emphasize, or delineate values.
3. Results
The purpose of this study was to interrogate the installation gap and potential of solar PV systems in Ballarat city. To achieve this purpose, we acquired spatial data from government websites and leveraged deep-learning algorithms and GIS software i.e ArcGIS Pro 2.6 developed by ESRI which is headquartered in Redlands, California. The outcome of the proposed methodology was maps that depicted the location of the detected solar panels and the EPE of each rooftop. Thereafter, the results were then summarized at the SA1 level for comprehensive comparison and pattern-recognition purposes. Lastly, a correlation between both of the results was computed and visualized. Throughout the process, the quantile classification method was used to symbolize the choropleth maps.
3.1. Existing Solar PV Systems
According to the first objective of the study, it was required to locate the existing solar PV systems installed in the study area. Considering the resources and requirements of the paper, the SSD model was selected. Section 2.4.1 gives a thorough explanation of the functionality and advantages of using the SSD model for object detection. The performance and efficiency of the deep-learning process specifically using GIS software were also taken under consideration. Figure A1 demonstrates the bounding boxes generated by the model that contain the solar panels. The model successfully detected 6010 solar panels on 4150 properties out of 42,480 using high-resolution aerial imagery. The trained model provided a precision of 0.79 and an accuracy of 77%.
Figure 6 reveals the spatial distribution of the detected solar panels, which appears to be clustered towards the southern area, somewhat uniformly separated in the central area and fairly scattered in a few outer regions of the study area. The true result of the model was first intersected with the building footprint to eliminate the false-negative values and increase the accuracy.
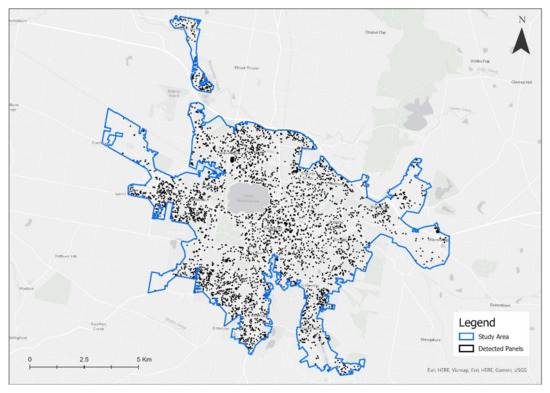
Figure 6.
Spatial distribution of the detected solar panels.
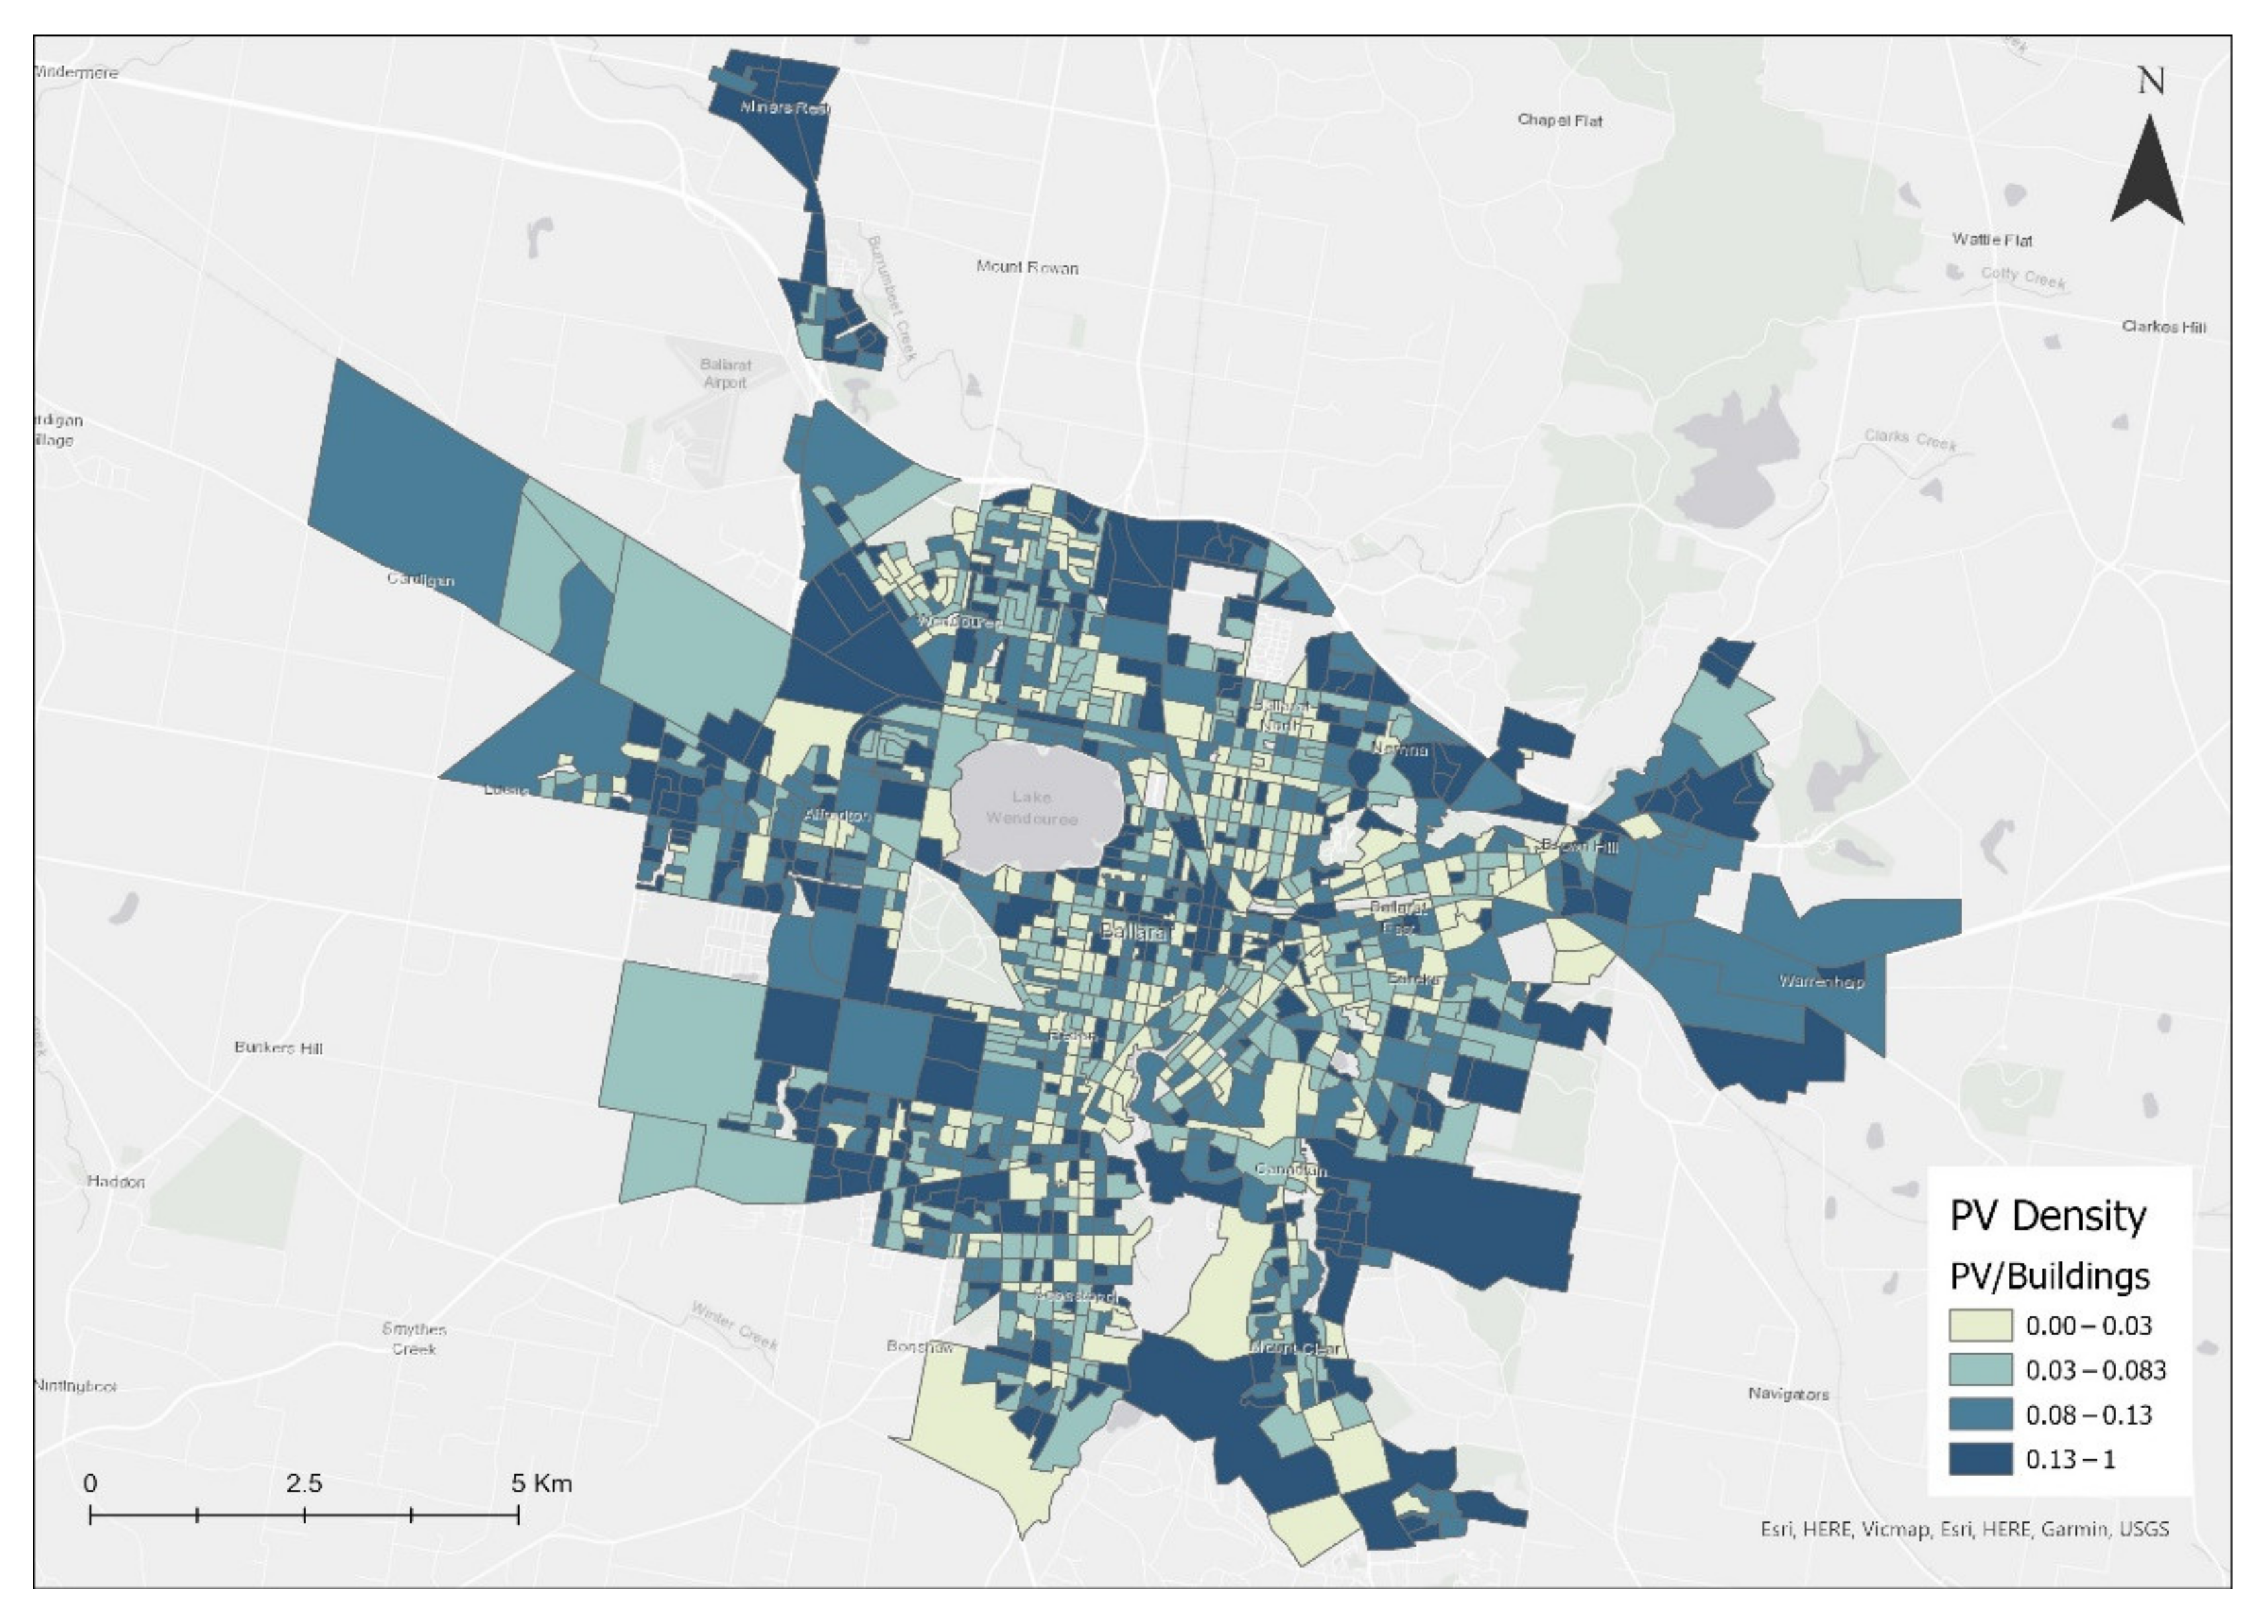
Depicting the existing solar panels does not provide a full understanding of the pattern. Therefore, to put the PV-system usage into perspective, the detected solar panels were normalized with the number of properties in a particular SA1, which provided the density of solar PV systems (PV density), as seen in Figure 7. It was evident from Figure 7 that the number of SA1s with low PV density was higher than the number of SA1s with high PV density. It was observed from statistical data that there were only 12 SA1s that had a PV density of more than 0.5 and there were 176 SA1s that had properties with no PV systems installed.

Figure 7.
Spatial distribution of the detected solar panels at the SA1 level.
3.2. Solar-Power Potential
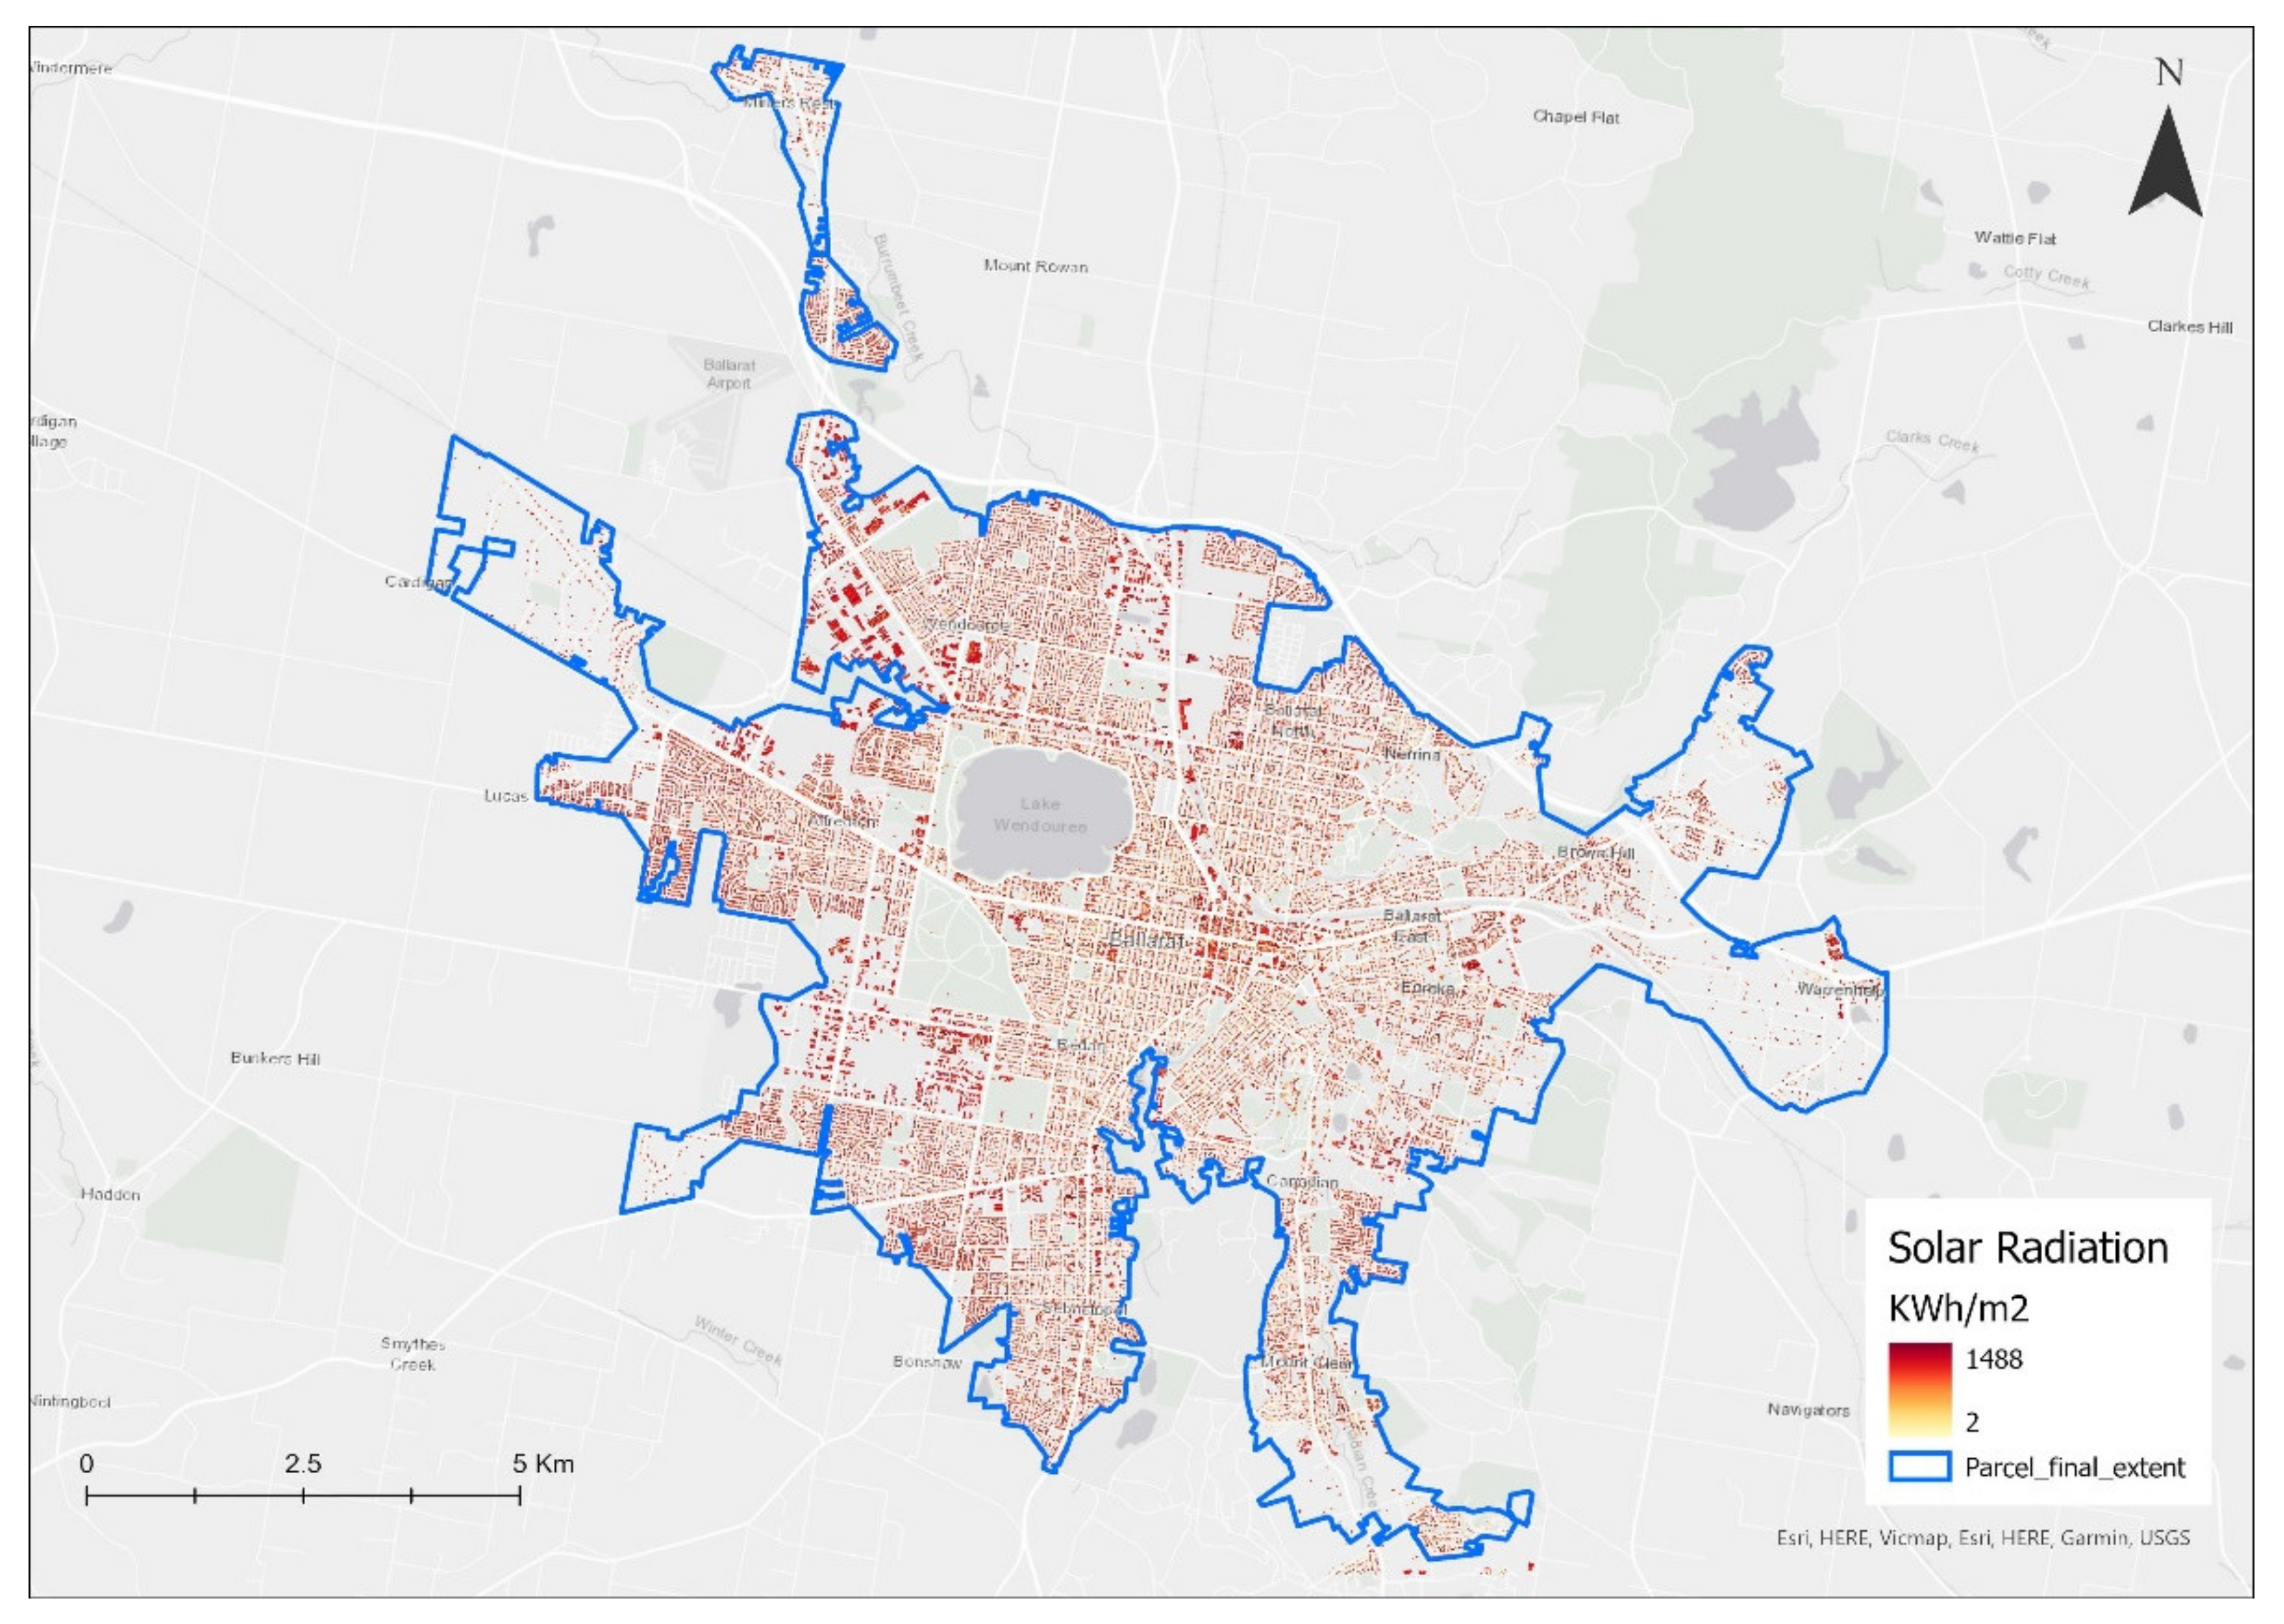
This study used targeted to compute the solar irradiance and calculate the EPE for each rooftop in the study area. After detecting all the properties of the existing solar panels, the solar-power potential of each building could be determined. Considering the factors mentioned and the efficiency and performance ratio of PV systems in Section 2.4.2, an estimation of electricity production by each roof was calculated. Additionally, the properties with detected solar panels were deducted, which reduced the total number of properties to 38,340. Figure A2 shows some samples of computed solar insolation using the DMS at a large scale. The pixel-based radiation value ranged from 800 to 1488 KWh/m2 and each pixel in Figure A3 represents the average solar radiation received on a 1 × 1 m area in the year 2020.
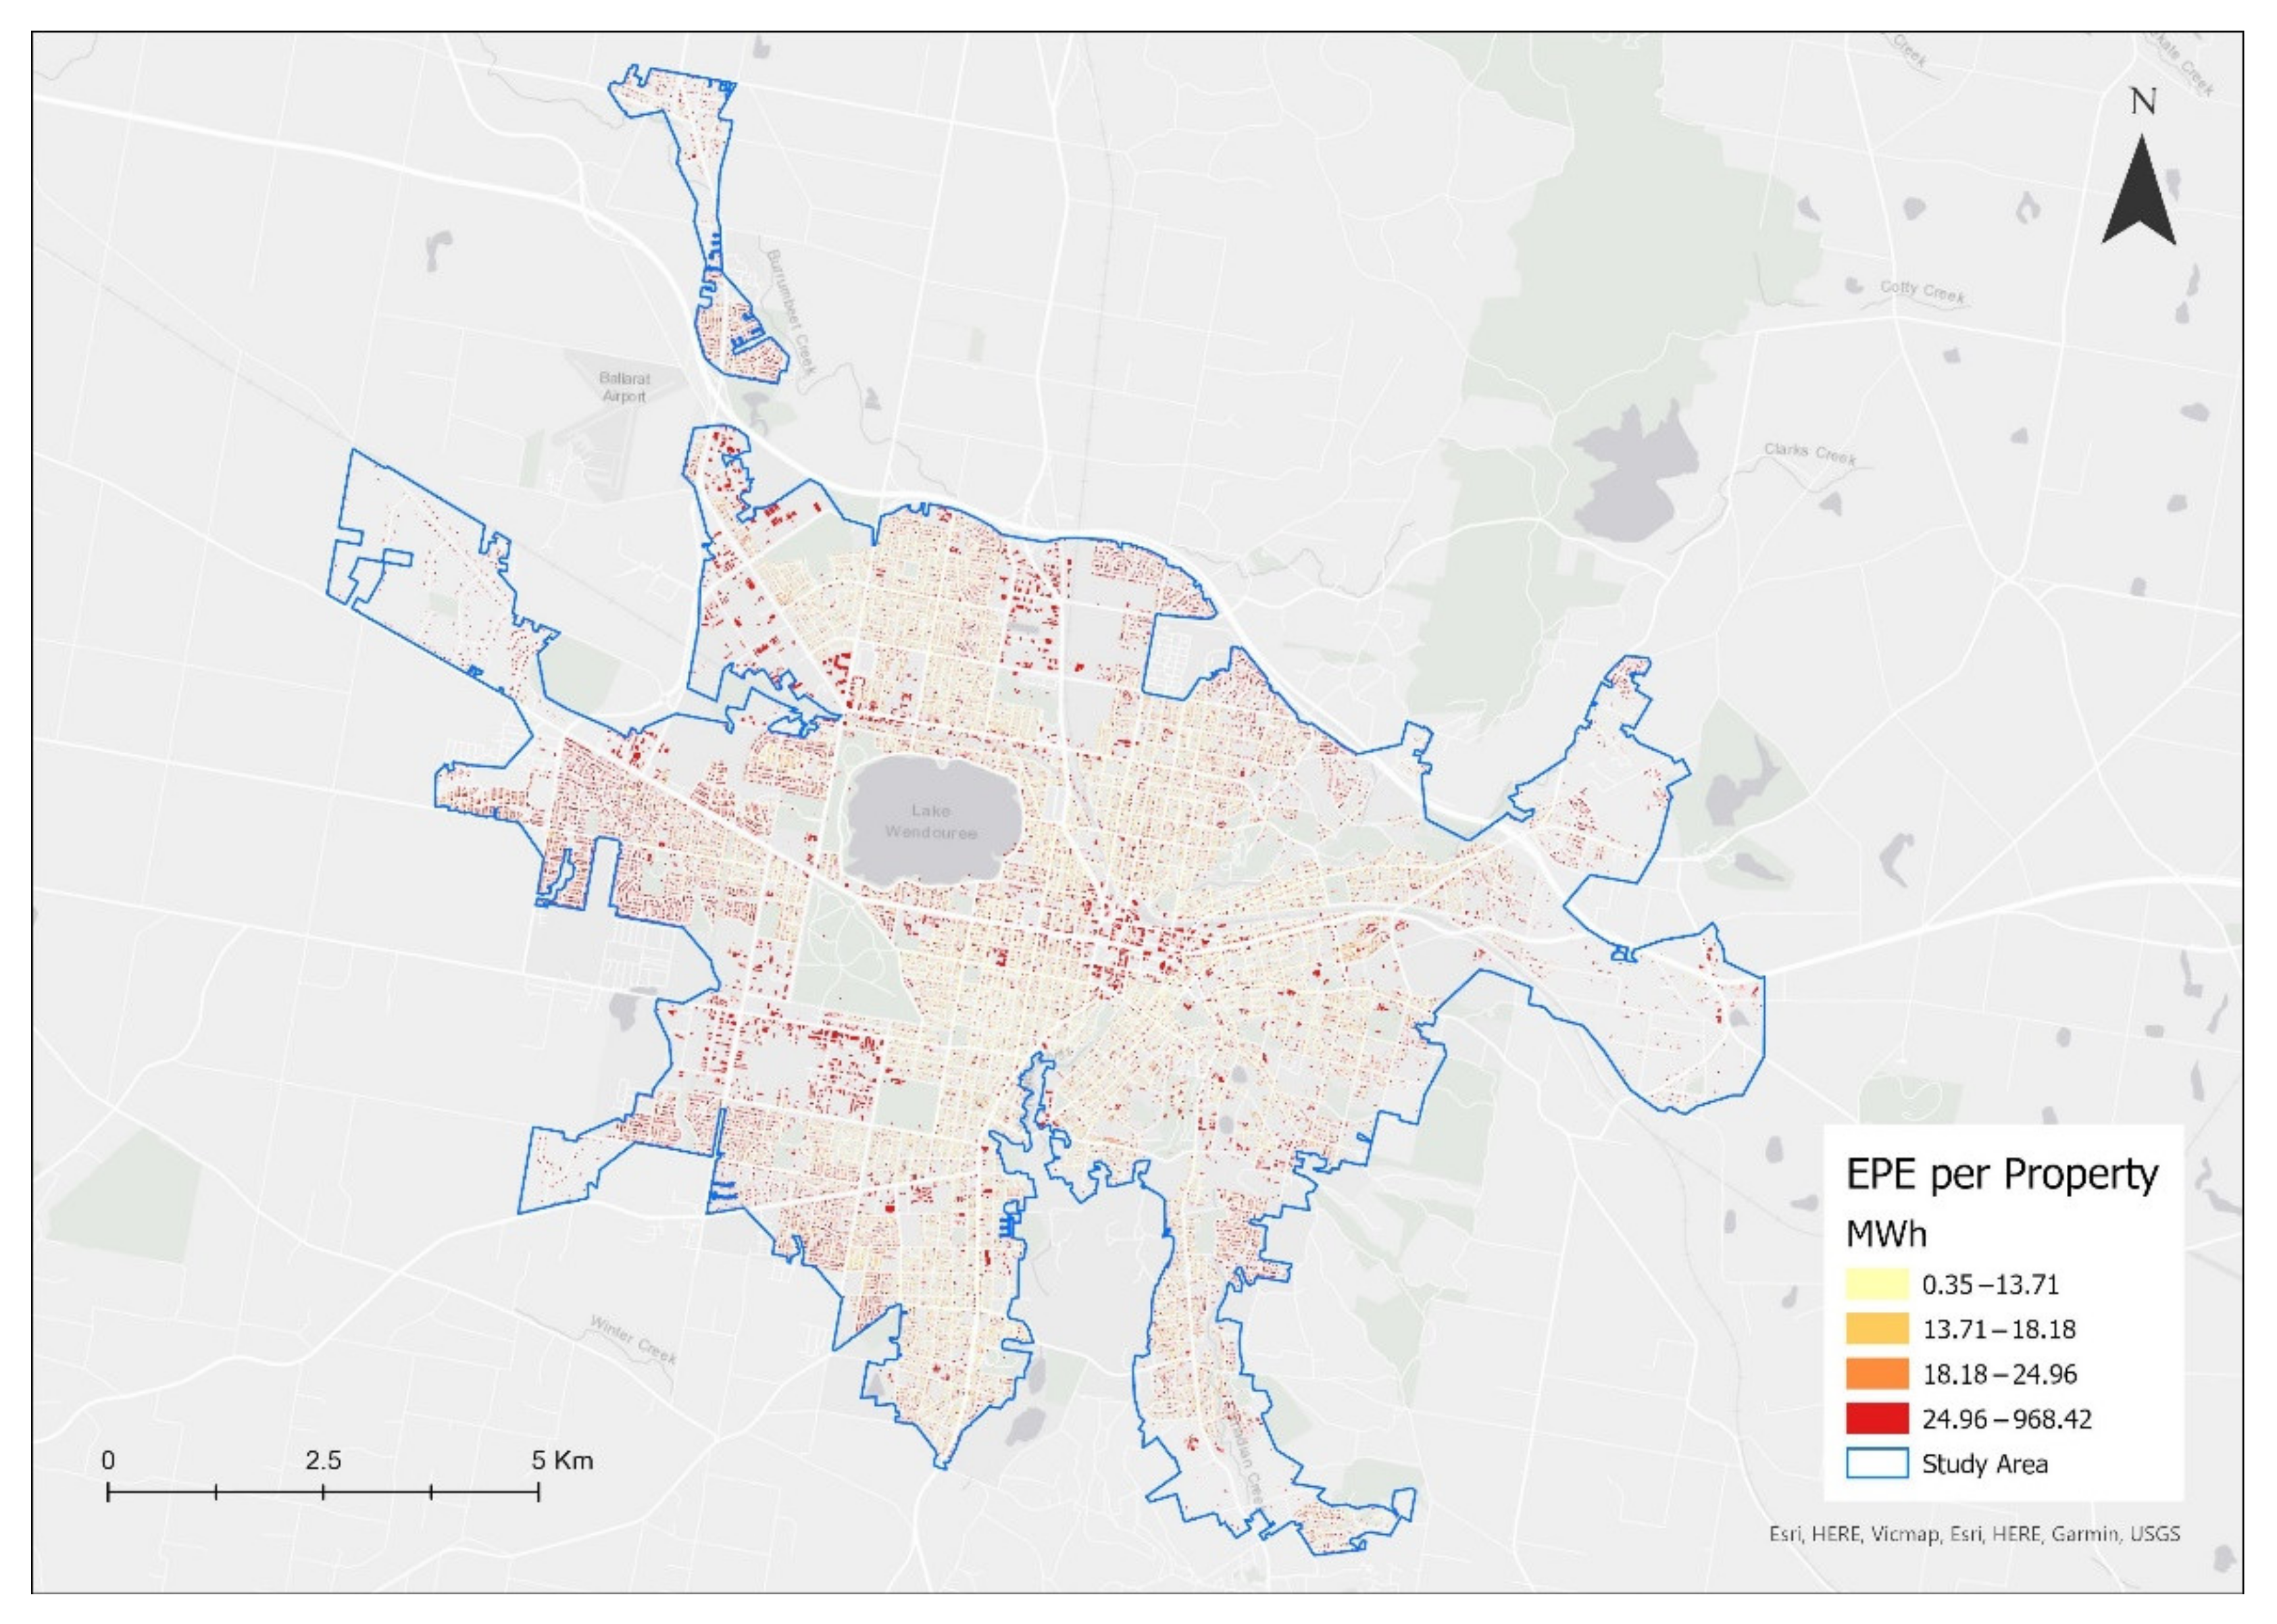
Figure 8 displays the spatial distribution of the EPE for each building in the study area after deducting the existing solar panels. The minimum and maximum EPE values were known to be 0.35 and 968 MWh, respectively. Darker features indicate a higher production of electricity and vice versa. Since the quantile classification method was used, three of the class values in the legends had an EPE value below 25 MWh per property. This is because there were a high number of buildings under residential land use that had only 20 MWh EPE per building (see Table 5). Moreover, high-EPE buildings were mainly in the central part of the study area, but it was difficult to discover the pattern due to the small size of the buildings. Even though this calculation provides a summary of the likely solar-power potential in the study area, we integrated it with SA1 for better visualization.

Figure 8.
Spatial distribution of the EPE.
Table 5.
Detected solar panels and EPE values in each land use.
Similar to the PV-density map in Figure 7, the EPE was also summarized at the SA1 level, as seen in Figure 9. The EPE value per SA1 was noticed to range from 2.9 to 10,280.6 MWh. Moreover, the high EPE values were generally on the outer SA1, mainly on the north-west and the eastern side, whereas the lowest EPE values were largely on the northern side of the study area. Overall, all the properties with no existing solar PV systems installed were estimated to produce annual electricity of 929,773.62 MWh or 929.78 GWh.
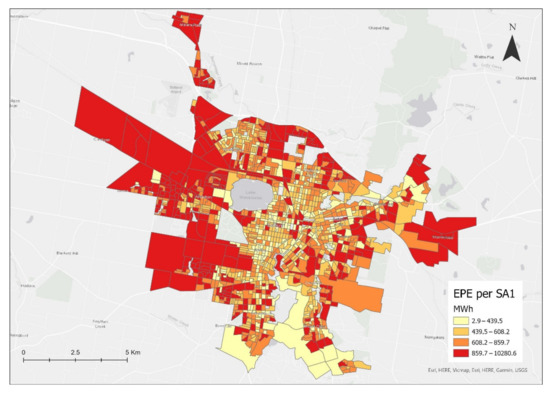
Figure 9.
Spatial distribution of the EPE at the SA1 level.
3.3. Correlation
The results from the deep-learning process and spatial analysis were then correlated to identify the relationship and further prioritize the suitable area. In the correlation analysis, a bivariant relationship was mapped using ArcGIS Pro. Figure 10 shows the relationship between the EPE and PV-density data. The map reveals the high and low areas of EPE and PV density. Logically, the highest priority should be the SA1 that has high solar potential but low PV density (yellow color), then the SA1 that has high solar potential with high PV density (dark red color), then the SA1 that has low solar potential with low PV density (light yellow), and lastly, the SA1 that has low solar potential but high PV density (blue color). This only makes sense because the blue color is mainly in the southern area, and it was observed in Section 3.1 that the southern region has clusters of detected solar panels.
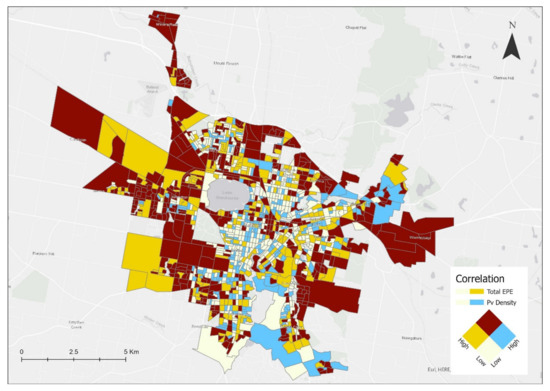
Figure 10.
Correlation between EPE and PV-density data.
The results were also categorized by different land use in the study to gain a deeper understanding of the situation of currently installed PV systems and solar-potential distribution. Table 5 shows the total number of properties, total number of PV systems installed, PV density, EPE per building, and the total amount of annual EPE for each land use.
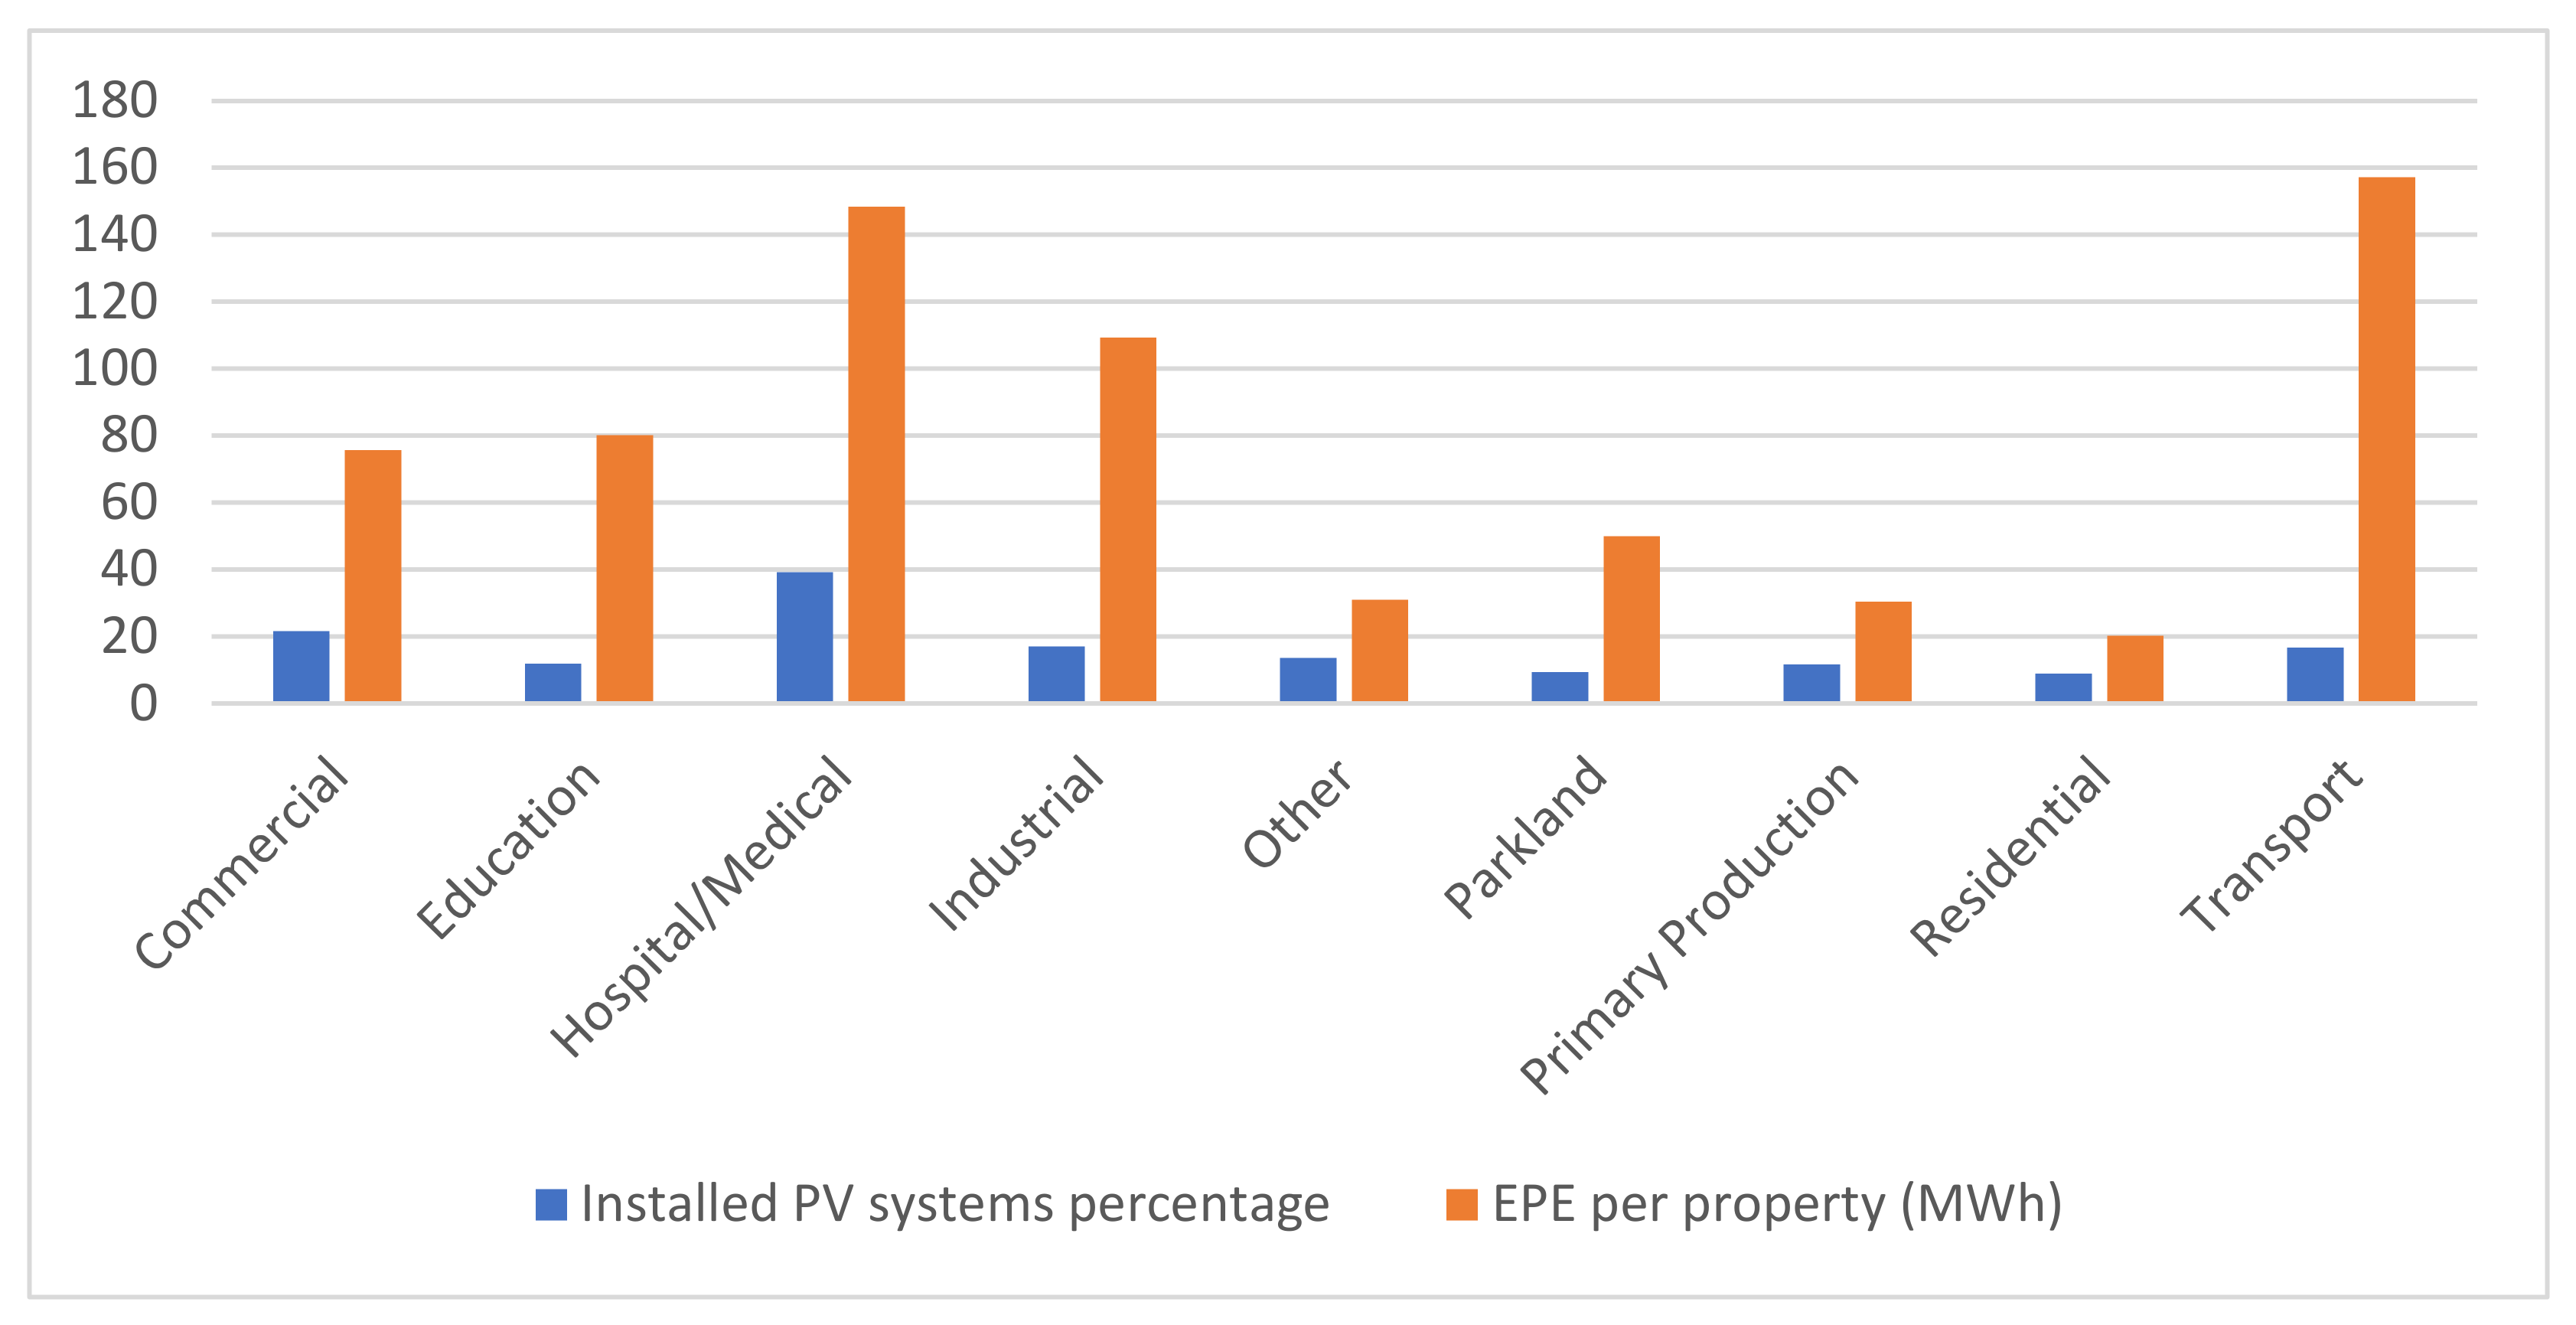
It can be seen that even though residential land use has the highest number of PV systems installed, it has the lowest PV density along with parkland land use, i.e., 0.9. On the other hand, hospital/medical land use is in the top position of PV density with nearly four times the parkland land use. Moreover, in terms of solar potential, transport land use holds the highest EPE per property, i.e., 157 MWh, and residential land use, due to its small area per property, has the least, which is almost 8 times less than the transport land use. Nevertheless, residential land use has the maximum total EPE due to a high number of buildings, i.e., 715 GWh. However, transport land use, which was highest in EPE per property, has the lowest total EPE at merely 1.57 GWh.
To put these values into perspective, Figure 11 presents a graphical representation of the installed-PV-system percentage and EPE per property (MWh) in each land use. It is apparent that there is a large variation between different land uses for both the EPE and existing PV percentage values. Additionally, the proportion between EPE and the existing PV percentage is varied in each land use.

Figure 11.
The installed-PV-system percentage and EPE per property in each land use graph.
4. Discussion
Considering the data acquired, the method used, and the outcome produced in the previous sections, this section summarizes the results and major findings of the paper and discusses the importance and effect of installing solar PV systems on building rooftops along with the limitation of this study.
4.1. The Implication of the Results
Concerning the environmental threats due to the usage of non-renewable resources, this project proposed an efficient and cost-effective approach to interrogate the solar-radiation potential and encourage the use of renewable resources. The conducted research yielded a few intriguing outcomes. The results include the spatial distribution of the existing solar PV systems and EPE across the study area. Knowing the current state of the existing solar PV systems installed in an area can significantly enhance the decision effectiveness. The PV systems’ spatial distribution and the recognition of the pattern perform a vital role in understanding the resident’s situation and views on sustainable energy. Clustering or scattering of PV systems will indicate solar-power usage and can be useful information to the electricity authority board members in power-plant-production management. The deep-learning model used in this study showed relatively accurate results considering the system configuration and training data provided.
The key outputs of this study area are: There are around 6010 solar panels on 4150 properties out of 42,480, the total calculated EPE from the 5.6 km2 suitable area is 929.8 GWh, and the average EPE from each property is 24.4 MWh annually. Additionally, our result shows that out of the total number of properties in the study area, only 10% have solar PV systems installed on their rooftops, whereas each residential building has an EPE of 20.2 MWh annually. In 2020, Australia’s power sector emitted 0.656 kg of carbon dioxide per kilowatt-hour (gCO2/KWh) of electricity produced [45], which means each property in our study and the total study area would offset a minimum of 16.1 Kilotons (kt) and 610.4 kt, respectively.
Hence, it is evident from our analysis that the study area has a significantly smaller number of solar PV systems installed; however, it holds a considerable amount of solar-power potential. It is crucial to understand the unrealized solar potential now more than ever. Photovoltaic systems are ideal for off-grid energy generation and when the cost of power generation from conventional sources is too high [17]. A variety of incentives and subsidies have been offered to Australian homeowners to encourage them to install solar panels [46,47]; for instance, in Victoria, the typical cost of an installed 6.6 kW solar system is 9500 dollars and the government’s financial incentive is 2950 dollars [48]. Using the results of this study, the existing PV system map, EPE map and bivariate choropleth map can be helpful to analyze the pattern in socioeconomic and solar-adoption contexts, prioritize a region, and appropriately align the incentives to optimize solar-energy utilization. While our results are a clear indication that solar-energy potential is not fully utilized, it can be changed through systematic and careful studies in this direction along with government support and funding.
Furthermore, these outcomes have the potential to furnish useful contributions for examining and monitoring the PV-system-installation status in a region and identifying the suitable areas that have high solar-power potential. It will be useful to conduct this study in remote areas to check their PV density and solar potential before making any decision regarding power plants, because establishing new power lines is a high investment cost. Specifically, remote areas typically have low-rise structures, are free of shading, and have abundant capacity for solar PV systems, which can make them highly beneficial assets to the country.
Lastly, this study intended to demonstrate the advantages of applying deep-learning algorithms and spatial-analytical techniques to determine the most suitable rooftops to optimize the use of solar energy in Ballarat. Performing the deep-learning and GIS analyses together provides a deeper, more realistic view of future solar-PV-system deployment plans. Furthermore, it can help to clarify regional renewable-energy strategies and supply/demand forecasting. Finally, executing the deep-learning process using GIS software does not require extensive knowledge of coding and provides robust spatial-analysis options with an efficacious algorithm that generates reliable results.
4.2. Limitations
This study illustrates a methodological framework to uncover the spatial distribution of installed solar PV systems and the solar-power potential of the entire study area; however, there are some limitations to this work at different levels. First, the input data can be improved to enhance the correctness of the results. For instance, a higher spatial resolution of the DSM for the solar-radiation analysis would yield a more accurate outcome, especially for small buildings. Secondly, the machine configuration used can be increased so that it can handle large-size data, process them effectively and speed up the overall process. For instance, the configuration used for this study restricts the batch size while training the model due to the size of graphics card of the workstation, which results in high computational time. Addressing these challenges can help the research to timely produce more accurate results.
5. Conclusions
Considering the apparent harmful impacts on the environment from non-renewable-energy usage and the possibility of mitigating them by transitioning to renewable-energy sources, this study proposes a conceptual framework to understand and calculate the potential of solar energy to generate electricity. This paper studied the relevant research on this topic and highlighted the importance and urgency of migration to renewable resources in order to develop a sustainable future. All the datasets were acquired from trusted sources. This study used cutting-edge robust technology and explains all the necessary steps of the methodology to make it replicable for future work. The SSD model with the backbone of ResNet34 has shown reliable outcomes in detecting solar panels from high-resolution aerial imagery, and ArcGIS Pro has proven to be an efficacious software with effective tools in computing the solar-power potential.
Additionally, this study can easily be applied to other geographical areas and possibly be extended by considering the socio-economic factors to gain an understanding of the reasons behind the discovered patterns. Through our results, it can be inferred that the study area has a considerable amount of solar-suitable areas with a significant amount of solar-power potential, but a substantially lower existing PV density. To conclude, the necessity and possibility of increasing solar-PV-system deployment to offset GHG emission have been highlighted by the statistical and spatial findings of this work. Our result would allow planners and authorities to discover the best-suited PV-system locations and estimate energy savings for each property.
Author Contributions
Introduction, conceptualization, data analysis, result’s interpretation, discussion, S.K.; resources, reviewing, supervision, Q.S. All authors have read and agreed to the published version of the manuscript.
Funding
This study is supported by the NCRIS-enabled Australian Urban Research Infrastructure Network (AURIN). Project name: Integrated Heat Vulnerability Assessment Toolkit for Australian Cities, AURIN, High Impact Projects 2021.
Institutional Review Board Statement
Not applicable.
Informed Consent Statement
Not applicable.
Data Availability Statement
Not applicable.
Conflicts of Interest
The authors declare no conflict of interest.
Appendix A

Figure A1.
Samples of bounding boxes generated by the model containing the solar panels.
Figure A1.
Samples of bounding boxes generated by the model containing the solar panels.
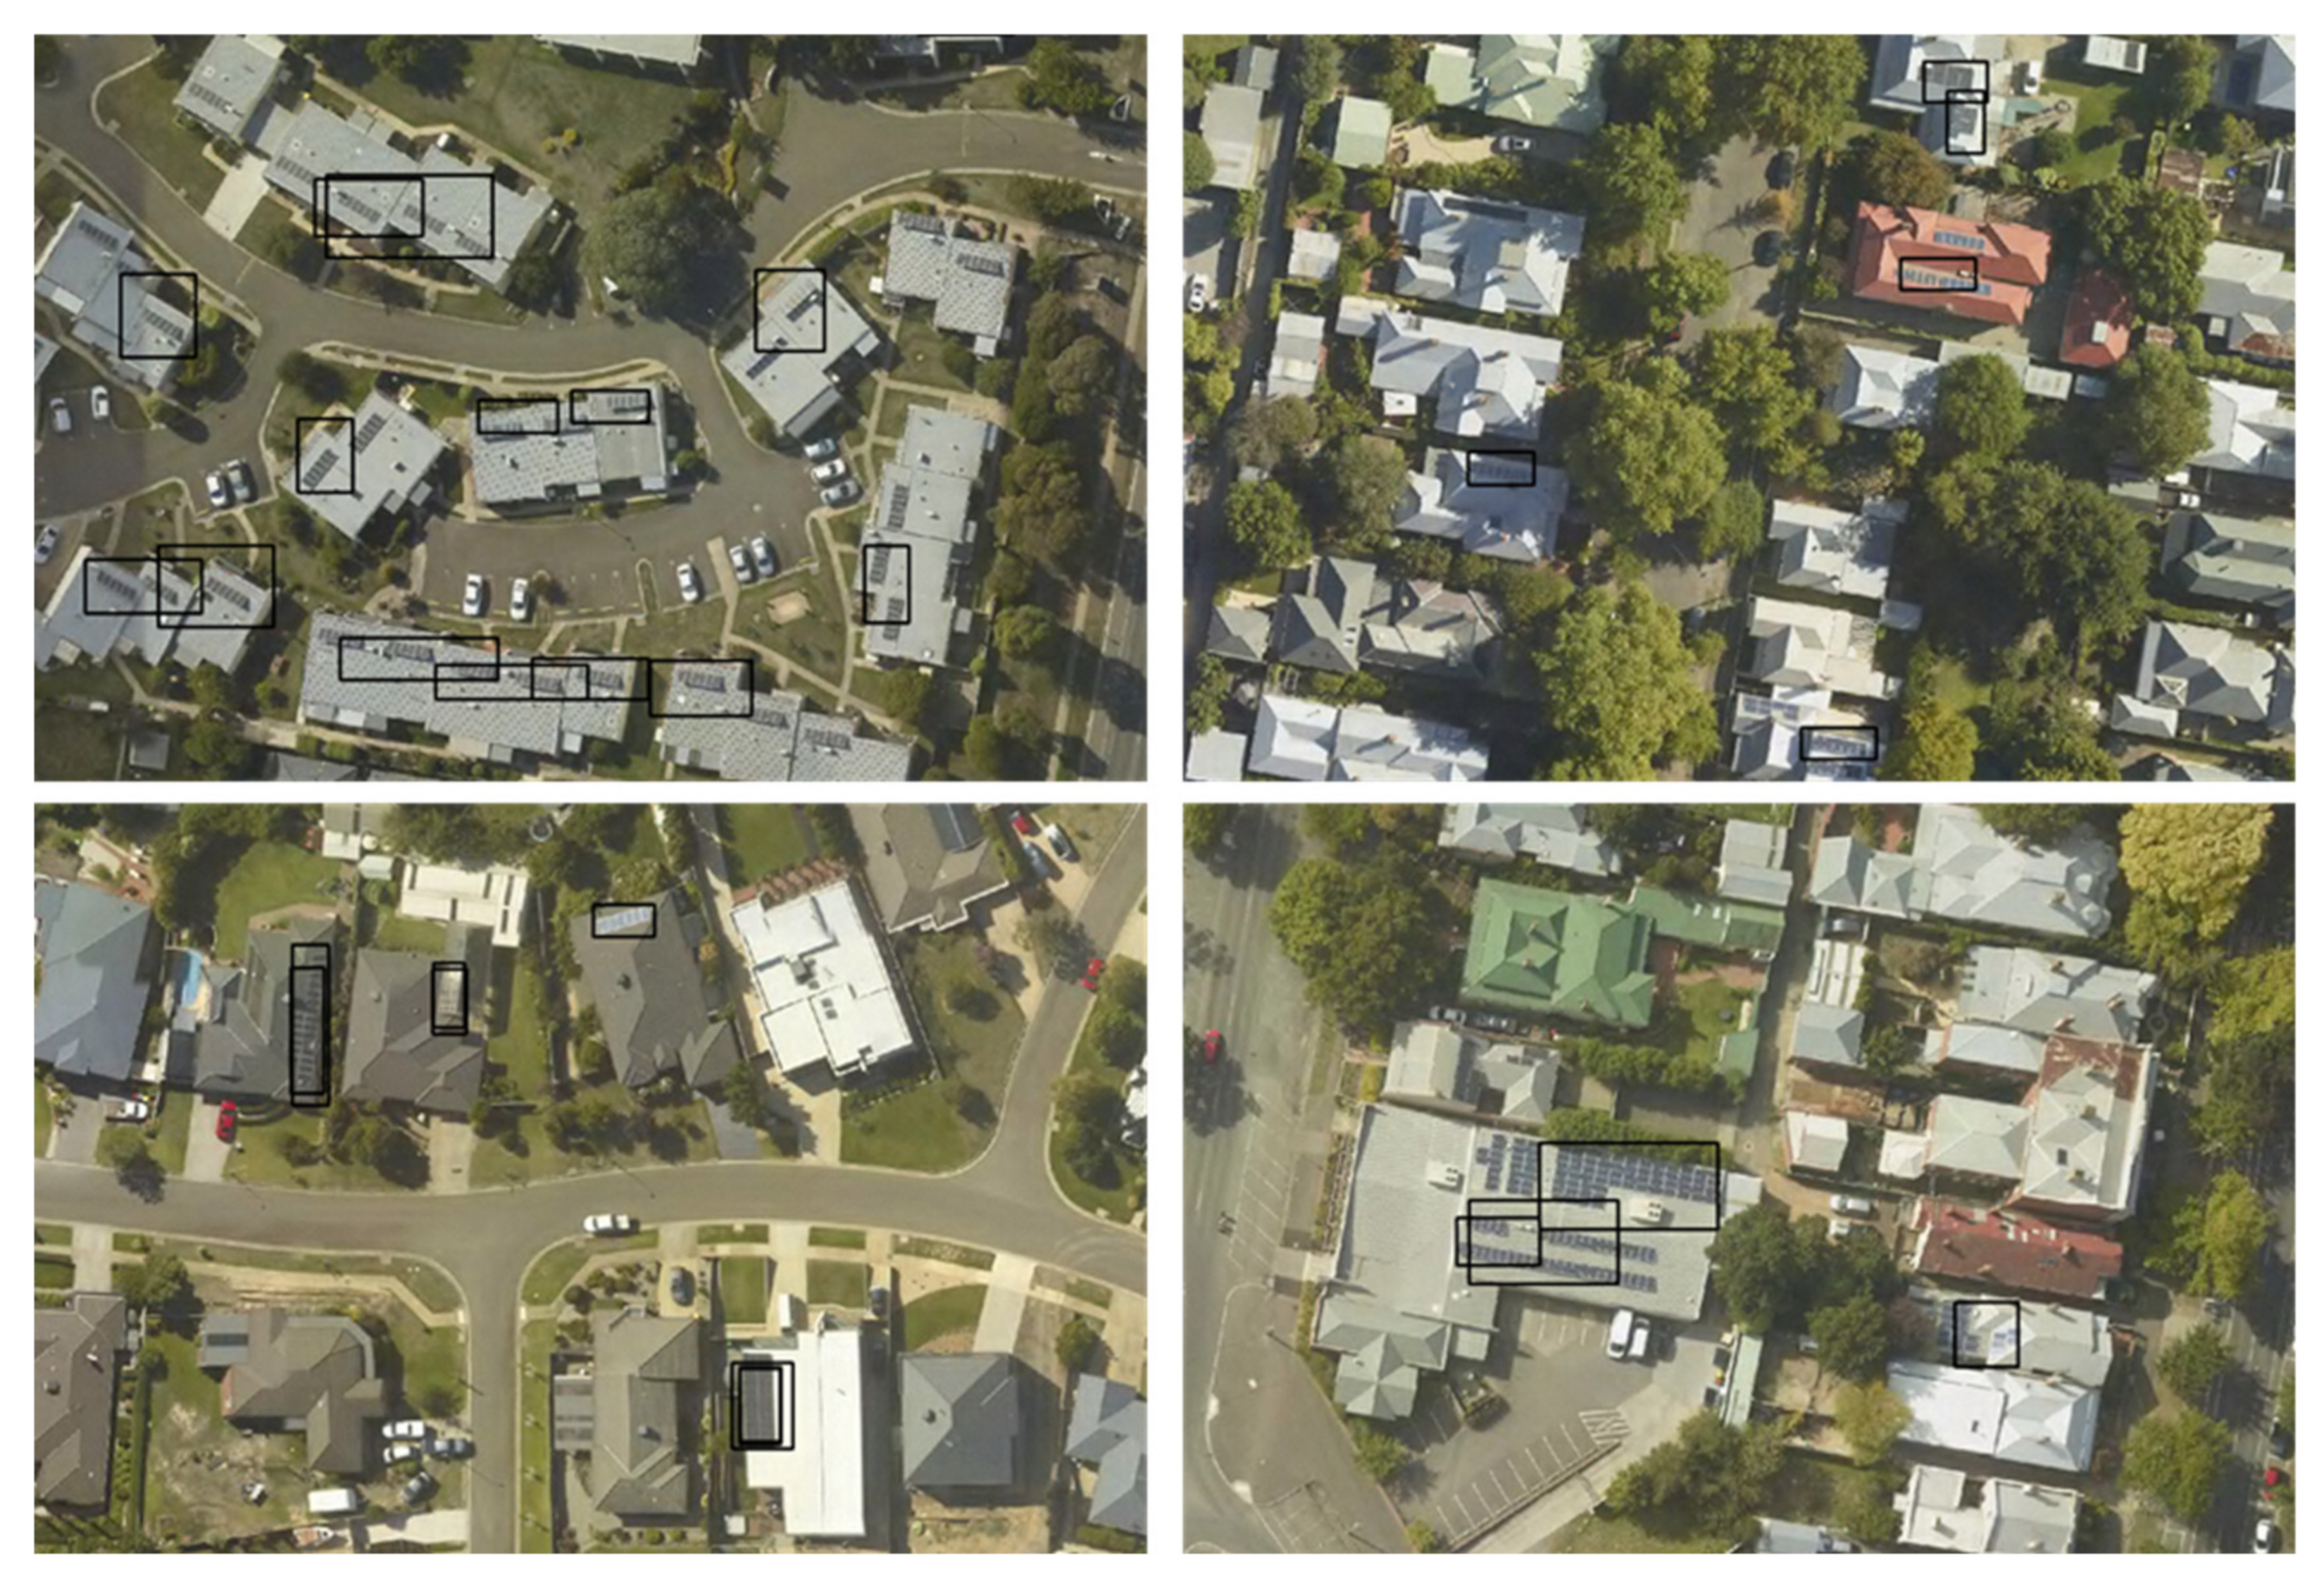
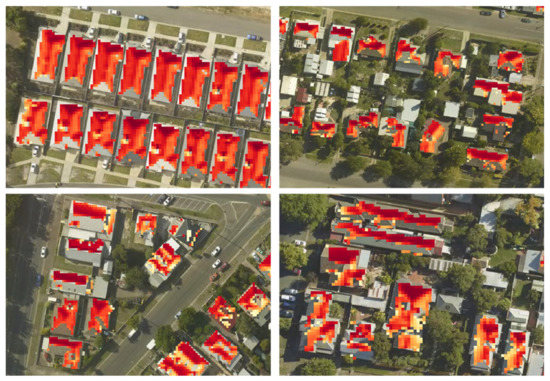
Figure A2.
Sample of computed solar radiation on roofs.
Figure A2.
Sample of computed solar radiation on roofs.


Figure A3.
Spatial distribution of computed solar radiation.
Figure A3.
Spatial distribution of computed solar radiation.
References
- Sen, Z. Solar Energy Fundamentals and Modeling Techniques—Atmosphere, Environment, Climate Change and Renewable Energy; Springer: London, UK, 2008; pp. 15–64. [Google Scholar]
- Li, D. Using GIS and Remote Sensing Techniques for Solar Panel Installation Site Selection. Master’s Thesis, University of Waterloo, Waterloo, ON, Canada, 2013. [Google Scholar]
- Burck, J.; Hagen, U.; Höhne, N.; Nascimento, L.; Bals, C. Climate Change Performance Index Results. 2020. Available online: https://www.germanwatch.org/en/17281 (accessed on 31 May 2021).
- Olivier, J.G.; Schure, K.M.; Peters, J.A.H.W. Trends in Global CO2 and Total GHG Emissions; PBL Netherlands Environmental Assessment Agency: The Hague, The Netherlands, 2017. [Google Scholar]
- Our World in Data. CO2 Emissions by Fuel. 2021. Available online: https://ourworldindata.org/emissions-by-fuel (accessed on 31 May 2021).
- Jamasb, T.; Pollitt, M.G. The Future of Electricity Demand: Customers, Citizens and Loads; Cambridge University Press: Cambridge, UK, 2011. [Google Scholar]
- Department of Industry, Science, Energy and Resources (DISER). Australian Energy Statistics. 2020. Available online: https://www.energy.gov.au/publications/australian-energy-statistics-table-o-electricity-generation-fuel-type-2018-19-and-2019 (accessed on 31 May 2021).
- Chester, L.; Elliot, A. Energy Problem Representation: The Historical and Contemporary Framing of Australian Electricity Policy. Energy Policy 2019, 128, 102–113. [Google Scholar] [CrossRef]
- Friedlingstein, P.; O’Sullivan, M.; Jones, M.W.; Andrew, R.M.; Hauck, J.; Olsen, A.; Peters, G.P.; Peters, W.; Pongratz, J.; Sitch, S.; et al. Global Carbon Budget 2020. Earth Syst. Sci. Data 2020, 12, 3269–3340. [Google Scholar] [CrossRef]
- Climate Council. What Does Net Zero Emissions Mean? Explainer. 2021. Available online: https://www.climatecouncil.org.au/resources/what-does-net-zero-emissions-mean/ (accessed on 15 November 2021).
- Bódis, K.; Kougias, I.; Jäger-Waldau, A.; Taylor, N.; Szabó, S. A High-Resolution Geospatial Assessment of The Rooftop Solar Photovoltaic Potential in The European Union. Renew. Sustain. Energy Rev. 2019, 114, 109309. [Google Scholar] [CrossRef]
- Jordaan, S.M.; Romo-Rabago, E.; Mcleary, R.; Reidy, L.; Nazari, J.; Herremans, I.M. The Role of Energy Technology Innovation in Reducing GHG Emissions: A Case Study of Canada. Renew. Sustain. Energy Rev. 2017, 78, 1397–1409. [Google Scholar] [CrossRef]
- Li, H.X.; Edwards, D.J.; Hosseini, M.R.; Costin, G.P. A Review on Renewable Energy Transition in Australia: An Updated Depiction. J. Clean. Prod. 2020, 242, 118475. [Google Scholar] [CrossRef]
- Bilgili, M.; Ozbek, A.; Sahin, B.; Kahraman, A. An Overview of Renewable Electric Power Capacity and Progress in New Technologies in The World. Renew. Sustain. Energy Rev. 2015, 49, 323. [Google Scholar] [CrossRef]
- Teofilo, A.; Sun, Q.C.; Radosevic, N.; Tao, Y.; Iringan, J.; Liu, C. Investigating Potential Rooftop Solar Energy Generated by Leased Federal Airports in Australia: Framework and Implications. J. Build. Eng. 2021, 41, 102390. [Google Scholar] [CrossRef]
- Terashima, K.; Sato, H.; Ikaga, T. Development of An Environmentally Friendly Pv/T Solar Panel. Sol. Energy 2020, 199, 510–520. [Google Scholar] [CrossRef]
- Australian Renewable Energy Agency (ARENA). Chapter 10 Solar Energy. 2013. Available online: https://arena.gov.au/assets/2013/08/Chapter-10-Solar-Energy.pdf (accessed on 8 June 2021).
- Carbajo, R.; Cabeza, L.F. Renewable Energy Research and Technologies Through Responsible Research and Innovation Looking Glass: Reflexions, Theoretical Approaches and Contemporary Discourses. Appl. Energy 2018, 211, 792–808. [Google Scholar] [CrossRef]
- Masini, A.; Menichetti, E. The Impact of Behavioural Factors in The Renewable Energy Investment Decision Making Process: Conceptual Framework and Empirical Findings. Energy Policy 2012, 40, 28–38. [Google Scholar] [CrossRef]
- Mondal, M.A.H.; Islam, A.S. Potential and Viability of Grid-Connected Solar Pv System in Bangladesh. Renew. Energy 2011, 36, 1869–1874. [Google Scholar] [CrossRef]
- Sun, Y.-W.; Hof, A.; Wang, R.; Liu, J.; Lin, Y.-J.; Yang, D.-W. GIS-Based Approach for Potential Analysis of Solar PV Generation at The Regional Scale: A Case Study of Fujian Province. Energy Policy 2013, 58, 12. [Google Scholar] [CrossRef]
- Clean Energy Reviews. Most Efficient Solar Panels 2021. Available online: https://www.cleanenergyreviews.info/blog/most-efficient-solar-panels (accessed on 8 June 2021).
- Bloombergnef. 2021. Available online: https://about.bnef.com/ (accessed on 8 June 2021).
- Briguglio, M.; Formosa, G. When Households Go Solar: Determinants of Uptake of a Photovoltaic Scheme and Policy Insights. Energy Policy 2017, 108, 154–162. [Google Scholar] [CrossRef]
- Lorenz, D.; Lützkendorf, T. Sustainability in Property Valuation: Theory and Practice. J. Prop. Invest. Financ. 2008, 26, 16–21. [Google Scholar]
- Graziano, M.; Gillingham, K. Spatial Patterns of Solar Pv System Adoption: The Influence of Neighbors and The Built Environment. J. Econ. Geogr. 2014, 15, 815–839. [Google Scholar] [CrossRef]
- Hartner, M.; Mayr, D.; Kollmann, A.; Haas, R. Optimal Sizing of Residential Pv-Systems from A Household and Social Cost Perspective. Sol. Energy 2017, 141, 9–17. [Google Scholar] [CrossRef]
- Charabi, Y.; Rhouma, M.B.H.; Gastli, A. GIS-Based Estimation of Roof-Pv Capacity & Energy Production for The Seeb Region in Oman. In Proceedings of the 2010 IEEE International Energy Conference, Manama, Bahrain, 18–22 December 2010. [Google Scholar]
- Gooding, J.; Edwards, H.; Giesekam, J.; Crook, R. Solar City Indicator: A Methodology to Predict City Level Pv Installed Capacity By Combining Physical Capacity and Socio-Economic Factors. Sol. Energy 2013, 95, 325–335. [Google Scholar] [CrossRef]
- Al Garni, H.Z.; Awasthi, A. Solar Pv Power Plant Site Selection using a GIS-AHP Based Approach with Application in Saudi Arabia. Appl. Energy 2017, 206, 1225–1240. [Google Scholar] [CrossRef]
- Regional Development Victoria. Regional City of Ballarat. 2021. Available online: https://www.rdv.vic.gov.au/victorias-regions/ballarat (accessed on 8 June 2021).
- Australian Photovoltaic Institute. Mapping Australian Photovoltaic Installations. 2022. Available online: https://pv-map.apvi.org.au/historical#9/-37.5624/143.9346 (accessed on 3 May 2021).
- Najafabadi, M.M.; Villanustre, F.; Khoshgoftaar, T.M.; Seliya, N.; Wald, R.; Muharemagic, E. Deep learning applications and challenges in big data analytics. J. Big Data 2015, 2, 1–21. [Google Scholar] [CrossRef] [Green Version]
- Liu, W.; Anguelov, D.; Erhan, D.; Szegedy, C.; Reed, S.; Fu, C.-Y.; Berg, A.C. Ssd: Single Shot MultiBox Detector; Springer International Publishing: Cham, Switzerland, 2016; pp. 21–37. [Google Scholar]
- Gu, S.; Ding, L.; Yang, Y.; Chen, X. A new deep learning method based on AlexNet model and SSD model for tennis ball recognition. In Proceedings of the 2017 IEEE 10th International Workshop on Computational Intelligence and Applications (IWCIA), Hiroshima, Japan, 11–12 November 2017; pp. 5–16. [Google Scholar]
- Jeong, J.; Park, H.; Kwak, N. Enhancement of SSD by concatenating feature maps for object detection. arXiv 2017, arXiv:1705.09587. [Google Scholar]
- Bennett, L. Machine learning in ArcGIS. ArcUser 2018, 21, 8–9. [Google Scholar]
- Bahaghighat, M.; Xin, Q.; Motamedi, S.A.; Zanjireh, M.M.; Vacavant, A. Estimation of wind turbine angular velocity remotely found on video mining and convolutional neural network. Appl. Sci. 2020, 10, 3544. [Google Scholar] [CrossRef]
- Alhammad, A.; Sun, Q.C.; Tao, Y. Optimal Solar Plant Site Identification Using GIS and Remote Sensing: Framework and Case Study. Energies 2022, 15, 312. [Google Scholar] [CrossRef]
- Radosevic, N.; Liu, G.J.; Tapper, N.; Zhu, X.; Sun, Q.C. Solar Energy Modeling and Mapping for a Sustainable Campus at Monash University. Front. Sustain. Cities 2022, 3, 745197. [Google Scholar] [CrossRef]
- Learn.arcgis.com. Estimate Solar Power Potential. 2021. Available online: https://learn.arcgis.com/en/projects/estimate-solar-power-potential/ (accessed on 8 June 2021).
- Fu, P.; Rich, P.M. A Geometric Solar Radiation Model with Applications in Agriculture and Forestry. Comput. Electron. Agric. 2002, 37, 25–35. [Google Scholar] [CrossRef]
- Pro.arcgis.com. How Solar Radiation Is Calculated—ArcGIS Pro. Documentation. 2021. Available online: https://pro.arcgis.com/en/pro-app/latest/tool-reference/spatial-analyst/how-solar-radiation-is-calculated.htm (accessed on 1 November 2021).
- US EPA. Green Power Equivalency Calculator—Calculations and References. 2021. Available online: https://www.epa.gov/greenpower/green-power-equivalency-calculator-calculations-and-references (accessed on 8 June 2021).
- Statista. Australia Power Sector Carbon Intensity Outlook 2050. 2021. Available online: https://www.statista.com/statistics/1190081/carbon-intensity-outlook-of-australia/ (accessed on 16 November 2021).
- Poruschi, L.; Ambrey, C.L.; Smart, J.C. Revisiting feed-in tariffs in Australia: A review. Renew. Sustain. Energy Rev. 2018, 82, 260–270. [Google Scholar] [CrossRef]
- Lan, H.; Gou, Z.; Lu, Y. Machine learning approach to understand regional disparity of residential solar adoption in Australia. Renew. Sustain. Energy Rev. 2021, 136, 110458. [Google Scholar] [CrossRef]
- SolarQuotes. Solar Panel Rebate: How It Works and How to Get It. 2022. Available online: https://www.solarquotes.com.au/panels/rebate/ (accessed on 3 May 2022).


Publisher’s Note: MDPI stays neutral with regard to jurisdictional claims in published maps and institutional affiliations. |
© 2022 by the authors. Licensee MDPI, Basel, Switzerland. This article is an open access article distributed under the terms and conditions of the Creative Commons Attribution (CC BY) license (https://creativecommons.org/licenses/by/4.0/).