Article

Reducing Carbon Emissions from the Tourist Accommodation Sector on Non-Interconnected Islands: A Case Study of a Medium-Sized Hotel in Rhodes, Greece

1
ISATEC GmbH, Rathausstraße 10, 52072 Aachen, Germany
2
School of Biological Sciences, University of Aberdeen, Cruickshank Building, St Machar Drive, Aberdeen AB24 3UU, Scotland, UK
3
Hellenic Centre for Marine Research, Institute of Oceanography, Hydrobiological Station of Rhodes, Cos Street, 85100 Rhodes, Greece
4
Marine Biodiscovery Centre, Department of Chemistry, University of Aberdeen, Aberdeen AB24 3UE, Scotland, UK
5
Department of Chemistry and Biochemistry, San Diego State University, San Diego, CA 92182-1030, USA
6
Institute of Energy and Climate Research (IEK-3), Techno-Economic Systems Analysis, Forschungszentrum Jülich GmbH, Wilhelm-Johnen-Str., 52428 Jülich, Germany
7
Cologne Institute for Renewable Energy (CIRE), TH Köln, Faculty of Process Engineering, Energy and Mechanical Systems, Betzdorfer Str. 2, 50679 Köln, Germany
*
Authors to whom correspondence should be addressed.
Energies 2022, 15(10), 3801; https://doi.org/10.3390/en15103801
Submission received: 5 January 2022 / Revised: 5 May 2022 / Accepted: 11 May 2022 / Published: 21 May 2022
(This article belongs to the Special Issue Frontiers in Marine Carbon Cycle)

Abstract

:
Reducing the carbon emissions from hotels on non-interconnected islands (NII) is essential in the context of a low carbon future for the Mediterranean region. Maritime tourism is the major source of income for Greece and many other countries in the region, as well as hot-temperate and tropical regions worldwide. Like many NIIs, Rhodes attracts a high influx of tourists every summer, doubling the island’s energy demand and, given the high proportion of fossil fuels in the Rhodian energy supply, increasing carbon emissions. Using the theoretical framework ‘FINE’, this paper presents the optimisation of a medium-sized hotel’s energy system with the aim of reducing both cost and carbon emissions. By introducing a Photovoltaic (PV) net metering system, it was found that the carbon emissions associated with an NII hotel’s energy system could be reduced by 31% at an optimised cost. It is suggested that large-scale deployment of PV or alternative renewable energy sources (RES) in NII hotels could significantly reduce carbon emissions associated with the accommodation sector in Greece and help mitigate climate change.

1. Introduction

International tourism contributes to almost 5% of total global carbon emissions [1], and the NII Rhodes is one of the most popular tourist destinations in Europe [2]. The island is a host to a medieval old town, which has been declared a UNESCO World Heritage Site [3] and boasts a number of attractive beaches. These attractions, combined with the island’s hot summer weather [4], draw a large influx of visitors in the high season from June to September. Between 2010 and 2020, the number of tourists visiting Rhodes reached an annual peak tourist-to-resident ratio of 3:1 in the months of July and August [2]. Whilst tourism is undoubtedly of enormous benefit to the economy of the island [5], it not only generates higher demand for hotel accommodation, swimming pool amenities, and bar and restaurant services but also causes a spike in the use of air conditioning for thermal comfort [2]. With 85.7% of the energy demand on Rhodes met by fossil fuels [6], increased energy consumption is closely correlated with higher greenhouse gas emissions. Data recorded on the popular Greek holiday island of Crete highlights that 13% of carbon emissions per visitor trip can be attributed to the accommodation sector. The remaining carbon emissions are associated with transport and visitor activities (81% and 6%, respectively) [7]. Moreover, as [8] points out, 10% of total Greek energy demand is attributable to the hotel sector, a significant proportion of this demand (75%) being generated by heating and cooling spaces and for heating water, respectively. Both studies demonstrate the considerable impact of tourist hotels on increased energy demand and, consequently, carbon dioxide emissions, in particular in the case of the Greek islands.
Electricity consumption data for Rhodes, published by the Hellenic Electricity Distribution Network Operator (HEDNO), closely correlate with the evidence provided by other sources [5,7,8] (Figure 1). As expected, a spike in electricity consumption can be observed during the peak of the tourist season. The comparative dip in electricity consumption in the summer of 2020, when visitor numbers fell in the wake of the global COVID-19 pandemic, is further evidence of the impact of tourism on electricity consumption. On a positive note, like most NIIs, Rhodes offers a high potential for renewable energy production, in particular wind and solar [2,9], providing the island with ample opportunity to cover part or all of its energy requirements with renewable energy sources (RES). Moreover, the large proportion of carbon emissions attributed to the tourist accommodation sector highlights the vast carbon reduction potential associated with increased use of RES and reduced energy consumption in hotels and other residential buildings [10]. This may prove to be a highly beneficial attribute with a view to mitigating climate change.
It is evident that there is a strong interest in reducing carbon emissions in the European hotel sector. However, very few studies have analysed individual hotels on NIIs where the levels of tourism-related carbon emissions are extremely high, and fossil fuels are extensively consumed. This study was conducted in order to characterise the key energy usage patterns of a typical Mediterranean hotel and identify a suitable supplementation of grid-supplied, fossil-derived power by low-carbon, locally installed photovoltaic renewable energy systems, the aim being to generate significant savings in both carbon emissions and energy expenses. In view of the currently high share of fossil fuels in the hotel’s energy mix, it is hypothesised that the introduction of RES into the hotel’s energy system will reduce both total annual cost (TAC) and carbon emissions. This case study seeks to provide a template framework which can be extrapolated to other NII hotels. It is expected that large-scale deployment would reduce carbon emissions associated with the tourist accommodation sector on NIIs. As the analysis is performed with the flexible, open access framework for energy systems modelling FINE, the study can be easily adapted to other cases and locations in the world.

2. Literature Review

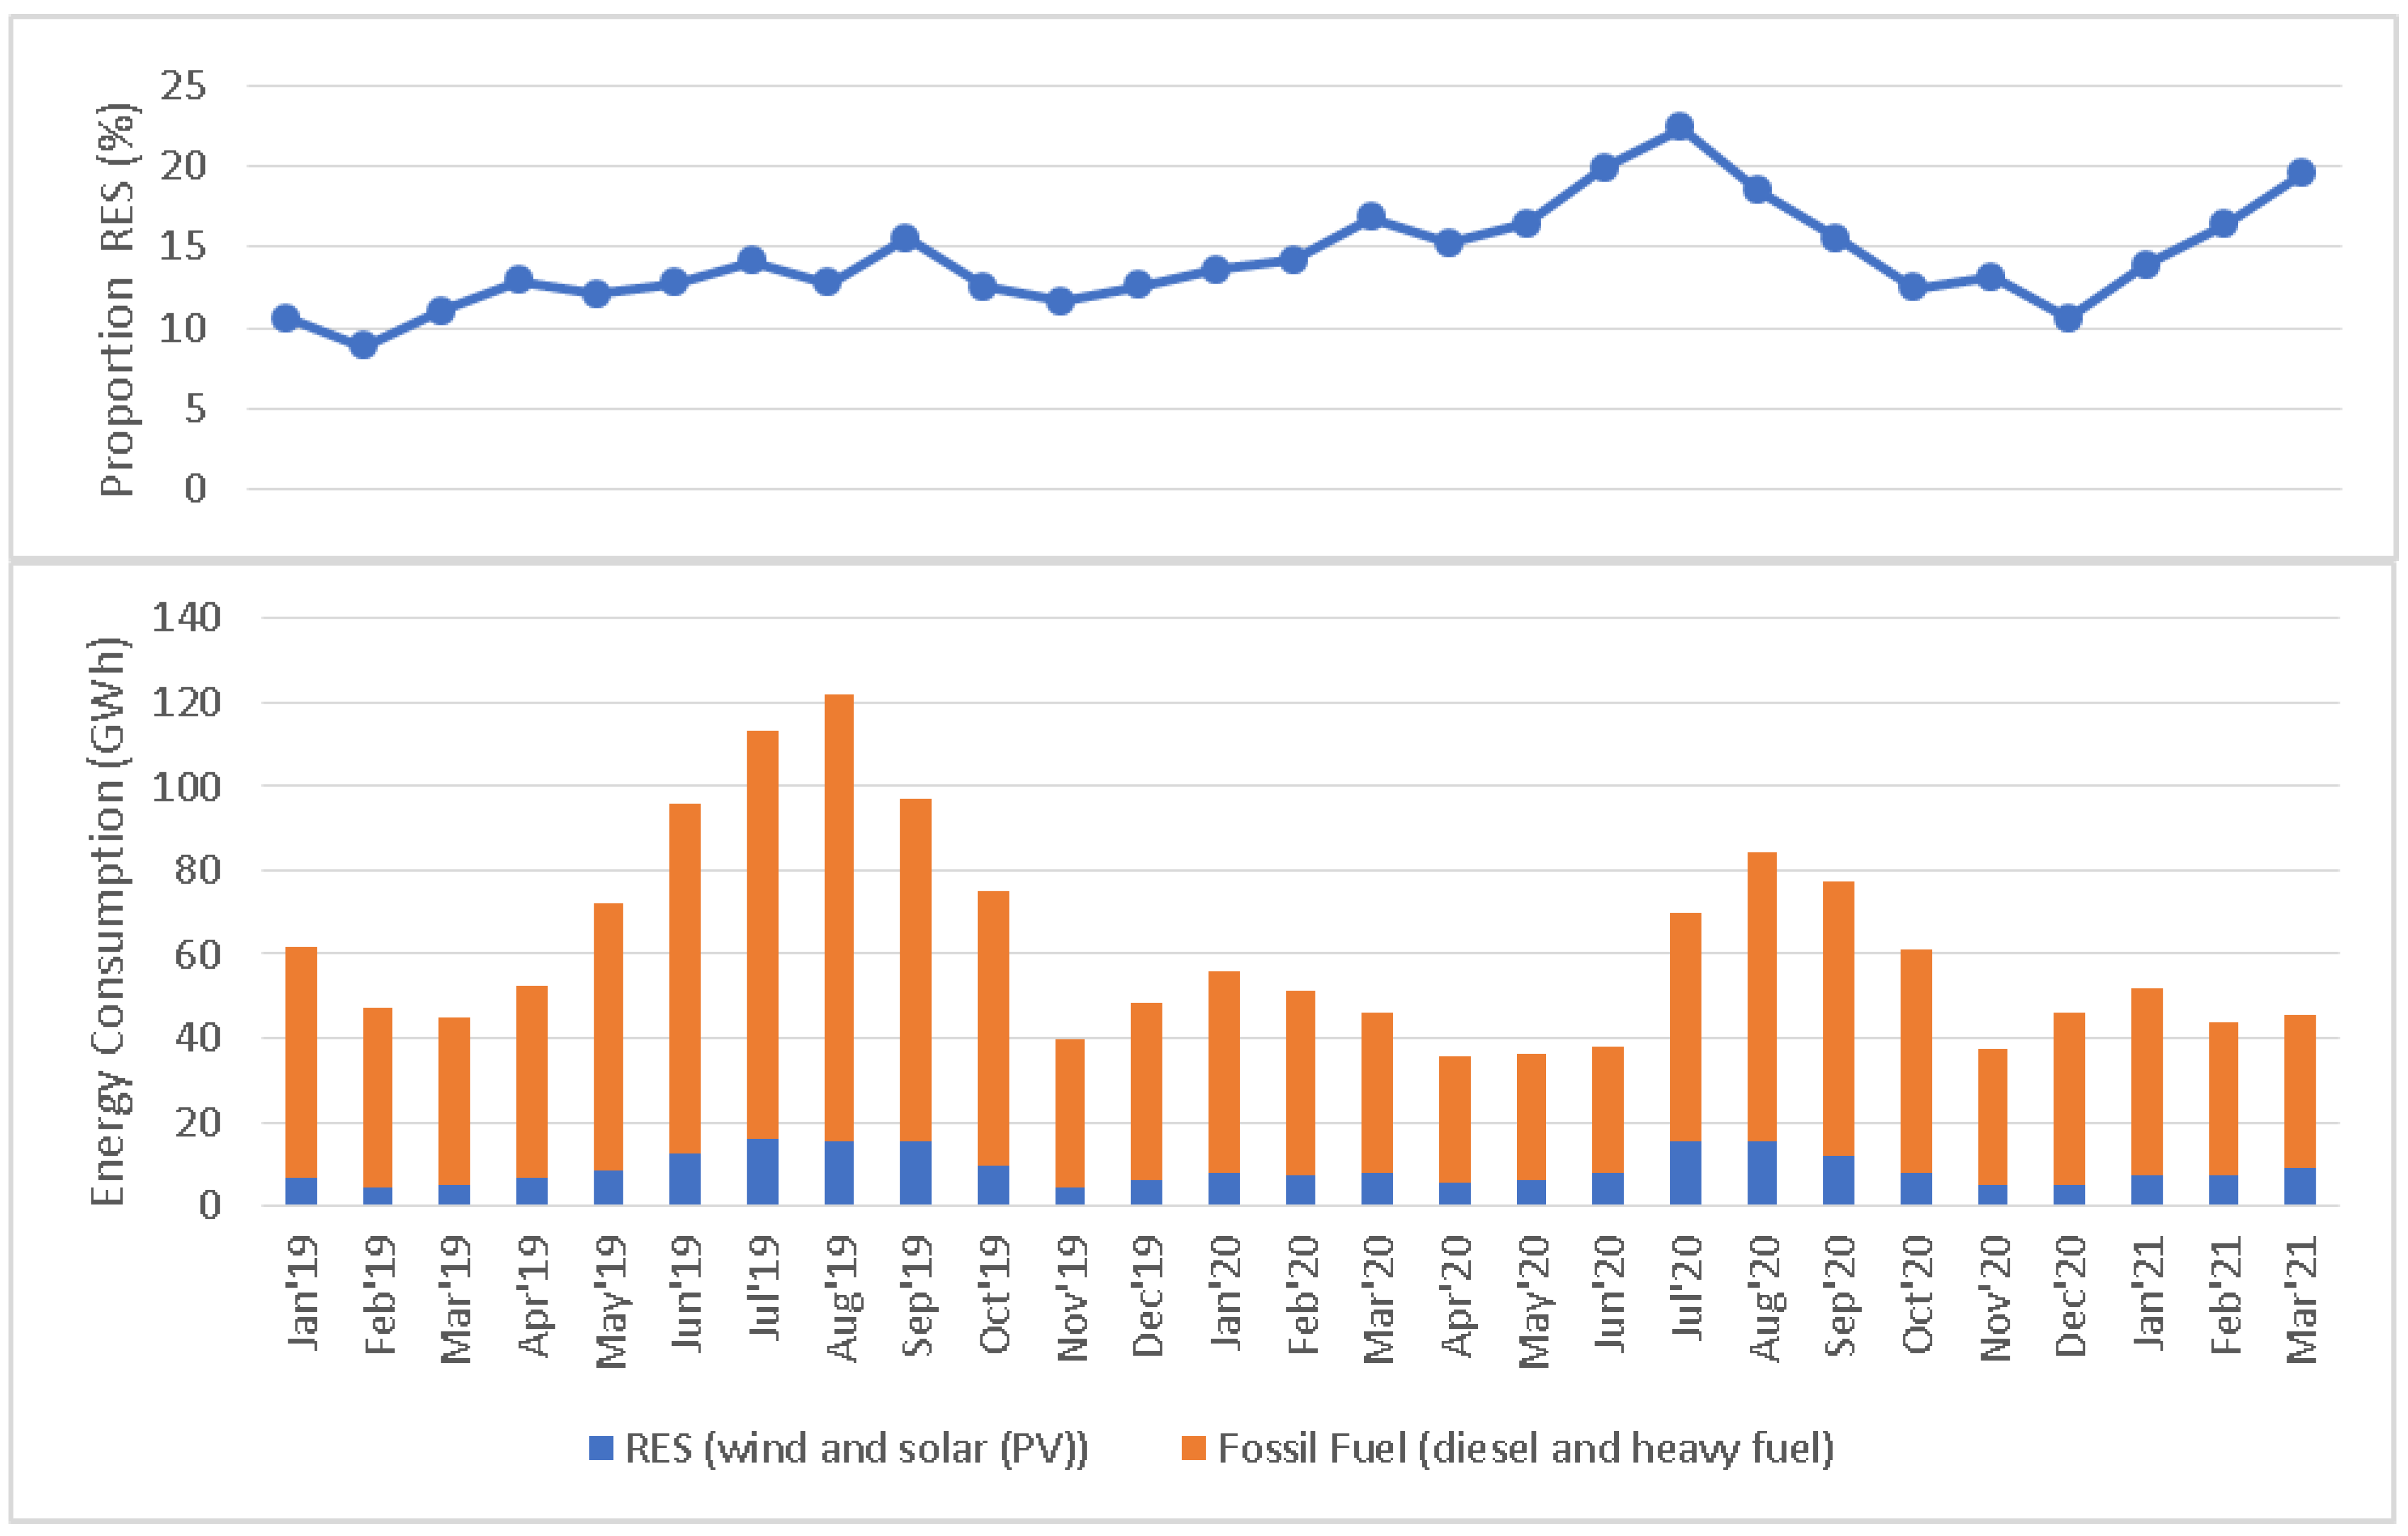
2.1. Current State of Affairs—Greece

In summer 2021, Greece was impacted by what is considered to be ‘its worst heatwave in more than 30 years’ [12]. With close to record-breaking temperatures of 46-degrees Celsius [13], wildfires have caused residents near Athens to flee their homes. This heatwave is considered to be the worst since July 1987, when over one thousand deaths were recorded in and around the capital in the period 20–31 July [14]. One concomitant cause of these fatalities was the heat stress experienced by residents when daytime air temperatures ranged between 40–45 degrees Celsius [14]. It should be noted that cooling technologies were then not as widely accessible as they are today. Given that a major proportion of the energy demand of the Greek hotel sector is attributable to cooling [8], the use of air conditioning can be expected to have risen even further throughout the 2021 heatwave, and in general, given the increasing frequency of such heatwaves caused by climate change. This means that in order to meet the increased cooling demand, Rhodian fossil fuel power plants will be operating at maximum capacity, thereby further exacerbating climate change. Moreover, the unreliability of NII energy systems causes frequent blackouts and energy shortages during periods of high demand [10]. Loss of electricity for cooling is a major risk during heatwaves when heat stress has proven to be a threat to human health [14]. The rise in heatwave frequency and extremity, coupled with the increased risk of energy shortages, demonstrates the importance of creating self-sustaining energy systems with an increased share of RES in energy production.
In the wake of the current climate crisis, Greece plans to connect most of its NIIs with the mainland by 2030 [15]. This will have a positive impact on the energy system of Rhodes, not only generating a more efficient and reliable energy supply but also reducing the currently high energy production costs associated with the import of fossil fuels [10]. The Greek National Energy and Climate Plan has set out specific objectives to attain energy and climate goals by 2030 [15]. These objectives include a reduction in greenhouse gas emissions by over 56% compared with 2005 emission levels, an increase in the share of RES in energy consumption to a minimum of 35%, and greater efficiency of energy use [15]. To support this initiative, a number of schemes have been implemented to help private individuals, small businesses, and public entities to expand the proportion of RES in their energy mix. An initiative of specific interest in this context is a support scheme for electricity generation by means of PV panels on both the mainland and NIIs [16]. This scheme is a net metering programme that allows users who produce their own electricity by means of PV systems to export their surplus energy back to the grid. It has to be noted that in the framework of net metering, maximum capacity limits are defined for the installed PV systems: for non-interconnected islands, PV systems need to be smaller than 10 kWp or have less than 50% of the agreed power consumption [16]. For the hotel under investigation, 50% of the agreed electricity consumption of 265.8 kW is not reached even with maximum expansion, so the expansion of PV in the case presented here is not limited by the maximum capacity limit. Incentives of this kind encourage individuals to increase the share of RES in energy production and thus contribute to reducing carbon emissions.

2.2. Sustainable Energy Systems

A wide range of studies have already analysed the most effective methods of reducing carbon emissions in energy production. For the purposes of this report, papers analysing sustainable island energy systems and individual residential energy systems were evaluated in order to identify appropriate strategies to reduce carbon emissions within the tourist accommodation sector on NIIs.
The high costs associated with fuel imports, the vast RES potential available on Greek islands, and the National Energy and Climate Plan initiatives have provided an incentive for various Greek NIIs to maximise the use of RES in their energy systems in recent years. A string of Greek islands are currently striving towards or have already achieved a self-sustained or carbon-neutral energy supply (Table 1). However, inadequate interconnection to the mainland poses a number of challenges to the integration of high RES ratios [17]. Given the intermittent nature of RES, guaranteeing sufficiently high energy storage capacity to accommodate excess power generation during high generation periods (e.g., high solar irradiance or optimal wind conditions) is particularly critical in this context [11].
Analysis of studies on the carbon reduction in European hotels or buildings highlights that the following factors contribute to promoting sustainability in the accommodation sector as a whole:
  • Improving a building’s structure to enhance energy efficiency and prevent unnecessary heat losses/gains [8,22];
  • Incorporating renewable energy technologies [10,18,20];
  • Implementing energy-saving strategies—inter alia key cards, thermostat controls and energy-saving light bulbs [8]—to reduce energy consumption;
  • Understanding public perception as a critical element in promoting the popularity of ‘green hotels’ [23];
  • Hotels are ultimately businesses that seek financial gain [8], hence the importance of optimising a hotel energy system in terms of both carbon emissions and costs.

3. Materials and Methods

3.1. Case Study—Kolymbia Bay Hotel (KBH)

KBH is a popular tourist hotel situated in the village of Kolymbia on the northeastern coast of the Greek island Rhodes (36°14′45.63″ N 28°09′40.3″ E). It is a family-run business with 58 guestrooms in three buildings and also features a swimming pool, a bar, a restaurant, and a supermarket. The hotel currently sources all its electrical energy from the local utility provider, which primarily relies on fossil fuel-based sources. The hotel’s hot water requirements are covered by 42 two-square-metre solar thermal panels, supplemented by electrical heat pumps during the winter. The location of the hotel offers a high solar capacity with a long-term average photovoltaic power potential of approximately 1700 kWh/kWp per year [24]. Unlike the south and west of the island, the potential for wind power at this location is insignificant [25]. PV technology is therefore prioritised in this particular case study. High external temperatures experienced during the summer months in Kolymbia village significantly increase the demand for air conditioning at the hotel. This, coupled with increased visitor numbers, results in a large peak in energy consumption between April and October (Figure 2). Positively, it can be seen that the hotel’s energy demand peaks when the solar potential is at its highest (Figure 2 and Figure 3). This points to solar energy as an appropriate choice. In 2021, with a price of 0.23 EUR/kWh and an assumed energy demand for a regular year of 385 MWh, the total annual cost (TAC) for electricity was about EUR 88,550 for the KBH. The price of electricity recently increased to 0.30 EUR/kWh (exact value obtained for March 2022). This value was taken as the upper bound of electricity price in our parametric study shown in Section 4.1.

3.2. Theoretical Framework—FINE

The FINE python package provides a framework for modelling, optimising, and assessing energy systems. This framework can be used for a number of applications, including residential, industrial, and mobility energy systems. Moreover, systems with multiple regions, commodities, and time steps can be modelled. This optimisation programme aims to minimise the TAC of an energy system while at the same time factoring in environmental and technical constraints, e.g., carbon emissions [27,28]. A number of studies have applied the optimisation approach to a range of energy systems [29,30,31,32]. Each study varies in the scale of the energy system examined and the approach adopted in the search for an optimal solution. For example, a study could compare potential RES sources or potential storage systems. All these studies have the common objective of reducing carbon emissions and increasing the share of RES in the residential sector at optimal cost.

3.3. Energy System Modelling

In view of the hotel’s PV power potential [24], the Greek National Energy and Climate Plan objectives [15] and the roll-out of PV incentive schemes [16], the KBH energy system was modelled and optimised by adding a PV net metering system (Figure 4). The model took two PV technologies into consideration, as well as the location, orientation, and tilt of the panels and also accounted for the quantity of energy required from the grid to supplement the PV system (Figure 4). In order to simulate a net metering system, the utility provider was added to each model as both an electricity source and a sink. The hotel’s energy system was modelled using the theoretical framework FINE [27]. FINE is written in Python language [33] and is supplemented by the programmes RESkit (Renewable Energy Simulation Toolkit) and PVlib (Open Source Photovoltaic Performance Modelling). PVlib provides accessible, reliable, and benchmark implementations of PV system models [34]. Using the System Advisor Model (SAM) database [35] for a wide range of PV modules and inverters, PVlib acquired all the parameters necessary for the introduction of PV technologies to an energy system model [34]. SARAH (Surface Solar Radiation Data Set—Heliosat) and ERA5 weather data were vital to predict a generation time series for each PV panel. SARAH data provide solar surface irradiance, the surface direct normalized irradiance, and the effective cloud albedo derived from satellite observations. Data are produced at monthly, daily, and hourly averages with a spatial resolution of 0.05° × 0.05° [36]. ERA5 provides solar radiation data (including global horizontal, direct, and diffuse irradiance) between the years 2010–2016 with worldwide coverage at hourly time steps and 0.28° lat/lon spatial resolution [37]. Using SARAH and ERA5 weather data, providing solar irradiance values for a specific location over a selected year, the RESkit tool simulated a system generation time series for each specified panel (acquired using PVlib). This generation time series was subsequently extracted and imported into the FINE model, where it was used to determine the TAC and carbon emissions associated with the hotel’s energy system [38]. All the models used can be found in the Supplementary Materials.

3.4. Model Locations

To account for the different investment costs for the construction of transmission cables linking the PV technologies on each building to the energy metre, the modelled hotel was divided into six locations: buildings 1–5 and the energy metre (Figure 5). The further away the respective building is from the energy metre, the higher the investment costs for the PV systems of the given building will be (due to the correspondingly higher wiring requirements). It was important to ensure that the cost of supplying AC cables from each building to the energy metre was only factored in once. The surface area available for PV installations on each building and the distance from the energy metre are outlined in Table 2 and illustrated in Figure 5. In order to define an economically viable positioning of the PV panels, the spacing of the PV panels was chosen as a compromise between maximum installed capacity and shading losses, as shown in Figure 6. These results were generated using the software Helioscope [39] and take the geometric constraints caused by the real geometry of the roofs and the panes into account. The shading losses are summarised in Table 3. These losses reduce the total PV capacity installed to an effective capacity that is used for the simulations.
In addition to buildings 1–5, the energy metre was added to the model as a single location to account for the fact that the hotel’s energy demand applies to the hotel as a whole, not just individual buildings. It was assumed that all the energy generated by PV technologies on each building was converted from DC to AC, applying separate inverters for each building and then transferred to the energy metre. As a result, any interactions between PV generation, energy demand, the utility provider, and carbon emissions were taken into account.

3.5. PV Technologies

Because of the wide variety of available PV technologies, it was necessary to identify which panels were the most likely to achieve the objective of reducing carbon emissions at an optimal cost. The two key factors impacting the growth of PV technologies have been cost and efficiency [40]. The higher the panel’s efficiency, the higher its power output, and the lower the number of modules required to meet the target energy demand. The cost per module can nevertheless be expected to rise with increasing efficiency [40]. On the other hand, a less efficient panel requires a higher number of modules to meet the same demand but may come at a lower cost. PV panel efficiency varies depending on the panel type, orientation, tilt, shading effects from structures and large trees, PV cell temperature, and physical obstructions, e.g., snow or dust [41,42,43]. In addition to improving cost-effectiveness and efficiency, studies have focused on developments in the incorporation of PV technology into the building envelope (building-integrated photovoltaics (BIPV)) [44,45,46]. The panels selected for optimisation in the present study represent (i) a standard panel, (ii) a more efficient but expensive panel, and (iii) building-integrated PV for the façade and balconies (Table 4). Moreover, rooftop tilt angles of 8 and 25 degrees will be compared. The orientations of installations on rooftops, balconies, and façades were south, east-southeast, and south-southwest, respectively (Figure 5). The maximum installed capacity depending on the PV technology applied to each building is given in Table 5.
Information on the selected PV technologies and rooftop tilt angles are shown below.
(i) Crystalline silicon technology
Today, crystalline silicon photovoltaics is the world’s leading PV technology, accounting for 70–90% of all installed modules. In addition, manufacturing costs have decreased over the last decade, while module efficiency and performance have increased, making it the most profitable technology today. Cells can either be cut from a single piece of crystalline silicon (monocrystalline technology) or assembled from multiple pieces of silicon to form the PV module (polycrystalline technology). While polycrystalline technology was popular for many years because of its lower cost, monocrystalline technology has now gained acceptance because the better material quality increases efficiency more than the cost [48]. To ensure comparability for validation (cf. Section 3.8), a module from Jinko Solar was used as the standard rooftop PV technology in our model [47,49].
(ii) Heterojunction technology
A new trend in PV technologies is heterojunction technology. Here, the advantages of crystalline and thin-film technology are combined. Thin-film modules are cheaper to manufacture because of the use of only small layers of material, but they are also less efficient than crystalline modules. The combination of a silicon wafer with thin-film layers on both sides leads to better absorption of the electric current and thus to higher efficiency. The cost per capacity is still higher than other technologies, but the efficiency of these modules reaches higher values than traditional modules, and further optimisations are expected in the coming years [49,50].
Therefore, this technology is added to the standard technology in this study, as it can achieve the maximum reduction in CO2 emissions possible today. One of the leading companies in the production of heterojunction PV modules is REC Solar (Singapore), so their latest module was chosen for this purpose.
(iii) State of the art: building-integrated PV (BIPV)
BIPV is being increasingly developed on account of the multifunctionality of this type of panel [44]. The term BIPV covers a wide range of PV technologies, including BIPV windows, blinds, façades, and thin-film [44,45,46]. When using BIPV on a building façade or window, factors such as shadowing effects and building orientation have to be taken into consideration [44] as they impact panel efficiency and, therefore, the feasibility of successful integration. Moreover, module temperature may be higher in regions of high solar irradiance in comparison with other regions. For this reason, a reasonable air channel should be considered to allow cooling [45]. Because of the abundant solar energy resources in locations of high solar irradiance and the high-efficiency rating of BIPV panels, this technology provides significant advantages and environmental benefits [45].
(iv) Optimal rooftop tilt angle
The optimal tilt angle of a PV panel is critical for maximal energy production and varies according to location and throughout a given year [51,52]. A study analysing the optimal tilt angle for the province of Izmir in western Turkey concluded that a tilt angle of 8 degrees was optimal during the months of July and August, whereas an angle of 61 degrees resulted in optimal exposure in December [51]. Because of the similarity in latitude between Rhodes and Izmir, it was assumed that the results of this study could be extrapolated to Rhodes. Another study [41] on optimal annual tilt angles chose to maximise the annual energy yield on Rhodes over a period of an entire year. It drew the conclusion that 25 degrees was the optimal tilt for maximum energy production from solar. When considering the energy demand profile of the KBH (Figure 2), it may be preferable to optimise the tilt angle of PV panels for maximal energy production during the months of July and August, when the demand is highest. For this reason, the present study analysed PV generation for rooftop panels at tilt angles of both 8 and 25 degrees. This permitted a conclusion to be drawn on whether maximum annual or maximum summer PV generation is preferable for a tourist hotel.

3.6. Hotel Electricity Demand

A key component for the optimisation model was hotel electricity demand at hourly time steps over a period of a year. This data series was created using the KBH’s monthly electricity consumption data for 2019 (Figure 2), alongside daily variations in electricity demand. The daily variations were recorded by the hotel proprietor at 10:00, 14:00, and 20:00 each day between 17 and 22 July 2021. Under the assumption of a constant daily energy profile, the two datasets were combined to simulate the expected hourly variation in electricity demand across a given year (Figure 7a). The total annual electricity demand equates to 385 MWh. The hotel proprietor underlined that almost 50% of total electricity demand was attributable to cooling during the summer months when the guestroom air conditioning is in permanent use to meet holidaymakers’ demands and expectations. Moreover, the hotel regularly utilises a wide range of electrical appliances, including kitchen equipment and guest television sets. Under the assumption that the hotel’s energy demand can be reduced by implementing energy-saving strategies [8], the carbon emissions from an energy system operating at 80% of the current electricity demand were assessed (Figure 7b). This reduction in demand was only applied during the months of April to October when cooling is required, and guests are more likely to be present. This analysis investigated the benefit of implementing energy-saving strategies within the hotel management in terms of carbon emissions.

3.7. Model Variations

In summary, KBH operations were optimised in terms of both costs and carbon emissions. The aforementioned variables—PV technologies, rooftop PV tilt angles, and reduced energy demand—were assessed with a view to obtaining an optimal solution. In order to compare multiple variables, a set of model variations was required (Table 6) with multiple runs per variation. The steps taken were as follows:
  • By consideration of the chosen number of PV panels in the available area and the power capacity of the respective panels, each technology was assigned a total capacity value for each individual building. Using these capacities alongside solar irradiation data, system generation results were simulated for each panel type using the RESkit programme. This allowed a comparison of the generation capacity of different PV panel types over a typical year. Figure 8 shows clearly that the 8° configuration should be preferred over the 25° tilt angle. Therefore, in what follows, the focus is on configurations with an 8° rooftop tilt angle;
  • FINE was used to simulate results under the assumption that the entire electricity supply was sourced from the utility provider in order to predict carbon emissions associated with the current hotel energy system. This provided baseline results to which all other model runs could be compared;
  • The model was designed to ensure that only one type of rooftop PV technology could be selected per building (if at all). However, it was possible to select both BIPV and rooftop PV technologies for the same building.
  • Because of its design, unless a constraint is applied, the FINE model selects electricity source components predicting the lowest possible TAC. In order to reduce carbon emissions associated with the hotel’s energy system (and thus electricity obtained from the utility provider), a carbon emissions constraint was applied to the model. This constraint represented the annual carbon emissions (kg CO2 /annum) that the simulated energy system must not exceed and limited the carbon emitted from the hotel over a single year (Equation (1));
Carbon   constraint   = ( 1   %   carbon   reduction 100 ) ×   total   CO 2   ( utility )  
Figure 8. System generation (kW) average across all buildings for each PV panel type across a given year for the rooftop tilt angle of 8° (left) and 25° (right). The numbers given in the red and green boxes are the total yearly energy production for crystalline (Jinko) and heterojunction (REC) cells, respectively.
Energies 15 03801 g008
5.
In addition to the costs of the PV systems themselves, various other costs must be taken into account. For other hardware costs, such as mounting frames, cabling, etc., 50% of the PV module costs were assumed [53]. For installation and management costs, half of all hardware costs were multiplied by a factor of 0.75, which takes into account the lower wages in Greece compared to the European average [53]. In addition, annual operating costs were assumed to be a fixed cost of EUR 10 per kWp installed plus 1.5% of total installation costs, which includes insurance fees, service costs, and reserves for repairs [54];
6.
We assume that one inverter is installed in each building. The inverters from SMA’s Sunny Tripower series [55] have been given as options for the FINE model so that an inverter with the appropriate power can be installed. The costs per power, as well as the specific costs per capacity, are shown in Figure 9;
7.
In addition, economic parameters had to be assumed. The interest rate was set at 5%, and the depreciation period is assumed to be 20 years for all PV systems and five years for all inverters;
8.
Several runs were conducted for each model variation to record a Pareto front. Minimum TAC was identified by running the model with no constraints. The lowest possible carbon constraint can be found by changing the model’s objective function to the net carbon emissions. To calculate the carbon reduction, the carbon emissions without any PV modules installed could be evaluated by multiplying the sum of the electricity demand over the year with the amount of carbon produced when consuming 1 kWh of electricity acquired from the utility provider;
9.
To obtain a relationship between TAC and carbon reduction, results were recorded at a number of carbon constraints. This was carried out in four steps between the carbon constraint at minimum TAC and the maximum reduction in carbon emissions;
10.
To compare carbon emissions from the optimised energy system to those from the current hotel energy system, hourly electricity distribution for 24 h in mid-January and mid-July were extracted from the results simulated from the optimised model run and the utility-only model, respectively. A line graph was generated for the purpose of comparison;
11.
The same PV technologies selected within the optimised system were rerun under a reduced energy demand, and the change in carbon emissions and TAC were recorded to simulate the reduction in carbon emissions as a result of reduced energy utilisation.

3.8. Model Validation

The values on PV generation and solar irradiation simulated from RESkit were validated using the European Commission’s Photovoltaic Geographical Information System (PVGIS) [56]. PVGIS simulates the performance of a grid-connected PV system with specified coordinates and power capacity. Results obtained from RESkit were compared to those simulated from the PVGIS programme to ensure similarities. Energy demand data were validated by ensuring that the total energy demand displayed by the energy system model equated to the total annual energy demand calculated from the monthly energy bills issued by the hotel’s utility provider, Volterra [26]. Similarly, the TAC predicted by the model for a ‘utility only’ scenario matched the total hotel energy charges for the period from January to December 2019. As a validation of the cost modelling used in this study, the results were compared with bids from local Greek companies: PV generation potential for crystalline Jinko rooftop panels at 10-degree tilt for building 5 (with 12.19 kWp installed capacity) simulated during the present study using RESkit resulted in 17.67 MWh/annum, which is 14% less than stated in the reference offer. The estimated costs in our FINE model were 11% less. These values show that the costs obtained from the FINE model are realistic.

3.9. Model Assumptions

The following assumptions were made for the modelling of the energy system of the KBH:
  • Any electricity acquired from the utility provider was assumed to produce 0.42 kg CO2/kWh [57]. Different prices for electricity were assumed: 0.08 EUR/kWh, 0.15 EUR/kWh, 0.23 EUR/kWh (which is the actual realistic price for electricity in Rhodes in 2021) and 0.30 EUR/kWh (which is the actual price for electricity in Rhodes in March 2022), respectively;
  • The energy system was optimised using a net metering scheme. In this scheme, the energy generated by a PV system can either be consumed by local consumers or fed into the grid [58]. No storage was included in the energy system model. Using net metering, there is no direct revenue and CO2 saving from electricity to surplus; however, the surplus has a positive effect on the total balance. The final cost shown in the electricity bill depends on the net balance of the energy fed into the grid and taken from the grid. If the difference is positive, i.e., more electricity was generated and fed into the grid than was consumed, this surplus is credited to the next electricity bill. However, surpluses after the end of the year are not paid out by the electricity trader to the self-generating electricity consumer and are cancelled. If the difference is negative, i.e., more electricity was consumed than generated, the consumer is obliged to pay the difference. In the case of the current (virtual) PV net metering scheme implemented in Rhodes, the assessment period follows a three-year cycle, while there is a liquidation procedure if the PV system operator switches to another electricity trader [16];
  • Total cabling costs (the cost of the actual and the installation charges) were estimated at EUR 16 per metre [59];
  • As the majority of the hotel’s heat demand is met by solar thermal panels, the electricity required for supplementary heat pumps was assumed to be negligible. The hotel’s annual heat demand was assumed to have been entirely met by solar thermal panels and was accordingly not included in the optimisation model, which means that the optimization was performed for electricity only;
  • The interpanel row spacing was assumed to be 25 cm for a tilt of 8 degrees (see the green bar in Figure 6 (left);
  • BIPV technologies were set at a tilt angle of 90 degrees;
  • Meteorological trends and hotel energy demand were assumed to remain constant year to year.

4. Results

4.1. PV Technology Selection and Optimised PV Net Metering System for the KBH

Rooftop heterojunction technologies offered the highest generation potential of all the proposed PV technologies, as shown in Figure 8, with a peak system generation of 85 kW. This slightly exceeds the peak generation of 74.3 kW associated with standard crystalline panels. BIPV balcony and BIPV façade panels had lower system generation peaks of 12.1 kW and 2.4 kW, respectively.
There was a distinct variation in the annual generation trends observed between the 25-degree and 8-degree tilted rooftop panels (see Figure 8). Overall, in the case of both standard crystalline and heterojunction, the 25-degree tilted panels presented smaller annual variations in system generation than those titled at 8 degrees (Figure 8). However, because of shading losses, significantly less electricity can be generated with the 25-degree system than with the 8-degree system. What is more, the 8° tilt increases the PV energy production in summer, which corresponds to the electricity demand of the hotel, making the 25-degree configuration economically unattractive; thus, it is not studied further.
The highest possible carbon reduction using the proposed PV technologies was 35.5%, corresponding to a carbon emissions reduction of 57.5 t CO2/annum. For an electricity price of 0.23 EUR/kWh, this resulted in a TAC of EUR 75,614 (Table 7). To achieve this carbon emissions reduction, the model had to select the maximum capacity of all the available PV technologies. BIPV panels were installed at 100% capacity on the upper-floor balconies and facades, where possible. The lowest TAC predicted by the model was EUR 72,908, with a carbon reduction of 31.1% (i.e., a reduction of 50.3 t CO2/annum, Table 7). In this scenario, the model selected standard crystalline and BIPV balcony PV technologies at 100% of total capacity. For an electricity price of 0.23 EUR /kWh, all the model runs containing any PV generation were less expensive than the run provided by the utility system only.
It was observed that an increase in the carbon reduction percentage from 31.1% (at optimal cost) to 35.5% corresponded to an increase of about EUR 2700 in TAC or 0.007 EUR /kWh in levelized cost of energy (Figure 10). This reflects a further carbon reduction of 6.9 t CO2/annum. However, as the specific cost of this additional reduction stands at 386 EUR /ton CO2, it seems justified to recommend the configuration with standard crystalline PV, i.e., the configuration with the lowest TAC.
Figure 11 shows the dependency of TAC on the effective price of electricity. At low electricity costs, PV is unprofitable; the TAC at 0% annual carbon reduction, i.e., no PV installed, is less than with PV. At 0.15 EUR/kWh, the total annual costs for electricity without PV were 57,720 EUR/year, so the PV starts to pay off. At 0.3 EUR/kWh, the total annual cost of electricity without PV would be 115,441 EUR/year, so that savings in the order of EUR 24,000 per year are possible. In fact, at this high electricity price, the installation of heterojunction PV technology in building 5, which has low shading losses and relatively high installed capacity, is identified to be part of the most cost-effective scenario. It is evident that further increasing the cost of electricity makes the installation of highly efficient PV even more attractive.
In summary, for an electricity price of 0.23 EUR/kWh, the optimized system for the KBH yields a carbon emission reduction of 31.1% and a total annual cost reduction of 18% in comparison with an energy system obtaining all electricity from the utility provider. The optimised energy system was 23.5% self-sufficient (Figure 12).
Figure 13 shows the evolution of electricity demand and generated power over time for KBH for a representative day in winter (left) and a representative day in summer (right). In winter, the electricity demand of the hotel is very low, so the excess PV energy can be provided to the grid.
Comparing the optimized energy system with the current hotel system in the high season (Figure 13, right), it is obvious that the assumed electricity demand of KBH is higher than what can be provided by PV. Still, a carbon reduction of 203 kg per day was recorded for the entire hotel. This corresponds to the reduction of 3.5 kg of CO2 emissions per room per day. Between 04:00 and 18:00, the optimised energy system reduces carbon emissions in comparison with the current energy system on a typical July day. From 18:00 to 04:00, there is no production of PV energy and, therefore, no reduction in CO2 emissions. The share of self-consumed PV energy is 75% (Table 7). It should be noted that with increasing installed capacity using heterojunction technology, this share decreases slightly to 74% (Table 7) as the excess energy not consumed in the off-season increases.

4.2. Effect of Energy-Saving Strategies

As outlined above, during later hours of the day, PV cannot help reduce the CO2 emissions of the KBH. Therefore, the question was addressed if a general reduction of 20% energy consumption of the KBH would lead to a different layout of the optimized system. The simulation showed that the same technology configuration as above should be applied. Therefore, a 20% reduction in the energy demand would linearly decrease the CO2 footprint and the energy bill of the hotel by 20%. It was demonstrated that by reducing the current energy demand by 20%, the hotel could reduce its carbon emissions by a further 32.3 t CO2/annum. This represented a carbon emission reduction of 20.9% compared with the same energy system operating at full load. Moreover, TAC was expected to fall 20.9%, corresponding to a saving of EUR 17,710 per annum. This demonstrates clearly the high impact of energy-saving measures.

5. Discussion

5.1. Optimal RES for KBH

As the KBH offered significant solar potential, a PV energy system was selected for optimisation. This included a comparison of a number of PV technologies and different roof tilt angles. Given that available RES will vary according to location, the type of energy system used for optimisation must be selected on a case-by-case basis [17,25].

5.1.1. Rooftop Panels

When comparing the two rooftop panel options and assuming an electricity price of 0.23 EUR/kWh, the model selected standard crystalline PV panels on each building rather than heterojunction PV panels. This was to be expected as the results showed that the generation of heterojunction systems did not significantly exceed the generation of standard crystalline PV panels (Figure 8). In this case study, the investment related to the connection of AC cables to each building was assumed to be the same for each rooftop panel type. The model was accordingly forced to select the rooftop technology with the lowest investment per panel capacity unit—in this case, standard crystalline PV.
However, at higher electricity prices, i.e., 0.3 EUR/kWh, the installation of heterojunction PV technology is part of the most cost-effective scenario. It is obvious that further rising electricity costs make the installation of high-efficiency PV systems more profitable.

5.1.2. Rooftop Tilt Angles

The generation profile of the 8-degree tilt panel was more closely correlated to the hotel energy demand profile than for the 25-degree tilt (Figure 7 and Figure 8). It was advantageous that the PV panel produced more energy during summer when large quantities of electricity were required. Results comparing tilt angles highlighted the importance of designing a PV system to maximise energy production as a function of specific energy demand. A closer correlation between PV generation and energy demand will reduce the proportion of energy required from fossil fuel sources and hence reduce carbon emissions.

5.1.3. Building-Integrated Photovoltaics (BIPV)

Although BIPV balcony panels had a much smaller generation capacity in comparison with rooftop panels (Figure 8), this panel type was still selected by the model at 100% of its total capacity, even in a low-cost scenario. This implies that the installation of this technology results in carbon reductions at an effective cost. This conclusion is substantiated by [45], who concluded that BIPV provides huge advantages in regions of high solar irradiance, such as Rhodes. Moreover, placing BIPV on balcony panels not normally equipped with PV cells significantly improved the hotel’s PV electricity production potential [44]. Although this technology is, due to the small area where it can be applied, less effective in the case of the KBH, it could be assumed that the installation of BIPV façade panels over a larger surface area will increase the investment per unit capacity for this technology. It may therefore be a more advantageous option for hotels in a different location.

5.2. PV Net Metering System Benefits

5.2.1. Carbon Emissions

Extreme meteorological events, such as the Greek heatwave in the summer of 2021 [12], are frequent reminders that climate change is an ongoing prominent and daunting issue. Like many NIIs hotels, the KBH currently draws 100% of its electricity from the local utility provider. As explained above, 85.7% of this energy is obtained from fossil fuels (heavy fuel oil) imported from mainland Greece at a high cost on account of inadequate electric grid interconnections. This situation was reflected by high annual carbon emissions and high TAC associated with the utility-only simulation (Table 7). Analysis of an optimised energy system for the KBH has demonstrated potential for carbon reductions associated with the hotel energy sector.
Compared with the current KBH carbon emissions (161.6 t CO2/annum), a carbon saving of almost 50.3 t CO2/annum is proposed by the optimised PV net metering energy system. To put this figure into perspective, 50.3 t CO2/annum would offset the carbon emissions generated by 46 return economy class flights from Aberdeen to Rhodes [60]. Extrapolating the outcomes recorded on the Greek island of Crete [7] to the Rhodian context, it can be assumed that the proportions of carbon emissions caused by every tourist trip to Rhodes amount to 81% for transport, 13% for accommodation and 6% for other activities. This implies that the potential carbon reduction of 31% obtained by the introduction of a PV net metering system correlates to a carbon reduction of 4% per tourist trip to the KBH. If deployed on a large scale, the 31% carbon reduction in an individual hotel could be maximised, providing the opportunity to significantly reduce the carbon emissions associated with the tourism accommodation sector. This reduction is in accordance with the IPCC recommendation for reducing carbon emissions by 2030 to keep global warming below 1.5 K [61]. Moreover, assuming that the National Energy and Climate Plan’s objectives come to fruition [15] and the NIIs are interconnected to the mainland, it is to be expected that grid-sourced energy will become cleaner in the course of the coming decade. In this event, there will be a reduction in the carbon emissions associated with electricity from the utility provider within a PV net metering system. This further corroborates the strategy of installing net metering PV systems in NII hotels.

5.2.2. Off-Loading the Grid

Rhodes is currently recording soaring day- and night-time temperatures of 35 °C and 28 °C, respectively [4], and the island’s power plants are already overstretched by the peak tourist season and increased cooling demand during these high temperatures. As a result of the unreliability of the energy supply from power plants [10], heat-related blackouts are a frequent phenomenon at the KBH. This negatively impacts guest satisfaction and is a potential cause of unnecessary stress for the hotel owners. Against this background, the implementation of a PV system or alternative RES in tourist hotels could not only offer the benefits of reduced carbon emissions but also relieve and stabilize the island’s energy grid and provide Rhodian hotels with safer and more reliable energy supplies.

5.2.3. Cost

Given that hotel operators tend to be reticent about RES investment [8], it was positive to note that at the current price of electricity, all the energy system variations equipped with PV installations were less expensive than the hotel’s current system. A simple solution would therefore be to install all PV technologies at maximum capacity. However, like many businesses, hotels opt for the most cost-effective solution whenever possible. The cost of carbon in Europe currently stands at a price of EUR 47 per tonne of CO2 [62]. This cost is expected to grow significantly over the coming decade, with a price of EUR 90 per tonne of CO2 expected by 2030 [63]. Although an 8-degree-tilt system with a 31.1% carbon reduction generated the lowest TAC, an increased carbon reduction level of a further 4.4% correlated to a TAC increase of EUR 2706. As stated above, this corresponds to a price of EUR 386 per additional tonne of carbon saved. In comparison with the current cost of carbon in Europe, this seems to be a high price to pay for a further reduction in carbon emissions. In view of current expectations on trends in European carbon market pricing, it may be more cost-effective for the hotel to offset its carbon emissions by other means. This is an important consideration for hotels for which financial gain is the main priority.

5.3. Energy-Saving Strategies

Carbon emissions are closely correlated to energy utilisation, in particular on NIIs [7]. This was demonstrated by results showing that a 20% reduction in energy demand at the KBH was correlated to a further carbon reduction of 20.9% (32.3 t CO2/annum) of the already optimised energy system. Given the wide range of services offered by the KBH and its permanent use of air-conditioning, a number of potential opportunities to reduce hotel energy use can be envisaged. However, it is important to note that the success rate of energy-saving strategies is notoriously low [8]. Unfortunately, consumers tend to be uncircumspect in their use of energy, being invariably unaware of the correlation between the energy they consume and the cost it generates. This is a major factor influencing uncontrolled energy use [64]. Without a clear incentive, guests are less likely to comply with energy-saving recommendations. This implies that energy-saving strategies over which the hotel proprietor has the most control will be more likely to succeed and reduce carbon emissions. The strategies which could be envisaged in this context include energy use charges per room, timers on appliances such as lights and pool heating systems and more widespread use of high-efficiency appliances [8].

5.4. Limitations and Future Works

Whilst significant reductions were expected from the optimised energy system at KBH, the carbon reduction potential was limited by the fact that the energy system was modelled as a net metering system. This ruled out the possibility of the hotel achieving a zero-carbon energy system. Even at maximum potential, the PV system could not meet the energy demand of the hotel throughout the entire year. Further studies investigating the use of local battery storage at KBH would be of interest in terms of positive effects on stabilizing the power grid. Local battery storage could be beneficial in case of a grid blackout. However, there is no incentive in the framework of net metering for such solutions. It should also be checked if there are plans to change the PV support mechanism.
The energy demand used during this study was a collation of both monthly energy consumption and daily fluctuations in energy demand recorded at three daily time points over a period of five days. This data set provided an approximate estimate of the electricity consumption of the hotel over 8760 time steps. Although adequate for the purpose of this study, the energy demand time series could have been further refined by recording hourly electricity consumption readings over a period of a week, a month, or a whole year. This would have increased the accuracy of the model. However, it was not feasible to gather data to this degree of granularity during the timeframe of this project and in the absence of the appropriate technologies.
One risk is that the price development for PV systems is difficult to predict and thus to plan. The COVID-19-related global health crisis and the war in Ukraine have consequences on the stability of supply chains. In Europe, it is currently, above all, the shortage of available truck drivers that is hindering the timely flow of goods and causing transport prices to skyrocket. The growing deployment of PV requires more raw materials, more national and international production, and transport capacities, as well as more skilled workers in the areas of planning, installation, and service. The shortage is also causing prices to rise for components, but also for assembly. One solution could be the re-establishment of PV production in Europe, which would also increase local added value and, at the same time, mean shorter transport distance and thus further CO2 savings.
Another source of uncertainty is the regulatory framework, which in the current net metering scheme sets very high incentives for the installation of PV systems. These incentives could become less strong in the future, e.g., through only a partial remuneration of the electricity fed into the grid. However, since the further expansion of PV is to be promoted in Greece as in the EU, this risk is to be considered low.
Last but not least, the years of the COVID19 pandemic have shown that the number of tourists, and thus the occupancy rate of the hotels, could be lower than planned due to external influences. These are general uncertainties that have an impact on the investment climate. In further studies, it can be analysed to what extent the investment in solar systems is worthwhile even if the hotels are only partially occupied.
An increase in the electricity price is taken into account in the study to the extent that a variation of the price from EUR0.08/kWh to EUR0.30/kWh, which is the exact price of electricity in March 2022 for commercial end users in Rhodes, was examined within the framework of a parameter study. A possibly much higher electricity price is probably only temporary, or if the higher energy costs persist, the price level for PV will also increase analogously, so the general results of this study remain valid.
Many companies and individuals utilise carbon offsetting schemes to compensate for their own emissions [65]. This study demonstrated the potential for one hotel to reduce its carbon emissions by 50 t CO2/annum at an optimal price. It would be of interest to investigate the feasibility of a scheme offering the opportunity of deploying carbon offsetting funds to support the construction of RES in buildings with significant carbon reduction potential. An approach of this kind could eliminate the economic stress factors associated with RES investments and maximise carbon reductions within the accommodation sector.

6. Conclusions

By optimising the energy system of the KBH, it was demonstrated that highly efficient rooftop PV panels installed at a tilt angle favouring summer generation combined with BIPV balcony panels would increase the PV generation required to mirror a tourist hotel energy demand profile. As hypothesised, the introduction of a PV net metering system led to a reduction in both carbon emissions and the costs incurred by the hotel’s energy system. The simulation showed that if electricity prices were higher than in 2021, installation of heterojunction PV technology could be part of the most cost-effective scenario, and that if electricity prices continued to rise, installation of high-efficiency PV would be even more attractive.
By using the optimisation approach for other NII hotel energy systems, carbon emissions related to the tourist accommodation sector on NIIs could be lowered. Moreover, the installation of RES within multiple hotel energy systems could ease the strain on overstretched NII fossil fuel power plants during the high tourist season and peak temperatures.
As a general finding, it can be stated that the installation of PV systems for local self-consumption of green electricity is a key measure to reduce greenhouse gas emissions associated with fossil electricity generation, especially on NIIs. The green electricity produced could also serve heating and cooling demand by applying heat pumps and electric air conditioning systems. Furthermore, local, renewable, smart grids could be established and create synergies by connecting hotel energy systems with other electricity prosumers on a local level. This could further increase the level of self-consumption of green electricity on a local level, thus positively affecting total greenhouse gas emissions on NIIs.

Supplementary Materials

The FINE and RESkit models alongside the datasets used during this study are available at the link below: https://doi.org/10.5281/zenodo.5795964/ (accessed on 21 December 2021).

Author Contributions

Conceptualization, M.S., Z.M., F.C.K. & P.L.; methodology, K.K., P.S., C.M., M.S. & Z.M.; software, K.K., P.S. & C.M.; validation, M.S. & C.M.; formal analysis, Z.M., C.M. & M.S.; investigation, M.S., F.C.K. & P.L.; resources, F.C.K.; data curation, M.S. & C.M.; writing—original draft preparation, M.S. & Z.M.; writing—review and editing, M.S., K.K., F.C.K., P.S.; visualization, C.M. & Z.M.; supervision, M.S., F.C.K. & P.S.; project administration, F.C.K.;. All authors have read and agreed to the published version of the manuscript.

Funding

This research received no external funding.

Institutional Review Board Statement

Not applicable.

Informed Consent Statement

Not applicable.

Data Availability Statement

Data supporting the reported results can be found in the supplementary materials, which include archived datasets analyzed and generated during the study.

Acknowledgments

The authors would like to thank Mikhalis Markopoulos and Manolis Markopoulos for their assistance in gathering comprehensive information about the special demands of hotels, the hotel’s energy consumption and energy bills.

Conflicts of Interest

The authors declare no conflict of interest.

Abbreviations

KBHKolymbia Bay Hotel
NIINon-Interconnected Island
RESRenewable Energy Sources
PVPhotovoltaic
TACTotal Annual Cost
BIPVBuilding-Integrated Photovoltaic

References

  1. UNWTO. Annual Report 2017; UNWTO World Tourism Organisation: Madrid, Spain, 2017; pp. 10–20. [Google Scholar]
  2. Sourianos, E.; Kyriakou, K.; Vagiona, D. Tourism development and carrying capacity in the Rhodes Island, Greece. In Proceedings of the Third International Conference on Environmental Management, Engineering, Planning and Economics (CEMEPE 2011) & SECOTOX Conference, Skiathos Island, Greece, 19–24 June 2011. [Google Scholar]
  3. UNESCO. Medieval City of Rhodes. 2021. Available online: https://whc.unesco.org/en/list/493/ (accessed on 24 July 2021).
  4. WorldWeatherOnline.com. Rhodes Historical Weather. 2021. Available online: https://www.worldweatheronline.com/rhodes-weather-history/south-aegean/gr.aspx (accessed on 24 July 2021).
  5. Işik, C.; Kasımatı, E.; Ongan, S. Analyzing the causalities between economic growth, financial development, international trade, tourism expenditure and/on the CO2 emissions in Greece. Energy Sources Part BEcon. Plan. Policy 2017, 12, 665–673. [Google Scholar] [CrossRef]
  6. HEDNO. RES Energy Generation at NIIs|HEDNO. 2021. Available online: https://www.deddie.gr/en/themata-tou-diaxeiristi-mi-diasundedemenwn-nisiwn/agora-mdn/stoixeia-ekkathariseon-kai-minaion-deltion-mdn/statistika-stoixeia-ilektrikwn-sustimatwn-sta-mdn/paragogi-energeias-ape-mdn/ (accessed on 5 August 2021).
  7. Vourdoubas, J. Estimation of Carbon Emissions due to Tourism in the Island of Crete, Greece. J. Tour. Hosp. Manag. 2019, 7, 24–32. [Google Scholar] [CrossRef] [Green Version]
  8. Parpairi, K. Sustainability and Energy Use in Small Scale Greek Hotels: Energy Saving Strategies and Environmental Policies. Procedia Environ. Sci. 2017, 38, 169–177. [Google Scholar] [CrossRef]
  9. Kaldellis, J.; Simotas, M.; Zafirakis, D.; Kondili, E. Optimum autonomous photovoltaic solution for the Greek islands on the basis of energy pay-back analysis. J. Clean. Prod. 2009, 17, 1311–1323. [Google Scholar] [CrossRef]
  10. Katsoulakos, N. An Overview of the Greek Islands’ Autonomous Electrical Systems: Proposals for a Sustainable Energy Future. Smart Grid Renew. Energy 2019, 10, 55–82. [Google Scholar] [CrossRef] [Green Version]
  11. Dimeas, D.; Chatziargyriou, P.; Margaris, D.; Renewable Energy Developments in Greek Islands. Friedrich Ebert Stiftung. 2016. Available online: https://library.fes.de/pdf-files/bueros/athen/13050.pdf (accessed on 5 August 2021).
  12. DW.COM. 2021. Greece Faces Worst Heat Wave in over Three Decades DW 02.08.2021. Available online: https://www.dw.com/en/greece-faces-worst-heat-wave-in-over-three-decades/a-58736438 (accessed on 6 August 2021).
  13. Euronews. Thousands flee as Wildfires Reach Residential Areas North of Athens. 2021. Available online: https://www.euronews.com/2021/08/02/greece-is-being-hit-by-worst-heatwave-in-30-years-says-pm (accessed on 6 August 2021).
  14. Matzarakis, A.; Mayer, H. The extreme heat wave in Athens in July 1987 from the point of view of human biometeorology. Atmos. Environ. Part B Urban Atmos. 1991, 25, 203–211. [Google Scholar] [CrossRef]
  15. Hellenic Republic Ministry of the Environment and Energy. National Energy and Climate Plan. pp. 1–7. 2019. Available online: https://ec.europa.eu/energy/sites/ener/files/el_final_necp_main_en.pdf (accessed on 5 August 2021).
  16. Maroulis, G. Feed-In Tariff II (Rooftop PV). 2019. Available online: http://www.res-legal.eu/search-by-country/greece/single/s/res-e/t/promotion/aid/net-metering-law-no34682006-amended-by-law-no42032013/lastp/139 (accessed on 12 April 2022).
  17. Kougias, I.; Szabó, S.; Nikitas, A.; Theodossiou, N. Sustainable energy modelling of non-interconnected Mediterranean islands. Renew. Energy 2019, 133, 930–940. [Google Scholar] [CrossRef]
  18. Hellenic Republic—Ministry of Foreign Affairs. Transforming Astypalea Into the First Smart, Green Island in the Mediterranean with Energy Autonomy—Meetings—Events. 2020. Available online: https://www.mfa.gr/en/current-affairs/news-announcements/transforming-astypalea-into-the-first-smart-green-island-in-the-mediterranean-with-energy-autonomy.html (accessed on 5 August 2021).
  19. Dafninetwork.gr. The Energy Storage in Kythnos Has Started! DAFNI Network of Sustainable Greek Islands. 2019. Available online: https://dafninetwork.gr/en/the-energy-storage-in-kythnos-has-started/ (accessed on 5 August 2021).
  20. Kaldellis, J. Supporting the Clean Electrification for Remote Islands: The Case of the Greek Tilos Island. Energies 2021, 14, 1336. [Google Scholar] [CrossRef]
  21. European Union. Clean Energy Transition Agenda Sifnos Island. Clean Energy for EU Islands. 2019. Available online: https://euislands.eu/sites/default/files/2019-11/SIFNOS_FinalTransitionAgenda_20191118.pdf (accessed on 5 August 2021).
  22. Cheung, M.; Fan, J. Carbon reduction in a high-density city: A case study of Langham Place Hotel Mongkok Hong Kong. Renew. Energy 2013, 50, 433–440. [Google Scholar] [CrossRef]
  23. Navratil, J.; Picha, K.; Buchecker, M.; Martinat, S.; Svec, R.; Brezinova, M.; Knotek, J. Visitors’ preferences of renewable energy options in “green” hotels. Renew. Energy 2019, 138, 1065–1077. [Google Scholar] [CrossRef]
  24. Global Solar Atlas. 2021. Available online: https://globalsolaratlas.info/map?c=36.272511,28.156929,11&s=36.314019,28.198471&m=site&pv=medium,180,30,100 (accessed on 5 August 2021).
  25. Theodosiou, G.; Stylos, N.; Koroneos, C. Integration of the environmental management aspect in the optimization of the design and planning of energy systems. J. Clean. Prod. 2015, 106, 576–593. [Google Scholar] [CrossRef]
  26. Private Provider of Electricity and Gas Volterra AE. 2021. Available online: https://www.volterra.gr (accessed on 6 August 2021).
  27. FINE Developer Team (FZJ IEK-3). Welcome to FINE’s Documentation!—FINE 2.2.0 Documentation. 2020. Available online: https://vsa-fine.readthedocs.io/en/master/index.html (accessed on 5 August 2021).
  28. Forschungszentrum Jülich. Forschungszentrum Jülich—Research—Residential Sector. 2020. Available online: https://www.fz-juelich.de/iek/iek-3/EN/Research/ResidentialSector/residentialSector.html?nn=557400 (accessed on 5 August 2021).
  29. Knosala, K.; Kotzur, L.; Röben, F.; Stenzel, P.; Blum, L.; Robinius, M.; Stolten, D. Hybrid Hydrogen Home Storage for Decentralized Energy Autonomy. Int. J. Hydrog. Energy 2021, 46, 21748–21763. [Google Scholar] [CrossRef]
  30. Welder, L.; Ryberg, D.; Kotzur, L.; Grube, T.; Robinius, M.; Stolten, D. Spatio-temporal optimization of a future energy system for power-to-hydrogen applications in Germany. Energy 2018, 158, 1130–1149. [Google Scholar] [CrossRef]
  31. Kotzur, L.; Markewitz, P.; Robinius, M.; Cardoso, G.; Stenzel, P.; Heleno, M.; Stolten, D. Bottom-up energy supply optimization of a national building stock. Energy Build. 2020, 209, 109667. [Google Scholar] [CrossRef] [Green Version]
  32. Stenzel, P.; Schreiber, A.; Marx, J.; Wulf, C.; Schreieder, M.; Stephan, L. Environmental impacts of electricity generation for Graciosa Island, Azores. J. Energy Storage 2018, 15, 292–303. [Google Scholar] [CrossRef]
  33. Welcome to Python.org. 2021. Available online: https://www.python.org (accessed on 16 August 2021).
  34. Package Overview—Pvlib Python 0.8.1+0.gba7d753.dirty Documentation. 2021. Available online: https://pvlib-python.readthedocs.io/en/stable/package_overview.html (accessed on 6 August 2021).
  35. Data, P. PV Cost and Component Data—System Advisor Model (SAM). 2021. Available online: https://sam.nrel.gov/photovoltaic/pv-cost-component.html (accessed on 6 August 2021).
  36. Surface Solar Radiation Data Set—Heliosat (SARAH) -Edition 1|NCAR—Climate Data Guide. 2021. Available online: https://climatedataguide.ucar.edu/climate-data/surface-solar-radiation-data-set-heliosat-sarah-edition-1 (accessed on 17 September 2021).
  37. EU Science Hub—European Commission. Preliminary Description of the New Reanalysis-Based Data in PVGIS—EU Science Hub—European Commission. 2021. Available online: https://ec.europa.eu/jrc/en/PVGIS/docs/reanalysis (accessed on 17 September 2021).
  38. GitHub. RESKit/README.md at Master FZJ-IEK3-VSA/RESKit. 2021. Available online: https://github.com/FZJ-IEK3-VSA/RESKit/blob/master/README.md (accessed on 6 August 2021).
  39. Helioscope (Folsom Labs). Available online: https://www.helioscope.com (accessed on 1 October 2021).
  40. Sharma, D.; Mehra, R.; Raj, B. Comparative analysis of photovoltaic technologies for high efficiency solar cell design. Superlattices Microstruct. 2021, 153, 106861. [Google Scholar] [CrossRef]
  41. Kambezidis, H.; Psiloglou, B. Estimation of the Optimum Energy Received by Solar Energy Flat-Plate Convertors in Greece Using Typical Meteorological Years. Part I: South-Oriented Tilt Angles. Appl. Sci. 2021, 11, 1547. [Google Scholar] [CrossRef]
  42. Jaiganesh, K.; Bharath Simha Reddy, K.; Shobhitha, B.; Dhanush Goud, B. Enhancing the efficiency of rooftop solar photovoltaic panel with simple cleaning mechanism. Mater. Today: Proc. 2021, 51, 411–415. [Google Scholar] [CrossRef]
  43. Laseinde, O.; Ramere, M. Efficiency Improvement in polycrystalline solar panel using thermal control water spraying cooling. Procedia Comput. Sci. 2021, 180, 239–248. [Google Scholar] [CrossRef]
  44. Yu, G.; Yang, H.; Luo, D.; Cheng, X.; Ansah, M. A review on developments and researches of building integrated photovoltaic (BIPV) windows and shading blinds. Renew. Sustain. Energy Rev. 2021, 149, 111355. [Google Scholar] [CrossRef]
  45. Liu, Z.; Zhang, Y.; Yuan, X.; Liu, Y.; Xu, J.; Zhang, S.; He, B. A comprehensive study of feasibility and applicability of building integrated photovoltaic (BIPV) systems in regions with high solar irradiance. J. Clean. Prod. 2021, 307, 127240. [Google Scholar] [CrossRef]
  46. Atmaja, T. Façade and Rooftop PV Installation Strategy for Building Integrated Photo Voltaic Application. Energy Procedia 2013, 32, 105–114. [Google Scholar] [CrossRef] [Green Version]
  47. Photovoltaik4all. Available online: https://www.photovoltaik4all.de (accessed on 1 October 2021).
  48. Wilson, G.M.; Al-Jassim, M.; Metzger, W.K.; Glunz, S.W.; Verlinden, P.; Xiong, G.; Mansfield, L.M.; Stanbery, B.J.; Zhu, K.; Yan, Y. The 2020 photovoltaic technologies roadmap. J. Phys. D: Appl. Phys. 2020, 53, 49. [Google Scholar] [CrossRef]
  49. Philipps, S.; Warmuth, W. Photovoltaics Report. 2021. Available online: https://www.ise.fraunhofer.de/content/dam/ise/de/documents/publications/studies/Photovoltaics-Report.pdf (accessed on 3 December 2021).
  50. Louwen, A.; van Sark, W.G.J.H.M.; Schropp, R.E.I.; Turkenburg, W.C.; Faaij, A.P.C. Life-cycle greenhouse gas emissions and energy payback time of current and prospective silicon heterojunction solar cell designs. Prog. Photovolt. Res. Appl. 2015, 23, 1406–1428. [Google Scholar] [CrossRef] [Green Version]
  51. Bakirci, K. General models for optimum tilt angles of solar panels: Turkey case study. Renew. Sustain. Energy Rev. 2012, 16, 6149–6159. [Google Scholar] [CrossRef]
  52. Chinchilla, M.; Santos-Martín, D.; Carpintero-Rentería, M.; Lemon, S. Worldwide annual optimum tilt angle model for solar collectors and photovoltaic systems in the absence of site meteorological data. Appl. Energy 2021, 281, 116056. [Google Scholar] [CrossRef]
  53. Lugo-Laguna, D.; Arcos-Vargas, A.; Núñez, F. A European Assessment of the Solar Energy Cost: Key Factors and Optimal Technology. 2021. Available online: https://www.researchgate.net/publication/350089711_A_European_Assessment_of_the_Solar_Energy_Cost_Key_Factors_and_Optimal_Technology (accessed on 3 December 2021).
  54. Bayerische Landesanstalt für Landwirtschaft, Institut für Betriebswirtschaft und Agrarstruktur (Bavarian State Research Centre for Agriculture, Institute for Business Management and Agricultural Structure). Information PV-004 (23.08.2021). 2021. Available online: https://www.lfl.bayern.de/mam/cms07/iba/dateien/information_pv_004_anschaffungskosten_pv_20210801.pdf (accessed on 3 December 2021).
  55. SMA Sunny Tripower. Available online: https://www.europe-solarstore.com/solar-inverters/sma/sunny-tripower.html (accessed on 3 December 2021).
  56. JRC Photovoltaic Geographical Information System (PVGIS)—European Commission. 2021. Available online: https://re.jrc.ec.europa.eu/pvg_tools/en/ (accessed on 6 August 2021).
  57. U.S. Energy Information Administration. Frequently Asked Questions (FAQs)—U.S. Energy Information Administration (EIA). 2020. Available online: https://www.eia.gov/tools/faqs/faq.php?id=74&t=11 (accessed on 6 August 2021).
  58. Mavromatakis, F.; Viskadouros, G.; Haritaki, H.; Xanthos, G. Photovoltaic Systems and Net Metering in Greece. Eng. Technol. Appl. Sci. Res. 2018, 8, 3168–3171. [Google Scholar] [CrossRef]
  59. Solar PV Cables. Available online: https://www.solar-wind.co.uk/solar-pv-array-uv-resistant-cable-wire-H1Z2Z2-K (accessed on 14 August 2021).
  60. US EPA. Greenhouse Gas Equivalencies Calculator|US EPA. 2021. Available online: https://www.epa.gov/energy/greenhouse-gas-equivalencies-calculator (accessed on 14 August 2021).
  61. IPCC. An IPCC Special Report on the Impacts of Global Warming of 1.5 °C above Pre-Industrial Levels and Related Global Greenhouse Gas Emission Pathways, in the Context of Strengthening the Global Response to the Threat of Climate Change, Sustainable Development, and Efforts to Eradicate Poverty. Global warming of 1.5 °C. 2018. Available online: https://www.ipcc.ch/site/assets/uploads/sites/2/2019/06/SR15_Full_Report_High_Res.pdf (accessed on 16 August 2021).
  62. Reuters. Europe Carbon Prices Expected to Rise to 2030-Industry Survey. 2021. Available online: https://www.reuters.com/business/sustainable-business/europe-carbon-prices-expected-rise-2030-industry-survey-2021-06-14/ (accessed on 14 August 2021).
  63. Simon, F. Analyst: EU Carbon Price on Track to Reach €90 by 2030. 2021. Available online: https://www.euractiv.com/section/emissions-trading-scheme/interview/analyst-eu-carbon-price-on-track-to-reach-e90-by-2030/ (accessed on 16 August 2021).
  64. Salehi, M.; Filimonau, V.; Asadzadeh, M.; Ghaderi, E. Strategies to improve energy and carbon efficiency of luxury hotels in Iran. Sustain. Prod. Consum. 2021, 26, 1–15. [Google Scholar] [CrossRef]
  65. Günther, S.; Staake, T.; Schöb, S.; Tiefenbeck, V. The behavioral response to a corporate carbon offset program: A field experiment on adverse effects and mitigation strategies. Glob. Environ. Chang. 2020, 64, 102123. [Google Scholar] [CrossRef]
Figure 1. Electricity consumption for Rhodes recorded by the Hellenic Electricity Distribution Network Operator (HEDNO) between January 2019 and March 2021. Blue represents the proportion of the electricity demand supplied via renewable energy sources (RES) (wind and solar), and orange represents fossil fuel-based electricity supplies (diesel and heavy fuel). The proportion of energy demand met by RES per month has been outlined above each bar [6,11].
Energies 15 03801 g001
Figure 2. Total electricity consumption recorded during 2019 at the Kolymbia Bay Hotel. Data supplied by Volterra [26]. Total annual consumption equates to 385 MWh, with a TAC of EUR 88,550 for an electricity price of 0.23 EUR/kWh.
Energies 15 03801 g002
Figure 3. Monthly average of total PV power output for the location (36°14′45.6″ N 28°09′40.3″ E) based on a medium-sized commercial PV system with installed capacity of 100 kWp, which delivered about 161 MWh in 2019 [24].
Energies 15 03801 g003
Figure 4. Simplified diagram illustrating energy transfer within the modelled net metering energy system.
Energies 15 03801 g004
Figure 5. Satellite image of the KBH highlighting individual buildings 1–5 and the type of PV technology that can be potentially installed on them: (1) crystalline silicon or heterojunction rooftop panels, balcony building-integrated photovoltaics (BIPV), and façade BIPV, (2) crystalline silicon or heterojunction rooftop panels and balcony BIPV, (3) balcony BIPV only (roof occupied by solar thermal panels, (4) crystalline silicon or heterojunction rooftop panels, and (5) crystalline silicon or heterojunction rooftop panels. Only one rooftop panel type could be selected per building. The black triangle indicates the location of the hotel’s energy metre, and the red lines indicate cables required for AC energy transmission from local inverters to the energy metre.
Energies 15 03801 g005
Figure 6. Shading losses and capacity as a function of row spacing shown for the example of building 1 with the tilt angles of 8° (left) and 25° (right). Please mind that the x-axes are scaled differently.
Energies 15 03801 g006
Figure 7. Colour map illustrating the electricity demand profile of the KBH across a given year (period) and during a given day (timesteps per period): (a) current electricity demand and (b) proposed reduced electricity demand.
Energies 15 03801 g007
Figure 9. Costs over capacity, and specific costs for inverters assumed in this study.
Energies 15 03801 g009
Figure 10. Graph illustrating the relationship between TAC and carbon emission reduction associated with a PV net metering system with 8-degree tilt panels between the lowest simulated TAC system (green marker, 0.189 EUR/kWh levelized cost of energy) and the system generating the largest carbon reduction (orange marker, 0.196 EUR/kWh levelized cost of energy). The graph shows the results for an electricity price of 0.230 EUR/kWh.
Energies 15 03801 g010
Figure 11. Graphs illustrating the relationship between TAC and annual carbon emission reduction associated with different configurations of the PV system at KBH and their dependency on the price of electricity.
Energies 15 03801 g011
Figure 12. Pie chart illustrating the proportion of self-sufficiency attributed to crystalline PV panels, BIPV balcony panels, and fossil fuels (utility).
Energies 15 03801 g012
Figure 13. Line graph illustrating the comparison between power demand and generated power for the KBH for one day in winter (left) and one day in summer (right).
Energies 15 03801 g013
Table 1. NII Greek islands and their objectives to achieve carbon neutrality.
IslandMain Actions/Objectives References
AstypaleaCurrently replacing the existing vehicle fleet with e-vehicles; the introduction of a hybrid RES system has already reduced the use of fossil fuels.[10,18]
KythnosIncreased use of solar and wind energy sources; installation of village-scale microgrids and lithium-ion battery storage systems.[11,19]
IkariaIntroduction of a hybrid RES system with energy storage.[11]
TilosIntroduction of a hybrid power station (wind and solar) as well as battery energy storage.[20]
SifnosTargeting self-sufficiency by means of a 100% renewable energy supply to be achieved using wind energy, solar, and wind hybrid power plants and hydro hybrid power plants.[21]
Table 2. Possible PV technologies for each building as well as the respective areas available for PV installation on rooftop, balcony, and façade.
Building No.Potential PV Technology Available Roof Area (m2) (Usable Part with 8° Tilt)Available Balcony Area (m2)Available Façade Area (m2)Distance to Energy Metre (m)
1Rooftop Crystalline, Rooftop Heterojunction, BIPV façade, BIPV balcony174 (40%)3617100
2Rooftop Crystalline, Rooftop Heterojunction, BIPV balcony299 (53%)10070
3BIPV balcony0 (occupied by solar thermal panels)36035
4Rooftop Crystalline, Rooftop Heterojunction100 (60%)0011
5Rooftop Crystalline, Rooftop Heterojunction165 (56%)0030
Table 3. Shading losses of the rooftops depending on the PV technology and inclination applied.
Building
Number
Shading Losses (%)Objects Casting Shadows
CrystallineHeterojunction
25°25°
11.01.60.71.3-
23.44.33.64.1adjacent building 1 (3.6 m higher), ventilation and other equipment
44.55.74.45.4adjacent building 3 (3.6 m higher), tree in the east
51.22.31.01.9adjacent building 3 (3.6 m higher)
Table 4. PV technologies used in the optimisation model and their relevant parameters.
PV
Technology
Module NamePower Capacity (W) Efficiency (W/m2)Cost per m2 (EUR)Panel Area (m2)Possible Building NumbersReferences
Rooftop CrystallineJinko Solar Co. Ltd.JKM530M-7TL4-V530210842.5291, 2, 4, 5[35,47]
Rooftop HeterojunctionREC Solar AlphaREC400AA Pure Black4002161481.851, 2, 4, 5[35,47]
BIPV balcony and façadeBIPV BIPV054-T86541381000.3901, 2, 3[35], own assumptions
Table 5. Maximum installable capacity for each PV technology on each respective building, taking into account the shading losses.
Building Number Installed Capacities (kW)
CrystallineHeterojunctionBIPV-BalconyBIPV-Façade
25°25°
114.211.515.912.25.32.4
230.721.335.125.71.50.0
30.00.00.00.05.30.0
411.69.012.69.80.00.0
517.812.421.414.90.00.0
Table 6. Table outlining the model variations used during energy system optimisation.
Model VariationElectricity SourcesElectricity Sinks
1: 8-degree rooftop panelsBIPV balcony and façade, crystalline and heterojunction panels at 8-degree tilt only), utility providerCurrent hotel electricity demand, utility provider
2: Optimised system, reduced demandOptimised PV configuration, utility providerReduced hotel electricity demand, utility provider
Table 7. Table illustrating the carbon emissions and TAC associated with the use of PV technologies in the hotel’s energy system under the current energy demand. The proportion of total capacity of each PV technology to be installed at the hotel, along with the associated carbon reduction, total annual cost, and levelized cost of energy, is shown for three variations: utility only, 8-degree tilt rooftop panels, optimal cost obtained, and 8-degree tilt rooftop panels, maximum CO2 reduction obtained.
Utility Only8 Degrees, Optimal TAC8 Degrees, Max. CO2 Reduction
Total capacity used (%)Crystalline01000
Heterojunction00100
BIPV balcony0100100
BIPV façade0100100
Total annual PV generation (MWh)0122.3139.1
Proportion of PV generation self-consumed (%)-7574
CO2 emissions (tons/year)161.6111.3104.3
Reduction of CO2 emissions (%)031.135.5
Total Annual Cost (EUR)88,55072,90875,614
Levelized Cost of Energy (EUR/kWh)0.2300.1890.196
Publisher’s Note: MDPI stays neutral with regard to jurisdictional claims in published maps and institutional affiliations.

