Article

Performance Analysis of an Ammonia-Fueled Micro Gas Turbine

Department of Engineering and Applied Sciences, University of Bergamo, Viale Marconi 5, 24044 Dalmine, Italy
*
Author to whom correspondence should be addressed.
Energies 2022, 15(11), 3874; https://doi.org/10.3390/en15113874
Submission received: 5 May 2022 / Revised: 20 May 2022 / Accepted: 22 May 2022 / Published: 24 May 2022

Abstract

:
Micro gas turbines fit perfectly with the energy roadmap to 2050: on-site, small scale power generation, combined with heat recovery from exhaust gas, offers an opportunity to deploy primary energy saving and pollutant emission reduction. Moreover, their flexibility enables fuel switching from natural gas (NG) to carbon-free fuels such as hydrogen and ammonia. This study aims to explore the potential of direct combustion of ammonia in a micro gas turbine (MGT), from a thermodynamic point of view. A modeling procedure was developed to simulate the behavior of a 100 kW MGT operating at full and part-load. After validation with NG as fuel, an increasing fraction of ammonia was fed to the combustor to predict performance variations in terms of electric, thermal and total efficiency, as well as exhaust gas composition, for a load range between 40% and 100%. Additional relevant details, related to the interaction between compressor and turbine in the single-shaft arrangement, were discussed through performance maps. Full replacement of NG with ammonia was found to reduce electric efficiency by about 0.5 percentage points (pp), whatever the power output, with a consequent improvement in exhaust gas heat recovery. Thus, total efficiency is maintained at a high level, with values ranging from 74.5% to 79.1% over the investigated load range. The benefit of zero CO2 emissions can be achieved provided that compressor–turbine matching is adjusted to compensate for the reduction in fuel calorific value: at rated power, when the largest fuel input is required, flow rates of air and flue gas decrease by 4.3% and 2.8%, respectively, with an increase in Brayton cycle pressure ratio of 2%.

1. Introduction

The global demand for carbon-free power generation is pushing the boundaries of research into alternative fuels deriving from renewable sources: they can be produced from electricity when supply capacity exceeds demand. The so called “e-fuels” such as e-hydrogen, e-ammonia, e-methane, e-methanol, or e-diesel are actually opening up a new path to the future. The former can be used straightaway in a prime mover, but its widespread application as a practical fuel still faces several shortcomings in several respects [1]. Starting from the production phase, lower renewable costs are not enough to make green hydrogen cost competitive by 2030: electrolysis needs to be scaled up from MW to GW levels through continuous innovation and performance improvements [2]. For storage, challenges are mainly the weight, volume, cost, efficiency, as well as codes and standards. Due to the low volumetric energy density, hydrogen utilization suffers from high cost of back production in the case of compressed gas or liquid stream and low storage capacity in the case of solid carriers [3]. When dealing with delivery and distribution, the main issue is that a new infrastructure would be required as a function of the technology chosen for large-scale hydrogen storage [4]. Unfortunately, there is no ideal solution for all stationary and automotive applications but a set of complementary production and delivery systems that must be integrated to reduce the overall hydrogen cost [5]. Indeed, advantages of e-fuels other than hydrogen include higher energy density so that they can be transported conveniently over long distances and kept in large scale stationary storage to compensate seasonal supply fluctuations. Moreover, existing infrastructure can continue to be used [6].
Among all the options available, green hydrogen can be stored in the form of ammonia, as ammonia offers higher volumetric energy density and thus greater convenience of storage and transport, as well as excellent safety and long-term stability. In particular, liquid ammonia is of interest, especially at mild conditions: being similar to propane, much of the necessary infrastructure required for handling and transport is already in place, with well-established regulations for operations and storage [7].
On the one hand, ammonia can be cracked back into hydrogen (and nitrogen) on demand [8], thus serving as a hydrogen carrier.
On the other hand, ammonia is receiving unprecedented attention as a zero-carbon fuel for direct power generation [9]. Direct feeding to a solid oxide fuel cell has been reported to show a comparable performance to that with hydrogen even though commercial availability to the market has yet to be reached [10]. Alternatively, combustion bases technologies rely on internal combustion engines and gas turbines, being aware that thermal properties and combustion characteristics of ammonia require innovation [11].
In the former case, a dual-fuel approach is recommended with the other fuel (gasoline or diesel) acting as combustion promoter, due to ammonia’s low flame speed and high resistance to auto-ignition [12]. More specifically, in spark-ignition engines, ammonia can be blended with hydrogen, gasoline, NG, etc., while in compression-ignition engines it can be blended with diesel and dimethyl ether (DME) [13]. In the latter case, ammonia has been considered an economically viable option for micro gas turbines used for distributed power generation, as it allows for zero carbon emissions without the unaffordable cost and complexity of CO2 sequestration [14].
NH3–air power generation using a 50 kW class MGT was stably operated by Kurata et al. [15], over a wide range of power and rotational speeds, i.e., 18.4–44.4 kW and 70,000–80,000 rpm, respectively. The combustion efficiency ranged from 89% to 96% at the highest rotational speed. A regenerative cycle was adopted to take advantage of combustor inlet temperature higher than 500 °C, thus lowering unburnt NH3. Gaseous NH3 and diffusion combustor contributed to the flame stabilization [16]. Flame observations made it clear that emissions of NO and NH3 depend on combustor inlet temperature [17]. Indeed, the greatest efforts focused on experimental investigation of NOx reduction strategies, by varying the fuel mixture. For a premixed swirling NH3/H2 flame, NOx levels strongly depend on the operational equivalence ratio [18]. When comparing swirl stabilized premixed vs. diffusion NH3–air flame, the latter delivered substantially lower NO concentrations at leaner conditions [19]. In a highly humidified 70%NH3-30%H2 blend, a stable flame was obtained even under highly humidified conditions but, more important, NOx emissions decrease with the increase in the injected steam [20]. In a small-scale Siemens burner used in the SGT-750 gas turbine (GT), flame stability and emissions were characterized as a function of fuel mixtures, with the aim of finding the optimal NH3-H2-N2 fuel blend [21]: the emissions become very low when full decomposition is achieved (H2/N2-75/25). Moreover, blended-fuel combustion is aimed at improving flame propagation characteristics: extensive experimental campaigns demonstrated that low reactivity and low-flame-speed issues of pure NH3/air combustion can be tackled by mixing NH3 with H2 [22], CH4 [23], syngas [24], and DME [25]. As regards combustion strategies in gas turbines, partially premixed combustion has attracted considerable attention recently: it combines the advantages of both premixed and non-premixed combustion so that the equivalence ratio can be extended to about 0.4 while retaining reasonable flame stability and low NO emissions [26].
Research activity has also been active in the field of thermodynamic modeling of gas turbines in a wide range of sizes. An ammonia-fueled combined-cycle gas turbine, including exhaust gas recirculation, was simulated by Keller et al. [27]: GT is operated under fuel-rich conditions and the unburned hydrogen from the GT is burned in the heat-recovery steam generator. The goal is to maximize the electric efficiency of the system, while maintaining low NO concentration. With the same aim, an improved Brayton cycle fed by humidified ammonia/hydrogen was conceived theoretically by Božo and Valera-Medina [28], through a sensitivity analysis on Brayton cycle pressure ratio and compressor/turbine polytropic efficiency. The maximum cycle efficiency is up to 43.4%; hence, comparable to that of fossil-based systems. At a small scale, the effect of NH3/CH4 mixture on exergetic performance of a Turbec T100 MGT was assessed by Ayaz et al. [29]. Three values of ammonia fraction were considered, i.e., 0–10–20%, with the latter being characterized by the lowest environmental impact.
None of the cited modeling studies ([27,28,29]) accounted for part-load behavior of an ammonia-fueled MGT, which is instead particularly relevant for a prime mover in combined-heat and power (CHP) mode. More generally, the lack of tools predicting the off-design characteristics of an MGT—when integrated with on-site renewable technologies such as solar photovoltaics, wind turbines, as well as battery energy storage, to meet the power demand—was pointed out by Hampel and Braun [30]. They addressed this deficiency by developing a thermodynamic model of a commercial 200 kW MGT to predict part-load control, change in intake air conditions, or change in hot water temperature setpoints for CHP applications, under the assumption of NG/air combustion.
Therefore, there is a need to evaluate MGT performance when an alternative, carbon-free fuel such as ammonia is used, under the impulse of clean energy transition. The relevance of the subject is confirmed by the fact that Horizon2020 EU’s research and innovation program financed the project “FLEXnCONFU” in 2020. It is based on Power-to-X-to-Power solutions, in which surplus power from renewable energies is converted into NH3 prior to converting it back to power. Combustion tests with up to 100% NH3 are planned in a heavy-duty representative GT combustion system. Moreover, re-design of a micro gas turbine is expected to enable operation with 100% NH3 for small-scale applications.
This work is intended to provide considerations for the required fuel switching, at part load. Performance maps of rotating components were taken into account to improve the accuracy in off-design conditions: this is important to mimic the actual behavior of the MGT, as highlighted in [31]. The steady-state MGT model is presented in detail, including benchmarking and validation against experimental data: part-load information and assessment of ambient sensitivity are available in the case of NG as fuel. Model validity was also proven with respect to fuel flexibility by examining a single operating point with syngas feeding. The model was then exercised to predict the effects of partial and full replacement of NG with ammonia: variations in electric, thermal, and thus total efficiency were explored in response to reduction in electric load, down to 40%.

2. Assumptions and Method

In the following, a general overview of the modeling procedure is provided including design and off-design conditions. The Turbec T100 Power and Heat unit was chosen as a case study for the availability of technical information [32]. MGT thermodynamic performance was calculated with the help of Thermoflex® (Version 29, Thermoflow Inc., Jacksonville, FL, USA). The model incorporates steady-state heat and mass balances: they were solved for each component resulting in an algebraic system of equations with input and output parameters such as pressure, temperature, enthalpy, and mass flow rate. Their convergence tolerance was within 5 × 10⁻⁵, whereas power convergence was within 0.1%, for 4 consecutive loops having up to 60 iterations in each loop.

2.1. Design Modeling

A schematic diagram of the MGT system is shown in Figure 1. The core of the Turbec T100 consists of the components necessary for the regenerative Brayton cycle. The compressor and turbine are mounted on the same shaft as the high-speed generator to produce electricity. An exhaust gas recuperator is included to reduce the fuel consumption. The reference fuel is NG, with a lower heating value (LHV) of 49.56 MJ/kg, fed into a lean-premixed combustor. The power module is combined with a heat exchanger for CHP applications. At the design point, 100 kW of electric power (Pel) are produced with an efficiency of ηel = 30% at ISO conditions, with the nominal rotational speed being set at 70,000 rpm.
Both compressor and turbine are single-stage, radial turbomachineries with a nominal pressure ratio of βc and βexp, respectively, equal to about 4.5 bar. Compressed air enters the recuperator to receive the heat energy from the hot exhaust gas flow (mexh = 0.8 kg/s). The hot, compressed air mixes with NG to reach a turbine inlet temperature (TIT) of approximately 950 °C. Flue gas leaving the turbine at 650 °C is passed through the recuperator where its temperature drops to 270 °C. In CHP mode, further cooling of the exhaust takes place in the recovery heat exchanger (RHE) to produce hot water: a nominal water flow of 2 l/s is heated up, from the return temperature of 50 °C to the supply temperature of 70 °C. Thermal power (Pth) in CHP mode equals 165 kW.
Starting from the information made available by the manufacturer, inputs for setting the design model were established. A key role was played by performance maps of compressor and turbine, taken from published literature [33] and included in Figure A1 in order to allow easier consultation. Given Pel, ηel, and mexh, simple math operations were required to obtain the fuel flow rate (mfuel) and the airflow (ma). The latter was essential to characterize the compressor behavior through corrected flow (CF), together with corrected speed (CS). The design point was then identified on the compressor performance map, given βc. Polytropic efficiency (ηy,c) was deduced from the map whereas isentropic efficiency (ηis,c) was computed through:
η is , c = β c γ a 1 γ a 1 β c γ a 1 γ a η y , c 1
Turning to the turbine, lack of clear indications on its inlet pressure (pin,t) made it necessary to iteratively reduce βexp, from the initial estimate of 4.5, until convergence is reached between pin,t, turbine outlet pressure (pout,t), and pressure drop across combustor, recuperator, and RHE. The resulting values of normalized pressure loss (Δp/p) are defined as:
Δ p p = p in p out 1
where pin and pout are pressure values before and after the loss, listed in Table 1. The turbine design operating point was then found on the turbine performance map, at the intersection of βexp, CS, and corrected flow—defined as inlet flow function (FF)—given mexh, TIT, and pin,t. Finally, polytropic efficiency (ηy,t) was estimated from the map, hence obtaining isentropic efficiency (ηis,t) as follows:
η is , t = 1 ( 1 β exp ) γ exh 1 γ exh η y , t 1 ( 1 β exp ) γ exh 1 γ exh
Table 2 summarizes design point features for both the compressor and turbine.
As regards the recuperator, the heat transfer from the hot side can be easily obtained from the available information on exhaust flow. Its effectiveness, equal to 89%, is consistent with NG consumption. Complete combustion was assumed: production of carbon monoxide and NOx emissions is disregarded in the analysis. However, the exhaust oxygen level of 17.8% (mol%) is in line with MGT technology, which uses a large amount of excess air [34]. Finally, 9% loss was considered when converting mechanical shaft power into net electric power. The heat recovery section was easily modeled since complete information was provided by the manufacturer, on both cold and hot sides: a normalized heat loss of 1% was set for the RHE to match inlet and outlet temperature on the exhaust side.
MGT performance was evaluated in terms of electric efficiency (ηel), thermal efficiency (ηth), and total efficiency (ηtot):
η el = P el P fuel   η th = P th P fuel   η tot = P el + P th P fuel

2.2. Off-Design Modeling

The operating point of the single-shaft MGT derives from the interaction between the compressor and the turbine. Performance maps allow the off-design performance to be determined as a function of the inlet conditions and actual rotational speed (n) of the machine, by scaling from the design point conditions and speed. For the compressor and turbine, respectively, the relationship between pressure ratio (βc, βexp) vs. corrected flow (CF, FF), with lines for each value of CS, was implemented by applying the following definitions:
  CF = m a T in , c T ref MW   p in , c p ref
FF = C   m exh p in , t ( R MW   γ exh ) T in , t ( 2 γ exh + 1 ) γ exh + 1 γ exh 1
CS = n   T ref T in
with Tref = 288.15 K and pref = 1.013 bar. In Equation (6), the universal gas constant (R), molecular weight (MW)and specific heat ratio (γ) will be affected by changes in the exhaust composition because of fuel flexibility.
On each CS line, 10 points were defined with values of pressure ratio, corrected flow, and polytropic efficiency normalized with respect to design conditions, as follows:
CF ( CF ) Design   Point
FF ( FF ) Design   Point
CS ( CS ) Design   Point
β ( β ) Design   Point
η y η y ( η y ) Design   Point
Moreover, for each CS line, the maximum pressure ratio, normalized by the nominal pressure ratio, is required to define surge for compressor and choking for the turbine. Eight speed lines were entered for each map.

3. Model Validation

This section is devoted to verifying the accuracy of the proposed model at both design and off-design conditions. Maps of the compressor and turbine were essential for evaluating the actual working point of each turbomachinery, by varying ambient temperature and load while maintaining the traditional fuel. As further demonstration of the method’s reliability, syngas was also considered as a fuel source.

3.1. Nominal Conditions

In Table 3, Thermoflex model outputs (hereinafter referred to as “TFX”) were compared against manufacturer’s data at full load and ISO standard conditions: site elevation of 0 m above sea level; ambient temperature (Tamb) of 15 °C; relative humidity of 60%. The fuel type is NG. The design point is well simulated since the largest deviation between predicted and reference parameters is less than 2%. It should be noted that a tolerance of ± 3 kW and ±1% of the declared value was reported in [32] for electric power and efficiency, respectively. Moreover, it is worth highlighting that the slight overestimation of fuel LHV depends on NG composition: pure CH4 was assumed in the model whereas a mixture of CH4 (91% vol), C2H6 (7% vol), and C3H8 (2% vol) was considered in the datasheet [32]. It was verified that this variation in the mixture of hydrocarbon gases entering the combustor, at the same fuel input, has a negligible impact on MGT performance: any difference in results is within the numerical error.

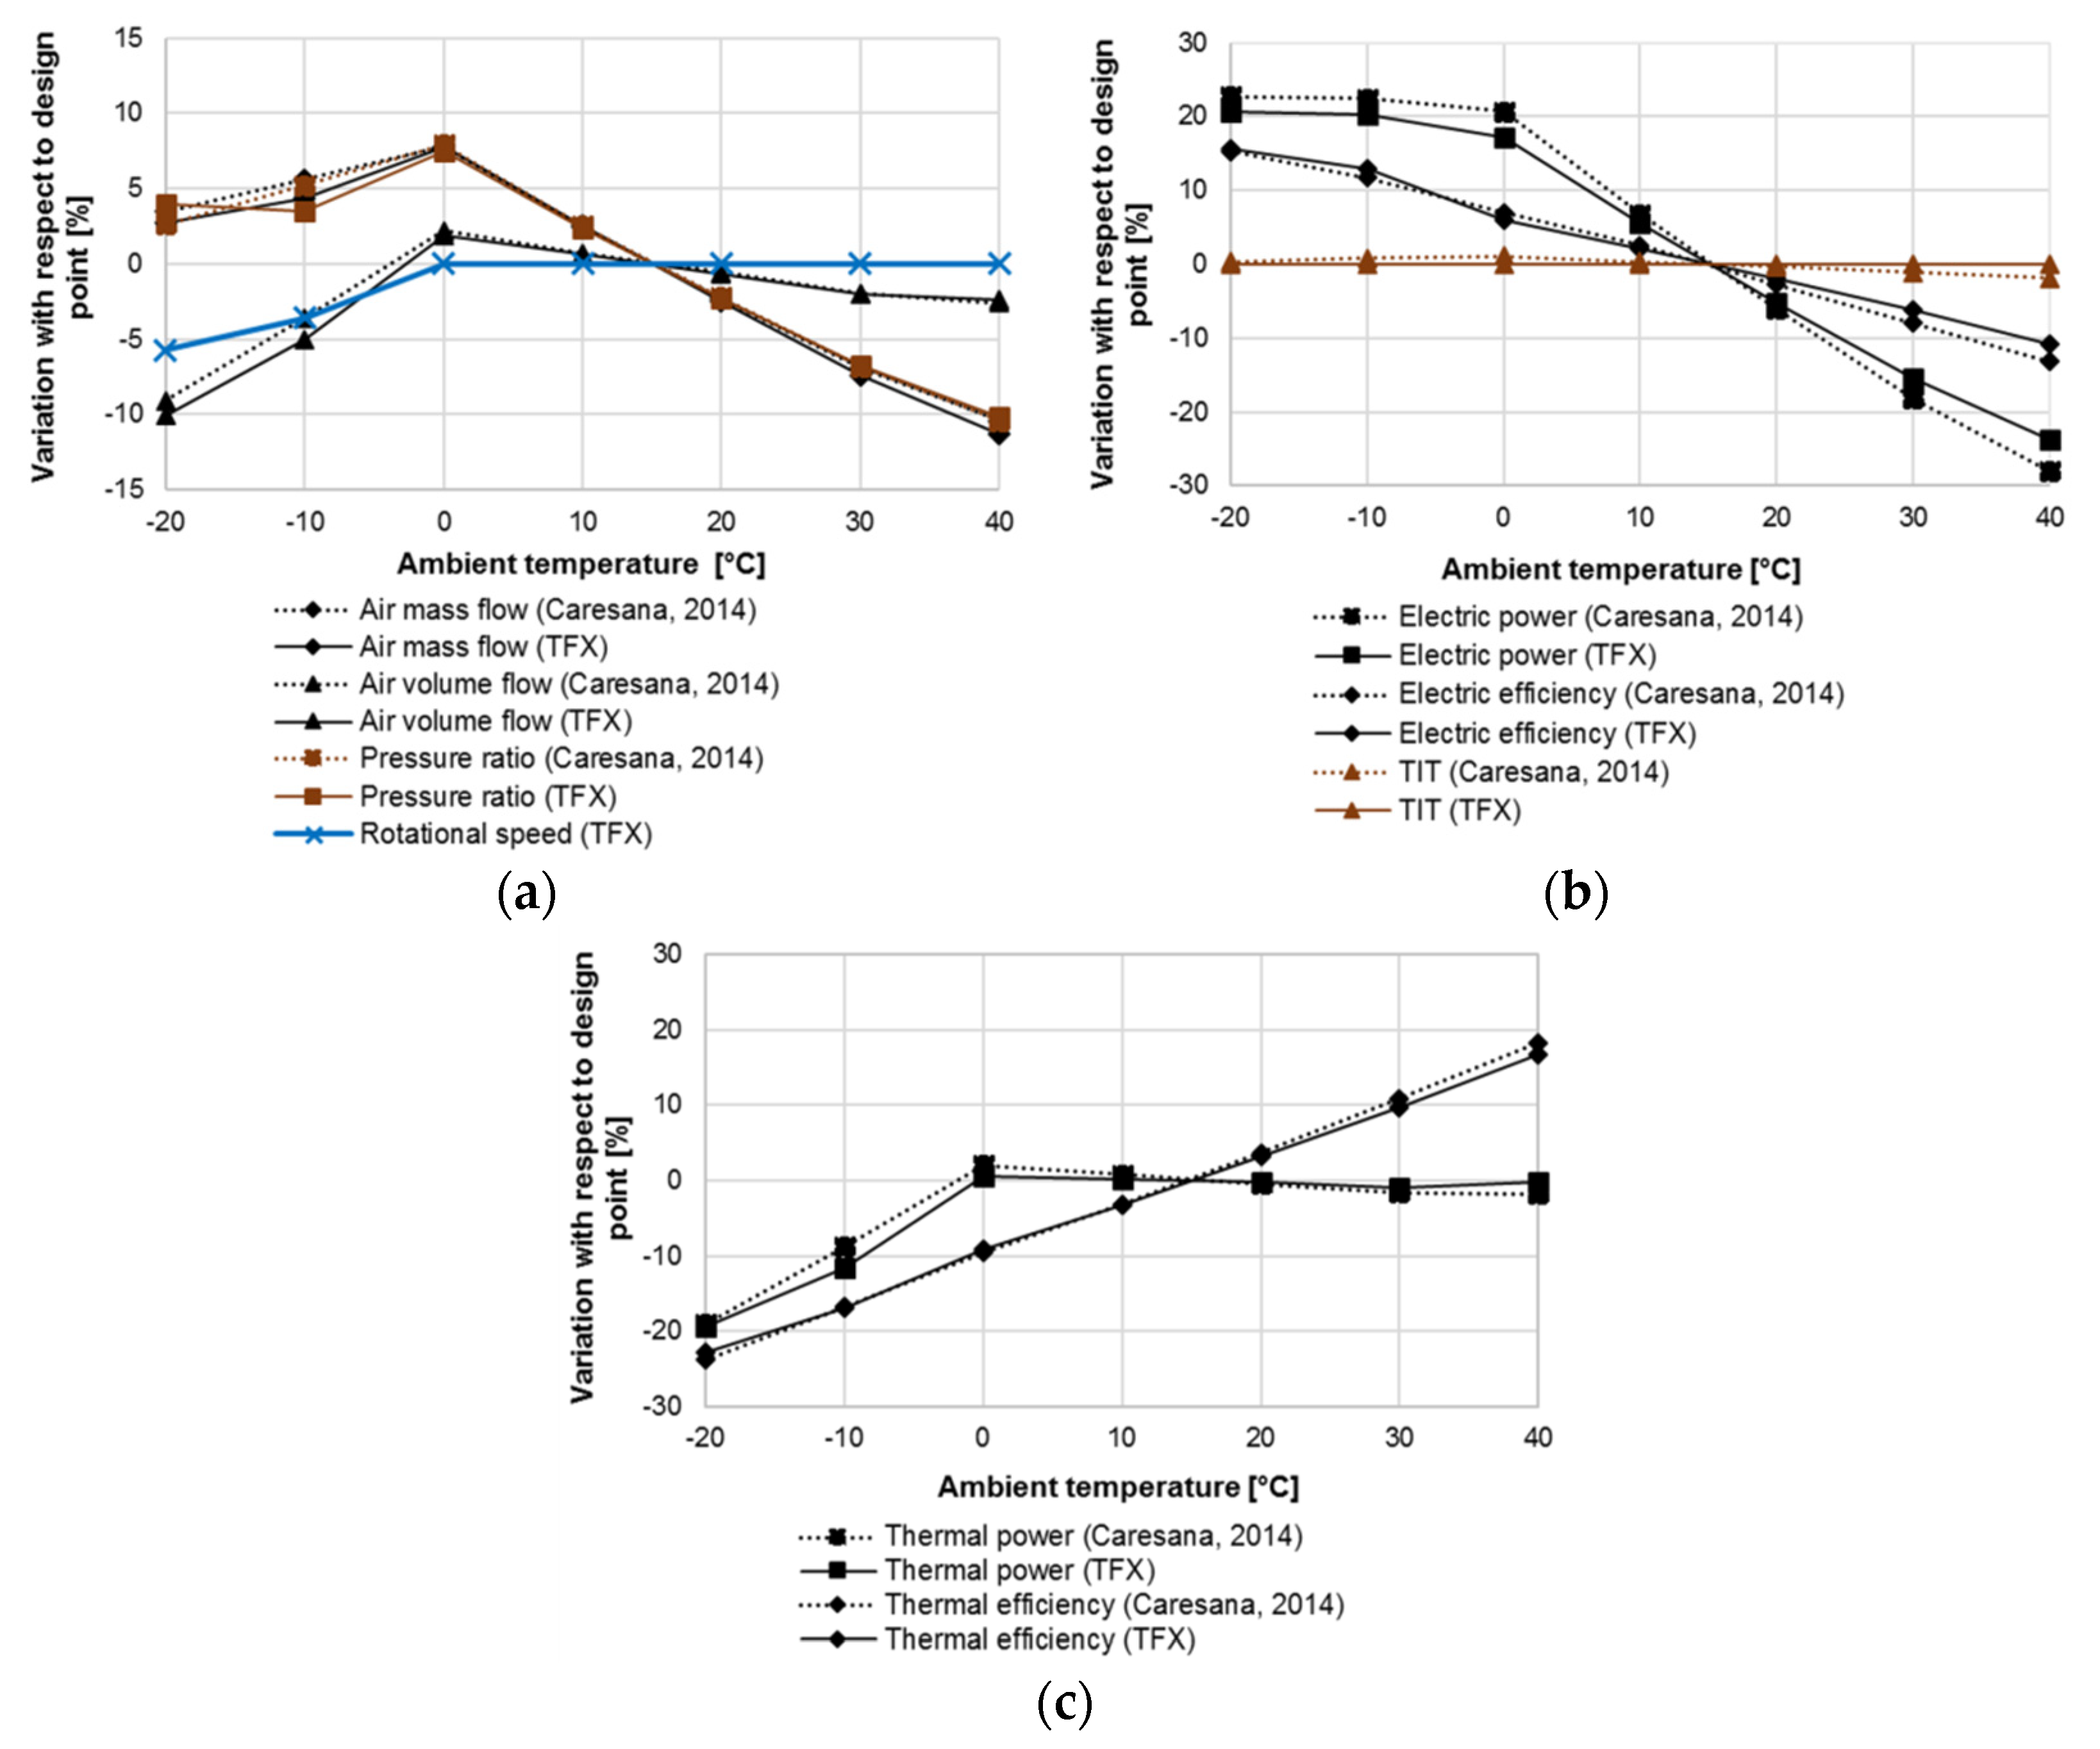
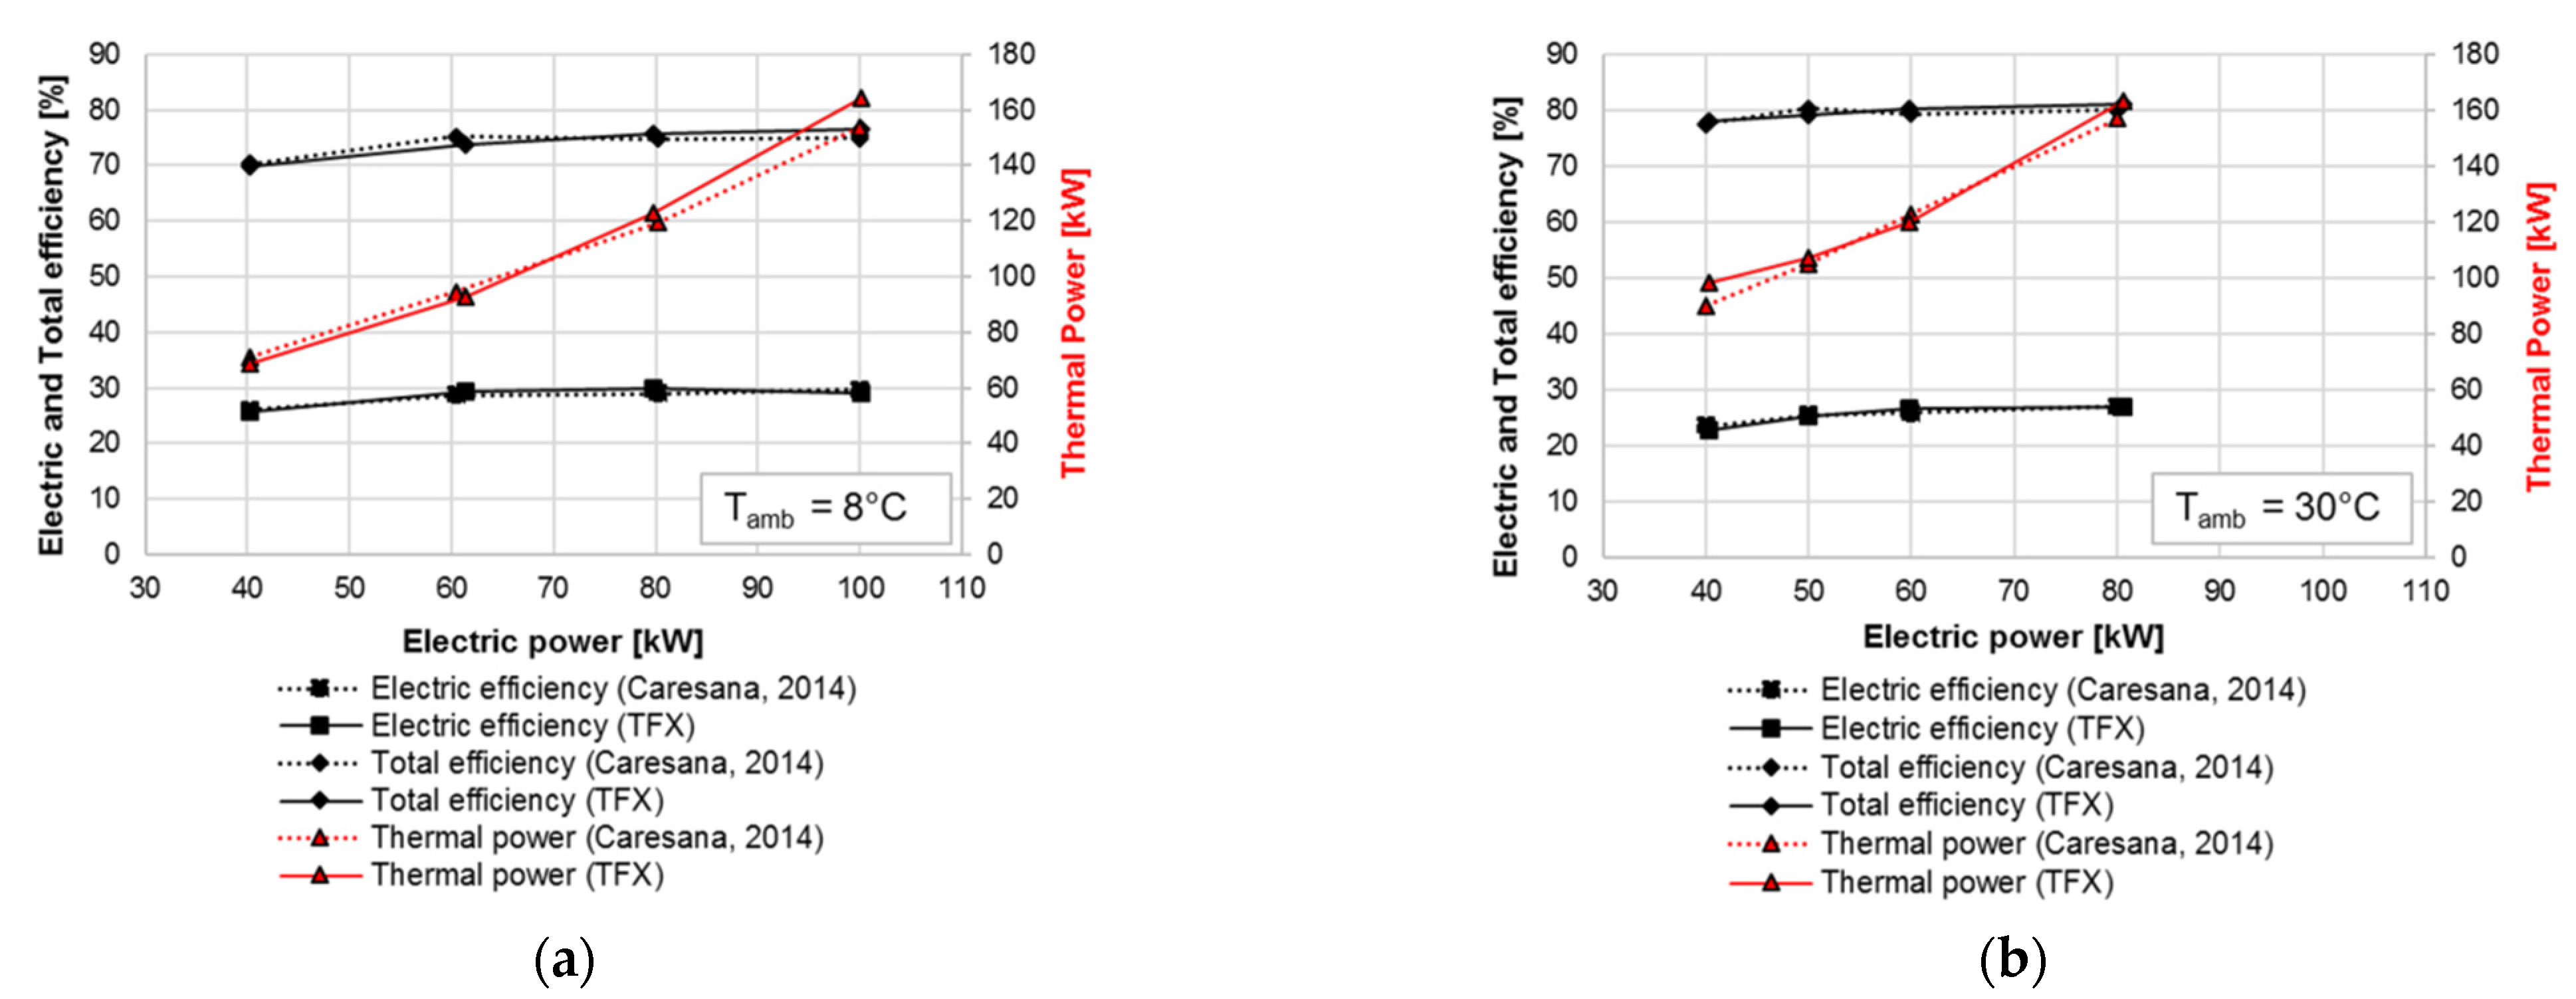
3.2. Effects of Ambient Temperature

The ambient temperature varied from −20 to 40 °C with 10 °C steps. Predictions were compared against the data available from [33]. Results are presented in Figure 2 as percent variation with respect to nominal condition (Tamb = 15 °C). Global parameters are shown together with the most significant MGT operating variables. As is well known, an increase in Tamb lowers the density of the air; thus, reducing ma through the MGT with a negative effect on Pel. At the same time βc is diminished whereas the compressor discharge temperature is increased; thus, impairing the prerequisites for the recuperator. Therefore, ηel is also decreased. Thermal power decreases much less than Pel because the reduction in mexh is partially compensated by the augmentation of exhaust temperature at the recuperator inlet. This translates into an increasing temperature of the exhaust gas sent to the RHE, with a consequent benefit in terms of enhanced ηth. The behavior outlined above is valid at constant speed, which corresponds to Tamb ≥ 0 °C. Obviously, the opposite takes place when lowering Tamb: an increase in ηel and Pel is expected. When the maximum capacity is reached at about 0 °C, power output is limited by gradually diminishing the rotational speed as Tamb falls below 0 °C, with a consequent declining trend in the intake air flow and, thus, βC. This enables constant Pel, at about 120% of design value, while preserving ηel, which still shows increasing values with decreasing Tamb. Similarly, the profile of ηth does not appear to be influenced by speed reduction, despite the sharp fall in Pth at Tamb < 0 °C because of the drop in intake air.
Overall, the modeling procedure quite accurately reproduces the MGT performance discussed in [33]: Pth and air volume flow show similar trends; the same is valid for ma and βC, as pointed out by Caresana et al. All variables were properly calculated: the deviation between the actual value and the measured one is less than 4.5% for all global parameters such as Pel, ηel, Pth, and ηth. More precisely, the largest error is due to overestimation of Pel at of 40 °C. This might be due to the fact that computations were carried out with TIT held constant at the design value whereas a slight reduction in TIT, by up to 2% at the hottest Tamb, was considered in [33] to prevent the machine from thermal stresses.
Figure 3 depicts the impact of Tamb on rotating machineries. Two operating regimes are evident. Above the threshold of Tamb = 0 °C, at iso-speed conditions, the working points move towards lower βc and lower CF as Tamb increases, along the equilibrium running line: in other words, the compressor delivers less air at a lower pressure hence MGT power decreases. On the turbine map, the corresponding reduction in βexp can be appreciated; values of FF are also diminished, although to a lesser extent than the compressor CF. Below the threshold of Tamb = 0 °C, operating points deviate from the equilibrium running line: since the maximum capacity cannot be exceeded while lowering Tamb, rotational speed must be reduced. This means moving the working points towards lower corrected flows for the compressor whereas the opposite occurs for the turbine, as the decrease in pin,t outweighs the decrease in mexh, at constant TIT (see Equation (6)).
Figure 2. Model validation: effects of ambient temperature on (a) compressor characteristics; (b) electric power and efficiency; (c) thermal power and efficiency [33].
Energies 15 03874 g002

3.3. Effects of Part-Load Operation

Simulated cases reproduced the laboratory tests performed at Tamb of 8 and 30 °C, with ambient pressure of 101 kPa, under the same thermal load conditions. Measurements taken from [33] and model-predicted data are shown in Figure 4. The level of electric power was reduced up to 40 kW by lowering the rotational speed of the shaft. Looking at Figure 4a, ηel drops by about 4 pp, from 30% to 26%, when Pel falls from 100 to 40 kW. A loss in ηel of a similar magnitude occurs at Tamb = 30 °C when Pel is halved from 80 to 40 kW, although starting from a lower level. Conversely, higher values of Pth and ηtot can be achieved at hotter Tamb, when Pel stays below 80 kW.
Good agreement between model-predicted and measured data is observed throughout the load range. Whatever Tamb, predictions of Pth at the ends of the considered range of Pel showed the largest deviations from measurements, still within 8%. A reason for this can be found in the management of the exhaust gas temperature at the recuperator outlet. Similar conclusions were obtained by Hampel and Braun [30]: they stated expressly that error in Pth mainly depends on overestimation of exhaust temperature at the recuperator outlet, since exhaust mass flow rate closely agrees with laboratory data across the entire load span. The investigation of part-load behavior at non-ISO conditions confirmed that lower air density, i.e., hotter Tamb, penalizes ηel but increases heat recovery at de-rated operation, once again consistently with [30].

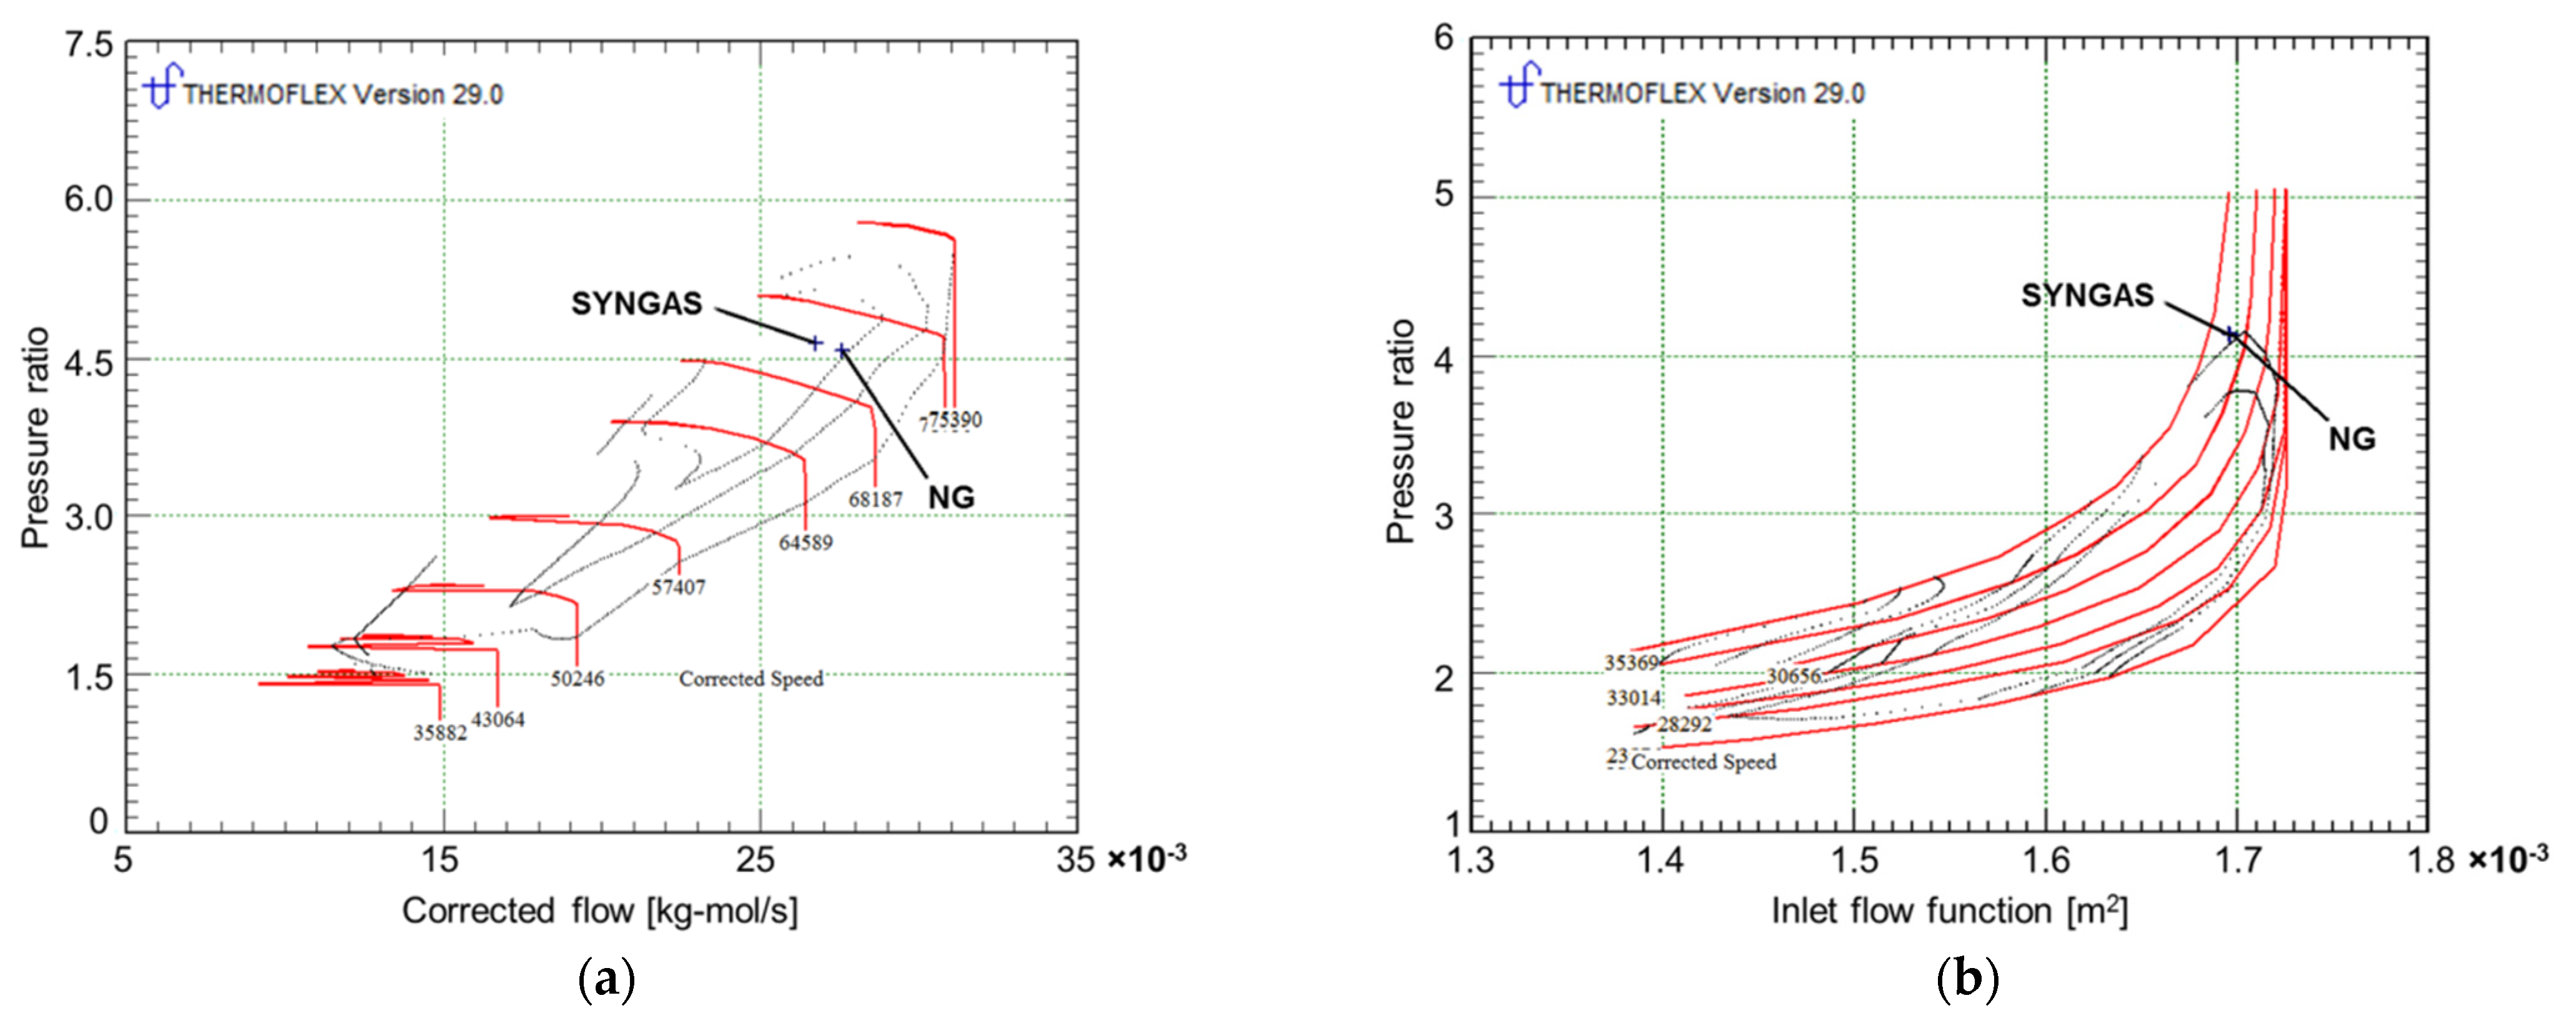
3.4. Effects of Syngas Feeding

Drawing inspiration from the research carried out by Renzi et al. [35], syngas from pyrolysis of forestry residual biomass was chosen as fuel for validation purposes. Syngas composition is available, unlike the fuel conditions at the combustor inlet, which were set to avoid water condensation. Ultimate analysis prescribes the following (mol%): CH4 (21%), H2 (7%), CO2 (38%), CO (29%), and H2O (5%). Hence, LHV, being equal to 9.15 MJ/kg is less than a quarter of that of NG.
The model was used to check whether MGT can ensure in any case the nominal output at rated speed and ISO standard conditions. Please note that TIT was adjusted to 946 °C. Larger amount of syngas must be combusted, compared to NG, in order to release an equivalent amount of energy; thus, causing an increase in mexh, hence in turbine power. The turbine adapts to new inlet conditions in terms of slightly reduced TIT and greater exhaust flow, with higher molecular weight (29.12 vs. 28.66). Indeed, variation in flue gas composition (mol%) takes place, unlike the previous cases: CO2 increases from 1.5 to 4.2% at the expense of N2 (74.3 vs. 76.1%), H2O (3.5 vs. 4.0), and O2 (17.1 vs. 17.4%). However, this only has a marginal influence on FF so that Figure 5b shows almost overlapping turbine operating points for syngas and NG. Conversely, compressor operating point is deeply affected by fuel switching, as shown in Figure 5a: CF drops significantly whereas βc increases slightly. Therefore, a reduced ma exits the compressor at higher pressure, thereby causing the flow in the turbine, with larger βt.
Model outputs are collected in Table 4, for an easy comparison based on the results reported in [35]. With the largest percentage difference below 5%, the simulation captures well the effects of syngas feeding on MGT operation. Despite the slight underestimation of syngas flow and hence mexh, which is responsible for underestimated turbine power by about 4%, turbomachineries are properly characterized in terms of ηis and β; thus, supporting the correct application of performance maps. As regards ηis, the use of syngas in place of NG was found to enhance compressor performance (0.791 vs. 0.785) whereas the opposite is true for the turbine (0.812 vs. 0.829). This is fully in line with the findings presented in [35], just as the loss in ηel (29.26% vs. 30.14%) as the fuel input required to run the MGT at the rated speed is higher than that with NG (357 vs. 338 kW). Electricity production is also consistent with [35], being 2.4% higher than that with NG.

4. Results

As a complement to the majority of studies tackling combustion issues of NH3/CH4 mixtures, the effects of replacing NG with NH3 on MGT performance were discussed by adjusting the power output to different loads, in view of achieving grid flexibility. The picture was subsequently completed by a comparison between NG and NH3, used as pure fuel. Ammonia blending ratio (yNH3) varies between 0 and 1, according to the following:
y NH 3 = m NH 3 m NH 3 + m CH 4
Within the maximum combustor pressure of 7 bar, a preheater (labeled “Q+” in Figure 1) was included in the model to keep the temperature of gaseous ammonia at 50 °C; thus, avoiding liquefaction.

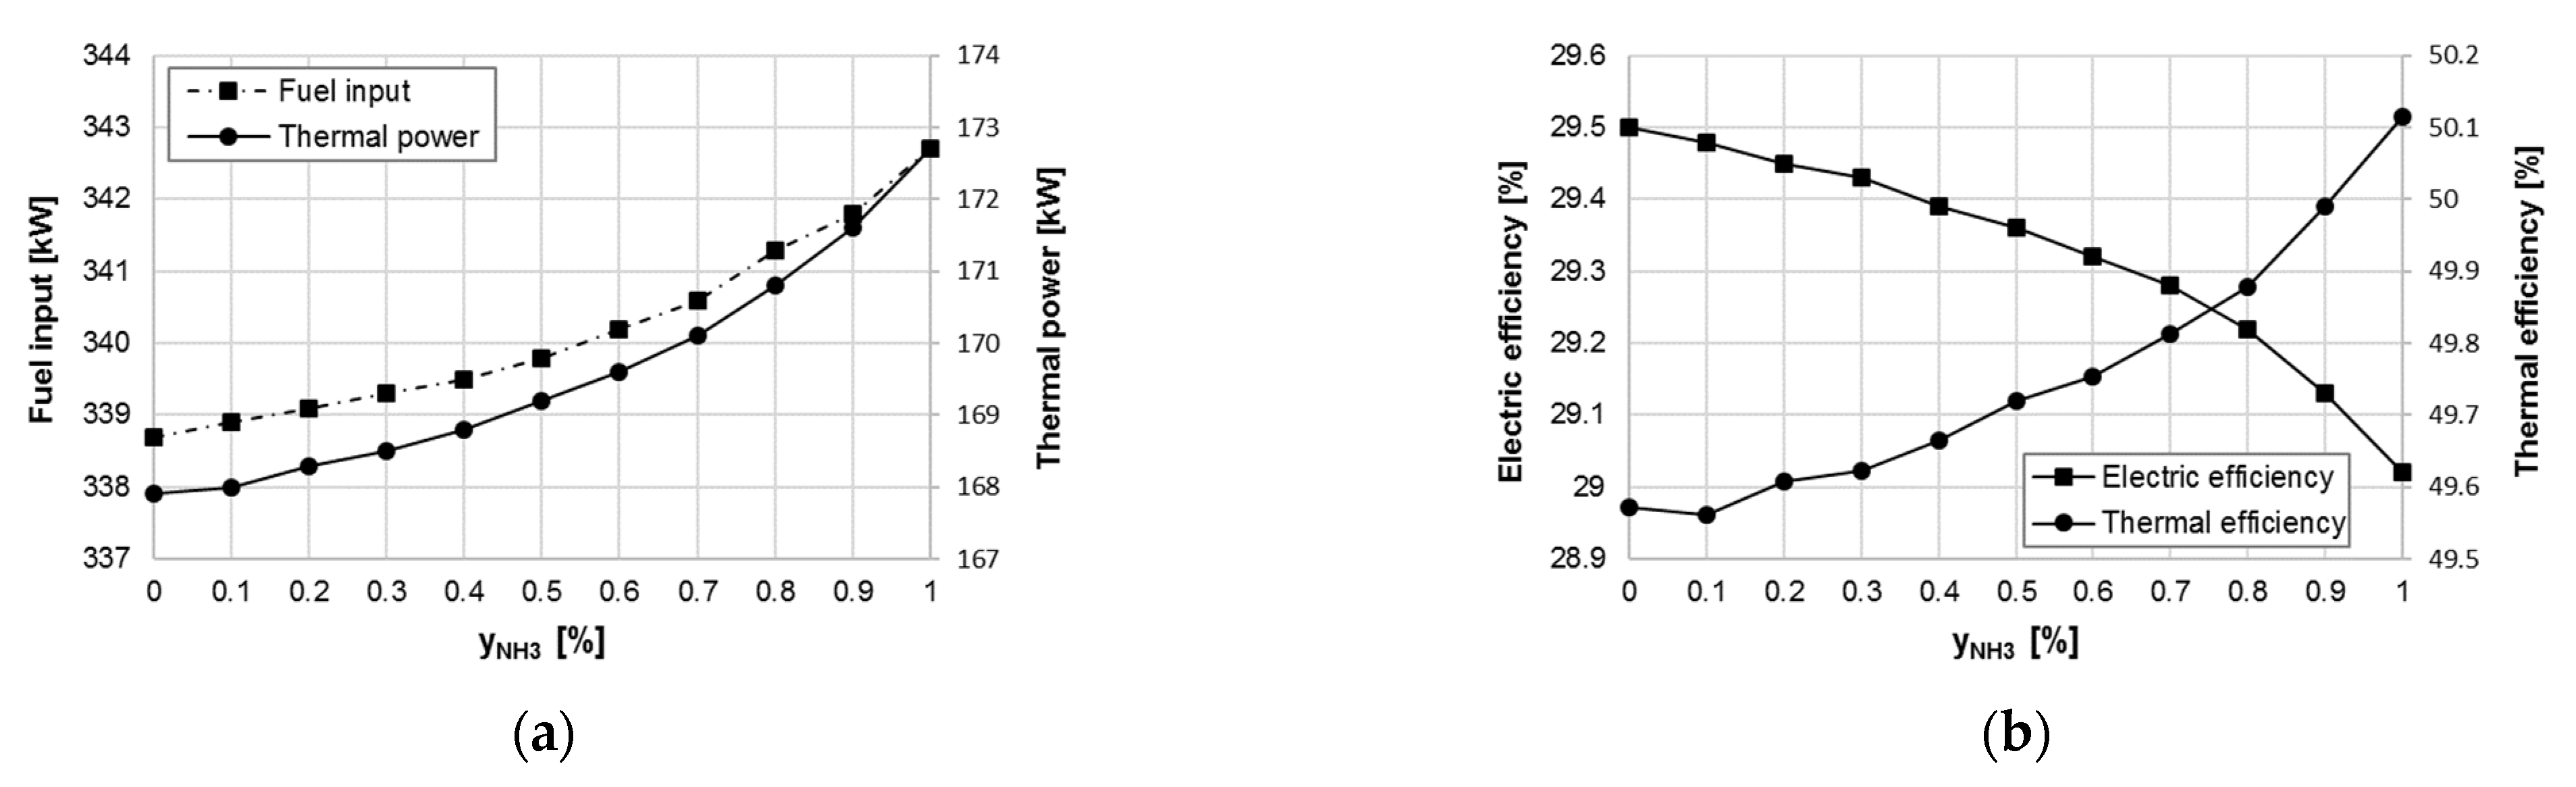
4.1. Full Load Behavior

A first set of simulations was carried out across the entire yNH3 range while keeping rated specifications for TIT and Pel. Similarly to what was observed for the syngas feeding, a higher mass flow rate of NH3 is required by the combustor, trying to compensate for the reduced LHV (18.6 MJ/kg), as compared with NG. The higher the yNH3, the larger the mfuel (Figure 6a). The constraint of constant design power leads to a significant drop in the airflow entering the compressor (−4.5% at yNH3 = 1), which ultimately leads to a reduction in mexh as yNH3 increases (−2.8% at yNH3 = 1). Compressor CF is reduced as well, which translates into increasing βc (Figure 6b). The same is valid for turbine βexp which obviously stands at slightly lower level, because of pressure drops across the combustor and heat exchangers.
From Figure 7a it can be observed that the fuel input into the combustor increases with yNH3 to guarantee the rated power output. This has a negative effect on ηel, whose value decreases by up to 0.5 pp at yNH3 = 1 (from 29.5 to 29%). Conversely, heat recovery from exhaust gas is promoted as evident from the growing trend in Pth, with a consequent improvement in ηth, up to 0.5 pp (from 49.6% to 50.1%). It follows that the loss in ηel is compensated by the gain in ηth, as displayed in Figure 7b, so that ηtot remains almost constant, at about 79%, whatever yNH3. This result was corroborated by tests conducted on a 2 MW-class GT: ηth during NH3 co-firing up 20% was found to stay constant at around 80%, at the same level as that during NG firing [36].
It should be clarified that the augmentation of Pth is due to the fact that the increase in exhaust temperature at the recuperator outlet (by up to 8 °C) outweighs the reduction in mexh. On the other hand, despite the decrease in the heat transfer across the recuperator, reduced ma may enter the combustor at increasing temperature. In addition, it was verified that turbine outlet temperature (TOT) exceeds the design value by 2 °C, at the worst.
It deserves to be mentioned that, if the power constraint is removed, burning NH3 would lead to an electric production by up to 113 kW, at yNH3 = 1, still within the maximum capacity. Such a result could be achieved by running the MGT at the rated airflow: exhaust gas flow would increase up to 0.82 kg/s, still within the limit of 0.87 kg/s set by the manufacturer. Hence, Pth would increase as well, up to 176 kW. Therefore, conversion of MGT to pure NH3 fuel operation could be accomplished. Indeed, power augmentation in the order of 10–20% has been known since 1968 when NH3 replaced hydrocarbon in GT engines at the same TIT [37].

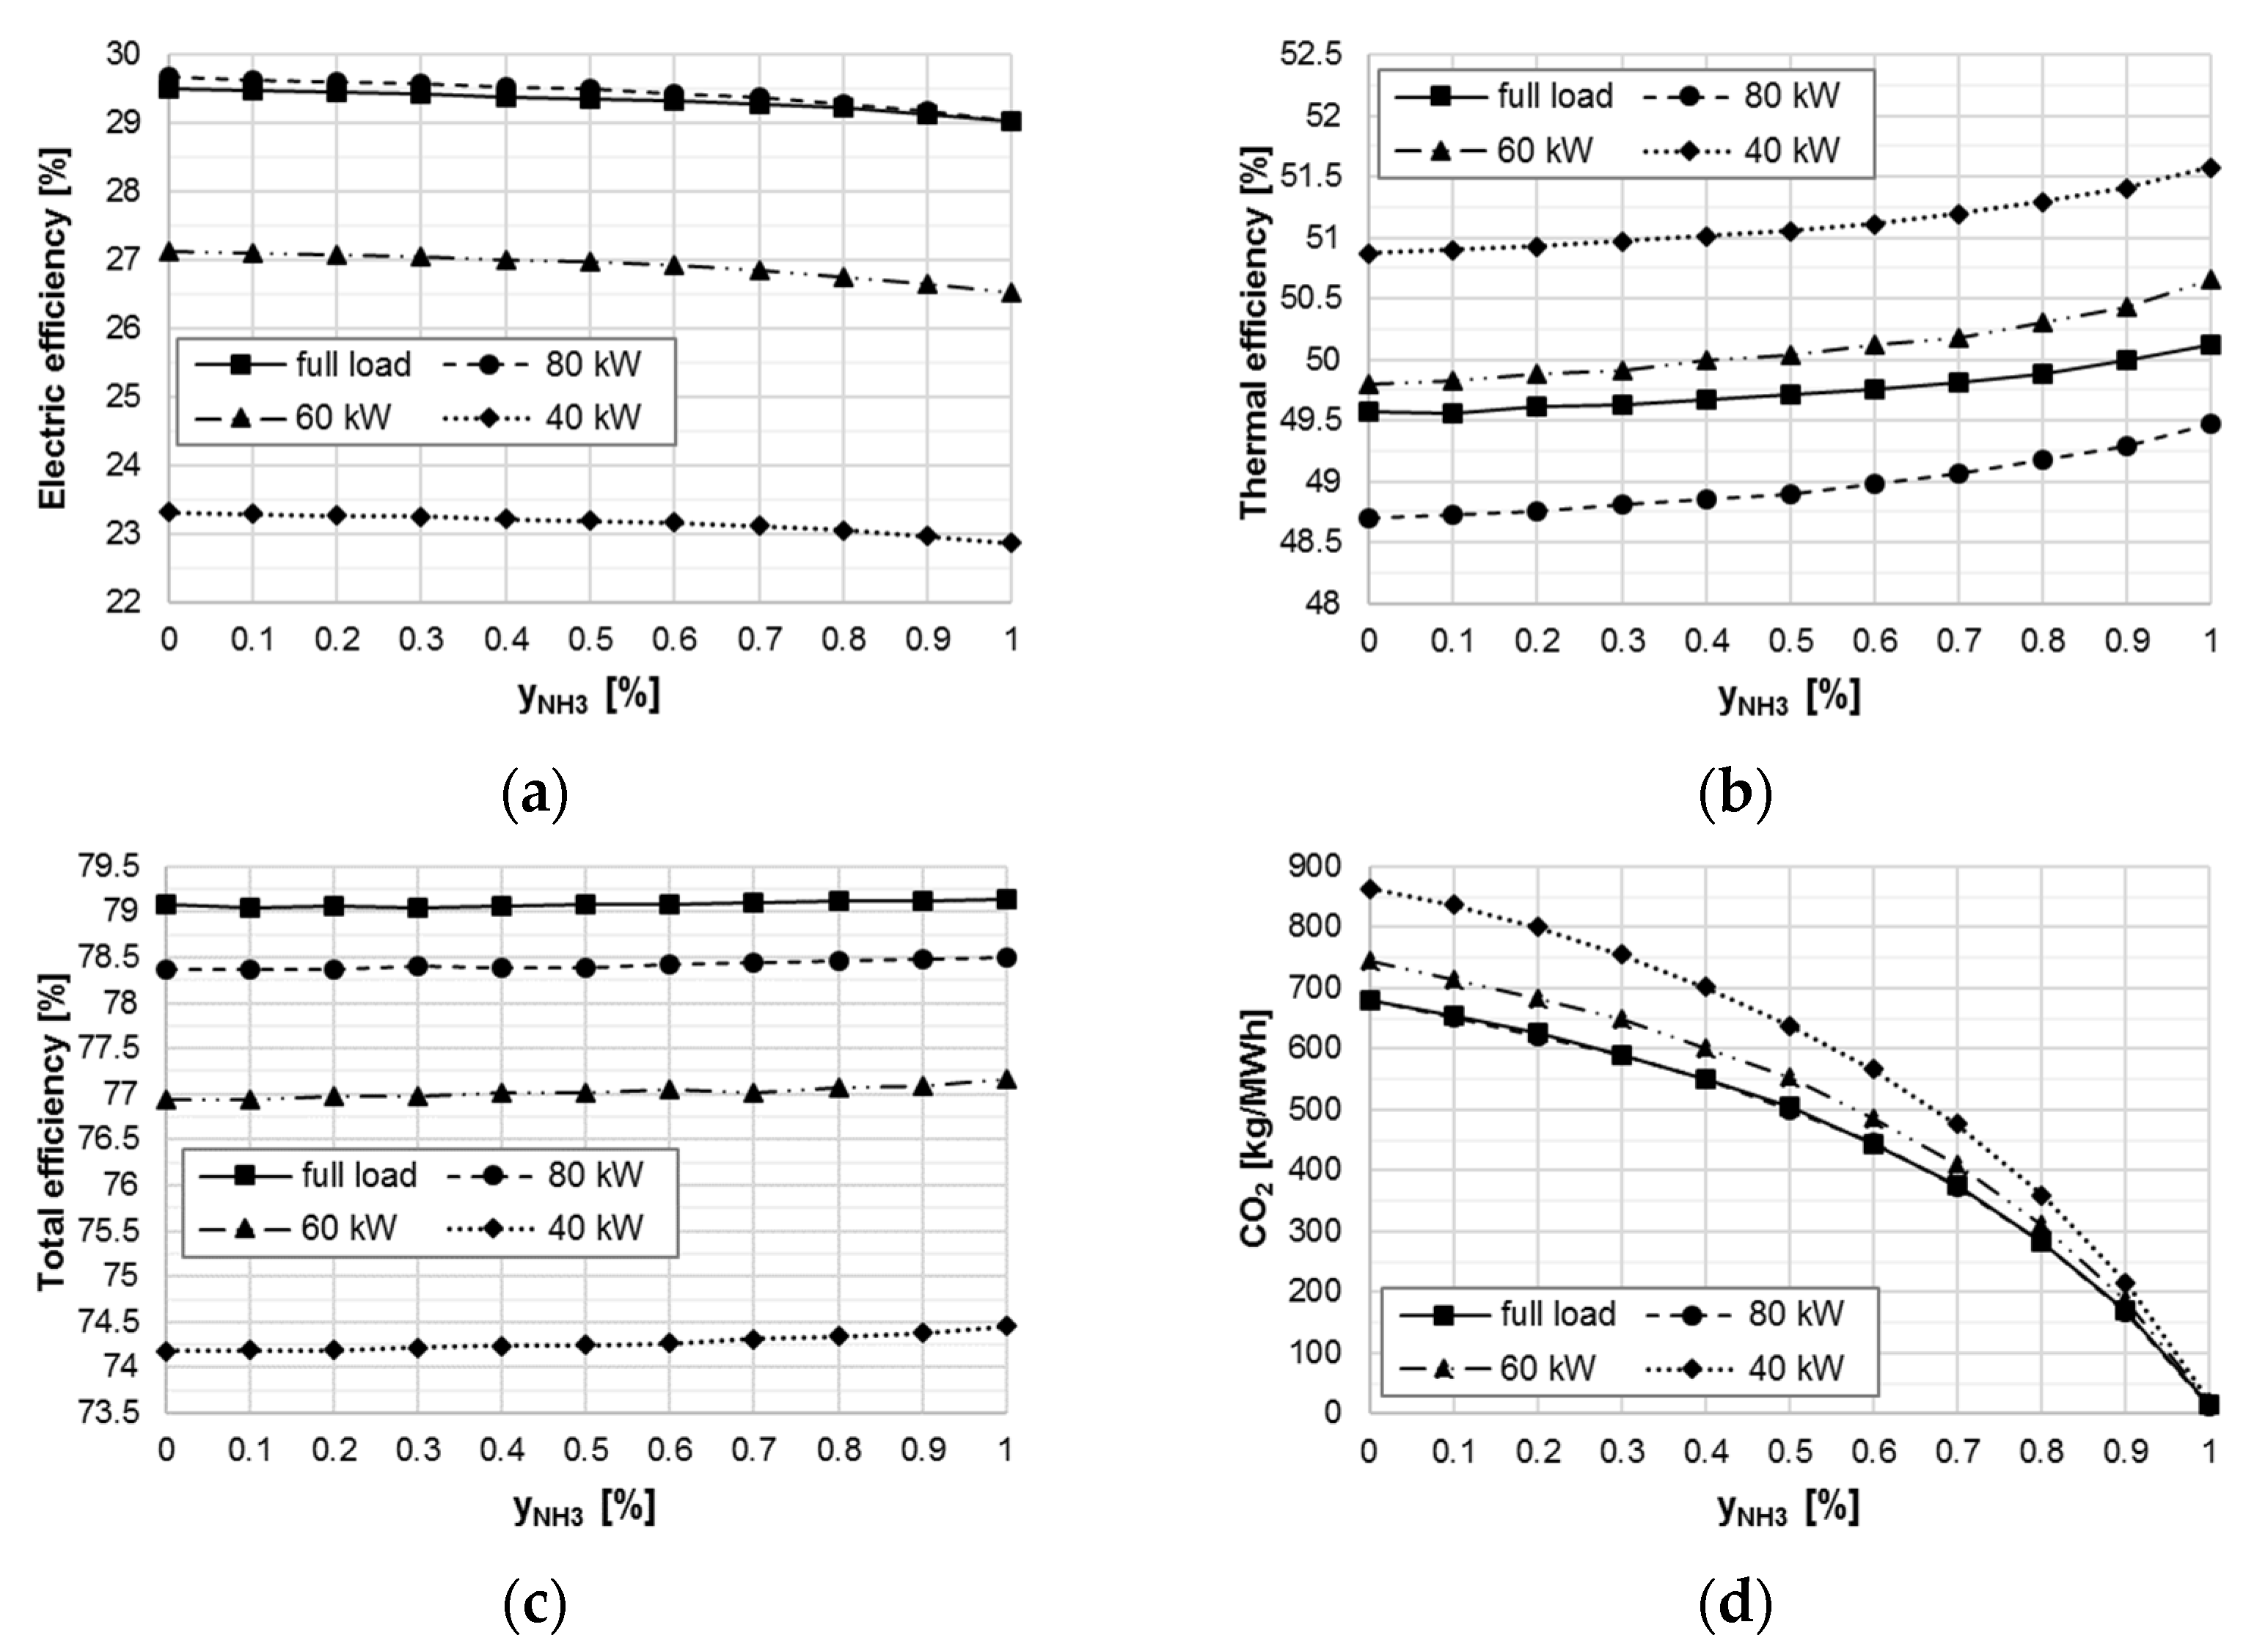
4.2. Part-Load Behavior

Three additional sets of simulations were executed at partial load by lowering Pel to 80, 60, and 40 kW, under the assumption of constant TIT, for consistency with Section 4.1. The findings obtained at full load remain valid from a qualitative point of view: trends shown in Figure 6 and Figure 7 are confirmed. Whatever the MGT output, replacing NG with NH3 causes the compressor working point to move towards lower CF and greater βc (Figure 8a). The turbine is characterized by a slightly higher βt and a small increase in FF, due to choked flow limit (Figure 8b). However, calculations at part-load gave the opportunity to discuss turbomachinery features while lowering the rotational speed. Operating points for both the compressor and turbine move downwards and left; thus, indicating a reduction in β and air/exhaust mass flow rate. Clearly, since less fuel input is required at part-load, the amount of NH3 injected into the combustor gets smaller as Pel decreases: that is why the horizontal distance between extreme points (where yNH3 equals 0 and 1, respectively) is shortened, with much more evident impact on compressor operation.
The compressor seems to be severely affected by partial load (Figure 9a): ηis,c, which was found to be enhanced by raising yNH3 at full load, goes completely the other way when Pel equals 80 and 60 kW. The largest loss in ηis,c is within 0.3 and 0.6 pp, respectively. However, ηis,c stays above 78.8% if Pel does not fall below 60 kW, even though the compressor approaches its surge limit. The case at Pel = 40 kW is associated with the lowest value of ηis,c which is stable at 75.5%; thus, underlining that MGT performance may degrade significantly at low load conditions. On the contrary, the turbine behaves in the same manner, whatever the Pel level (Figure 9b): ηis,t, despite the declining trend as yNH3 increases, remains at good level amounting to at least 80%. Nevertheless, fuel switching has an adverse influence on turbine performance.
As far as the energy balance is concerned, nothing changes with respect to the results in Figure 7b. In fact, the efficiency penalty is confirmed when referring to ηel: the largest loss, at yNH3 = 1, lies between 0.4 and 0.6 pp in comparison with NG feeding (Figure 10a). On the contrary, ηth rises to the same extent, whatever the load (Figure 10b). It turned out that ηtot is not influenced by yNH3: trends substantially flat are depicted in Figure 10c, at gradually decreasing levels, i.e., 78.4, 77.1, 74.2%, while lowering the power in steps of 20 kW.
However, the main goal is to reduce greenhouse gas emissions. CO2 emission intensity decreases continuously with the effect of using NH3 instead of NG, whatever Pel (Figure 10d). It is important that the amount of CO2 discharged through the stack can be brought down to zero not only at full load, the condition at which the largest emission equals 680 kg/MWh, but especially at part-load, which is characterized by higher emission intensity, up to 864 kg/MWh. In terms of flue gas composition, CO2 is simply being replaced by H2O, as a product of NH3 combustion. In fact, the content of N2 and O2 undergoes a small reduction, by a maximum of 3%.

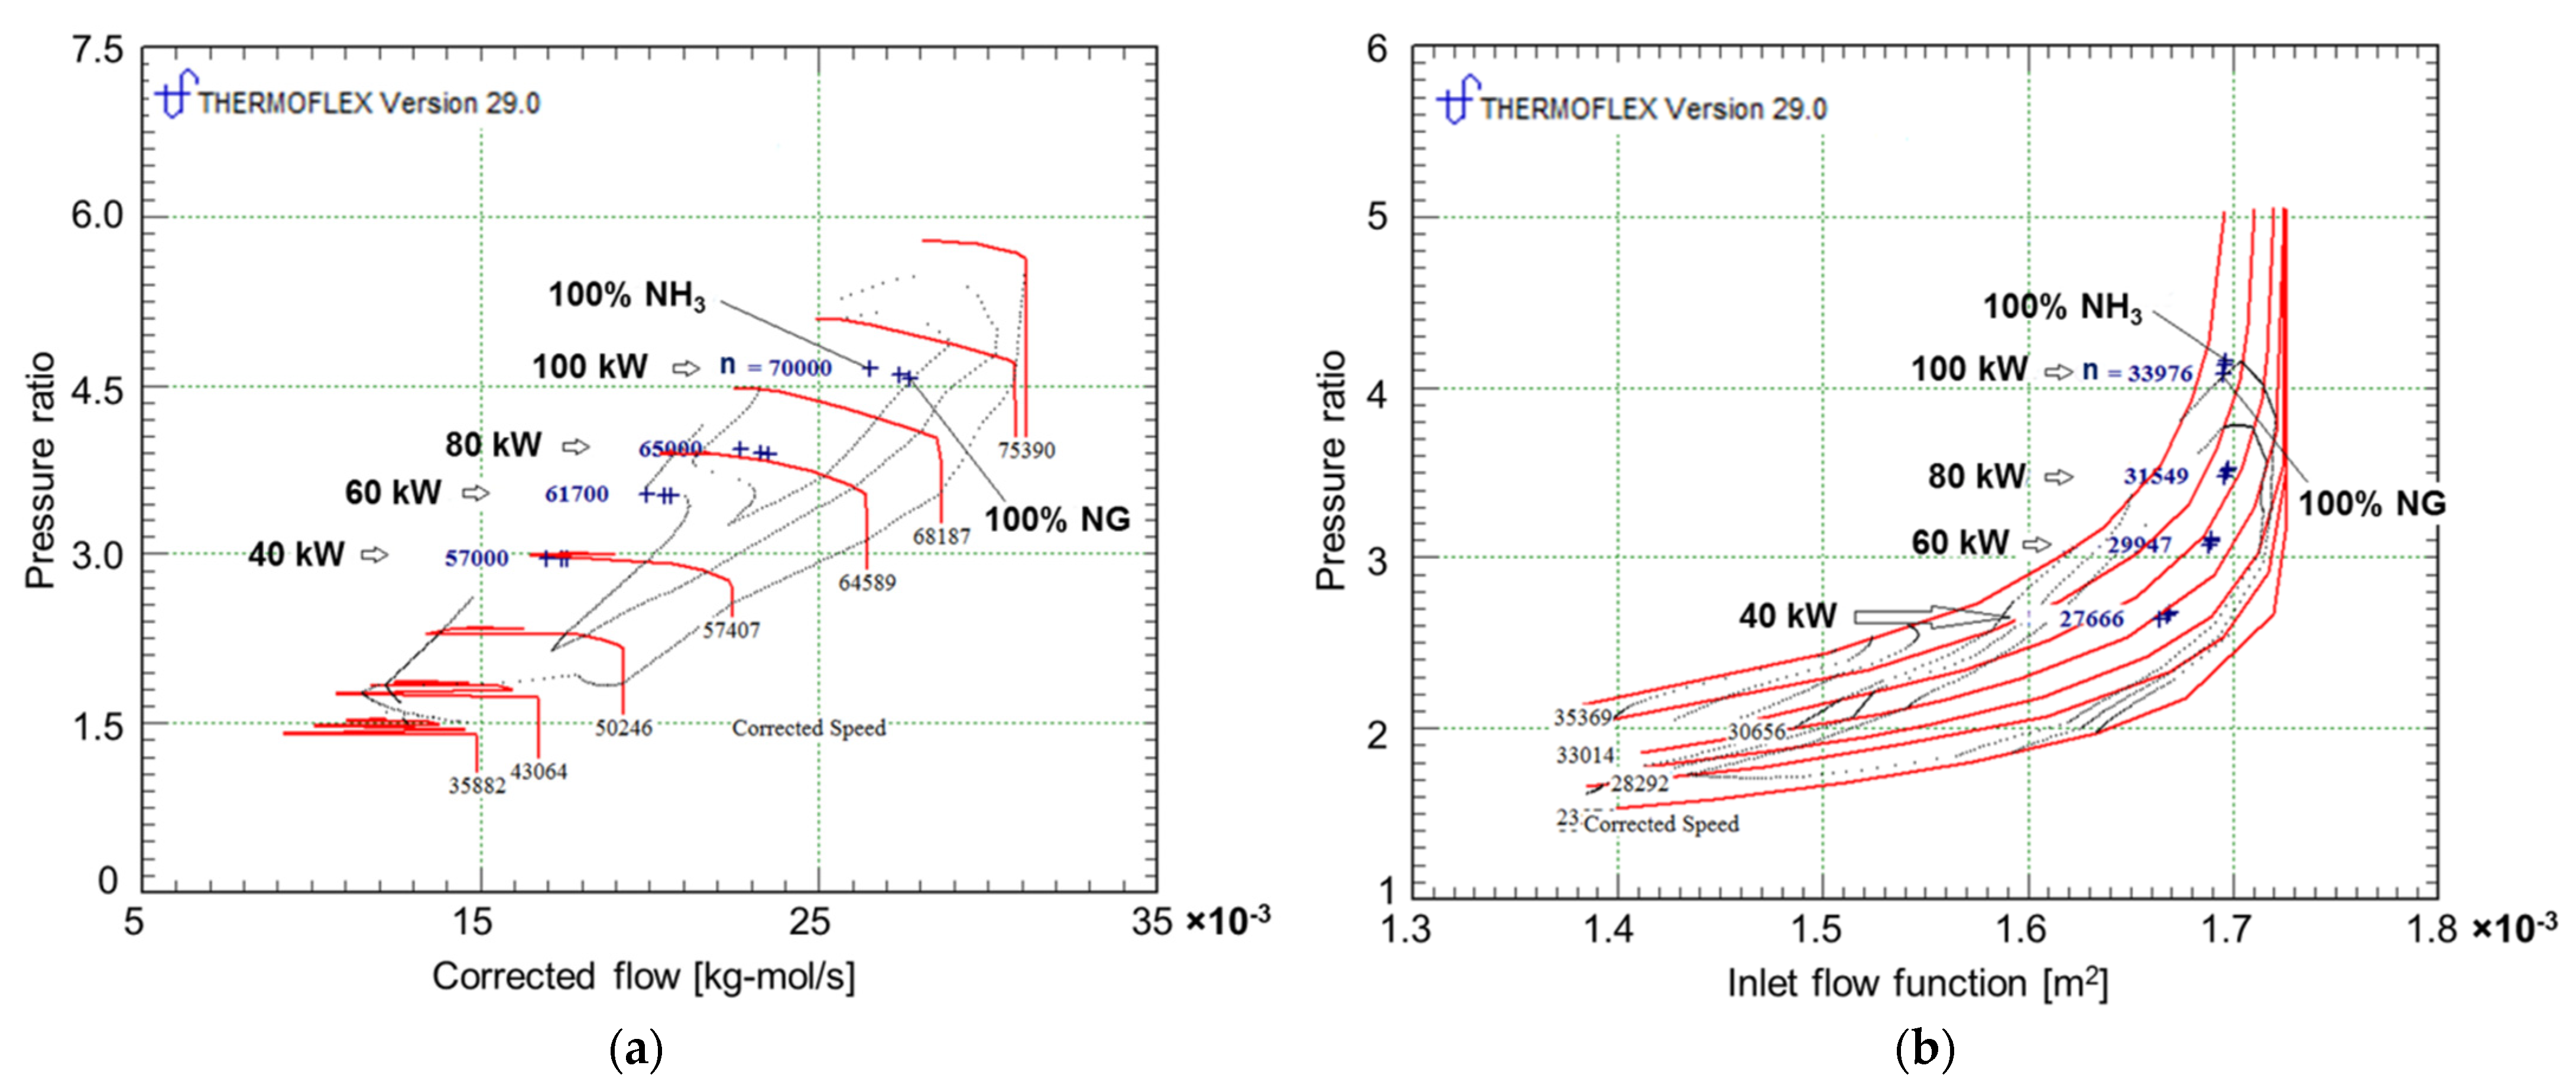
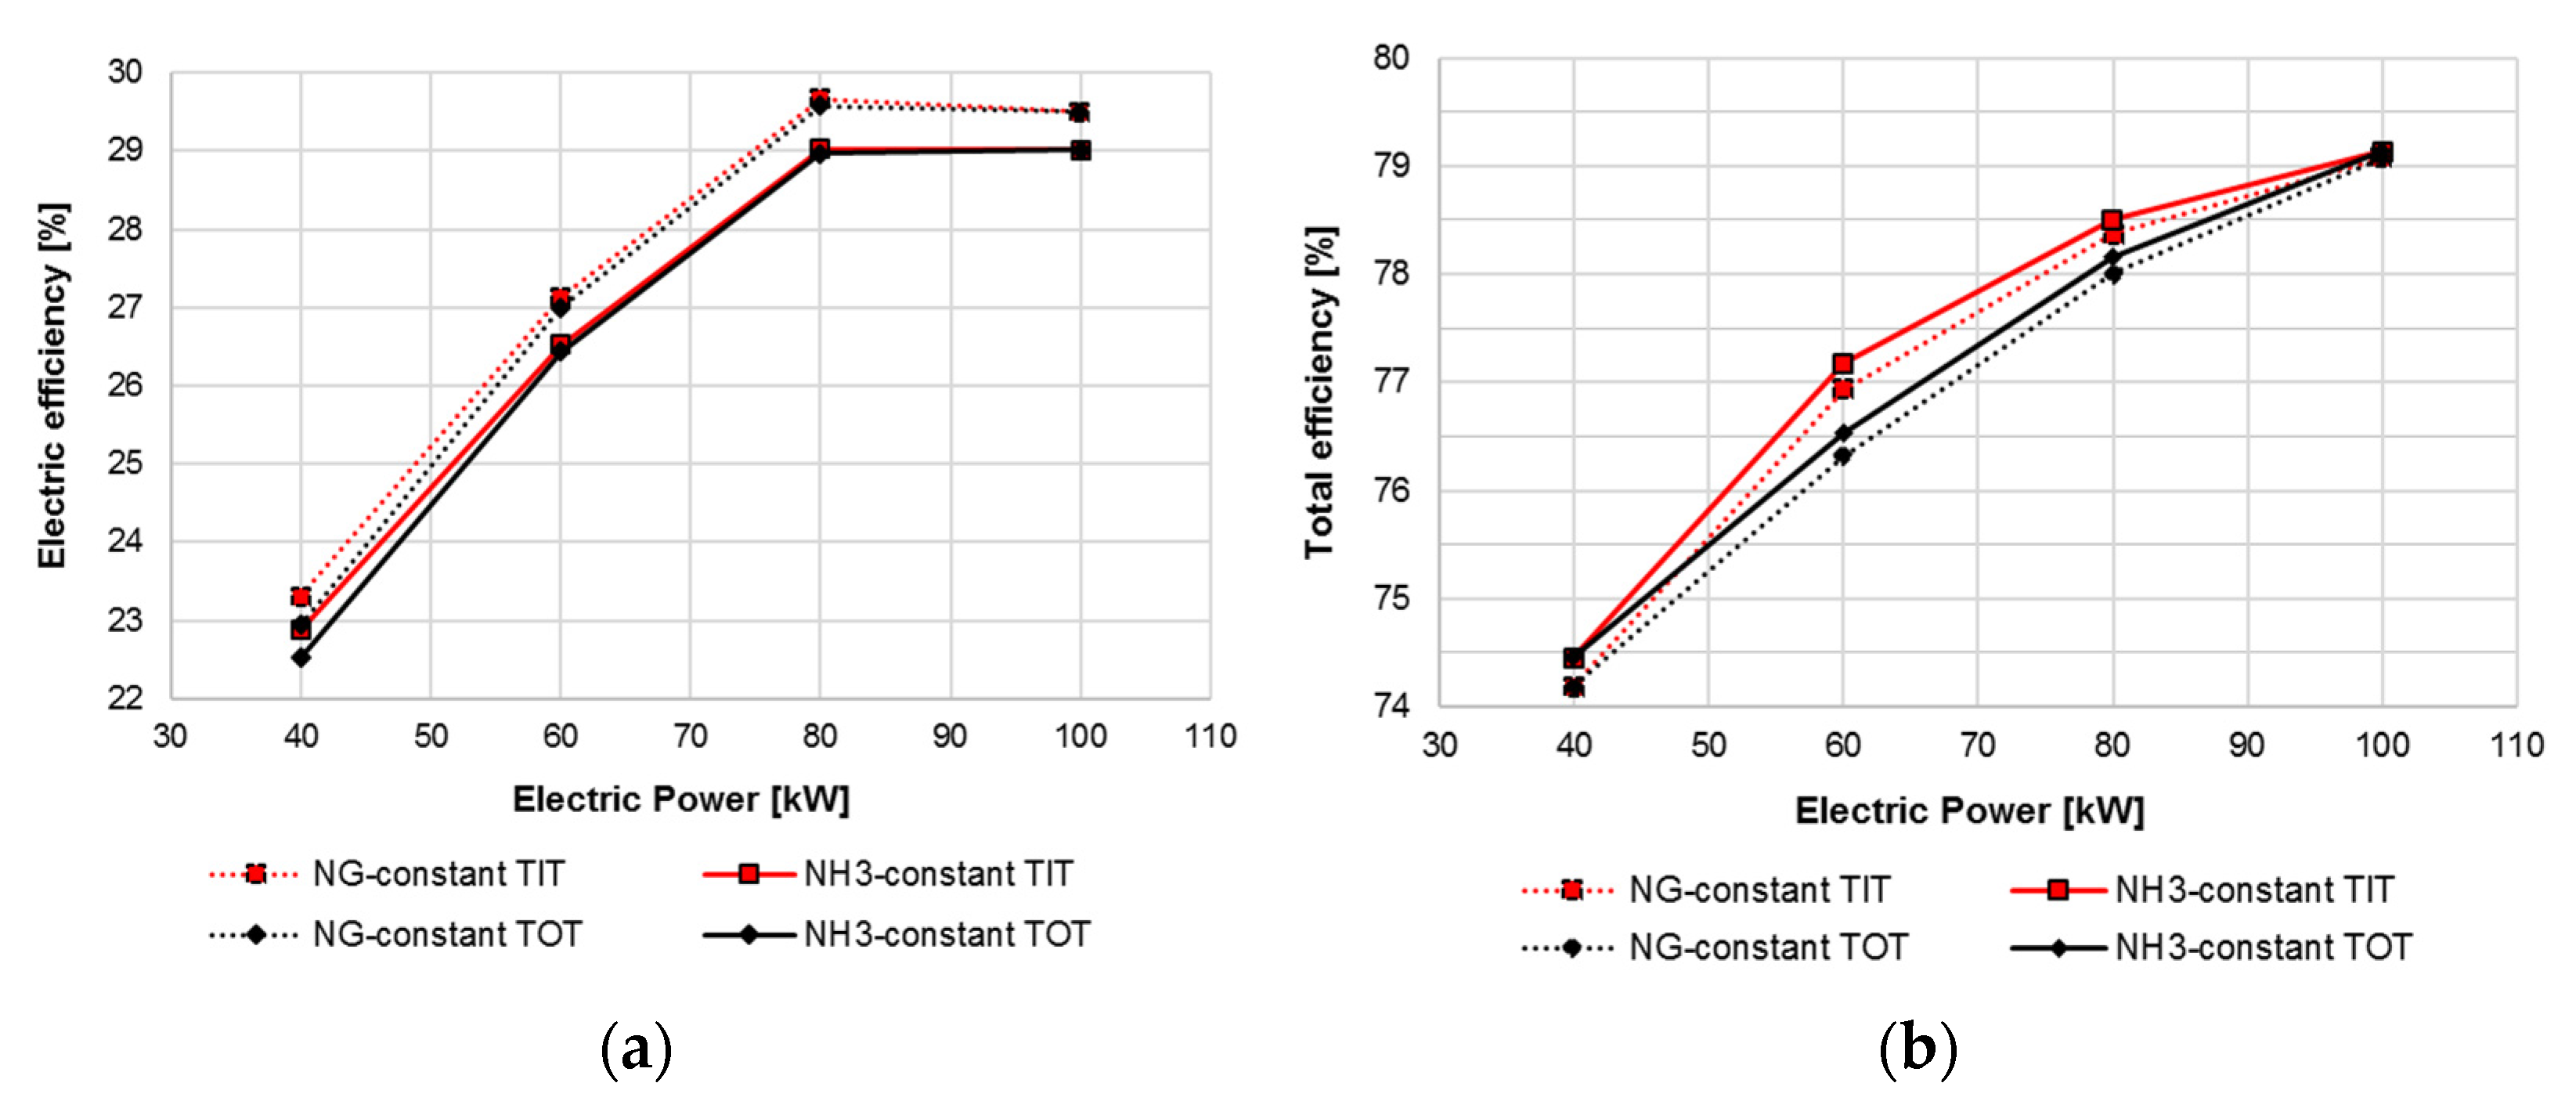
4.3. Natural Gas vs. Ammonia

One might argue that keeping TIT constant at part-load would inevitably set demands for the recuperator materials. Indeed, TOT was found to raise from 650 °C, at full load, up to 733 °C, at 40% load. Moreover, firing of 100% ammonia led to a negligible increase in TOT, by 2 °C, compared to pure NG. The point is that the MGT electric output may be reduced by lowering both rotational speed and TIT, to prevent temperature increase in the combustion gases at the recuperator inlet [38]. Accordingly, simulations at part-load were repeated using the same levels of rotational speed as Section 4.2, but with decreasing TIT as Pel reduces. TIT values, being determined in such a way that TOT exceeds the design value by 10 °C at the worst, are equal to 920, 895, and 870 °C at 80, 60, and 40 kW of power, respectively. Results shown in Figure 11 allow a direct comparison between NG and NH3, used as pure fuel. At first glance, the part-load strategy has a marginal effect on MGT performance, thereby confirming the results presented in Section 4.2: although NH3 may lower ηel by 0.5 pp, ηtot is not less than that with NG thanks to enhanced heat recovery. However, at Pel < 60 kW, there is a slightly more marked drop in ηel when TIT is lowered with load, whatever the fuel. Since a decrease in ηel contributes to the heat output, but in practice Pth falls at part-load because of reduced mexh, the decay in ηtot at de-rated conditions is roughly the same, regardless of fuel type and part-load control.

5. Conclusions

Within the context of distributed generation, MGT is an attractive prime mover fed by a relatively clean fossil fuel such as NG. However, in fulfilling the goal of carbon neutrality, carbon-free fuels such as ammonia have gained increased interest as they can be used as energy carriers in a circular carbon economy.
In this study, a modeling procedure was developed, tested, and used to predict the performance of a MGT flexible in operation, in terms of load reduction and fuel switching. Model predictions of electric and thermal efficiency at non-ISO conditions and part-load were validated against data sources, using NG as fuel. Further verification, to ensure that the model replicates experiments satisfactorily, included adoption of syngas as the fuel, at a rated speed. Steady-state simulations were then run for evaluating the impact of ammonia combustion on MGT thermodynamic behavior. Substantial changes, with respect to the conventional fuel, can be summarized as follows:
  • At the same MGT power output, compressor–turbine matching in a single-shaft arrangement results in lower flow rates of air and flue gas, despite the increase in the fuel amount due to reduced LHV.
  • The compressor operating point moves towards lower CF and slightly higher βc; the turbine is affected by a small increase in βt and FF. Isentropic efficiency varies within 1.6 pp.
  • Although ηel is lowered by about 0.5 pp, ηtot shall remain unaffected thanks to enhanced heat recovery. This applies to the entire load range, from 100 to 40%, whatever the part-load strategy (i.e., keeping TIT/TOT constant).
  • CO2 content in flue gas may be reduced down to zero, offset by H2O.
In conclusion, there are no disadvantages of burning ammonia in a MGT for CHP applications, although adjustment of the turbomachinery operating point is required. However, NOx emissions are relatively high in practical combustion; therefore, selective catalytic reduction systems may be installed to reduce stack NOx concentration. Finally, the scale of facilities in experimental research fits well with MGT; thus, enabling advancements in burner technology.

Author Contributions

Conceptualization, S.R.; methodology and software, V.B. and S.R.; validation and simulation, V.B.; writing—original draft preparation, S.R. and V.B.; writing—review and editing, S.R.; supervision, S.R. All authors have read and agreed to the published version of the manuscript.

Funding

This research received no external funding.

Institutional Review Board Statement

Not applicable.

Informed Consent Statement

Not applicable.

Data Availability Statement

Not applicable.

Conflicts of Interest

The authors declare no conflict of interest.

Abbreviations

CDimensional constant
CFCompressor corrected flow
CHPCombined heat and power
CSCorrected speed
DMEDimethyl ether
FFTurbine inlet flow function
GTGas turbine
LHVLower heating value
mMass flow rate
MGTMicro gas turbine
MWMolecular weight
nRotational speed
NGNatural gas
PPower
pPressure
ppPercentage points
RGas constant
RHERecovery heat exchanger
TTemperature
TFXThermoflex predictions
TITTurbine inlet temperature
TOTTurbine outlet temperature
yAmmonia blending ratio
βPressure ratio
γRatio of specific heat
ηEfficiency
Subscripts
aair
ambambient
ccompressor
elelectric
exhexhaust
expexpansion
fuelfuel input
ininlet
isisentropic
outoutlet
refreference
tturbine
tottotal
ypolytropic

Appendix A

Figure A1. Performance maps of: (a) compressor; (b) turbine adapted from [33].
Energies 15 03874 g0a1

References

  1. Abdalla, A.M.; Hossain, S.; Nisfindy, O.B.; Azad, A.T.; Dawood, M.; Azad, A.K. Hydrogen production, storage, transportation and key challenges with applications: A review. Energy Convers. Manag. 2018, 165, 602–627. [Google Scholar] [CrossRef]
  2. IRENA. Green Hydrogen Cost Reduction: Scaling up Electrolysers to Meet the 1.5 °C Climate Goal; International Renewable Energy Agency: Abu Dhabi, United Arab Emirates, 2020. [Google Scholar]
  3. Andersson, J.; Grönkvist, S. Large-scale storage of hydrogen. Int. J. Hydrog. Energy 2019, 44, 11901–11919. [Google Scholar] [CrossRef]
  4. Kurtz, J.; Sprik, S.; Bradley, T.H. Review of transportation hydrogen infrastructure performance and reliability. Int. J. Hydrog. Energy 2019, 44, 12010–12023. [Google Scholar] [CrossRef]
  5. Hassan, I.A.; Ramadan, H.S.; Saleh, M.A.; Hissel, D. Hydrogen storage technologies for stationary and mobile applications: Review, analysis and perspectives. Renew. Sust. Energ. Rev. 2021, 149, 111311. [Google Scholar] [CrossRef]
  6. Searle, S.; Christensen, A. Decarbonization Potential of Electrofuels in the European Union; The International Council on Clean Transportation: Washington, DC, USA, 2018. [Google Scholar]
  7. Aziz, M.; Wijayanta, A.T.; Nandiyanto, A.B.D. Ammonia as effective hydrogen storage: A review on production, storage and utilization. Energies 2020, 13, 3062. [Google Scholar] [CrossRef]
  8. Yüzbaşıoğlu, A.E.; Tatarhan, A.H.; Gezerman, A.O. Decarbonization in ammonia production, new technological methods in industrial scale ammonia production and critical evaluations. Heliyon 2021, 7, e08257. [Google Scholar] [CrossRef]
  9. Brown, T. Ammonia: Zero-Carbon Fertiliser, Fuel and Energy Store. Available online: https://royalsociety.org/-/media/policy/projects/green-ammonia/green-ammonia-policy-briefing.pdf (accessed on 8 April 2022).
  10. Wan, Z.; Tao, Y.; Shao, J.; Zhang, Y.; You, H. Ammonia as an effective hydrogen carrier and a clean fuel for solid oxide fuel cells. Energy Convers. Manag. 2021, 228, 113729. [Google Scholar] [CrossRef]
  11. Kobayashi, H.; Hayakawa, A.; Somarathne, K.K.A.; Okafor, E.C. Science and technology of ammonia combustion. Proc. Combust. Inst. 2019, 37, 109–133. [Google Scholar] [CrossRef]
  12. Valera-Medina, A.; Xiao, H.; Owen-Jones, M.; David, W.I.; Bowen, P.J. Ammonia for power. Prog. Energy Combust. Sci. 2018, 69, 63–102. [Google Scholar] [CrossRef]
  13. Xu, X.; Liu, E.; Zhu, N.; Liu, F.; Qian, F. Review of the Current Status of Ammonia-Blended Hydrogen Fuel Engine Development. Energies 2022, 15, 1023. [Google Scholar] [CrossRef]
  14. Karabeyoglu, A.; Evans, B. Selection of NH3 for Gas Turbine Use. In Proceedings of the 8th NH3 Conference, Portland, OR, USA, 19 September 2011. [Google Scholar]
  15. Kurata, O.; Iki, N.; Matsunuma, T.; Inoue, T.; Tsujimura, T.; Furutani, H.; Kobayashi, H.; Hayakawa, A. Performances and emission characteristics of NH3–air and NH3CH4–air combustion gas-turbine power generations. Proc. Combust Inst. 2017, 36, 3351–3359. [Google Scholar] [CrossRef]
  16. Kurata, O.; Iki, N.; Matsunuma, T.; Inoue, T.; Tsujimura, T.; Furutani, H.; Hayakawa, A.; Kobayashi, H. Success of Ammonia-fired, Regenerator-Heated, Diffusion Combustion Gas Turbine Power Generation and Prospect of Low NOx Combustion with High Combustion Efficiency. In Proceedings of the ASME 2017 Power Conference Joint with ICOPE-17, Charlotte, NC, USA, 26–30 June 2017. [Google Scholar]
  17. Iki, N.; Kurata, O.; Matsunuma, T.; Inoue, T.; Tsujimura, T.; Furutani, H.; Kobayashi, H.; Hayakawa, A. Operation and Flame Observation of Micro Gas Turbine Firing Ammonia. In Proceedings of the ASME Turbo Expo 2017: Turbomachinery Technical Conference and Exposition, Charlotte, NC, USA, 26–30 June 2017. [Google Scholar]
  18. Pugh, D.; Bowen, P.; Valera-Medina, A.; Giles, A.; Runyon, J.; Marsh, R. Influence of steam addition and elevated ambient conditions on NOx reduction in a staged premixed swirling NH3/H2 flame. Proc. Combust. Inst. 2019, 37, 5401–5409. [Google Scholar] [CrossRef]
  19. Pugh, D.; Valera-Medina, A.; Bowen, P.; Giles, A.; Goktepe, B.; Runyon, R.; Morris, S.; Hewlett, S.; Marsh, R. Emissions performance of staged premixed and diffusion combustor concepts for an NH3/air flame with and without reactant humidification. J. Eng. Gas Turbines Power 2021, 143, 051012. [Google Scholar] [CrossRef]
  20. Božo, M.G.; Vigueras-Zuniga, M.O.; Buffi, M.; Seljak, T.; Valera-Medina, A. Fuel rich ammonia-hydrogen injection for humidified gas turbines. Appl. Energy 2019, 251, 113334. [Google Scholar] [CrossRef]
  21. Ditaranto, M.; Saanum, I.; Larfeldt, J. Experimental Study on High Pressure Combustion of Decomposed Ammonia: How Can Ammonia Be Best Used in a Gas Turbine? In Proceedings of the ASME Turbo Expo 2021: Turbomachinery Technical Conference and Exposition, Virtual, 7–11 June 2021.
  22. Han, X.; Wang, Z.; Costa, M.; Sun, Z.; He, Y.; Cen, K. Experimental and kinetic modeling study of laminar burning velocities of NH3/air, NH3/H2/air, NH3/CO/air and NH3/CH4/air premixed flames. Combust. Flame 2019, 206, 214–226. [Google Scholar] [CrossRef]
  23. Okafor, E.C.; Naito, Y.; Colson, S.; Ichikawa, A.; Kudo, T.; Hayakawa, A.; Kobayashi, H. Experimental and numerical study of the laminar burning velocity of CH4–NH3–air premixed flames. Combust. Flame 2018, 187, 185–198. [Google Scholar] [CrossRef]
  24. Wang, S.; Wang, Z.; Elbaz, A.M.; Han, X.; He, Y.; Costa, M.; Konnov, A.A.; Roberts, W.L. Experimental study and kinetic analysis of the laminar burning velocity of NH3/syngas/air, NH3/CO/air and NH3/H2/air premixed flames at elevated pressures. Combust. Flame 2020, 221, 270–287. [Google Scholar] [CrossRef]
  25. Yin, G.; Li, J.; Zhou, M.; Li, J.; Wang, C.; Hu, E.; Huang, Z. Experimental and kinetic study on laminar flame speeds of ammonia/dimethyl ether/air under high temperature and elevated pressure. Combust. Flame 2022, 238, 111915. [Google Scholar] [CrossRef]
  26. Chiong, M.C.; Chong, C.T.; Ng, J.H.; Mashruk, S.; Chong, W.W.F.; Samiran, N.A.; Mong, G.R.; Valera-Medina, A. Advancements of combustion technologies in the ammonia-fuelled engines. Energy Convers. Manag. 2021, 244, 114460. [Google Scholar] [CrossRef]
  27. Keller, M.; Koshi, M.; Otomo, J.; Iwasaki, H.; Mitsumori, T.; Yamada, K. Thermodynamic evaluation of an ammonia-fueled combined-cycle gas turbine process operated under fuel-rich conditions. Energy 2020, 194, 116894. [Google Scholar] [CrossRef]
  28. Božo, M.G.; Valera-Medina, A. Prediction of novel humified gas turbine cycle parameters for ammonia/hydrogen fuels. Energies 2020, 13, 5749. [Google Scholar] [CrossRef]
  29. Ayaz, S.K.; Altuntas, O.; Caliskan, H. Effect of ammonia fuel fraction on the exergetic performance of a gas turbine. Energy Procedia 2018, 144, 150–156. [Google Scholar] [CrossRef]
  30. Hampel, C.A.; Braun, R.J. Off-design modeling of a microturbine combined heat & power system. Appl. Therm. Eng. 2022, 202, 117670. [Google Scholar]
  31. Reale, F.; Sannino, R. Numerical Modeling of Energy Systems Based on Micro Gas Turbine: A Review. Energies 2022, 15, 900. [Google Scholar] [CrossRef]
  32. Technical description-T100 NG. D 14127-03 Version 3 09/12/29, Copyright © 2009 Turbec Spa. Available online: www.turbec.com (accessed on 5 January 2010).
  33. Caresana, F.; Pelagalli, L.; Comodi, G.; Renzi, M. Microturbogas cogeneration systems for distributed generation: Effects of ambient temperature on global performance and components’ behavior. Appl. Energy 2014, 124, 17–27. [Google Scholar] [CrossRef]
  34. Deployment of FlexCHP System. Available online: https://www.osti.gov/servlets/purl/1238362 (accessed on 20 April 2022).
  35. Renzi, M.; Patuzzi, F.; Baratieri, M. Syngas feed of micro gas turbines with steam injection: Effects on performance, combustion and pollutants formation. Appl. Energy 2017, 206, 697–707. [Google Scholar] [CrossRef]
  36. Ito, S.; Uchida, M.; Suda, T.; Fujimori, T. Development of ammonia gas turbine co-generation technology. IHI Eng. Rev. 2020, 53, 1–6. [Google Scholar]
  37. Bull, M.G. Development of an Ammonia-Burning Gas Turbine Engine; Solar Turbines International: San Diego, CA, USA, 1968. [Google Scholar]
  38. Backman, J.L.H.; Kaikko, J. Microturbine Systems for Small Combined Heat and Power (CHP) Applications. In Small and Micro Combined Heat and Power (CHP) Systems; Woodhead Publishing: Sawston, UK, 2011; pp. 147–178. [Google Scholar]
Figure 1. Layout of the micro gas turbine system.
Energies 15 03874 g001
Figure 3. Effects of ambient temperature on performance maps of: (a) compressor; (b) turbine.
Energies 15 03874 g003
Figure 4. Model validation: effects of part-load operation at non-ISO conditions: (a) Tamb = 8 °C; (b) Tamb = 30 °C [33].
Energies 15 03874 g004
Figure 5. Effects of syngas feeding at rated speed on performance maps of: (a) compressor; (b) turbine.
Energies 15 03874 g005
Figure 6. Effects of increasing ammonia blending ratio (yNH3) on: (a) mass flow rate of air, fuel, and flue gas; (b) compressor pressure ratio and turbine expansion ratio.
Energies 15 03874 g006
Figure 7. Effects of increasing ammonia blending ratio (yNH3) on: (a) fuel input and thermal power; (b) thermal end electric efficiency.
Energies 15 03874 g007
Figure 8. Effects of NH3 feeding, at different levels of power output, on performance maps of: (a) compressor; (b) turbine.
Energies 15 03874 g008
Figure 9. Effects of NH3 feeding, at different levels of power output, on isentropic efficiency of: (a) compressor; (b) turbine.
Energies 15 03874 g009
Figure 10. Effects of NH3 feeding, at different levels of power output, on: (a) electric efficiency; (b) thermal efficiency; (c) total efficiency; (d) CO2 emission intensity.
Energies 15 03874 g010
Figure 11. Effects of replacing NG with NH3, by varying part-load control strategy, on: (a) electric efficiency; (b) thermal efficiency.
Energies 15 03874 g011
Table 1. Normalized pressure loss at the design point.
ComponentΔp/p
Combustor0.08
Recuperator–air side0.03
Recuperator–exhaust side0.05
RHE–exhaust side0.05
RHE–water side1
Table 2. Design features of the compressor and turbine.
CompressorTurbine
Inlet temperatureK288.15Inlet temperatureK1223.15
Inlet pressure bar1.01Inlet pressure bar4.15
Outlet pressurebar4.56Outlet pressurebar1.014
Airflowkg/s0.7934Exhaust flowkg/s0.8
Corrected flow (CF)kg-mol/s0.0276Corrected flow (FF)m20.0017
Corrected speed (CS)rpm70,000Corrected speed (CS)rpm33,975
Pressure ratio (βc) 4.5Pressure ratio (βc) 4.09
Isentropic efficiency (ηis,c)%78.5Isentropic efficiency (ηis,t)%82.9
Polytropic efficiency (ηy,c)%82.5Polytropic efficiency (ηy,t)%80.3
Table 3. Model validation at nominal conditions.
ParameterDatasheet [32]ModelΔ (%)
Fuel LHV (MJ/kg)49.5650.0471.0
Fuel flow (kg/s)0.006720.00681.2
Turbine inlet temperature (°C)9509500
Turbine outlet temperature (°C)650652.90.4
Fuel input (kW)333338.11.5
Exhaust gas flow (kg/s)0.80.80
Rotational speed (rpm)70,00070,0000
Heat exchanger–inlet exhaust gas temperature (°C)2702700
Heat exchanger–outlet exhaust gas temperature (°C)70700
Heat exchanger–inlet water temperature (°C)50500
Heat exchanger–outlet water temperature (°C)70700
Thermal power (kW)165165.70.4
Electric power (kW)100101.91.9
Electric efficiency (%)3030.140.5
Total efficiency (%)8079.1−1.1
Table 4. Model validation with syngas feeding at the rated speed.
ParameterReference [35]ModelΔ (%)
Syngas flow (kg/s)0.04050.0386−4.7
Air flow (kg/s)0.770.77380.5
Exhaust flow (kg/s)0.820.8123−0.9
Compressor power (kW)156.9155.9−0.6
Compressor outlet temperature (°C)212.2212.60.2
Pressure ratio (βc)4.554.621.5
Isentropic compressor efficiency (ηis,c)0.7880.7910.4
Turbine power (kW)294.7281.6−4.4
Expansion ratio (βexp)4.144.262.9
Isentropic turbine efficiency (ηis,t)0.8270.812−1.8
Publisher’s Note: MDPI stays neutral with regard to jurisdictional claims in published maps and institutional affiliations.

