
Inequalities in Regional Level Domestic CO2 Emissions and Energy Use: A Case Study of Iran


Abstract
:1. Introduction
Literature Review
2. Materials and Methods
2.1. Kaya Factors
2.2. Study Area
2.3. Data Analysis
3. Results
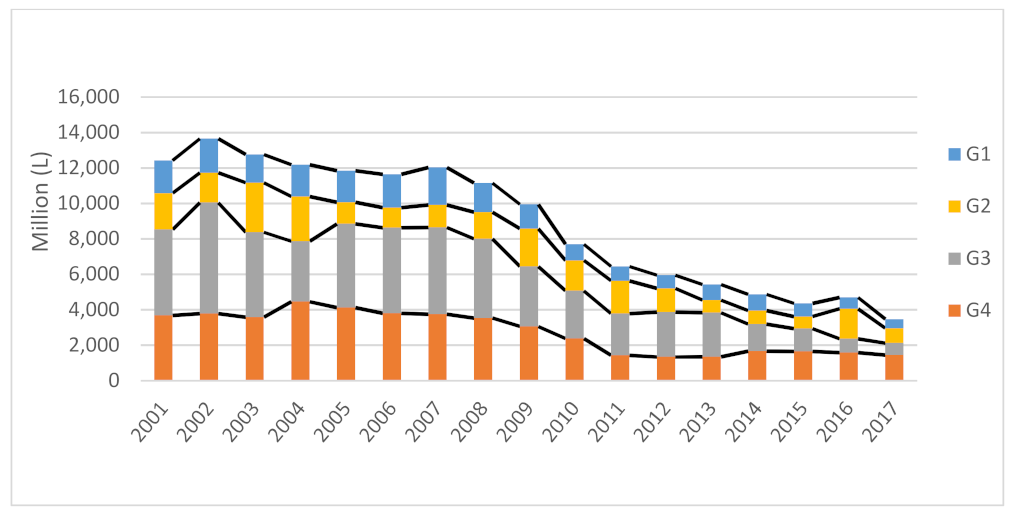
3.1. Descriptive Results
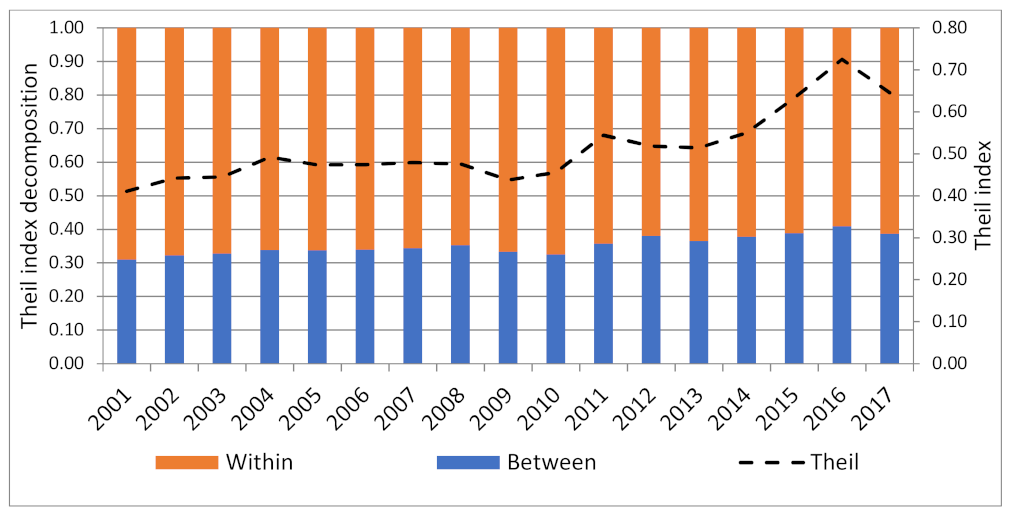
3.2. Analytic Results
3.3. Kaya Factor
4. Discussion
5. Conclusions
Author Contributions
Funding
Institutional Review Board Statement
Informed Consent Statement
Data Availability Statement
Acknowledgments
Conflicts of Interest
Appendix A

| Province | 2001 | 2002 | 2003 | 2004 | 2005 | 2006 | 2007 | 2008 | 2009 | 2010 | 2011 | 2012 | 2013 | 2014 | 2015 | 2016 | 2017 |
|---|---|---|---|---|---|---|---|---|---|---|---|---|---|---|---|---|---|
| AZ1 * | I3 | I3 | I3 | I3 | I3 | I3 | I3 | I3 | I3 | I2 | I2 | I3 | I2 | I2 | I2 | I2 | I2 |
| AZ2 * | I2 | I2 | I2 | I1 | I1 | I1 | I1 | I1 | I2 | I1 | I2 | I2 | I2 | I2 | I2 | I2 | I2 |
| Ardabil | I1 | I1 | I1 | I1 | I1 | I1 | I1 | I1 | I1 | I1 | I1 | I1 | I1 | I1 | I1 | I1 | I1 |
| Esfahan | I3 | I3 | I3 | I3 | I3 | I3 | I3 | I3 | I3 | I3 | I3 | I3 | I3 | I3 | I3 | I3 | I3 |
| Ilam | I1 | I1 | I1 | I1 | I1 | I1 | I1 | I1 | I1 | I1 | I1 | I1 | I1 | I1 | I1 | I1 | I1 |
| Bushehr * | I1 | I1 | I2 | I2 | I2 | I2 | I2 | I2 | I2 | I2 | I2 | I3 | I3 | I3 | I3 | I3 | I3 |
| Tehran | I4 | I4 | I4 | I4 | I4 | I4 | I4 | I4 | I4 | I4 | I4 | I4 | I4 | I4 | I4 | I4 | I4 |
| Chaharmahal | I1 | I1 | I1 | I1 | I1 | I1 | I1 | I1 | I1 | I1 | I1 | I1 | I1 | I1 | I1 | I1 | I1 |
| Khorasan | I3 | I3 | I3 | I3 | I3 | I3 | I3 | I3 | I3 | I3 | I3 | I3 | I3 | I3 | I3 | I3 | I3 |
| Khozestan * | I3 | I4 | I3 | I4 | I4 | I4 | I4 | I3 | I3 | I3 | I3 | I3 | I3 | I3 | I3 | I3 | I3 |
| Zanjan | I1 | I1 | I1 | I1 | I1 | I1 | I1 | I1 | I1 | I1 | I1 | I1 | I1 | I1 | I1 | I1 | I1 |
| Semnan | I1 | I1 | I1 | I1 | I1 | I1 | I1 | I1 | I1 | I1 | I1 | I1 | I1 | I1 | I1 | I1 | I1 |
| Sistan | I1 | I1 | I1 | I1 | I1 | I1 | I1 | I1 | I1 | I1 | I1 | I1 | I1 | I1 | I1 | I1 | I1 |
| Fars | I3 | I3 | I3 | I3 | I3 | I3 | I3 | I3 | I3 | I3 | I3 | I3 | I3 | I3 | I3 | I3 | I3 |
| Iazvin | I1 | I1 | I1 | I1 | I1 | I1 | I1 | I1 | I1 | I1 | I1 | I1 | I1 | I1 | I1 | I1 | I1 |
| Iom | I1 | I1 | I1 | I1 | I1 | I1 | I1 | I1 | I1 | I1 | I1 | I1 | I1 | I1 | I1 | I1 | I1 |
| Kurdestan | I1 | I1 | I1 | I1 | I1 | I1 | I1 | I1 | I1 | I1 | I1 | I1 | I1 | I1 | I1 | I1 | I1 |
| Kerman | I2 | I2 | I2 | I2 | I2 | I2 | I2 | I2 | I2 | I2 | I2 | I2 | I2 | I2 | I2 | I2 | I2 |
| Kermanshah | I1 | I1 | I1 | I1 | I1 | I1 | I1 | I1 | I1 | I1 | I1 | I1 | I1 | I1 | I1 | I1 | I1 |
| Kohgiloyeh * | I3 | I3 | I3 | I3 | I3 | I3 | I2 | I2 | I2 | I2 | I2 | I1 | I1 | I1 | I1 | I1 | I1 |
| Golestan | I1 | I1 | I1 | I1 | I1 | I1 | I1 | I1 | I1 | I1 | I1 | I1 | I1 | I1 | I1 | I1 | I1 |
| Gilan | I2 | I2 | I2 | I2 | I2 | I2 | I2 | I2 | I2 | I2 | I1 | I2 | I2 | I2 | I2 | I2 | I2 |
| Lorestan | I1 | I1 | I1 | I1 | I1 | I1 | I1 | I1 | I1 | I1 | I1 | I1 | I1 | I1 | I1 | I1 | I1 |
| Mazandaran * | I3 | I3 | I3 | I2 | I2 | I2 | I2 | I3 | I3 | I3 | I2 | I3 | I3 | I2 | I3 | I3 | I3 |
| Markazi * | I2 | I2 | I2 | I2 | I1 | I2 | I1 | I1 | I1 | I1 | I1 | I2 | I2 | I2 | I2 | I2 | I2 |
| Hormozgan * | I1 | I1 | I1 | I2 | I1 | I1 | I1 | I1 | I1 | I1 | I2 | I2 | I2 | I2 | I2 | I2 | I2 |
| Hamedan | I1 | I1 | I1 | I1 | I1 | I1 | I1 | I1 | I1 | I1 | I1 | I1 | I1 | I1 | I1 | I1 | I1 |
| Yazd | I1 | I1 | I1 | I1 | I1 | I1 | I1 | I1 | I1 | I1 | I1 | I1 | I1 | I1 | I1 | I1 | I1 |
Appendix B
| Province | 2001 | 2002 | 2003 | 2004 | 2005 | 2006 | 2007 | 2008 | 2009 | 2010 | 2011 | 2012 | 2013 | 2014 | 2015 | 2016 | 2017 |
|---|---|---|---|---|---|---|---|---|---|---|---|---|---|---|---|---|---|
| AZ1 | P3 | P3 | P3 | P3 | P3 | P3 | P3 | P3 | P3 | P3 | P3 | P3 | P3 | P3 | P3 | P3 | P3 |
| AZ2 | P3 | P3 | P3 | P3 | P3 | P3 | P3 | P3 | P3 | P3 | P3 | P3 | P3 | P3 | P3 | P3 | P3 |
| Ardabil | P1 | P1 | P1 | P1 | P1 | P1 | P1 | P1 | P1 | P1 | P1 | P1 | P1 | P1 | P1 | P1 | P1 |
| Esfahan | P3 | P3 | P3 | P3 | P3 | P3 | P3 | P3 | P3 | P3 | P3 | P3 | P3 | P3 | P3 | P3 | P3 |
| Ilam | P1 | P1 | P1 | P1 | P1 | P1 | P1 | P1 | P1 | P1 | P1 | P1 | P1 | P1 | P1 | P1 | P1 |
| Bushehr | P1 | P1 | P1 | P1 | P1 | P1 | P1 | P1 | P1 | P1 | P1 | P1 | P1 | P1 | P1 | P1 | P1 |
| Tehran | P4 | P4 | P4 | P4 | P4 | P4 | P4 | P4 | P4 | P4 | P4 | P4 | P4 | P4 | P4 | P4 | P4 |
| Chaharmahal | P1 | P1 | P1 | P1 | P1 | P1 | P1 | P1 | P1 | P1 | P1 | P1 | P1 | P1 | P1 | P1 | P1 |
| Khorasan | P3 | P3 | P3 | P3 | P3 | P3 | P3 | P3 | P3 | P3 | P3 | P3 | P3 | P3 | P3 | P3 | P3 |
| Khozestan | P3 | P3 | P3 | P3 | P3 | P3 | P3 | P3 | P3 | P3 | P3 | P3 | P3 | P3 | P3 | P3 | P3 |
| Zanjan | P1 | P1 | P1 | P1 | P1 | P1 | P1 | P1 | P1 | P1 | P1 | P1 | P1 | P1 | P1 | P1 | P1 |
| Semnan | P1 | P1 | P1 | P1 | P1 | P1 | P1 | P1 | P1 | P1 | P1 | P1 | P1 | P1 | P1 | P1 | P1 |
| Sistan * | P2 | P2 | P2 | P2 | P2 | P2 | P2 | P2 | P2 | P2 | P2 | P2 | P2 | P2 | P2 | P3 | P2 |
| Fars | P3 | P3 | P3 | P3 | P3 | P3 | P3 | P3 | P3 | P3 | P3 | P3 | P3 | P3 | P3 | P3 | P3 |
| Pazvin | P1 | P1 | P1 | P1 | P1 | P1 | P1 | P1 | P1 | P1 | P1 | P1 | P1 | P1 | P1 | P1 | P1 |
| Pom | P1 | P1 | P1 | P1 | P1 | P1 | P1 | P1 | P1 | P1 | P1 | P1 | P1 | P1 | P1 | P1 | P1 |
| Kurdestan | P1 | P1 | P1 | P1 | P1 | P1 | P1 | P1 | P1 | P1 | P1 | P1 | P1 | P1 | P1 | P1 | P1 |
| Kerman * | P2 | P3 | P3 | P3 | P3 | P3 | P3 | P3 | P3 | P3 | P3 | P3 | P3 | P3 | P3 | P3 | P3 |
| Kermanshah | P2 | P2 | P2 | P2 | P2 | P2 | P2 | P2 | P2 | P2 | P2 | P2 | P2 | P2 | P2 | P2 | P2 |
| Kohgiloyeh | P1 | P1 | P1 | P1 | P1 | P1 | P1 | P1 | P1 | P1 | P1 | P1 | P1 | P1 | P1 | P1 | P1 |
| Golestan | P2 | P2 | P2 | P2 | P2 | P2 | P2 | P2 | P2 | P2 | P2 | P2 | P2 | P2 | P2 | P2 | P2 |
| Gilan | P2 | P2 | P2 | P2 | P2 | P2 | P2 | P2 | P2 | P2 | P2 | P2 | P2 | P2 | P2 | P2 | P2 |
| Lorestan | P2 | P2 | P2 | P2 | P2 | P2 | P2 | P2 | P2 | P2 | P2 | P2 | P2 | P2 | P2 | P2 | P2 |
| Mazandaran | P3 | P3 | P3 | P3 | P3 | P3 | P3 | P3 | P3 | P3 | P3 | P3 | P3 | P3 | P3 | P3 | P3 |
| Markazi | P1 | P1 | P1 | P1 | P1 | P1 | P1 | P1 | P1 | P1 | P1 | P1 | P1 | P1 | P1 | P1 | P1 |
| Hormozgan * | P1 | P1 | P1 | P2 | P1 | P1 | P1 | P1 | P1 | P1 | P1 | P1 | P1 | P1 | P2 | P2 | P2 |
| Hamedan | P2 | P2 | P2 | P2 | P2 | P2 | P2 | P2 | P2 | P2 | P2 | P2 | P2 | P2 | P2 | P2 | P2 |
| Yazd | P1 | P1 | P1 | P1 | P1 | P1 | P1 | P1 | P1 | P1 | P1 | P1 | P1 | P1 | P1 | P1 | P1 |
Appendix C
| Year | Group 1 Range | Group 2 Range | Group 3 Range | Group 4 Range |
|---|---|---|---|---|
| 2001 | 516,951–1,424,571 | 1,424,571–2,332,190 | 2,332,190–7,113,070 | 7,113,070–11,893,950 |
| 2002 | 522,364–1,445,118 | 1,445,118–2,367,872 | 2,367,872–7,281,506 | 7,281,506–12,195,139 |
| 2003 | 527,921–1,466,015 | 1466,015–2,404,109 | 2,404,109–7,450,882 | 7,450,882–12,497,654 |
| 2004 | 533,611–1,487,247 | 1,487,247–2,440,883 | 2,440,883–7,621,573 | 7,621,573–12,802,263 |
| 2005 | 539,459–1,508,844 | 1,508,844–2,478,229 | 2,478,229–7,792,760 | 7,792,760–13,107,290 |
| 2006 | 545,787–1,531,747 | 1,531,747–2,517,707 | 2,517,707–7,970,037 | 7,970,037–13,422,366 |
| 2007 | 547,923–1,548,358 | 1,548,358–2,548,793 | 2,548,793–8,097,648 | 8,097,648–13,646,502 |
| 2008 | 550,171–1,565,554 | 1,565,554–2,580,936 | 2,580,936–8,228,368 | 8,228,368–13,875,800 |
| 2009 | 552,533–1,583,346 | 1,583,346–2,614,158 | 2,614,158–8,362,270 | 8,362,270–14,110,382 |
| 2010 | 555,009–1,601,744 | 1,601,744–2,648,478 | 2,648,478–8,499,426 | 8,499,426–14,350,374 |
| 2011 | 557,599–1,620,758 | 1,620,758–2,683,917 | 2,683,917–8,639,911 | 8,639,911–14,595,904 |
| 2012 | 563,000–1,639,357 | 1,639,357–2,715,714 | 2,715,714–8,740,357 | 8,740,357–14,765,000 |
| 2013 | 569,000–1,658,447 | 1,658,447–2,747,893 | 2,747,893–8,841,447 | 8,841,447–14,935,000 |
| 2014 | 575,000–1,677,804 | 1,677,804–2,780,607 | 2,780,607–8,943,804 | 8,943,804–15,107,000 |
| 2015 | 581,000–1,697,197 | 1,697,197–2,813,393 | 2,813,393–9,045,697 | 9,045,697–15,278,000 |
| 2016 | 587,000–1,716,482 | 1,716,482–2,845,964 | 2,845,964–9,147,982 | 9,147,982–15,450,000 |
| 2017 | 586,000–1,740,661 | 1,740,661–2,895,321 | 2,895,321–9,561,161 | 9,561,161–16,227,000 |
Appendix D
| Year | Group 1 Range | Group 2 Range | Group 3 Range | Group 4 Range |
|---|---|---|---|---|
| 2001 | 43–136 | 136–230 | 230–984 | 984–1739 |
| 2002 | 37–143 | 143–249 | 249–1055 | 1055–1861 |
| 2003 | 38–150 | 150–261 | 261–1126 | 1126–1990 |
| 2004 | 48–168 | 168–289 | 289–1208 | 1208–2127 |
| 2005 | 57–188 | 188–320 | 320–1323 | 1323–2326 |
| 2006 | 63–205 | 205–347 | 347–1451 | 1451–2555 |
| 2007 | 66–215 | 215–364 | 364–1532 | 1532–2701 |
| 2008 | 65–203 | 203–341 | 341–1534 | 1534–2726 |
| 2009 | 66–197 | 197–327 | 327–1542 | 1542–2757 |
| 2010 | 74–225 | 225–376 | 376–1701 | 1701–3026 |
| 2011 | 84–250 | 250–416 | 416–1779 | 1779–3142 |
| 2012 | 95–268 | 268–441 | 441–1942 | 1942–3443 |
| 2013 | 98–299 | 299–501 | 501–2105 | 2105–3710 |
| 2014 | 96–293 | 293–490 | 490–2144 | 2144–3797 |
| 2015 | 76–226 | 226–377 | 377–1643 | 1643–2909 |
| 2016 | 74–223 | 223–371 | 371–1616 | 1616–2860 |
| 2017 | 74–221 | 221–368 | 368–1602 | 1602–2836 |
Appendix E
| Grouping Methodology | Variable | B W | 2001 | 2002 | 2003 | 2004 | 2005 | 2006 | 2007 | 2008 | 2009 |
|---|---|---|---|---|---|---|---|---|---|---|---|
| GDP | Oil products | B | 26.34 | 27.05 | 28.46 | 30.59 | 28.18 | 28.08 | 28.80 | 29.86 | 28.81 |
| W | 73.66 | 72.95 | 71.54 | 69.41 | 71.82 | 71.92 | 71.20 | 70.14 | 71.19 | ||
| Natural gas | B | 27.85 | 33.04 | 33.82 | 34.31 | 35.29 | 34.89 | 33.99 | 34.37 | 33.74 | |
| W | 72.15 | 66.96 | 66.18 | 65.69 | 64.71 | 65.11 | 66.01 | 65.63 | 66.26 | ||
| Electricity | B | 32.02 | 32.31 | 35.33 | 32.17 | 32.20 | 30.15 | 33.10 | 27.93 | 23.82 | |
| W | 67.98 | 67.69 | 64.67 | 67.83 | 67.80 | 69.85 | 66.90 | 72.07 | 76.18 | ||
| CO2 emissions | B | 42.06 | 42.14 | 44.01 | 42.49 | 42.63 | 40.80 | 40.64 | 39.82 | 38.98 | |
| W | 57.94 | 57.86 | 55.99 | 57.51 | 57.37 | 59.20 | 59.36 | 60.18 | 61.02 | ||
| Population | Oil products | B | 25.87 | 25.95 | 26.69 | 28.17 | 27.68 | 27.72 | 29.37 | 30.10 | 28.35 |
| W | 74.13 | 74.05 | 73.31 | 71.83 | 72.32 | 72.28 | 70.63 | 69.90 | 71.65 | ||
| Natural gas | B | 41.68 | 41.10 | 42.64 | 41.50 | 41.84 | 41.21 | 40.46 | 40.18 | 38.68 | |
| W | 58.32 | 58.90 | 57.36 | 58.50 | 58.16 | 58.79 | 59.54 | 59.82 | 61.32 | ||
| Electricity | B | 22.82 | 24.14 | 30.77 | 27.39 | 27.31 | 28.09 | 31.03 | 29.45 | 27.80 | |
| W | 77.18 | 75.86 | 69.23 | 72.61 | 72.69 | 71.91 | 68.97 | 70.55 | 72.20 | ||
| CO2 emissions | B | 41.63 | 41.05 | 42.60 | 41.46 | 41.80 | 41.16 | 40.42 | 40.13 | 38.64 | |
| W | 58.37 | 58.95 | 57.40 | 58.54 | 58.20 | 58.84 | 59.58 | 59.87 | 61.36 | ||
| Grouping Methodology | Variable | B W | 2010 | 2011 | 2012 | 2013 | 2014 | 2015 | 2016 | 2017 | |
| GDP | Oil products | B | 29.47 | 38.70 | 38.66 | 36.47 | 37.79 | 37.49 | 38.85 | 37.88 | |
| W | 70.53 | 61.30 | 61.34 | 63.53 | 62.21 | 62.51 | 61.15 | 62.12 | |||
| Natural gas | B | 32.43 | 46.40 | 51.06 | 48.01 | 50.84 | 53.85 | 60.77 | 57.42 | ||
| W | 67.57 | 53.60 | 48.94 | 51.99 | 49.16 | 46.15 | 39.23 | 42.58 | |||
| Electricity | B | 24.74 | 25.69 | 25.75 | 24.86 | 25.27 | 25.27 | 25.10 | 25.30 | ||
| W | 75.26 | 74.31 | 74.25 | 75.14 | 74.73 | 74.73 | 74.90 | 74.70 | |||
| CO2 emissions | B | 38.08 | 39.56 | 39.17 | 37.94 | 37.58 | 36.39 | 36.68 | 35.93 | ||
| W | 61.92 | 60.44 | 60.83 | 62.06 | 62.42 | 63.61 | 63.32 | 64.07 | |||
| Population | Oil products | B | 29.97 | 39.12 | 38.29 | 36.39 | 36.10 | 34.70 | 36.38 | 35.48 | |
| W | 70.03 | 60.88 | 61.71 | 63.61 | 63.90 | 65.30 | 63.62 | 64.52 | |||
| Natural gas | B | 38.18 | 39.00 | 39.00 | 37.53 | 37.24 | 36.79 | 36.31 | 35.69 | ||
| W | 61.82 | 61.00 | 61.00 | 62.47 | 62.76 | 63.21 | 63.69 | 64.31 | |||
| Electricity | B | 31.85 | 35.91 | 39.13 | 34.53 | 36.26 | 37.24 | 35.95 | 38.57 | ||
| W | 68.15 | 64.09 | 60.87 | 65.47 | 63.74 | 62.76 | 64.05 | 61.43 | |||
| CO2 emissions | B | 38.14 | 38.96 | 38.96 | 37.49 | 37.21 | 36.76 | 36.28 | 35.65 | ||
| W | 61.86 | 61.04 | 61.04 | 62.51 | 62.79 | 63.24 | 63.72 | 64.35 |
Appendix F
| Grouping Methodology | Variable | B W | 2001 | 2002 | 2003 | 2004 | 2005 | 2006 | 2007 | 2008 | 2009 |
|---|---|---|---|---|---|---|---|---|---|---|---|
| GDP | Oil products | B | 30.94 | 32.14 | 32.72 | 33.78 | 33.73 | 33.88 | 34.37 | 35.26 | 33.27 |
| W | 69.06 | 67.86 | 67.28 | 66.22 | 66.27 | 66.12 | 65.63 | 64.74 | 66.73 | ||
| Natural gas | B | 28.87 | 28.32 | 28.51 | 28.36 | 29.22 | 28.25 | 28.52 | 26.25 | 23.10 | |
| W | 71.13 | 71.68 | 71.49 | 71.64 | 70.78 | 71.75 | 71.48 | 73.75 | 76.90 | ||
| Electricity | B | 13.84 | 14.04 | 12.06 | 11.87 | 14.40 | 15.24 | 16.45 | 14.14 | 10.17 | |
| W | 14.04 | 85.96 | 87.94 | 88.13 | 85.60 | 84.76 | 83.55 | 85.86 | 89.83 | ||
| CO2 emissions | B | 28.84 | 28.30 | 28.48 | 28.33 | 29.19 | 28.23 | 28.50 | 26.22 | 23.08 | |
| W | 71.16 | 71.70 | 71.52 | 71.67 | 70.81 | 71.77 | 71.50 | 73.78 | 76.92 | ||
| Population | Oil products | B | 28.71 | 30.06 | 31.00 | 32.09 | 32.22 | 32.24 | 32.05 | 32.31 | 30.74 |
| W | 71.29 | 69.94 | 69.00 | 67.91 | 67.78 | 67.76 | 67.95 | 67.69 | 69.26 | ||
| Natural gas | B | 27.30 | 26.96 | 27.74 | 27.58 | 28.59 | 27.49 | 27.85 | 25.42 | 22.62 | |
| W | 72.70 | 73.04 | 72.26 | 72.42 | 71.41 | 72.51 | 72.15 | 74.58 | 77.38 | ||
| Electricity | B | 6.05 | 6.47 | 5.78 | 5.85 | 7.68 | 7.97 | 8.95 | 6.58 | 6.55 | |
| W | 93.95 | 93.53 | 94.22 | 94.15 | 92.32 | 92.03 | 91.05 | 93.42 | 93.45 | ||
| CO2 emissions | B | 47.46 | 45.25 | 44.39 | 44.20 | 45.39 | 43.88 | 43.05 | 43.19 | 30.02 | |
| W | 52.54 | 54.75 | 55.61 | 55.80 | 54.61 | 56.12 | 56.95 | 56.81 | 69.98 | ||
| Grouping Methodology | Variable | B W | 2010 | 2011 | 2012 | 2013 | 2014 | 2015 | 2016 | 2017 | |
| GDP | Oil products | B | 32.42 | 35.67 | 38.01 | 36.49 | 37.70 | 38.78 | 40.88 | 38.64 | |
| W | 67.58 | 64.33 | 61.99 | 63.51 | 62.30 | 61.22 | 59.12 | 61.36 | |||
| Natural gas | B | 25.50 | 26.48 | 22.63 | 24.05 | 23.17 | 23.68 | 24.36 | 23.55 | ||
| W | 74.50 | 73.52 | 77.37 | 75.95 | 76.83 | 76.32 | 75.64 | 76.45 | |||
| Electricity | B | 9.76 | 10.43 | 8.76 | 6.18 | 7.94 | 8.96 | 9.05 | 10.05 | ||
| W | 90.24 | 89.57 | 91.24 | 93.82 | 92.06 | 91.04 | 90.95 | 89.95 | |||
| CO2 emissions | B | 25.47 | 26.46 | 22.60 | 24.03 | 23.14 | 23.66 | 24.34 | 23.53 | ||
| W | 74.53 | 73.54 | 77.40 | 75.97 | 76.86 | 76.34 | 75.66 | 76.47 | |||
| Population | Oil products | B | 29.88 | 33.18 | 34.68 | 33.66 | 33.24 | 33.95 | 35.93 | 34.72 | |
| W | 70.12 | 66.82 | 65.32 | 66.34 | 66.76 | 66.05 | 64.07 | 65.28 | |||
| Natural gas | B | 24.93 | 25.67 | 21.56 | 22.72 | 21.81 | 22.51 | 23.21 | 22.30 | ||
| W | 75.07 | 74.33 | 78.44 | 77.28 | 78.19 | 77.49 | 76.79 | 77.70 | |||
| Electricity | B | 5.70 | 5.91 | 5.70 | 3.83 | 5.59 | 6.22 | 6.22 | 7.22 | ||
| W | 94.30 | 94.09 | 94.30 | 96.17 | 94.41 | 93.78 | 93.78 | 92.78 | |||
| CO2 emissions | B | 36.38 | 37.79 | 29.03 | 29.36 | 26.81 | 28.21 | 28.84 | 27.42 | ||
| W | 63.62 | 62.21 | 70.97 | 70.64 | 73.19 | 71.79 | 71.16 | 72.58 |
Appendix G
| Year | T Alpha | T Beta | T Gamma | Interaction (Alpha, Beta and Gamma) | Interaction (Beta and Gamma) | Theil |
|---|---|---|---|---|---|---|
| 2001 | 0.00 | 0.27 | 0.05 | 0.83731 | −0.00169 | 1.15808 |
| 2002 | 0.01 | 0.25 | 0.06 | 0.81280 | −0.00156 | 1.12649 |
| 2003 | 0.01 | 0.25 | 0.06 | 0.80891 | −0.00140 | 1.12494 |
| 2004 | 0.02 | 0.25 | 0.06 | 0.72089 | −0.00107 | 1.04674 |
| 2005 | 0.02 | 0.25 | 0.06 | 0.68401 | −0.00098 | 1.01992 |
| 2006 | 0.03 | 0.25 | 0.06 | 0.61896 | −0.00079 | 0.95554 |
| 2007 | 0.03 | 0.25 | 0.06 | 0.54738 | −0.00067 | 0.88948 |
| 2008 | 0.03 | 0.24 | 0.06 | 0.60659 | −0.00083 | 0.94220 |
| 2009 | 0.04 | 0.23 | 0.05 | 0.65882 | −0.00092 | 0.97065 |
| 2010 | 0.05 | 0.24 | 0.05 | 0.62863 | −0.00075 | 0.96446 |
| 2011 | 0.05 | 0.23 | 0.05 | 0.63826 | −0.00076 | 0.96243 |
| 2012 | 0.05 | 0.21 | 0.04 | 0.73598 | −0.00105 | 1.03937 |
| 2013 | 0.06 | 0.19 | 0.04 | 0.69662 | −0.00087 | 0.99061 |
| 2014 | 0.08 | 0.18 | 0.04 | 0.71980 | −0.00094 | 1.01192 |
| 2015 | 0.09 | 0.18 | 0.04 | 0.69728 | −0.00090 | 1.00013 |
| 2016 | 0.09 | 0.17 | 0.04 | 0.66221 | −0.00079 | 0.96952 |
| 2017 | 0.11 | 0.16 | 0.04 | 0.71914 | −0.00093 | 1.02058 |
References
- Demirbas, F.M.; Bozbas, K.; Balat, M. Carbon Dioxide emission trends and environmental problems in Turkey. Energy Explor. Exploit. 2004, 22, 355–366. [Google Scholar] [CrossRef]
- Perera, F. Pollution from fossil-fuel combustion is the leading environmental threat to global pediatric health and equity: Solutions exist. Int. J. Environ. Res. Public Health 2018, 15, 16. [Google Scholar] [CrossRef] [PubMed] [Green Version]
- Pakrooh, P.; Pishbahar, E. Forecasting air pollution concentration in Iran, using a hybrid model. Pollution 2019, 5, 739–747. [Google Scholar] [CrossRef]
- IPCC. Intergovernmental Panel on Climate Change. The Physical Science Basis. Contribution of Working Group I to the Fifth Assessment Report of the Intergovernmental Panel on Climate Change; IPCC: Geneva, Switzerland, 2007. [Google Scholar]
- Padilla, E.; Serrano, A. Inequality in CO2 emissions across countries and its relationship with income inequality: A distributive approach. Energy Policy 2006, 34, 1762–1772. [Google Scholar] [CrossRef] [Green Version]
- Heil, M.T.; Wodon, Q.T. Inequality in CO2 emissions between poor and rich countries. J. Environ. Dev. 1997, 6, 426–452. [Google Scholar] [CrossRef]
- Millimet, D.L.; Slottje, D. An environmental Paglin-Gini. Appl. Econ. Lett. 2002, 9, 271–274. [Google Scholar] [CrossRef]
- Hedenus, F.; Azar, C. Estimates of trends in global income and resource inequalities. Ecol. Econ. 2005, 55, 351–364. [Google Scholar] [CrossRef]
- Duro, J.A.; Padilla, E. Inequality across countries in energy intensities: An analysis of the role of energy transformation and final energy consumption. Energy Econ. 2011, 33, 474–479. [Google Scholar] [CrossRef] [Green Version]
- Cantore, N.; Padilla, E. Equality and CO2 emissions distribution in climate change integrated assessment modeling. Energy 2010, 35, 298–313. [Google Scholar] [CrossRef]
- Groot, L. Carbon lorenz curves. J. Resour. Energy Econ. 2010, 32, 45–64. [Google Scholar] [CrossRef]
- Smiech, S.; Papiez, M. Energy consumption and economic growth in the light of meeting the targets of energy policy in the EU: The bootstrap panel Granger causality approach. Energy Pol. 2014, 71, 118–129. [Google Scholar] [CrossRef]
- Cai, Y.; Sam, C.Y.; Chang, T. Nexus between clean energy consumption, economic growth and CO2 emissions. J. Clean. Prod. 2018, 182, 1001–1011. [Google Scholar] [CrossRef]
- Khan, M.I.; Teng, J.Z.; Khan, M.K. The impact of macroeconomic and financial development on carbon dioxide emissions in Pakistan: Evidence with a novel dynamic simulated ARDL approach. Environ. Sci. Pollut. Res. 2020, 27, 39560–39571. [Google Scholar] [CrossRef]
- Andreoni, V.; Galmarini, S. Drivers in CO2 emissions variation: A decomposition analysis for 33 world countries. Energy 2016, 103, 27–37. [Google Scholar] [CrossRef]
- Sohag, K.; Begum, R.A.; Syed Abdullah, S.M.; Jaafar, M. Dynamics of energy use, technological innovation, economic growth, and trade openness in Malaysia. Energy 2015, 90, 1497–1507. [Google Scholar] [CrossRef]
- Khan, M.K.; Teng, J.Z.; Khan, M.I. Effect of energy consumption and economic growth on carbon dioxide emissions in Pakistan with dynamic ARDL simulations approach. Environ. Sci. Pollut. Res. 2019, 26, 23480–23490. [Google Scholar] [CrossRef]
- Nussbaumer, P.; Nerini, F.F.; Onyeji, I.; Howells, M. Global Insights Based on the Multidimensional Energy Poverty Index (MEPI). Sustainability 2013, 5, 2060–2076. [Google Scholar] [CrossRef] [Green Version]
- Scarpellini, S.; Rivera-Torres, P.; Suárez-Perales, I.; Aranda-Usón, A. Analysis of energy poverty intensity from the perspective of the regional administration: Empirical evidence from households in southern Europe. Energy Policy 2015, 86, 729–738. [Google Scholar] [CrossRef] [Green Version]
- Jaffe, A.B.; Stavins, R.N. The energy-efficiency gap What does it mean? Energy Policy 1994, 22, 804–810. [Google Scholar] [CrossRef]
- Streimikiene, D.; Lekavičius, V.; Baležentis, T.; Kyriakopoulos, G.L.; Abrhám, J. Climate Change Mitigation Policies Targeting Households and Addressing Energy Poverty in European Union. Energies 2020, 13, 3389. [Google Scholar] [CrossRef]
- Zhang, Z. Meeting the Kyoto targets: The importance of developing country participation. J. Policy Model. 2004, 26, 3–19. [Google Scholar] [CrossRef] [Green Version]
- Energy Performance of Buildings. Available online: https://www.eceee.org/policy-areas/Buildings/ (accessed on 1 March 2021).
- Zhang, J.; Ma, L.; Li, J. Why Low-Carbon Publicity Effect Limits? The Role ofHeterogeneous Intention in ReducingHousehold Energy Consumption. Energies 2021, 14, 7634. [Google Scholar] [CrossRef]
- Kim, M.; Park, C. Academic Topics Related to Household Energy Consumption Using the Future Sign Detection Technique. Energies 2021, 14, 8446. [Google Scholar] [CrossRef]
- Yang, L.; Zhao, K.; Zhao, Y.; Zhong, M. Identifying Key Factors in Determining Disparities in Energy Consumption in China: A Household Level Analysis. Energies 2021, 14, 7149. [Google Scholar] [CrossRef]
- British Petroleum. BP Statistical Review of World Energy; British Petroleum PLC: London, UK, 2017. [Google Scholar]
- Enerdata. Global Energy Statistical Yearbook. 2017. Available online: https://yearbook.enerdata.net/total-energy/world-energy-intensity-gdp-data.html (accessed on 1 June 2017).
- Statistical Center of Iran. Annual GDP: Statistical Year Book; Statistical Center: Tehran, Iran, 2019. [Google Scholar]
- Soltani, M.; Rahmani, O.; Pour, A.B.; Ghaderpour, Y.; Ngah, I.; Misnan, S.H. Determinants of variation in household energy choice and consumption: Case from Mahabad City, Iran. Sustainability 2019, 11, 4775. [Google Scholar] [CrossRef] [Green Version]
- Soltani, M.; Rahmani, O.; Ghasimi, D.S.M.; Ghaderpour, Y.; Pour, A.B.; Misnan, S.H.; Ngah, I. Impact of household demographic characteristics on energy conservation and carbon dioxide emission: Case from Mahabad city, Iran. Energy 2020, 194, 116916. [Google Scholar] [CrossRef]
- Worldometer Iran CO2 Emissions. Available online: https://www.worldometers.info/co2-emissions/ (accessed on 1 January 2016).
- Ministry of Energy of Iran. Annuals Energy Balance Sheet (2001–2017), Energy Consumption and CO2 Emissions: Office of Planning and Macroeconomics of Electricity and Energy; Ministry of Energy of Iran: Tehran, Iran, 2019. [Google Scholar]
- Iran Energy Report. Available online: https://www.enerdata.net/estore/energy-market/iran/ (accessed on 1 January 2020).
- Borozan, D. Regional-level household energy consumption determinants: The European perspective. Renew. Sustain. Energy Rev. 2018, 90, 347–355. [Google Scholar] [CrossRef]
- Cowell, F. Measuring Inequality; Oxford University Press: London, UK, 2011; pp. 7–24. [Google Scholar]
- Wang, H.; Zhou, P. Assessing global CO2 emission inequality from consumption perspective: An index decomposition analysis. Ecol. Econ. 2018, 154, 257–271. [Google Scholar] [CrossRef]
- Bianco, V.; Cascetta, F.; Marino, A.; Nardini, S. Understanding energy consumption and carbon emissions in Europe: A focus on inequality issues. Energy 2019, 170, 120–130. [Google Scholar] [CrossRef]
- Remuzgo, L.; Sarabia, J.M. International inequality in CO2 emissions: A new factorial decomposition based on Kaya factors. Environ. Sci. Policy 2015, 54, 15–24. [Google Scholar] [CrossRef]
- Chen, L.; Xu, L.; Yang, Z. Inequality of industrial carbon emissions of the urban agglomeration and its peripheral cities: A case in the Pearl River Delta, China. Renew. Sustain. Energy Rev. 2019, 109, 438–447. [Google Scholar] [CrossRef]
- Hajilary, N.; Shahi, A.; Rezakazemi, M. Evaluation of socio-economic factors on CO2 emissions in Iran: Factorial design and multivariable methods. J. Clean. Prod. 2018, 189, 108–115. [Google Scholar] [CrossRef]
- Hafeznia, H.; Pourfayaz, F.; Maleki, A. An assessment of Iran’s natural gas potential for transition toward low-carbon economy. Renew. Sustain. Energy Rev. 2017, 79, 71–81. [Google Scholar] [CrossRef]
- Moshiri, S. The effects of the energy price reform on households consumption in Iran. Energy Policy 2015, 79, 177–188. [Google Scholar] [CrossRef]
- Araghi, M.K.; Barkhordari, S. An evaluation of the welfare effects of reducing energy subsides in Iran. Energy Policy 2012, 47, 398–404. [Google Scholar] [CrossRef]
- Hosseini, S.M.; Saifoddin, A.; Shirmohammadi, R.; Aslani, A. Forecasting of CO2 emissions in Iran based on time series and regression analysis. Energy Rep. 2019, 5, 619–631. [Google Scholar] [CrossRef]
- Rahmani, O.; Rezania, S.; Beiranvand Pour, A.; Aminpour, S.M.; Soltani, M.; Ghaderpour, Y.; Oryani, B. An overview of household energy consumption and carbon dioxide emissions in Iran. Processes 2020, 8, 994. [Google Scholar] [CrossRef]
- Pakrooh, P.; Hayati, B.; Pishbahar, E.; Nematian, J. Focus on the provincial inequalities in energy consumption and CO2 emissions of Iran’s agriculture sector. Sci. Total Environ. 2020, 715, 137029. [Google Scholar] [CrossRef]
- TUTBERIDZE, G.; PIPIA, Q.; Rakviashvili, G. The measuring of the Gini, Theil and Atkinson indices for Georgia Republic and some other countries. Glob. Bus. 2018, 5, 110–119. [Google Scholar]
- Salois, M.J. Regional changes in the distribution of foreign aid: An entropy approach. Phys. A Stat. Mech. Its Appl. 2013, 392, 2893–2902. [Google Scholar] [CrossRef]
- Bourguignon, F. Decomposable income inequality measure. Econometrica 1979, 47, 901–920. [Google Scholar] [CrossRef] [Green Version]
- Dh, S. An entropy approach to regional differences in carbon dioxide emissions: Implications for ethanol usage. Sustainability 2018, 10, 243. [Google Scholar] [CrossRef] [Green Version]
- Padilla, E.; Duro, J.A. Explanatory factors of CO2 per capita emission inequality in the European Union. Energy Policy 2013, 62, 1320–1328. [Google Scholar] [CrossRef] [Green Version]
- Alamdari, P.; Nematollahi, O.; Alemrajabi, A.A. Solar energy potentials in Iran: A review. Renew. Sustain. Energy Rev. 2013, 21, 778–788. [Google Scholar] [CrossRef]
- Barkhordar, Z.A. Evaluating the economy-wide effects of energy efficient lighting in the household sector of Iran. Energy Policy 2019, 127, 125–133. [Google Scholar] [CrossRef]


Publisher’s Note: MDPI stays neutral with regard to jurisdictional claims in published maps and institutional affiliations. |
© 2022 by the authors. Licensee MDPI, Basel, Switzerland. This article is an open access article distributed under the terms and conditions of the Creative Commons Attribution (CC BY) license (https://creativecommons.org/licenses/by/4.0/).
Share and Cite
Ata, B.; Pakrooh, P.; Barkat, A.; Benhizia, R.; Pénzes, J. Inequalities in Regional Level Domestic CO2 Emissions and Energy Use: A Case Study of Iran. Energies 2022, 15, 3902. https://doi.org/10.3390/en15113902
Ata B, Pakrooh P, Barkat A, Benhizia R, Pénzes J. Inequalities in Regional Level Domestic CO2 Emissions and Energy Use: A Case Study of Iran. Energies. 2022; 15(11):3902. https://doi.org/10.3390/en15113902
Chicago/Turabian StyleAta, Behnam, Parisa Pakrooh, Ayoub Barkat, Ramzi Benhizia, and János Pénzes. 2022. "Inequalities in Regional Level Domestic CO2 Emissions and Energy Use: A Case Study of Iran" Energies 15, no. 11: 3902. https://doi.org/10.3390/en15113902
APA StyleAta, B., Pakrooh, P., Barkat, A., Benhizia, R., & Pénzes, J. (2022). Inequalities in Regional Level Domestic CO2 Emissions and Energy Use: A Case Study of Iran. Energies, 15(11), 3902. https://doi.org/10.3390/en15113902