Abstract
Utilizing the flexibility of hydropower to integrate more intermittent renewable energy into the power grid requires hydro units to expand the operating range; this duty, however, requires a continuous improvement of their stability during part-load conditions. This study focuses on the stability performance of hydropower generation systems (HGS) during flexible operation. First, a dynamic model of HGS that reflects the characteristics of part-load conditions is established by introducing pressure pulsation in the draft tube. Second, the model of HGS is coupled with a shafting system to investigate the vibration property of the unit. Then, the validity of the coupling model is verified by comparing it with a traditional model and actual data. Finally, some possible ways to mitigate the instability caused by part-load operation are explored. The results show that part-load operation of the system is accompanied by significant dynamic response fluctuations (5%). Moreover, the interaction effect of multiple vibration sources and the vibration performance in a part-load condition are investigated. This paper is expected to provide support for improving the stability of HGS part-load operation and offer useful insights for exploiting the flexibility potential of HGS.
1. Introduction
To meet the goal of net zero emissions by 2050, nearly 90% of global power generation must come from renewable energy sources, with solar photovoltaic and wind energy together accounting for nearly 70% [1]. Large-scale grid connection of intermittent energy such as solar photovoltaic and wind energy will aggravate the frequency and amplitude of power fluctuation on the generation side, which requires that the power system provide a more flexible power supply to meet the stability requirements [2,3,4,5]. Hydropower generation systems (HGS) with rapid start–stop performance, excellent adjustability and stable output [6] have become an important option for improving operational flexibility. This improvement of flexibility requires the unit to operate in a wider range and switch between operating conditions more frequently, posing a challenge to the stability of the HGS.
The research on the flexible operational stability of HGS can be divided into two categories: (i) the stability on the transition process is an important guarantee for the safe start–stop and ramp of the HGS. This stimulates an interest in the investigating of transient processes, particularly large fluctuation transient processes [7]. For example, Chirag [8] investigated the inception, propagation and interaction of vortex rings during turbine load variations using a dynamic mesh approach. Zhang et al. [9] studied the unit-plant structure vibration during a transition process based on the hydraulic-mechanical-electrical-structural model. Lai et al. [10] constructed a refined nonlinear model for the transient process and quantitatively studied the effects of the rejection parameters on HGS. Riasi et al. [11] employed a characteristics method to study the dynamics of transient flow in the waterways of HGS and the effectiveness of the surge relief valves was substantiated. (ii) The stability of HGS operating at part-load condition is crucial to improving the flexibility and extending the scope of safe operation. Many scholars have studied the characteristics during part-load conditions [4,12,13,14]. For example, Pasche et al. [4] investigated the generation and propagation of synchronous pressure waves in Francis turbines during part-load conditions. Guo et al. [12] analyzed the dynamic characteristic under non-rated and rated conditions, but the selection of pressure pulsation amplitude and frequency was not combined with engineering practice. Silva et al. [13] studied the effects of pressure pulsations through a case study and evaluated the power swings through modal analysis. Altimemy et al. [14] conducted LES to characterize the spatial and temporal structure of turbulent flows while the unit operated at the design point and at part load. In summary, guaranteeing stability of HGS during part-load conditions and the transition process is an important task to integrate intermittent energy.
However, the continuous extension of the operating scope may lead to unstable vortex ropes inducing an efficiency drop, fluctuations of pressure and large vibrations of the unit and eventually endangering the structural integrity of the unit [15,16]. Previous research on part-load operation tends to focus on the evolution of the internal flow field, but research on the dynamic and vibration characteristics is lacking because it cannot model the interaction feature between the various subsystems of HGS [17,18,19,20]. The operation characteristics of the HGS is affected by three main factors, i.e., hydraulic factor, mechanical factor and electromagnetic factor [21]. Few studies have been conducted on the characteristics of HGS with the influence of multiple factors coupling, but this has an essential impact on the safe operation of the system.
Motivated by the above discussions, the innovations of this paper can be summarized as follows:
- The vortex rope in the draft tube as the main factor affecting unit stability is introduced into the HGS through screening the key factors affecting the stable operation during part-load conditions.
- Dynamic performance analysis of the HGS is conducted under different working conditions. The effects of hydraulic-mechanical-electromagnetic excitation interactions on the vibration performance of HGS are quantitatively evaluated.
- Key parameters affecting part-load stability and possible ways for mitigating vibration in part-load conditions are obtained to diminish the operating risk of HGS.
This paper is organized as follows: in Section 2, a nonlinear mathematical model of the HGS that can reflect the characteristics during part-load conditions is presented and validated. Section 3 analyzes the dynamic characteristics of the HGS operating at part-load conditions, and the vibration caused by the coupling of hydraulic-mechanical-electromagnetic excitations are investigated by using numerical experiments. Conclusions and Discussion are summarized in Section 4.
2. Model of Coupled Systems
2.1. Model of HTGS
Based on the accurate expression of the main influencing factors, a simplified nonlinear model of the HTGS was selected to reduce the complexity of the coupling system [22]. The block diagram of the HTGS is shown in Figure 1.
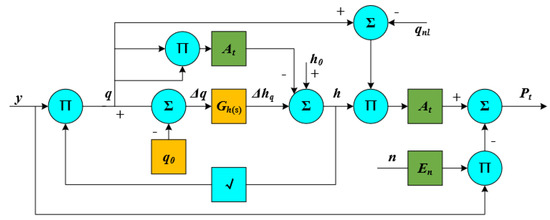
Figure 1.
Block diagram of HTGS.
2.1.1. Hydro-Turbine and Generator
The IEEE nonlinear model is selected as the hydraulic turbine model, and the first-order generator model is adopted [23]. According to Figure 1, the equations can be shown as:
2.1.2. Pipeline System
Both the water and the pipe wall have elasticity in engineering practice. The impact of this elastic effect on the hydropower system should be considered when the HTGS has a long water-diversion pipeline [24]. From Figure 1, the transfer function of the pipeline system considering hydraulic friction and elastic water hammer is:
Converting Equation (2) to a differential equation, the pipeline model can be expressed as [25]:
The corresponding state-space equations are:
where , , , , is the intermediate variable and .
2.1.3. Speed Regulation System
PID control systems are widely used in hydropower stations, which consist of a PID controller and a hydraulic servo system. Generally, the transfer function of PID control is:
The output signal of the governor control loop is:
where re is speed reference input. Select , when the generator speed reference input re is a constant. Then, Equation (6) can be written as:
Finally, the differential equation of the hydraulic servo system is [26]:
2.1.4. Model of Draft Tube Vortex
The HGS needs to operate at part-load conditions to adapt to the changing demand of the power system and the vortex rope usually occurs during these conditions [27,28]. This phenomenon can lead to the propagation of low-frequency pressure fluctuations, power swings, efficiency drop and damage to components [29]. The model of HGS that can accurately reflect the dynamic characteristics in part-load conditions is still very rudimentary. In this part, an HGS model that can reflect the dynamic characteristics of part-load conditions is established by introducing pressure fluctuations.
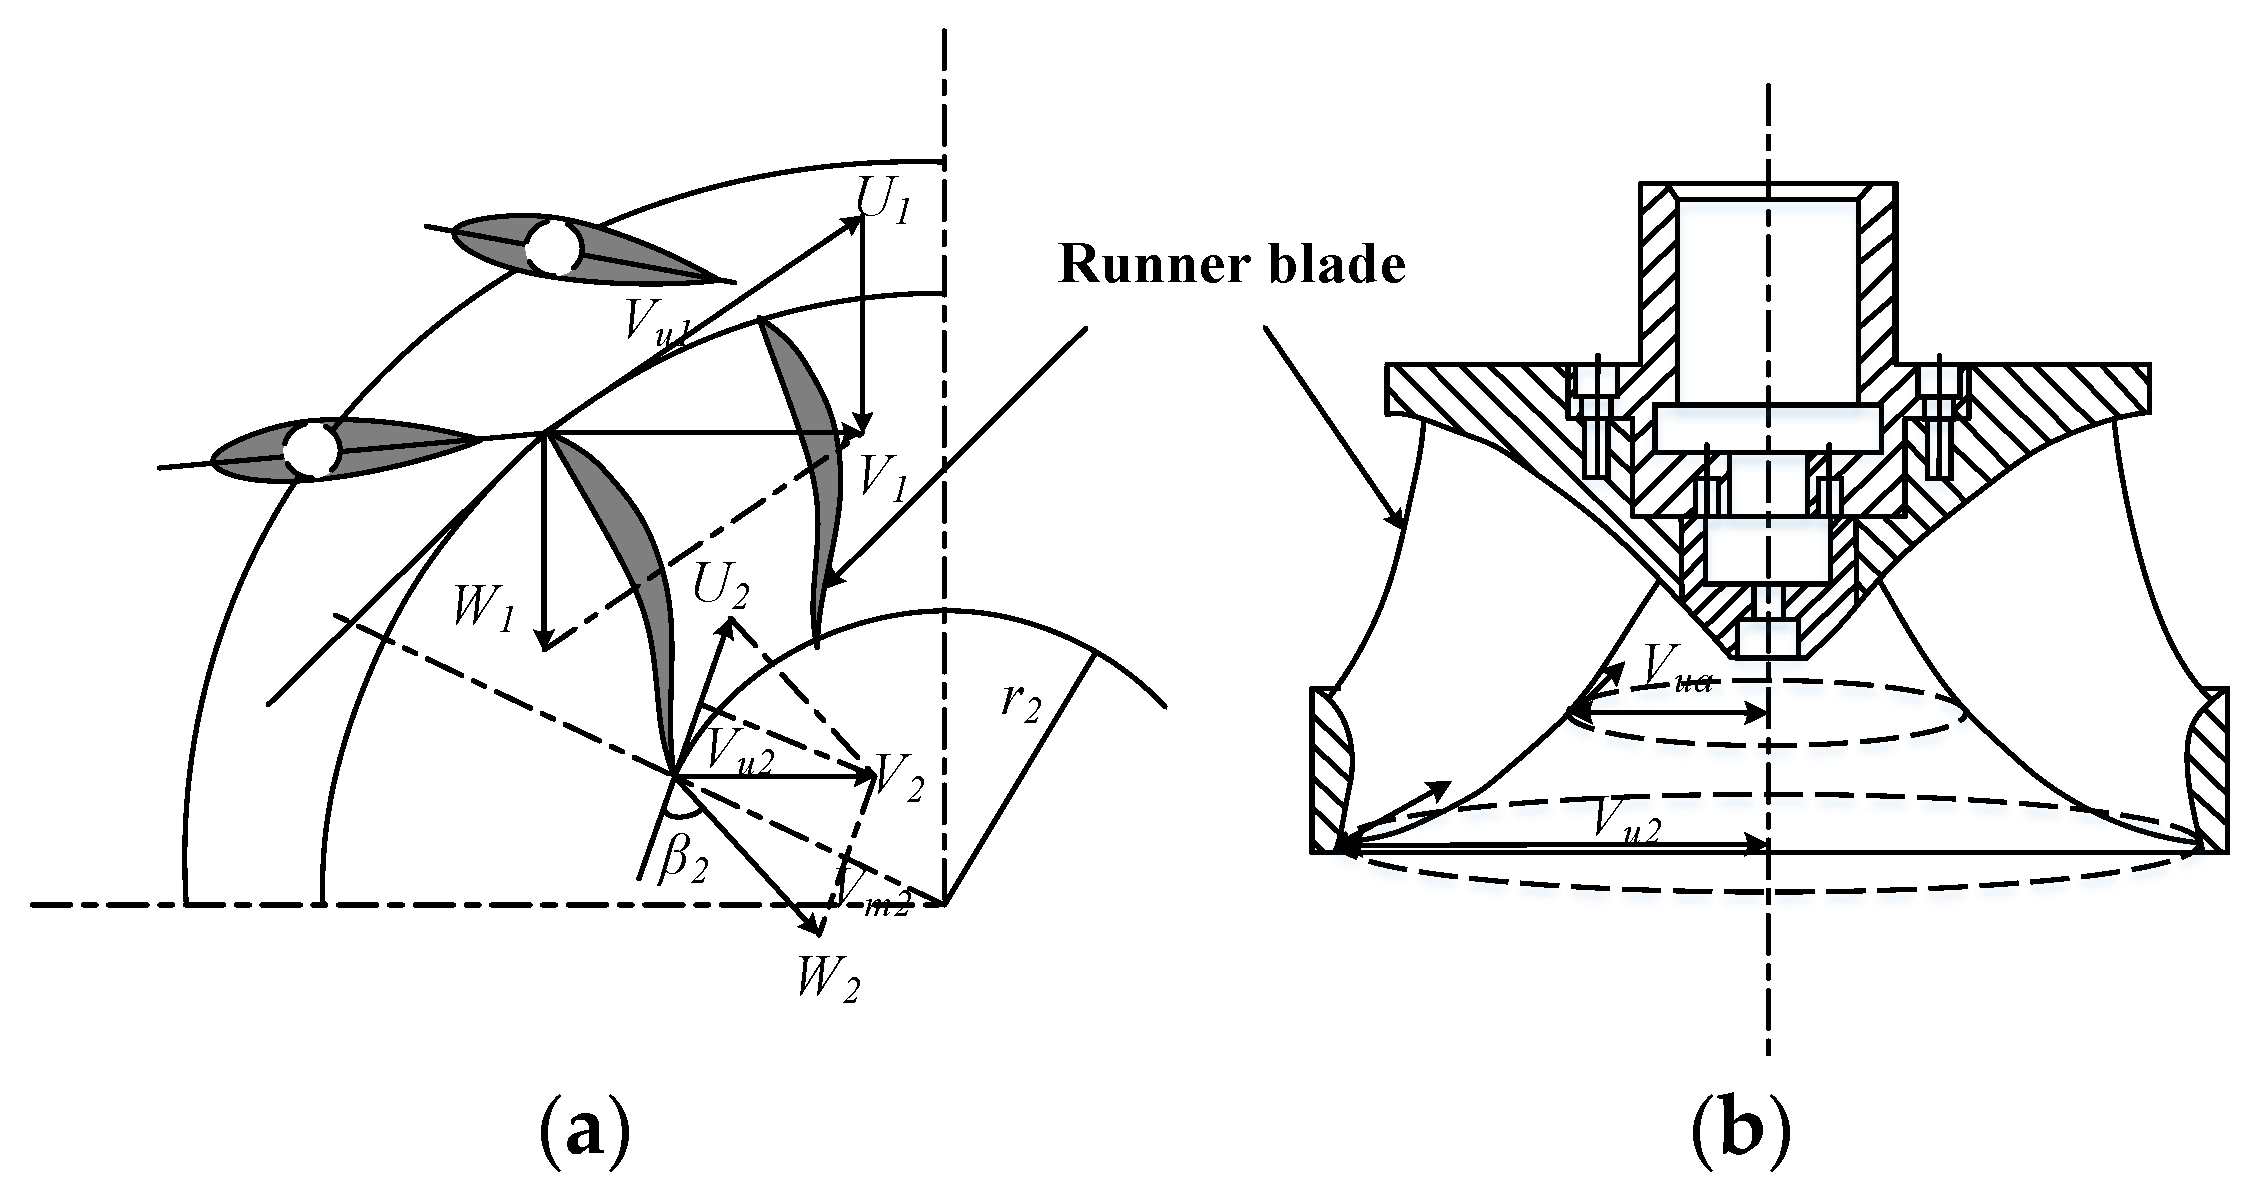
The circulation of the runner outlet is equal to that from the draft tube inlet because the viscosity of the water is ignored. From Figure 2, the circumferential velocity at the runner exit is:
where , . Thus, the circumferential component of absolute speed at runner exit Vu2 can be written as [9]:
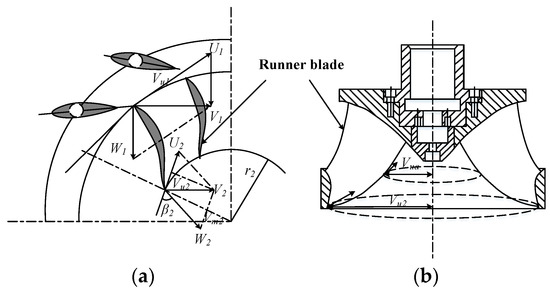
Figure 2.
The velocity vector diagram of outlet of turbine blade; (a) top view of runner blade; (b) front view of runner blade.
The flow in the draft pipe near the outside is a free vortex. Therefore:
The relationship between the vortex rope frequency of the draft tube and the inlet circulation in the inlet of the draft tube can be expressed by:
In line with a concise formula presented by Nechleba [9], the value of pulsating pressure can be obtained as:
The section size of the vortex rope varies with the change of the hydro turbine load. The vibration amplitude of the vortex rope is large and the flow pattern is helical during part-load conditions. At this time, the amplitude of the pressure pulsation is also relatively large, which may cause great harm to the stable operation of HGS [28,29]. Assume that the eccentricity of the vortex ev has the following linear relationship with the output power Pt of the HGS [9].
Combined with Equations (12) and (13), the law of pressure pulsations can be written as:
The pressure pulsations can be calculated and normalized as the fluctuation of the water head [12]:
In light of the above discussion, the mathematical model of HTGS is:
2.2. Model of Shafting System
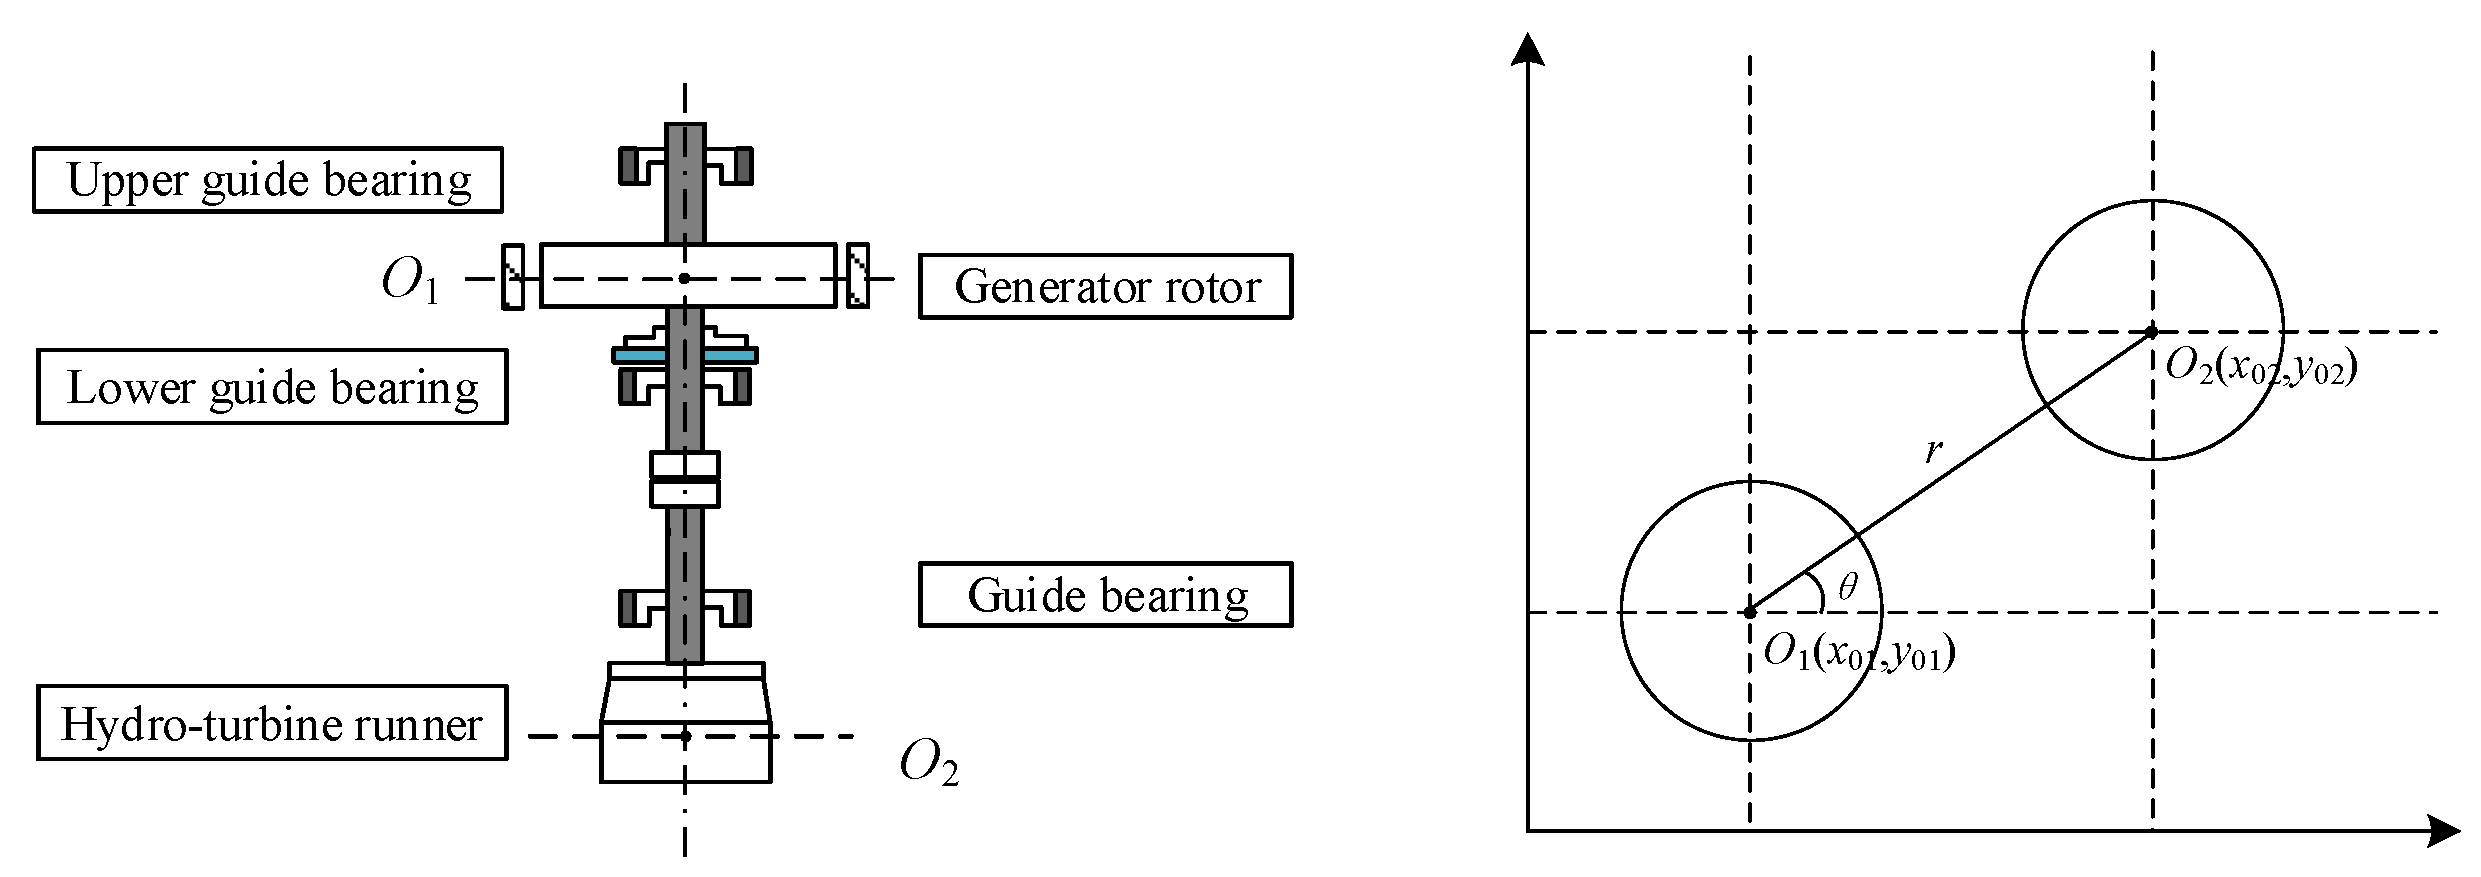
The shafting system, as a bridge and link between the runner and the generator, is the core component of HGS [30]. The structure of the shafting system is shown in Figure 3.

Figure 3.
The structure diagram of shafting system. O1 and O2 are the centroids for the generator rotor and the hydro-turbine runner, respectively, where O1 coincides with the origin of the coordinates.
From Figure 3, the geometric centers of the generator rotor and turbine runner is (x01, y01) and (x02, y02), respectively. Their position relationship can be expressed as:
where θ = ωt + θ0, θ0 is the initial phase angle of the shafting and ω is the angular velocity.
The centroid coordinates of the generator rotor are (xc1, yc1). According to their position relationship, we can obtain that , , in which φ = ωt + φ0 and φ0 is the initial phase of the rotor. Similarly, , .
The static equilibrium point of the shafting system is selected as the zero potential energy point. The kinetic energy and potential energy of the shafting system can be expressed as [31]:
The total external force acting on the HGS are F = {∑Fx,∑Fy}; then the Lagrangian function of the shafting system can be expressed as [32]:
Damping is the property that the amplitude decreases because of external forces or the characteristics of the system itself during the vibration process. The damping force of the shafting system are [33]:
The unbalanced magnetic pull of the shafting system can be written as [34]:
The oil film force acting on the diameter of axis can be expressed as [35,36]:
where the stiffness coefficients kxx, kxy, kyx and kyy and damping coefficients dxx, dxy, dyx and dyy are presented in the Appendix A.
In light of above analysis, the corresponding differential equation are:
2.3. Coupled Model of HGS
The relationship between the relative deviation of the speed and the system torque can be expressed as [37]:
where AM and BM are intermediate variables and their expression are shown in the Appendix A.
Furthermore, the turbine and generator are connected by flanges; therefore, the relationship between the shafting speed and the relative deviation of the HTGS speed is and . Combining with Equations (1) and (25), we can get the connection equation of shafting and PTGS and the equation is [32,37]:
According to the above discussion, the mathematical model of the HGS can be written as:
The hydraulic-mechanical-electromagnetic coupling model has relatively definite physical and engineering significance. This model reflects the nonlinear characteristics of the HGS and integrates the interaction of various influencing factors as much as possible.
2.4. Model Validation
2.4.1. Verification of the Coupling Model
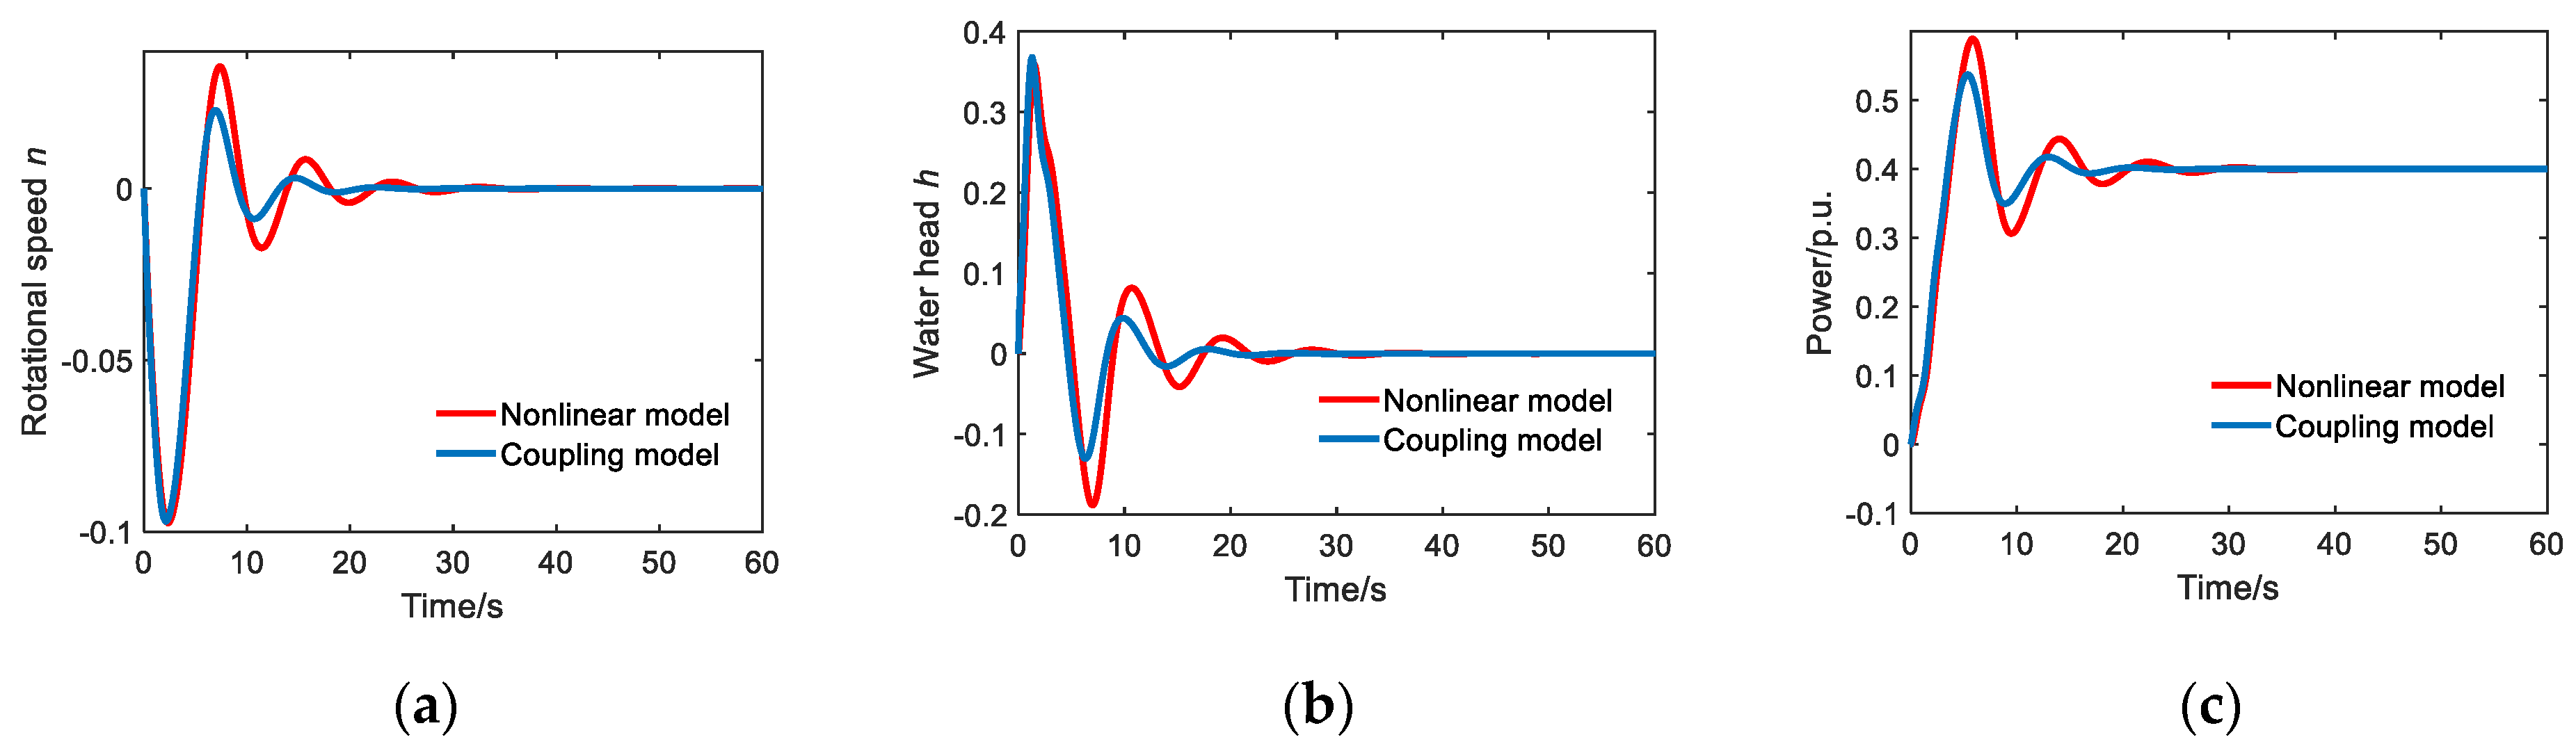
In this study, the HGS model based on the coupling of HTGS and shafting system is adopted to investigate the dynamic characteristics of the HGS during part-load conditions. To verify the correctness of the coupling model, a typical transient process of load increase is selected for comparative analysis. The results are shown in Figure 4.
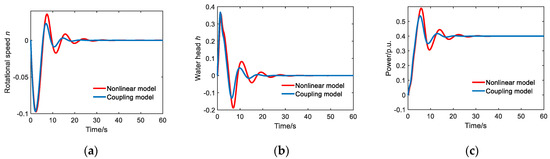
Figure 4.
Transient characteristics of two different models during a load increase process; (a) time domain diagram of relative deviation of rotation speed n; (b) time domain diagram of relative deviation of water head h; and (c) time domain diagram of relative value of power Pt.
Figure 4 shows the dynamic characteristics comparison between the coupling model and the classical nonlinear model [23]. From Figure 4, the rotational speed n decreases rapidly at the initial stage (0–15 s) after receiving the command of load increase, while the power Pt gradually increases. The reason for this phenomenon is that the electromagnetic power suddenly increases, but the change of the turbine power is slower than it. To overcome the electromagnetic torque increase and prevent the further decrease in speed, the HGS needs to increase the guide vane opening and the turbine power is also increased. Eventually, the HGS approaches a steady state with the gap between the power and the turbine electromagnetic power gradually narrowing. This simulation process is consistent with the dynamic characteristics of the load-increasing process in actual hydropower stations. As shown in Figure 4, the two models have the same regularity during the transition process with only minor differences in amplitude; the maximum difference of water head h is 0.057, the maximum difference of power pt is 0.051, the maximum difference of rotational speed n is 0.013 and the minimum error is 0, which is an acceptable range for this study. Besides, the differences are caused by the introduction of more variables and parameters into the coupled model. Therefore, we can conclude that the HGS model could express more features with similar accuracy as the traditional nonlinear model.
2.4.2. Verification of Pressure Pulsation Characteristics
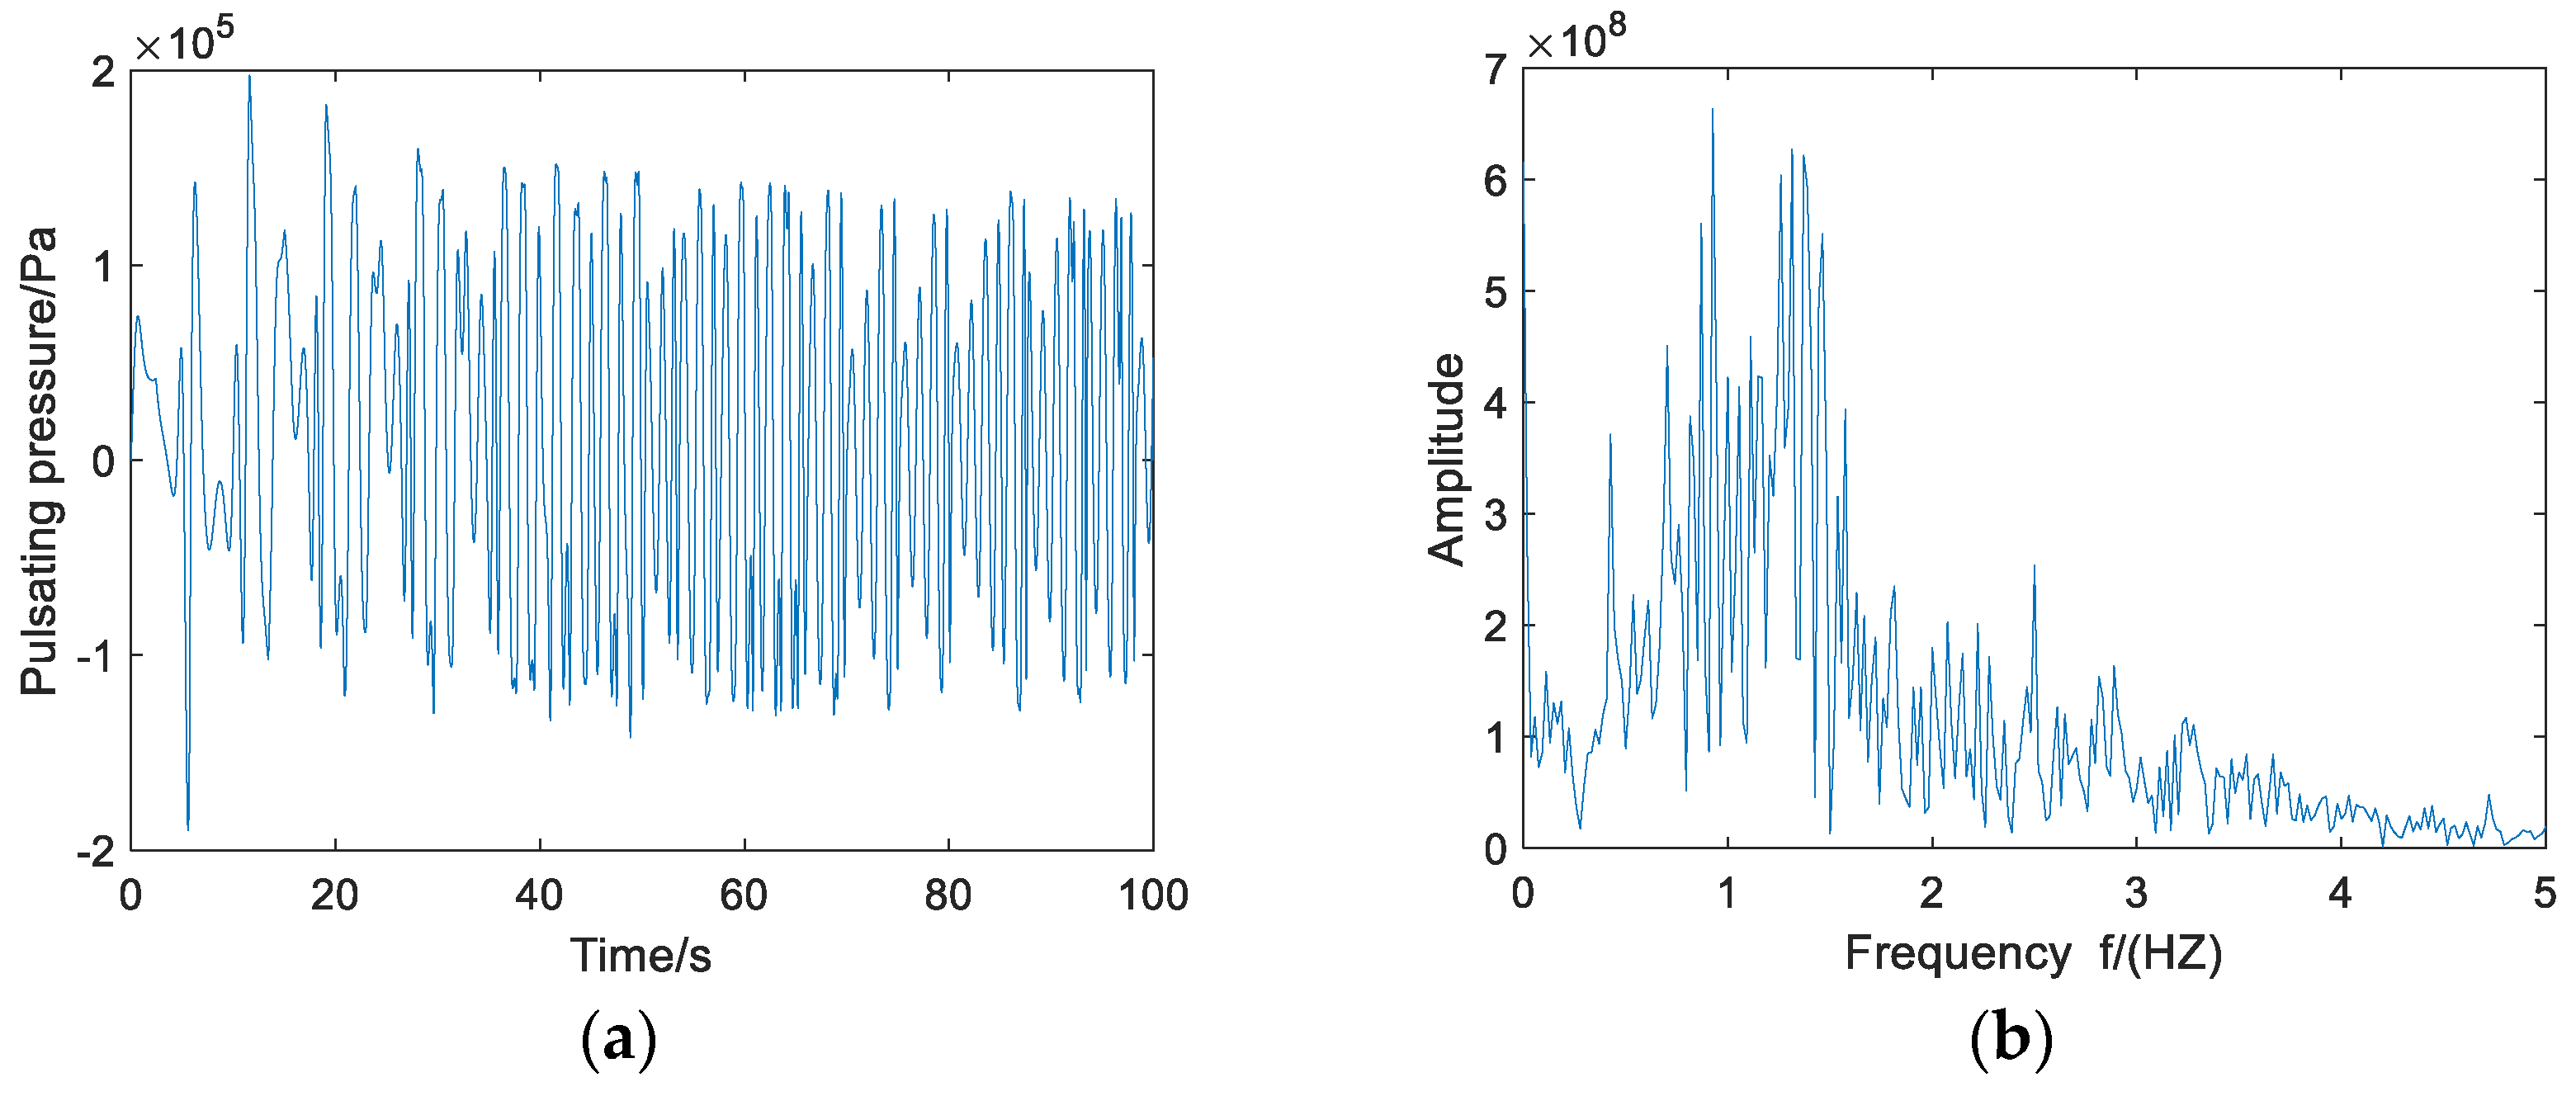
The pressure pulsation in the draft tube is introduced into the model to reflect the dynamic characteristics of the system operating at part-load conditions. It should be noted that the vortex rope is affected by various factors such as unit type, status, water head, etc., and has random characteristics. To reduce the difficulty of the research, the model of the vortex rope only considers the main factor that affects the pressure pulsation in the draft tube; that is, the eccentricity of the vortex rope, and other influencing factors are simplified and omitted. The pressure pulsation during part-load conditions (50%) is shown in Figure 5.
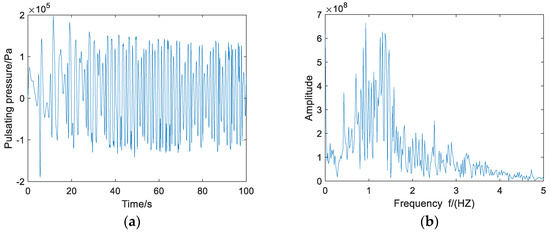
Figure 5.
Simulation results of pressure fluctuation in the draft tube during part-load conditions (50%); (a) time domain diagram of pressure pulsation; (b) frequency-domain diagram of pressure pulsation.
Table 1 shows the test data of pressure pulsation with different loads in an actual hydropower station [38]. From Figure 5, the distribution range of the main frequency of the draft tube vortex rope (0.52–1.59 Hz) is close to the measured data in Table 1, which is in line with the low-frequency characteristics of pressure pulsation in engineering practice. Furthermore, as shown in Figure 6, the water level fluctuation h caused by pressure pulsation is about 5% when the hydro turbine power is 0.5 and 0.65, which is close to the amplitude in Table 1.

Table 1.
Measured data of pressure pulsation in the draft tube of a unit with different loads.
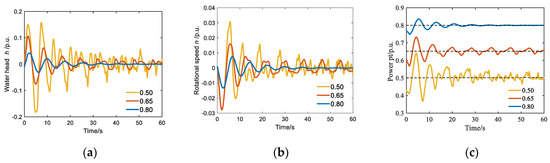
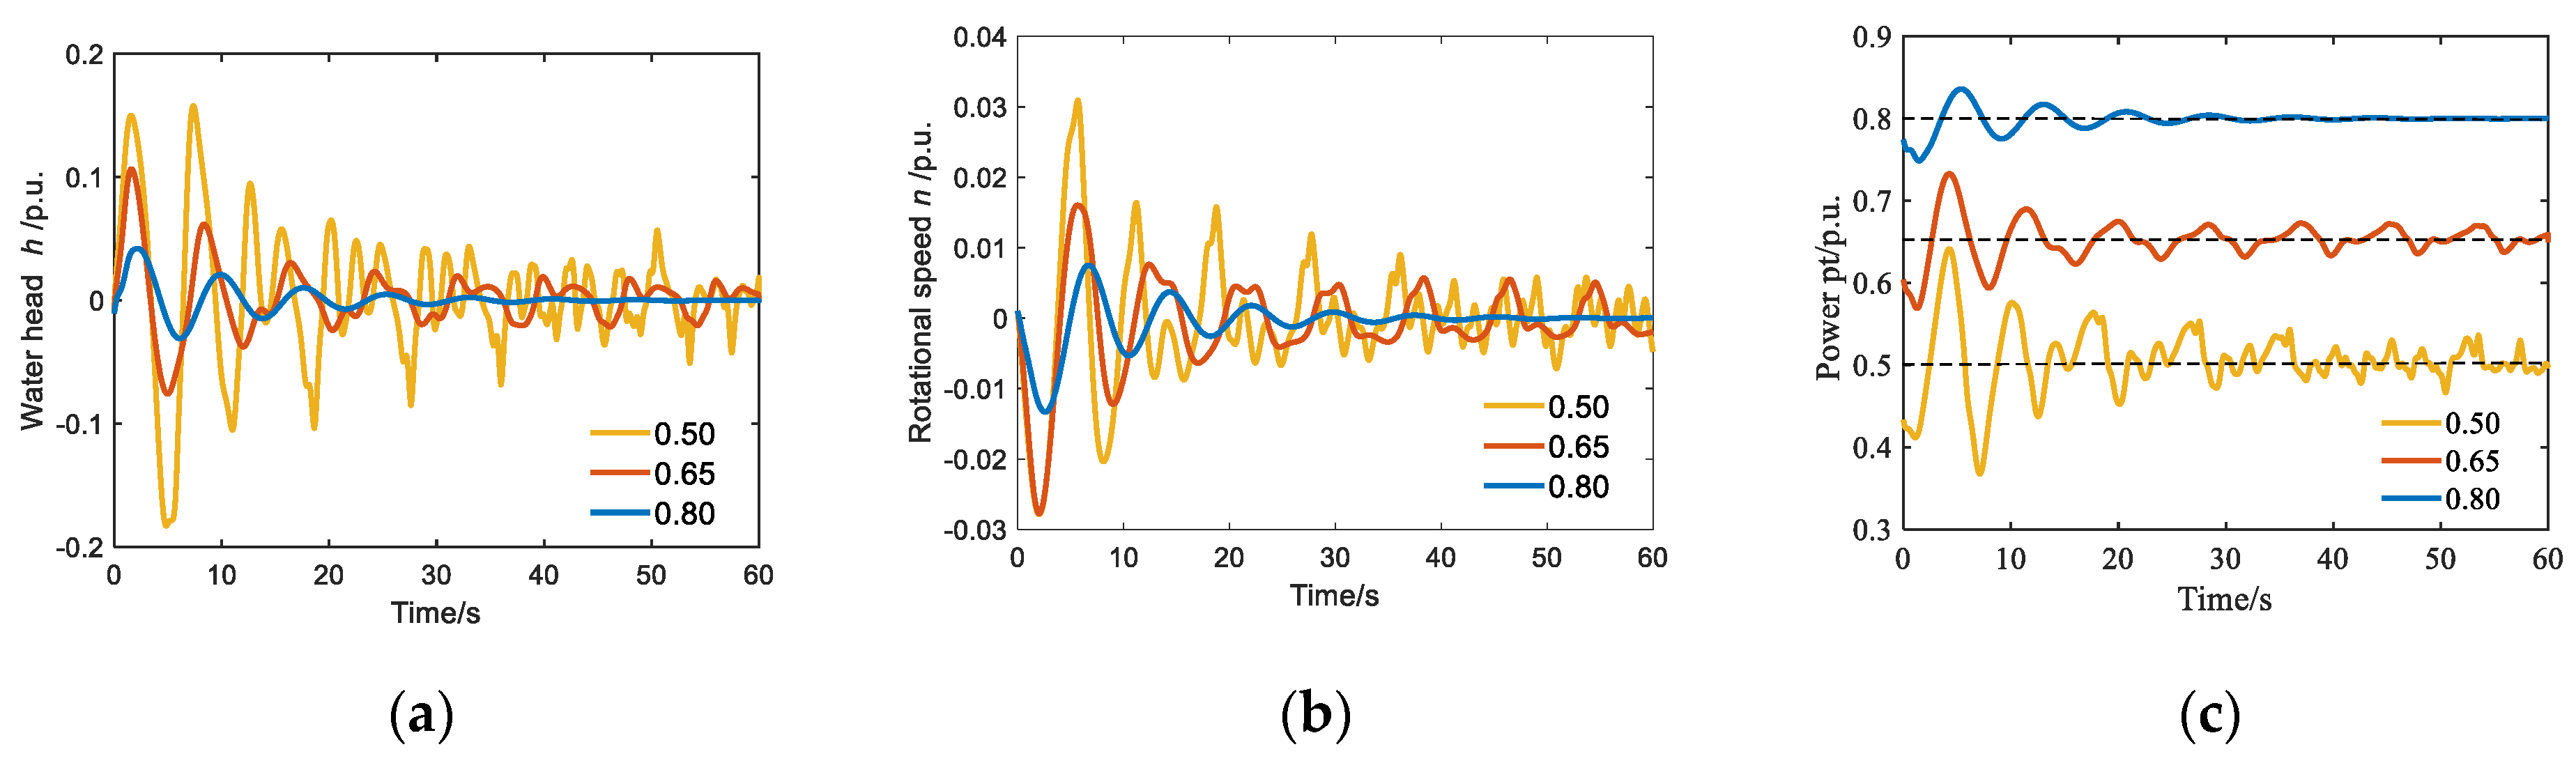
Figure 6.
Time domain diagram of dynamic characteristics of HGS with different working conditions (0.5, 0.65, 0.8); (a) time domain diagram of relative deviation of water head h; (b) time domain diagram of relative deviation of rotation speed n; and (c) time domain diagram of relative value of power Pt.
The simulation results cannot be completely consistent with the actual measured data because the model simplifies and omits some influencing factors, but still could reflect the dynamic characteristics of part-load conditions to some extent. When simulating other hydropower units, the eccentricity ev could be further optimized based on the measured data to reflect the dynamic characteristics at part-load conditions more accurately.
3. Stability Assessment of HGS
3.1. Dynamic Characteristic of HGS
Part-load operation of the HGS often accompanies a variety of dynamic characteristics, which can be reflected by the dynamic response of HTGS and the vibration of the shafting system. For this purpose, three typical working conditions (i.e., 0.5, 0.65 and 0.8) are selected for comparison based on Table 1. First, the dynamic response of the water head, rotational speed and power are analyzed together because they both refer to the variation of guide vane opening. Then, the vibration characteristics of a shafting system with different working conditions are investigated. The default parameter settings are shown in the Appendix A.
Figure 6 shows the dynamic responses of the relative deviation of water head h, the relative deviation of rotational speed n and the relative power Pt with different working conditions. From Figure 6, the dynamic responses share a similar trend in different conditions at the initial part (about 0–15 s), but also show significantly differences in fluctuation amplitude. When the working condition is 0.8, the fluctuation amplitude of the HGS is relatively small and the frequency of fluctuation is low. The maximum relative deviation of the water head (hmax) is 0.04, the maximum relative deviation of the rotational speed (nmax) is 0.07 and the maximum fluctuation of power (Ptmax) is 0.84 in this condition. After a fluctuation attenuation process of 15 s, the fluctuation tends to 0. This means that the operating state of the system is stable after 15 s. When the working condition is 0.65, hmax = 0.04, nmax = 0.007 and Ptmax = 0.66. Both amplitude and frequency are obviously increased compared with the dynamic response of the unit operating at 0.8 working condition. The dynamic response of the HGS still has obvious fluctuations between 15 s and 60 s, in which hmax = 0.16, nmax = 0.030 and Ptmax = 0.64, respectively. Note that the dynamic response shows significant fluctuations when the unit is operating at 0.5 working condition, in which hmax = 0.16, nmax = 0.30 and Ptmax = 0.64. At this time, the frequency of the fluctuation is the highest and the unit needs a longer period (about 20 s) to reach a relative stable state. Even in this relative stable state, the unit is also experiencing high-frequency fluctuations with minor amplitude, in which hmax = 0.06, nmax = 0.009 and Ptmax = 0.53, respectively.
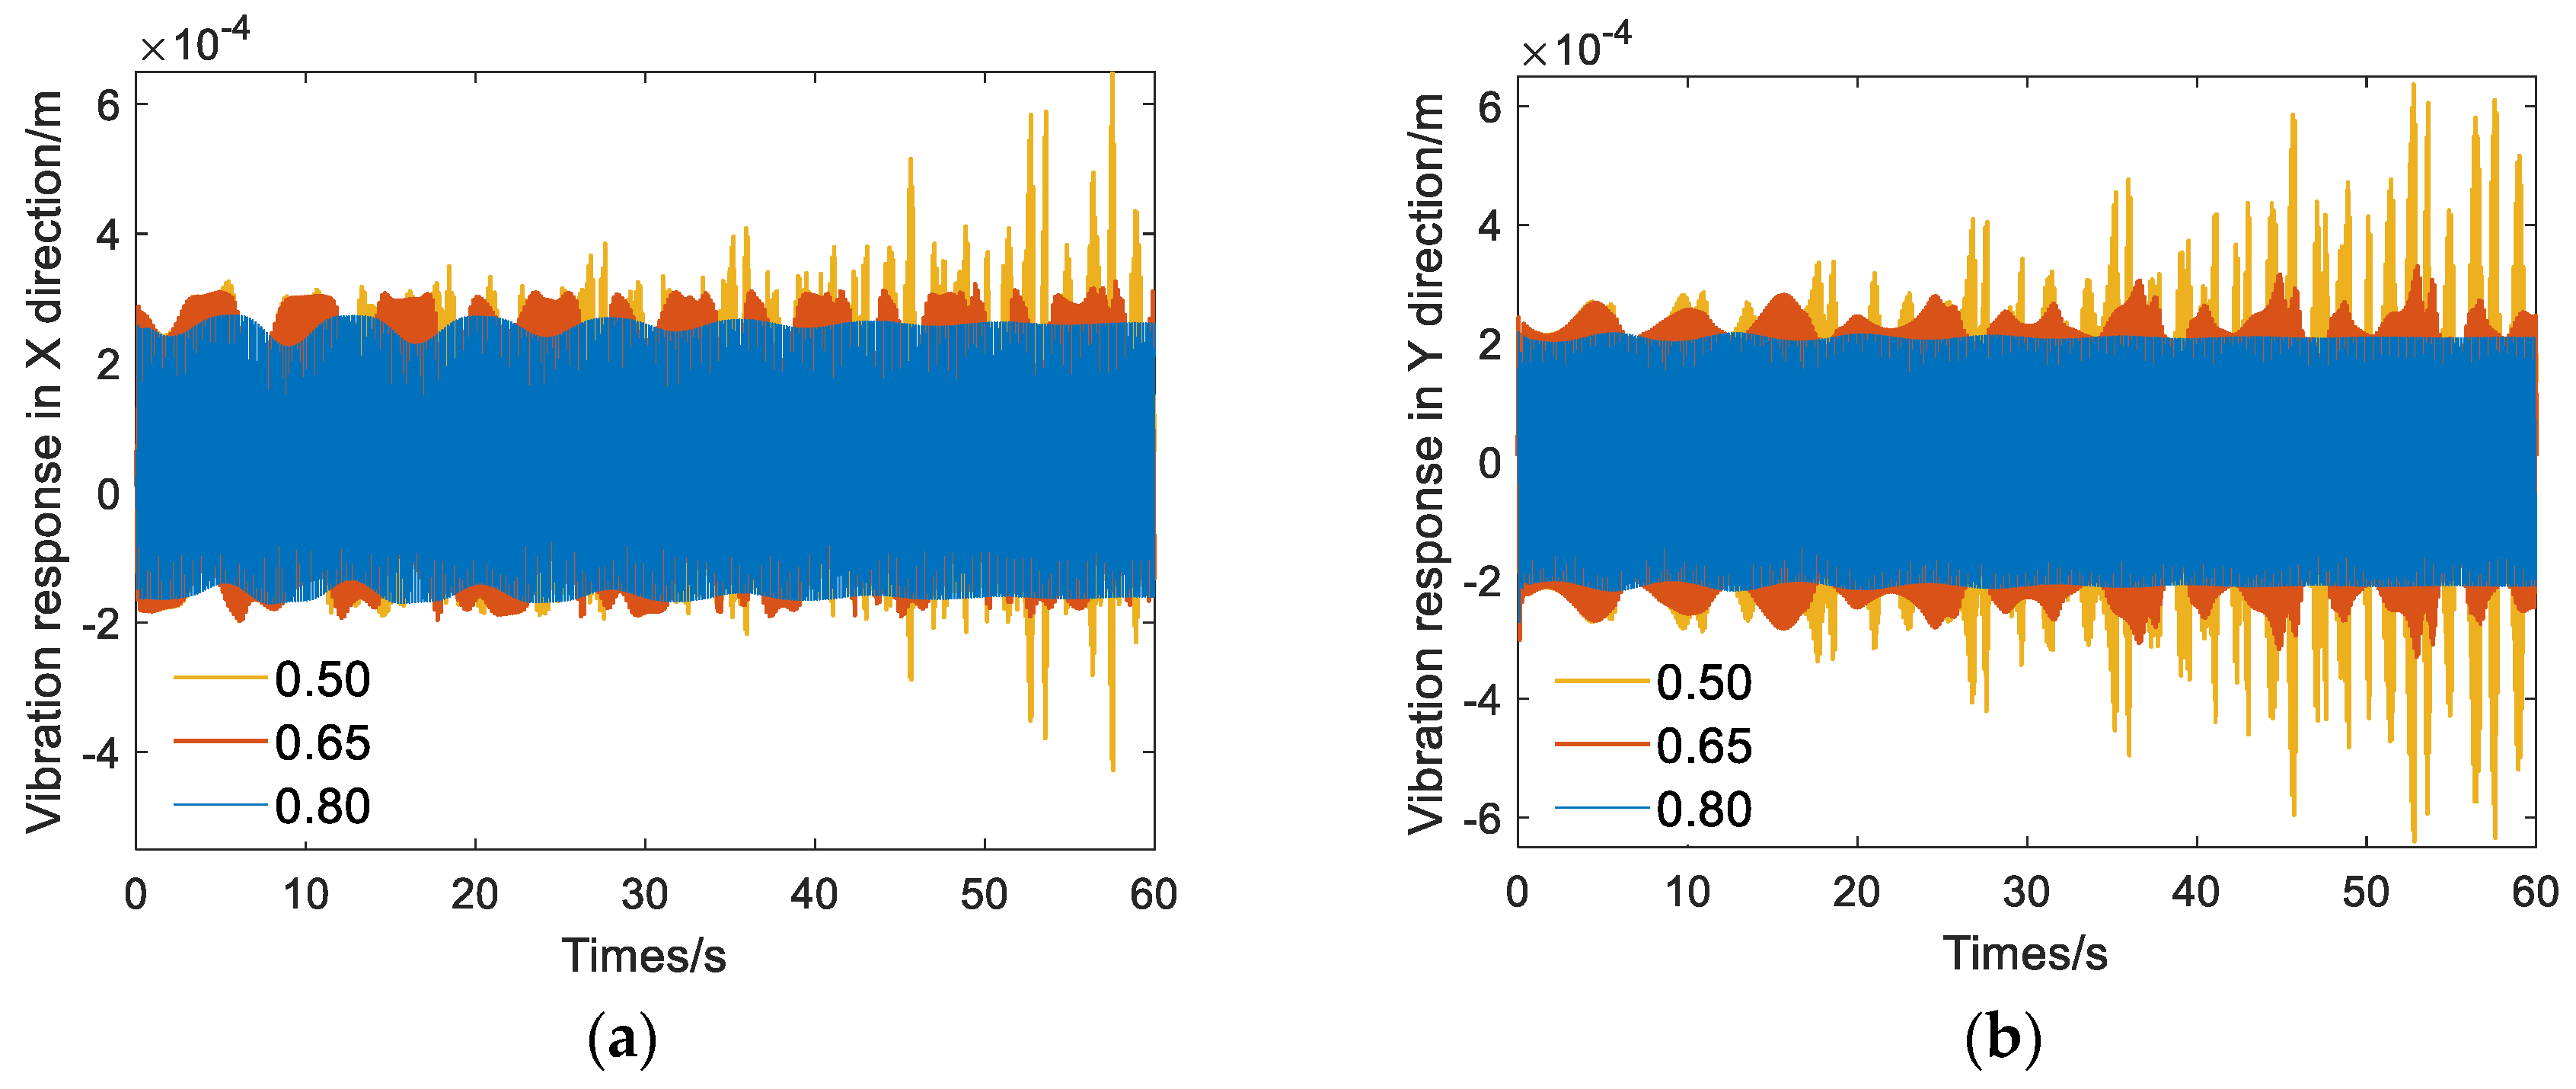
Vibration is an inevitable inherent attribute of rotating machinery and it is also a very important index to measure the stability of HGS. Thus, the shafting vibration performance to reveal the operation stability of HGS was analyzed and the results are shown in Figure 7. Corresponding to the dynamic response in Figure 6, the unit vibration in Figure 7 becomes stable rapidly after a short period of fluctuation when the working condition is 0.8. At this time, the vibration response of a unit in X direction (VRX) is 2.61 × 10⁻⁴ m and 2.09 × 10⁻⁴ m in Y direction (VRY). This means that HGS could operate safely in this condition. Conversely, when the unit is operating at part-load conditions, the amplitude of vibration increases and a relatively large peak–valley difference of vibration occurs. The amplitude is VRX = 3.24 × 10⁻⁴ m and VRY = 3.29 × 10⁻⁴ m when the working condition is 0.65. The vibration is further enhanced when the working condition is 0.5, in which VRX = 0.6.46 × 10−4 m and VRY = 6.10 × 10⁻⁴ m. It could be concluded that the vibration of part-load operation has a significant increase compared with the optimal operating area.

Figure 7.
Shafting vibration in the X and Y directions of the unit with different working conditions; (a) shafting vibration response in X direction; (b) shafting vibration response in Y direction.
The reason for the phenomenon from Figure 6 and Figure 7 is that HGS can only operate stably within a certain range and some stability problems exist during part-load conditions, which is one of the inherent characteristics of the hydraulic turbine. When the working condition is 0.8, the unit operates with higher efficiency, smooth water flow and minimal response variation. However, the pressure pulsation of the draft pipe is aggressive at this part-load condition when working conditions are 0.5 and 0.65, which is the main factor affecting the unit vibration. Hence, the vibration intensity of the unit also increases and the vibration frequency presents an obviously periodic phenomenon that is due to the effect of the vortex rope. The simulation results also verify that the established coupling model can reflect the dynamic characteristics of the HGS during part-load conditions. In practical engineering, many hydropower stations cannot operate at part-load conditions for a long time, or even fail to operate. Even if the equipment could operate at such conditions, the deterioration of the unit’s status and the aging of components will be accelerated, leading to the decrease of operating efficiency, shortening of the maintenance cycle and more unplanned maintenance downtime.
3.2. Vibration Characteristics of HGS
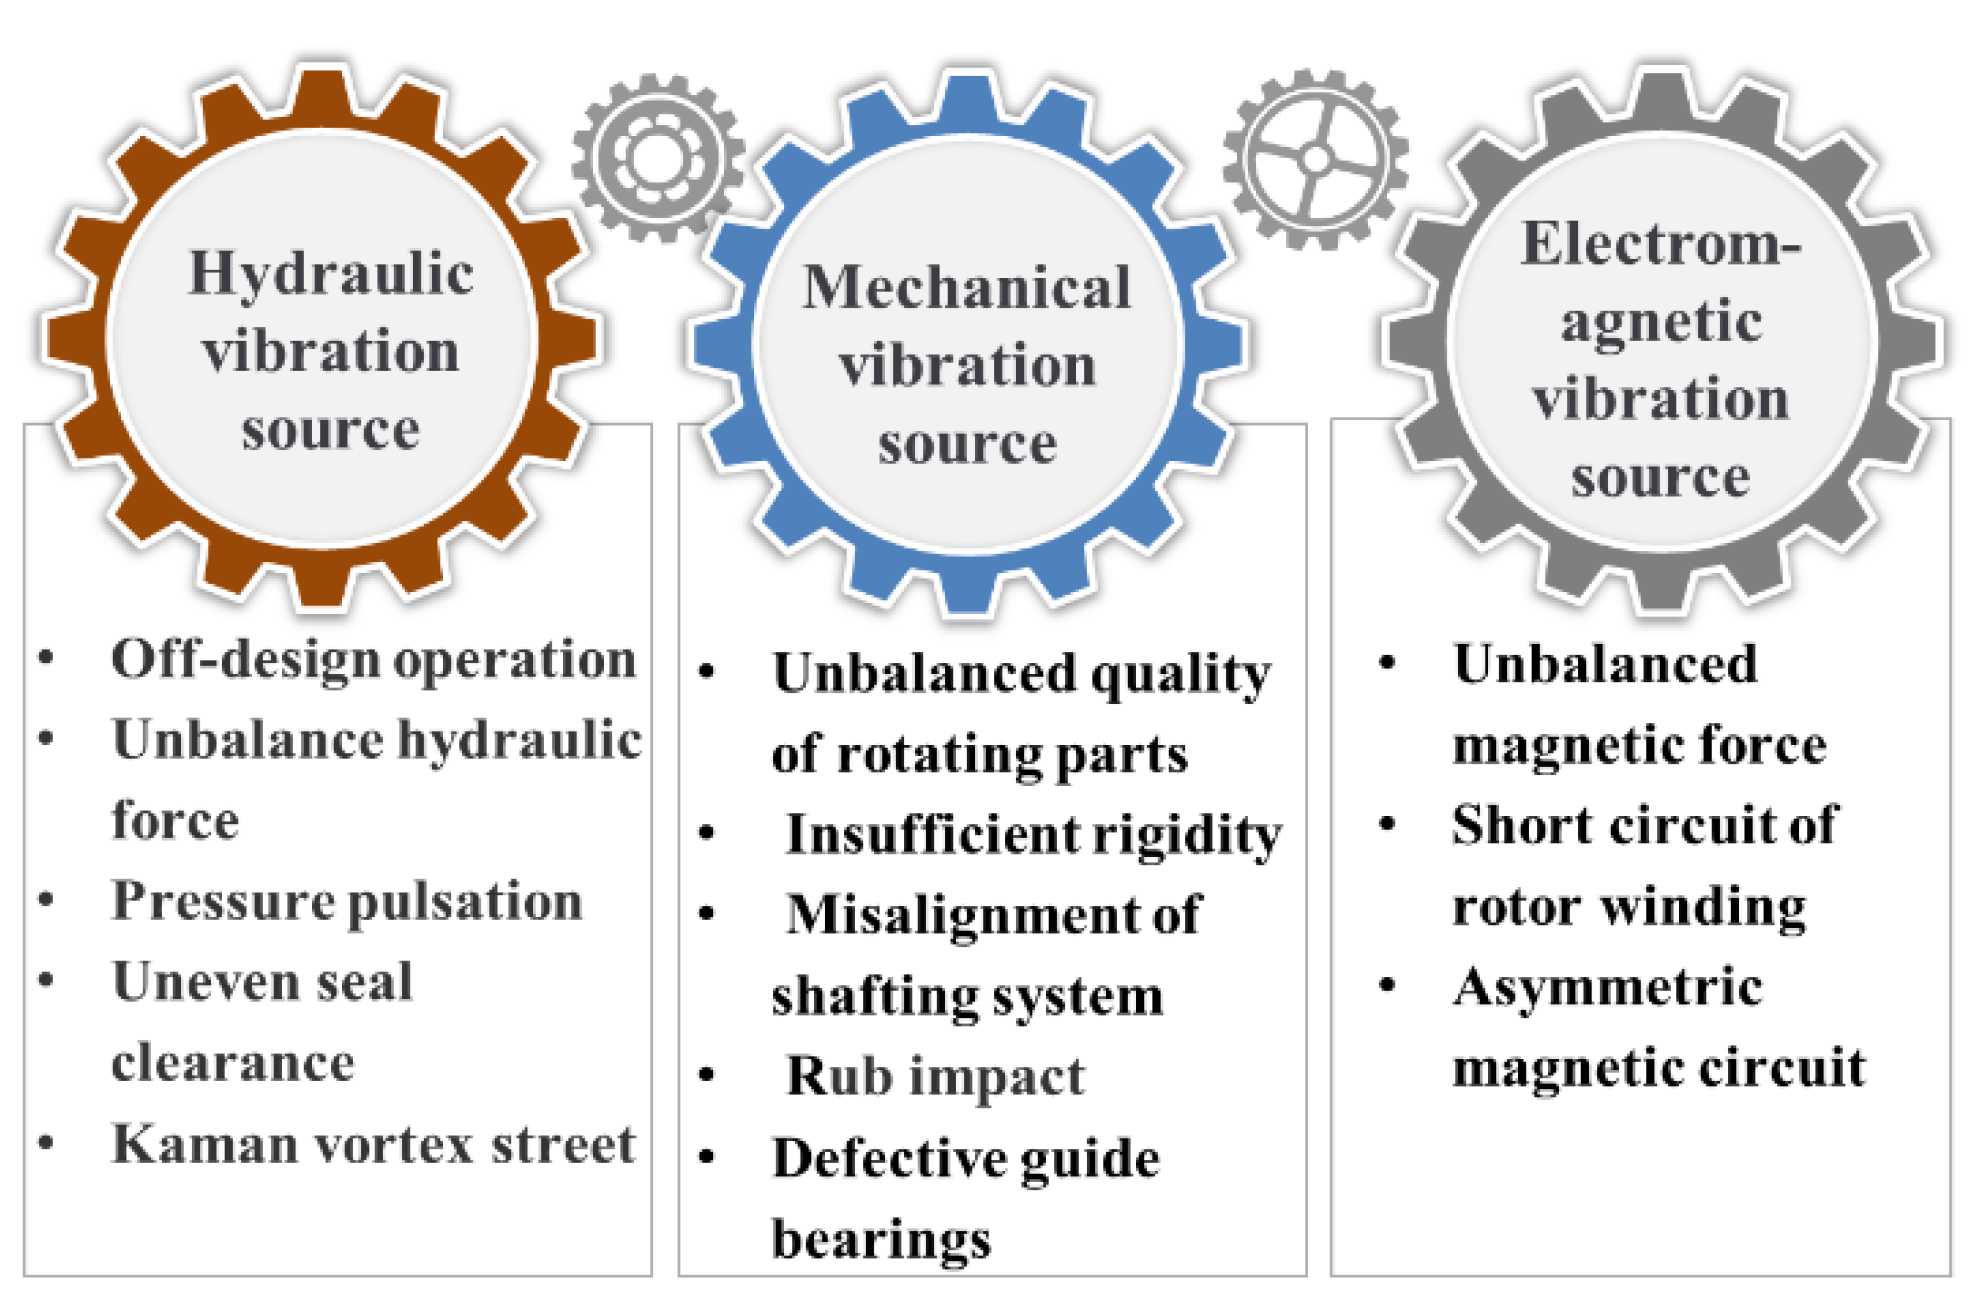
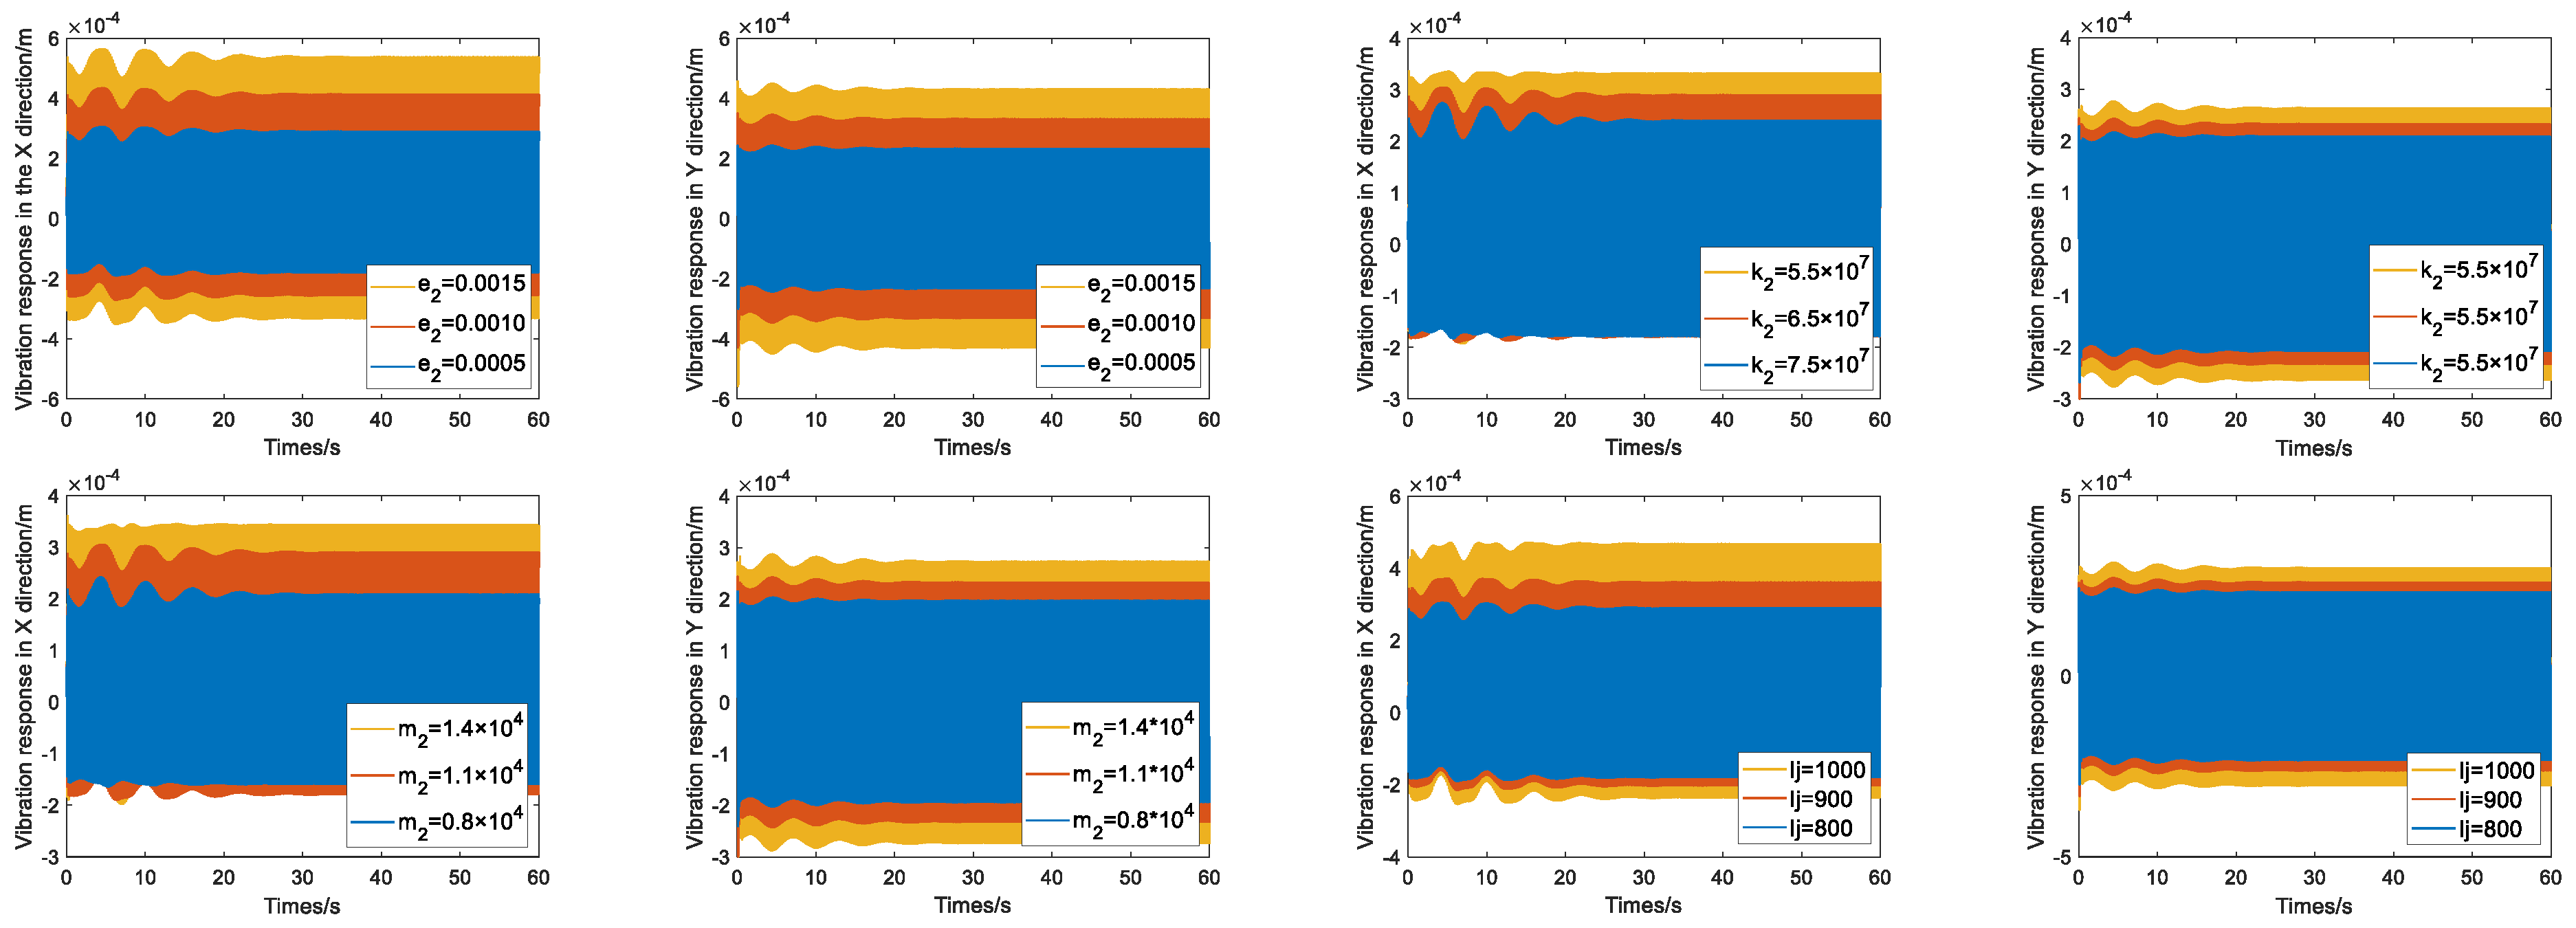
Figure 8 shows the main factors affecting the stability of the HGS that can be summarized as hydraulic vibration source, mechanical vibration source and electromagnetic vibration source [21]. To further study the influence of different vibration sources on the stability of the HGS during part-load conditions, the representative parameters, i.e., turbine mass eccentricity e2, turbine runner bearing stiffness k2, mass of turbine runner m2 and excitation current Ij, are selected to deeply analyze the vibration characteristics of the HGS during part-load conditions. A theoretical basis is sought for improving the stability of HGS during part-load conditions.

Figure 8.
Main influencing factors of unit vibration.
3.2.1. Mechanical Vibration Source
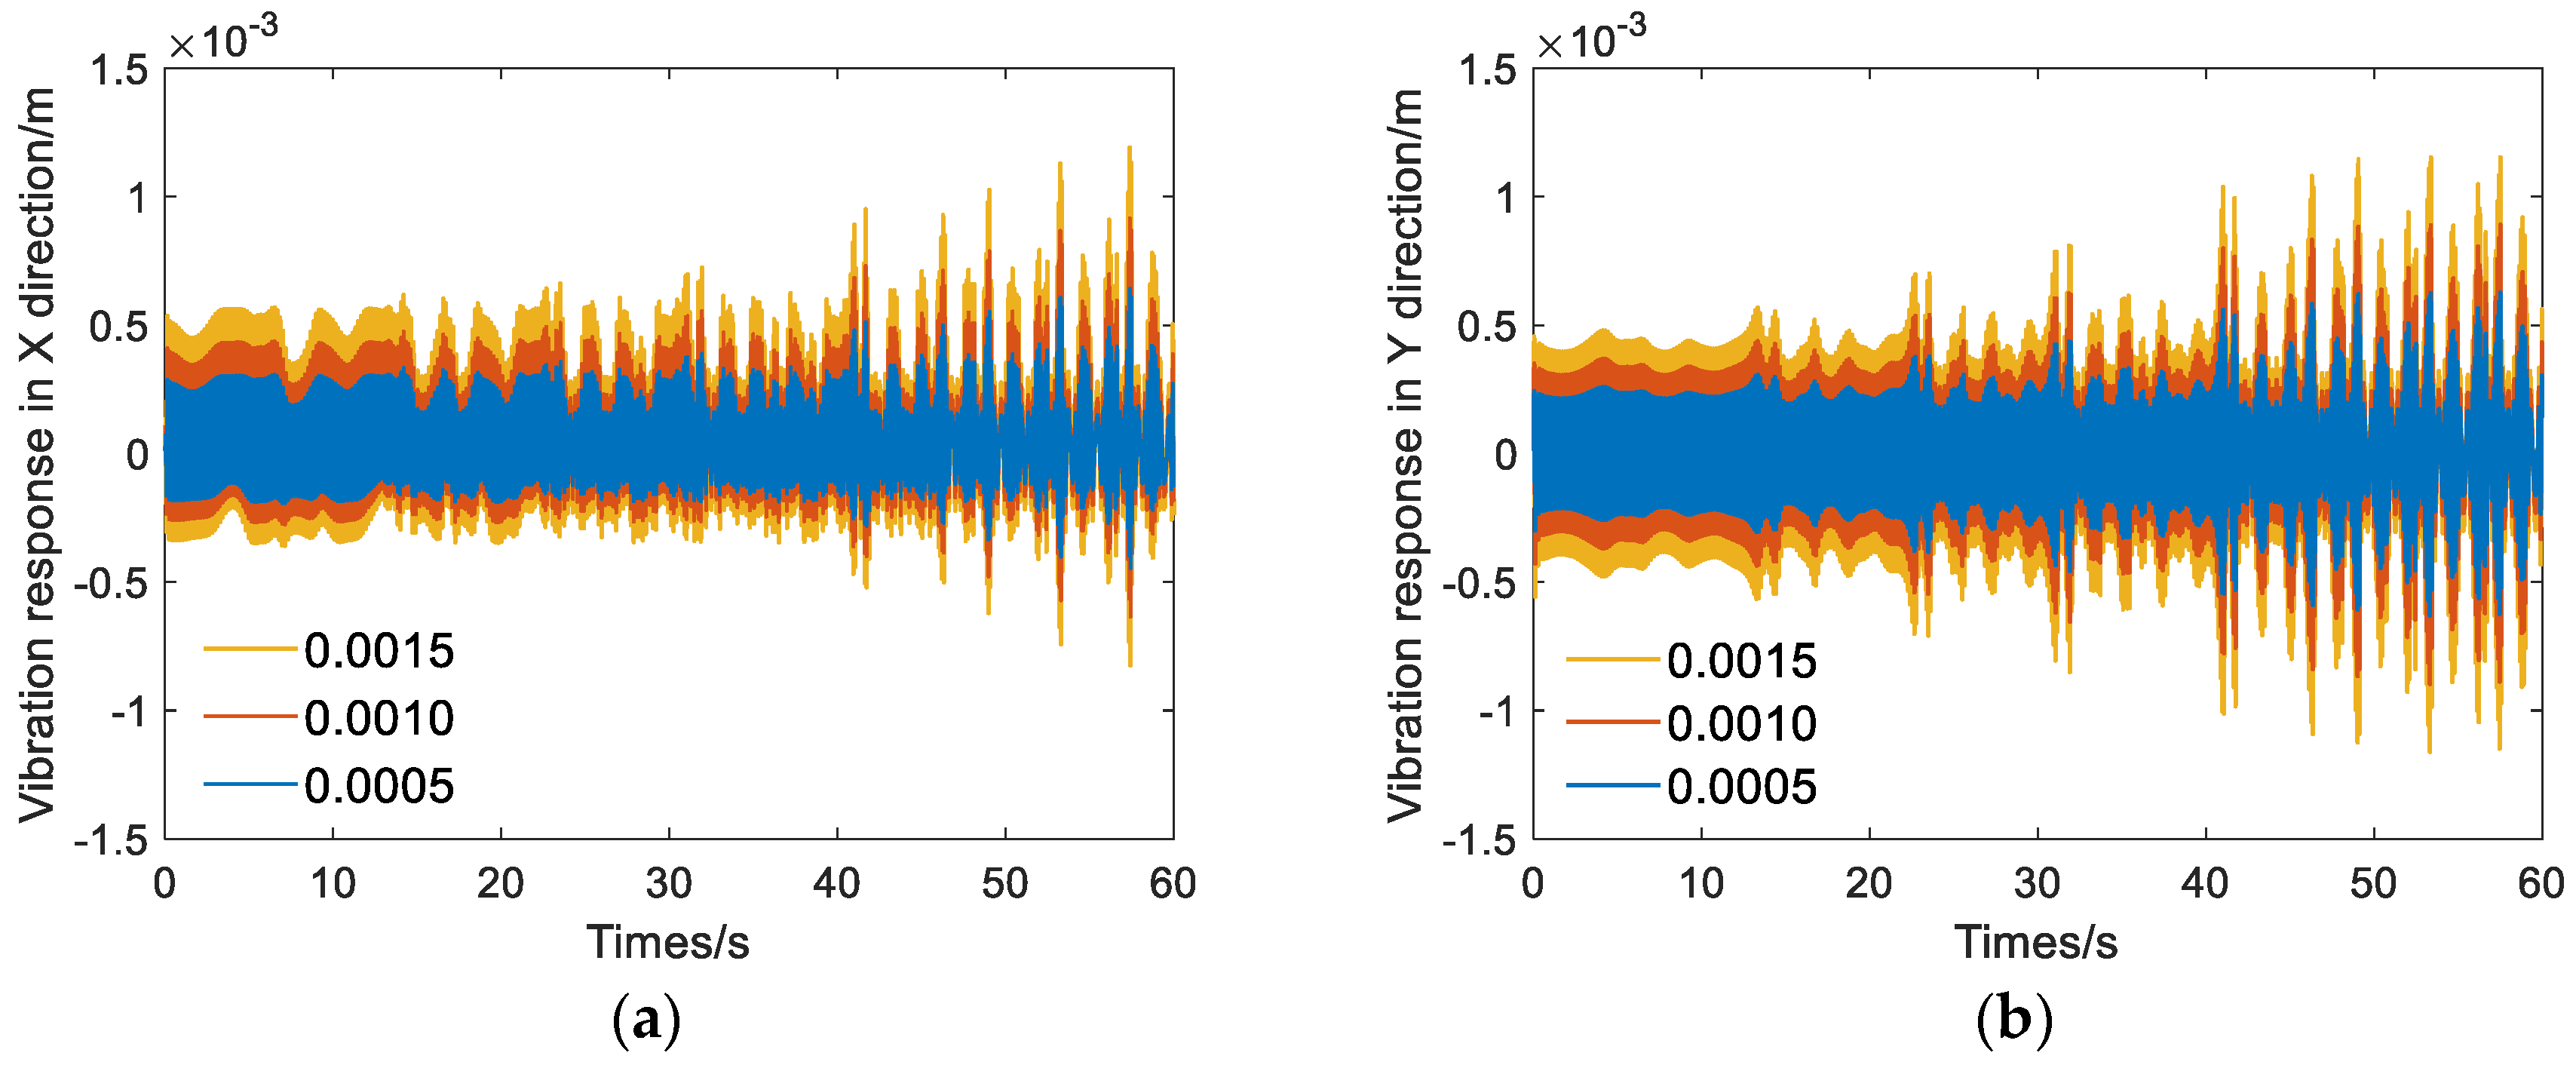
Unbalance of the turbine runner may occur because of the processing technology. After the unit is in service, sediment abrasion and cavitation make the eccentricity change in different degrees with the passage of operating time. Patch welding and other maintenance means may destroy the original balance state of the runner. Figure 9 shows the vibration of shafting system with different turbine mass eccentricity e2. From Figure 9, the variation of e2 has a significant impact on the vibration of the unit and the maximum amplitudes both occur in the vibration region after 40 s. When e2 = 0.0005 m, the maximum of the vibration response in the X direction (VRXmax) is 6.25 × 10⁻⁴ m, and that in the Y direction (VRYmax) is 6.17 × 10⁻⁴ m. When e2 = 0.0010 m, VRXmax = 8.64 × 10⁻⁴ m and VRYmax = 8.89 × 10⁻⁴ m. When e2 =0.0015 m, VRXmax = 11.29 × 10⁻⁴ m and VRYmax = 11.53 × 10⁻⁴ m. It is shown that the vibration of the unit increases remarkably with the increase of turbine mass eccentricity e2. This phenomenon occurs because the turbine mass eccentricity e2 generates an additional centrifugal force during the operation of the unit. The turbine runner will be unbalanced because of the presence of additional centrifugal force, which will lead to eccentric bearing wear and other adverse effects. Hence, it is particularly important to reduce e2 as far as possible through the balance test to ensure the stable operation of the unit and prolong the unit life.

Figure 9.
Shafting vibration response in the X and Y directions of the unit with different e2; (a) shafting vibration response in X direction; (b) shafting vibration response in Y direction.
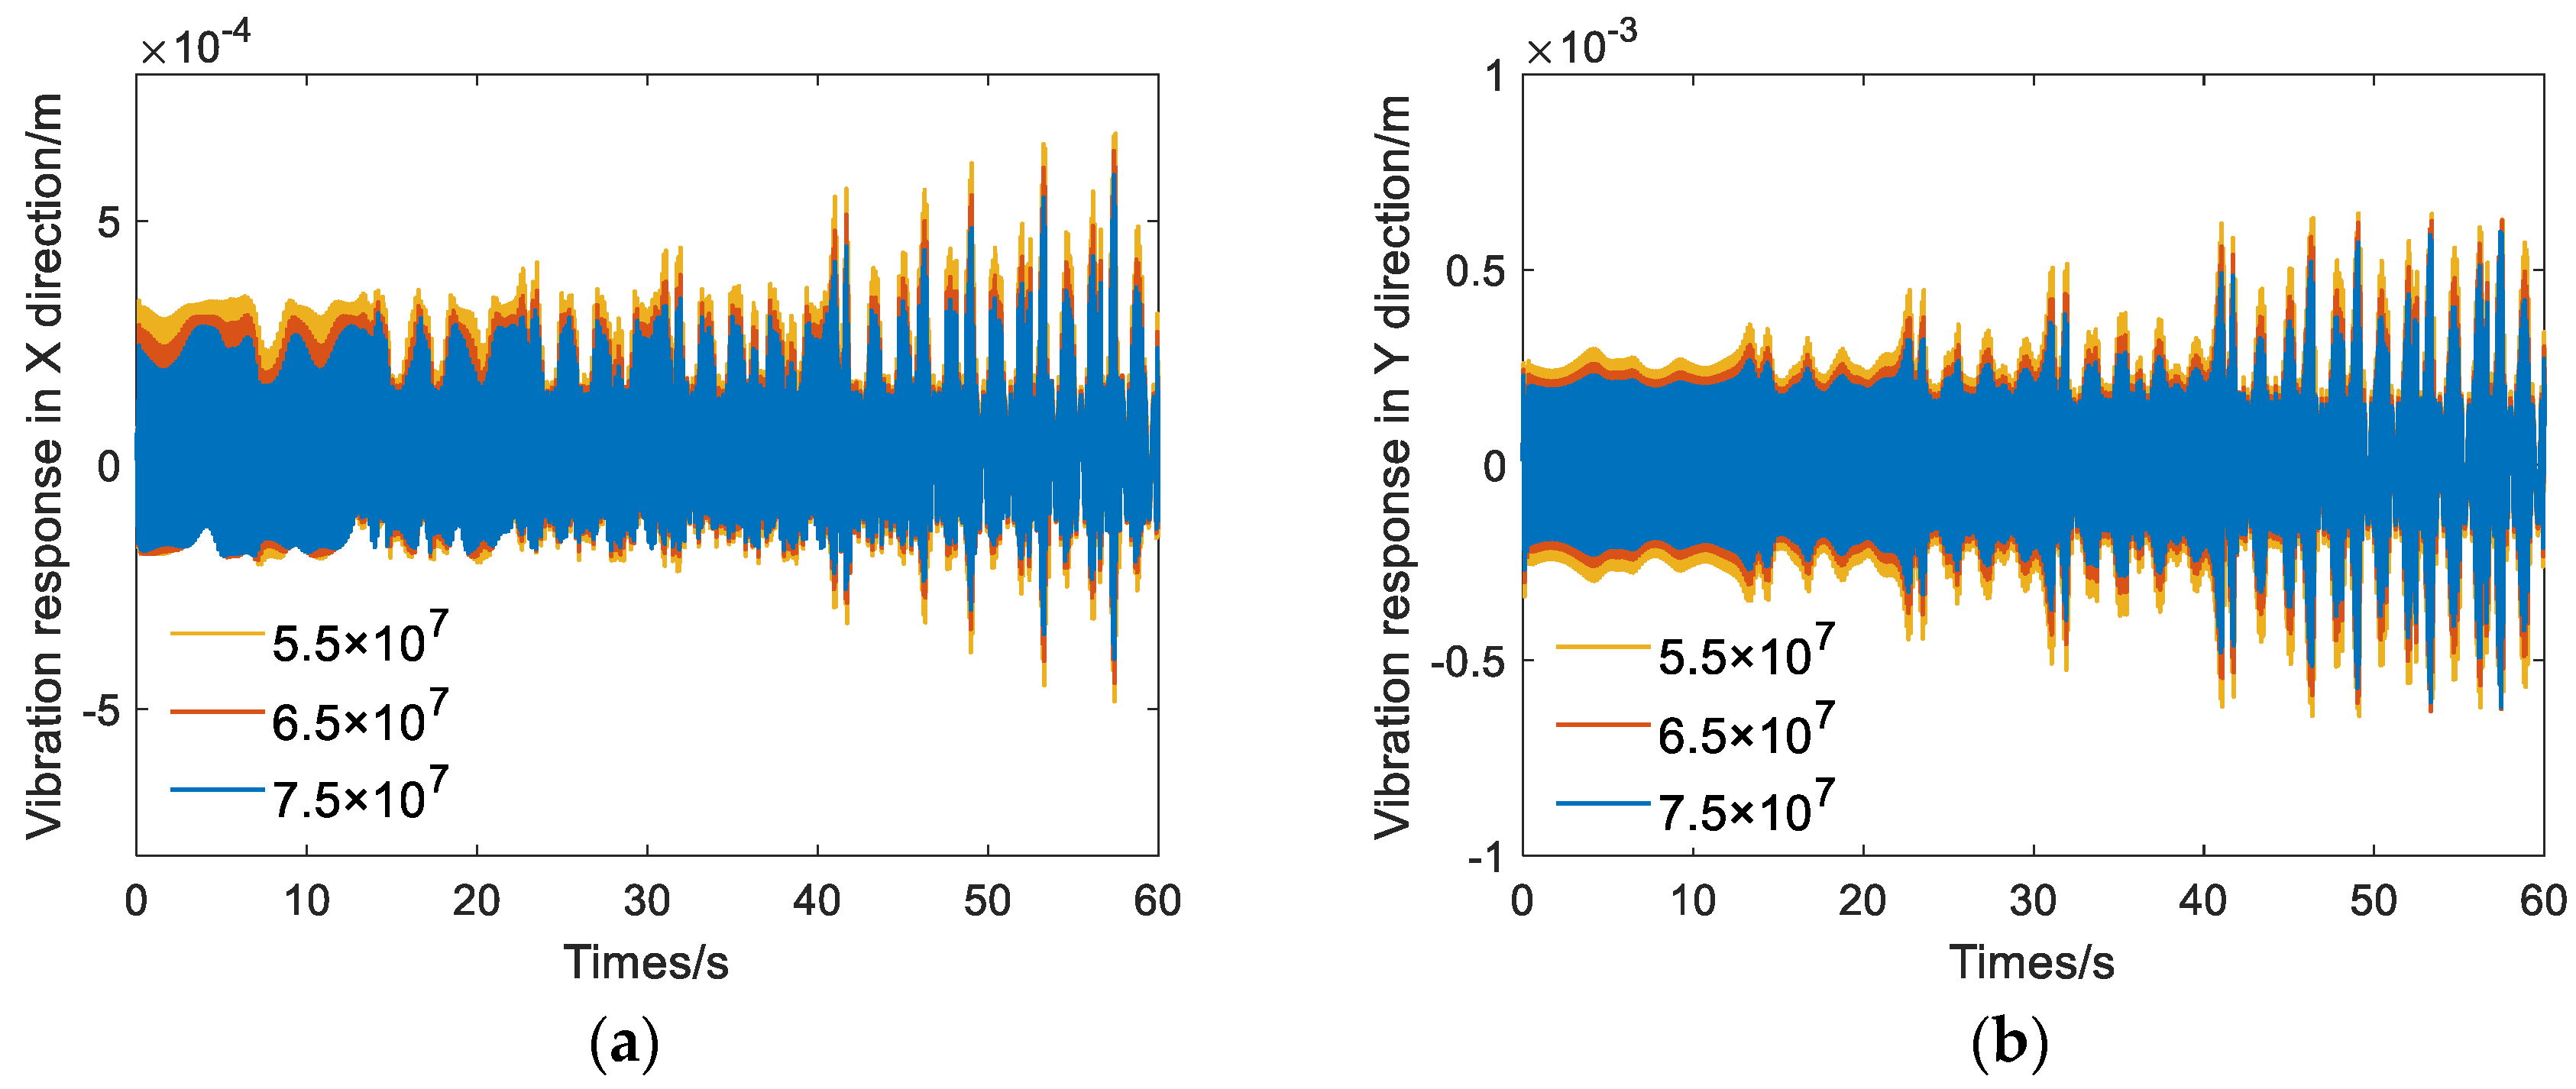
The shafting system will be deformed with the influence of centrifugal force during the operation of the unit. Fatigue damage caused by the long-term operation of a unit may cause cracks and other failures, which will cause changes in bearing stiffness k2. The influence of different bearing stiffness k2 on unit vibration are compared in Figure 10. From Figure 10, when k2 = 7.5 × 10⁷ N/m, the VRXmax is 5.47 × 10⁻⁴ m and the VRYmax is 5.73 × 10⁻⁴ m. When k2 = 6.5 × 10⁷ N/m, the VRXmax is 6.06 × 10⁻⁴ m and the VRYmax is 6.17 × 10⁻⁴ m. When k2 = 5.5 × 10⁷ N/m, the VRXmax is 6.57 × 10⁻⁴ m and the VRYmax is 6.42 × 10⁻⁴ m. Based on the vibration response, it can be concluded that the unit vibration increases gradually with the decrease of k2. This means that the lower the turbine runner bearing stiffness k2, the greater the spindle deformation, and the more serious the unit vibration. Therefore, improving the turbine runner bearing stiffness k2 has a positive effect on reducing the amplitude. In engineering practice, the stiffness of the bearing can be reinforced by improving the material. However, it is necessary to ensure a simple structure for easy installation and maintenance.
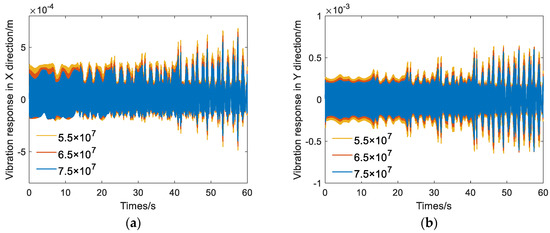
Figure 10.
Shafting vibration response in the X and Y directions of the unit with different k2; (a) shafting vibration response in X direction; (b) shafting vibration response in Y direction.
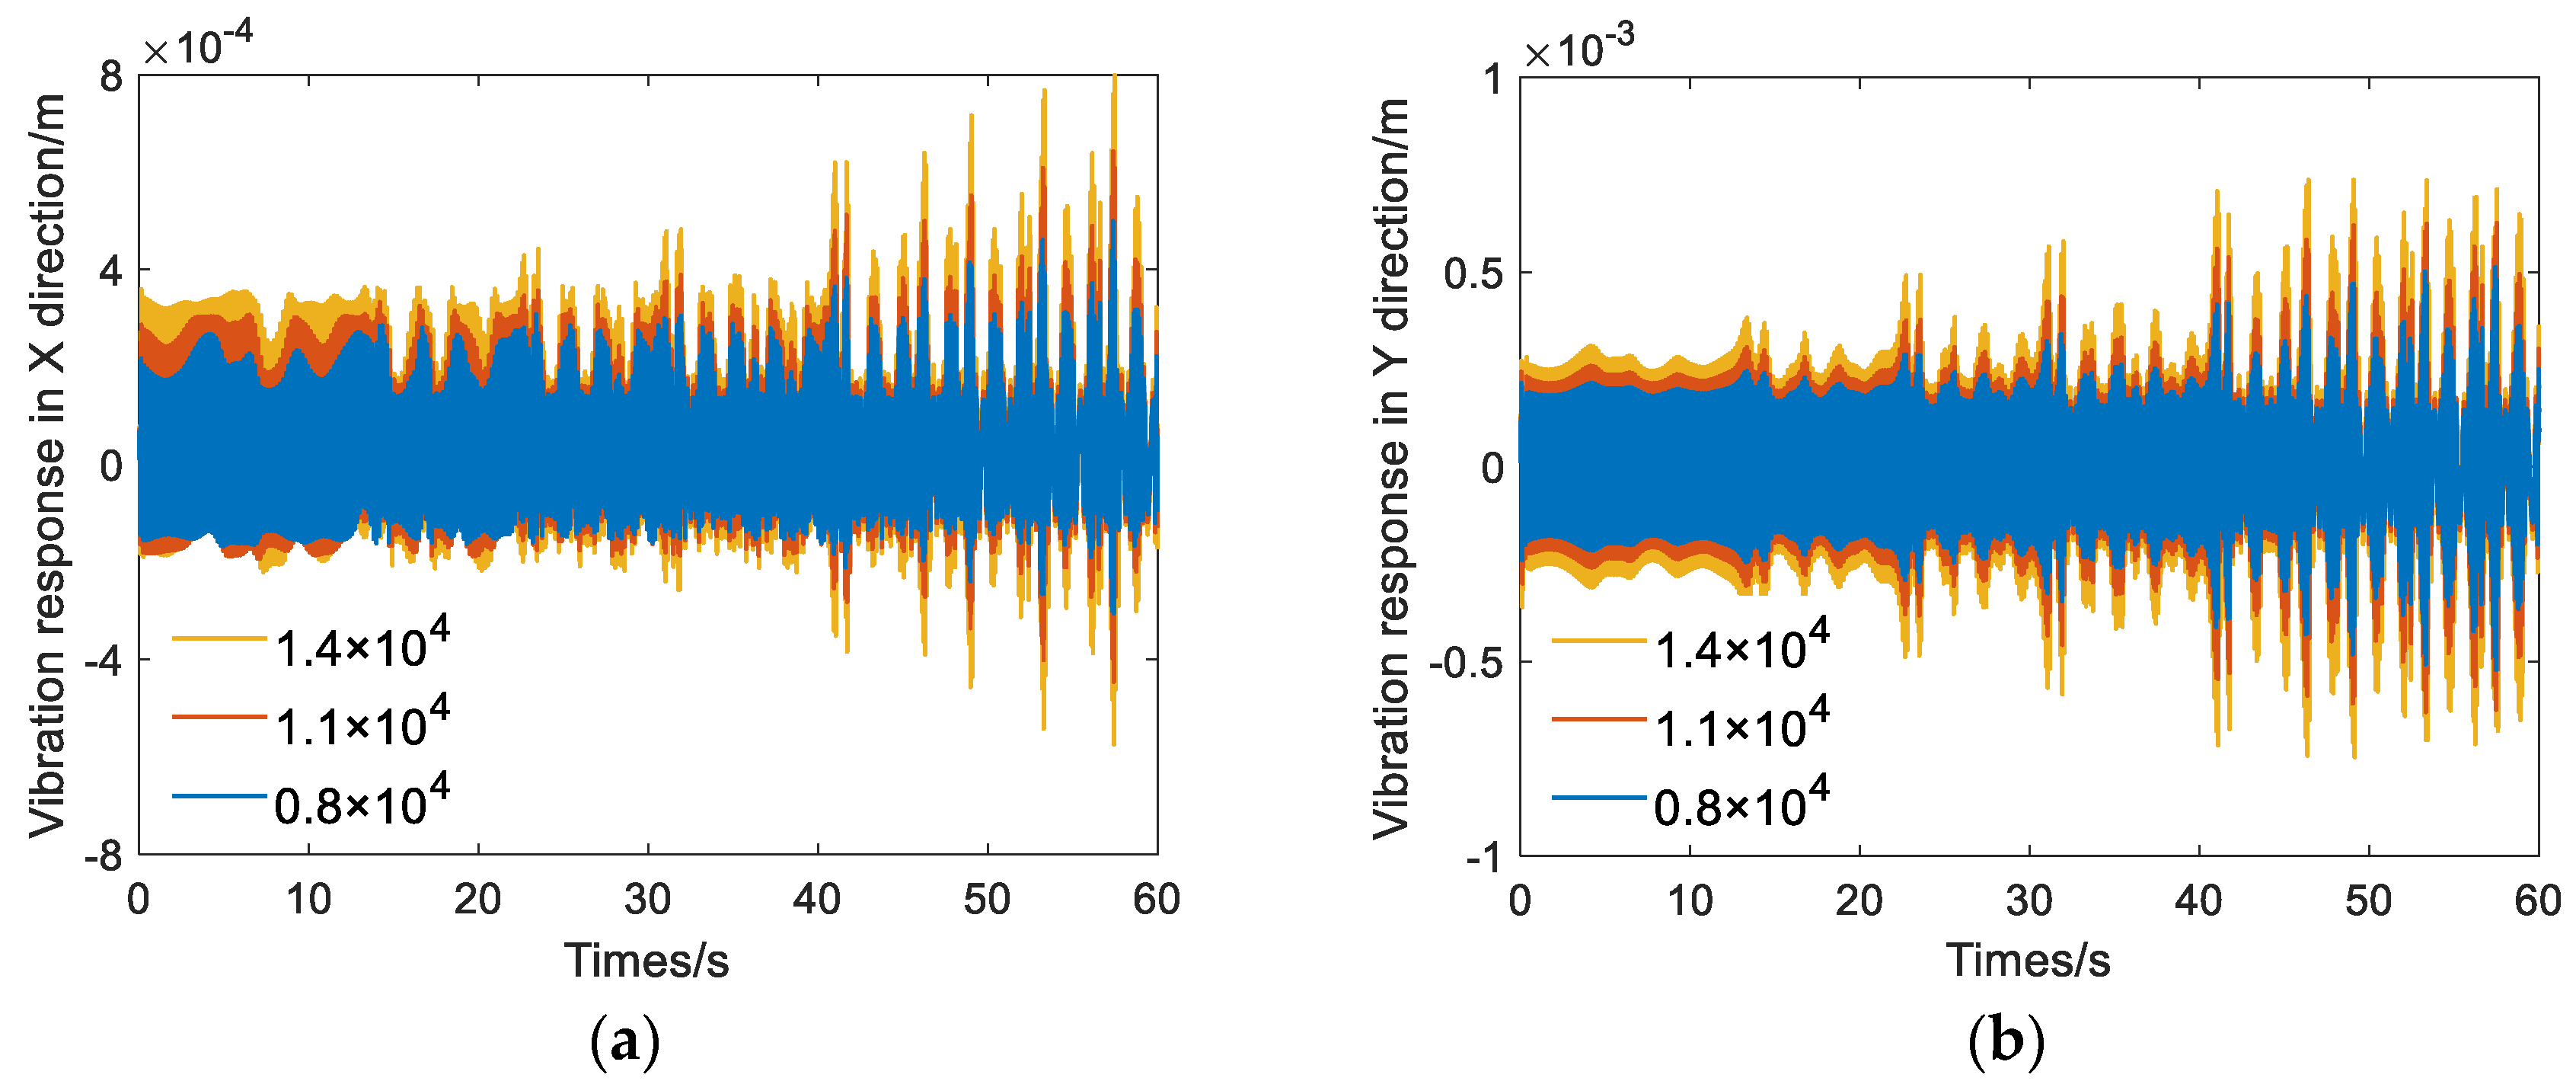
The mass of turbine runner m2 is usually determined by the material used for casting and the number of the blades. Equipment manufacturers may reduce the blade thickness to improve efficiency and use new materials and coatings to resist cavitation and wear; all of these ways may have an impact on m2. From Figure 11, three different runner masses are selected to compare the vibration of the unit. The VRXmax is 7.63 × 10⁻⁴ m when m2 = 1.4 × 10⁴ kg and the VRYmax is 7.37 × 10⁻⁴ m. The VRXmax is 6.06 × 10⁻⁴ m when m2 = 1.1 × 10⁴ kg and the VRYmax is 6.08 × 10⁻⁴ m. When m2 = 0.8 × 10⁴ kg, the VRXmax is 4.60 × 10⁻⁴ m and the VRYmax is 4.70 × 10⁻⁴ m. It can be found that the vibration amplitude of the unit decreases with the decrease of m2. The reason for this phenomenon is that the mass reduction reduces the inertia of the runner and makes it easier to recover from instability. This implies that a lighter runner has the potential to improve operational stability during part-load conditions. Therefore, it is beneficial to reduce the mass of the runner by optimizing the design and processing of the runner while ensuring strength.
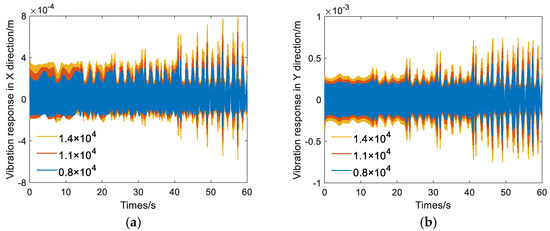
Figure 11.
Shafting vibration response in the X and Y directions of the unit with different m2; (a) shafting vibration response in X direction; (b) shafting vibration response in Y direction.
3.2.2. Electromagnetic Vibration Source
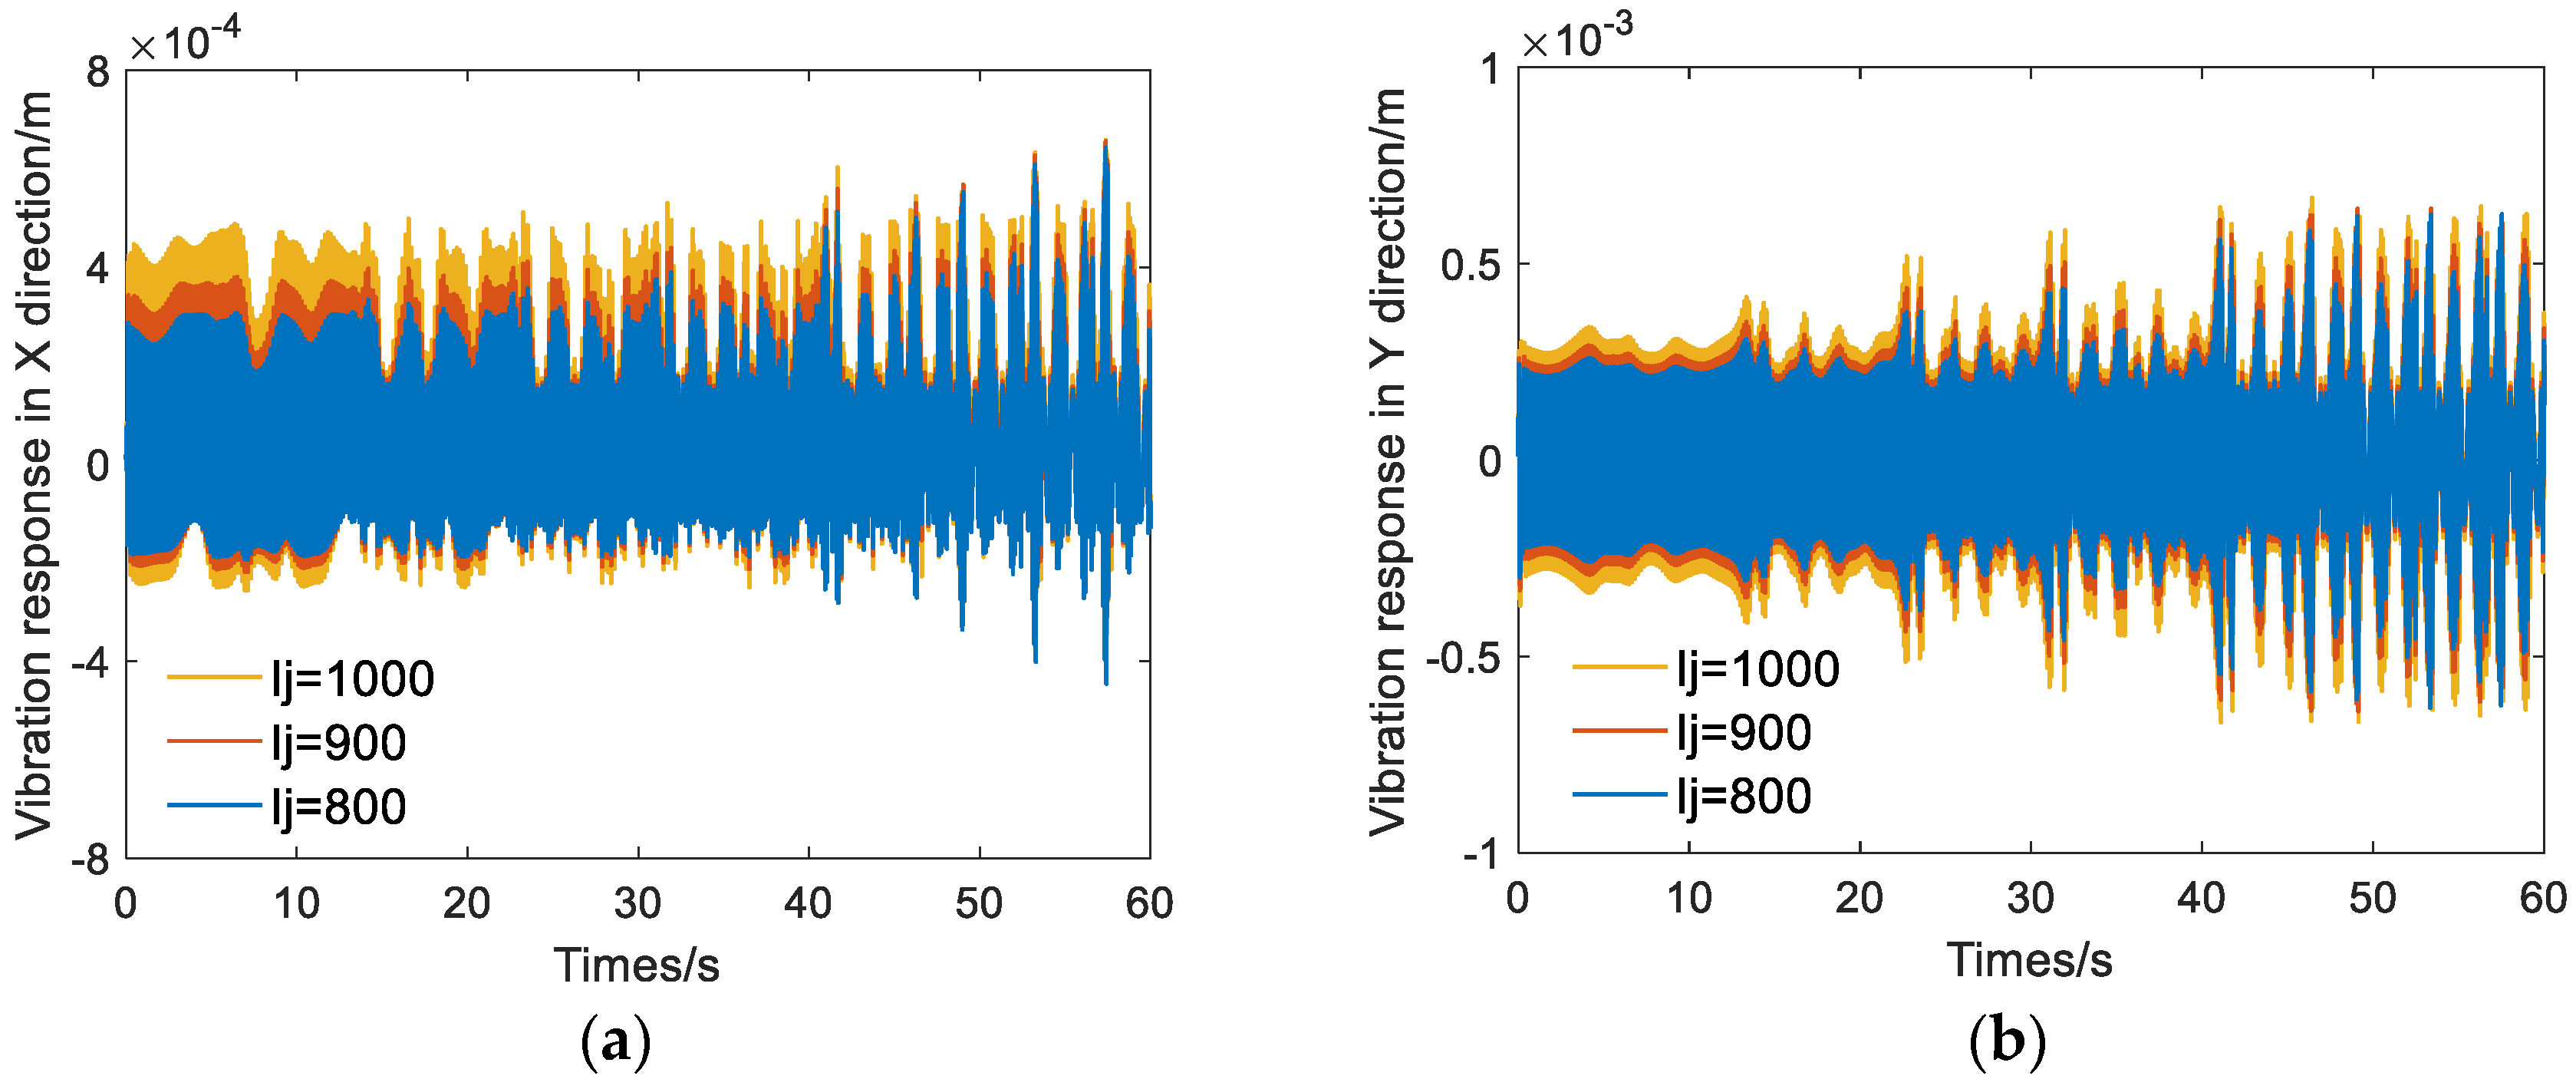
The demagnetization caused by the armature reaction and the voltage drop of leakage impedance have an effect on excitation current Ij. To meet the requirements of power quality, the HGS needs to adjust the excitation current to keep the terminal voltage constant. As observed in Figure 12, when Ij = 1000 A, the VRXmax is 6.33 × 10⁻⁴ m and the VRYmax is 6.46 × 10⁻⁴ m. When Ij = 900 A, the VRXmax is 6.18 × 10⁻⁴ m and the VRYmax is 6.02 × 10⁻⁴ m. When Ij = 800 A, the VRXmax is 6.08 × 10⁻⁴ m and the VRYmax is 5.61 × 10⁻⁴ m. The vibration amplitude of the unit gradually decreases with the decrease of Ij. Excitation current Ij is a key parameter that directly affects the magnitude of the unbalanced magnetic pull, which is a nonlinear factor leading to the vibration and instability of the unit. In engineering practice, the stability of the unit can be improved by optimizing the motor, setting up the auxiliary groove and reducing the eccentricity to suppress the unbalanced magnetic pull.

Figure 12.
Shafting vibration response in the X and Y directions of the unit with different Ij; (a) shafting vibration response in X direction; (b) shafting vibration response in Y direction.
3.2.3. Hydraulic Vibration Source
The vortex rope in the draft tube vibrates and spirals forward during part-load conditions; the pressure pulsation caused by its work on the turbine has a greater risk. In this study, hydraulic factors are mainly reflected in the form of the draft vortex rope. In view of this, the vibration characteristics with or without considering the draft vortex rope are compared to intuitively reflect the influence of hydraulic factors on the unit vibration.
The vibration of a hydroelectric unit without the hydraulic factors is shown in Figure 13. As observed in Figure 13, the operation of the unit is stable at both part-load and rated working conditions without hydraulic factors, which cannot correspond to the unstable phenomenon in engineering practice.

Figure 13.
Shafting vibration response in the X direction and Y direction of the unit without vortex rope.
To accurately evaluate the influence of hydraulic factors on unit vibration, we conduct statistics on the vibration data from Figure 9, Figure 10, Figure 11, Figure 12 and Figure 13 and the results are shown in Table 2. The difference between the vibration with or without hydraulic factors is defined as the hydraulic factors difference (HFD). From Table 2, the maximum of HFD in the X direction (HFDXmax) is 5.92 × 10⁻⁴ m and the maximum of HFD in the Y direction (HFDYmax) is 7.23 × 10⁻⁴ m. It is found that the HFD is significantly bigger than the vibration difference because of other influencing factors, which indicates that the vortex rope in the draft tube as a hydraulic factor has a significant influence on the vibration of the unit. Moreover, the maximum difference (Max-Min) of vibration response in the X direction and Y direction is 2.65 × 10⁻⁴ m and 2.72 × 10⁻⁴ m, respectively, when the hydraulic factor is considered. This reflects that the fluctuations caused by coupling with e2 are the most pronounced compared with other coupled vibration sources. In practical engineering, the stable operation scope of the HGS can be enlarged by the reasonable design of the turbine and the runner flow channel. Air replenishment is also an effective method to reduce the pressure pulsation, but the use of this method is limited because of the huge noise generated during air supply; along with that, the practical application is also affected because of cost and durability.
Table 2.
Comparison between the vibrations of HGS with or without hydraulic vibration source.
4. Conclusions and Discussion
As a clean energy source that combines flexibility and large scale, HGS are increasingly operating at part-load conditions to meet the flexibility demands of the power grid. Therefore, it is particularly important to investigate the stability of HGS operating at part-load conditions. In this study, a model of the HGS that can reflect the characteristic of part-load conditions and the vibration property of the unit was presented. The validity of the coupling model was verified by comparing it with the traditional model and the actual monitoring data from a hydropower station. The working conditions of 0.5, 0.65 and 0.8 were selected to study the dynamic performance laws of the system with different loads. Three typical vibration excitation sources, i.e., hydraulic vibration source, mechanical vibration source and electromagnetic vibration source, were extracted to deeply analyze the vibration characteristic of the HGS operating at a part-load condition. The numerical results show that:
- The hydraulic vibration source has an essential effect on the stability of the HGS at part-load conditions. The pressure pulsation caused by the vortex rope in the draft tube can cause a wide range of output fluctuations of the turbine and bring other conditions that are not conducive to the stability of the HGS. The amplitude and frequency of unit vibration tend to increase with the decrease of the guide vane opening. In engineering practice, controlling the velocity distribution of the runner outlet in design and using means such as air supplementation could mitigate pressure fluctuations in a draft tube at a part-load condition.
- Among the mechanical and electromagnetic vibration sources, mass eccentricity e2 has the most obvious effect on the unit vibration. The amplitude of unit variation increases significantly with the increase of the mass eccentricity. The influence of other vibration sources on the vibration of the unit is relatively small compared with the hydraulic vibration source. The vibration of the unit at a part-load condition can be reduced to a certain extent by improving the manufacturing process, appropriately increasing the stiffness and conducting dynamic balance test on the unit in time.
- Compared with the change of a single vibration source, the vibration of HGS is more intense with the coupling action of a hydraulic-mechanical-electromagnetic vibration source. Therefore, optimization of a single vibration source is hardly effective to improve unit stability. Through a comprehensive analysis of the coupling effect with different vibration sources on unit stability, a system improvement and upgrade plan is conducted; only in this way could the operation range of the unit be extended and the flexibility of the power system be guaranteed.
The way of modeling the vortex rope in this paper could reflect the dynamic characteristics of part-load conditions to some extent, but every turbine and installation can present different characteristics for the vortex rope, depending on their runner and waterway designs. Therefore, the model needs to be further improved in future work to make the results more accurate. The improved flexibility of hydraulic turbines requires not only an extended operating area, but also more frequent transition processes for switching operating conditions, which significantly affects the stability of the unit and control system. Further deterioration of system stability may lead to changes in eigenvalues, which will have a fundamental impact on the dynamic response of the system. Thus, future work will investigate the effect of the superposition of pulsating pressure and water hammer pressure generated by transient processes on unit stability from a system and control perspective.
Author Contributions
Conceptualization, X.L.; software, X.Q.; supervision, D.C.; visualization, J.M.; writing—original draft, G.L. All authors have read and agreed to the published version of the manuscript.
Funding
This research is supported by the Fundamental Research Funds for Northwest A&F University (No. /Z1090220172), the scientific research foundation of the Natural Science Foundation of Shaanxi Province of China (2019JLP-24), the Shaanxi Science and Technology Innovation Team and the Water Conservancy Science and Technology Program of Shaanxi Province (2018slkj-9).
Data Availability Statement
Not applicable.
Conflicts of Interest
The authors declare no conflict of interest.
Nomenclature
| At | Turbine gain coefficient |
| β2 | Angle of blade outlet edge, rad |
| c | Damping coefficient, N∙s/m |
| En | Self-regulation coefficient |
| e1 | Eccentricity of generator, m |
| e2 | Eccentricity of runner, m |
| Ek Ep | Kinetic energy and Potential energy, N·m |
| F | Cross-section area, m2 |
| Fx−c Fy−c | Damping force in the X and Y direction, N |
| Fx−ump Fy−ump | Unbalanced magnetic force in the X and Y direction, N |
| Fx−oil Fy−oil | Oil film forces in the X and Y direction, N |
| h | Relative deviation of flow |
| H | Water head, m |
| hw | Pipeline characteristic coefficient |
| Ij | Excitation current, A |
| J1J2 | Moment of inertia of the generator and turbine runner, kg/m2 |
| k1k2 | Stiffness of the rotor and runner, N/m |
| kp ki kd | Proportional gain, s; Integral gain Differential gain, s−1 |
| kj | Air-gap flux potential, At |
| Kx | Correction coefficient |
| L | Rotor length of the generator, m |
| m1m2 | Masses of the generator rotor and turbine runner respectively, kg |
| Mg | Electromagnetic torque, N∙m |
| mg0 | Load disturbance |
| mg | Relative deviation of the electromagnetic torque |
| MgR | Rated electromagnetic torque, N∙m |
| ∆hq | Transient changes of water head |
| y | Relative value of guide vane opening |
| Mt | Torque of the turbine, N∙m |
| mt | Relative deviation of the turbine torque |
| n | Relative deviation of rotation speed |
| N | Rotating speed of runner, rad/min |
| Pt | Relative value of output, w |
| q | Relative deviation of flow, m3/s |
| q0 | Initial value of flow, m3/s |
| qnl | Flow in no-load condition, m3/s |
| Q | Discharge of turbine, m3/s |
| r2 | Radius of blade outlet edge at exit, m |
| R | Rotor radius of the generator, m |
| ra | Radius of lower ring at midpoint, m |
| Tab | Inertia time constant, s |
| re | Shaft misalignment, m |
| Ty | Servomotor response time constant, s |
| Tr | Elastic water hammer time constant, s |
| U2 | Absolute velocity at runner exit, m3/s |
| Vma | Axial component at the midpoint, m/s |
| Vu2 | Circumferential component of absolute speed at runner exit, m/s |
| Vm2 | Axial velocity at runner exit, m/s |
| Vua | Circumferential velocity of blade outlet edge at midpoint, m/s |
| θ0 | Initial phase Angle of the shafting, rad |
| ρ | Density of water kg/m3 |
| ωR | Rated value of the unit speed, r/min |
| λ | rotation angle, rad |
| μ0 | air permeability |
| ∆q | Transient change of flow |
Appendix A
(1) The intermediate variable of unbalanced magnetic pull
(2) Intermediate variables AM and BM and their expression
(3) The stiffness and damping coefficients of the oil film forces
where B/d is the width-to-diameter ratio of the bearing; is the eccentricity; E is the eccentricity of the bearing; and C is the radial clearance of the bearing.
(4) Parameter values of HGS
(1) Parameter values of HTGS:
Hydro turbine and generator: At = 1.1364, qnl = 0.12, mt0 = 0.5, mg0 = 0, En = 1.5 Pipeline: hw = 2 s, Tr = 1 s.
Governor: Kp = 3 s, Ki = 2, Kd = 0.5 s−1, Ty = 0.15 s.
Draft tube vortex: r2 = 2.05 m, ra = 1.45 m, β2 = 0.28 rad, N = 130 r/min, H = 125 m, Kx = 1.11.
(2) Parameter values of shafting system:
m1 = 1.5 × 10⁴ kg, m2 = 1.1 × 10⁴ kg, e1 = 0.0005 m, e2 = 0.0005 m, J1 = 7.9 × 10⁶ kg∙m2, J2 = 3.8 × 10⁶ kg∙m2, c = 6.5 × 10⁵ N∙s/m, r = 10−6 m, θ0 = 1 rad, φ0 = 0.65 rad, MgR = 7.497 × 10⁵ N/m, ωR = 13.61 rad/s, L = 2.5m, Kj = 27550At, R = 2.12m, Ij = 800 A, μ0 = 4π × 10−7 H/m.
References
- International Energy Agency. Net Zero by 2050, A Roadmap for the Global Energy Sector. 2021. Available online: https://www.iea.org/events/net-zero-by-2050-a-roadmap-for-the-global-energy-system (accessed on 20 May 2022).
- Zhang, Y.; Ma, C.; Lian, J.; Pang, X.; Qiao, Y.; Chaima, E. Optimal photovoltaic capacity of large-scale hydro-photovoltaic complementary systems considering electricity delivery demand and reservoir characteristics. Energy Convers. Manag. 2019, 195, 597–608. [Google Scholar] [CrossRef]
- Hirth, L. The benefits of flexibility: The value of wind energy with hydropower. Appl. Energy 2016, 181, 210–223. [Google Scholar] [CrossRef]
- Pasche, S.; Gallaire, F.; Avellan, F. Origin of the synchronous pressure fluctuations in the draft tube of Francis turbines operating at part load conditions. J. Fluids Struct. 2019, 86, 13–33. [Google Scholar] [CrossRef]
- Pasche, S.; Avellan, F.; Gallaire, F. Part Load Vortex Rope as a Global Unstable Mode. J. Fluids Eng. Trans. ASME 2017, 139, 051102. [Google Scholar] [CrossRef]
- Pereira, J.G.; Favrel, A.; Andolfatto, L.; Landry, C.; Alligné, S.; Nicolet, C.; Avellan, F. Procedure for predicting part load resonance in Francis turbine hydropower units based on swirl number and local cavitation coefficient similitude. Mech. Syst. Signal Process. 2019, 132, 84–101. [Google Scholar] [CrossRef]
- Zhang, H.; Guo, P.; Sun, L. Transient analysis of a multi-unit pumped storage system during load rejection process. Renew. Energy 2020, 152, 34–43. [Google Scholar] [CrossRef]
- Trivedi, C. Time-dependent inception of vortex rings in a Francis turbine during load variation: Large eddy simulation and experimental validation. J. Hydraul. Res. 2020, 58, 790–806. [Google Scholar] [CrossRef]
- Zhang, L.; Wu, Q.; Ma, Z.; Wang, X. Transient vibration analysis of unit-plant structure for hydropower station in sudden load increasing process. Mech. Syst. Signal Process. 2019, 120, 486–504. [Google Scholar] [CrossRef]
- Lai, X.; Li, C.; Zhou, J.; Zhang, Y.; Li, Y. A multi-objective optimization strategy for the optimal control scheme of pumped hydropower systems under successive load rejections. Appl. Energy 2020, 261, 114474. [Google Scholar] [CrossRef]
- Riasi, A.; Tazraei, P. Numerical analysis of the hydraulic transient response in the presence of surge tanks and relief valves. Renew. Energy 2017, 107, 138–146. [Google Scholar] [CrossRef] [Green Version]
- Guo, P.; Zhang, H.; Gou, D. Dynamic characteristics of a hydro-turbine governing system considering draft tube pressure pulsation. IET Renew. Power Gener. 2020, 14, 1210–1218. [Google Scholar] [CrossRef]
- Silva, P.; Nicolet, C.; Grillot, P.; Drommi, J.-P.; Kawkabani, B. Assessment of power swings in hydropower plants through high-order modelling and eigenanalysis. In Proceedings of the XXII International Conference on Electrical Machines, Lausanne, Switzerland, 4–7 September 2016. [Google Scholar]
- Altimemy, M.; Attiya, B.; Daskiran, C.; Liu, I.H.; Oztekin, A. Mitigation of flow-induced pressure fluctuations in a Francis turbine operating at the design and partial load regimes—LES simulations. Int. J. Heat Fluid Flow 2019, 79, 108444. [Google Scholar] [CrossRef]
- Favrel, A. Dynamics of the Cavitation Precessing Vortex Rope for Francis Turbines at Part Load Operating Conditions; EPFL: Lausanne, Switzerland, 2016. [Google Scholar]
- Zhu, L.; Zhang, R.; Yu, A.; Lu, L.; Luo, X.W. Suppression of vortex rope oscillation and pressure vibrations in Francis turbine draft tube using various strategies. J. Hydrodyn. 2021, 33, 534–545. [Google Scholar] [CrossRef]
- Muhirwa, A.; Cai, W.H.; Su, W.T.; Liu, Q.; Binama, M.; Li, B.; Wu, J. A review on remedial attempts to counteract the power generation compromise from draft tubes of hydropower plants. Renew. Energy 2019, 150, 743–764. [Google Scholar] [CrossRef]
- Gavrilov, A.A.; Sentyabov, A.V.; Dekterev, A.A.; Hanjalić, K. Vortical structures and pressure pulsations in draft tube of a Francis-99 turbine at part load: RANS and hybrid RANS/LES analysis. Int. J. Heat Fluid Flow 2017, 63, 158–171. [Google Scholar] [CrossRef]
- Yu, A.; Zou, Z.; Zhou, D.; Zheng, Y.; Luo, X. Investigation of the correlation mechanism between cavitation rope behavior and pressure fluctuations in a hydraulic turbine. Renew. Energy 2020, 147, 1199–1208. [Google Scholar] [CrossRef]
- Müller, A.; Favrel, A.; Landry, C.; Avellan, F. Fluid–structure interaction mechanisms leading to dangerous power swings in Francis turbines at full load. J. Fluids Struct. 2017, 69, 56–71. [Google Scholar] [CrossRef]
- Wu, Q.; Zhang, L.; Ma, Z. Model establishment and numerical simulation of a dynamic coupled hydraulic-mechanical-electric-structural system for a hydropower station. J. Vib. Shock 2017, 87, 459–474. [Google Scholar] [CrossRef] [Green Version]
- Xu, B.; Zhang, J.; Egusquiza, M.; Chen, D.; Li, F.; Behrens, P.; Egusquiza, E. A review of dynamic models and stability analysis for a hydro-turbine governing system. Renew. Sustain. Energy Rev. 2020, 144, 110880. [Google Scholar] [CrossRef]
- IEEE Group. Hydraulic turbine and turbine control models for system dynamic studies. IEEE Trans. Power Syst. 1992, 7, 167–179. [Google Scholar] [CrossRef]
- Qu, F.; Guo, W. Robust H∞ control for hydro-turbine governing system of hydropower plant with super long headrace tunnel. Int. J. Electr. Power Energy Syst. 2021, 124, 106336. [Google Scholar] [CrossRef]
- Zhao, Z.; Chen, D.; Li, H.; Wei, H. Performance analysis of pumped-storage plant from condenser mode to generating process. J. Energy Storage 2020, 29, 101286. [Google Scholar] [CrossRef]
- Liu, G.; Chen, D.; Li, H.; Ye, J.; Zhang, H.; Liu, J.; Skjelbred, H.I.; Kong, J. Dynamical assessment of a PTGS with time delay. IET Renew. Power Gener. 2019, 13, 2594–2603. [Google Scholar] [CrossRef]
- Trivedi, C.; Gogstad, P.J.; Dahlhaug, O.G. Investigation of the Unsteady Pressure Pulsations in the Prototype Francis Turbines-Part 1: Steady State Operating Conditions. Mech. Syst. Signal Process. 2018, 108, 188–202. [Google Scholar] [CrossRef] [Green Version]
- Jonsson, P.P.; Mulu, B.G.; Cervantes, M.J. Experimental investigation of a Kaplan draft tube–Part II: Off-design conditions. Appl. Energy 2012, 94, 71–83. [Google Scholar] [CrossRef]
- Muhirwa, A.; Li, B.; Su, W.T.; Liu, Q.Z.; Binama, M.; Wu, J.; Cai, W.H. Investigation on mutual traveling influences between the draft tube and upstream components of a Francis turbine unit. Renew. Energy 2020, 162, 973–992. [Google Scholar] [CrossRef]
- Zeng, Y.; Zhang, L.; Guo, Y.; Qian, J.; Zhang, C. The generalized Hamiltonian model for the shaft transient analysis of the hydro-turbine generating units. Nonlinear Dyn. 2014, 76, 1921–1933. [Google Scholar] [CrossRef] [Green Version]
- Shi, Y.; Zhou, J.; Lai, X.; Xu, Y.; Guo, W.; Liu, B. Stability and sensitivity analysis of the bending-torsional coupled vibration with the arcuate whirl of hydro-turbine generator unit. Mech. Syst. Signal Process. 2021, 149, 107306. [Google Scholar] [CrossRef]
- Yan, D.; Zhuang, K.; Xu, B.; Chen, D.; Mei, R.; Wu, C.; Wang, X. Excitation Current Analysis of a Hydropower Station Model Considering Complex Water Diversion Pipes. J. Energy Eng. 2017, 143, 04017012. [Google Scholar] [CrossRef]
- Zhang, L.; Ma, Z.; Wu, Q.; Wang, X. Vibration analysis of coupled bending-torsional rotor-bearing system for hydraulic generating set with rub-impact under electromagnetic excitation. Arch. Appl. Mech. 2016, 86, 1665–1679. [Google Scholar] [CrossRef]
- Evestedt, F.; Perez-Loya, J.J.; Abrahamsson, C.J.D.; Lundin, U. Mitigation of Unbalanced Magnetic Pull in Synchronous Machines with Rotating Exciters. IEEE Trans. Energy Convers. 2021, 36, 812–819. [Google Scholar] [CrossRef]
- Li, J.; Chen, D.; Liu, G.; Gao, X.; Miao, K.; Li, Y.; Xu, B. Analysis of the gyroscopic effect on the hydro-turbine generator unit. Mech. Syst. Signal Process. 2019, 132, 138–152. [Google Scholar] [CrossRef]
- Yan, D.; Chen, Q.; Zheng, Y.; Liu, W. Parameter sensitivity and dynamic characteristic analysis of bulb hydro generating unit with shaft crack fault. Mech. Syst. Signal Process. 2021, 158, 107732. [Google Scholar] [CrossRef]
- Xu, B.; Chen, D.; Hao, Z.; Li, C.; Zhou, J. Shaft mis-alignment induced vibration of a hydraulic turbine generating system considering parametric uncertainties. J. Sound Vib. 2018, 435, 74–90. [Google Scholar] [CrossRef]
- Chen, S. Research on the Operating Stability of Francis Turbine. Master’s Thesis, Tianjin University, Tianjin, China, 2004. (In Chinese). Available online: https://kns.cnki.net/KCMS/detail/detail.aspx?dbname=CMFD9904&filename=2004075422.nh (accessed on 20 May 2022).

Publisher’s Note: MDPI stays neutral with regard to jurisdictional claims in published maps and institutional affiliations. |
© 2022 by the authors. Licensee MDPI, Basel, Switzerland. This article is an open access article distributed under the terms and conditions of the Creative Commons Attribution (CC BY) license (https://creativecommons.org/licenses/by/4.0/).