Abstract
The increasing use of high-voltage transmission wires requires more and more high-voltage pylons, and sometimes, constructing pylons in mining areas is very urgent. To ensure the safe operation of pylons, coal pillars with large side lengths are usually used to provide sufficient support; however, this results in a huge waste of coal. Eight high-voltage pylons are arranged on the ground surface corresponding to the location of working face 1110 of Sima Coal Mine in Shanxi Province, China, which cannot be mined by traditional methods. Taking this as the engineering background, the failure mode of high-voltage pylon is first analyzed. Using FLAC3D numerical simulations, the influence of five different mining plans on ground surface deformation in working face 1110 is evaluated, and the vertical settlement and horizontal deformation in different areas of the ground surface, as well as the variation law of horizontal strain and slope are analyzed. According to the numerical simulation results, the range of thickness-limiting mining or backfill mining in working face 1110 is shown in scheme 3, and the key regions in the mining process are determined. Secondly, the strengthening scheme of high-voltage pylons is designed, that is, the four foundations of high-voltage pylons are connected as a whole with steel supports and steel connectors so as to improve the structural strength of the high-voltage pylon. Finally, the position change in the foundation of high-voltage pylons was monitored for 22 consecutive months. The results show that the maximum settlement of the high-voltage tower foundation is 3.1 m, which is consistent with the actual mining thickness; The high-voltage pylon was stably moved, and the change in transmission line tension and total length was usually less than 1.0%. The combined mining scheme and foundation strengthening scheme can ensure the safe operation of high-voltage pylons and provide a new method for the stability control of ground buildings in coal mining subsidence area.
1. Introduction
Coal mining activities, especially in shallow coal mines are the main cause of geological hazards, such as surface subsidence, surface cracking or surface movement [1,2,3,4], which makes the surface buildings in mining areas more prone to losing their stability or even failure [5,6,7]. With the increasingly used high-voltage transmission lines, high-voltage pylons are currently becoming more and more popular. Because of the designed layout of high-voltage transmission lines, sometimes, constructing high-voltage pylons in mining areas is necessary. Protecting these high-voltage pylons from geological hazards caused by mining disturbance is essential to ensure the normal operation of transmission wires along the route [8]. Unlike other surface buildings, such as industrial workshops or residential buildings, high-voltage pylons are columnar shaped, with relatively low bending stiffness, and their four bases are often independently arranged, with little force restraints between each of them [9,10]; therefore, when they are disturbed, high-voltage pylons may potentially not only settle as a whole, but may overturn or even become twisted because of their non-uniform ground surface subsidence or ground surface movement [10,11].
To protect high-voltage pylons in mining areas [11,12], it is required that, on ground surfaces, all areas extending outward 15 m from the base of high-voltage pylons should be protected (as shown in Figure 1a). To achieve this, the geotechnical protection layers with an isosceles trapezoidal section should be reserved under the protection areas. The base angles of the protection layers in the soil layer and rock layer are 45° and 75°, respectively (Figure 1b) [12,13,14]. These protection layers form a pyramid-like foundation that provides adequate support to high-voltage pylons [14,15]. However, considering the depth of the coal seam is often at least 200 m, the designed geotechnical protection layers require much wider coal pillars. For example, if the thickness of soil layer and rock layer is assumed to be 180 m and 36 m, respectively, a coal pillar with a width of about 400 m is required (Figure 1b), and it is about 8–10 times wider than normal coal pillars [16,17,18]. Once there are too many high-voltage pylons, overly wide coal pillars would cause a great waste of coal resource; therefore, developing a proper scheme that can reduce the width of coal pillars, while ensuring the safe operation of high-voltage pylons, is of great economic significance.
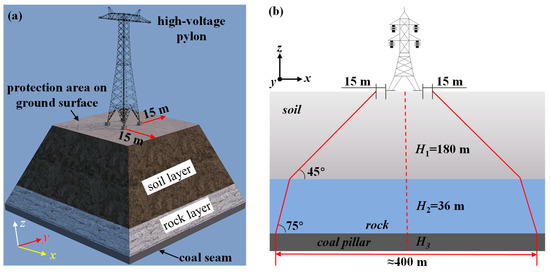
Figure 1.
Schematic diagrams of the protection area and geotechnical protection layers designed for high-voltage pylons constructed in mining areas. (a) Protection area on ground surface and (b) area of the geotechnical protection layers. Based on requirements of the literature [12].
This study focuses on how to recover as many coal resources as possible under high-voltage pylons, while ensuring the stability of the high-voltage pylon in mining subsidence areas. By taking working face 1110 of Sima Coal Mine in China as an example, where there are many high-voltage pylons, the authors designed a mining scheme that combined a fully mechanized caving mining method, thickness-limiting mining method, backfill mining method and a foundation strengthening scheme for the pylons to improve the mining production while protecting the pylons. To be specific, according to the positions of pylons on ground surface, some of the coal seams in working face 1110 were defined as key regions, in which thickness-limiting mining or backfill mining was used, whereas fully mechanized caving mining was used in the remaining regions. Meanwhile, steel beam connections were added to the bases of pylons to provide additional reinforcement. A numerical simulation study was conducted to determine the scope of key regions, and the actual deformation and displacement of bases of some typical pylons were monitored on site during coal mining. The results show that the mining scheme designed here could significantly increase coal production, and the reinforcement method was helpful in maintaining the safe operation of pylons. These findings highlight new methods of lowering the failure risk of surface buildings in areas where underground mining activities frequently occur.
2. Engineering Background
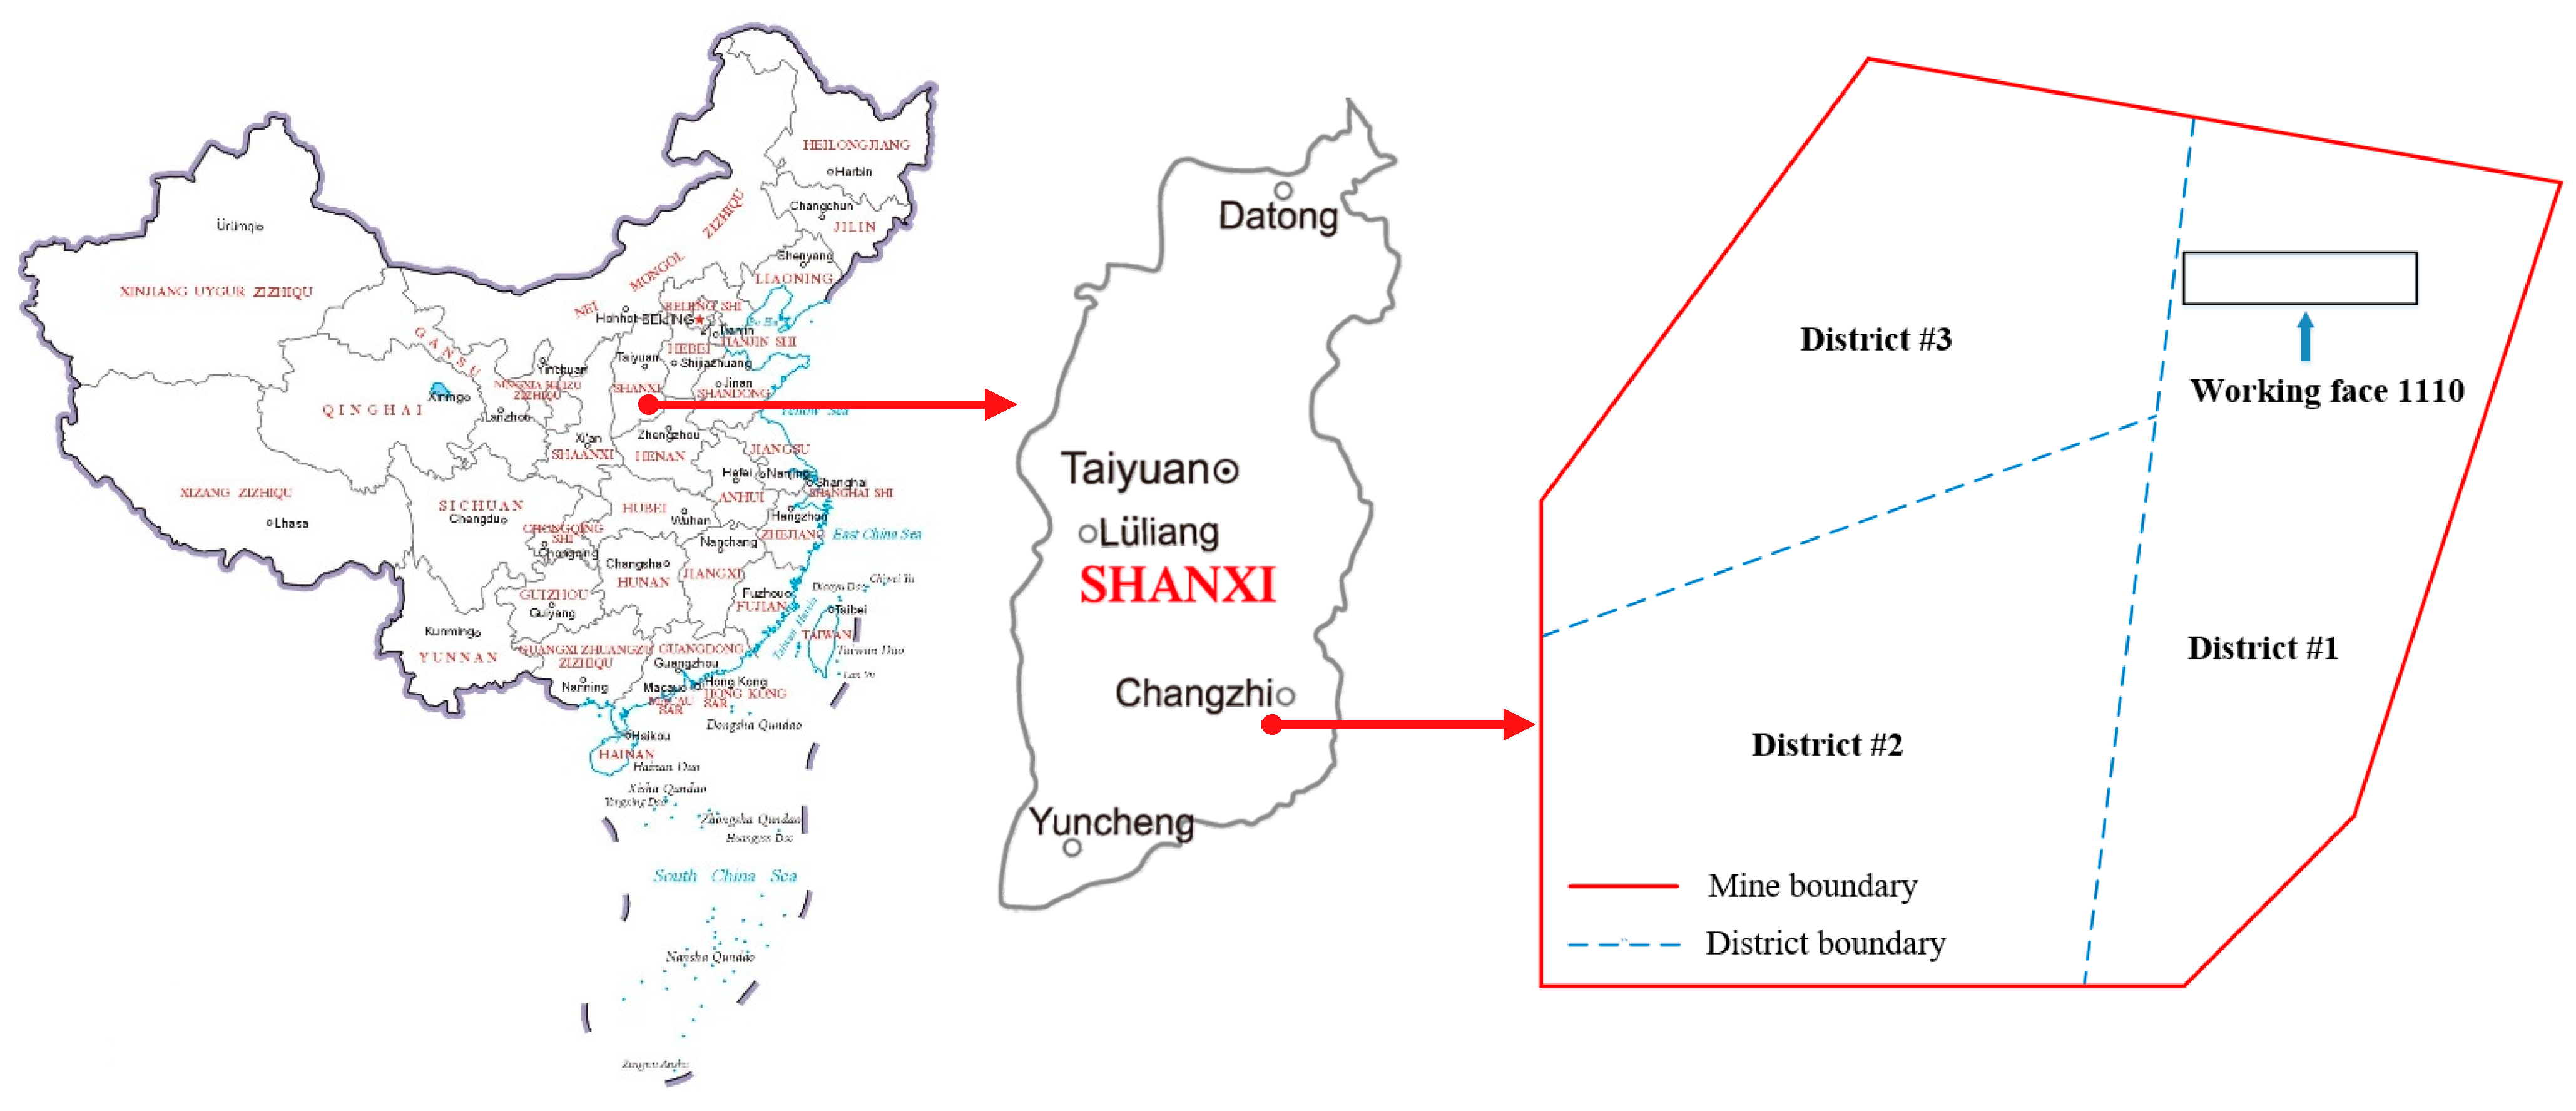
The chosen coal mine, Sima Coal Mine, with a total area of about 29.5 km2, is located in Shangdang Region, Changzhi County, Shanxi Province, China (as shown in Figure 2). The total coal reserves in this coal mine are about 9.66 × 10⁶ tons. There are three districts in Sima Coal Mine, and the area of interest is working face 1110 within District #1 (Figure 2).
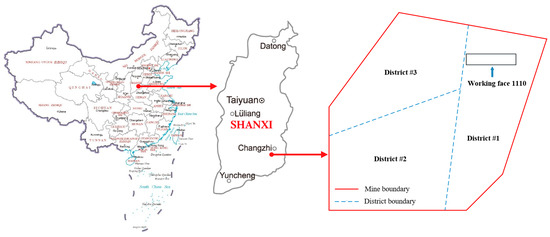
Figure 2.
Locations of the Sima Coal Mine and working face 1110.
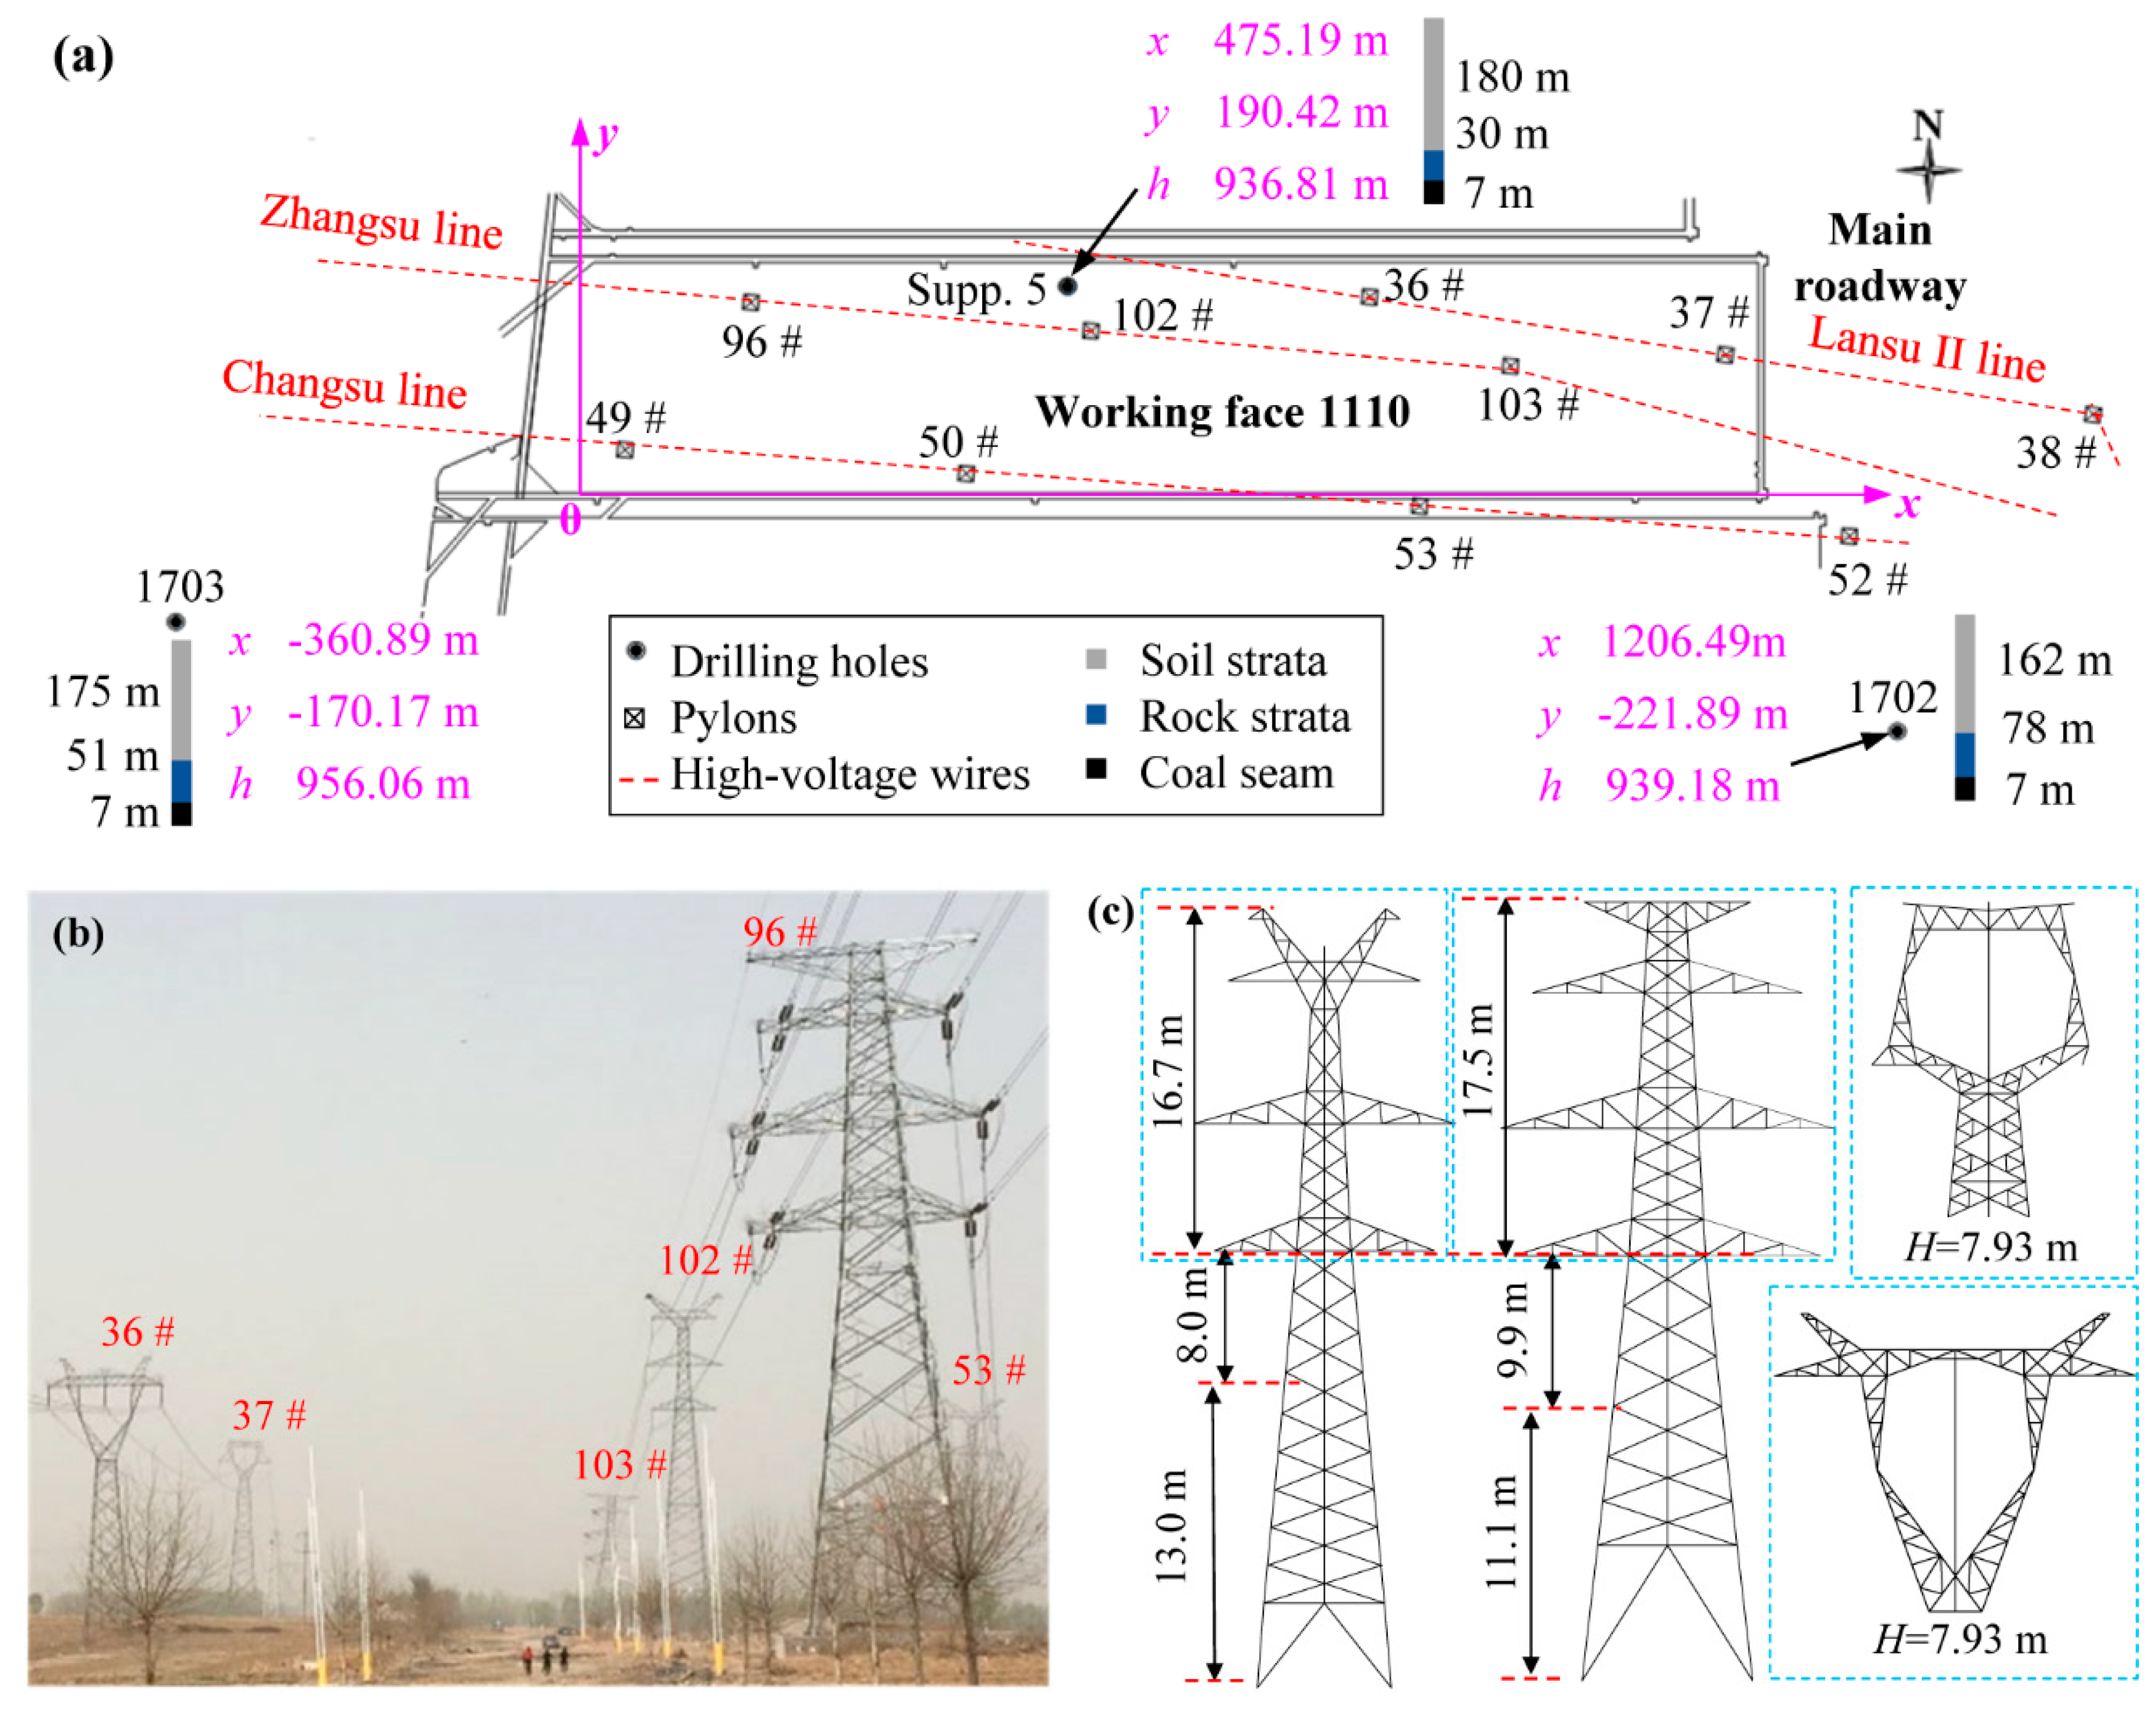
As shown in Figure 3a, working face 1110 goes from west to east and it is about 1100 m in x direction and 220 m in y direction. Over working face 1110, there are three high-voltage wires—Lansu II line, Zhangsu Line and Changsu Line—that run from northwest to southeast, and eight high-voltage pylons (36#, 37#, 49#, 50#, 53#, 96#, 102#, and 103#) are found in this area. A picture of these high-voltage pylons is shown in Figure 3b, and their total height is over 45 m (Figure 3c), depending on which kind of tower head is inserted. The position coordinates of these pylons in the x-y plane are presented in Table 1.
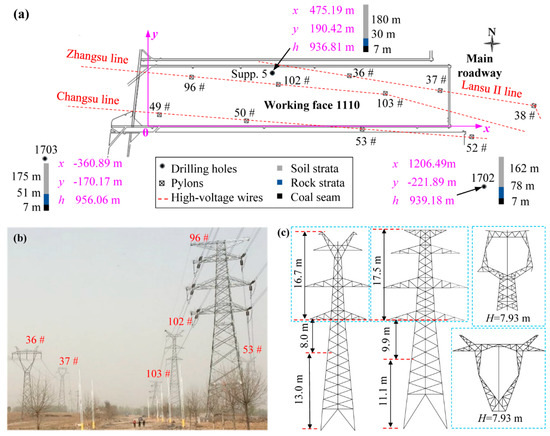
Figure 3.
(a) Schematic diagram of distributions of high-voltage pylons over working face 1110, (b) physical picture and (c) geometry of high-voltage pylons.

Table 1.
Position coordinates of high-voltage pylons over working face 1110.
Figure 3a and Table 1 show that the linear distances between any two adjacent pylons are in the range of about 145 m (between 36# and 103#) to 400 m (between 50# and 53#). The geological drilling exploration results (Figure 3a) show that the depth of coal seams is about 210–240 m, and the thicknesses of the rock strata and soil layer above the coal seam are about 160–180 m and 30–80 m, respectively. If the suggested method shown in Figure 1 is used to protect high-voltage pylons [11,12], the side length of coal pillars in working face 1110 should be about 365–380 m. As a result, all coal resource stored here would not be mined, causing a direct economic loss of about CNY 1 billion; therefore, a proper mining scheme and protection measures are required to overcome this issue, which ultimately requires knowledge of the possible failure modes of pylons.
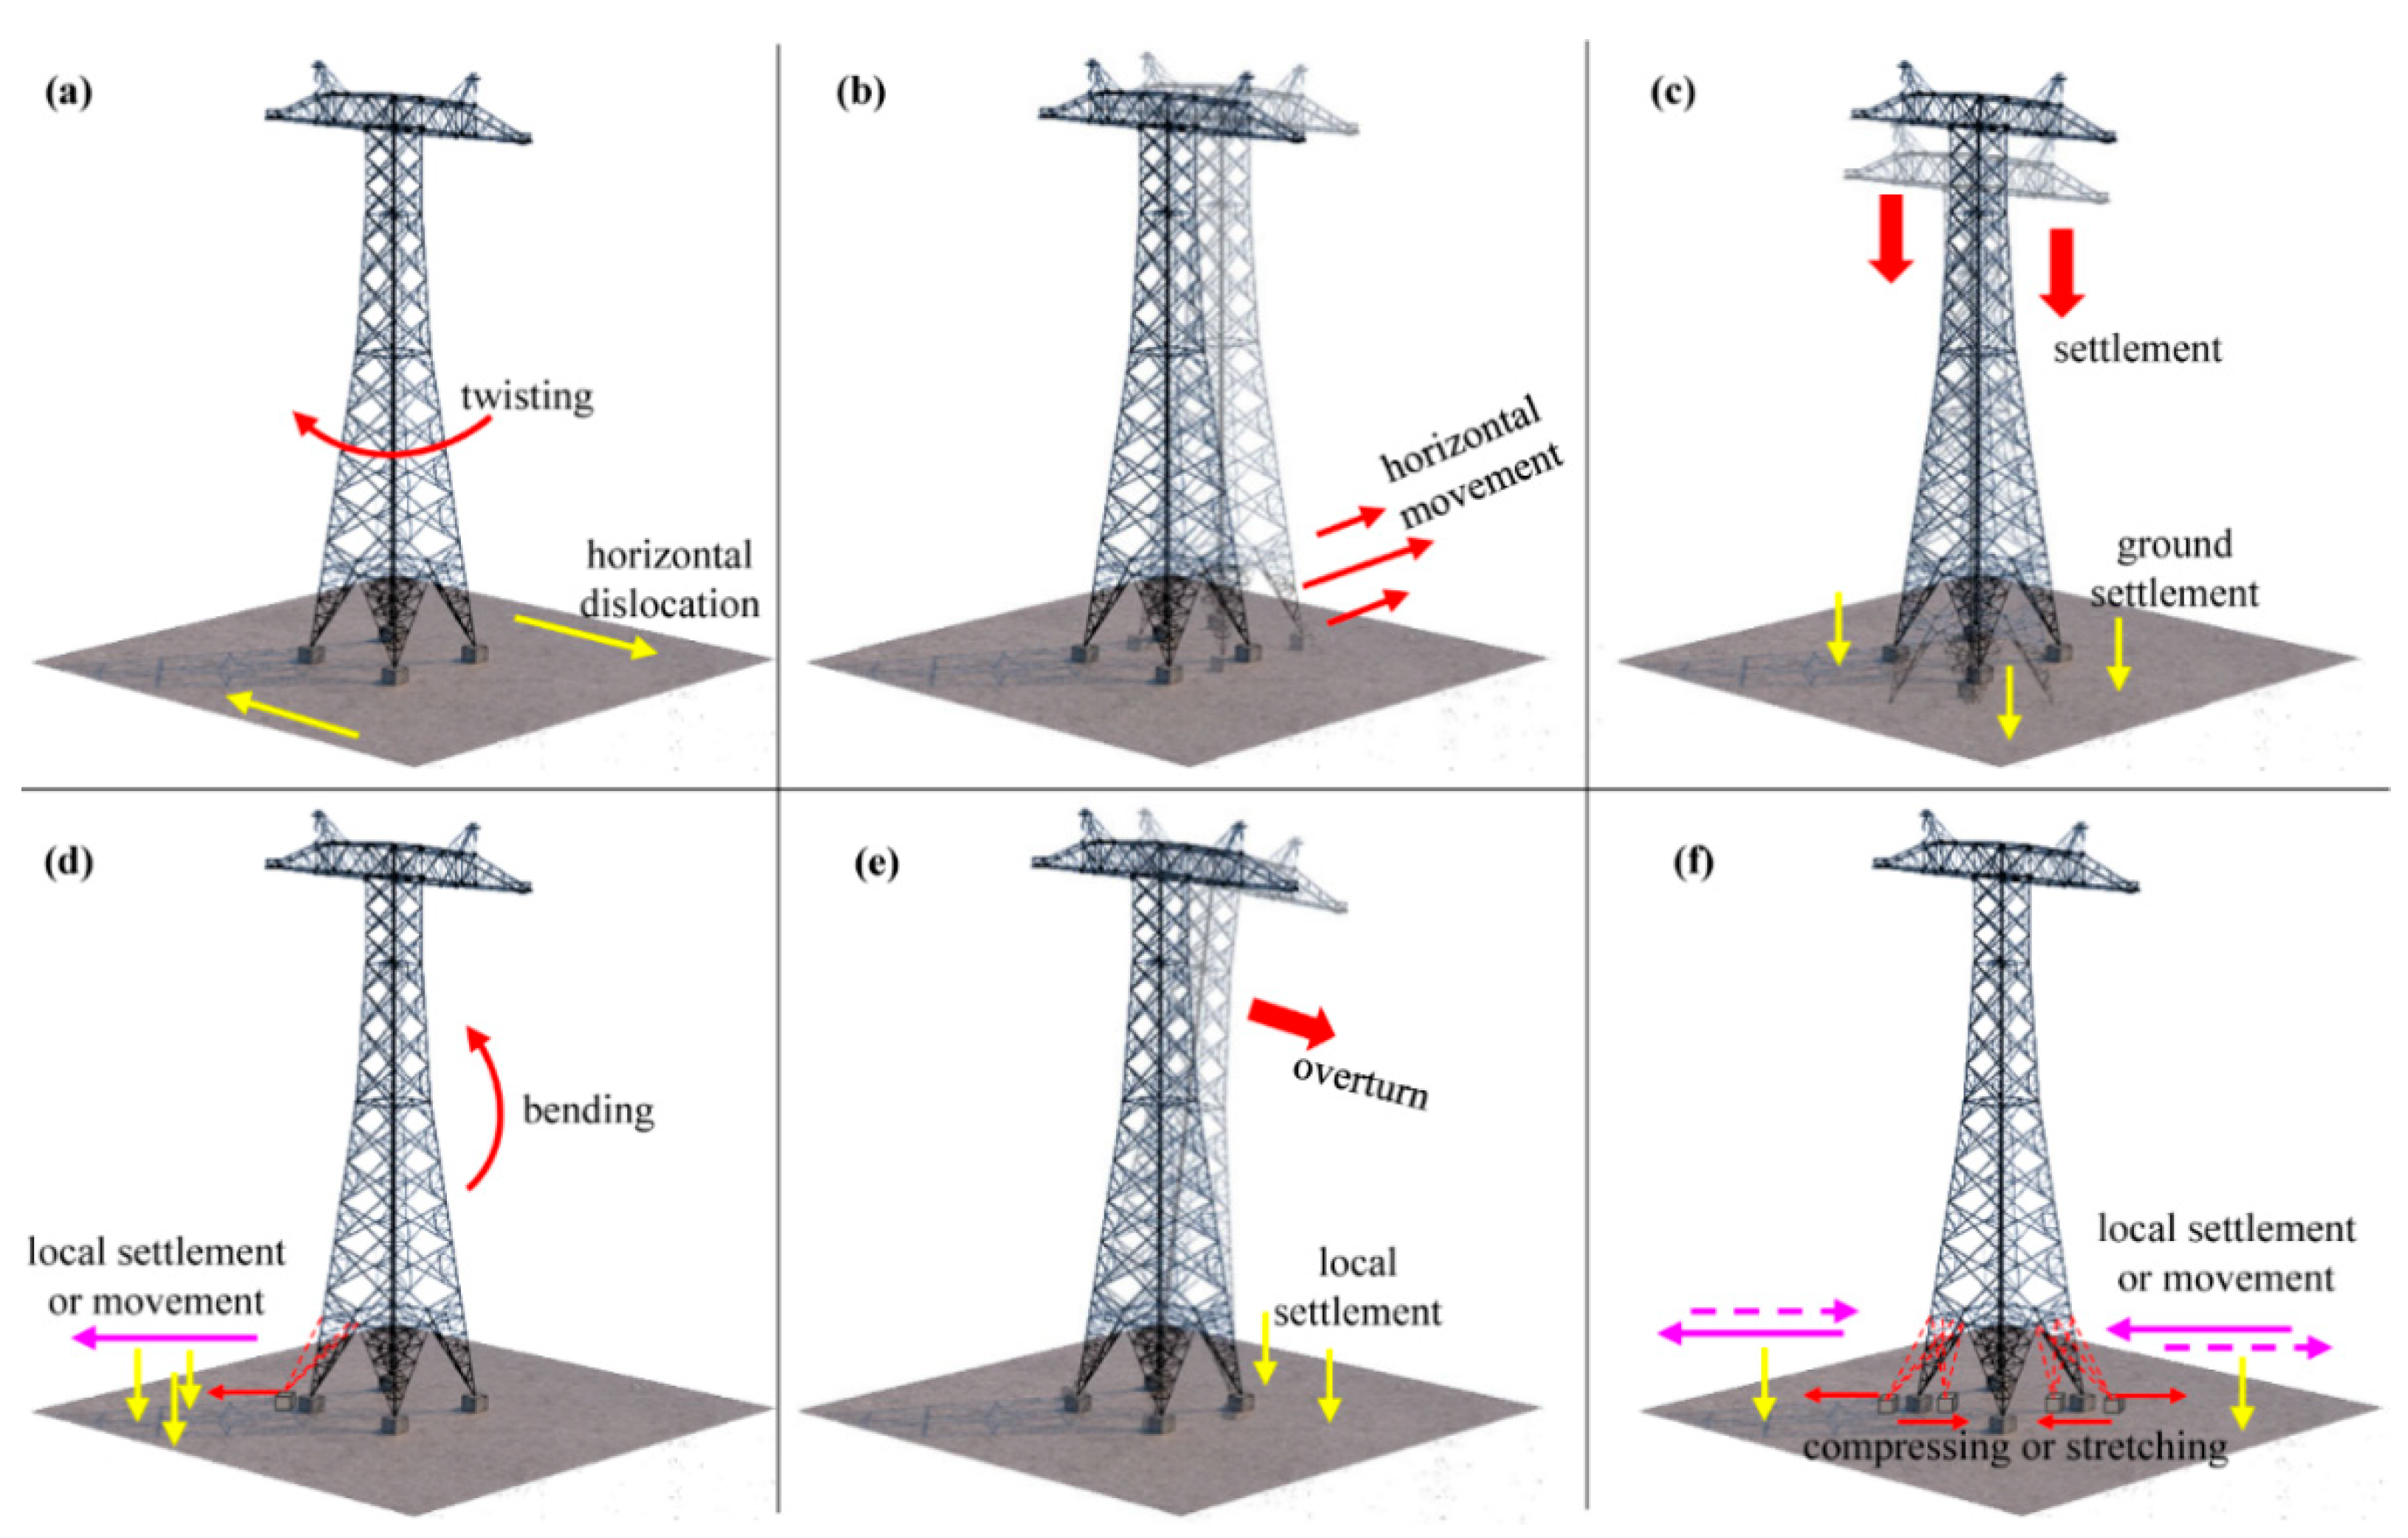
According to the commonly seen geological hazards caused by mining activity in shallow coal mines [1,2,19] and the structural characteristics of high-voltage pylons [9,10], the failure modes of pylons are identified as the twisting deformation, horizontal movement, vertical settlement, bending deformation, base-stretching/compressing and overturn (as shown in Figure 4).

Figure 4.
Possible failure modes of a high-voltage pylon: (a) twisting deformation, (b) horizontal movement, (c) vertical settlement, (d) bending, (e) overturn and (f) base-stretching/compressing.
For a pylon, the twisting deformation is mainly caused by the horizontal dislocation of the ground surface (Figure 4a), and it may also move horizontally or settle vertically as a whole along with the ground surface (Figure 4b,c). In some cases, coal mining may result in the local subsidence or movement of ground [1], which may cause high-voltage pylons to bend or overturn owing to their deviated center of mass [20]. Additionally, the bases of a pylon may also be stretched or compressed when the local subsidence or local movement of the ground surface occurs (Figure 4f). Both horizontal movement, vertical settlement and the overturn of the pylons may not destroy their own structures, but they may cause the transmission wires to be pulled or even broken. The twisting, bending, and base-stretching/compressing of pylons can damage their structural strength, ultimately resulting in the breaking of transmission wires. It should be noted that, due to the complexity of the geological hazards [19,21], the above-mentioned failure modes usually do not appear alone, but often simultaneously occur in two or more modes.
3. Determination of the Scope of the Key Area: Based on Numerical Simulation Study
In this part, a three-dimensional finite difference program, FLAC3D, was used to evaluate the influences of coal mining activity on the ground surface deformation of working face 1110. Based on the numerical simulation results, the scope of key area mentioned in Section 3.2 was determined.
3.1. Numerical Simulation Details
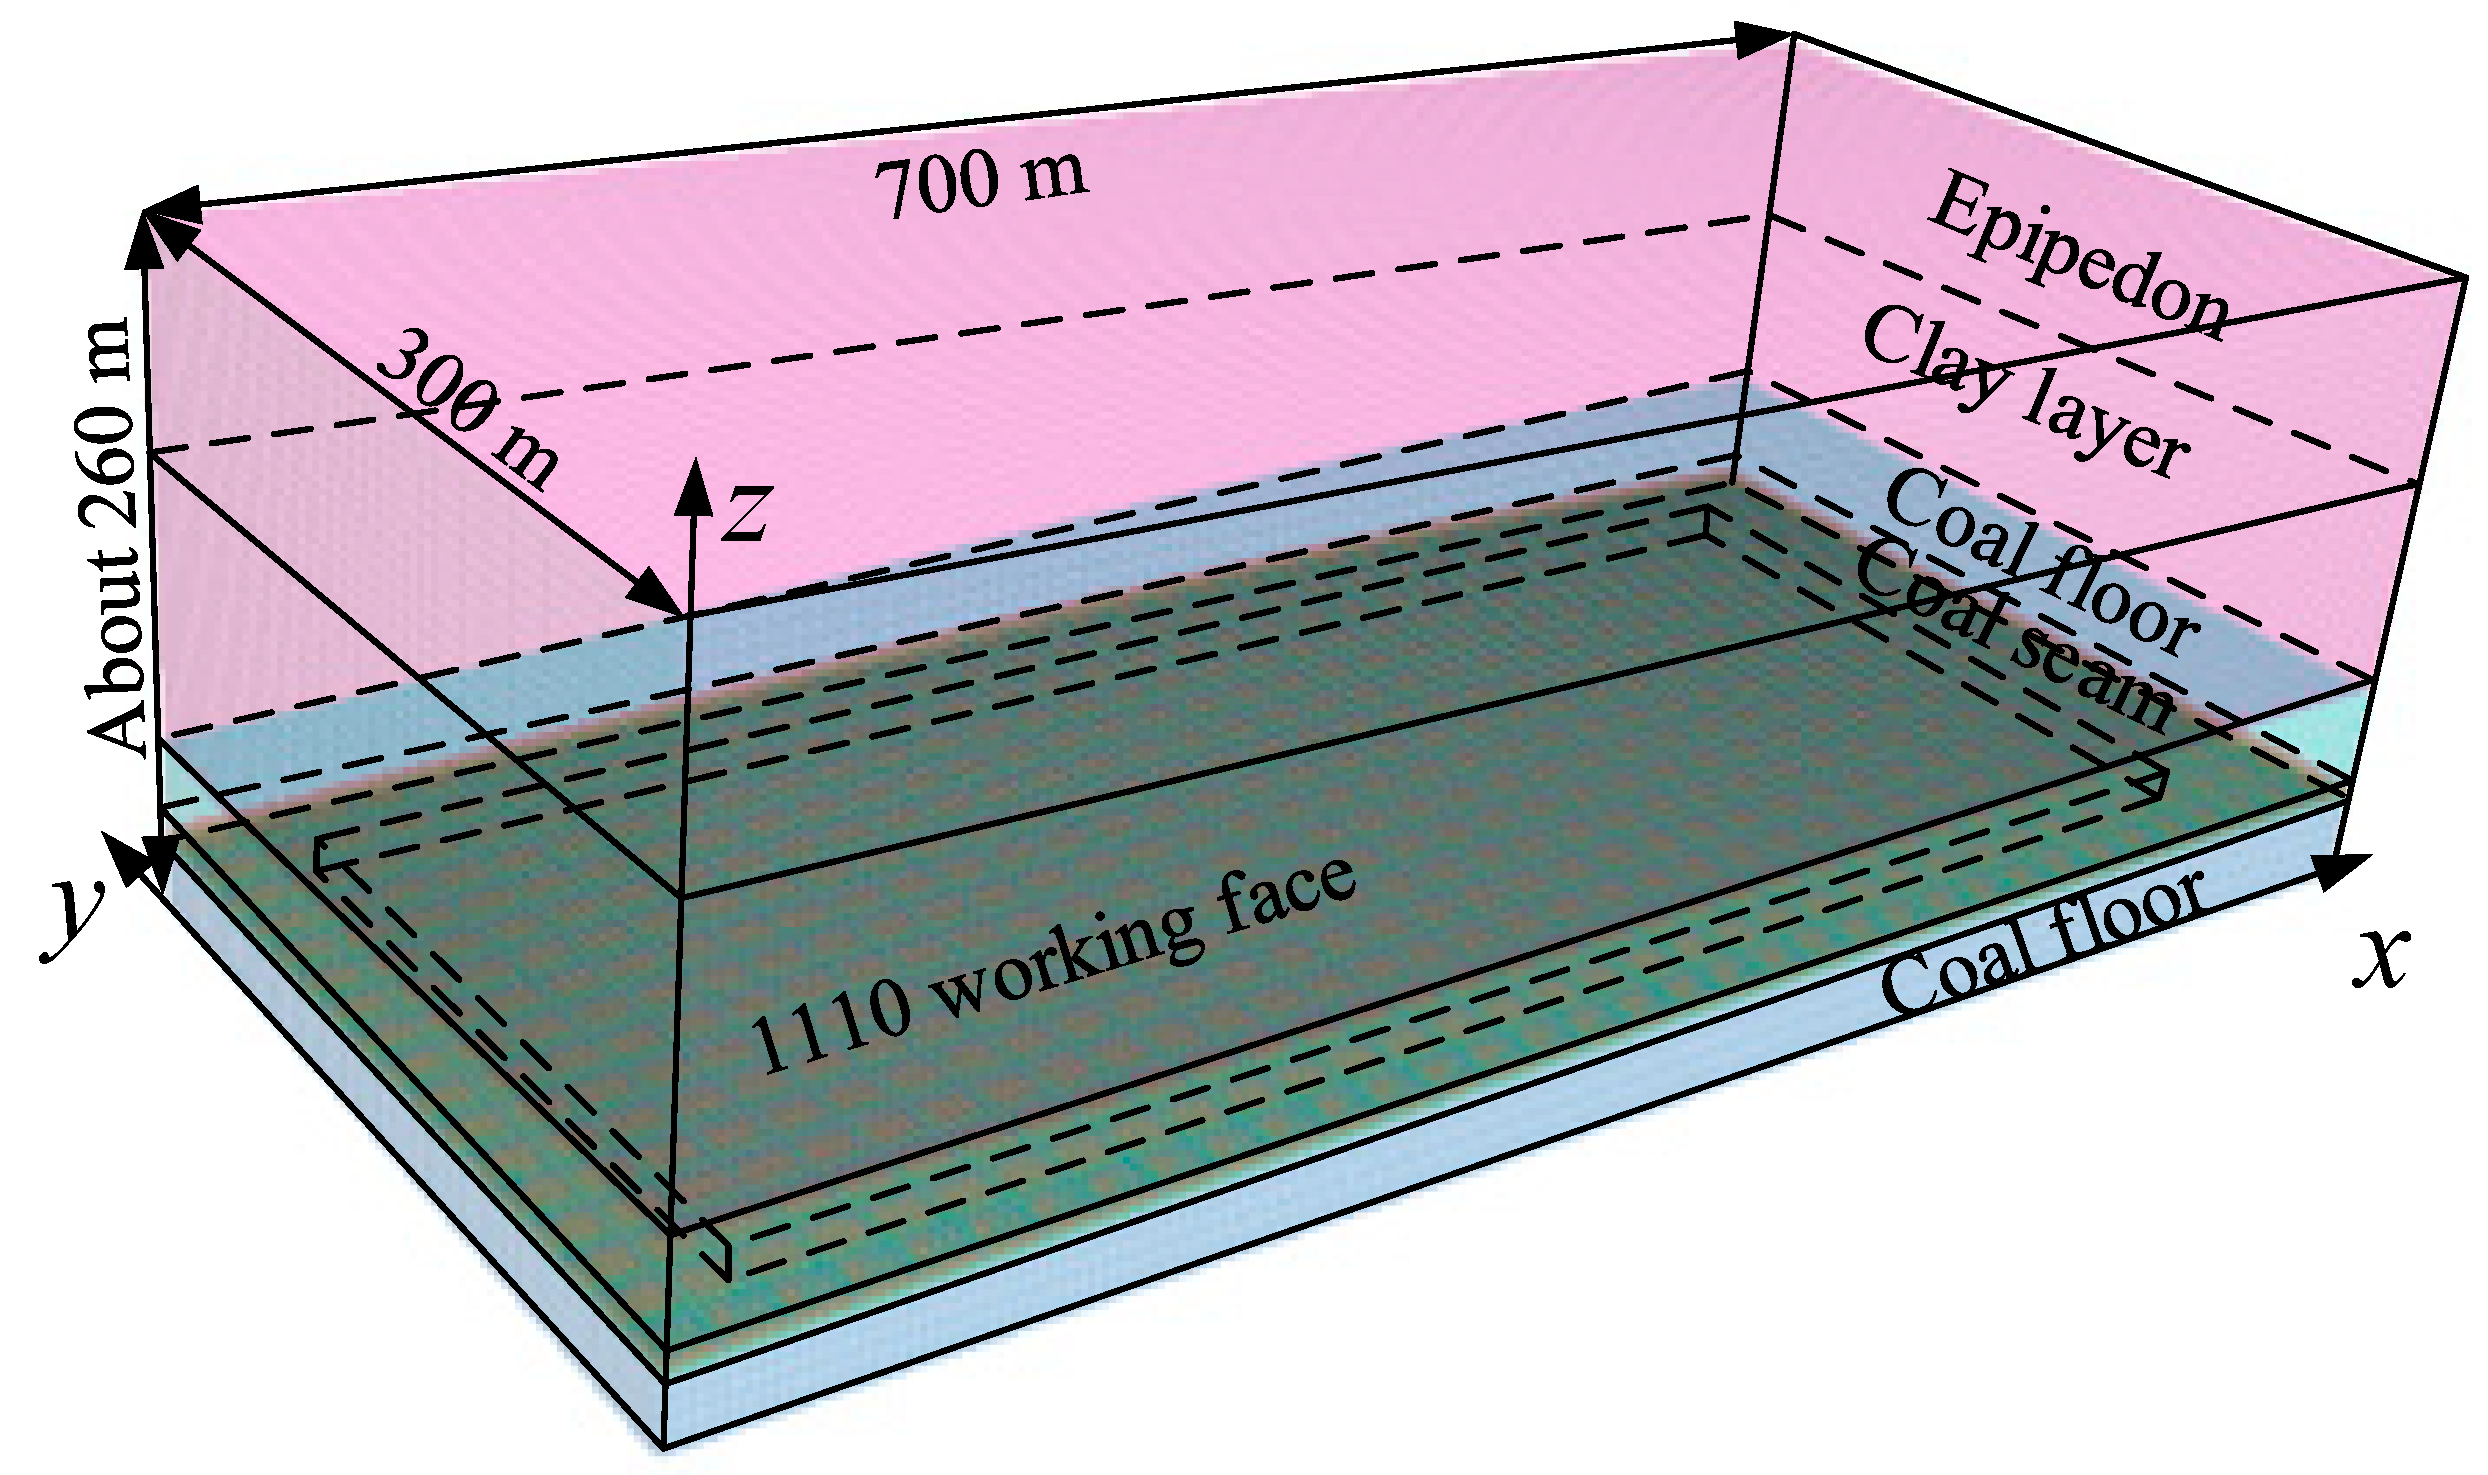
Based on the geological survey results (Figure 3a), a simplified numerical simulation model, including the epipedon, clay layer, coal seam, and rock layer, was established (Figure 5). The total number of nodes and grids of this model are 437,805 and 418,880, respectively. This model has side lengths of 700 m, 300 m, and about 260 m in the x-, y- and z-directions, respectively. It only contains part of working face 1110, but does contain the Pylon 37#, Pylon 53#, Pylon 103# and Pylon 36#. The side lengths of working face 1110 included in this model in the x-, y- and z-direction are 500 m, 220 m and about 7 m, respectively. The mechanical properties of the five different geology layers are listed in Table 2, and the horizontal in situ stress coefficient is 0.5 [22,23].

Figure 5.
Numerical simulation model. The epipedon, clay layer, rock layers and coal seam are represented by different colors.
Table 2.
Numerical model parameter.
During simulations, the movement of the top surface was free in all directions, whereas that of the surrounding and bottom faces in the z-direction was fixed. The total number of numerical simulation steps was 200, and each step represented a 2.5 m mining distance. During simulations, the displacement and settlement of the top surface were calculated with the stochastic medium method (SMM) [24,25]. The mining thickness of the key area was determined as 3.0 m and that of the fully mechanized caving mining area was 7.0 m. The 3.0 m and 7.0 m mining thicknesses were designed according to the actual production technical conditions of Sima Coal Mine and the real thickness of coal seam, respectively.
The designed scopes of key regions in the west–east direction (length) and north–south direction (width) are listed in Table 3. The gravity line of each pylon crosses the diagonal intersection of the rectangular key regions. Since Pylons 53# is close to the southern boundary of working face 1110, only the coal seam in the northern part of this pylon was designed as the key region; therefore, the scope of thickness-limiting mining area designed for Pylons 53# was smaller than others.
Table 3.
The designed scope of the key regions.
3.2. Influences of Coal Mining Activity on the Surface Deformation
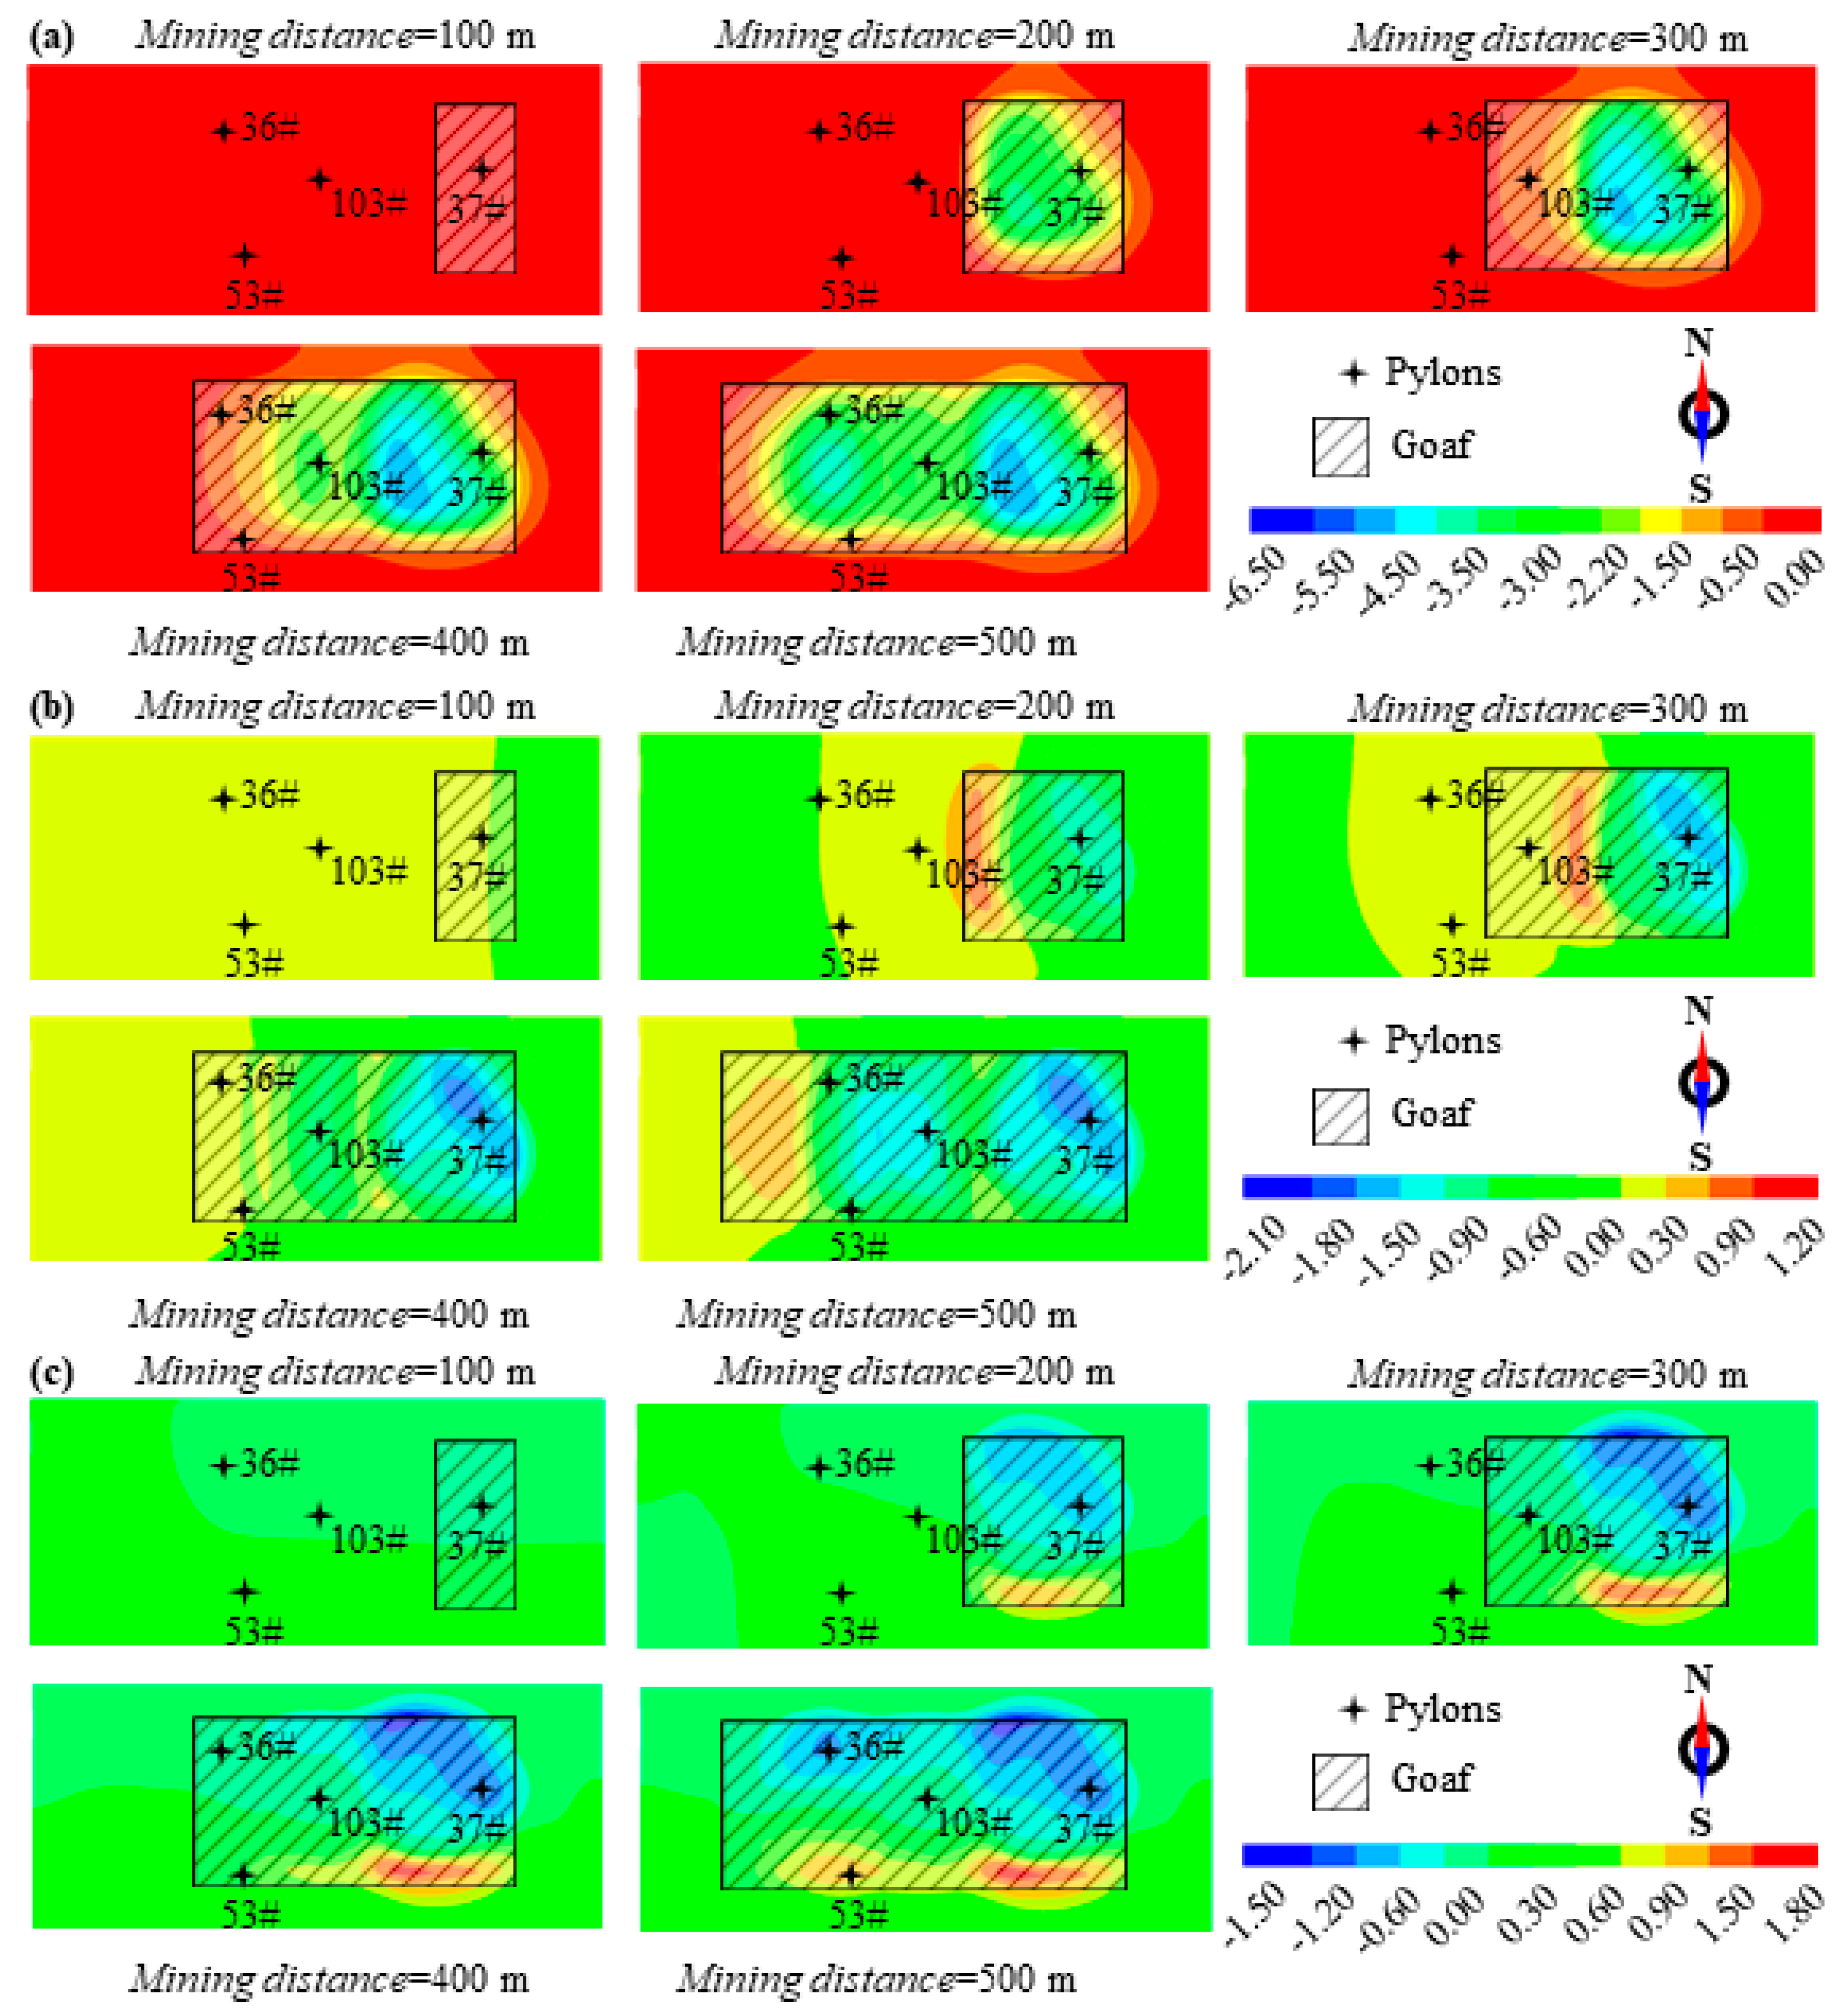
In this section, to evaluate the effects of mining activity on surface deformation of working face 1110, taking Plan 3 as an example, the evolution characteristics of the surface deformation during mining (as shown in Figure 6) is discussed.
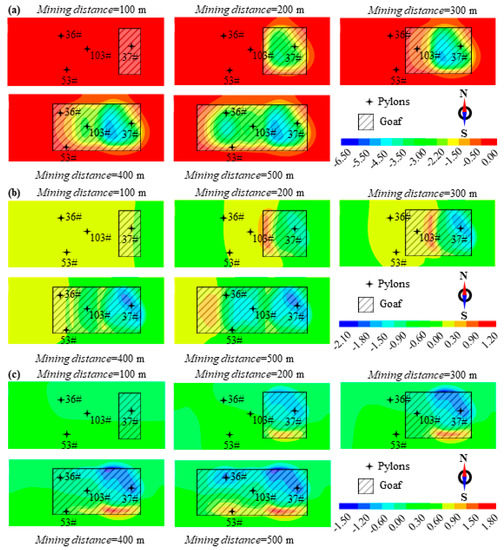
Figure 6.
Evolution of surface deformation filed during mining in: (a) vertical, (b) west–east and (c) north–south directions.
Figure 6a shows that with the increased mining distance, the vertical subsidence of the ground surface over working face 1110 gradually increases. At a mining distance of 500 m, the topographic of the ground surface can be characterized as double basins, and the maximum vertical subsidence was about 5.5 m, observed in areas where fully mechanized caving mining method was used. Pylons were located near the boundary of the basins with a maximum ground surface subsidence of less than 2.5 m. The area containing Pylon 53# had a ground surface subsidence of less than 2.0 m. On the horizontal plane, the point at which the maximum ground surface subsidence was reached was more than 70 m from both Pylon 37# and Pylon 103#. Figure 6a also shows that the ground surface subsidence lags behind with the advance of the working face. For example, at a mining distance of 300 m, even though coal was mined out, the ground surface settlement in the area around Pylon 103# was still less than 0.5 m, and it increased to about 2.2 m at a mining distance of 400 m.
By comprehensively analyzing Figure 6a–c, one can also see that, once the subsidence of ground surface around pylons reaches the maximum, the subsequent mining activity has little impact on it, but the horizontal deformation continuously varied during the whole mining process. This can be illustrated using pylons as characteristic points. For example, at a mining distance of 200 m and 300 m, the point where Pylon 103# is located tended to move to the east, whereas it moved to the west when the mining distance was 400 m (Figure 6b). Another example is the point where Pylon 37# is located; it moved to the southwest during the whole mining process, with a moving distance of about 2.0 m. The information in Figure 6 tells us that reducing the mining thickness of the coal seam is effective for declining ground surface deformation, and especially for declining the vertical subsidence.
3.3. Influences of Scope of Key Regions on the Surface Deformation
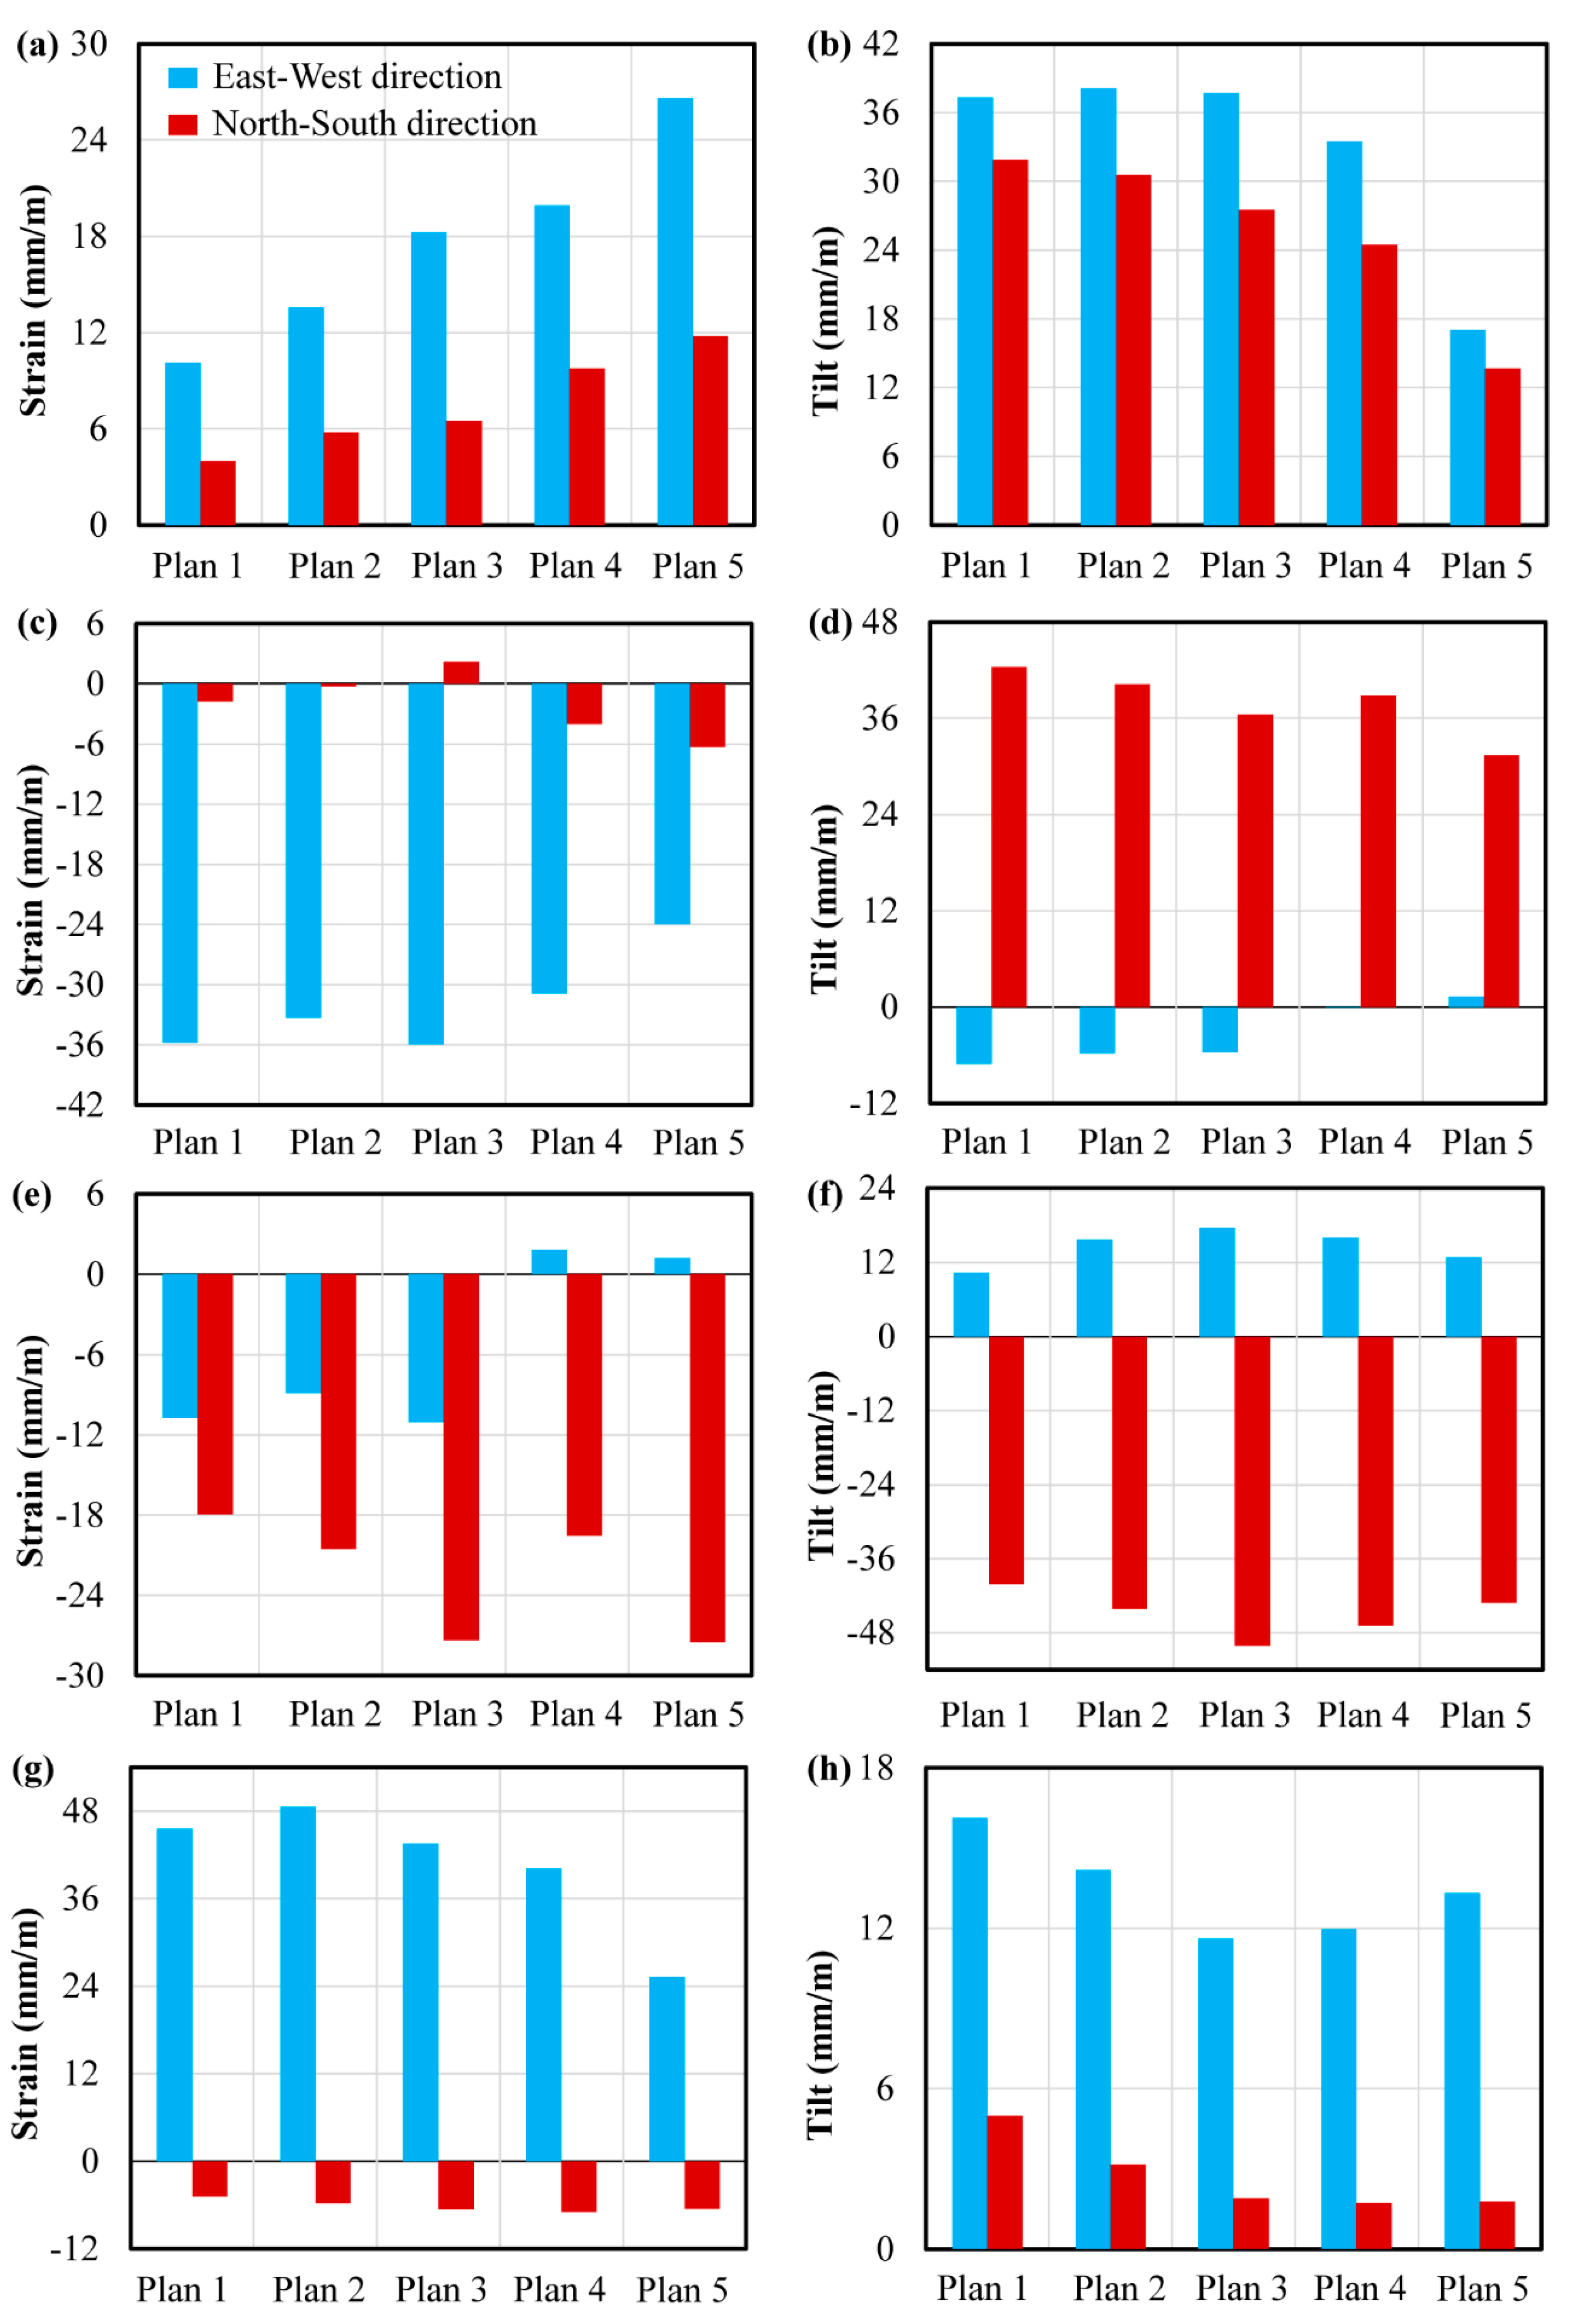
Figure 7 shows the average horizontal strain and tilt in different areas at mining distance of 500 m. These areas are 7 m2, and they contain Pylon 37#, Pylon 36#, Pylon 53# and Pylon 103#, respectively. From Figure 7, it can be seen that, when the scope of the key regions varies, both the horizontal strain and tilt of these characteristic areas change, but irregularly. For example, when the scope of the key regions increased, the area containing Pylon 37# was stretched in both the east–west and north–south directions, and its horizontal strain was increased (Figure 7a); whereas the area containing Pylon 36# was compressed in an east–west direction and its horizontal strain declined (Figure 7c). However, in a north–south direction, when Plan 1 or Plan 2 was used, this area was compressed, and when Plan 3 or Plan 4 or Plan 5 was used, this area was stretched. Another example is the tilt of these areas. The area containing Pylon 37# was tilted toward an east-north direction, and the tilt declined when the scope of the key regions increased, whereas the area containing Pylon 36# was titled toward an east–south direction.
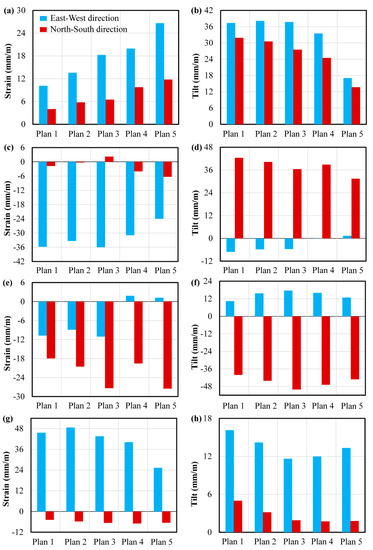
Figure 7.
The average horizontal strain and tilt in the area containing: (a,b) Pylon 37#, (c,d) Pylon 36#, (e,f) Pylon 53#, and (g,h) Pylon 103# at mining distance of 500 m. The areas are 10 m square.
Figure 7 also shows that the horizontal strain of these areas in the east–west direction is often larger than that in north–south direction (except for the area that contains Pylon 53#), corresponding well with the figures presented in Figure 6, and that the horizontal strain and tilt of these areas can be over 20 mm/m. According to the classification of surface movement and deformation [26], the pylons on the ground surface would maintain their stability, but some additional reinforcement was required for the pylons just in case. Figure 7 also shows that the variation in the horizontal strain and tilt of these areas caused by the varied scope of key regions is less significant. Through the comprehensive consideration of the surface deformation, coal production and real mining conditions of Sima Coal Mine, the scopes of thickness-limiting mining and filling mining areas were designed as Plan 3.
4. The Mining Scheme and the Ground Surface Reinforcement Method
4.1. The Mining Scheme
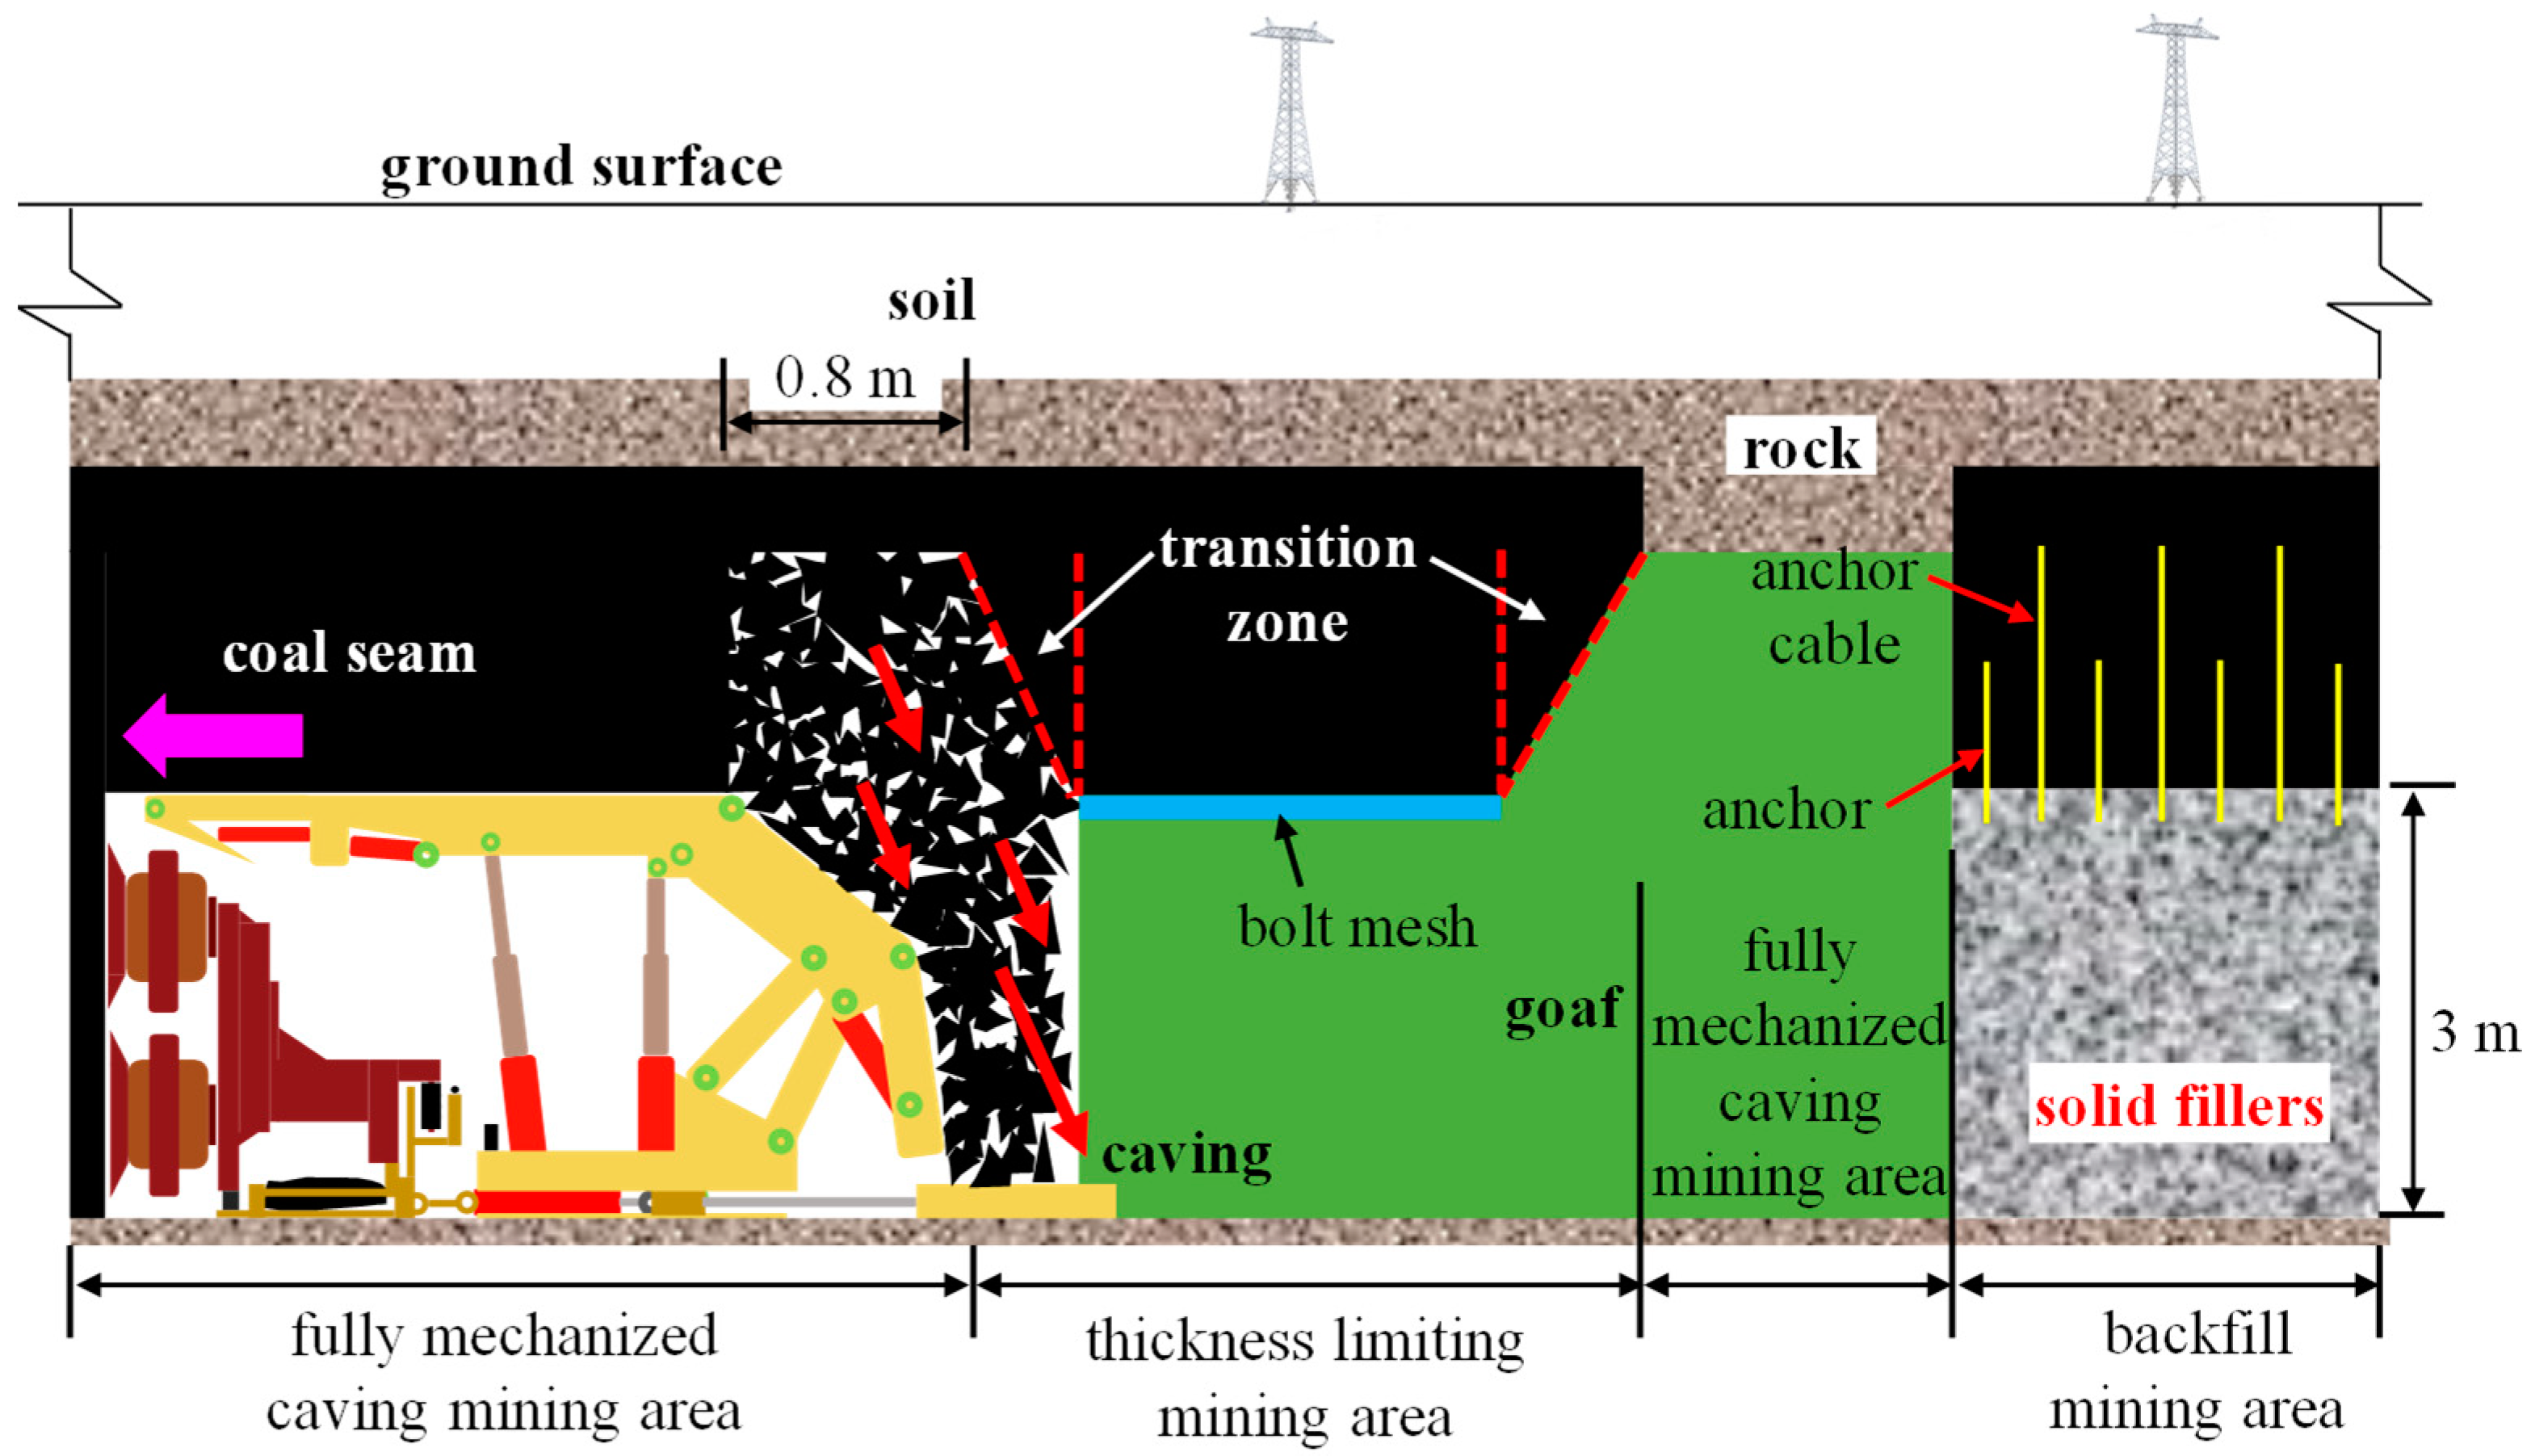
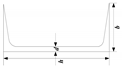
The detailed mining process is as shown in Figure 8. In working face 1110, the length of open-off cut was 220 m, and conventional mining with a thickness of 3 m was first carried out by using a combination of a coal cutter and hydraulic support system (as shown in Figure 8). During mining, in the area where a filling mining method was used, the roof was supported by combining U-steel, bolt mesh, anchors and anchor cables; then, the goaf was filled with a self-developed, high-water, fast-setting, cement-based material (JCT-516 Type) as the hydraulic support moved forward. During mining, the roof in thickness-limiting mining areas was protected using bolt mesh; as for the fully mechanized caving mining areas, coal caving was carried out after every 0.8 m of mining, and the caving thickness was 4.0 ± 0.1 m. To minimize the influences of coal caving process on the stability of roof in thickness-limiting mining areas, the transition zones between thickness-limiting mining area and the fully mechanized caving mining area were designed, and coals in these zones were reserved, making the roofs in thickness-limiting mining areas show an inverted trapezoidal shape cross section.
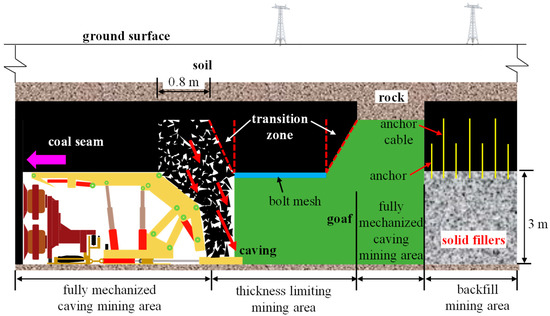
Figure 8.
Schematic diagram of the combined mining scheme adopted in working face 1110.
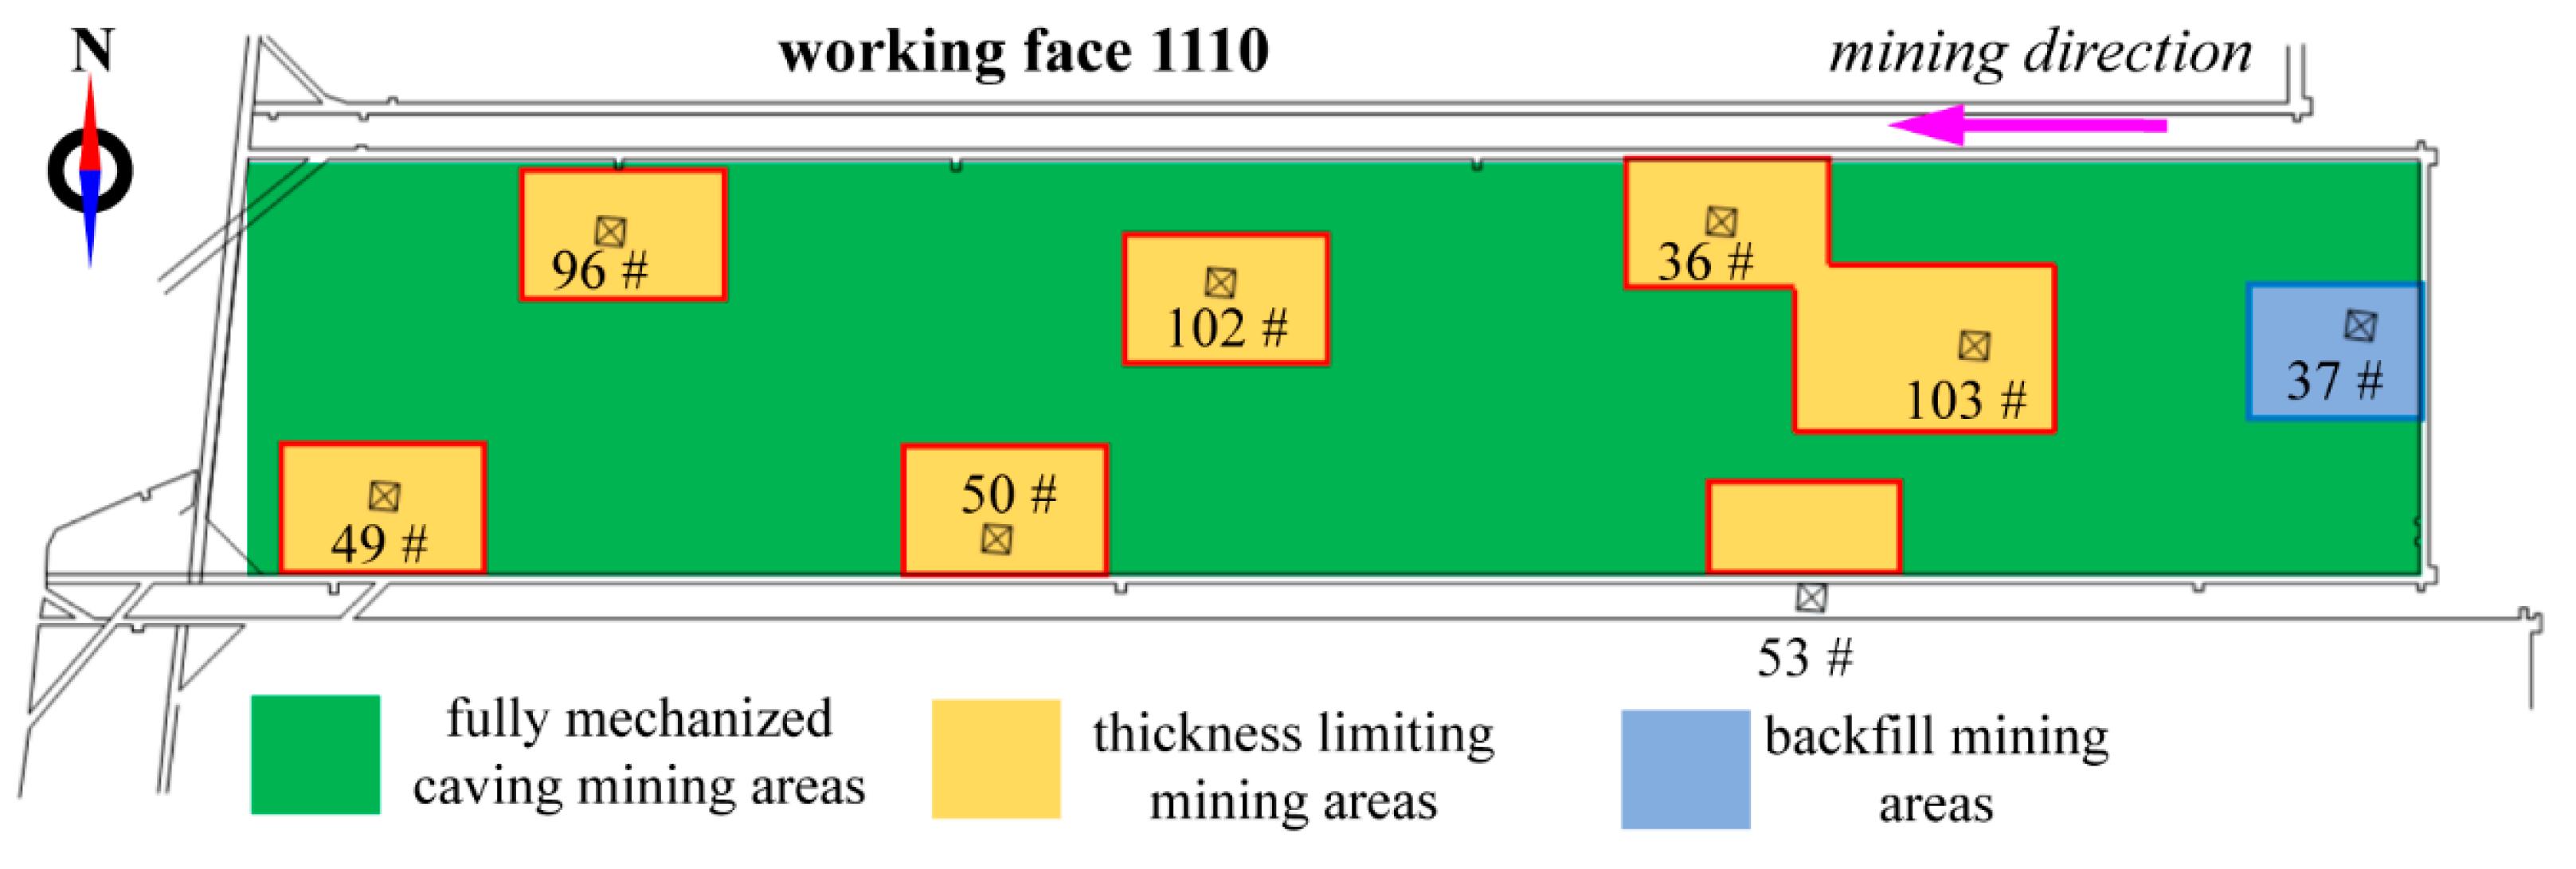
Based on the above analysis and combined with the failure modes of pylons (Figure 4), mining methods for different areas of working face 1110 were determined, as shown in Figure 9. For the coal seam, in a certain area directly below the pylons (those highlighted as yellow or light blue), thickness-limiting mining or backfill mining was used, while for the coal seam in the remaining areas (highlighted as green), fully mechanized caving mining method was used.
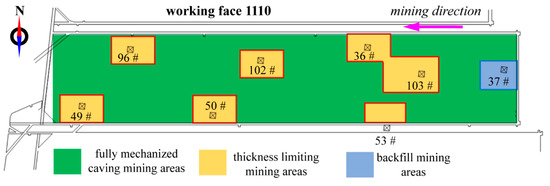
Figure 9.
Diagram of the application area of the three different mining methods in working face 1110. The thickness-limiting mining areas and the backfill mining areas are defined as the key regions.
The mining scheme can simultaneously make full use of the advantages of these three mining methods, and, at least partially, overcome their disadvantages. On the one hand, by using this mining scheme, disasters such as ground subsidence near high-voltage pylons can be effectively restrained because thickness-limiting mining or backfill mining is used in the key areas [27,28]. On the other hand, the overall mining progress of this working face is expected to be accelerated, and coal production is improved by adopting a fully mechanized caving mining method in the rest regions. The reason why thickness-limiting mining and filling mining are used in the key regions, rather than simply using either method, is that it may be too conservative to only use backfill mining, which may prolong the mining duration and increase costs [29,30], and using thickness-limiting mining would only be more risky [29,31].
Additionally, during mining, on the ground, the stability of some typical pylons was monitored in real time. Because of the mining direction of working face 1110 is from east to west, pylons 37#, 53#, 103# and 36# are affected by almost the whole mining process; hence, the monitoring sensors were installed on the bases of these four pylons to record their position change. Monitoring began on 15 February 2018, and monitoring data were recorded every 10 days for a total of 22 months. The base at the northeast corner was numbered T1, and the rest bases were numbered T2, T3 and T4, in a clockwise direction.
4.2. Reinforcement Scheme on Ground Surface for Pylons
The possible failure modes of high-voltage pylons suggest that their own structural strength, especially the base strength, also needs to be reinforced. Inspired by common reinforcement methods for steel structures [32], some steel supports and steel connections could be added to the bases of pylons to provide additional reinforcement.
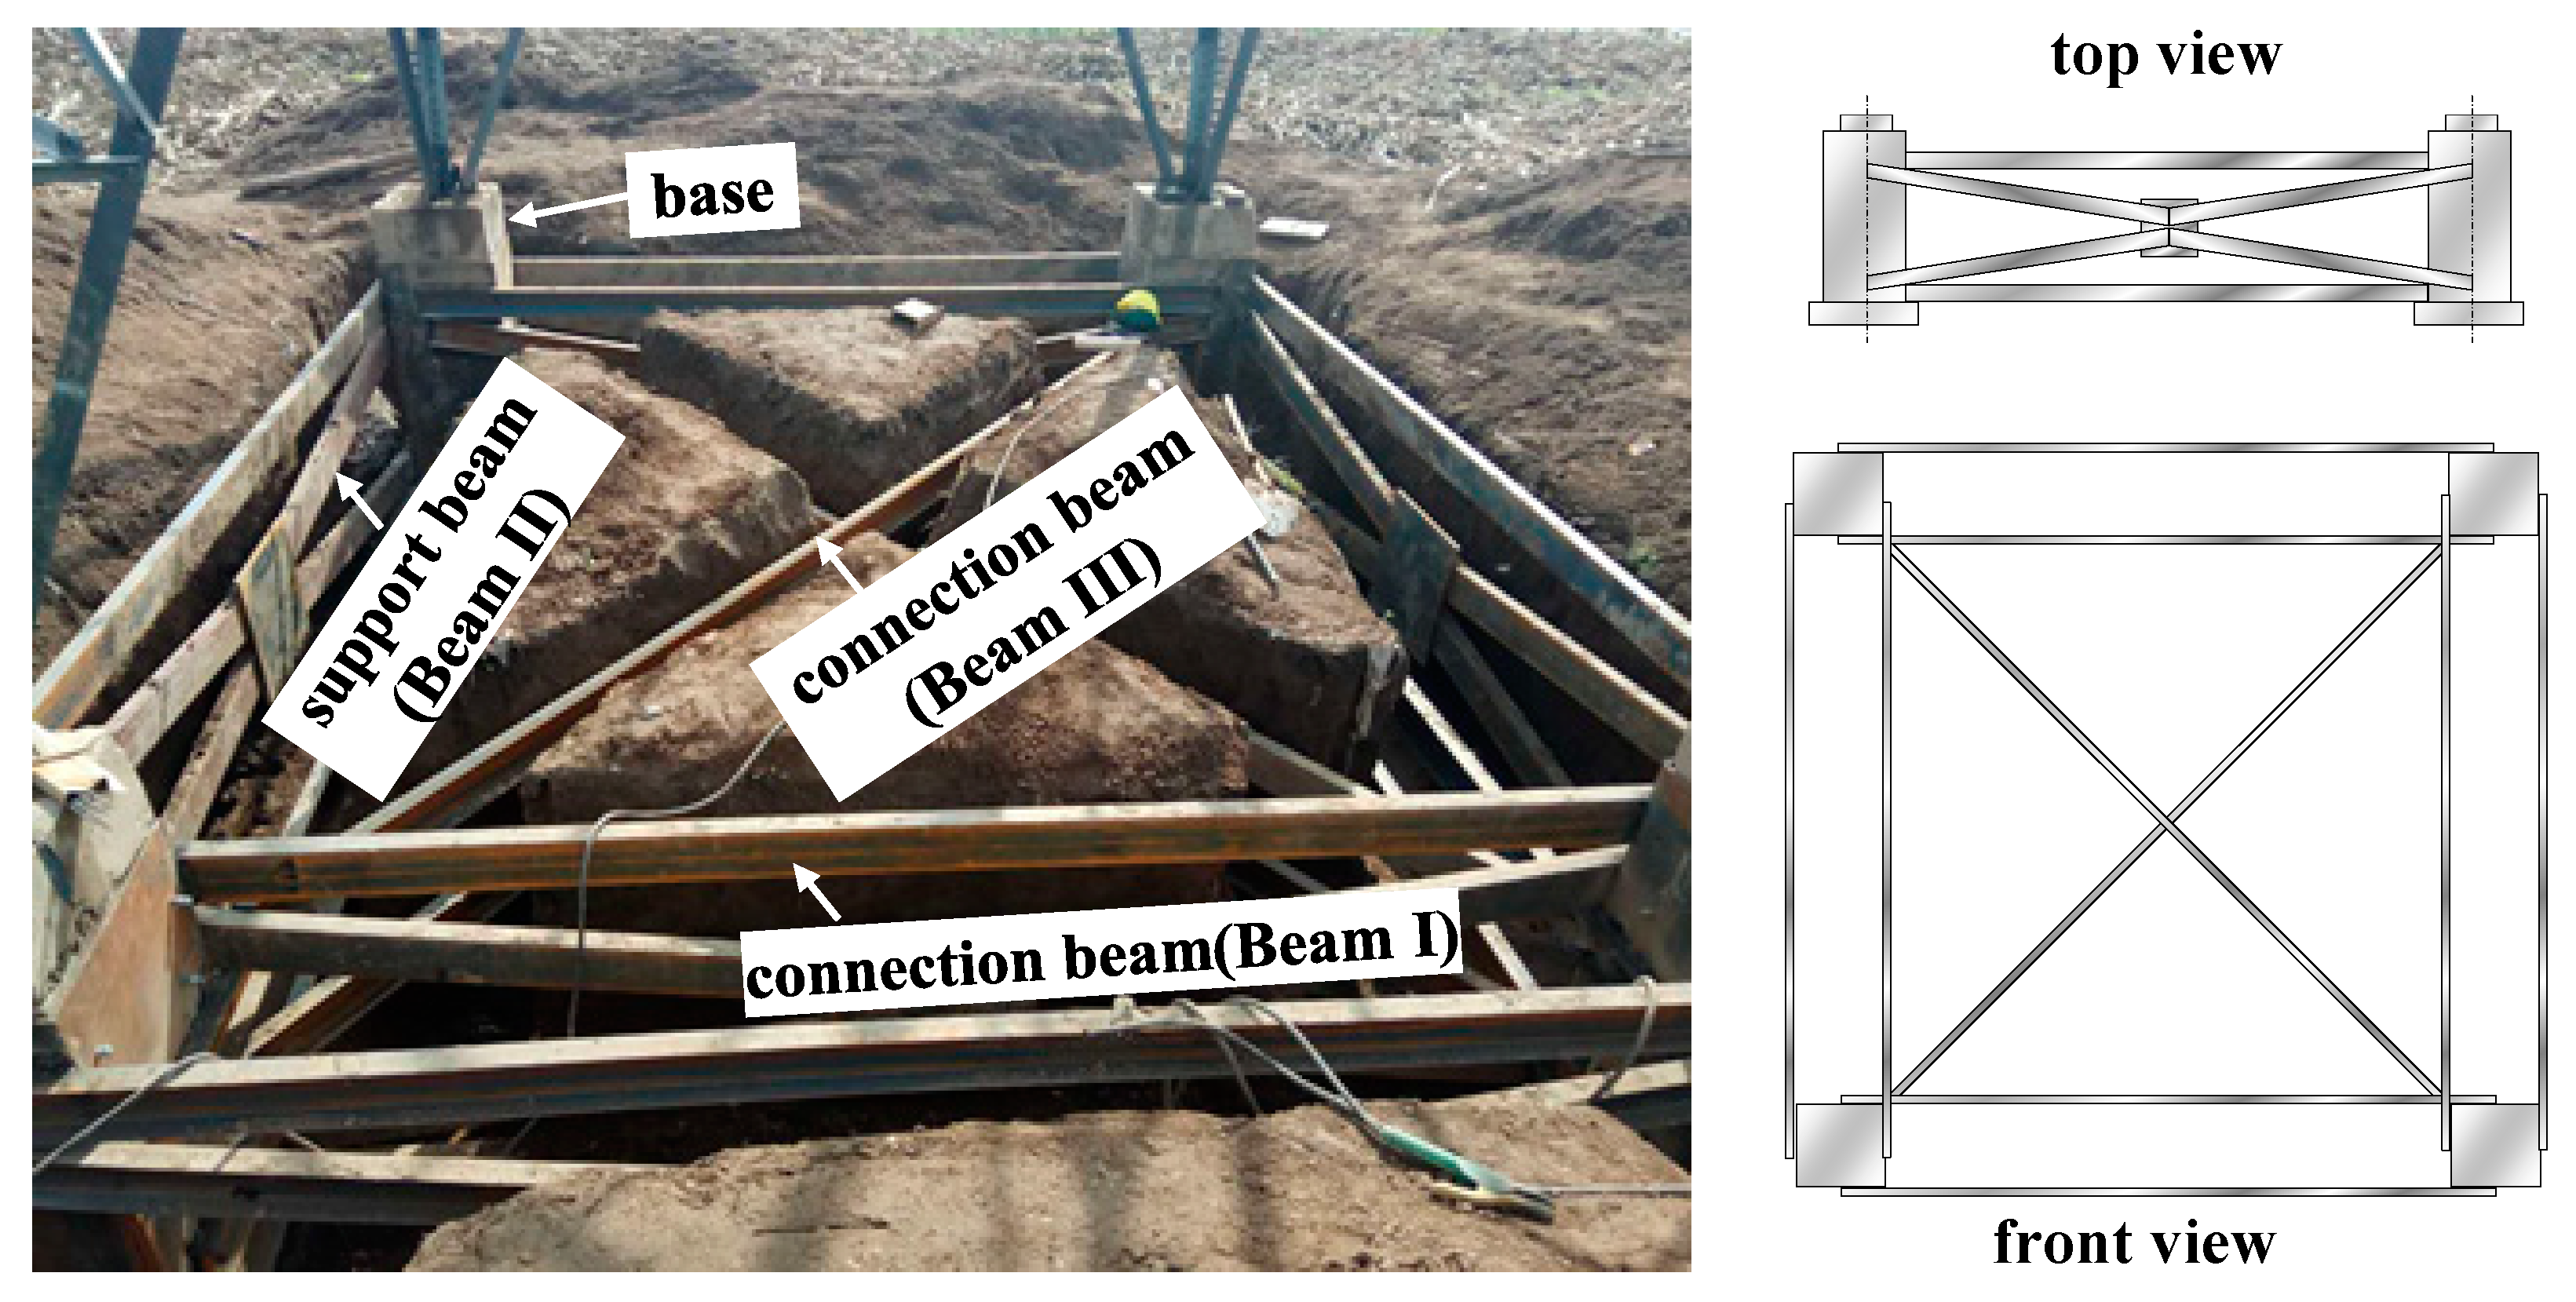
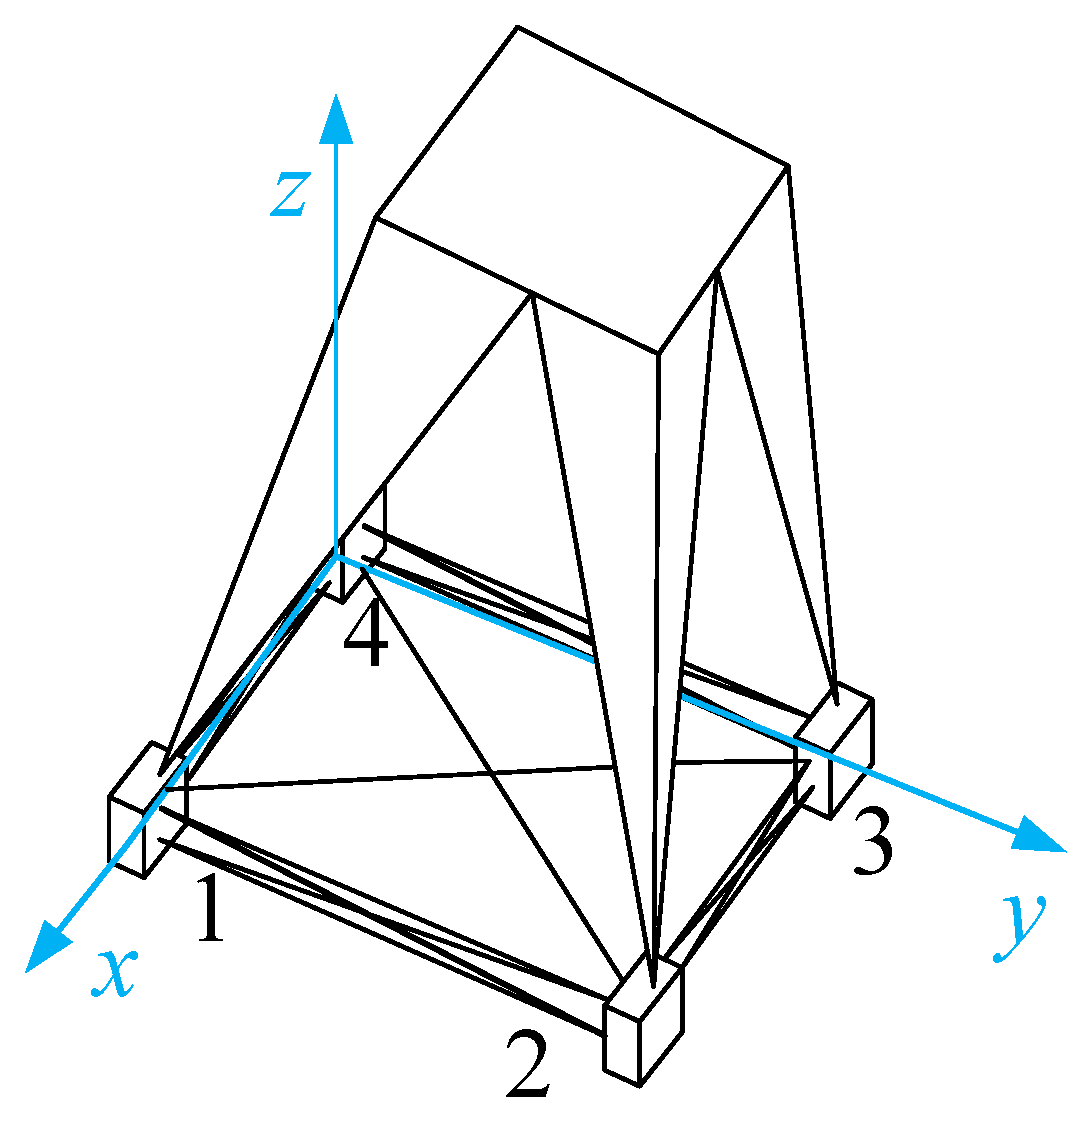
As shown in Figure 10, at an embedded depth of 1.5 m, 20 steel connection beams were added to the concrete bases of the high-voltage pylon. Sixteen of these connection beams (Beam I) were arranged along the sides of the square with four bases as vertices, and the other four (Beam II) were diagonally arranged. Between the upper and lower beams of Beam I, four steel support beams (Beam III) were added to form a X-shaped structure to provide additional enhancement. Both the connection beams and support beams were bolted to the bases, which were commercially available hot-rolled steel channels. The section sizes of Beam I, Beam II and Beam III are shown in Table 4. The technical parameters of this reinforcement scheme were more conservatively designed because of its low cost and in order to achieve the best reinforcing effect possible.

Figure 10.
Reinforcement measures on ground surface designed for pylons.
Table 4.
Section sizes of the steel beams used to reinforce the pylons.
The schematic diagram of the reinforced bases is shown in Figure 11. After reinforcement, the pylon legs, which were considered as cantilever beams [9,10], were transformed into an integral structure; therefore, the deformation of the bottom of the pylons would mainly be caused by the combination of tension deformation and bending deformation. This can reduce the risk of occurrence of twisting or bending deformation of pylons and the base-stretching/compressing deformations. On the other hand, the added steel beams increased the weight of the bottom part of the pylons, and thus the center of gravity of the pylons was lowered [33]. According to the geometric parameters of the bases of the pylons and the technical parameters of the steel beams, it was estimated that the center of gravity of the pylons had been reduced by about 12–22% in height, and this would make the pylons more resistant to overturning [34].
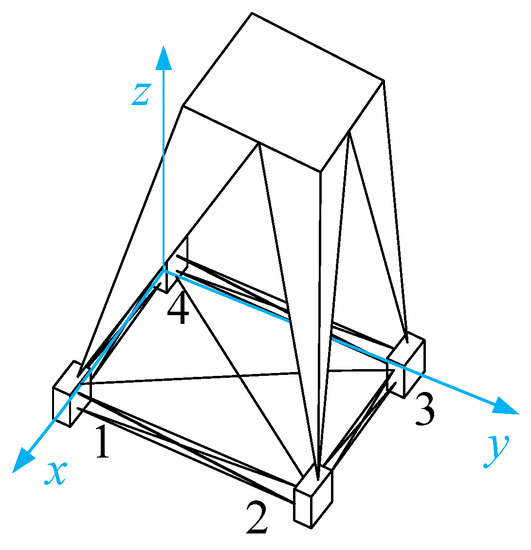
Figure 11.
Schematic diagram of the stressed structure of the reinforced pylons.
5. The Stability of High-Voltage Pylons and Its Influence on Transmission Wires: Based on the Field Monitoring Results
In this section, the stability of the typical high-voltage pylons is evaluated according to the deformation of their bases and then its influence on transmission wires.
5.1. The Stability of High-Voltage Pylons
Taking Pylon 37# as an example, based on the monitoring results, the influence of coal mining procedure on the variations of spatial position coordinates of its four bases is discussed (Figure 12), and then the stability of pylons after mining will be evaluated.
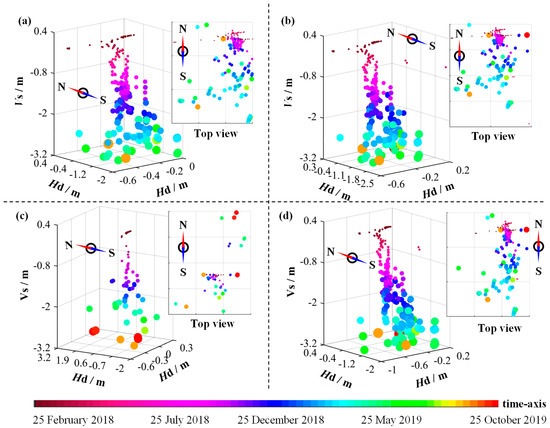
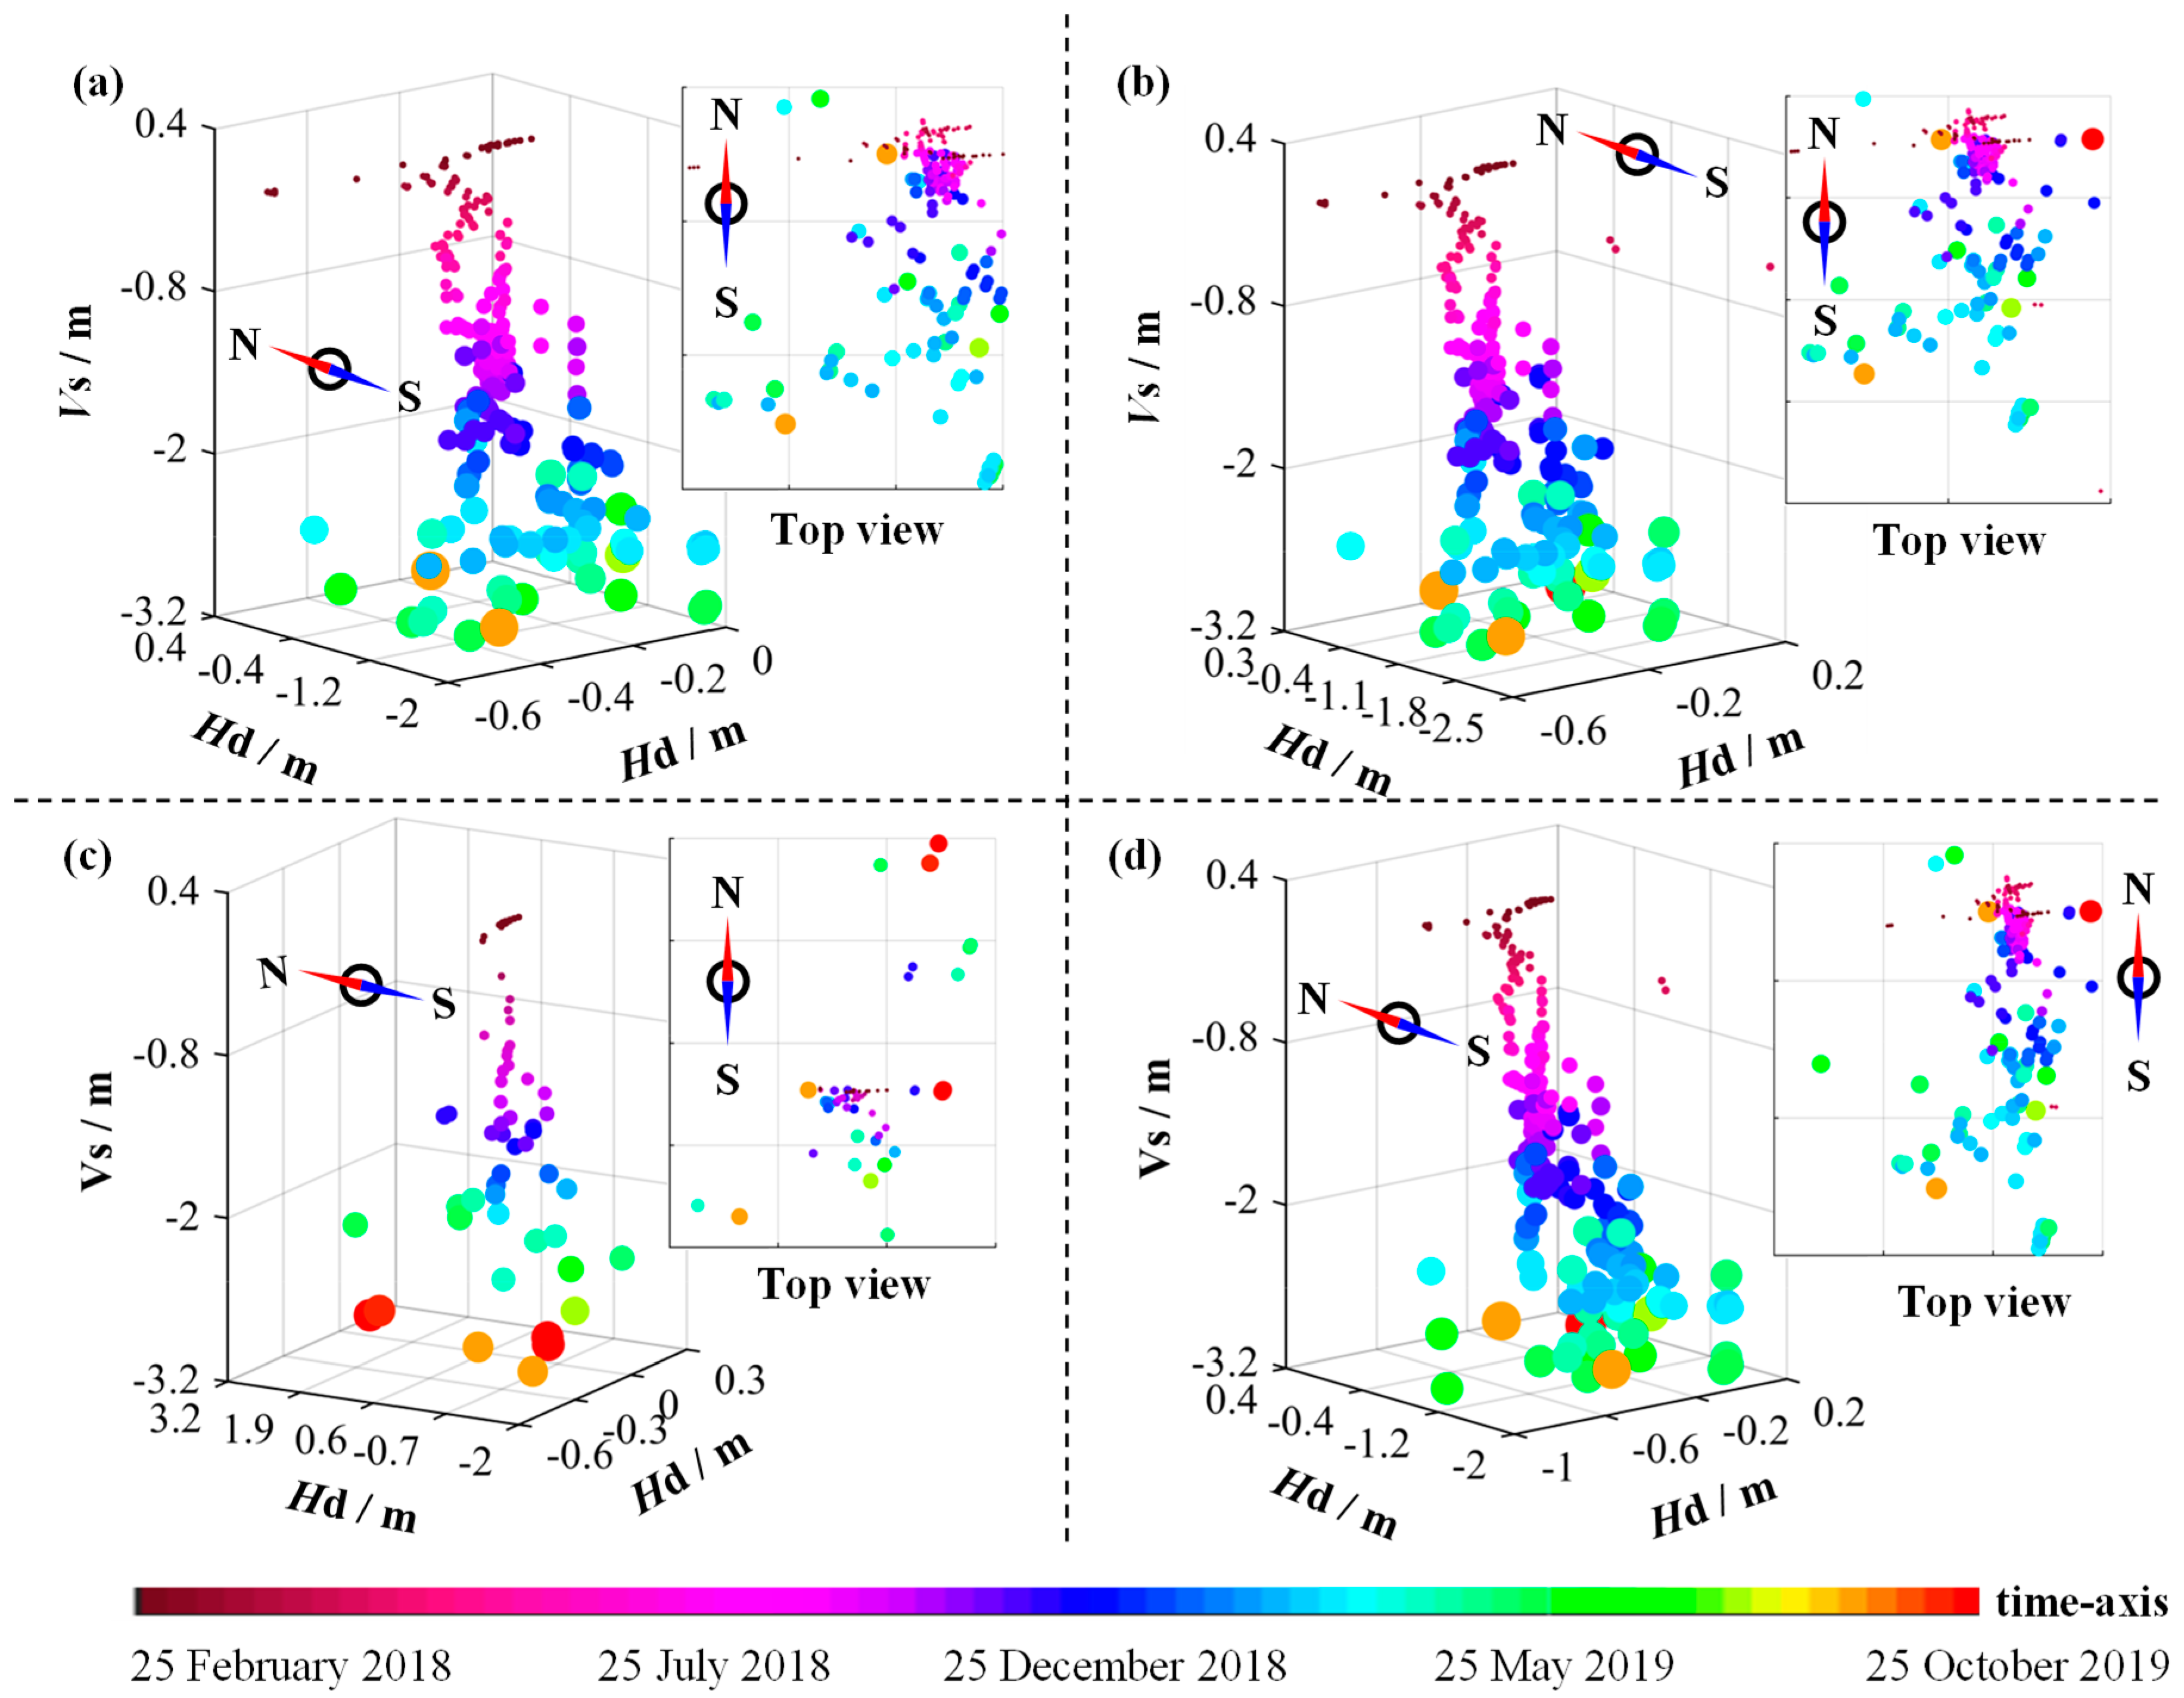
Figure 12.
The variations of the spatial position coordinates of: (a) Base T1, (b) Base T2, (c) Base T3 and (d) Base T4 of Pylon 37#. The top view figures show the position of the bases in the horizontal plane. Vs and Hd represent the vertical settlement and displacement in east–west and north–south direction, respectively.
From Figure 12, one can see that, in the first three months, Vs, the vertical settlements of these bases, were lower than about 0.25 m, whereas they gradually increased over the next 17 months, indicating that the following mining activity had greater influence on the stability of Pylon 37#. The maximum Vs were around 2.7 m, 2.7 m, 3.0 m and 3.1 m, respectively, and the average Vs was about 2.87 m, almost the same as the real mining thickness. Figure 12 also shows that, although Hd of Base T1, Base T2, Base T3, and Base T4 irregularly varied, they showed an increasing trend overall, and they were often lower than Vs. For these four bases, their maximum Hd in west–east direction were about 50–80% lower than that in north–south direction.
Figure 12 also shows that, although the spatial position coordinate variation of the pylon bases in the early stage was disordered, after a certain period, the spatial position coordinate variation tended to become stable; therefore, it is hard to evaluate the stability of pylons during the whole monitoring procedure, and only the spatial positions of the bases of these monitored pylons before and after coal mining were considered for evaluating the stability of pylons.
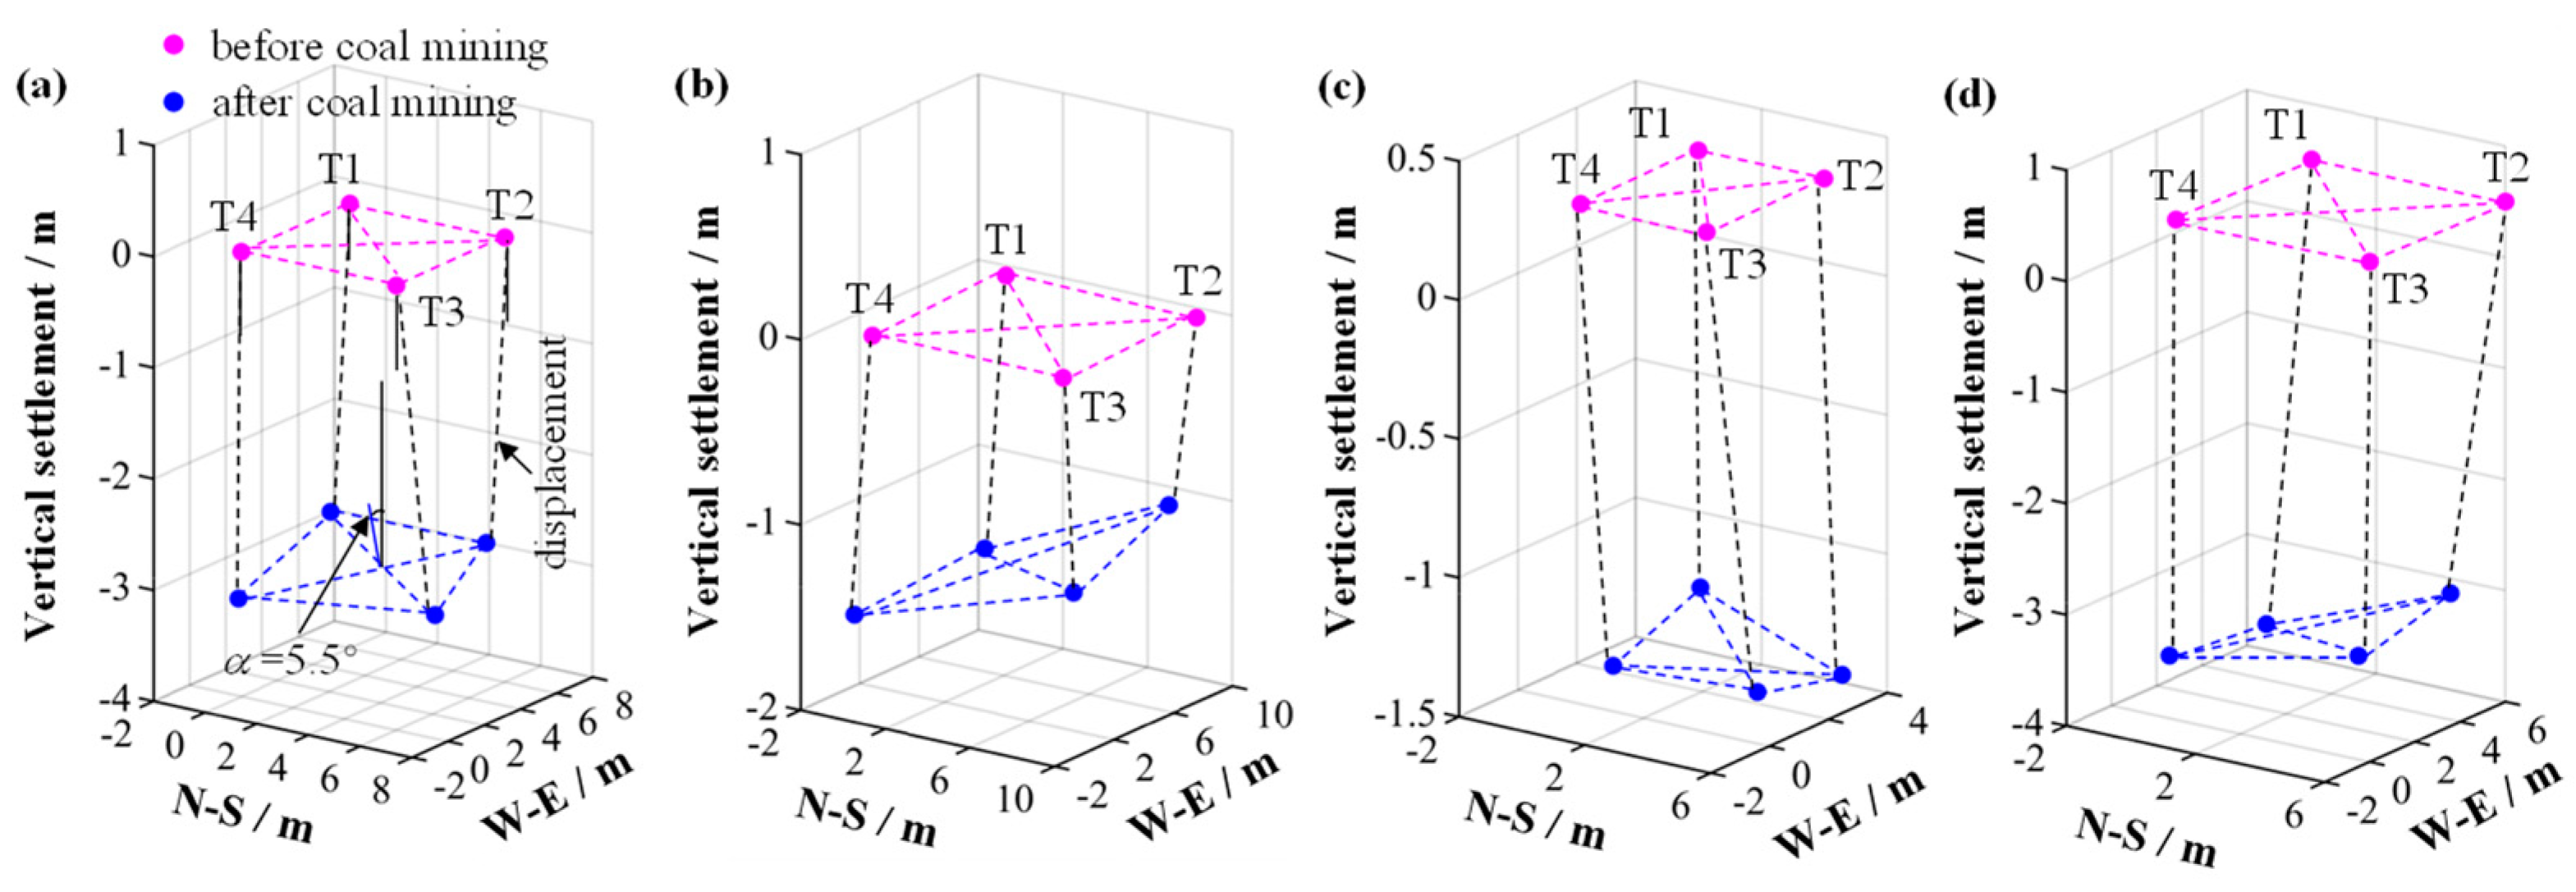
Figure 13a shows that, for Pylon 37#, after 20 months of mining, in the east–west direction, Base T1 and Base T2 were shifted to west, whereas Base T4 and T3 were shifted to east; in the north–south direction, Base T1, Base T2, and Base T4 were shifted to the north, whereas Base T3 was shifted to the south. Due to the changed spatial positions of bases, the distance between them was also changed. To be specific, the distance between Base T2 and Base T3 declined by about 3.4 m, and the distance between Base T1 and Base T4 declined to about 4.8 m. On the contrary, the distance between Base T3 and Base T4 increased to about 6.7 m. As for the distance between Base T1 and Base T2, it was almost unchanged. Figure 13a also shows that the plane that contains four bases tended to slope to the west–south direction and the normal vector of this plane deviated from the vertical direction at an angle of about 5.5°, and the center point of this plane was shifted to east–south at a distance of about 0.46 m. This means that if the four bases are considered as a whole, the position of the center of mass would change when the relative positions of the four bases changed, which was helpful for preventing the overturn failure of Pylon 37#.
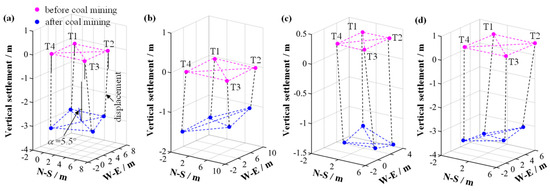
Figure 13.
The spatial positions of four bases of: (a) Pylon 37#, (b) Pylon 36#, (c) Pylon 53# and (d) Pylon 103# before coal mining and after 20 months of coal mining.
Figure 13b,c show that the vertical settlement of each base of different pylons is in the range of 1.1–3.8 m (more details are included in Table 5), and the average settlements of Pylon 36#, Pylon 53# and Pylon 103# are about 1.33 m, 1.60 m and 3.48 m, respectively. The distance between every two neighboring bases of Pylon 36#, Pylon 53# and Pylon 103# was also changed, and the specific data are included in Table 5. According to Table 5, it can be induced that the local bending deformation caused by the compressing or stretching of two neighboring bases is reduced. The plane that consists of four bases of both Pylon 36#, Pylon 103# and Pylon 53# tended toward the north–west, south–east and north–east direction, respectively, and the normal vector of these three planes deviated from the vertical at an angle of about 6.5, 5.1 and 6.6°, respectively.
Table 5.
The vertical settlement of four bases and distance between two neighboring bases of Pylon 36#, Pylon 53# and Pylon 103# after 20 months of mining (m).
The monitoring results show that the coal mining activity in working face 1110 caused the deformation and movement of pylons on the ground, but the actual pylons are still in stable service. This information reveals that the combined mining scheme in working face 1110 and ground surface reinforcements designed here are effective in maintaining the safe operation of pylons. However, it is also necessary to evaluate the influence of the already moved or settled pylons on the transmission wires [35].
5.2. Influence of Stability of Pylons on Transmission Wires
As shown in Figure 14a, it can be assumed that, between two neighboring pylons, the transition wire is fixed by tension F1 and tension F2. Assuming that the places of application of F1 and F2 are at the same level (Figure 14b), the shape of the sagging transmission wire can be considered as symmetrical and thus F1 is equal to F2; therefore, the following equation can be obtained:
where W represents the gravity, and θ is the angel between F1 and horizontal direction (Figure 14c):
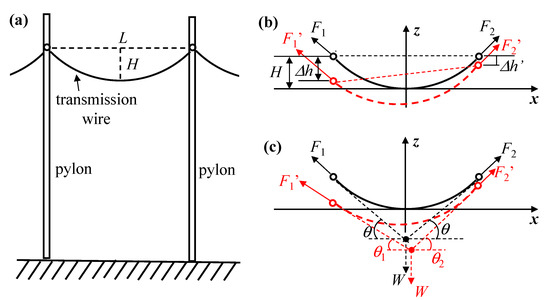
Figure 14.
Simplified schematic diagrams of: (a) pylon transmission wire system, (b) deformation of transmission wire caused by the settling pylons, and (c) forces on the transmission wire.
According to Equation (1), one can see that when the relative position of two neighboring pylon is changed, θ will change, which can influence the tension force sustained by the transmission wire.
The sagging transmission wires are often considered as catenary elements [26], and their shape can be described as upward parabolas. Before coal mining, for a transmission wire, assuming its lowest point to be the origin (the black dashed line, as shown in Figure 14b), its shape function can be simplified as the following:
where L and H represent the span and sag of the transmission wire (Figure 14a).
After coal mining, once the overall settlement of two adjacent pylons is inconsistent, the shape of transmission wire will be changed (the red dashed line, as shown in Figure 14b), and Equation (2) should be modified to the following:
where Δh and Δh′ represent the vertical settlement of two pylons.
Since the vertical settlement of two pylons is often much smaller than L, the change in the size of the parabolic opening will be so small that it is negligible, and thus the coefficient of the quadratic term in Equation (3) stays the same.
θ1 and θ2 presented in Figure 14c can be calculated as the following:
Substituting Equation (3) into Equation (4), the following equation can be obtained:
According to the static equilibrium condition [36], the following equation can be obtained:
The monitoring results presented in Section 4 showed that the average settlement of Pylon 37# was lower than 3 m. This can result in deformation in the transmission wire between Pylon 37# and Pylon 38#. L and H of the transmission wire between these two pylons are 350 m and 8 m, respectively. Accordingly, F1′ and F2′ can be calculated as the following:
Before coal mining, according to Equation (1), F1 and F2 can be calculated as the following:
By comparing Equations (7) and (8), it can be seen that the vertical settlement of Pylon 37# leads to little change in the tension sustained by the transmission wire (with a maximum change of less than 0.1%); therefore, there must be a small amount of strain in the transmission wire. This can also be illustrated by calculating the total length of transmission wire after coal mining. The total length of transmission wire, l, can be calculated as the following:
Substituting Equations (2) and (3) into Equation (9), l values before and after the coal mining area were about 350.6966 m and 350.6967 m, respectively. This is inconsistent with the above findings. However, the center of gravity of this part of the transmission wire was shifted to the lower right.
Similarly, the deformation of transmission wires between Pylons 36# and 37#, Pylons 102 # and 103#, and Pylons 53# and 50# was also calculated based on the monitoring results, and the calculated results illustrate that changes in the tension force and total length of the transmission wires are often lower than 1.0%. All in all, the deformation and movement of pylons on the ground surface of working face 1110 in Sima Coal Mine have little influence on the operation of transmission wires.
6. Result and Discussion
There is a large number of high-voltage pylons on the ground surface of working face 1110 of Sima Coal Mine. Using traditional mining methods, a large number of protective coal pillars needs to be reserved, which will lead to the failure of the normal mining of this working face. According to the engineering geological conditions of working face 1110 and the location of eight high-voltage pylons on the ground, a combined mining scheme including thickness-limiting mining, backfill mining and top-coal-caving mining is designed. The core of the scheme design is to accurately divide the key mining region. According to the position of key mining regions and the possible failure mode of the high-voltage pylon, the thickness-limiting mining or filling mining method is designed for the key region. In addition, strengthening the foundation of high-voltage pylons is also a key measure to ensure their stability. This article proposes the use of steel beams to strengthen the foundation of high-voltage pylons. On the one hand, it can connect the four foundations of a high-voltage pylon as a whole, which is conducive to the uniform settlement of the high-voltage pylon. On the other hand, it reduces the center of gravity of the high-voltage pylon and the risk of high-voltage pylon toppling.
The field monitoring results of the position change of high-voltage-pylon foundations show that high-voltage pylons move with the surface subsidence after mining, but their movement process is stable. At the same time, the calculation results show that the tension of transmission wires between adjacent pylons hardly changes, and the change in the total length is basically less than 1.0%. This shows that the combined mining scheme and foundation strengthening scheme can effectively control the stability of high-voltage pylons in coal mining subsidence areas.
In the past, some scholars have studied the coal mining scheme under high-voltage pylons or other buildings [37,38,39,40,41], but its limitations are reflected in two aspects. First, the number of high-voltage pylons or buildings involved is very small: only 1~2. In this case, no matter which scheme is adopted, its economic implications are not clear. Second, the mentioned mining scheme is the only one that is use. Only thickness-limiting mining is adopted, which could lead to wasting a large amount of coal resources; or only backfill mining, which could lead to very high mining cost.
The combined mining scheme proposed in this article has remarkable economic benefits. The strike length of working face 1110 is 1100 m, the inclined length is 220 m, the total thickness of the coal seam is 7 m, and the total area limiting the mining of 3 m coal seam thickness is 71,200 m2 (Figure 9). If the protective coal pillar of the stopping line is reserved according to the width of 50 m, the total area of top coal caving mining and backfill mining is 220 × 1050 − 71,200 = 159,800 m2. The recovery rate of coal resources is calculated as 85%, and the average bulk density of coal is 1.5 t/m3, so the total recovered coal resources are (159,800 × 7 + 71,200 × 3) × 0.85 × 1.5 = 1.699 million T. Based on the coal price of 800 CNY/t in the Chinese market, the total economic value of recovered coal resources is about CNY 1.36 billion.
In addition, the scheme proposed in this article is also applicable to the mining of coal resources under radio and television signal towers, chimneys, houses and other buildings or structures, which has important theoretical value and practical significance.
7. Conclusions
- (1)
- The failure modes of high-voltage pylons include twisting deformation, horizontal movement, vertical settlement, bending, overturn and base-stretching/compressing, and usually these failure modes do not occur alone; two or more modes can occur at the same time.
- (2)
- According to the geological conditions of working face 1110 of Sima Coal Mine and the location of eight high-voltage pylons on the ground surface, five mining plans were designed. FLAC3D was used to analyze the influence of mining on vertical settlement, horizontal deformation, horizontal strain and slope in different regions of the ground surface. According to the numerical simulation results, a range of thickness-limiting mining and backfill mining in the working face was carried out, that is, backfill mining was adopted under Pylon #37, and thickness-limiting mining was adopted under the other pylons. The combined mining scheme can make the most of the advantages of various mining methods and greatly recover coal resources underneath high-voltage pylons.
- (3)
- The reinforcement scheme of high-voltage pylons is designed, that is, the four foundations of high-voltage pylons are connected as a whole with steel supports and steel connectors. On the one hand, this can connect the four foundations of a high-voltage pylon as a whole, which is conducive to the uniform settlement of a high-voltage pylon; On the other hand, it reduces the center of gravity of the high-voltage pylon and reduces the risk of it toppling.
- (4)
- The position change of high-voltage-pylon foundation was monitored for 22 consecutive months. The results show that the maximum settlement of the high-voltage pylon foundation is 3.1 m, which is consistent with the actual mining thickness. The high-voltage pylons moved in a stable way, and the change in transmission line tension and total length was usually less than 1.0%.
- (5)
- The combined mining scheme and foundation strengthening scheme can ensure the safe operation of high-voltage pylons.
Author Contributions
Conceptualization, H.L. and B.Z.; methodology, M.D. and B.Z.; software, Z.L.; validation, H.L., M.D. and B.Z.; formal analysis, F.W.; investigation, H.L.; resources, B.Z.; data curation, C.L.; writing—original draft preparation, H.L.; writing—review and editing, M.D.; visualization, M.D.; supervision, B.Z.; project administration, B.Z.; funding acquisition, H.L., M.D., B.Z. and Z.L. All authors have read and agreed to the published version of the manuscript.
Funding
This research was founded by the National Natural Science Foundation of China (51778215, 52174072, 51908515), the Education Department of Guizhou Province Fund (Qianjiaohe KY Zi [2017] 265, Qianjiaohe KY Zi [2019] 073, Qianjiaohe KY Zi [2020] 050, Qianjiao XKTJ [2020] 23), the Science and Technology Department of Guizhou Province Fund (Qiankehe Platform Talent [2019] 5620, Qiankehe Platform Talent-YSZ [2021] 001), the Natural Science Foundation of Shandong Province (ZR2021QE170), the Liupanshui Science and Technology Bureau fund (52020-2018-04-08).
Institutional Review Board Statement
Not applicable.
Informed Consent Statement
Not applicable.
Conflicts of Interest
The authors declare no conflict of interest.
References
- Bell, F.G.; Cripps, J.C.; Culshaw, M.G.; Lovell, M.A. A review of ground movements due to civil and mining engineering operations. Geol. Soc. Lond. Eng. Geol. Spec. Publ. 1988, 5, 3–31. [Google Scholar] [CrossRef] [Green Version]
- Bell, F.G.; Stacey, T.R.; Genske, D.D. Mining subsidence and its effect on the environment: Some differing examples. Environ. Geol. 2000, 40, 135–152. [Google Scholar] [CrossRef]
- Tiwary, R.K. Environmental Impact of Coal Mining on Water Regime and Its Management. Water Air Soil Pollut. 2001, 132, 185–199. [Google Scholar] [CrossRef]
- Palchik, V. Formation of fractured zones in overburden due to longwall mining. Environ. Geol. 2003, 44, 28–38. [Google Scholar] [CrossRef]
- Liu, X.; Guo, G.; Li, H. Study on Damage of Shallow Foundation Building caused by Surface Curvature Deformation in Coal Mining Area. KSCE J. Civ. Eng. 2019, 23, 4601–4610. [Google Scholar] [CrossRef]
- Ji, H.; Yu, X.Y.; Gao, Z.X. Research on Surface Failure Mechanism and Building Stability for Coal Mining. Adv. Mater. Res. 2012, 368–373, 2165–2168. [Google Scholar] [CrossRef]
- Djamaluddin, I.; Mitani, Y.; Esaki, T. Evaluation of ground movement and damage to structures from Chinese coal mining using a new GIS coupling model. Int. J. Rock Mech. Min. Sci. 2011, 48, 380–393. [Google Scholar] [CrossRef]
- Breido, I.V.; Sichkarenko, A.V.; Kotov, E.S. Remote monitoring systems for high-voltage substations and mining machines at open pit coal mines. J. Min. Sci. 2016, 52, 919–926. [Google Scholar] [CrossRef]
- Ličev, L.; Hendrych, J.; Tomecek, J.; Cajka, R.; Krejsa, M. Monitoring of Excessive Deformation of Steel Structure Extra-High Voltage Pylons. Period. Polytech. Civ. Eng. 2018, 62, 323–329. [Google Scholar] [CrossRef]
- Peter, P.; Martin, K.; Michal, N.; Vladimír, P.; Jakub, P. External loading of High Voltage Pylons. Mater. Eng. 2013, 20, 184–194. [Google Scholar]
- Li, Z.G.; Sui, Z.L.; Li, W.L.; Sun, X.S.; Xu, T.J. Simulation Study of Stability of the Transmission Tower Foundations on Mined-Out Area. Appl. Mech. Mater. 2013, 438–439, 1116–1120. [Google Scholar] [CrossRef]
- Bureau, N.C.I. Regulations for Compressed Coal Mining and Retention of Coal Pillars in Main Shafts or under Buildings, Waterbody, Railways; Coal Industry Press: Beijing, China, 2017. [Google Scholar]
- Xu, F.; Guo, W.; Li, J. Study on Protective Coal Pillar Size Design for Ultra High Voltage Line Tower Mining in Mountain Areas. Designs 2019, 3, 20. [Google Scholar] [CrossRef] [Green Version]
- Fama, M.E.D.; Trueman, R.; Craig, M.S. Two- and three-dimensional elasto-plastic analysis for coal pillar design and its application to highwall mining. Int. J. Rock Mech. Min. Sci. Geomech. Abstr. 1995, 32, 215–225. [Google Scholar] [CrossRef]
- Xie, G.X.; Yang, K.; Liu, Q.M. Study on distribution laws of stress in inclined coal pillar for fully-mechanized top-coal caving face. Chin. J. Rock Mech. Eng. 2006, 25, 545–549. [Google Scholar]
- Singh, R.; Singh, T.N.; Dhar, B.B. Coal pillar loading in shallow mining conditions. Int. J. Rock Mech. Min. Sci. Geomech. Abstr. 1996, 33, 757–768. [Google Scholar] [CrossRef]
- Mohan, G.M.; Sheorey, P.R.; Kushwaha, A. Numerical estimation of pillar strength in coal mines. Int. J. Rock Mech. Min. Sci. 2001, 38, 1185–1192. [Google Scholar] [CrossRef]
- Wang, H.; Jiang, Y.; Zhao, Y.; Jie, Z. Numerical Investigation of the Dynamic Mechanical State of a Coal Pillar During Longwall Mining Panel Extraction. Rock Mech. Rock Eng. 2013, 46, 1211–1221. [Google Scholar] [CrossRef]
- Sun, X.; Fu, H.; Zhang, D.; Liu, Z.; An, X. Preliminary analysis of the geological hazards prediction in the process of coal mining. In Proceedings of the 2nd International Symposium on Land Reclamation and Ecological Restoration (LRER 2017), Beijing, China, 20–23 October 2017. [Google Scholar]
- Shang, D.F.; Wang, T.C.; Yang, Z.F. A Research on Key Technology in Overturn-Preventing of Longxi Tower’s Monolithic Movement. Appl. Mech. Mater. 2014, 548–549, 1810–1814. [Google Scholar] [CrossRef]
- Chen, F.; Lin, H.; Zhang, Y.; Lu, Z. Ground subsidence geo-hazards induced by rapid urbanization: Implications from InSAR observation and geological analysis. Nat. Hazards Earth Syst. Sci. 2012, 12, 935–942. [Google Scholar] [CrossRef] [Green Version]
- Zhang, B.; Bai, H.; Zhang, K. Study on the mechanism of delayed water inrush of collapse column under the influence of mining. J. China Univ. Min. Technol. 2016, 45, 447–454. [Google Scholar]
- Meng, S.P.; Lan, J.; Liu, C.L.; Ji, Y.M.; Li, S.N.; Zhang, X.M. In-situ stress and coal reservoir pressure in Southeast margin of Ordos basin and their coupling relations. J. China Coal Soc. 2013, 38, 122–128. [Google Scholar]
- Chaudhuri, A.; Sekhar, M. Analysis of biodegradation in a 3-D heterogeneous porous medium using nonlinear stochastic finite element method. Adv. Water Resour. 2007, 30, 589–605. [Google Scholar] [CrossRef]
- Nakagawa, H.; Hori, M. Analysis of Ground Surface Deformation Caused by Strike-Slip Fault Using Spectral Stochastic Finite Element Method. Doboku Gakkai Ronbunshuu A 2010, 5, 573–580. [Google Scholar]
- Shehata, A.Y.; Damatty, A.A.E.; Savory, E. Finite element modeling of transmission line under downburst wind loading. Finite Elem. Anal. Des. 2005, 42, 71–89. [Google Scholar] [CrossRef]
- Chang, Q.; Chen, J.; Zhou, H.; Bai, J. Implementation of Paste Backfill Mining Technology in Chinese Coal Mines. Sci. World J. 2014, 2014, 821025. [Google Scholar] [CrossRef]
- Hua, S.; Li, Y.A.; Wang, Y.W.; Wang, Q.G.; Wang, W.; Hu, F.; Hu, L.Z.; Lei, Y. Study on Safe Thickness of Stope Roof and Ground Subsidence Based on Numerical Simulation. Adv. Mater. Res. 2014, 1065–1069, 71–75. [Google Scholar] [CrossRef]
- Liu, J.; Li, X.; He, T. Application status and prospect of backfill mining in Chinese coal mine. J. China Coal Soc. 2020, 45, 141–150. [Google Scholar]
- Deng, X.; Zhang, J.; Kang, T.; Han, X. Strata behavior in extra-thick coal seam mining with upward slicing backfilling technology. Int. J. Min. Sci. Technol. 2016, 26, 587–592. [Google Scholar] [CrossRef]
- Sun, Q.; Zhang, J.; Zhang, Q.; Yan, H. A case study of mining-induced impacts on the stability of multi-tunnels with the backfill mining method and controlling strategies. Environ. Earth Ences 2018, 77, 234. [Google Scholar] [CrossRef]
- Cabrero, J.M.; Bayo, E. Development of practical design methods for steel structures with semi-rigid connections. Eng. Struct. 2005, 27, 1125–1137. [Google Scholar] [CrossRef]
- Horstmann, G.A.; Dietz, V. A basic posture control mechanism: The stabilization of the centre of gravity. Electroencephalogr. Clin. Neurophysiol. 1990, 76, 165–176. [Google Scholar] [CrossRef]
- Yoo, W. Effects of a low-center-of-gravity backpack on the trunk stability of mountaineers while ascending and descending. J. Phys. Ther. Sci. 2015, 27, 3259–3260. [Google Scholar] [CrossRef] [PubMed] [Green Version]
- Meng, Z.; Guifeng, Z.; Lulu, W.; Jie, L. Wind-Induced Coupling Vibration Effects of High-Voltage Transmission Tower-Line Systems. Shock Vib. 2017, 2017, 1205976. [Google Scholar]
- Korteland, S.; Bottero, R.; Hassanizadeh, R.M.; Berentsen, R.W.J. What is the Correct Definition of Average Pressure? Transp. Porous Media 2010, 84, 153–175. [Google Scholar] [CrossRef] [Green Version]
- Qi, X.D.; Cheng, X.Z. Analysis on the Surface Subsidence Regular about Paste Filling Mining under the Buildings. Adv. Mater. Res. 2013, 734–737, 290–293. Adv. Mater. Res. 2013, 734–737, 290–293. [Google Scholar] [CrossRef]
- Zhang, J.X.; Chen, Z.H.; Tang, C.A.; Guo, X.Z.; Nan, S.Q.; Bao, J. Numerical Simulation Study of Underground Mining Influence on Pylon Foundation Stability. Disaster Adv. 2013, 6, 451–456. [Google Scholar]
- Zha, J.F.; Guo, G.L.; Feng, W.K.; Qiang, W. Mining subsidence control by solid backfilling under buildings. Trans. Nonferrous Met. Soc. China 2012, 21, S670–S674. [Google Scholar] [CrossRef]
- Li, M.; Zhang, J.X.; Sun, K.; Wu, Z.Y.; Zhou, N. Reducing Surface Subsidence Risk Using Solid Waste Backfill Technique: A Case Study under Buildings. Pol. J. Environ. Stud. 2019, 28, 3333–3341. [Google Scholar] [CrossRef]
- Qiang, S.; Nan, Z.; Song, W.J.; Xu, Z. Risk Assessment and Prevention of Surface Subsidence under Buildings by Cemented Paste Filling and Strip Mining Methods: A Case Study. Adv. Civ. Eng. 2021, 2021, 9965279. [Google Scholar] [CrossRef]


Publisher’s Note: MDPI stays neutral with regard to jurisdictional claims in published maps and institutional affiliations. |
© 2022 by the authors. Licensee MDPI, Basel, Switzerland. This article is an open access article distributed under the terms and conditions of the Creative Commons Attribution (CC BY) license (https://creativecommons.org/licenses/by/4.0/).