Article

Dynamic Characteristics Analysis of a 660 MW Ultra-Supercritical Circulating Fluidized Bed Boiler

1
Key Laboratory of Low-Grade Energy Utilization Technologies and Systems, Chongqing University, Chongqing 400044, China
2
School of Energy and Power Engineering, Chongqing University, Chongqing 400044, China
3
School of Primary Education, Chongqing Normal University, Chongqing 400070, China
4
CNNC Key Laboratory on Nuclear Reactor Thermal Hydraulics Technology, Nuclear Power Institute of China, Chengdu 610213, China
*
Author to whom correspondence should be addressed.
Energies 2022, 15(11), 4049; https://doi.org/10.3390/en15114049
Submission received: 13 May 2022 / Revised: 26 May 2022 / Accepted: 30 May 2022 / Published: 31 May 2022

Abstract

:
The 660 MW ultra-supercritical circulating fluidized bed (CFB) boiler, which is the maximum capacity and largest scale boiler in the world has entered construction stage in China. This study established a full-scale dynamic simulation model of the 660 MW ultra-supercritical at 100% boiler maximum continuous rating (BMCR) condition. The model consists of an air-flue gas system, a water-steam system, and an ash circulation system. The “core-annulus” of the gas-solid two-phase flow structure and “six-equation” model of water-steam two-phase flow were applied to simulate the behaviors of the gas-solid phase and water-steam system, respectively. The model was calibrated and verified at 100% BMCR condition, and the steady-state simulation results presented a high accuracy compared with the designed parameters. A dynamic simulation of three typical conditions were carried out as well, including a 5% feed water decrease, 5% air decrease, and 5% coal decrease, respectively. The results showed that the dynamic simulation model established in this study can simulate the dynamic behaviors of the 660 MW ultra-supercritical CFB boiler reasonably.

1. Introduction

As the Chinese government puts forward the grand goal of “carbon peak and carbon neutralization”, it will have a significant and far-reaching impact on China’s energy industry [1]. Although the Chinese government continues to increase the proportion of renewable energy such as wind energy and solar energy in China’s energy industry, fossil energy will still play an important role in the future. In recent decades, circulating fluidized bed (CFB) boilers have developed rapidly due to the advantages of low emissions, high efficiency, and high fuel adaptability. The capacity of CFB boilers has developed from the initial 95.8 MW to 600 MW, and the main steam parameters have been continuously improved, from subcritical to supercritical. At present, two 660 MW ultra-supercritical CFB boiler projects have been approved and entered construction stage in China [2].
Different from pulverized coal boilers, a large amount of bed material accumulates at the bottom of the CFB boiler to form a high-density bed, and the bed materials move from the bottom to the furnace outlet under the blowing of the primary and secondary air. The solid particles at the outlet are captured by cyclone separators, then enter the external bed heat exchangers, and finally return to the furnace to form an external circulation of the bed material. Owing to a large number of bed materials in the furnace, the thermal inertia of CFB boilers is much larger than that of the pulverized coal boilers. Additionally, the coal combustion characteristics and gas-solid two-phase flow in the CFB boilers are also different from those in pulverized coal boilers. Hulin [3] et al. established a steady-state model based on the operation data of a 35t/h commercial CFB boiler. The model considered fluid dynamics, heat transfer, and combustion. It can predict the flue gas temperature and flue gas components. The radial and axial concentration distribution of char in the furnace were also simulated. Golriz [4] studied the temperature distribution in a 165 MW CFB boiler under two fuels (coal and peal). The results show that the thermal boundary thickness increases with the increment of furnace height and the decreasing superficial gas velocity. In addition, the fuel type has a significant effect on the bottom and upper areas of the CFB boiler. Hua [5] et al. developed a “core-annulus” semi-empirical model of gas-solid two-phase flow in furnace and studied the concentration distribution of solid particles in the furnace based on this model. The combustion model described the combustion and shrinkage of coal particles. The results showed that the coarser particles gathered near the water wall, and the average particle size decreases with the increase in furnace height. The system-level simulation is always based on lumped parameter model, which strengthen the understanding from system level. However, a detailed model, which can reflect the specific characteristics, such as the fluid flow characteristics [6,7] and heat transfer in furnace, are also important to be investigated. Many CFD-based works [8,9,10,11] were carried out to research the characteristics of combustion, heat transfer, and gas-solid two-phase flow in CFB boilers. Additionally, some system-level simulation models were also used to study the steady-state and dynamic characteristics of CFB boilers [12], including combustion system [13], water-steam system [14], ash circulation system [15], and air-flue gas system [16].
Currently, with the 660 MW ultra-supercritical CFB boiler entering the construction stage in China, some researches on the 660 MW ultra-supercritical CFB boiler have been reported. Tang [17] et al. developed a simulation model for the evaporator system of a 660 MW ultra-supercritical CFB boiler. The model was used to calculate the performance of the evaporator system under different working conditions, including total pressure drop, mass flux distribution, and metal wall temperature. Zhu [18] et al. developed a simulation model for cycle thermal efficiency calculation of a 660 MW ultra-supercritical CFB boiler power plant and gave optimization design and operation suggestions according to the thermal analysis results. Based on the two-dimensional combustion model of a 600 MW supercritical CFB boiler, Ji [19] et al. established a combustion model for a 660 MW ultra-supercritical CFB boiler for NOx and SO2 emissions prediction. Zhou [20] et al. studied the heat transfer characteristics of vertical the upward water wall in a 660 MW ultra-supercritical CFB boiler, and a new variable turbulent Prandtl model was applied in numerical simulation. Moreover, an experimental approach was used to study the effects of specific heat ratio, buoyancy parameter, and acceleration parameter on supercritical water heat transfer as well. Based on the results of numerical simulation and experimental research, the safe heat transfer characteristics of the water wall of the 660 MW ultra-supercritical CFB boiler were analyzed. The results provided a good reference for operating of the 660 MW ultra-supercritical boiler. Xin [21] et al. established a scaled experimental system based on the designed parameters of a 660 MW ultra-supercritical CFB boiler and studied the gas-liquid flow distribution in water wall under the 25%, 50%, and 70% turbine heat acceptance(THA) conditions. These researches deeply promoted the development of CFB boilers.
The dynamic characteristics are important for the boiler’s operation, especially the operational strategy deeply affected by the response of boilers. Therefore, for the 660 MW ultra-supercritical CFB, it is of great significance to study its dynamic response under different working conditions. At present, the researches mainly focus on various sub-systems, such as the water-steam system and combustion system, and the system-level simulation for the 660 MW ultra-supercritical CFB boiler is rarely reported. Therefore, the full-scale system-level simulation model of the 660 MW ultra-supercritical CFB boiler established in this study has important academic and engineering values, it could lay a good foundation for further work. In this study, we developed a system-level simulation model for a 660 MW ultra-supercritical CFB boiler, which was based on the commercial software-APROS. The model was calibrated and validated at the 100% BMCR condition.

2. System Architecture

The 660 MW ultra-supercritical CFB boiler simulation model was established in the commercial simulation software-Advanced Process Simulation software (APROS), which was developed by the Finland Fortum company and VTT Finland technology research center [22]. The 660 MW ultra-supercritical CFB boiler simulation model is composed of three sub-systems, which including a water-steam system, an air-flue gas system, and an ash circulation system. The coupled water-steam, air-flue gas and ash system of the 660 MW ultra-supercritical boiler is shown in Appendix A. In the water-steam system, water converted from liquid to steam in water wall, and the water-steam system of 660 MW ultra-supercritical CFB boilers are similar with that of ultra-supercritical coal-pulverized boilers. The air-flue gas system is to charge primary air into the bed for fluidizing the materials and the secondary air is used for combustion in furnace. The ash circulation system is used to set a material circulation loop for CFB boilers.

2.1. Water-Steam System

According to the water-steam flow process, the water-steam system is composed of the superheated steam system and reheated steam system. To control the main steam and reheated steam temperature, the attemperation water system is applied to keep the CFB boiler working in a safe condition.

2.1.1. Superheated Steam System

The superheated steam system consists of a feedwater pump, economizer (ECO), water wall, moisture separator, cyclone separator, low-temperature superheaters (LTS), intermediate-temperature superheaters (ITS), and high-temperature superheaters (HTS). The feedwater of boiler is driven by a feedwater pump and subsequently flows through the high-pressure heater, economizer and water wall. When the boiler works at low load conditions (<30% BMCR), the water-steam mixture comes from the water wall and then enters the moisture separator. The saturated water which comes from water wall flows into a water storage tank and driven by the boiler circulating pump (BCP) returns to the economizer. The saturated steam from the moisture separator flows through the cyclone separator and superheaters. When the boiler works at high load conditions (>30% BMCR), all the water is converged from liquid to steam in the water wall. The HTS are located in the external bed heat exchangers to heat the superheated steam through circulating ash. There are three stages of attemperation water are arranged in the superheated steam system to ensure the safe operation of the superheated steam system. The three stages of attemperation water are arranged between the LTS and ITS1, ITS 2 and HTS1, HTS1 and HTS2, respectively. The diagram of the superheated steam system is shown in Figure 1 [23].

2.1.2. Reheated Steam System

In the reheated steam system, the reheated steam comes from the high-pressure cylinder of the steam turbine. The reheated steam is heated in a two-stage of low-temperatures reheater (LTR) and a one-stage of high-temperature reheater (HTR). Similar to the HTSs, the HTRs are also arranged in the external bed heat exchangers to heat the reheated steam by adjusting the ash flow in the external bed heat exchangers. The diagram of the reheated steam system is shown in Figure 2.

2.2. Air-Flue Gas System

The air-flue gas system contains the primary air system, the secondary air system, and the flue gas system. The air is heated in a tri-sectional regenerative air pre-heater, and the primary air enters the bottom of the bed to keep the bed stays fluidized. The secondary air enters the furnace to control combustion. The flue gas passes through the cyclone separator, the second stage of LTR, the LTS, the first stage LTR, the economizer, and the air pre-heater. Finally, the flue gas passes through the exhaust after-treatment system. The flue gas system is shown in Figure 3.

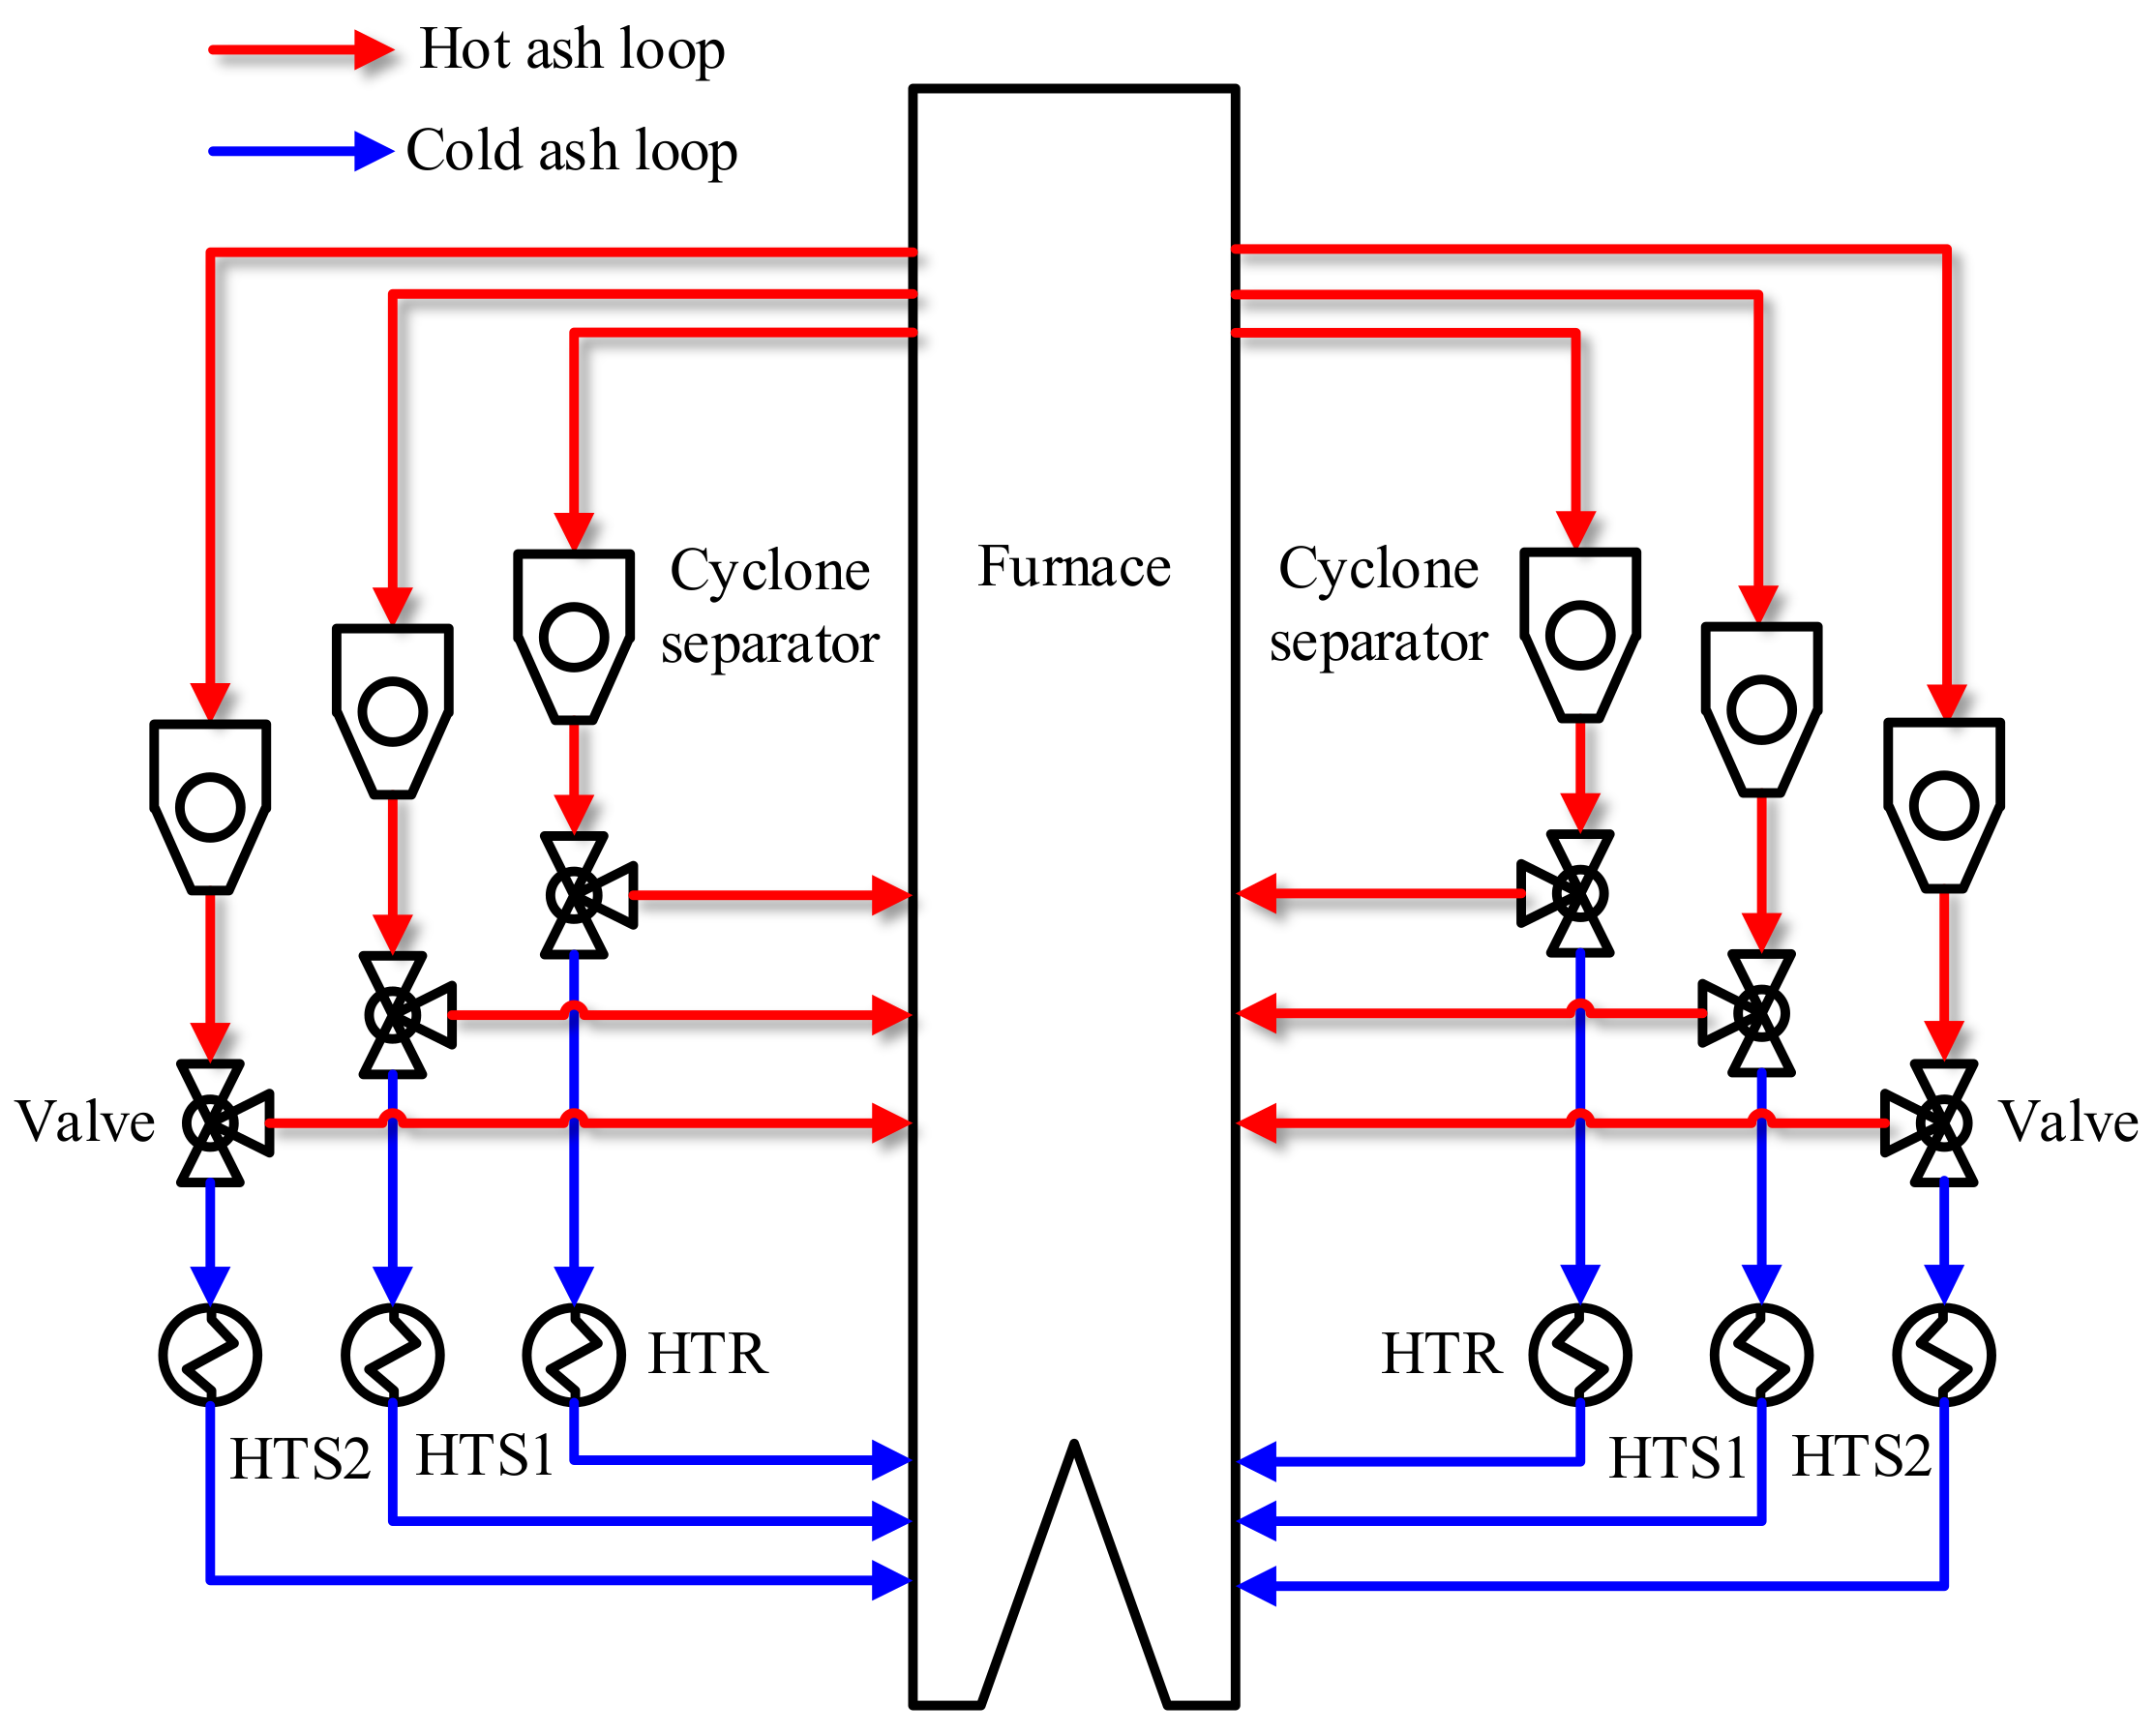
2.3. Ash Circulation System

The solid particles from the furnace outlet are captured by the cyclone separator, then the solid particles enter the ash circulation loop. A part of the solid particles heats the superheated steam and reheated steam in the external bed heat exchangers and then returns to the furnace; since the solid particles are cooled in this loop, it is called the “cold ash loop”. Another part of the solid particles directly returns to the furnace without heat exchange in the external bed heat exchangers, and this part of the circulation loop is called the “hot ash loop”. There are 6 external bed heat exchangers located in the ash circulation loop, 4 of them are superheaters and the rest of them are reheaters. The diagram of the ash circulation loop is shown in Figure 4 [23].

3. Mathematical Model

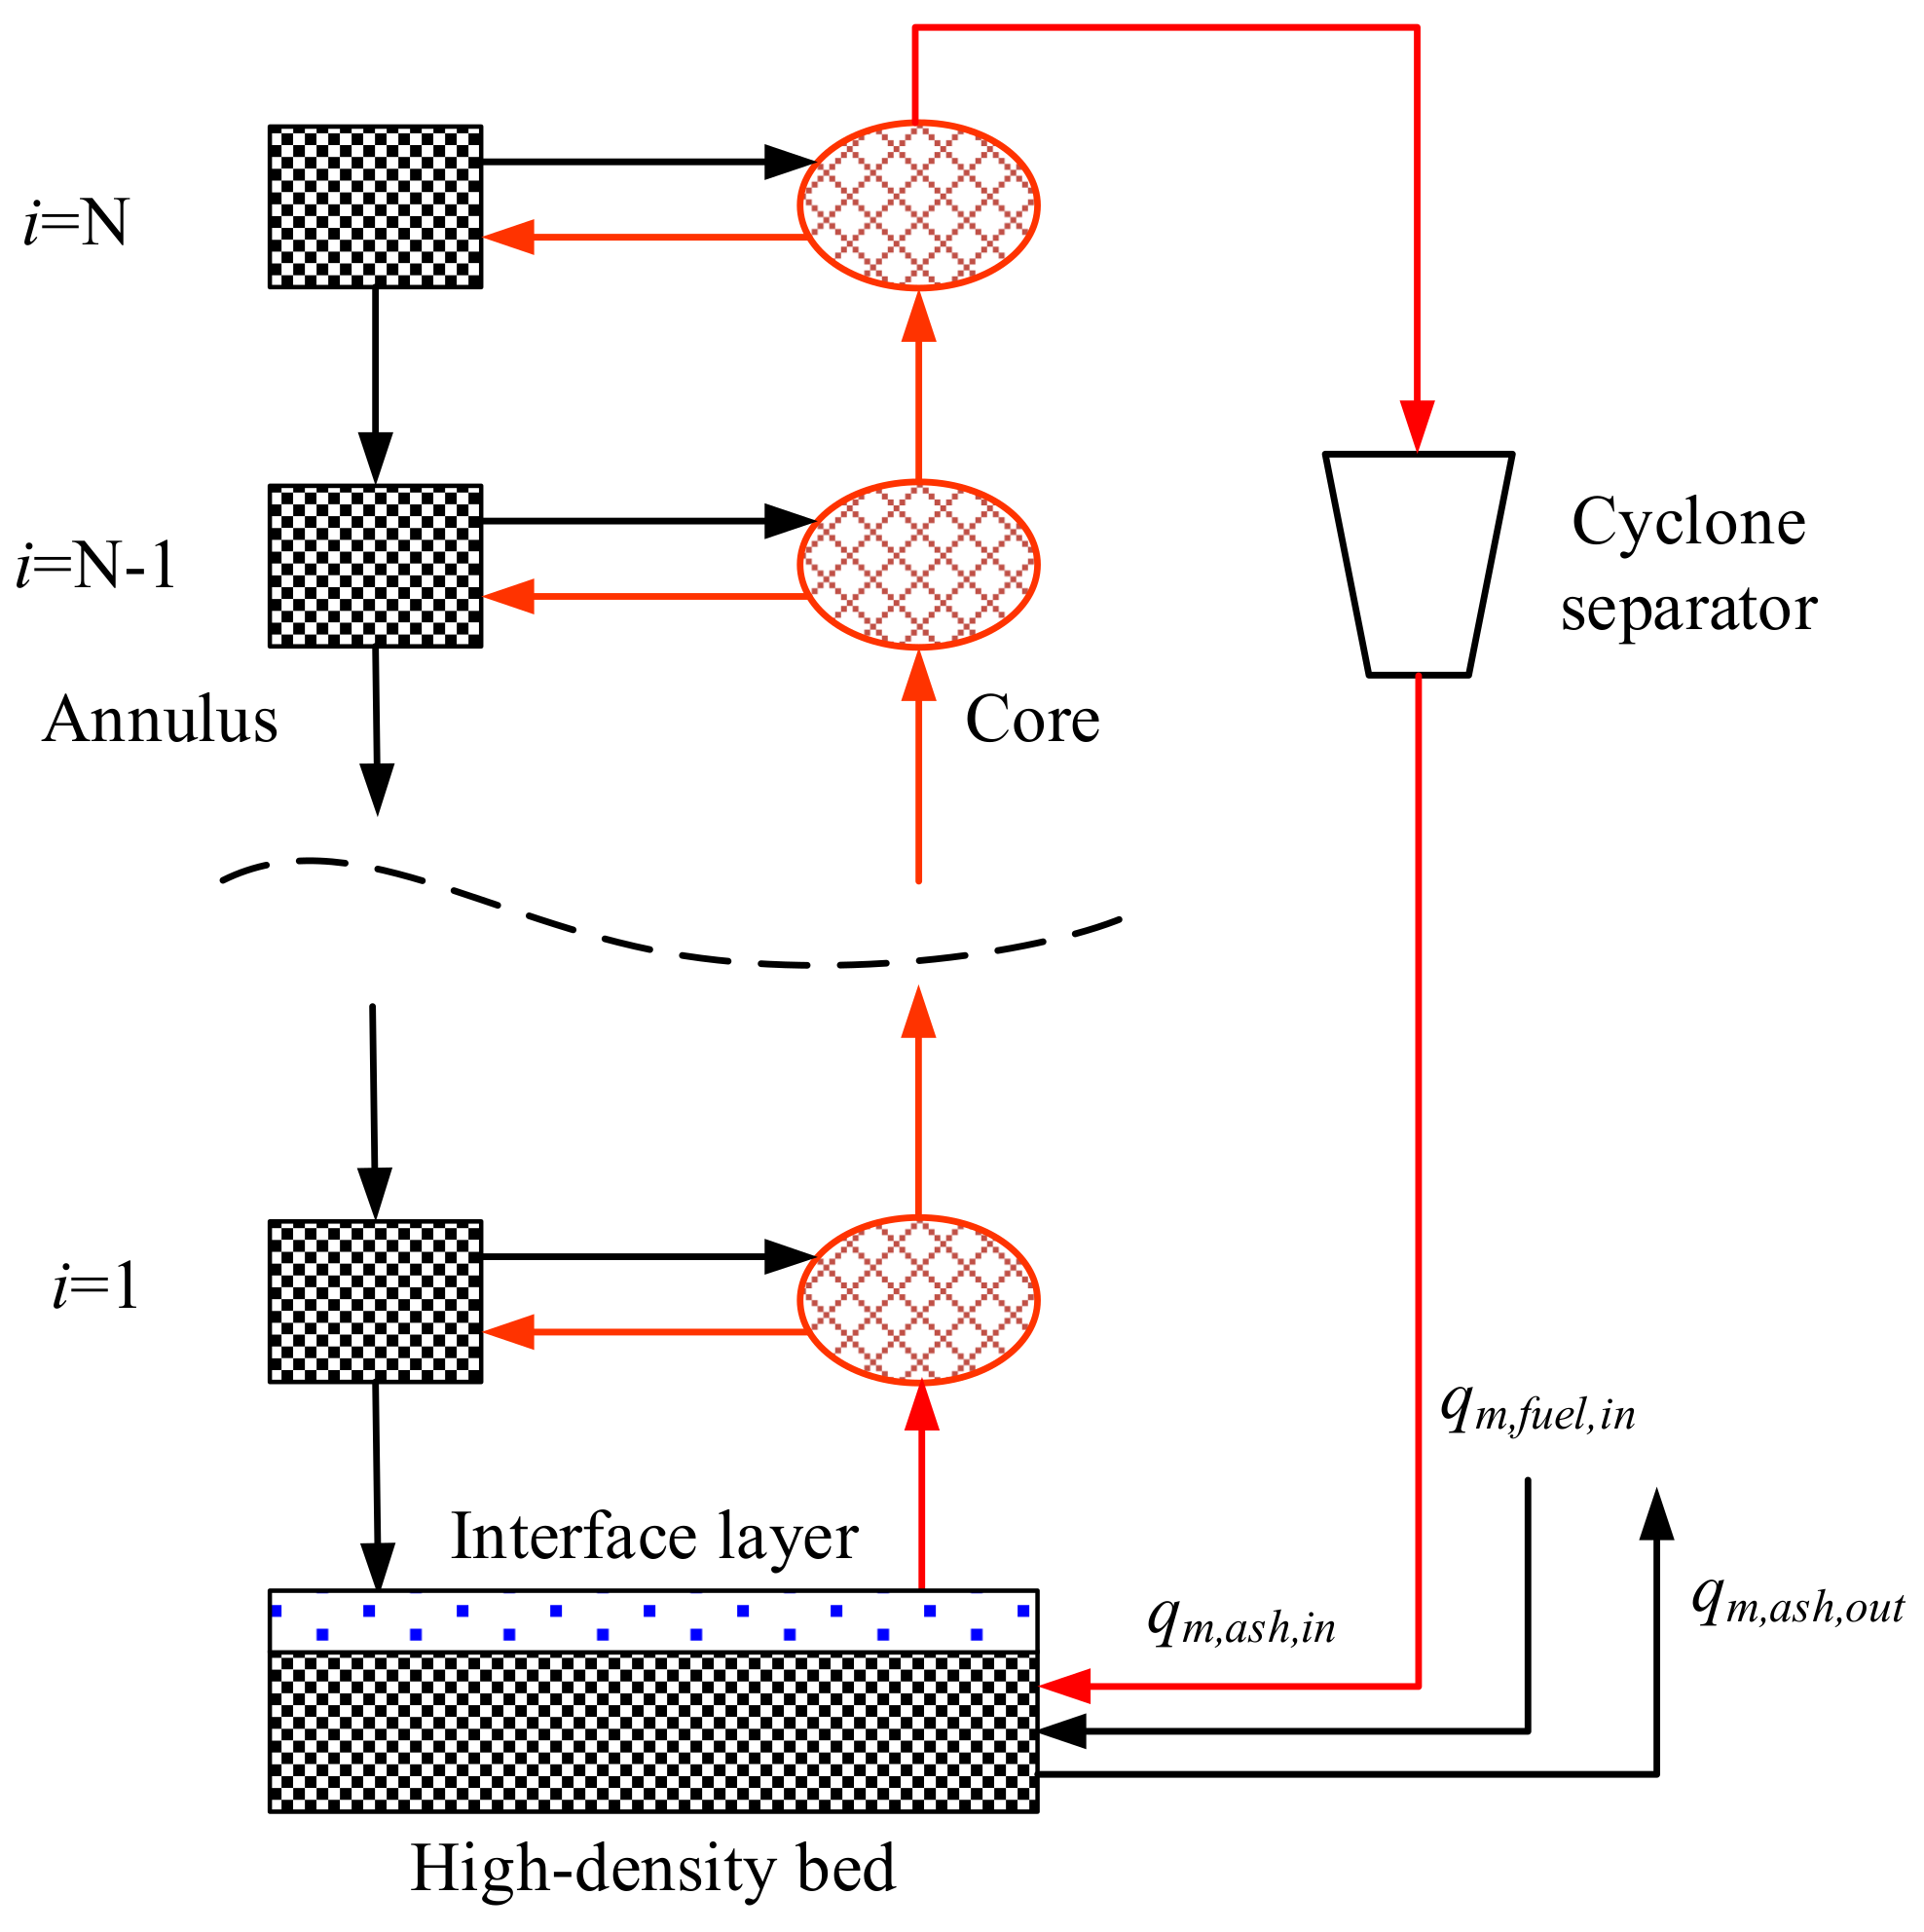
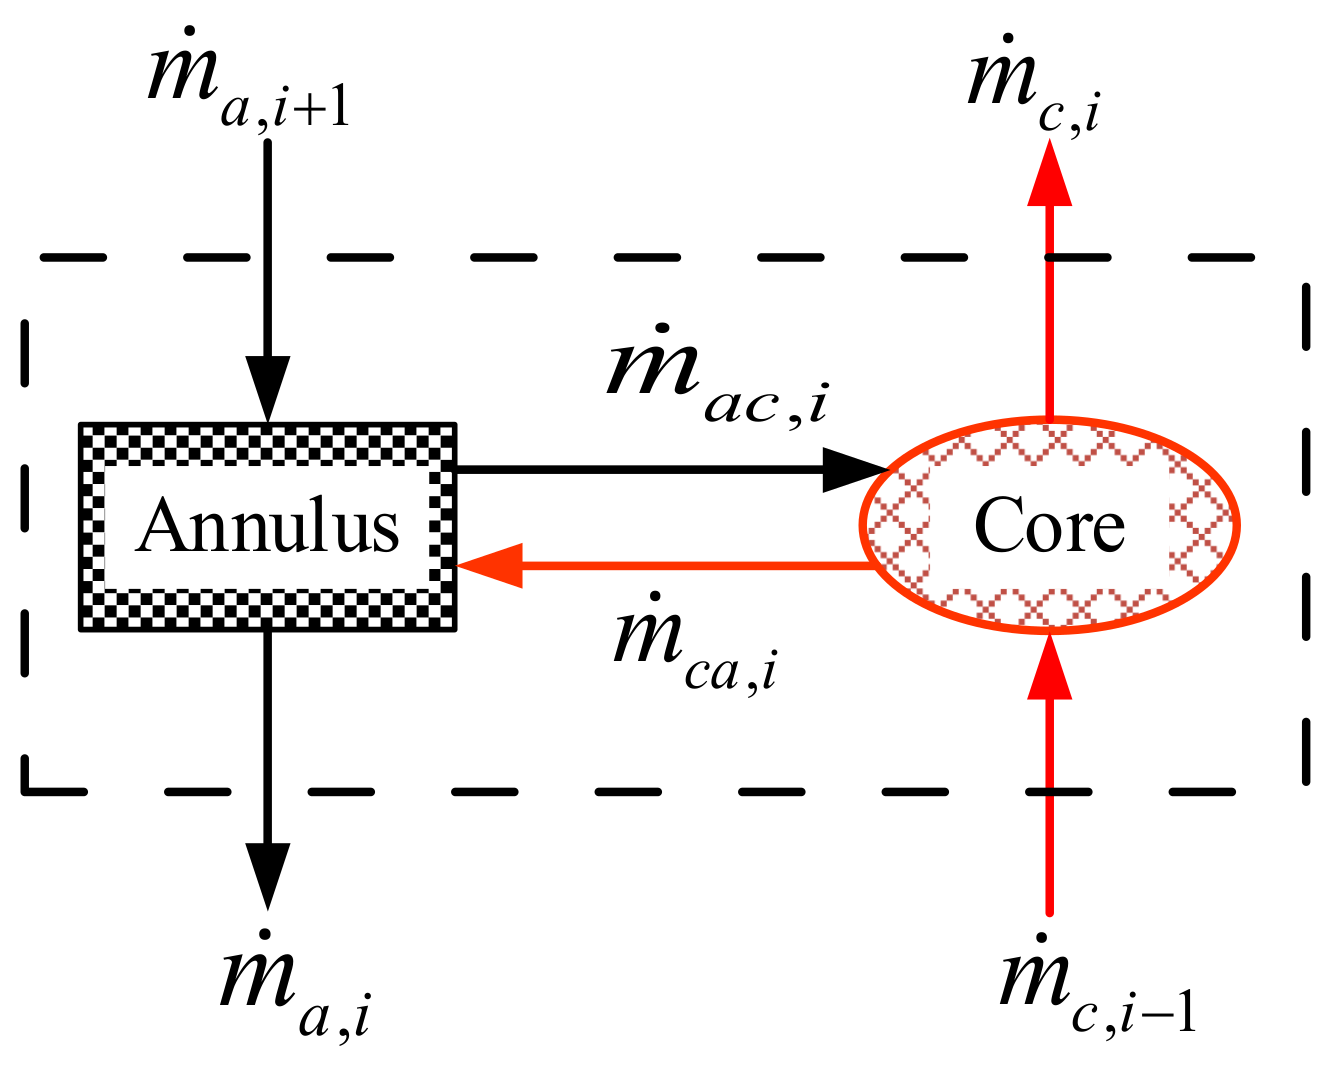
3.1. Gas-Solid Two-Phase Flow and Heat Transfer Model

The “core-annulus” model of gas-solid two-phase flow in furnace is a widely used simplified model to describe the dynamic characteristics of gas-solid two-phase flow in CFB boilers. In the radial direction of the CFB boiler, the furnace is divided into two zones, the core area and the annular area. In the core area, the air velocity is high, but the solid density is low, and the solid moves upward. In the annular area, since it is close to the furnace wall, solid particles gather near the wall to form a dense area, in which the solid particles move downward. The “core-annulus” model can not only reflect the non-uniformity of gas-solid two-phase distribution in the axial direction, but also reflect its change in the radial direction, so it has attracted a lot of attention since it is reported. The “core-annulus” model in the CFB boiler is shown in Figure 5 [23,24].
In the APROS simulation model, the furnace of the CFB boiler is divided into the upper dilute phase area and the bottom dense phase area. In the upper dilute phase area, it is divided into several nodes along the height direction. Each node contains a pair “core-annulus” structure. The mass transfer between the core area and the annular area is also simulated, and the last node in the upper zone is connected with the cyclone separator. In the bottom dense phase, which is called the “high-density bed”, there is only one node, and it is assumed that the solid particles are evenly mixed in the bed. There is a virtual interface layer between the dilute phase area and the dense phase area, which is used to provide the boundary conditions for solution. Figure 6 [25] shows the diagram of the “core-annulus” model in APROS.
As mentioned in Figure 6, the solid particles move upward from the bottom in the core area and downward in the annular area. In each pair of “core-annulus” structures, the mass transfer happened between the core area and the annular area. The average density of the node i is [26]:
ρ i = m c , i + m a , i V i = ρ c , i + ρ a , i
where ρi is the solid density of node i, which is the sum of the density of core node ρc,i and the density of annulus node ρa,i. mc,i and ma,i is the mass of core area and annulus area in node i, respectively.
The mass balance of the core area and the annulus area in node i is introduced as:
d ρ c , i d t = m ˙ c , i 1 m ˙ c , i + m ˙ a c , i m ˙ c a , i V i
d ρ a , i d t = m ˙ a , i + 1 m ˙ a , i + m ˙ c a , i m ˙ a c , i V i
In the above equations, m ˙ is the mass flow, the subscript c represents the core area and a represents the annulus area, ac represents mass that is transferred from the annulus area to the core area, and ca means the mass is transferred from the core area to the annulus area. The subscript i represents node i. The mass balance of node i is shown in Figure 7.

3.1.1. Bed Material Distribution

The bed material distribution in the vertical direction of the upper area is based on the equation [27,28]:
ε h = ε s , + ( ε s , d ε s , ) e a h
It uses the solid fraction in the infinite height ε s , and the average fraction in the dense bed of the bottom zone, and h is the elevation from the bottom of the bed. The coefficient a is calculated by using the particle diameter dp and superficial gas velocity v0 [29]:
a = 200 d p 0.572 v 0
The dense bed solid volume fraction ε s , d is calculated with the formula:
ε s , d = ε s , m f ( 1 ε b )
where εs,mf is the solid volume fraction at minimum fluidization and εb is the bubble volume fraction. The bubble volume fraction εb is calculated as [30]:
ε b = 1 1 + 1.3 f 2 ( v 0 v m f ) 0.8
f 2 = 0.24 ( 1.1 + 2.9 e 330 d p ) ( 0.15 + ( v 0 v m f ) ) 0.33
where vmf is the minimum fluidizing velocity. The gas fraction at minimum fluidization is obtained by using the equation [31]:
ε g , m f = 0.586 ϕ s 0.72 A r 0.029 ρ g ρ s 0.021
where ϕ s is the sphericity of particle, Ar is the Archimedes number, ρ g is gas density, and ρ s is the solid density. Therefore, the solid volume fraction at minimum fluidization ε s , m f is calculated as below:
ε s , m f = 1 ε g , m f
The Archimedes number is calculated as [32]:
A r = ( ρ s ρ g ) ρ g d p 3 g μ g 2
Additionally, the minimum fluidizing velocity is then calculated as:
v m f = μ g Re m f d p ρ g
where μ g is the dynamic viscosity of the gas, the Reynolds number at minimum fluidization Re m f can be obtained by solving the Ergun equation [33,34]:
1.75 ε g , m f 3 ϕ s Re m f 2 + 150 ( 1 ε g , m f ) ε g , m f 3 ϕ s 2 Re m f = A r

3.1.2. Heat Transfer

The heat transfer between gas-solid flow and water wall is presented in Figure 8 [25]. In the heat transfer simulation model, the solids of the core area and annulus area cannot transfer heat directly, the heat transfer only happened between solids and gas. There is no direct heat transfer between the flue gas and water/steam, the heat must be transferred through the tube metal. To reduce the complexity of the heat transfer model, the hypothesis that sufficient heat transfer between solids and flue gas is used, which means that the temperature of solids and flue gas are almost the same in each node. The total heat transfer coefficient which contains the effects of convection, conduction, and radiation is applied to calculate the heat transfer between the gas-solid flow and the water wall. The total heat transfer coefficient is calculated as [35]:
h w = C w ρ a v g 0.391 T a v g 0.408
where hw is the total heat transfer coefficient, Cw is a constant which the value is 5 in this model, ρ a v g is the average density of the gas-solid phase, and T a v g is the average temperature.

3.2. Water-Steam Two-Phase Flow Model

3.2.1. Homogeneous Model

The homogeneous model also known as the three-equation model, is used to simulate the dynamic behaviors of liquid and gas in the superheater, reheater, and economizer, where only water or steam exists in these parts of the boiler. The homogenous model is also applied for flue gas modeling. It is based on dynamic conservations of mass, energy, and momentum, as presented in the below formulas [28,36].
Mass conservation:
ρ t + ( ρ u ) z = 0
Energy conservation:
( ρ h ) t + ( ρ u h ) z = p t + q w
Momentum conservation:
( ρ u ) t + ( ρ u 2 ) z + p z = ρ g z + F w
In the above equations, qw is the heat transferred through walls, and Fw represents the friction force between the wall surface and fluid.

3.2.2. Two-Phase Flow Model

In the water wall of the boiler, water and steam are always mixed. Hence, the two-phase model is necessary to simulate the dynamic behaviors of the water-steam mixture. The two-phase model, also known as the six-equation model, is to set up the conservation equation of mass, energy, and momentum for both liquid and gas phases, respectively. The conservation equations of liquid and gas phases have similar formulas in one spatial coordinate as follows [28,36,37].
Mass conservation:
( α k ρ k ) t + ( α k ρ k u k ) z = Γ k
Energy conservation:
( α k ρ k u k ) t + ( α k ρ k u k h k ) z = α k p t + Γ k h i k + q i k + F w k u k + F i k u i k
Momentum conservation:
( α k ρ k u k ) t + ( α k ρ k u k 2 ) z = Γ k u i k + α k ρ k g z + F w k + F i k
In the above equations of the two-phase model, the subscript k can represent either liquid (k = l) or gas (k = g), α is the void fraction, i represents the interface between water and steam, and m is the metal wall. The term Γ refers to the mass exchange rate between water and steam, F is the friction force and q is heat flow. The h in the energy conservation equation represents the total enthalpy including the kinetic energy.
The mass transfer between the liquid and gas is calculated as:
Γ = Γ g = Γ l = q i l + q i g q w i h g , s a t h l , s a t
where qwi represents the heat flowing from the wall directly to the interface, qil is the heat transfer between interface and liquid phase, qig denotes the heat transfer between interface and gas phase, hg,sat is enthalpy of saturated gas, and hl,sat is the enthalpy of saturated liquid.
The heat transfer from the liquid side and gas side are calculated as:
q i l = K i l ( h l h l , s a t )
q i g = K i g ( h g h g , s a t )
where Kil and Kig are interfacial heat transfer coefficients based on empirical correlations. The interfacial friction of two-phase flow is calculated using the interfacial friction of the various flow regimes and the weighing factors for stratification R and entrainment E.
F i = R F i s + ( 1 R ) ( 1 E ) ( 1 α ) F i b + α F i a + E F i d
where Fis, Fib, Fia and Fid are interfacial friction of stratified flow, bubbly flow, annular flow and droplet flow, respectively.
The wall friction is calculated as:
F w k = 1 2 f k ρ k u k u k D H
where fk if the friction factor and DH is hydraulic diameter.

4. Model Calibration and Validation

The 660 MW ultra-supercritical CFB boiler simulation is based on the 100%BMCR condition. The analysis of coal is shown in Table 1, and the geometric parameters are shown in Table 2.
Table 3 shows the steady-state simulation results at 100% BMCR condition. The results show that the relative errors of most parameters are less than 1%, which means the simulation model established in this study has a good accuracy compared with the designed values, and it is proved that the model is reliable as well.
Figure 9 shows the gas and solid temperature distributions in the furnace at 100% BMCR condition. As it is assumed that heat transfer between gas and solid phases is sufficient in the above modeling process, the temperature of the gas and solid phases are almost the same. Figure 10 shows that the solid density at the bottom area is much higher than that of the upper area, and the pressure drop from the bottom air distributor to the furnace outlet is gradually increased along with the furnace height, the high-density bed at the bottom causes the maximum pressure drop compared with the upper zone.

5. Results and Discussion

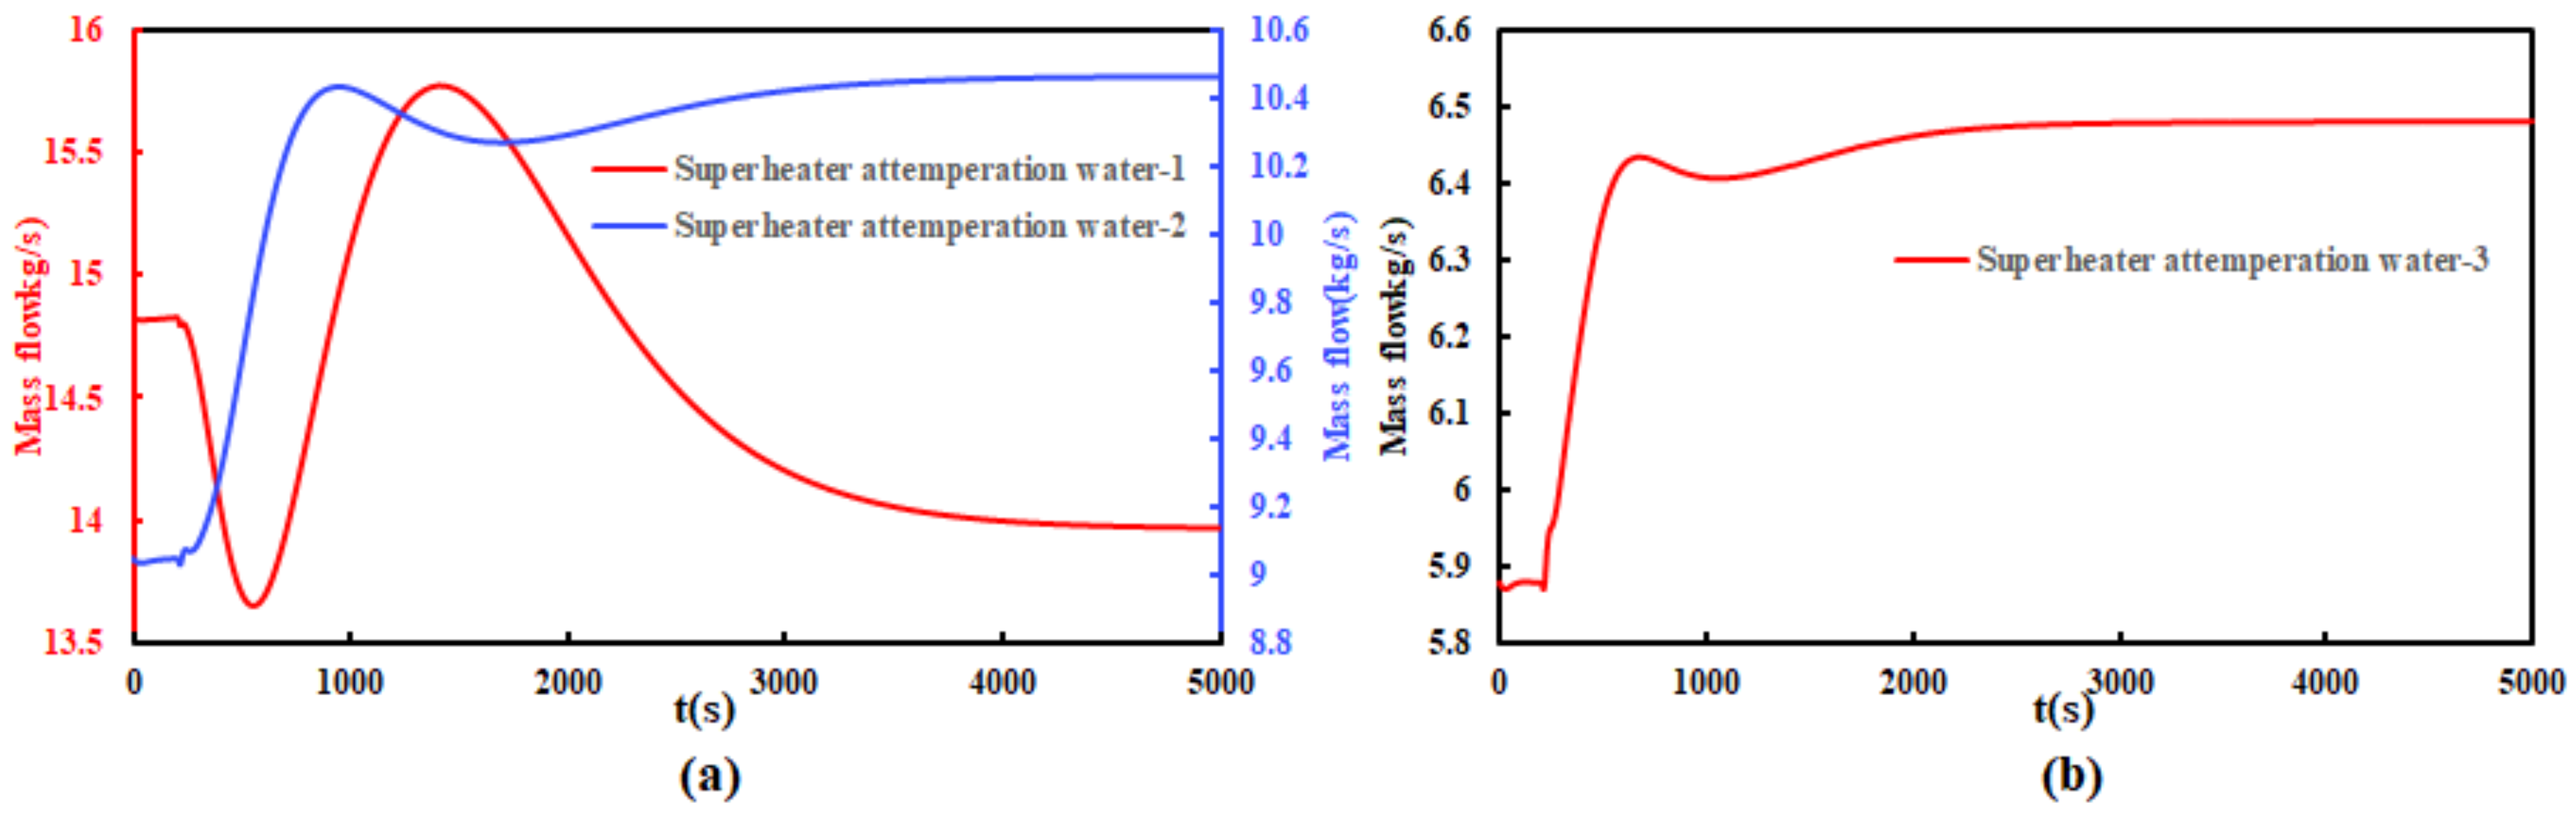
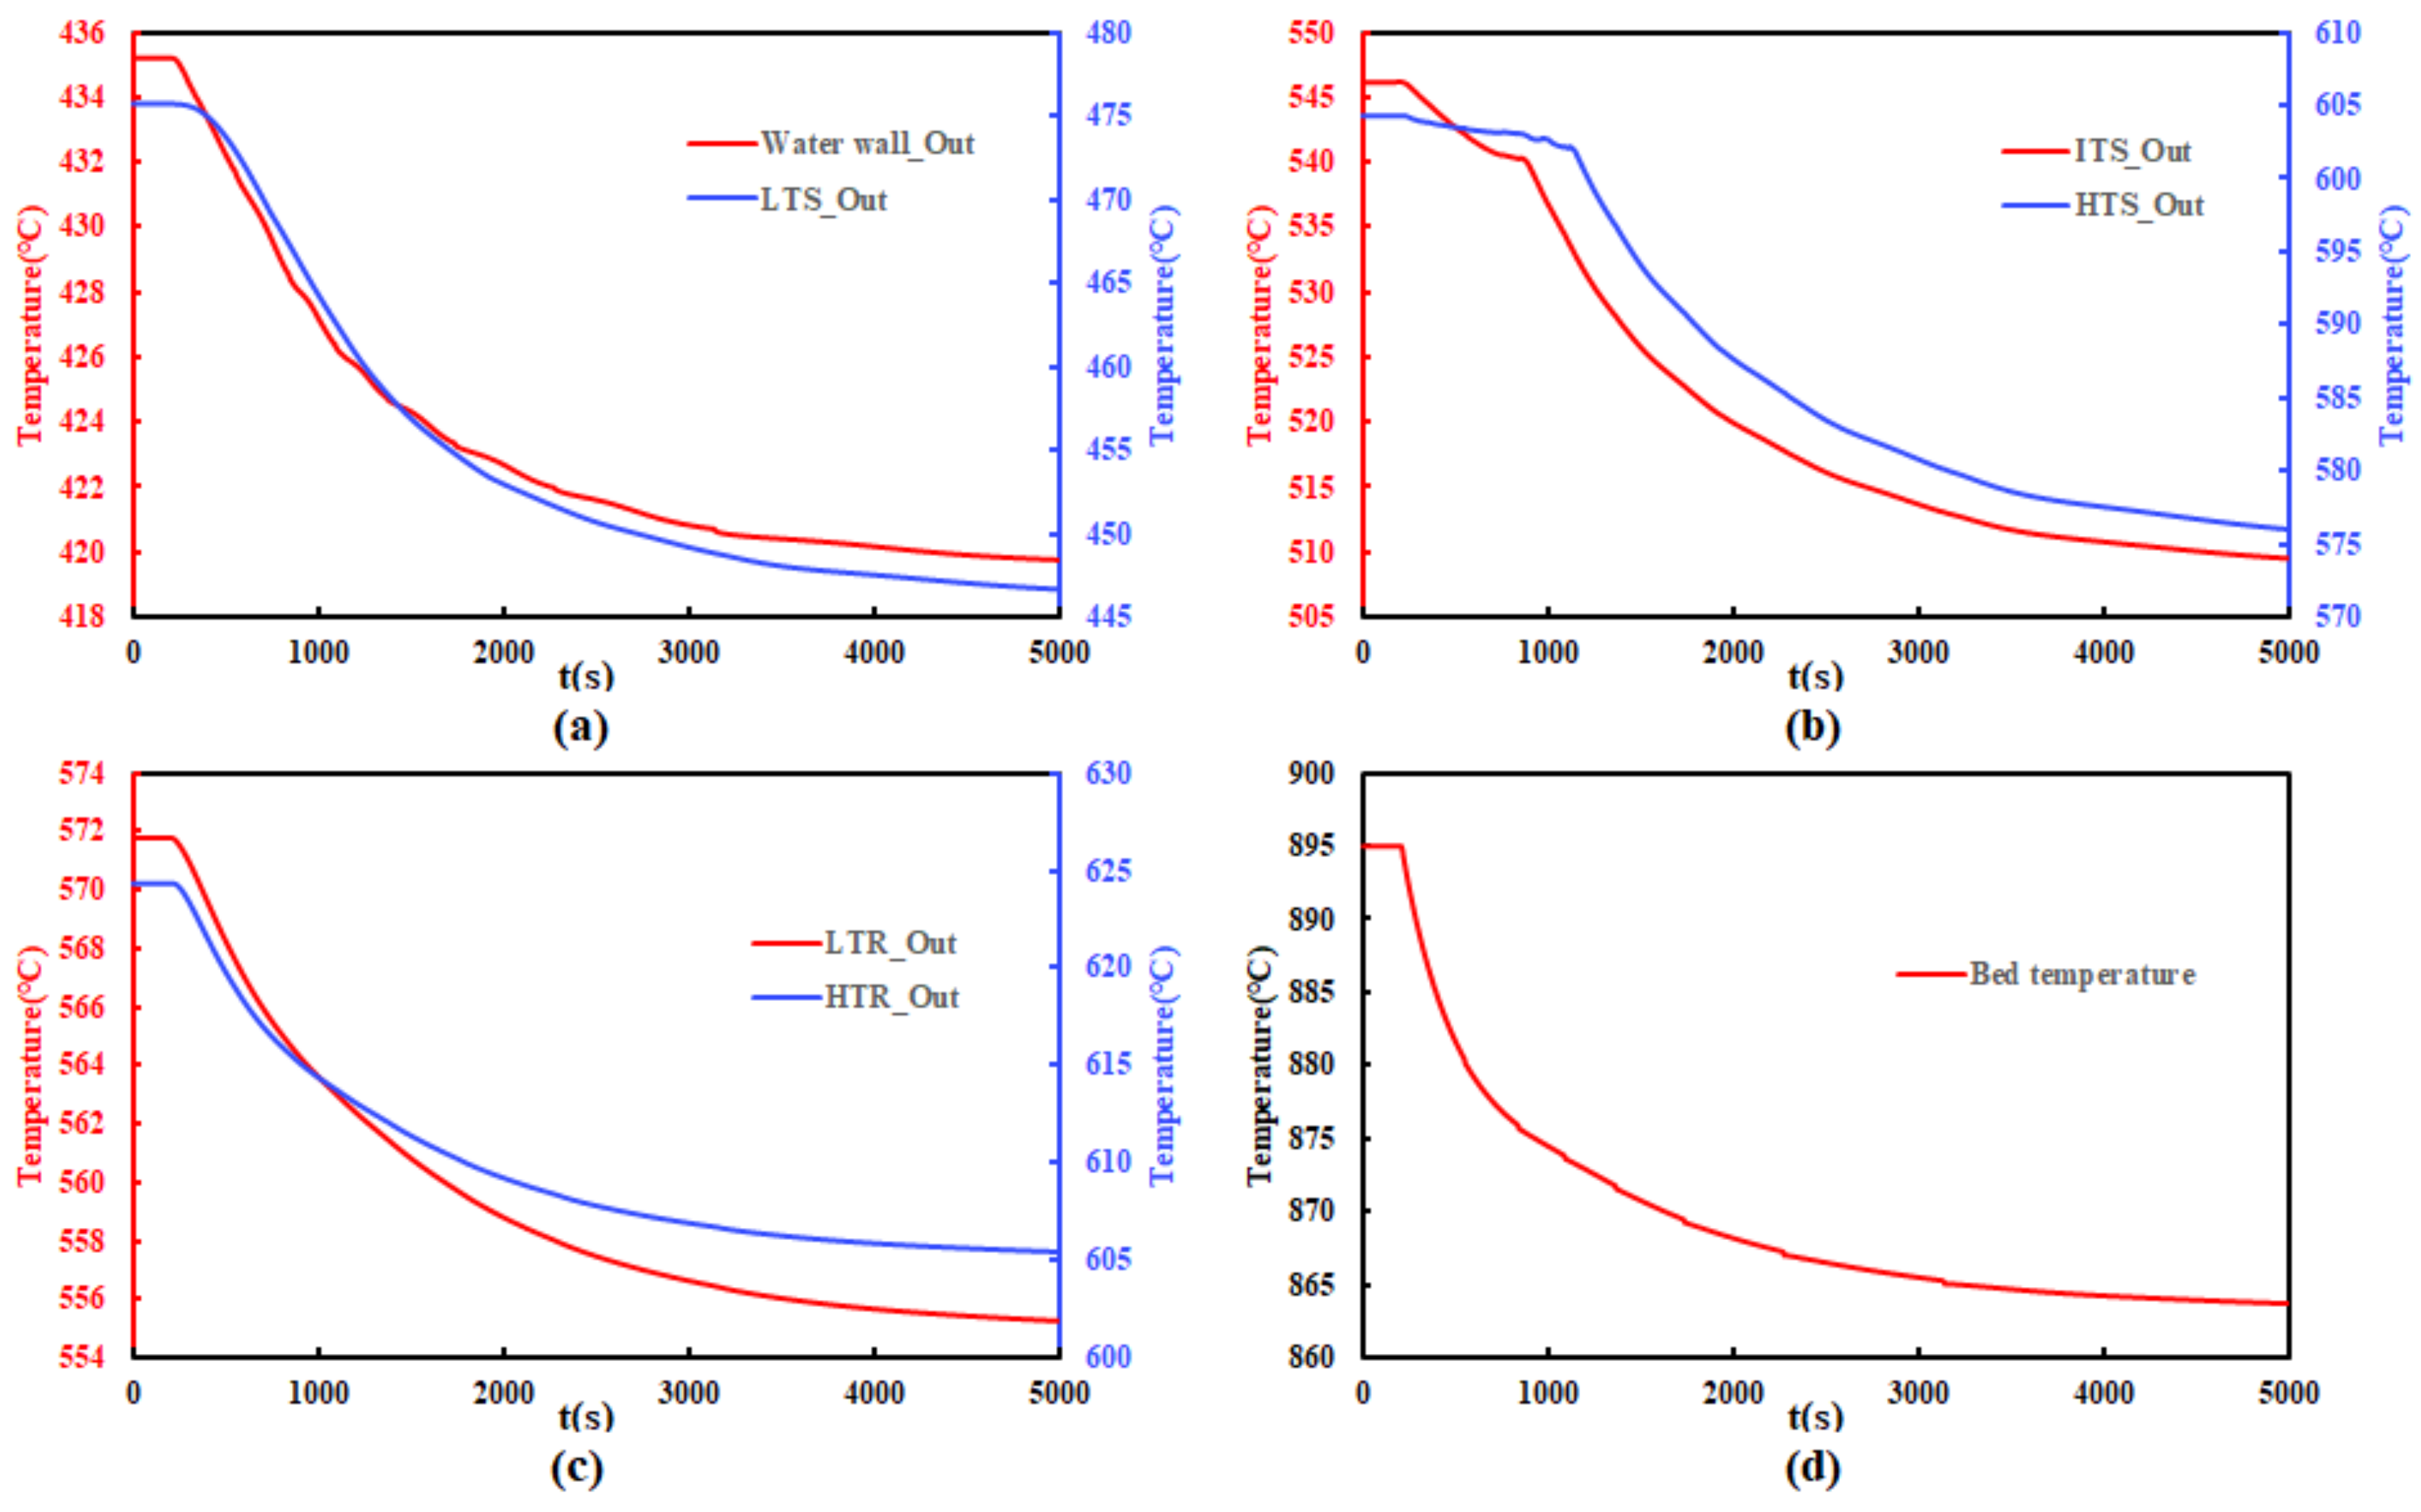
5.1. Feedwater Mass Flow Decreased by 5%

Figure 11 shows the temperature response of the superheated steam system, reheated steam system, and bed. Figure 12 shows the mass flow response of the attemperation water system. When the boiler feedwater mass flow is decreased by 5%, due to the constant air mass flow and coal mass flow, the heat in the furnace keeps constant as well. The mass flow of water wall decreases due to a decreased mass flow of feedwater, which causes the outlet temperature of the water wall to increase gradually. To prevent the ITS from overheating, the superheater attemperation water-1 mass flow increases to reduce the steam temperature of ITS. As the feedwater decreases, the bed temperature increases owing to the lower heat absorption of the water wall, which is decreased by the decrease in feedwater mass flow as well. For the reheated steam system, a higher bed temperature causes a higher heat absorption of the LTR, which also causes a higher reheater attemperation water mass flow. Since the increased reheater attemperation water mass flow, the steam mass flow of HTR also increases, which decreased the outlet steam temperature of the HTR. The temperature responses show us that the attemperation water system can keep the main steam and the reheated steam temperature at the settled values, which can ensure that boiler working in a safe condition. The decrease in feedwater affects the water-steam system a lot, especially for water wall and LTS. Owing to the large quantity of material in the bed, which causes a huge thermal inertia of the boiler, the bed temperature is almost kept at a constant.

5.2. Total Air Mass Flow Decreased by 5%

Figure 13 shows the responses of temperatures and Figure 14 shows the mass flow responses of the attemperation water system when total air mass flow decreased by 5%. Owing to the constant coal mass flow, the lower air mass flow causes a higher bed temperature. For the superheated steam system, the lower air mass flow in the furnace decreases heat absorption of the water wall, which also decreases the attemperation water-1 mass flow. The decreased attemperation water-1 mass flow also reduces the steam mass flow in ITS, which causes a lower temperature of the ITS. In this simulation model, we assume the ash mass flow of HTS is kept constant, so a higher bed temperature causes a higher outlet steam temperature of HTS. For the reheated steam system, a lower air mass flow means a lower flue gas mass flow in LTR, so the outlet steam temperature of the LTR is decreased, which also causes a lower HTR outlet temperature. Compared with the condition of feedwater decreased by 5%, we can observe that the decreased air mass flow affects the bed temperature a lot, which causes a 6 °C increase in the bed temperature.

5.3. Coal Mass Flow Decreased by 5%

Figure 15 shows the temperature response when coal mass flow decreased by 5%, and Figure 16 shows the response of the attemperation water system. When coal mass flow is decreased, the total air and feedwater mass flow keeps a constant value, so the bed temperature gradually decreased. The lower bed temperature means lower heat transfer between the water-steam system and the gas-solid flow, which causes a decreased steam temperature. With the continuous decrease in steam temperature, the attemperation water mass flow gradually decreases to zero. The decrease in coal mass flow not only affects the temperature of the water-steam system, but also affects the temperature of bed significantly. The 5% decrease in coal mass flow causes a more than 30 °C decrease in the bed, and the temperature of main steam and reheated steam deviates from the designed value by more than 20 °C.

6. Conclusions

In this study, we established a full-scale dynamic simulation model for a 660 MW ultra-supercritical CFB boiler. In the CFB boiler furnace, a “core-annulus” model was applied to simulate the characteristics of the solid-gas two-phase flow. For the water-steam system, the “six-equation” model was used in modeling. The model is verified and calibrated at 100% BMCR condition and the steady-state simulation results of 100% BMCR condition showed a high accuracy compared with the designed values. Moreover, the response of the 5% water mass flow decrease, 5% air mass flow decrease, and 5% coal mass decrease were simulated as well. The results showed that the decrease in feedwater mass flow significantly affects the temperature of water-steam system, and the decrease in air mass flow significantly affects the bed temperature. The coal mass flow affected not only the temperature of water-steam system, but also affected the bed temperature. The characteristics analysis was also carried out to understand the dynamic behaviors of the CFB boiler. The transient simulation results showed that the transient responses of the CFB boiler at various conditions were reasonable, which indicated that the simulation model was reliable, and this model could be used for other steady-state and transient analysis in further work. This system-level simulation model laid a good foundation for future work, such as control strategy optimization. Moreover, the model established in this study could be a good starting point for the development of a simulation-based digital twin for the 660 MW ultra-supercritical CFB boiler.

Author Contributions

Conceptualization, C.Y. and Z.Z.; methodology, C.Y. and Z.Z.; visualization, C.Y. and Z.Z.; writing—original draft preparation: Z.Z.; writing—reviewing and editing: C.Y., H.W., and K.D.; project administration: C.Y.; funding acquisition: C.Y. All authors have read and agreed to the published version of the manuscript.

Funding

This work was supported by the National Nature Science Foundation of China [grant number: 51876011].

Institutional Review Board Statement

Not applicable.

Informed Consent Statement

Not applicable.

Data Availability Statement

Not applicable.

Conflicts of Interest

The authors declare no conflict of interest.

Abbreviations

BCPboiler circulation pump
BMCRboiler maximum continuous rating
CFBcirculating fluidized bed
ECOeconomizer
HTRhigh-temperature reheater
HTShigh-temperature superheater
ITSintermediate-temperature superheater
LTRlow-temperature reheater
LTSlow-temperature superheater
THAturbine heat acceptance
Parameters
ArArchimedes number
Ddiameter (m)
Erate of entrainment
FFriction (N/m3)
ffriction factor
henthalpy (J/kg)
mmass (kg)
m mass flow (kg/s)
Ppressure (Pa)
qheat transfer (W/m3)
ReReynolds number
TTemperature (°C)
Vvolume (m3)
uvelocity (m/s)
zspatial coordinate (m)
αvolume fraction
ρdensity (kg/m3)
Γmass transfer rate (kg/(m3*s))
εfraction
μdynamic viscosity (N*s/m2)
Subscripts
aannulus, annular flow
avgaverage
bbubble, bubbly flow
ccore
ddense bed, droplet flow
ggas
hheight
inode i, interface
kindex, liquid (k = l), gas (k = g)
lliquid
mfminimum fluidization
pparticle
ssolid, stratified flow
wwall

Appendix A

The coupled water-steam, air-flue gas and ash system of the 660 MW ultra-supercritical boiler is shown in Figure A1.
Figure A1. Schematic of the coupled water-steam, air-flue gas and ash system of the CFB boiler.
Energies 15 04049 g0a1

References

  1. Li, Q. The view of technological innovation in coal industry under the vision of carbon neutralization. Int. J. Coal Sci. Technol. 2021, 8, 1197–1207. [Google Scholar] [CrossRef]
  2. Cheng, L.; Ji, J.; Wei, Y.; Wang, Q.; Cen, K. A note on large-size supercritical CFB technology development. Powder Technol. 2019, 363, 398–407. [Google Scholar] [CrossRef]
  3. Huilin, L.; Rushan, B.; Wenti, L.; Binxi, L.; Lidan, Y. Computations of a Circulating Fluidized-Bed Boiler with Wide Particle Size Distributions. Ind. Eng. Chem. Res. 2000, 39, 3212–3220. [Google Scholar] [CrossRef]
  4. Golriz, M.R. Temperature distribution at the membrane wall of a 165-MWth CFB boiler. Exp. Heat Transf. 2001, 14, 299–313. [Google Scholar] [CrossRef]
  5. Hua, Y.; Flamant, G.J.; Gauthier, D. Modelling of axial and radial solid segregation in a CFB boiler. Chem. Eng. Process. Process Intensif. 2004, 43, 971–978. [Google Scholar] [CrossRef]
  6. Tayebi, T.; Dogonchi, A.S.; Chamkha, A.J.; Ben Hamida, M.B.; El-Sapa, S.; Galal, A.M. Micropolar nanofluid thermal free convection and entropy generation through an inclined I-shaped enclosure with two hot cylinders. Case Stud. Therm. Eng. 2022, 31, 101813. [Google Scholar] [CrossRef]
  7. Aly, A.M.; El-Sapa, S. Double rotations of cylinders on thermosolutal convection of a wavy porous medium inside a cavity mobilized by a nanofluid and impacted by a magnetic field. Int. J. Numer. Methods Heat Fluid Flow 2022, 32, 2383–2405. [Google Scholar] [CrossRef]
  8. Pilawska, M. Testing of Heat Transfer Coefficients and Frictional Losses in Internally Ribbed Tubes and Verification of Results through CFD Modelling. Energies 2021, 15, 207. [Google Scholar]
  9. Liu, Y.; Wang, H.G.; Song, Y.Q.; Qi, H.Y. Numerical study on key issues in the Eulerian-Eulerian simulation of fluidization with wide particle size distributions. Int. J. Chem. React. Eng. 2022, 20, 357–372. [Google Scholar] [CrossRef]
  10. Zhang, N.; Wang, W.; Li, J. CFD Simulation of Combustion in a 150 MW e CFB Boiler. In Proceedings of the International Symposium on Coal Combustion, Harbin, China, 12–21 July 2011. [Google Scholar]
  11. Adamczyk, W.P. Modeling of particle transport and combustion phenomena in a large-scale circulating fluidized bed boiler using a hybrid Euler-Lagrange approach. Particuology 2014, 12, 29–40. [Google Scholar] [CrossRef]
  12. Hong, X.; Bai, J.; Wu, Y.; Wang, J.; Zhang, G. Dynamic simulation of a large scale 260 t/h CFB boiler based on SIMUCAD platform. In Proceedings of the 2009 ISECS International Colloquium on Computing, Communication, Control, and Management, Sanya, China, 8–9 August 2009. [Google Scholar]
  13. Wu, H.; Yang, C.; He, H.; Huang, S.; Chen, H. A Hybrid Simulation of a 600 MW Supercritical Circulating Fluidized Bed Boiler System. Appl. Therm. Eng. 2018, 143, 977–987. [Google Scholar] [CrossRef]
  14. Gao, M.; Zhang, B.; Hong, F.; Chen, F. Design and application of the feed water control strategy for a 350 MW circulating fluidized bed boiler. Appl. Therm. Eng. 2017, 125, 1–8. [Google Scholar] [CrossRef]
  15. Amczyk, W.P.; Kozołub, P.; Kruczek, G.; Pilorz, M.; Klimanek, A.; Czakiert, T.; Węcel, G. Numerical approach for modeling particle transport phenomena in a closed loop of a circulating fluidized bed. Particuology 2016, 29, 69–79. [Google Scholar] [CrossRef]
  16. Mirek, P. Air Distributor Pressure Drop Analysis in a Circulating Fluidized-Bed Boiler for Non-reference Operating Conditions. Chem. Eng. Technol. 2020, 43, 2233–2246. [Google Scholar] [CrossRef]
  17. Tang, G.; Zhang, M.; Junping, G.U.; Yuxin, W.U.; Junfu, L. Thermal-hydraulic Calculation and Analysis on Evaporator System of a 660 MWe Ultra-supercritical CFB boiler. Appl. Therm. Eng. 2019, 151, 385–393. [Google Scholar] [CrossRef]
  18. Zhu, S.; Zhang, M.; Huang, Y.; Wu, Y.; Yang, H.; Lyu, J.; Gao, X.; Wang, F.; Yue, G. Thermodynamic analysis of a 660 MW ultra-supercritical CFB boiler unit. Energy 2019, 173, 352–363. [Google Scholar] [CrossRef]
  19. Ji, J.; Cheng, L.; Wei, Y.; Wang, J.; Gao, X.; Fang, M.; Wang, Q. Predictions of NOx/N2O emissions from an ultra-supercritical CFB boiler using a 2-D comprehensive CFD combustion model. Particuology 2020, 49, 77–87. [Google Scholar] [CrossRef]
  20. Zhou, X.; Niu, T.; Xin, Y.; Li, Y.; Yang, D. Experimental and numerical investigation on heat transfer in the vertical upward flow water wall of a 660 MW ultra-supercritical CFB boiler. Appl. Therm. Eng. 2021, 188, 116664. [Google Scholar] [CrossRef]
  21. Xin, Y.F.; Niu, T.T.; Li, Y.L.; Yang, D. Experimental investigation on gas-liquid flow distribution in downward parallel pipes of a 660 MW ultrasupercritical CFB boiler. Int. J. Energy Res. 2021, 45, 6303–6319. [Google Scholar] [CrossRef]
  22. Juslin, K. A Companion Model Approach to Modelling and Simulation of Industrial Processes; VTT Publishing: Espoo, Finland, 2008. [Google Scholar]
  23. Zhang, Z.; Yang, C.; Wu, H.; Deng, K. Modeling and simulation of the start-up process of a 660 MW ultra-supercritical circulating fluidized bed boiler. Comput. Chem. Eng. 2022; in press. [Google Scholar]
  24. Myöhänen, K. Modelling of Combustion and Sorbent Reactions in Three-Dimensional Flow Environment of a Circulating Fluidized Bed Furnace. Doctor’s Thesis, Lappeenranta University of Technology, Lappeenranta, Finland, 2011. [Google Scholar]
  25. Hiidenkari, H.; Tuuri, S.; Lappalainen, J.; Ritvanen, J. Dynamic Core-Annulus Model for Circulating Fluidized Bed Boilers. In Proceedings of the Nordic Flame Days 2019, Turku, Finland, 28–29 August 2019. [Google Scholar]
  26. Heimo, H. Dynamic Core-Annulus Model of Circulating Fluidized Bed Boilers. Master’s Thesis, Lappeenranta University of Technology, Lappeenranta, Finland, 2018. [Google Scholar]
  27. Wen, C.Y.; Chen, L.H. Fluidized bed freeboard phenomena: Entrainment and elutriation. AIChE J. 1982, 28, 117–128. [Google Scholar] [CrossRef]
  28. Apros. User Manual: Apros 6 Feature Tutorial; Version 6.09; VTT & Fortum: Espoo, Finland, 2019. [Google Scholar]
  29. Kunii, D. Flow modeling of fast fluidized beds. In Circulating Fluidized Beds; Springer: Dordrecht, The Netherlands, 1991. [Google Scholar]
  30. Johnsson, F. Fluid Dynamics and Heat Transfer in Fluidized Beds—With Applications to Boilers. Doctor’s Thesis, Chalmers University, Gothenburg, Sweden, 1991. [Google Scholar]
  31. Broadhurst, T.E.; Becker, H.A. Onset of fluidization and slugging in beds of uniform particles. AIChE J. 1975, 21, 238–247. [Google Scholar] [CrossRef]
  32. Mostoufi, N.; Chaouki, J. Prediction of effective drag coefficient in fluidized beds. Chem. Eng. Sci. 1999, 54, 851–858. [Google Scholar] [CrossRef]
  33. Dukhan, N.; Patel, P. Equivalent particle diameter and length scale for pressure drop in porous metals. Exp. Therm. Fluid Sci. 2008, 32, 1059–1067. [Google Scholar] [CrossRef]
  34. Ergun, S. Fluid flow through packed columns. Chem. Eng. Prog. 1952, 48, 89–94. [Google Scholar]
  35. Dutta, A.; Basu, P. Overall heat transfer to water walls and wing walls of commercial circulating fluidized-bed boilers. J. Inst. Energy 2002, 75, 85–90. [Google Scholar]
  36. Deng, K.; Yang, C.; Chen, H.; Zhou, N.; Huang, S. Start-Up and dynamic processes simulation of supercritical once-through boiler. Appl. Therm. Eng. 2017, 115, 937–946. [Google Scholar] [CrossRef]
  37. Hänninen, M. Phenomenological Extensions to APROS Six-Equation Model. Non-condensable Gas, Supercritical Pressure, Improved CCFL and Reduced Numerical Diffusion for Scalar Transport Calculation. Doctor’s Thesis, Lappeenranta University of Technology, Lappeenranta, Finland, 2009. [Google Scholar]
Figure 1. Diagram of the superheated steam system.
Energies 15 04049 g001
Figure 2. Diagram of the reheated steam system.
Energies 15 04049 g002
Figure 3. Diagram of the air-flue gas system.
Energies 15 04049 g003
Figure 4. Diagram of the ash circulation loop.
Energies 15 04049 g004
Figure 5. Diagram of “core-annulus” in CFB boiler.
Energies 15 04049 g005
Figure 6. Diagram of “core-annulus” model in APROS.
Energies 15 04049 g006
Figure 7. Mass balance of the node i.
Energies 15 04049 g007
Figure 8. The heat transfer of CFB boiler in APROS simulation model.
Energies 15 04049 g008
Figure 9. The temperature distribution of solid and gas in the furnace.
Energies 15 04049 g009
Figure 10. The solid density distribution and pressure drop in the furnace.
Energies 15 04049 g010
Figure 11. Temperature response when feedwater mass flow decreased by 5%: (a) the steam temperature of the water wall outlet and LTS outlet; (b) steam temperature of ITS and HTS outlet; (c) steam temperature of LTR outlet and HTR outlet; (d) bed temperature.
Energies 15 04049 g011
Figure 12. Attemperation water system response when feedwater mass flow decreased by 5%: (a) superheater attemperation water-1 and superheater attemperation water-2 mass flow; (b) superheater attemperation water-3 and reheater attemperation water mass flow.
Energies 15 04049 g012
Figure 13. Temperature response when total air mass flow decreased by 5%: (a) the steam temperature of the water wall outlet and LTS outlet; (b) steam temperature of ITS and HTS outlet; (c) steam temperature of LTR outlet and HTR outlet; (d) bed temperature.
Energies 15 04049 g013
Figure 14. Attemperation water system response when total air mass flow decreased by 5%: (a) superheater attemperation water-1 and superheater attemperation water-2 mass flow; (b) superheater attemperation water-3 mass flow.
Energies 15 04049 g014
Figure 15. Temperature response when coal mass flow decreased by 5%: (a) the steam temperature of the water wall outlet and LTS outlet; (b) steam temperature of ITS and HTS outlet; (c) steam temperature of LTR outlet and HTR outlet; (d) bed temperature.
Energies 15 04049 g015
Figure 16. Attemperation water system response when coal mass flow decreased by 5%: (a) superheater attemperation water-1 and superheater attemperation water-2 mass flow; (b) superheater attemperation water-3 mass flow.
Energies 15 04049 g016
Table 1. Analysis of coal.
Proximate AnalysisUnitValueUltimate AnalysisUnitValue
Moisture%1.00Carbon%47.66
Ash%37.77Hydrogen%2.14
Volatile matter%10.32Oxygen%1.12
Lower heating valuekJ/kg18,370Nitrogen%0.83
Sulfur%2.98
Table 2. Geometric parameters of the boiler.
ParametersUnitValue
Boiler heightm55
Cross-section of boilerm231.41 × 16.47
Table 3. Simulation results at 100% BMCR.
ParameterUnitDesigned ValueSimulated ValueRelative
Error (%)
Main steam mass flowt/h190219020.00%
Main steam pressureMPa29.329.30.00%
Main steam temperature°C605604.3−0.12%
Reheated steam mass flowt/h1611.91611.90.00%
Reheated steam inlet temperature°C366.8366.80.00%
Reheated steam outlet temperature°C623624.40.22%
Coal mass flowt/h294.1295.60.51%
Limestone mass flowt/h42.0342.030.00%
ECO inlet water temperature°C303305.50.83%
ECO outlet water temperature°C350348.1−0.54%
Water wall outlet steam temperature°C435435.40.09%
Cyclone separator outlet steam temperature°C4454460.22%
LTS inlet steam temperature°C454455.70.37%
LTS outlet steam temperature°C473476.20.68%
ITS1 inlet steam temperature°C4684680.00%
ITS1 outlet steam temperature°C507507.10.02%
ITS2 outlet steam temperature°C547546.2−0.15%
HTS1 inlet steam temperature°C5385380.00%
HTS1 outlet steam temperature°C578579.20.21%
HTS2 inlet steam temperature°C5735730.00%
HTS2 outlet steam temperature°C605604.3−0.12%
Attemperation water temperature°C350348.1−0.54%
LTR1 inlet steam temperature°C367367.30.08%
LTR2 inlet steam temperature°C446446.10.02%
HTR inlet steam temperature°C5725720.00%
HTR outlet steam temperature°C623624.40.22%
Primary air mass flowkg/s300.3300.30.00%
Secondary air mass flowkg/s312.6312.60.00%
Primary air inlet temperature°C65650.00%
Primary air outlet temperature°C284284.40.14%
Secondary air inlet temperature°C65650.00%
Secondary air outlet temperature°C284284.40.14%
Bed temperature°C895895.20.02%
Cyclone separator outlet flue gas temperature°C889890.30.15%
LTR2 inlet flue gas temperature°C852854.80.33%
LTS inlet flue gas temperature°C692694.40.35%
LTR1 inlet flue gas temperature°C618626.81.42%
ECO inlet flue gas temperature°C502511.81.95%
Air pre-heater inlet flue gas temperature°C307325.66.06%
Air pre-heater outlet flue gas temperature°C127122.8−3.31%
Furnace outlet excess air coefficient 1.21.20.00%
THS1 ash mass flowkg/s315.2315.20.00%
HTS2 ash mass flowkg/s3153150.00%
HTR ash mass flowkg/s333.2333.20.00%
Publisher’s Note: MDPI stays neutral with regard to jurisdictional claims in published maps and institutional affiliations.

