Article

An Analytical TOOLBOX for the Characterization of Chalks and Other Fine-Grained Rock Types within Enhanced Oil Recovery Research and Its Application—A Guideline

by
Udo Zimmermann
1,2,*,
Mona Wetrhus Minde
2,3,
Merete Vadla Madland
4 and
Tine Vigdal Bredal
1,2
1
Department of Energy Resources, University of Stavanger, 4036 Stavanger, Norway
2
The National IOR Centre of Norway, University of Stavanger, 4036 Stavanger, Norway
3
Department of Mechanical and Structural Engineering and Materials Science, University of Stavanger, 4036 Stavanger, Norway
4
Division of Research, University of Stavanger, 4036 Stavanger, Norway
*
Author to whom correspondence should be addressed.
Energies 2022, 15(11), 4060; https://doi.org/10.3390/en15114060
Submission received: 7 April 2022 / Revised: 20 May 2022 / Accepted: 23 May 2022 / Published: 1 June 2022
(This article belongs to the Special Issue Management of High Water Cut and Mature Petroleum Reservoirs)

Abstract

:
Analyses of fine-grained rocks like shales, cherts, and specifically chalk are challenging with regards to spatial resolution. We propose a “toolbox” to understand mineralogical alteration in chalk, especially those induced by non-equilibrium fluids or polymers and silicates during production of hydrocarbons. These data are fundamental in experiments related to improved/enhanced oil recovery (IOR/EOR) research with the aim to increase hydrocarbon production in a sustainable and environmentally friendly process. The ‘toolbox’ methods analyse rock–fluid or polymer–rock interaction and can be applied to any fine-grained rock type. In our ‘toolbox’, we include methods for routine analysis and evaluate the economic side of the usage together with the complexity of application and the velocity of data acquisition. These methods are routine methods for identification and imaging of components at the same time by chemical or crystallographic means and here applied to petroleum geology. The ‘toolbox’ principle provides a first workflow to develop a road map with clear focus on objectives for maximizing EOR. Most importantly, the methods provide a robust dataset that can identify mineralogical properties and alterations in very fine-grained rocks over several scales (nanometer-decimeter).

1. Introduction

Chalk is a very fine-grained carbonate and a common Mesozoic reservoir rock in hydrocarbon (HC) fields worldwide but a rock difficult to study because of its small grainsize, wherefore there is a need to demonstrate steps of a feasible analytical study in one paper (Figure 1). The Ekofisk chalk field on the Norwegian Continental Shelf (NCS) is one of the largest oil producers in the North Sea. The study of chalk with the effect of circulating or injected fluids on the primary mineralogy has been of particular interest, as those may affect the oil recovery and compaction of the reservoir. Injection of seawater started during the 1980s with the aim of avoiding pressure depletion and further significant seabed subsidence [1,2,3,4]. Therefore, the effects of rock–fluid interactions in chalk have been a widely studied field of research, applicable on a global stage. Processes related to fluid injection, e.g., dissolution, precipitation, sorption, and changes in surface properties at micro- to sub-nanometer scales in chalk affect rock mechanical parameters, which in turn control improved/enhanced oil recovery (IOR/EOR, e.g., [5,6]).
Chalk is rather simple in terms of its mineralogy, with the major constituent being calcite and minor occurrences (0–10 wt% [weight percent]) of other minerals (e.g., dolomite, quartz, opal, apatite, feldspar, pyrite, oxides, varying clay minerals), depending on location, age, and degree of diagenesis (for the North Sea, see compilations in [7,8]). Chalk is composed mainly of skeletal debris of calcareous micro-fossils (e.g., coccolithophores, calcispheres, foraminifera) along with fragments of macro-fossils (<20 μm), whereas individual coccolith rings can be as small as 0.3 μm (e.g., [9], Figure 2), which exclude optical microscope studies as a useful application, and the lack of suitable routine tools has been a showstopper for many decades in applied petroleum geosciences on chalk. During IOR/EOR related experiments, mineralogical alterations take place mainly at a very small scale (<2 μm). The need for understanding and evaluation of the significance of those processes has been recently shown and is a major focus in IOR/EOR research (e.g., [5,10,11,12]) and is based on the identification and understanding of the mineralogical processes.
The major challenge is that analytical methods that can image the alteration, e.g., scanning electron microscopes (SEM), have too large spot-sizes to accurately identify and quantify the chemical composition by, e.g., spectroscopy. Vice versa, routine methods able to identify the mineral species via crystallography (by Raman or X-ray diffraction) are not able to image the analysed area with sufficient resolution. To challenge this catch-22 situation and to deliver applicable methodological recipes to identify the alterations for industry, we propose a “toolbox” that holds sufficient resolution and accuracy for analyses of even brittle very fine-grained sedimentary rocks. We report on the advantages and disadvantages to provide a work-flow model for future research in this field, as sample preparation—especially in the case of chalk—is often a bottleneck, in addition to economic aspects and the velocity of data acquisition. The content of the toolbox (Figure 1) provides the possibility to combine results for a tailored dataset for the needs of the HC industry and its specific issues within IOR/EOR research and application. The selected analytical techniques are a well-combined pool of ‘classic’ traditional analytical methods as forming the base of further studies and state-of-the-art applications, often for the first time applied to chalk. Similarly, any fine-grained rock type (e.g., shales or chert) can be studied using the here presented workflow. Moreover, the toolbox will be a major guideline to research on various lithotypes of any grain-sizes and may function for research as a guideline based on a thorough combination of several analytical approaches. The background of this contribution is to present for the first time a comprehensive catalogue of methods in one workflow with focus on the technology and applicability behind each non-routine method.

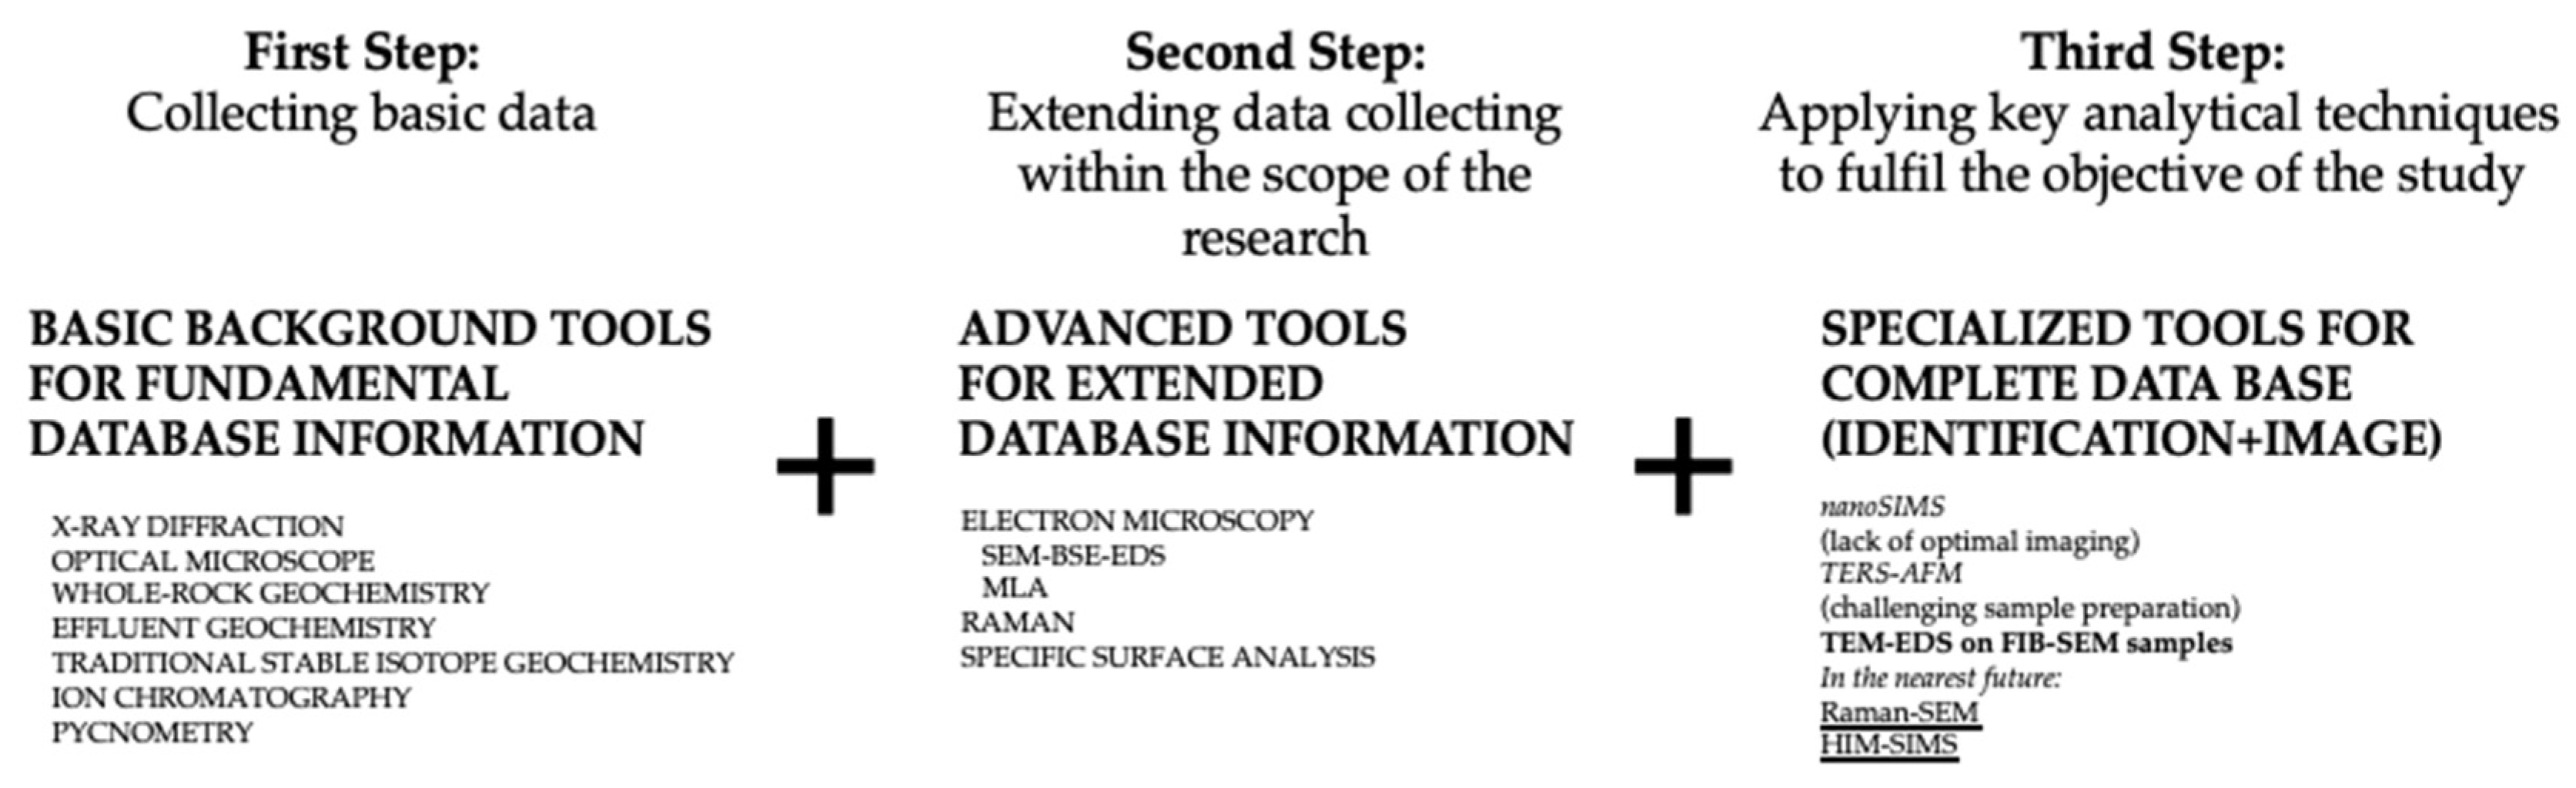
2. Results—The Toolbox Content

The toolbox (Figure 1) is composed of analytical tools that are on one hand well-known in terms of their application to rocks and partly on chalk (including optical microscopy, whole-rock geochemistry, X-ray diffraction, traditional (C and O) stable isotope systems, ion chromatography, pycnometry, and effluent water analysis), and on the other hand new methodological approaches in the study of chalk besides the use of SEM:
  • Field emission gun scanning electron microscopy (FEG-SEM) with energy dispersive X-ray spectroscopy (EDS),
  • SEM-based mineral liberation analyzer (MLA),
  • Focused ion beam (FIB)-SEM,
  • Transmission electron microscopy (TEM),
  • Electron microprobe analysis (EMPA),
  • Nano secondary ion mass spectrometry (nanoSIMS),
  • Specific surface area (SSA),
  • Raman spectroscopy,
  • Tip enhanced Raman spectroscopy (TERS) with atomic force microscopy (AFM).
The ‘toolbox’ concept with a detailed workflow scheme uses a combination of ‘classic’ traditional analytical methods as the base of data acquisition and state-of-the-art methods to focus on certain issues of interest within EOR research (Figure 1). The paramount basic background information datasets are shown on the left side as step 1 in the workflow (Figure 1). The central column in Figure 1 includes necessary analysis but already dependent on the objective of the research in the hydrocarbon industry. None of the methods fulfill the criteria of providing excellence in imaging and identification. The column to the right names methods that shall be applied for specific objectives (e.g., mineral identification or imaging textural characteristics), with all providing the necessary sub-micron resolution. Those applications are fundamental for up-scale modelling or analysis of wettability therefore they shall be used within EOR research. Some of the analytical methods are not ideal for soft materials like chalk, such as nanoSIMS (nano secondary ion mass spectrometry) or TERS-AFM (tip enhanced Raman spectroscopy coupled with atomic force microscopy), which cause strong sample preparation challenges [13,14,15]. Methods that can be applied routinely because they have been tested and sample preparation has been developed for the noted issue of resolution and high-resolution imaging at the same time are TEM-EDS (transmission electron microscopy coupled with energy dispersive X-ray spectroscopy) and MLA (mineral liberation analyser) if the phases are not smaller than 1 micron. In the near future, further developed applications like HIM-SIMS (helium ion microscopy coupled with secondary ion mass spectrometry; [16,17] and RAMAN-SEM (Raman spectroscopy coupled with scanning electron microscopy) will be able to match the same objective [18,19].
With all the noted applications, information can be extracted by progressively increasing resolution of analyses and comparing results from chemical and elemental studies with imaging, mineralogical, and crystallographic data for hydrocarbon research. Using this process, it is possible to identify, map, and quantify the mineralogical alterations from milli- to nanometer scales within a large amount of research applications and especially within those discussed in this special volume.

3. Electron and Ion Microscopy

3.1. Sample Preparation

Electron microscopy demands high quality samples. For chalk, small freshly broken rock-fragments (<1 cm) are often used for analyses in SEM. Polished thin sections and epoxy impregnated mounts have also been used successfully. Sample preparation to yield maximum information for TEM or TERS can be challenging in softer rocks like chalk and shales because mechanical and electrolyte polishing are either difficult or impossible and may alter rock properties. The method found to be most fitting in this study was sample-preparation by FIB-SEM. However, this method is part of the ‘classic’ analytical techniques, even as data acquisition on chalk is rather rare compared to studies on other rock types, as it requires experience for phase identification because chemical identification using EDS (energy dispersive X-ray spectroscopy) is nearly impossible, as the spotsize is larger than the phases that are in the focus of interest.

3.1.1. Field Emission Gun Scanning Electron Microscope (FEG-SEM)

In a FEG-SEM, electrons are accelerated to create a focused electron beam to scan the sample in an evacuated chamber. When the beam hits the surface of the sample, various energy signals are reflected or produced from the surface that are collected by different detectors like secondary electrons (SE), back-scattered electrons (BSE), and X-rays (energy dispersive X-ray spectroscopy, EDS) as well as, in cases, visible and fluorescent light. The beam ‘spot-size’ usually lies in the range of 0.5–2 µm as the smallest possible and, at the same time, is the most useful dimension restricting chemical identification to this scale when using EDS. The emission of SE will mainly vary as a function of the topography, enabling imaging of the surface (Figure 2 and Figure 3). A BSE detector collects backscattered, primary electrons dependent on the average atomic number of each phase, where a higher number will yield a brighter shade of grey in the image (Figure 3b). EDS detects characteristic X-rays that are produced during the electron bombardment where the difference in atomic structure of each element causes the release of X-rays differing in energy (or wavelength). Based on the energy spectra of the detected X-rays, quantification of each element is possible, but the accuracy varies based on several factors (e.g., [20]), wherefore the method is often described as semi-quantitative.

3.1.2. Mineral Liberation Analyzer (MLA)

Mineral Liberation Analyzer (MLA) combines imaging by SEM-BSE and X-ray mineral identification to create a spatial spectral color-coded map of the mineralogy or chemical composition of samples. The minerals in the samples are identified and characterised through comparison of their EDS spectra to a list of reference spectra by a “best match” algorithm [21]. Our peer-group developed a particular reference database to enable research on chalk. The resolution of the MLA scanning depends on the size of the area scanned and the time used, but it will always be constrained by the spot-size of the electron beam (c. 1 µm) and the corresponding excitation volume. As grains in the (flooded) chalk often have a grainsize below the beam diameter, signals from adjacent grains may in cases affect each other (Figure 4). The method is mainly used for heavy minerals within the field of economic geology but with more machines available, it spreads into other geoscientific fields and as well into the hydrocarbon industry for the sake of correlation using specific horizons or to identify trends within quantified components within a stratigraphy [22,23].

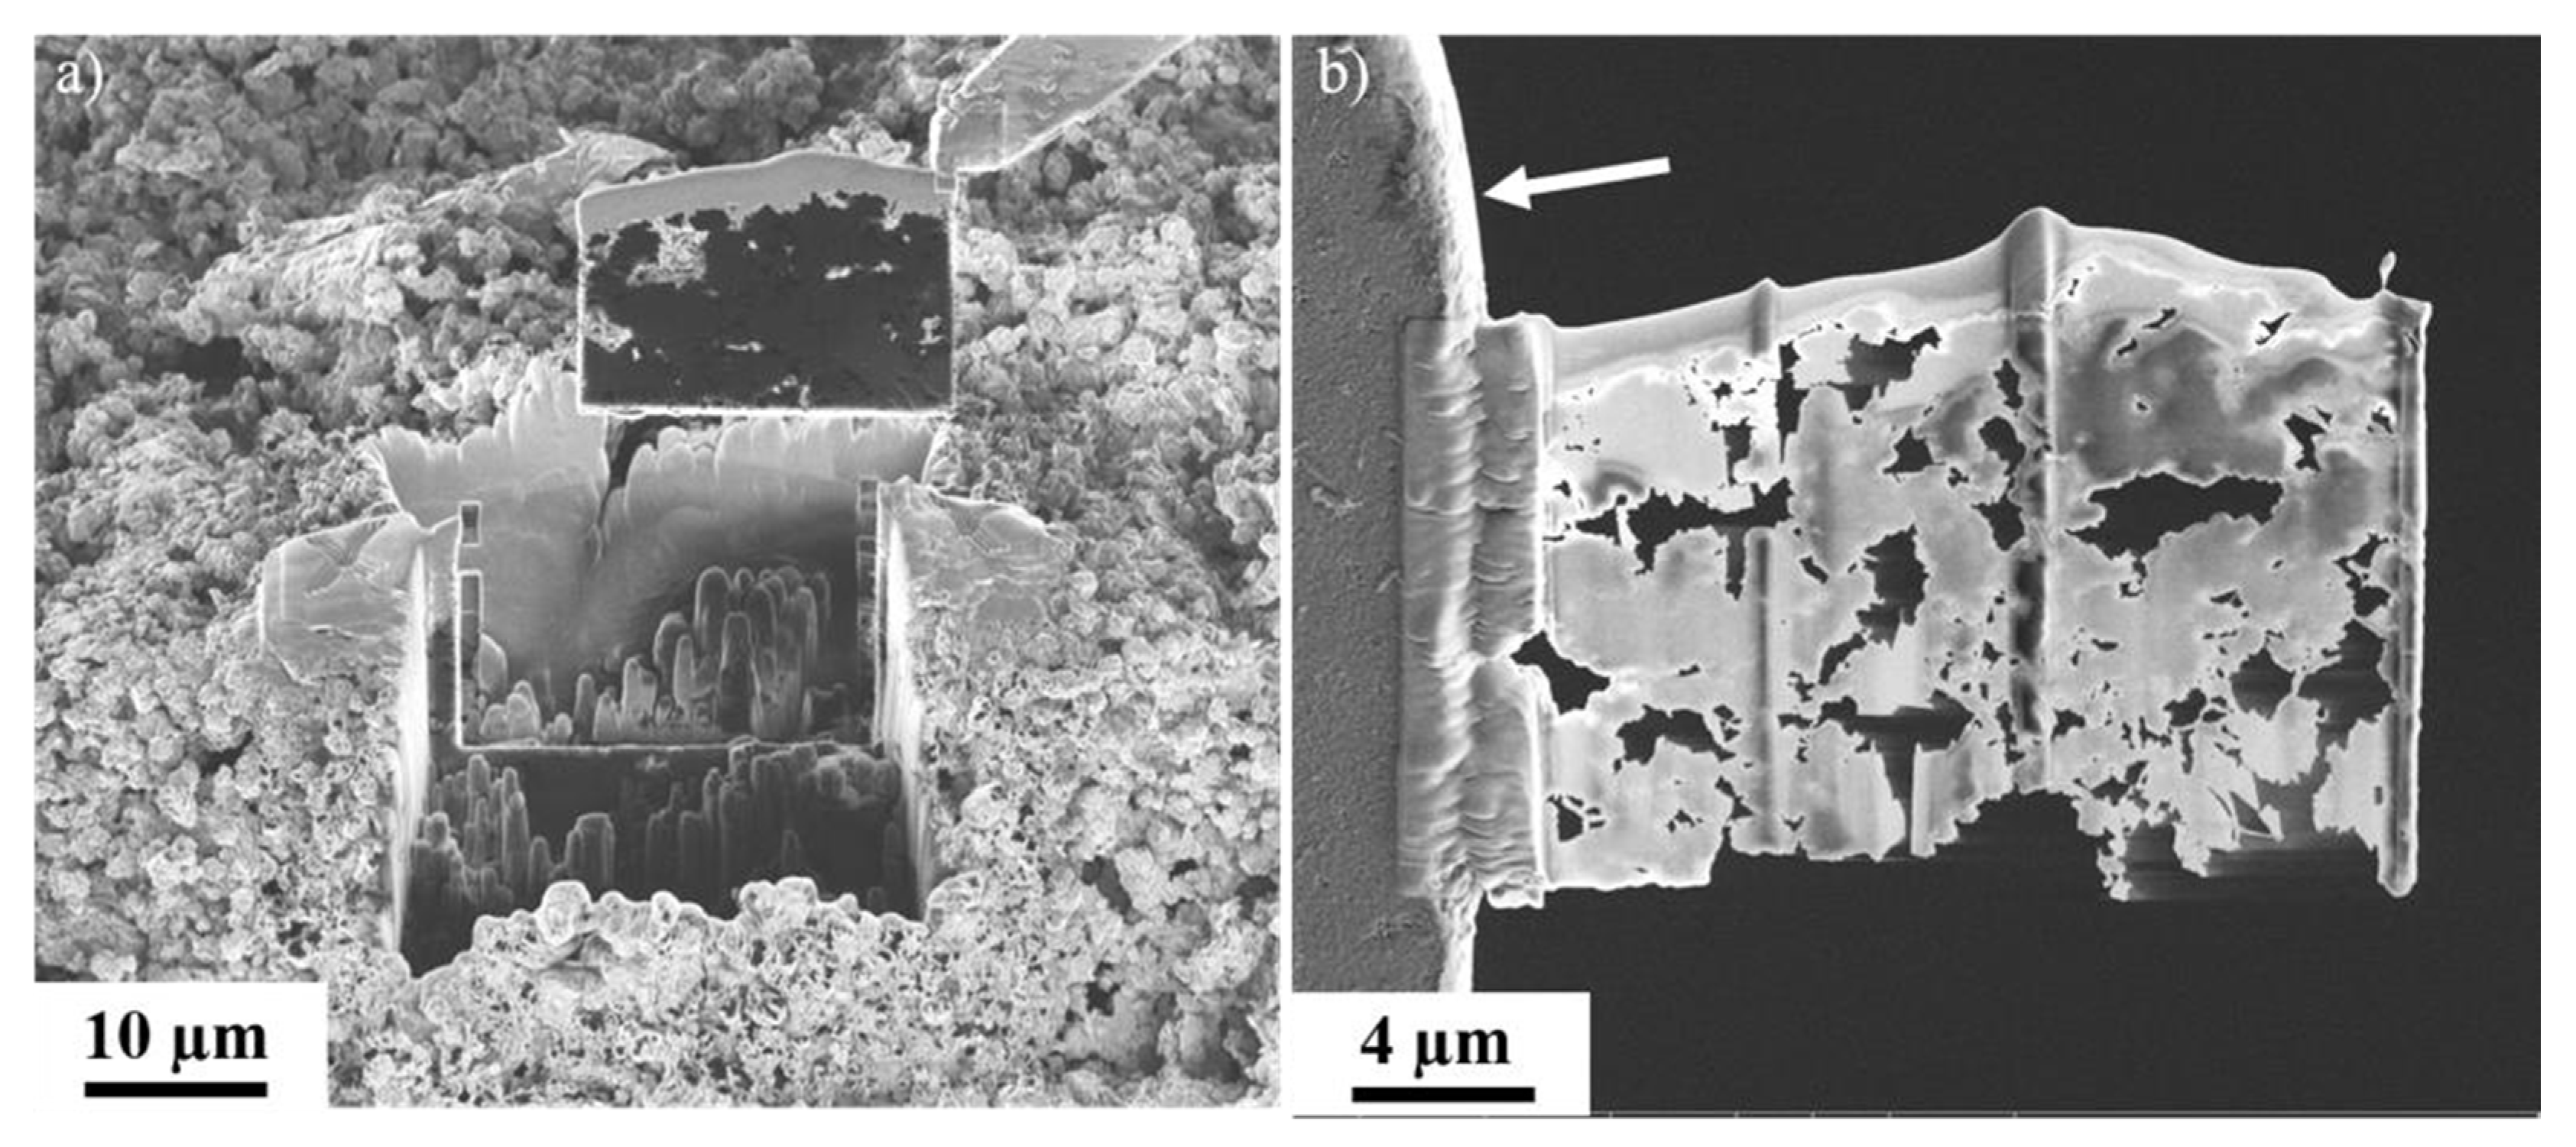
3.1.3. Focused Ion Beam Scanning Electron Microscopy (FIB-SEM)

Sample preparation of brittle materials like chalk for TEM is a challenging task because of the demands for extreme thin samples and possible undesired smearing effects by polishing procedures. FIB milling while the sample is mounted in a SEM is a solution. Samples are milled by an ion beam cutting lamellas of approximately 20 µm × 10 µm using a gallium ion-source gun. They are then welded to a 3 mm large copper grid (Figure 5). The FIB lamellas are subsequently thinned to ~100–150 nm by the same ion source. Figure 5 shows the high fragility of the chalk as a consequence of its high porosity with typical low degree of cementation. This technique ideally requires a dual-beam application (ion and electron beams) within the same machine, but this is still rare because of the cost of such an application. Nevertheless, this technique is the base for further detailed studies, especially in material sciences, to identify inhomogenities of materials but also for testing purities of minerals [24]. Nevertheless, the ability to then resolve the challenge of high resolution versus chemical identification enables the method as well for hydrocarbon and EOR research.

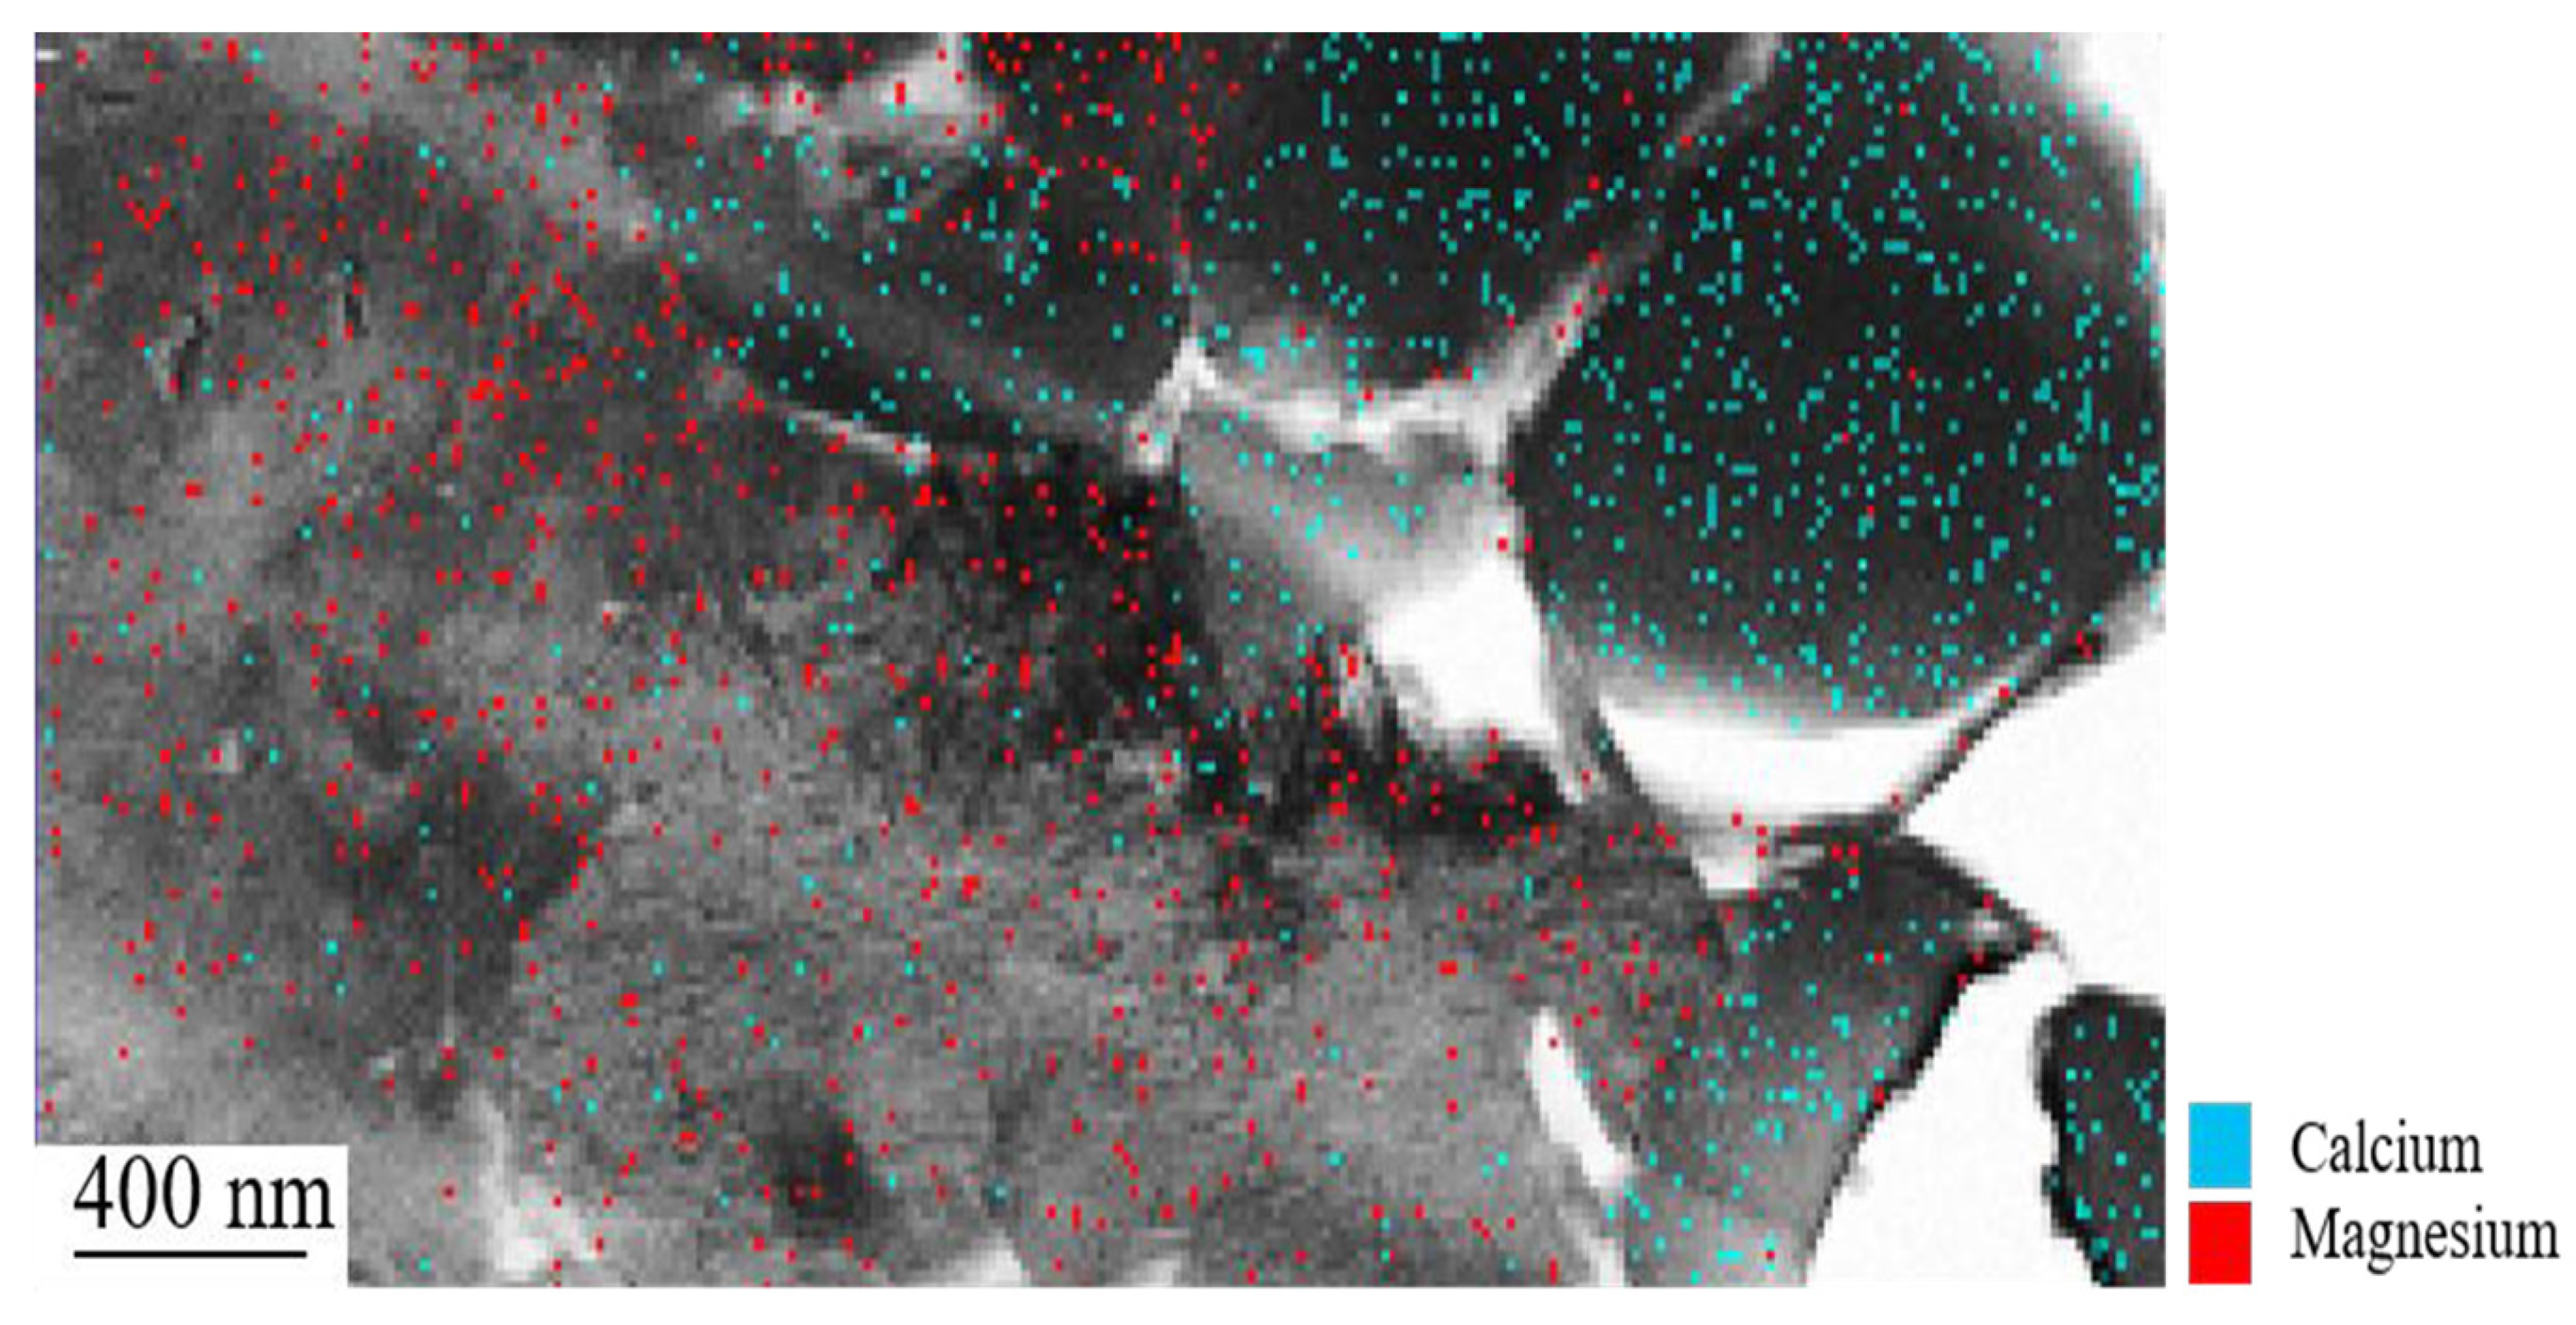
3.1.4. Transmission Electron Microscope (TEM)

In a TEM, the electron beam is transmitted through the sample, allowing for a much higher resolution than a SEM. This requires acceleration voltage up to 200 kV and extremely thin samples. For our studies, chalk samples are routinely prepared by FIB-SEM but are inclined to be affected by the electron beam, i.e., by burning holes in the samples due to beam damage (Figure 5; [25]), wherefore the microscope set-up and bombardment times need to be calculated carefully. The high acceleration voltage produces an electron beam with shorter wavelengths, allowing for resolutions < 1 nm. A TEM fitted with an EDS detector provides imaging and elemental analyses at high resolution and also offers analyses by electron diffraction, enabling identification of mineral phases based on lattice parameters. In scanning transmission electron microscopy (STEM) mode, elemental identification by EDS can produce multi-coloured maps displaying the elemental composition of grains, where each colour represents an element and not a mineral or phase (Figure 6). The method requires a cost intensive machine and is time consuming but can be used for any small-scale material, even with an EDS [26,27]. Further applications lie in the identification of the atomic composition, which is, for surface charge analysis and subsequently wettability studies, of utmost importance in the hydrocarbon industry and EOR research.

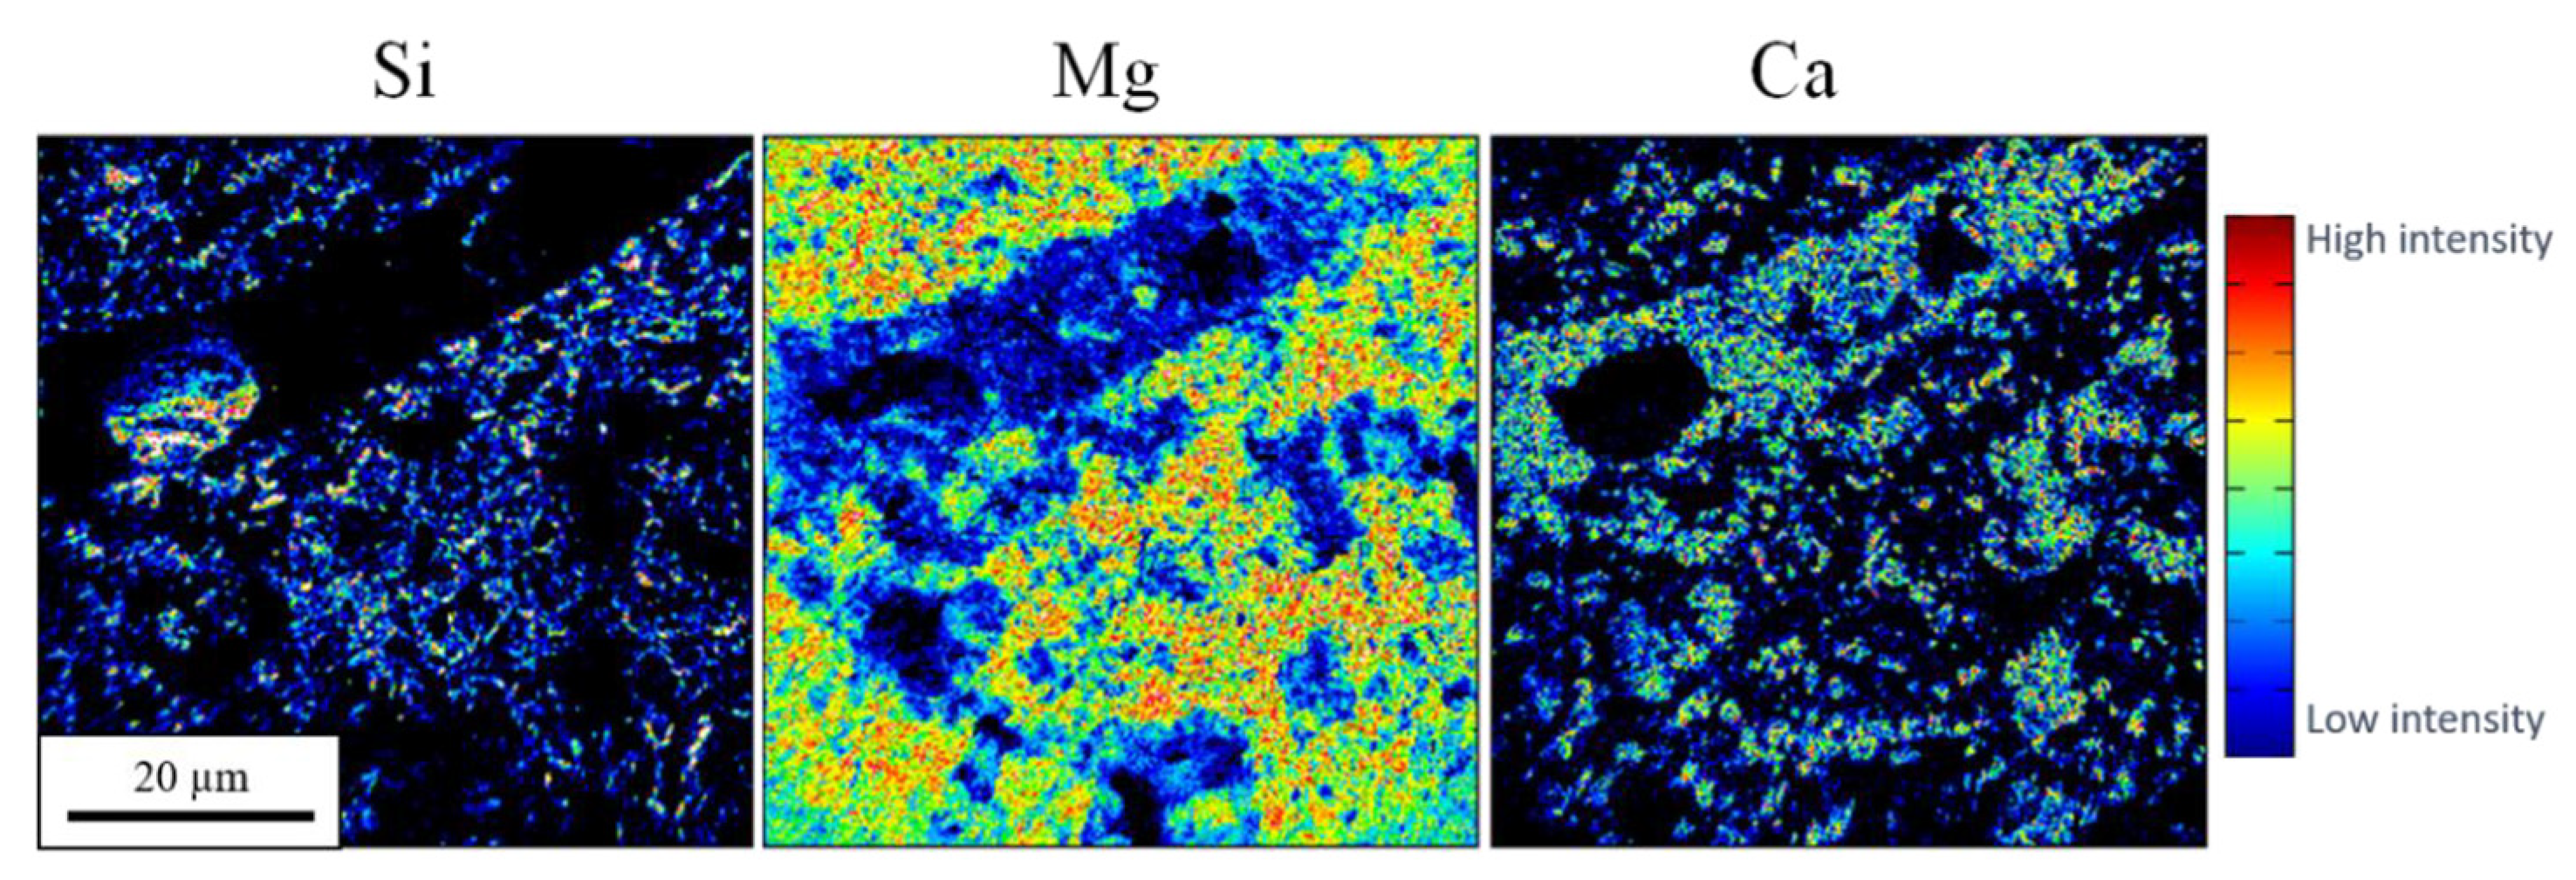
3.1.5. Electron Microprobe Analysis (EMPA)

The principle of EMPA is comparable to the SEM-EDS but here wavelength dispersive X-ray spectroscopy (WDS) instead of EDS is placed in a SEM. By detecting wavelengths instead of the energy of the X-rays, quantitative measurements can be achieved. The reason is simply that WDS analyses identify individual wavelength of X-rays from specific elements and are independent of the effect of partly overlapping energy spectra. The spot-size is limited to c. 1 µm, comparable to the SEM. Therefore, this method is used to determine the number of chemical phases and requires much more meticulous sample preparation compared to SEM-EDS samples. Moreover, the method should be combined with a high-resolution application like a SEM to image the analysed areas, but nevertheless a limit around 1 micron is given. However, the application is used since several decades and much knowledge has been produced to study chemical compositions on a small scale. If the objective is a quantification of a chemical component beyond a doubt and one is not being able to study the material with a TEM-EDS, then EMPA is a very feasible and attractive tool.

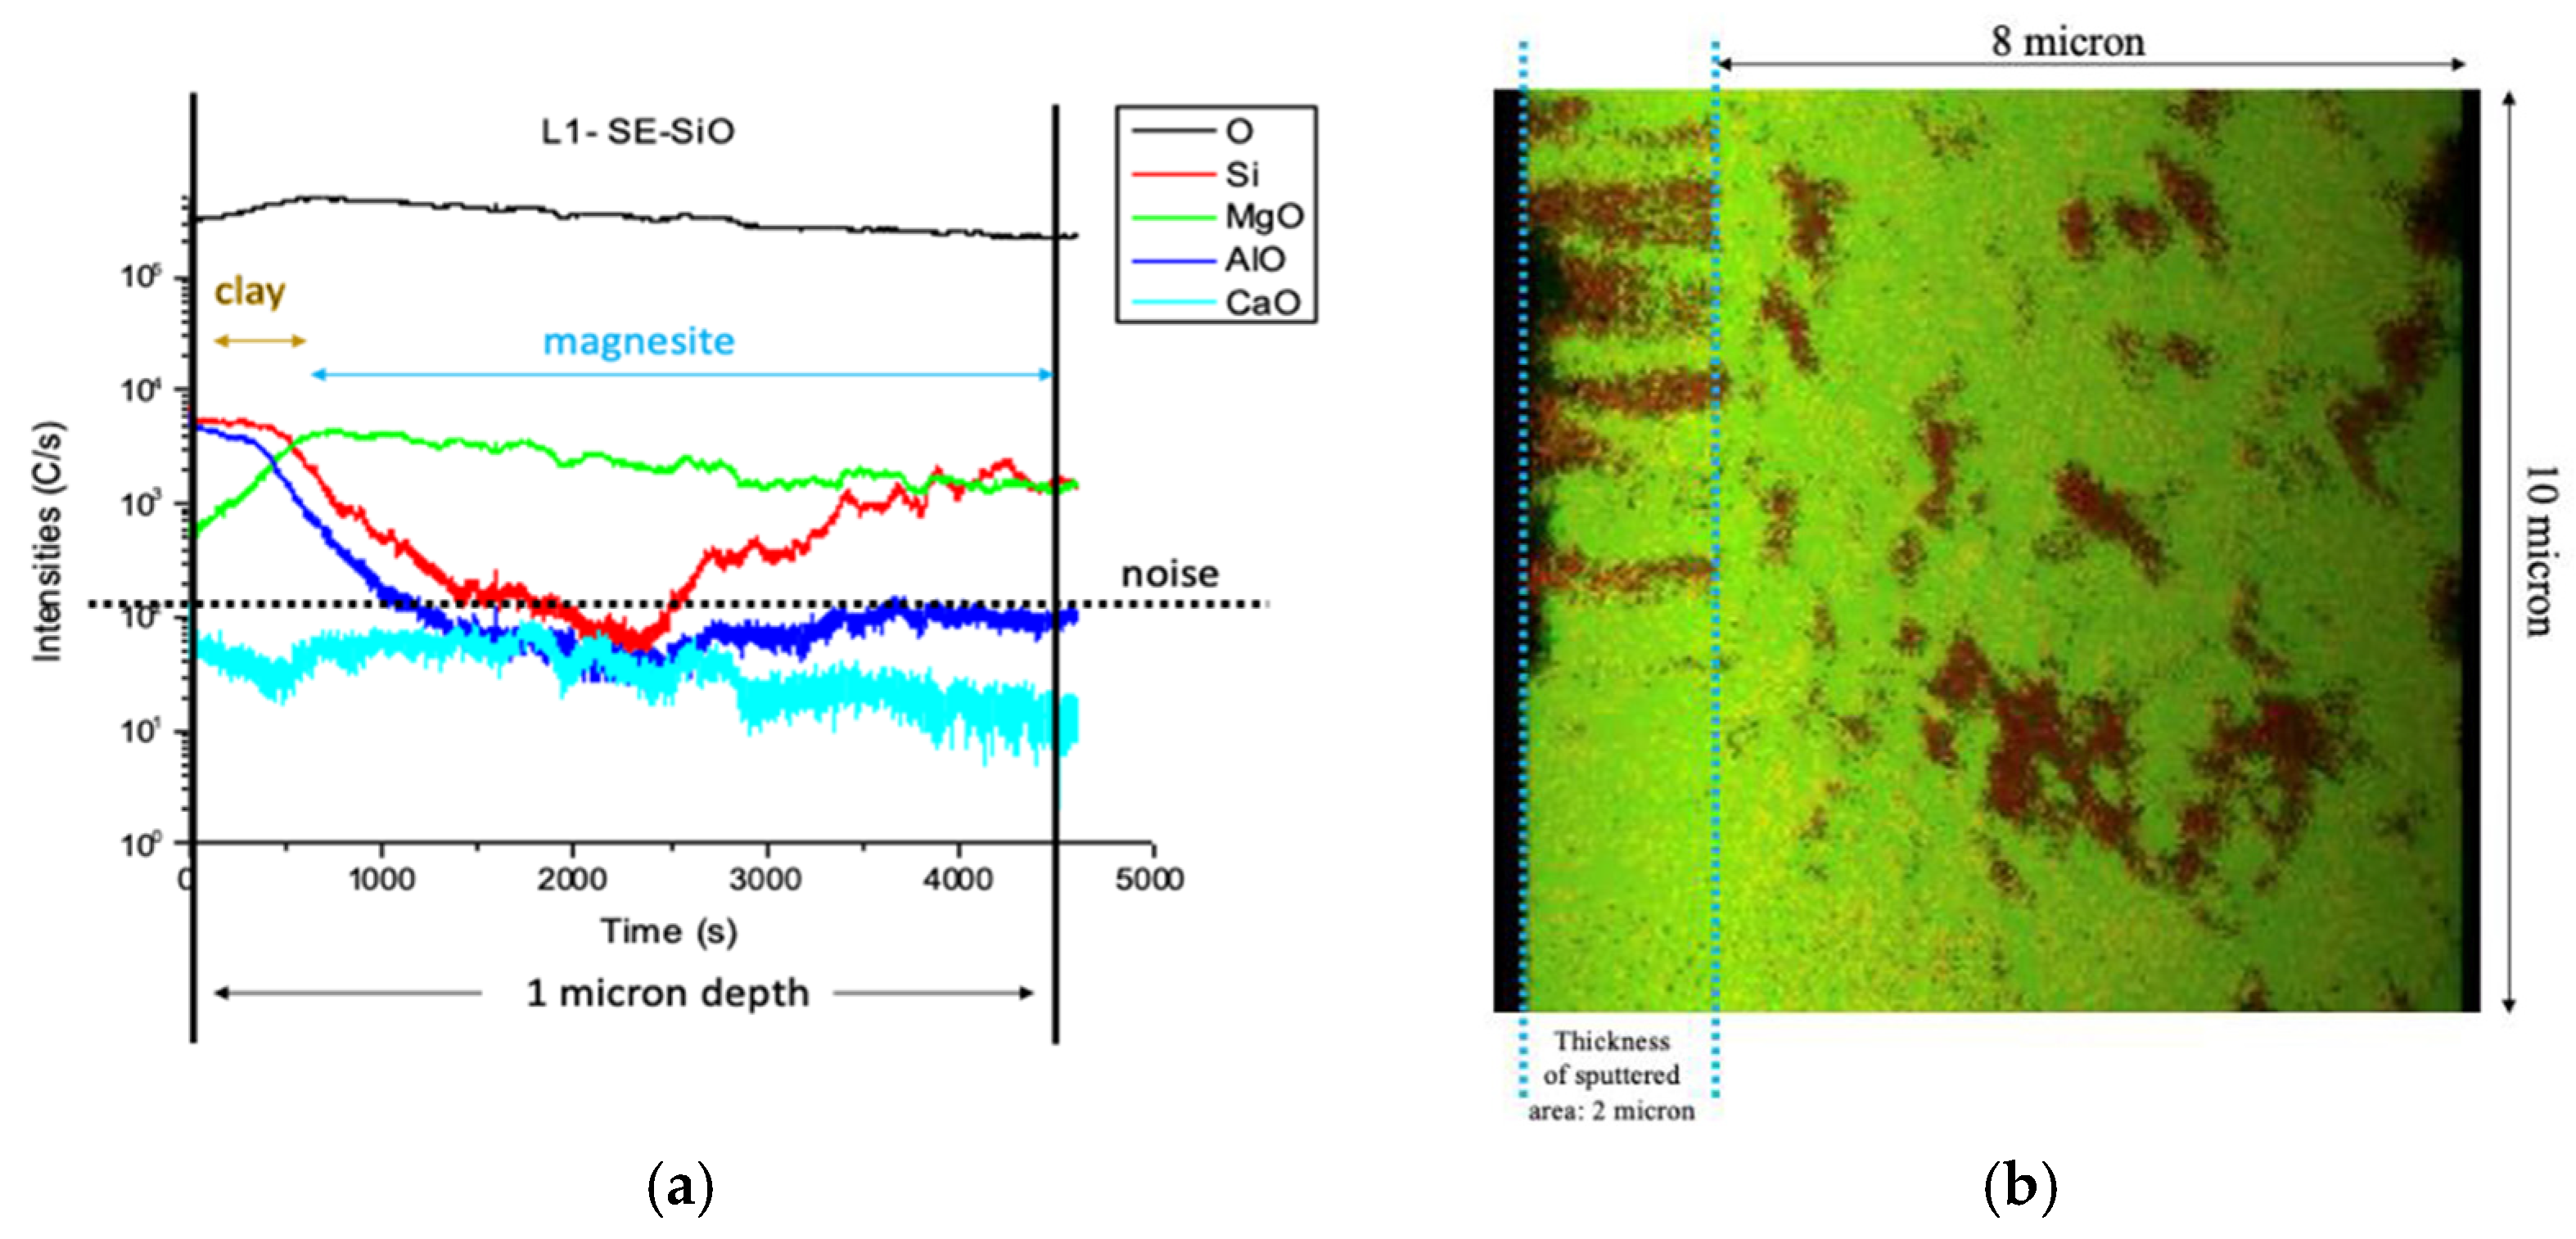
3.1.6. Nano Secondary Ion Mass Spectrometry (NanoSIMS)

Secondary ion mass spectrometry (SIMS) uses a primary ion beam that, when sputtering the sample surface, releases secondary ions from the surface to provide information about chemical compositions and structures [28]. The surface is scanned with a focused ion beam (lateral resolution < 100 nm) and has been successfully applied to chalk in IOR/EOR research [12]. The particles produced from the impact of the primary beam are neutral, positively, or negatively charged, depending on the kind of primary ions and the material [29]. The ion-yield varies with respect to the beam type (e.g., Cs, O), ionization energy of the elements, and sample matrix [30]. Using a Time-Of-Flight detector, the number of ejected ions may be measured for several ions simultaneously. Identification of elements in one area is as precise as a resolution of 40 nm. NanoSIMS scanning provides a relative intensity-map for selected ions, oxides, or masses. The intensity values of different images are not directly comparable as the method is not quantitative, but the method is a perfect tool for verification of the existence or absence of a specific element in a phase (Figure 7). NanoSIMS can also create depth profiles and 3D images by sputtering areas (e.g., 10 µm × 10 μm) repeatedly, determining the chemical composition of layers with a thickness of few nm to a depth of approximately 1 μm. This can be visualised as a video or rotatable still image, allowing calculation of porosities (Figure 8). To navigate within the nanoSIMS, an optical camera is used, which is extremely challenging because of the lack of topography and contrast in mineralogical homogeneous fine-grained rocks like chalk. The nanoSIMS requires high vacuum conditions during measurements, which can be time-consuming to reach when studying high-porosity materials. The application is still relatively rare, and only few machines are available compared to other microscopic applications. Studies are often hampered when nanoSIMS are not combined with high-resolution microscopes because then the studied area is not well imaged.

3.2. Specific Surface Area (SSA)

The SSA of a sample is a characteristic of solids that relates to the total particle surface per unit of mass, solid, or volume. The results are calculated via the amount of gas adsorbed as a monolayer on the sample surface. Based on the sample weight, the SSA of the sample can be calculated by the Brunauer–Emmett–Teller theory [33]. The SSA of a sample will vary as a function of several factors (e.g., grain size, shape, porosity, permeability), and is therefore a tool to interpret phase changes (e.g., dissolution, precipitation, surface modification) within a sample and a paramount parameter when studying porosity variation. However, there are a variety of methods and sample preparation techniques available, which hamper comparison of rock types or other materials. In-house studies are available, but larger studies that have published a variety of rock samples and their SSA are nearly absent [34,35]. In this field a wide area of improvement for applied science does exist.

3.3. Raman Spectroscopy

Raman spectroscopy is an analytical technique that uses a monochromatic laser beam with a diameter of c. 1 µm penetrating a sample observed using an optical microscope. Most photons scatter with no energy change, but some do and exchange a small amount of energy with the sample, which causes molecules to vibrate within the sample, producing the so-called Raman scattering [36]. The consequence is a shift in frequency of the scattered light, known as material specific ‘Raman shift’ (linked to lattice parameters, atomic weight, and strength of the atomic bonds of the sample), which enables identification of phases. The advantages of this method are its velocity and low cost compared to nearly all other analytical approaches [37] and the use of crystallography instead of chemical composition for identification. Materials with particles >5 µm are ideal for Raman spectroscopy. Raman application has also been combined within SEM, which then provides the necessary imaging [38], though not enhancing the spot-size.
Tip enhanced Raman spectroscopy coupled with atomic force microscopy has been tested as a method to perform Raman analyses at higher resolution with spot-sizes of 20 nm, producing topography maps of the analysed areas in chalk and allowing identification of phases [39]. However, this method sets extreme demands on sample preparation to produce a smooth surface, nearly impossible for chalk, and the method cannot therefore be recommended at this stage.
Raman spectroscopy is simple and economic, and it is extraordinary how rarely the method has been applied, especially in fields where the velocity of analysis is of importance like in the hydrocarbon industry. Sample preparation is extremely quick, and the method is non-destructive. A major obstacle is the absence of a complete and thorough database for the analytical results. Recent improvements with the development of automated Raman studies [40] and applications combined with electron microscopes to resolve the issue of the imaging of micron or sub-micron sized study areas will hopefully enhance the situation for all interests.

4. Discussion

Analyses of chalk can be challenging to perform when the objective is to identify its mineralogy and at the same time reveal high-resolution first-class images of the samples. Diagenetic processes or, as described in this study, mineralogical changes within experiments in the field of IOR/EOR produce phases on the scale of few microns or even smaller in chalk. Few techniques offer the opportunity for high-resolution images while identifying the mineralogical phases. However, often, analytical methods provide only an excellent image or crystallographic analyses without knowing the exact sampled area. Therefore, we argue that a sound combination of proposed methods provides the best approach. The introduced toolbox yields results at a wide range of scales and combines analyses of textures, chemistry, structures, and crystallography easily applicable like a recipe for very fine-grained reservoir rocks. Coarser rocks (grainsizes > 5 µm) are mostly well-understood by using conventional FEG-SEM-BSE-EDS, stable isotopes, and whole-rock geochemistry along with XRD analyses. Complementary methods, such as density and SSA measurements, are very useful tools to support data from the former noted analyses and are strong gameplayers for the interpretation of processes causing mineralogical modification on the grain-size level. Often, secondary mineral growth can be visualised by SEM analyses, but it is difficult to gain quantification and even identification if grainsizes are straddling 1µm. The δO18 isotope values may assist in determining temperatures under which secondary minerals grew, in natural contexts or during laboratory experiments [5]. Raman spectroscopy may support XRD data if the grain-sizes are favourable (>1 µm). For mapping of the mineralogy on micro to core-scale, MLA or equivalent methods may yield good results [10] with the same catch in regard to grainsizes as Raman.
Sub-micron sized minerals in chalk can ideally be identified beyond a doubt with nanoSIMS analytics [12], but imaging remains an issue. In our study, only TEM-EDS and TERS-AFM approaches would allow for both high-resolution imaging and chemical/crystallographic identification on sub-micron scales. Sample-preparation is an issue for TERS-AFM, where good results are dependent on flat surfaces avoiding large differences in topography, which hamper the quality of the study. TEM-EDS analyses are by themselves not extraordinarily time-consuming or expensive, but sample-preparation of brittle high-porous chalk is. Nevertheless, the noted complications are relevant to very fine-grained rocks like shales and chalk, but not an issue for most other rock types, which are harder and coarser grained. Further development on very fine-grained materials needs to include high resolution imaging coupled with chemical/crystallographic tools and less challenging sample preparation for soft very fine-grained rocks. One candidate may be helium microscopy coupled with SIMS technology, but the analysis on chalk has not left the experimental phase [41].

5. Conclusions

We have composed and successfully tested an analytical toolbox useful for a wide field of research on very fine-grained reservoir rocks like chalk for IOR/EOR purposes. The focus has been to find suitable tools to identify in very fine-grained reservoir chalk mineralogical alterations due to rock–fluid interactions at the grain-scale that affect rock mechanics and to implement those technologies for IOR/EOR (e.g., [5,10]). However, the same techniques and the workflow can be used for any fine-grained material, and even polymer research or other applications that require material studies on a small scale with imaging at the same time at highest resolution. The roadmap using the toolbox (Figure 1) shall also be effective, economic, and fast in order to be attractive for all users. The routine part of the toolbox comprises:
  • FEG-SEM-EDS,
  • XRD,
  • Whole-rock and stable isotope geochemistry,
  • Traditional stable isotope geochemistry.
  • MLA,
  • SSA,
  • Pycnometry: depending on the specific focus of the IOR/EOR research and refined by focussed work on representative areas to understand key processes causing mineralogical changes,
  • TEM analyses on FIB-SEM samples,
  • TERS analyses coupled with AFM imaging,
  • NanoSIMS analyses.
All noted methods are positively tested, and detailed methodology recipes exist for chalk [5,6,10,32], ready for application within analytical routines for applied research within the hydrocarbon industry and here focussed on EOR research. The toolbox is designed to enable selecting the quickest and most economic tools to yield necessary datasets for decision making and modelling in this field of HC research and industrial applications (e.g., [5,42]). This concept stresses the need of valuable mineralogical input for simulators to be able to upscale from pore- to core- and field-scale. Beyond a doubt, the noted methods are even more effective and less challenging when applied to harder and coarser grained samples (>5 µm) than shales and chalk. The highest impact for IOR/EOR research, as well as other research objectives, lies—in our opinion—within the combination of carefully selected methodologies from the toolbox in one workflow.

Author Contributions

Conceptualization, U.Z.; methodology, U.Z., M.V.M., M.W.M. and T.V.B.; software, validation, U.Z., M.V.M., M.W.M. and T.V.B.; formal analysis, investigation, U.Z., M.V.M., M.W.M. and T.V.B.; resources, U.Z., M.V.M., M.W.M. and T.V.B.; data curation, U.Z., M.V.M., M.W.M. and T.V.B.; writing—original draft preparation, U.Z.; writing—review and editing, U.Z., M.V.M., M.W.M. and T.V.B.; visualization, M.W.M. and T.V.B.; supervision, U.Z. and M.V.M.; project administration, U.Z.; funding acquisition, M.V.M. All authors have read and agreed to the published version of the manuscript.

Funding

This research received no external funding.

Data Availability Statement

Not applicable.

Acknowledgments

The authors acknowledge the Research Council of Norway and the industry partners, ConocoPhillips Skandinavia AS, Aker BP ASA, Vår Energi AS, Equinor, Energy AS, Neptune Energy Norge AS, Lundin Energy Norway AS, Halliburton AS, Schlumberger Norge AS, and Wintershall Dea Norge AS, of The National IOR Centre of Norway for support. We also thank two anonymous reviewers for their constructive comments and the kind editorial handling.

Conflicts of Interest

The authors declare no conflict of interest.

References

  1. Doornhof, D.; Kristiansen, T.G.; Nagel, N.B.; Pattillo, P.D.; Sayers, C.J.O.R. Compaction and subsidence. Oilfield Rev. 2006, 18, 50–68. [Google Scholar]
  2. Hermansen, H.; Landa, G.H.; Sylte, J.E.; Thomas, L.K. Experiences after 10 years of waterflooding the Ekofisk Field, Norway. J. Pet. Sci. Eng. 2000, 26, 11–18. [Google Scholar] [CrossRef]
  3. Nagel, N.B. Ekofisk field overburden modelling. In SPE/ISRM Rock Mechanics in Petroleum Engineering; OnePetro: Trondheim, Norway, 1998. [Google Scholar] [CrossRef]
  4. Teufel, L.W.; Rhett, D.W.; Farrell, H.E. Effect of Reservoir Depletion and Pore Pressure Drawdown on In Situ Stress and Deformation in the Ekofisk Field, North Sea; American Rock Mechanics Association: Norman, OK, USA, 1991. [Google Scholar]
  5. Andersen, P.Ø.; Wang, W.; Madland, M.V.; Zimmermann, U.; Korsnes, R.I.; Bertolino, S.R.A.; Minde, M.; Schulz, B.; Gilbricht, S. Comparative Study of Five Outcrop Chalks Flooded at Reservoir Conditions: Chemo-mechanical Behaviour and Profiles of Compositional Alteration. Transp. Porous Media 2017, 121, 135–181. [Google Scholar] [CrossRef]
  6. Minde, M.W.; Wang, W.; Madland, M.V.; Zimmermann, U.; Korsnes, R.I.; Bertolino, S.R.A.; Andersen, P.Ø. Temperature effects on rock engineering properties and rock-fluid chemistry in opal-CT-bearing chalk. J. Pet. Sci. Eng. 2018, 169, 454–470. [Google Scholar] [CrossRef]
  7. Hjuler, M.L.; Fabricius, I.L. Engineering properties of chalk related to diagenetic variations of Upper Cretaceous onshore and offshore chalk in the North Sea area. J. Pet. Sci. Eng. 2009, 68, 151–170. [Google Scholar] [CrossRef]
  8. Kallesten, E.; Zimmermann, U.; Madland, M.V.; Bertolino, S.R.A.; Omdal, E.; Andersen, P.Ø. Mineralogy and geochemistry of reservoir and non-reservoir chalk from the Norwegian continental shelf. J. Pet. Sci. Eng. 2021, 205, 108914. [Google Scholar] [CrossRef]
  9. Scholle, P.A.; Kinsman, D.J.J. Diagenesis of Upper Cretaceous chalks from North Sea, England and Northern Ireland. Am. Assoc. Pet. Geol. Bull. 1973, 57, 803–804. [Google Scholar]
  10. Minde, M.W.; Zimmermann, U.; Madland, M.V.; Korsnes, R.I.; Schultz, B.; Gilbrich, S. Mineral Replacement in Long-Term Flooded Porous Carbonate Rocks. Geochim. Cosmochim. Acta 2020, 268, 485–508. [Google Scholar] [CrossRef]
  11. Skovbjerg, L.L.; Hassenkam, T.; Makovicky, E.; Hem, C.P.; Yang, M.; Bovet, N.; Stipp, S.L.S. Nano sized clay detected on chalk particle surfaces. Geochim. Cosmochim. Acta 2012, 99, 57–70. [Google Scholar] [CrossRef]
  12. Zimmermann, U.; Madland, M.V.; Nermoen, A.; Hildebrand-Habel, T.; Bertolino, S.A.R.; Hiorth, A.; Korsnes, R.I.; Audinot, J.-N.; Grysan, P. Evaluation of the compositional changes during flooding of reactive fluids using scanning electron microscopy, nano-secondary ion mass spectrometry, X-ray diffraction, and whole-rock geochemistry. Am. Assoc. Pet. Geol. Bulletin 2015, 99, 791–805. [Google Scholar] [CrossRef] [Green Version]
  13. Hrstka, T.; Gottlieb, P.; Skala, R.; Breiter, K.; Motl, D. Automated mineralogy and petrology—Applications of TESCAN Integrated Mineral Analyzer (TIMA). J. Geosci. 2018, 63, 47–63. [Google Scholar] [CrossRef] [Green Version]
  14. Pirrie, D.; Rollinson, G.K. Unlocking the applications of automated mineral analysis. Geol. Today 2011, 27, 226–235. [Google Scholar] [CrossRef]
  15. Tsikouras, B.; Pe-Piper, G.; Piper, D.J.W.; Schaffer, M. Varietal heavy mineral analysis of sediment provenance, Lower Cretaceous Scotian Basin, eastern Canada. Sediment. Geol. 2011, 237, 150–165. [Google Scholar] [CrossRef]
  16. Ball, M.R.; Taylor, R.J.M.; Einsle, J.F.; Khanom, F.; Guillermier, C.; Harrison, R. Helium ion microscope—Secondary ion mass spectrometry for geological materials. J. Nanotechnol. 2020, 11, 1504–1515. [Google Scholar] [CrossRef] [PubMed]
  17. Ost, A.D.; Wu, T.; Höschen, C.; Mueller, C.W.; Wirtz, T.; Audinot, J.-N. 4D Surface Reconstructions to Study Microscale Structures and Functions in Soil Biogeochemistry. Environ. Sci. Technol. 2021, 55, 9384–9393. [Google Scholar] [CrossRef] [PubMed]
  18. Jiruse, J.; Haničinec, M.; Havelka, M. Integrating focused ion beam–scanning electron microscope with confocal Raman microscope into a single instrument. J. Vac. Sci. Technol. 2014, 32, 06FC03. [Google Scholar] [CrossRef]
  19. Wille, G.; Bourrat, X.; Maubec, N.; Lahfid, A. Raman-in-SEM, a multimodal and multiscale analytical tool: Performance for materials and expertise. Micron 2014, 67, 50–64. [Google Scholar] [CrossRef]
  20. Borromeo, L.; Zimmermann, U.; Andò, S.; Coletti, G.; Bersani, D.; Basso, D.; Gentile, P.; Schulz, B.; Garzanti, E. Raman Spectroscopy as a tool for magnesium estimation in Mg-calcite. J. Raman Spectrosc. 2017, 48, 983–992. [Google Scholar] [CrossRef]
  21. Fandrich, R.; Gu, Y.; Burrows, D.; Moeller, K. Modern SEM-based mineral liberation analysis. Int. J. Miner. Processing 2007, 84, 310–320. [Google Scholar] [CrossRef]
  22. Guhl, A.C.; Greb, V.G.; Schulz, B.; Bertau, M. An Improved Evaluation Strategy for Ash Analysis Using Scanning Electron Microscope Automated Mineralogy. Minerals 2020, 10, 484. [Google Scholar] [CrossRef]
  23. Keulen, N.; Næsby Malkki, S.; Graham, S. Automated Quantitative Mineralogy Applied to Metamorphic Rocks. Minerals 2020, 10, 47. [Google Scholar] [CrossRef] [Green Version]
  24. Andrew, M. A quantified study of segmentation techniques on synthetic geological XRM and FIB-SEM images. Comput. Geosci. 2018, 22, 1503–1512. [Google Scholar] [CrossRef] [Green Version]
  25. Hjuler, M.L.; Hansen, V.F.; Fabricius, I.L. Interpretational challenges related to studies of chalk particle surfaces in scanning and transmission electron microscopy. Bull. Geol. Soc. Den. 2018, 66, 151–165. [Google Scholar] [CrossRef]
  26. Ohnuki, T.; Yoshida, T.; Ozaki, T.; Samadfam, M.; Kozai, N.; Yubuta, K.; Mitsugashira, T.; Kasama, T.; Francis, A.J. Interactions of uranium with bacteria and kaolinite clay. Chem. Geol. 2005, 220, 237–243. [Google Scholar] [CrossRef]
  27. Yuan, P.; Liu, D.; Tian, Q.; Song, Y.; Wei, H.; Wang, S.; Zhou, J.; Deng, L.; Du, P. Identification of the occurrence of minor elements in the structure of diatomaceous opal using FIB and TEM-EDS. Am. Mineral. 2019, 104, 1323–1335. [Google Scholar] [CrossRef]
  28. Hirata, K.; Saitoh, Y.; Chiba, A.; Yamada, K.; Takahashi, Y.; Narumi, K. Secondary ion counting for surface-sensitive chemical analysis of organic compounds using time-of-flight secondary ion mass spectroscopy with cluster ion impact ionization. Rev. Sci. Instrum. 2011, 82, 033101. [Google Scholar] [CrossRef]
  29. Griffiths, J. Secondary Ion Mass Spectrometry. Anal. Chem. 2008, 80, 7194–7197. [Google Scholar] [CrossRef]
  30. Handley, J. Product Review: Secondary Ion Mass Spectrometry. Anal. Chem. 2002, 74, 335A–341A. [Google Scholar] [CrossRef] [Green Version]
  31. Minde, M.W.; Zimmermann, U.; Madland, M.V.; Korsnes, R.I.; Schulz, B.; Audinot, J.N. Fluid-flow During EOR Experiments in Chalk: Insights using SEM-MLA, EMPA and NanoISMS Applications. In Proceedings of the International Symposium of the Society of Core Analysts, Snowmass, CO, USA, 21–26 August 2016; p. 7. [Google Scholar]
  32. Minde, M.W.; Madland, M.V.; Zimmermann, U.; Egeland, N.; Korsnes, R.I.; Nakamura, E.; Kobayashi, K.; Ota, T. Mineralogical alterations in calcite powder flooded with MgCl2 to study Enhanced Oil Recovery (EOR) mechanisms at pore scale. Microporous Mesoporous Mater. 2019, 304, 109402. [Google Scholar] [CrossRef]
  33. Brunauer, S.; Emmett, P.H.; Teller, E. Adsorption of Gases in Multimolecular Layers. J. Am. Chem. Soc. 1938, 60, 309–319. [Google Scholar] [CrossRef]
  34. Kuila, U.; Prasad, M. Specific surface area and pore-size distribution in clays and shales. Geophys. Prospect. 2013, 61, 341–362. [Google Scholar] [CrossRef]
  35. Macht, M.; Eusterhues, K.; Pronk, G.J.; Totsche, K.-U. Specific surface area of clay minerals: Comparison between atomic force microscopy measurements and bulk-gas (N2) and -liquid (EGME) adsorption methods. Appl. Clay Sci. 2011, 53, 20–26. [Google Scholar]
  36. Raman, C.V. A new radiation. Indian J. Phys. 1928, 2, 387–398. [Google Scholar] [CrossRef]
  37. Borromeo, L.; Egeland, N.; Minde, M.W.; Zimmermann, U.; Andò, S.; Madland, M.V.; Korsnes, R.I. Quick, Easy, and Economic Mineralogical Studies of Flooded Chalk for EOR Experiments Using Raman Spectroscopy. Minerals 2018, 8, 221. [Google Scholar] [CrossRef] [Green Version]
  38. Aksenov, Y. Raman Microscopy in an Electron Microscope: Combining Chemical and Morphological Analyses. Ph.D. Thesis, University of Twente, Enschede, Switzerland, 2003. [Google Scholar]
  39. Borromeo, L.; Toccafondi, C.; Minde, M.W.; Zimmermann, U.; Andò, S.; Madland, M.V.; Korsnes, R.I.; Ossikovski, R. Application of Tip-Enhanced Raman Spectroscopy for the nanoscale characterization of flooded chalk. J. Appl. Phys. 2018, 124, 173101. [Google Scholar] [CrossRef]
  40. Lünsdorf, N.K.; Kalies, J.; Ahlers, P.; Dunkl, I.; von Eynatten, H. Semi-Automated Heavy-Mineral Analysis by Raman Spectroscopy. Minerals 2019, 9, 385. [Google Scholar] [CrossRef] [Green Version]
  41. Bredal, T.V.; Zimmermann, U.; Madland, M.V.; Minde, M.W.; Ost, A.D.; Wirtz, T.; Audinot, J.-N.; Korsnes, R.I. High-Resolution Topographic and Chemical Surface Imaging of Chalk for Oil Recovery Improvement Applications. Minerals 2022, 12, 356. [Google Scholar] [CrossRef]
  42. Kallesten, E.; Andersen, P.Ø.; Berawala, D.S.; Korsnes, R.I.; Madland, M.V.; Omdal, E.; Zimmermann, U. SPE Modelling of Permeability and Strain Evolution in Chemical Creep Compaction Experiments with Fractured and Unfractured Chalk Cores Conducted at Reservoir Conditions. SPE Reserv. Eval. Eng. Reserv. Eng. 2020, 25, 2710–2728. [Google Scholar] [CrossRef]
Figure 1. The ‘toolbox’ concept with a detailed workflow scheme. TEM-EDS = transmission electron microscopy coupled with energy dispersive X-ray spectroscopy; HIM-SIMS = helium ion microscopy coupled with secondary ion mass spectrometry; nanoSIMS = nano secondary ion mass spectrometry; TERS-AFM = tip enhanced Raman spectroscopy coupled with atomic force microscopy; SEM-BSE-EDS = scanning electron microscopy-back-scattered electron microscopy coupled with energy dispersive X-ray spectroscopy; MLA = mineral liberation analyser; FIB-SEM = focused ion beam scanning electron microscopy.
Energies 15 04060 g001
Figure 2. SEM micrograph of Liège chalk showing skeletal debris of coccolithophores and other micro-fossils along with minor occurrences of clay minerals.
Energies 15 04060 g002
Figure 3. (a) SEM micrograph taken with the use of a SE-detector. The imaged object is an opal-CT lepisphere found in Aalborg chalk. (b) SEM micrograph of a foraminifera fossil found in chalk from Liège using BSE. The different grey-scales reflects the average atomic number (AAN) of each phase, thereby separating different mineralogical composition.
Energies 15 04060 g003
Figure 4. Comparison of scales. Grain-sizes of chalk are smaller than 1 µm, which is more or less the spot-size limit of methods such as MLA where mapping of larger areas in centimeter sizes are possible. Data and modified figure from [10].
Energies 15 04060 g004
Figure 5. Production of FIB-lamella of MgCl2-flooded chalk: (a) cut-out of lamella from the sample surface, (b) thinned lamella welded to a copper grid (white arrow).
Energies 15 04060 g005
Figure 6. Example of elemental analysis performed on grain-scale by STEM. Blue represents occurrences of calcium, red magnesium. Image modified from [10].
Energies 15 04060 g006
Figure 7. Example of the distribution of silicon (Si), magnesium (Mg), and calcium (Ca) in a chalk sample. The intensity is only relative for each element. Modified from [31].
Energies 15 04060 g007
Figure 8. (a) A chemical depth profile of 1 micron while sputtering for 4500 s (c. 1.5 h), creating 5000 layers of 0.2 nm showing changes in the chemical composition and the combination of clay minerals and magnesite in a chalk test sample. (b) 3D still image from a video created during the sputtering of an area of 8 × 10 micron with a thickness of c. 2 microns. In red, primary calcite and in green, the produced secondary magnesite during flooding experiments for EOR—sample material from a long-term flooding test over 20 months with magnesium chloride in on-shore chalk under reservoir conditions (see [10,12,32]).
Energies 15 04060 g008
Publisher’s Note: MDPI stays neutral with regard to jurisdictional claims in published maps and institutional affiliations.

