Article

Visualization and Measurement of Swirling Flow of Dry Ice Particles in Cyclone Separator-Sublimator

1
Department of Mechanical Engineering, Osaka Prefecture University, 1-1 Gakuen-Cho, Naka-ku, Sakai 599-8531, Japan
2
Department of Mechanical Engineering, Osaka Metropolitan University, 1-1 Gakuen-Cho, Naka-ku, Sakai 599-8531, Japan
3
Mayekawa MFG. Co., Ltd., 3-14-15 Botan, Koto-ku, Tokyo 135-8482, Japan
4
SINTEF Energy Research, Sem Sælands vei 11, 7034 Trondheim, Norway
5
Department of Mechanical Engineering, Doshisha University, Kyotanabe city, Kyoto 610-0321, Japan
*
Author to whom correspondence should be addressed.
Energies 2022, 15(11), 4128; https://doi.org/10.3390/en15114128
Submission received: 27 April 2022 / Revised: 21 May 2022 / Accepted: 2 June 2022 / Published: 3 June 2022

Abstract

:
The dry ice sublimation process of carbon dioxide (CO2) is a unique, environmentally friendly technology that can achieve a temperature of −56 °C or lower, which is a triple point of CO2 in CO2 refrigeration systems. In this study, a cyclone separator-evaporator was proposed to separate dry ice particles in an evaporator. As an initial step before introducing the cyclone separator-evaporator into an actual refrigeration system, a prototype cyclone separator-evaporator was constructed to visualize dry ice particles in a separation chamber. A high-speed camera was used to visualize the non-uniform flow of dry ice particles that repeatedly coalescence and collision in a swirl section. Consequently, the dry ice particle size and the circumferential and axial velocities of dry ice were measured. The results show that the equivalent diameter of the most abundant dry ice particles in the cyclone separation chamber is 2.0 mm. As the inner diameter of the separation section decreases, dry ice particles coalesce and grow from an equivalent diameter of 4 mm to a maximum of 40 mm. In addition, the comparison of the experimental and simulation results shows that the drag force due to CO2 gas flow is dominant in the circumferential velocity of dry ice particles.

1. Introduction

In conventional refrigeration systems, hydrochlorofluorocarbons (HCFCs), which are nonflammable, nontoxic, and chemically stable, were used as refrigerants. However, the production of HCFCs was regulated because of their high greenhouse effect. In particular, HCFCs are ozone-depleting substances. In contrast, hydrofluorocarbons (HFCs) are currently the mainstream refrigerant; however, they still have an impact on the greenhouse effect and are many slightly flammable [1,2,3,4]. Against this background, in recent years, the importance of using natural refrigerants, which do not affect ozone layer depletion and have a small impact on global warming compared to HFC refrigerants, has been increasing [5,6]. Among natural refrigerants, CO2 is one of the promising environmentally friendly refrigerants because of its superior properties such as low global warming potential, zero-ozone depletion potential, non-toxicity, non-flammability, and inertness [7,8,9,10]. In addition, CO2 has excellent heat transfer properties with a volumetric capacity of three to four times greater than other refrigerants used in the market [11], such as chlorofluorocarbon and HFC. Another characteristic of CO2 is that it forms dry ice (the solid phase of CO2) at temperatures below −56 °C and pressures below the CO2 triple point of 0.518 MPa. This natural refrigerant is suitable for refrigeration because it easily changes the phase to dry ice. Furthermore, CO2 can be used as a working fluid for refrigeration. However, because CO2 forms a cycle in the high-pressure range, it is not suitable for medium-scale or larger refrigeration facilities with a single refrigeration cycle. Therefore, a CO2/ammonia cascade refrigeration system has been proposed and widely used [12,13,14]. The combined cycle can achieve condensation temperatures of 30–50 °C in its high-temperature ammonia cycle and −30 °C in its low-temperature CO2 cycle. In the low-temperature cycle of the expansion process, when the pressure drops below the triple point of CO2, dry ice forms and blocks the evaporator, generating a high heat loss, leading to low system efficiency.
In contrast, industrial applications, such as the fishing and food industries and biomedical engineering, require cooling technology below −30.0 °C. In a review study by Bansal [15], CO2 was reported as the most promising refrigerant for low-temperature refrigeration systems in the range from −25 to −50 °C due to its favorable thermophysical characteristics. Therefore, if the problem of dry ice blockages in the evaporator can be solved, an ultra-cooling range of −56 °C or lower using CO2 can be realized. Moreover, this system is expected to be an environmentally friendly next-generation refrigeration technology. Various studies were conducted to tackle the problem mentioned above. For instance, Huang et al. [16] theoretically studied a CO2 refrigeration system using solid–gaseous CO2 flow using nozzles, a sublimator, and high- and low-pressure regulating valves instead of an evaporator. Liu et al. [17,18] experimentally studied the formation and aggregation process of dry ice particles. The authors analyzed the particle size distribution and the amount of dry ice produced under various conditions. In our research group, a CO2/CO2 cascade refrigeration system was developed with a CO2 supercritical cycle in the high-pressure process and a triple-point cycle in the low-pressure process. In addition, a CO2 solid–gas two-phase flow below −56.6 °C refrigeration system was introduced [19]. The developed refrigeration system also achieved a continuous and stable cryogenic range of −62 °C. In further studies, heat transfer characteristics, blocking by dry ice sublimation, system performances with tapered evaporators/sublimators, and visualization of CO2 dry ice flow in the evaporator/sublimator [20,21,22] were reported. By expanding sufficiently cooled liquid CO2 to solid–gas two-phase, a −60 °C range below the triple point of CO2 was achieved. However, a problem of blockage by dry ice in the evaporator/sublimator, preventing the continuous operation of the refrigeration system, was reported in [20].
These studies [17,18,19,20,21,22] are of heat pump systems using horizontal tube evaporators (as a model of conventional tube evaporators) with CO2 as the refrigerant. As a solution to prevent this blockage phenomenon, in a previous study, we proposed a dry ice–gas separation technology using a cyclone separator-evaporator as an alternative to horizontal tube evaporators for ultra-low temperature energy storage [23]. The cyclone separator-sublimator is expected to be used in place of the conventional evaporator in the CO2 heat pump system. A prototype acrylic cyclone separator-evaporator with a heat storage tank was constructed, and dry ice particle collection efficiency and temperatures were measured using a cyclone separator with various introduction accounting before installation in an actual system. As a result, it was possible to achieve cryogenic temperatures as low as −76 °C under atmospheric pressure using a conical type cyclone separator-evaporator.
The previous study [23] reported on the collection efficiency and temperature distribution of dry ice particles when using a cyclone separation evaporator. In this study, to further improve the performance of the cyclone separator-evaporator, the behavior of dry ice particles inside the separator-evaporator was visualized and analyzed using a high-speed camera. In particular, we focused on dry ice particles in the separation section to analyze variations in diameter and circumferential and axial velocities. In addition, the simulation of CO2 gas motion was compared with measured particle motion, and a kinematic model of dry ice particle motion was developed. This study provides knowledge on dry ice particle size and kinetic modeling for designing high efficiency (dry ice cyclone separation) evaporators. Moreover, this study can provide a future introduction of cyclone separation evaporators into new generation heat pump systems that contributes to an environmentally friendly energy system capable of supplying cryogenic regions.

2. Materials and Methods

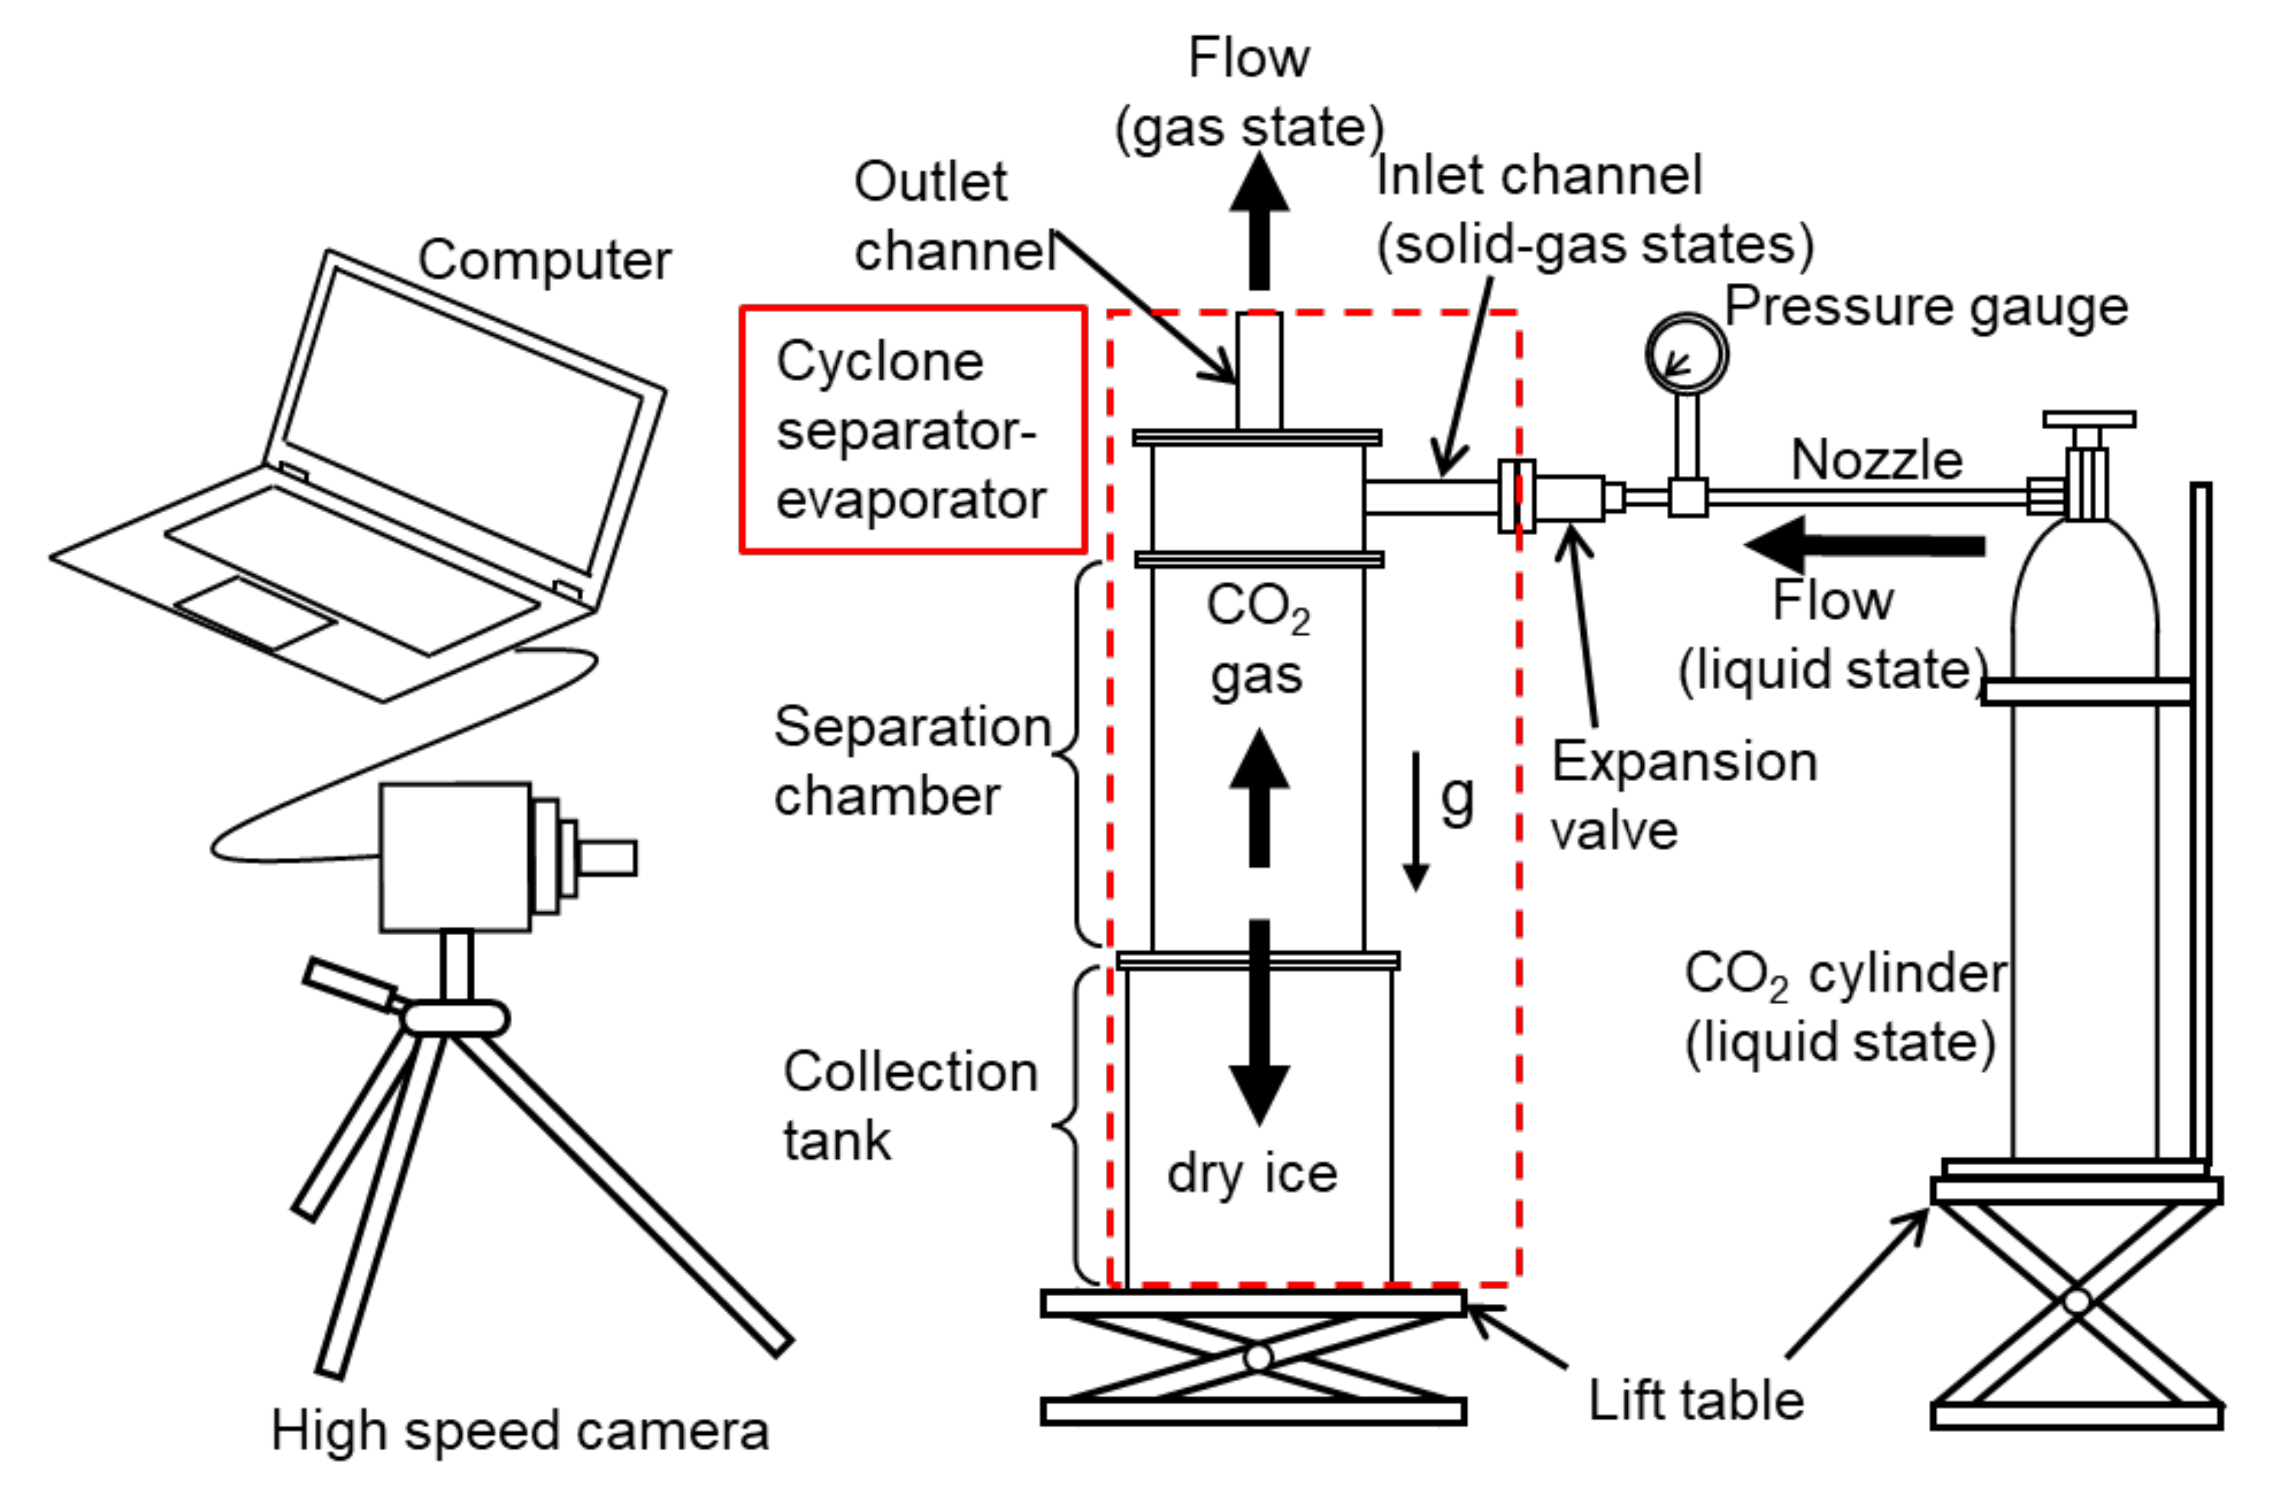
2.1. Experimental Setup

A cyclone separator-evaporator was developed to evaluate the dry ice particle behavior inside the separator-evaporator toward obtaining an ultra-low temperature energy storage process using CO2. Figure 1 shows a schematic diagram of the modified experimental setup to study the high-speed motion of dry ice particles in various positions. The experimental apparatus consists of a cylinder tank containing liquid CO2 at 12 MPa and 15 °C, a nozzle, an expansion valve, a cyclone separator, and a high-speed camera. The cyclone separator, made of acryl for visualization, consists of an inlet channel, outlet channel, separator chamber, and storage tank. The cyclone separator-evaporator and CO2 cylinder are placed on a lift table; the height of the table can be adjusted. The high-pressure liquid CO2 in the cylinder is depressurized to 1.5 MPa at a pressure gauge connected to the cylinder and flows into the nozzle as a liquid state. Subsequently, the CO2 is rapidly expanded by the expansion valve, resulting in a pressure drop. As the pressure drops, CO2 temperature decreases due to the Joule–Thomson effect, and dry ice is formed immediately after the expansion valve. The solid–gas two-phase flow of formed dry ice particles flows into the cyclone separator-evaporator. The dry ice solid–gas two-phase flow is separated in the cyclone section. Thus, dry ice particles flow into the collection section while the gas CO2 flows into the outlet channel. The outlet channel at the top of the cyclone separator-evaporator is open to the atmosphere, allowing separated CO2 gas to flow out.
A detailed schematic diagram of the cyclone separator-evaporator is shown in Figure 2. In this study, a cyclone separator-evaporator with a conical shape was used to achieve the lowest temperature range obtained in the previous study [23]. As seen in the figure, the cyclone chamber is 360 mm long, a length enough to allow the chamber to be used in an actual refrigerator to confirm the required characteristics. The inner diameter is tapered from Ø160 to Ø60 mm with a taper angle of 16 degrees. The inlet channel connected to the CO2 cylinder is made of acrylic with an inner diameter of Ø14 mm and a length of 150 mm. In order to induce a swirling flow of CO2 solid–gas two-phase flow in the separation chamber and efficiently collect dry ice particles, the inlet channel was connected along the sidewall of the separation chamber. The diameter of the throttle of the expansion valve was adjusted to Ø2.0 mm. The collection section is a cylinder shape with an inner diameter of Ø205 mm and a height of 300 mm. The inlet of the outlet section was installed at the same height as the inlet section and was located in the center of the longitude direction. The inlet is made of a cylindrical acrylic tube with an inner diameter of Ø22 mm.
In this study, a high-speed camera (FACTCAM Mini AX 100, Photron Co. Ltd., Tokyo, Japan) was used to analyze the motion behavior of the dry ice particles with a swirling flow in a cyclone separator-evaporator. In the visualization region, dry ice particles in the separation chamber were photographed, and the camera was adjusted in front of the cyclone separator-evaporator so that the outer diameter of the separation chamber was included in the image. In particular, the camera focused on the front side of the separation chamber to capture the dry ice moving on the front wall of the separation chamber. The visualization region was divided into four sections: (a) 0−90 mm, (b) 90−180 mm, (c) 180−270 mm, and (d) 270–360 mm. The experiment was conducted four times, each with a different visualization region. The shooting conditions were as follows: image resolution 1024 pix × 1024 pix, frame rate 1000 fps, and shutter speed 1/4000 s. The experimental procedure first comprised the opening of the CO2 cylinder valve, and then the valve was adjusted so that the value indicated by the pressure gauge was 1.5 MPa. The pressure was maintained constant, and after 20 s, the high-speed camera was used to perform five-second imaging. In the 20 s, CO2 in the nozzle stabilizes from a liquid–gas two-phase to a liquid state. The size and velocity of the circumferential and axial components of the dry ice particles were analyzed from the recording image. Light refraction was considered to visualize the acrylic experimental apparatus. In addition, before conducting the visualization experiment, a ruler was placed in each visualization area along the wall of the separation section, and images of the ruler were captured to obtain conversion coefficients between the pixel values and the actual lengths.
The size of dry ice particles was determined from the projected area of dry ice particles photographed by a high-speed camera. The previous study [23] showed that dry ice particles coalesce on the walls of the separation chamber and form thin flakes. Therefore, in this study, for all visualization regions (A)–(D), two frames of particles passing through rectangular regions of +30 mm and −35 mm in the z-direction and +1.5 mm vertically in the z-direction from the center of each visualization area were analyzed. After determining the depth from the brightness of the visualized image and identifying the particles that pass on the front side of the inner wall, the image was binarized. A series of image processing adopted in the present study is shown in Figure 3a–d. Figure 3a shows an image of the cyclone separator-evaporator in the absence of dry ice particles. Figure 3b shows an image of the cyclone separator-evaporator in the presence of dry ice particles. By filtering the brightness of Figure 3b by Figure 3a, the light reflection of the acrylic was successfully removed. The image after the removal is shown in Figure 3c. Finally, after the removal of unwanted, the image of the targeted particle at a certain location was binarized, as shown in Figure 3d. The projected area of the particles distinguished by binarization was converted from pixel values to mm, and the equivalent diameter assuming a spherical shape was obtained. The values for the two frames were then averaged to obtain the equivalent diameter of the dry ice particle. The resolution in this measurement was determined by the number of pixels and is 0.17 mm in length, equal to 0.029 mm2 in an equivalent area. Although dry ice particles have a curved shape in the separation area, the larger particle equivalent diameter is approximately 20 mm in the visualization region (D), where the curvature in this study is expected to be the largest. Thus, the curvature effect is less than the resolution. Therefore, the curvature effect was ignored, and the equivalent diameter obtained from the projected area was defined as the size of the dry ice particles.
The velocity of a dry ice particle v = (vθ, vz) is the moving velocity of the particle center of the binarized particle, where vθ is the circumferential velocity, and vz is the axial velocity. The pixel coordinates rp(i, j) can be used to determine the coordinates of the particle center rg based on the relationship between the sum of moments of a pixel and its area as follows:
r g = i , j = 0 1023 w r p ( i , j ) S p
where Sp is the projected area of dry ice particles, and w is a variable that distinguishes between particles and non-particle by binarization when w is one represents the targeted particles, and zero represents others.
The movement distance of the dry ice to be photographed is the distance projected on an axial plane parallel to the camera lens, which differs from the actual circumferential movement. Thus, correction is necessary. Figure 4 shows a diagram of the correction of the circumferential distance of dry ice particles between images in the separation chamber. The circle in the figure shows the horizontal cross-section of the separation section, and the dry ice particles are assumed to move along the inner circle. In this case, the movement distance of the dry ice particle from one frame to the other was considered. Because dry ice particles are on the wall, the swirl radius Rs(z) can be determined as follows:
R s ( z ) = 160 2 160 60 / 2 360 z
Furthermore, the angle θ between the particle centers of the dry ice particles in each frame is expressed by the following equation using the coordinates of the particle centers of each frame:
θ = π cos 1 r g R s ( z ) + cos 1 r g R s ( z )
where the distance of the z-directional component can be ignored, as the distance of the z-directional component is sufficiently small compared to the distance of the circumferential component. The circumferential movement distance L is as follows:
L = R s ( z ) θ
Because L is the distance, a dry ice particle moves in one frame, in which the pixel value can be converted to distance unit (mm). Then L is multiplied by the inverse of 1000 fps to obtain the circumferential velocity uθ of the dry ice particle. The velocity resolution can be determined by the camera resolution and fps, which in this study was 0.166 m/s. A series of image processing from image reading was programmed in Python using OpenCV [24].
It is generally known that rotating fluid flow in a cyclone separator or cylindrical tank is unsteady and highly stochastic [25,26]. Therefore, there are various limitations for particle imaging, including shutter speed, pixel resolution, and processing algorithms. However, the objective of this study was to determine the representative particle size and a kinetic model of dry ice particles in a cyclone separator-evaporator. By performing image processing on all particles passing through the image capturing area within the period of measuring time, we reported on the kinetic behavior of dry ice particles, including the effects of non-stationarity and base flow (gaseous phase). Uncertainties in this measurement method were derived from the assumption since the dry ice particles are thin flakes, that their motion is almost two-dimensional. However, there are some degrees of three-dimensional behavior that cannot be taken into account. Furthermore, the length of the resolution was 0.17 mm, which is rather coarse for complex flows. In the present study, the degree of uncertainties was minimized to interpolate by analyzing the accurate particle size and velocity of a large number of dry ice particles.

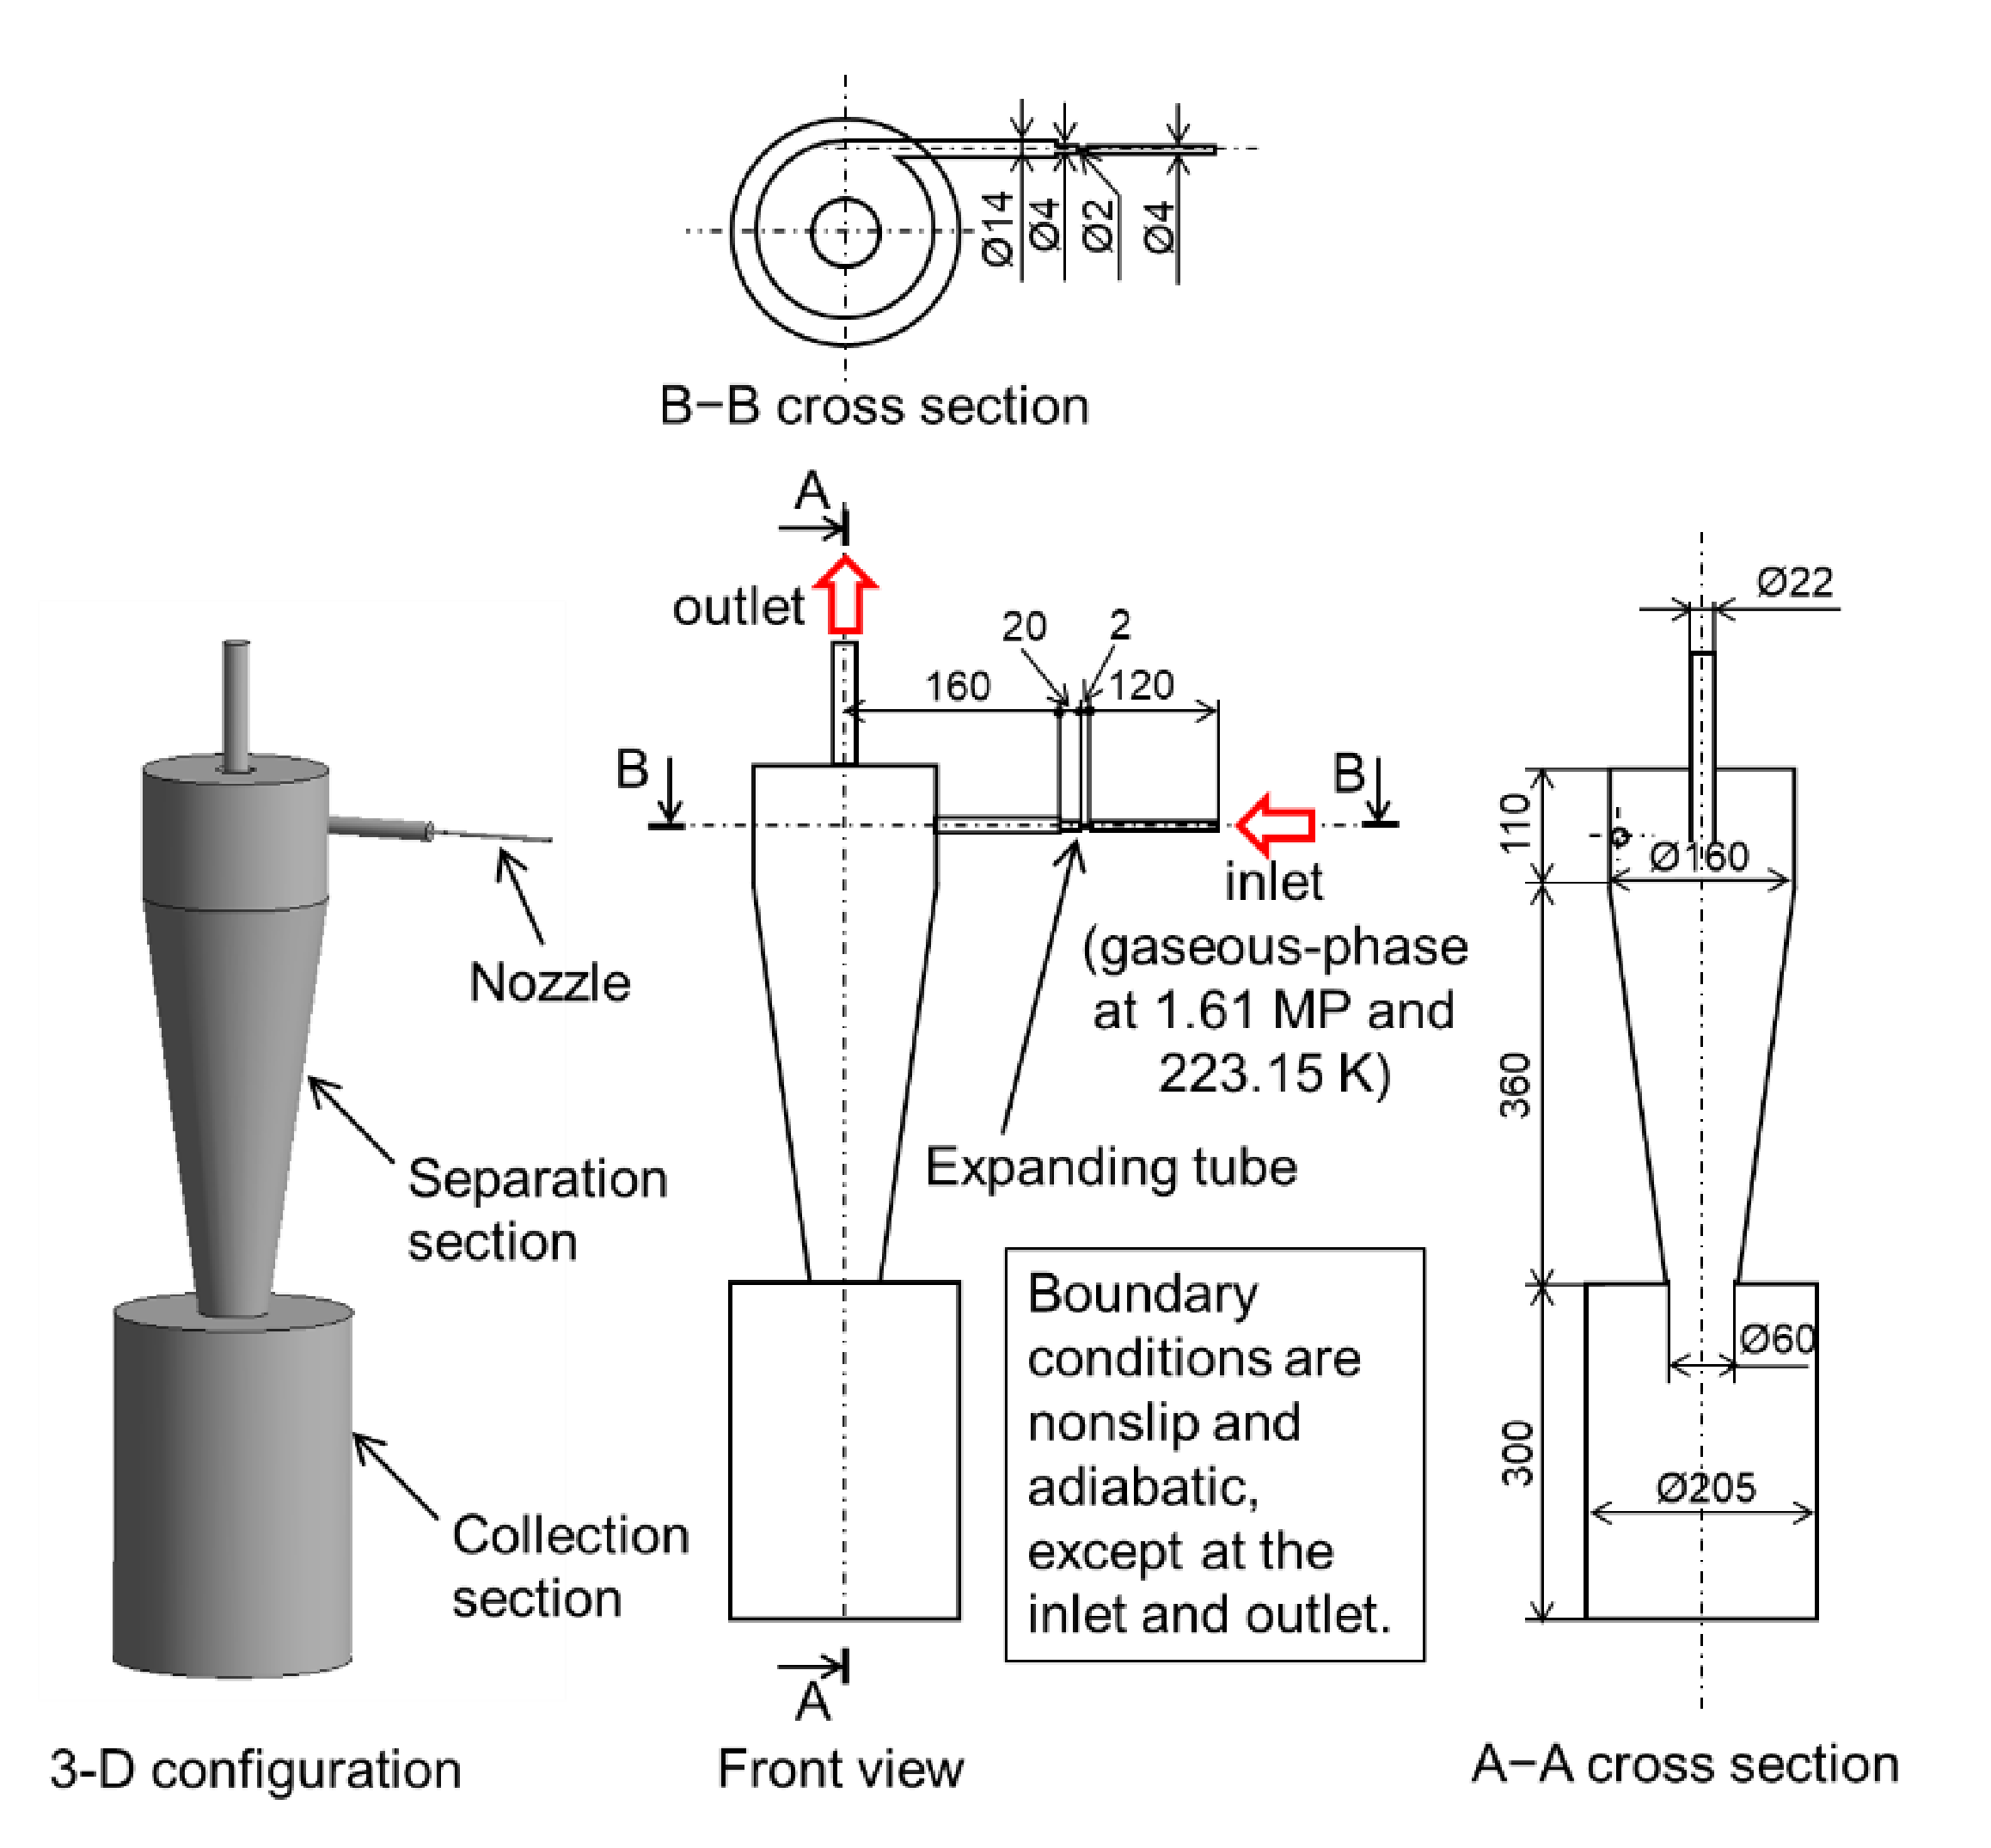
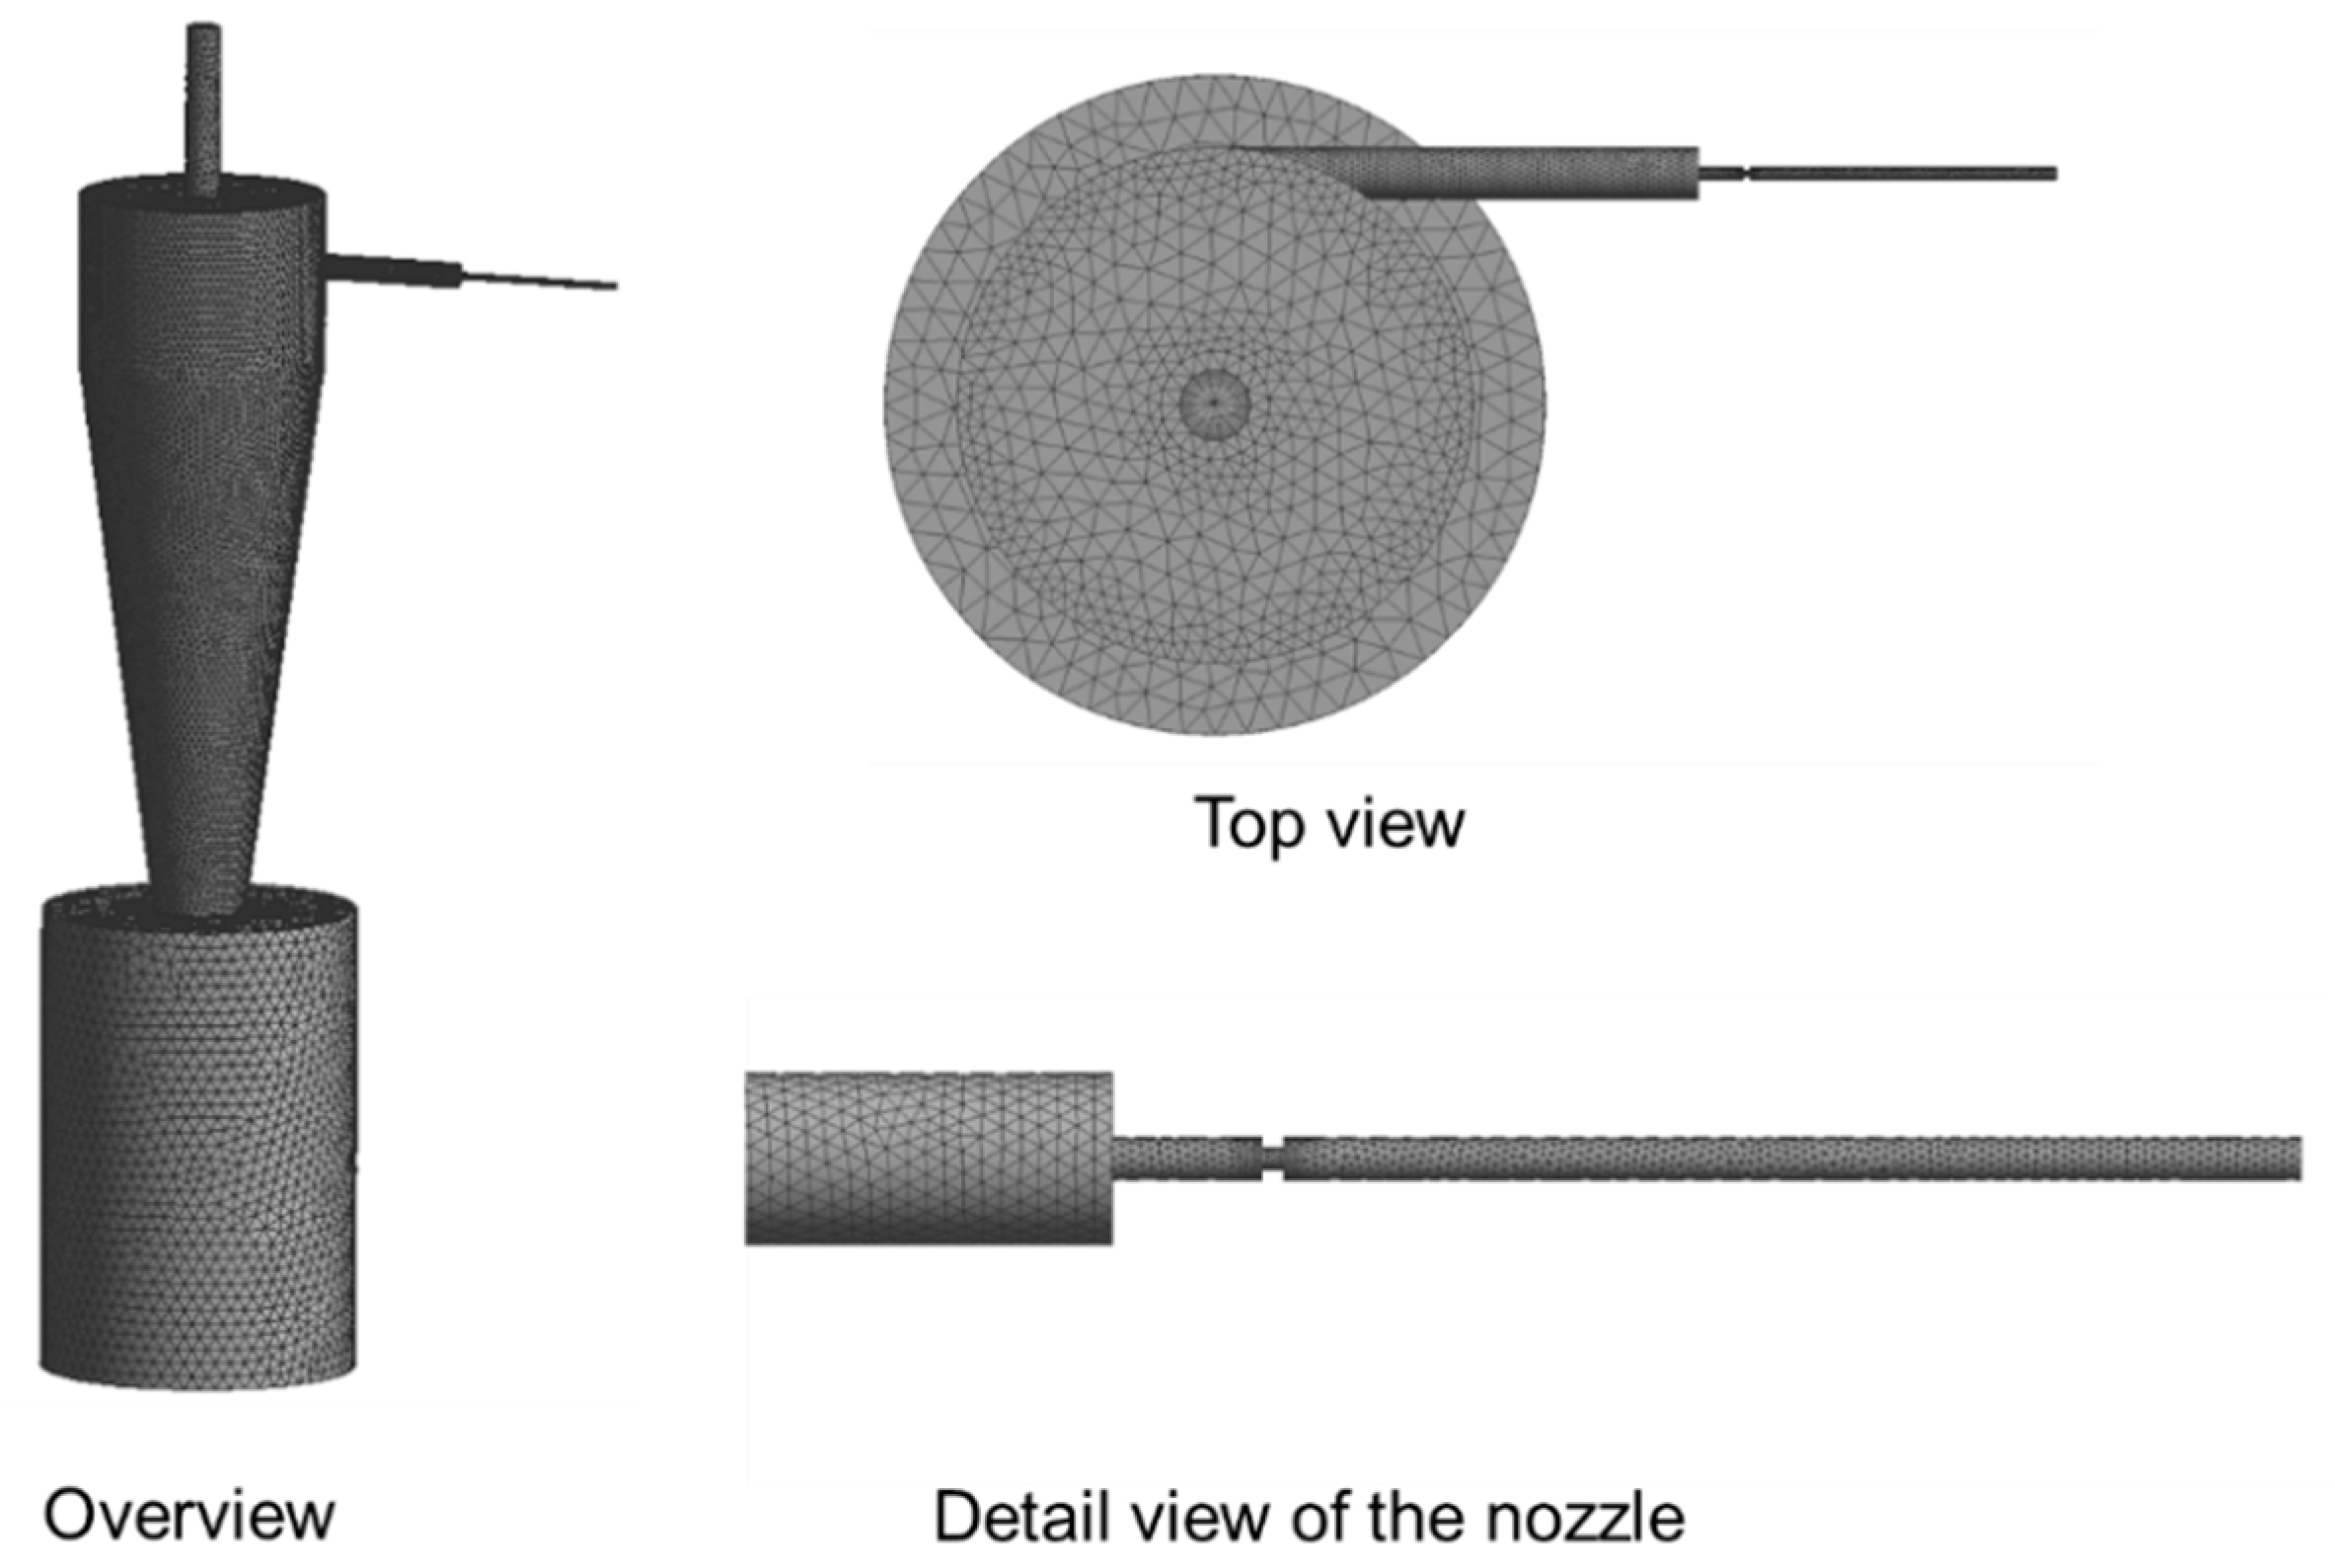
2.2. Simulation Model of CO2 Gaseous Phase Flow in the Separator-Evaporator

In order to determine a fundamental kinetic model of dry ice particles, the numerical simulation of the CO2 gaseous phase flow, which is a base flow for the motion of dry ice particles, was carried out. The gaseous phase flow can provide a basic flow field for the motion of particles, although in realistic experimental flow filed with dry ice particles is a very complex flow involving sublimation and splitting, as well as coalescence of particles. Figure 5 shows the flow field configuration. The configuration has the same geometry and dimensions as the experimental visualization apparatus. The flow field consists of a nozzle, an expanding tube, a separation chamber, a collection section, and an outlet channel. The gaseous phase flows from the nozzle inlet at 1.61 MPa and 223.15 K, passes through the orifice to the cyclone separator, and flows out from the outlet at 0.10 MPa. It was noted that the flow state with 1.61 MPa and 223.15 K is essentially a liquid state, but for primally CO2 gas flow calculations, the CO2 gas properties were linearly interpolated and treated as a gaseous phase. The boundary condition at the channel wall is a non-slip condition with zero velocity tangential component to the wall. Adiabatic condition with zero temperature gradient at the wall was imposed. CO2 gas enters the channel from the inlet at a uniform velocity. As an initial condition, zero velocity and temperature of 223.15 K were set for the entire calculation region. A steady three-dimensional compressible flow simulation was performed. This simulation was implemented in ANSYS version 2021R2, widely used commercial software for fluid analysis. The flow field was solved using ANSYS fluent, in which the calculation method is the pressure-based coupled algorithm.
Figure 6 shows the computational mesh system. The structure was constructed using ANSYS Meshing. Tetrahedron meshes were used in the entire computational domain. The total number of cells is 391,720. In order to focus on the CO2 gaseous phase flow in the separation section, a mesh of finer size mesh was used for the separation section and a rougher size mesh for the collection section. As shown in the top view of the figure, a fine mesh was used near the center and near the boundary to represent curvature. The nozzle connected to the separation section was used with an even finer mesh of 1 mm or less in size. Quality checking by the software shows that the skewness of generated mesh is lower than 0.41, which shows the acceptable accuracy of cell shape. It may be considered that finer mesh is needed to correctly evaluate the effects of turbulence, such as fine eddy structures. However, in this study, the quality of the mesh used can be regarded as sufficient to gain a basic flow field in order to focus on the kinetic behavior of dry ice particles.
The governing equations for a three-dimensional compressible steady-state gas-phase problem can be described as follows [27].
Continuity equation:
ρ u = 0
Momentum equation:
ρ u u = p + μ u + ρ g
where ρ, u, p, μ, and g are the density, velocity vector, pressure, viscosity, and gravitational acceleration, respectively.
Equation of state (Redlich–Kwong equation [28]):
p = R T V b g a g T 0.5 V ( V + b g )
where R, T, and V are the gas constant, temperature, and volume, respectively. ag and bg are defined as
a g = 0.4278 R 2 T c 2.5 P c , b g = 0.0867 R T c P c
where Tc and Pc are saturated temperature and pressure, 304.12 K and 7.374 MPa for CO2 gaseous phase, respectively.
Energy equation:
u ( ρ E + p ) = λ T + ψ D
where E, λ, and ΨD are the energy, thermal conductivity, and dissipation loss, respectively.
In this study, the SST (shear-stress transport) k-ω model was used as the turbulence model for primally flow filed calculation. The SST k-ω model provides numerically stable calculations by switching k-ε and k-ω at the wall boundary using the distance from the wall and the turbulent Reynolds number. The SST model has advantages for the calculations of rotation flows in cylindrical vessels and cyclone separators [29,30]. The simulation in this study was performed to obtain a primally CO2 gaseous phase flow to obtain a kinematic model of dry ice particles. It is noted here that the present simulation does not take into account the effects of complex turbulent vortexes, unsteady flow, etc., on the motion of dry ice particles.
The flow velocities at representative locations were monitored to satisfy the convergence conditions, which usually take three days for one run.

3. Results and Discussion

Basic characteristics of the dry ice separator-evaporator were evaluated by visualization measurements of dry ice particles in the separation chamber. In particular, the size and velocities of particles were analyzed.

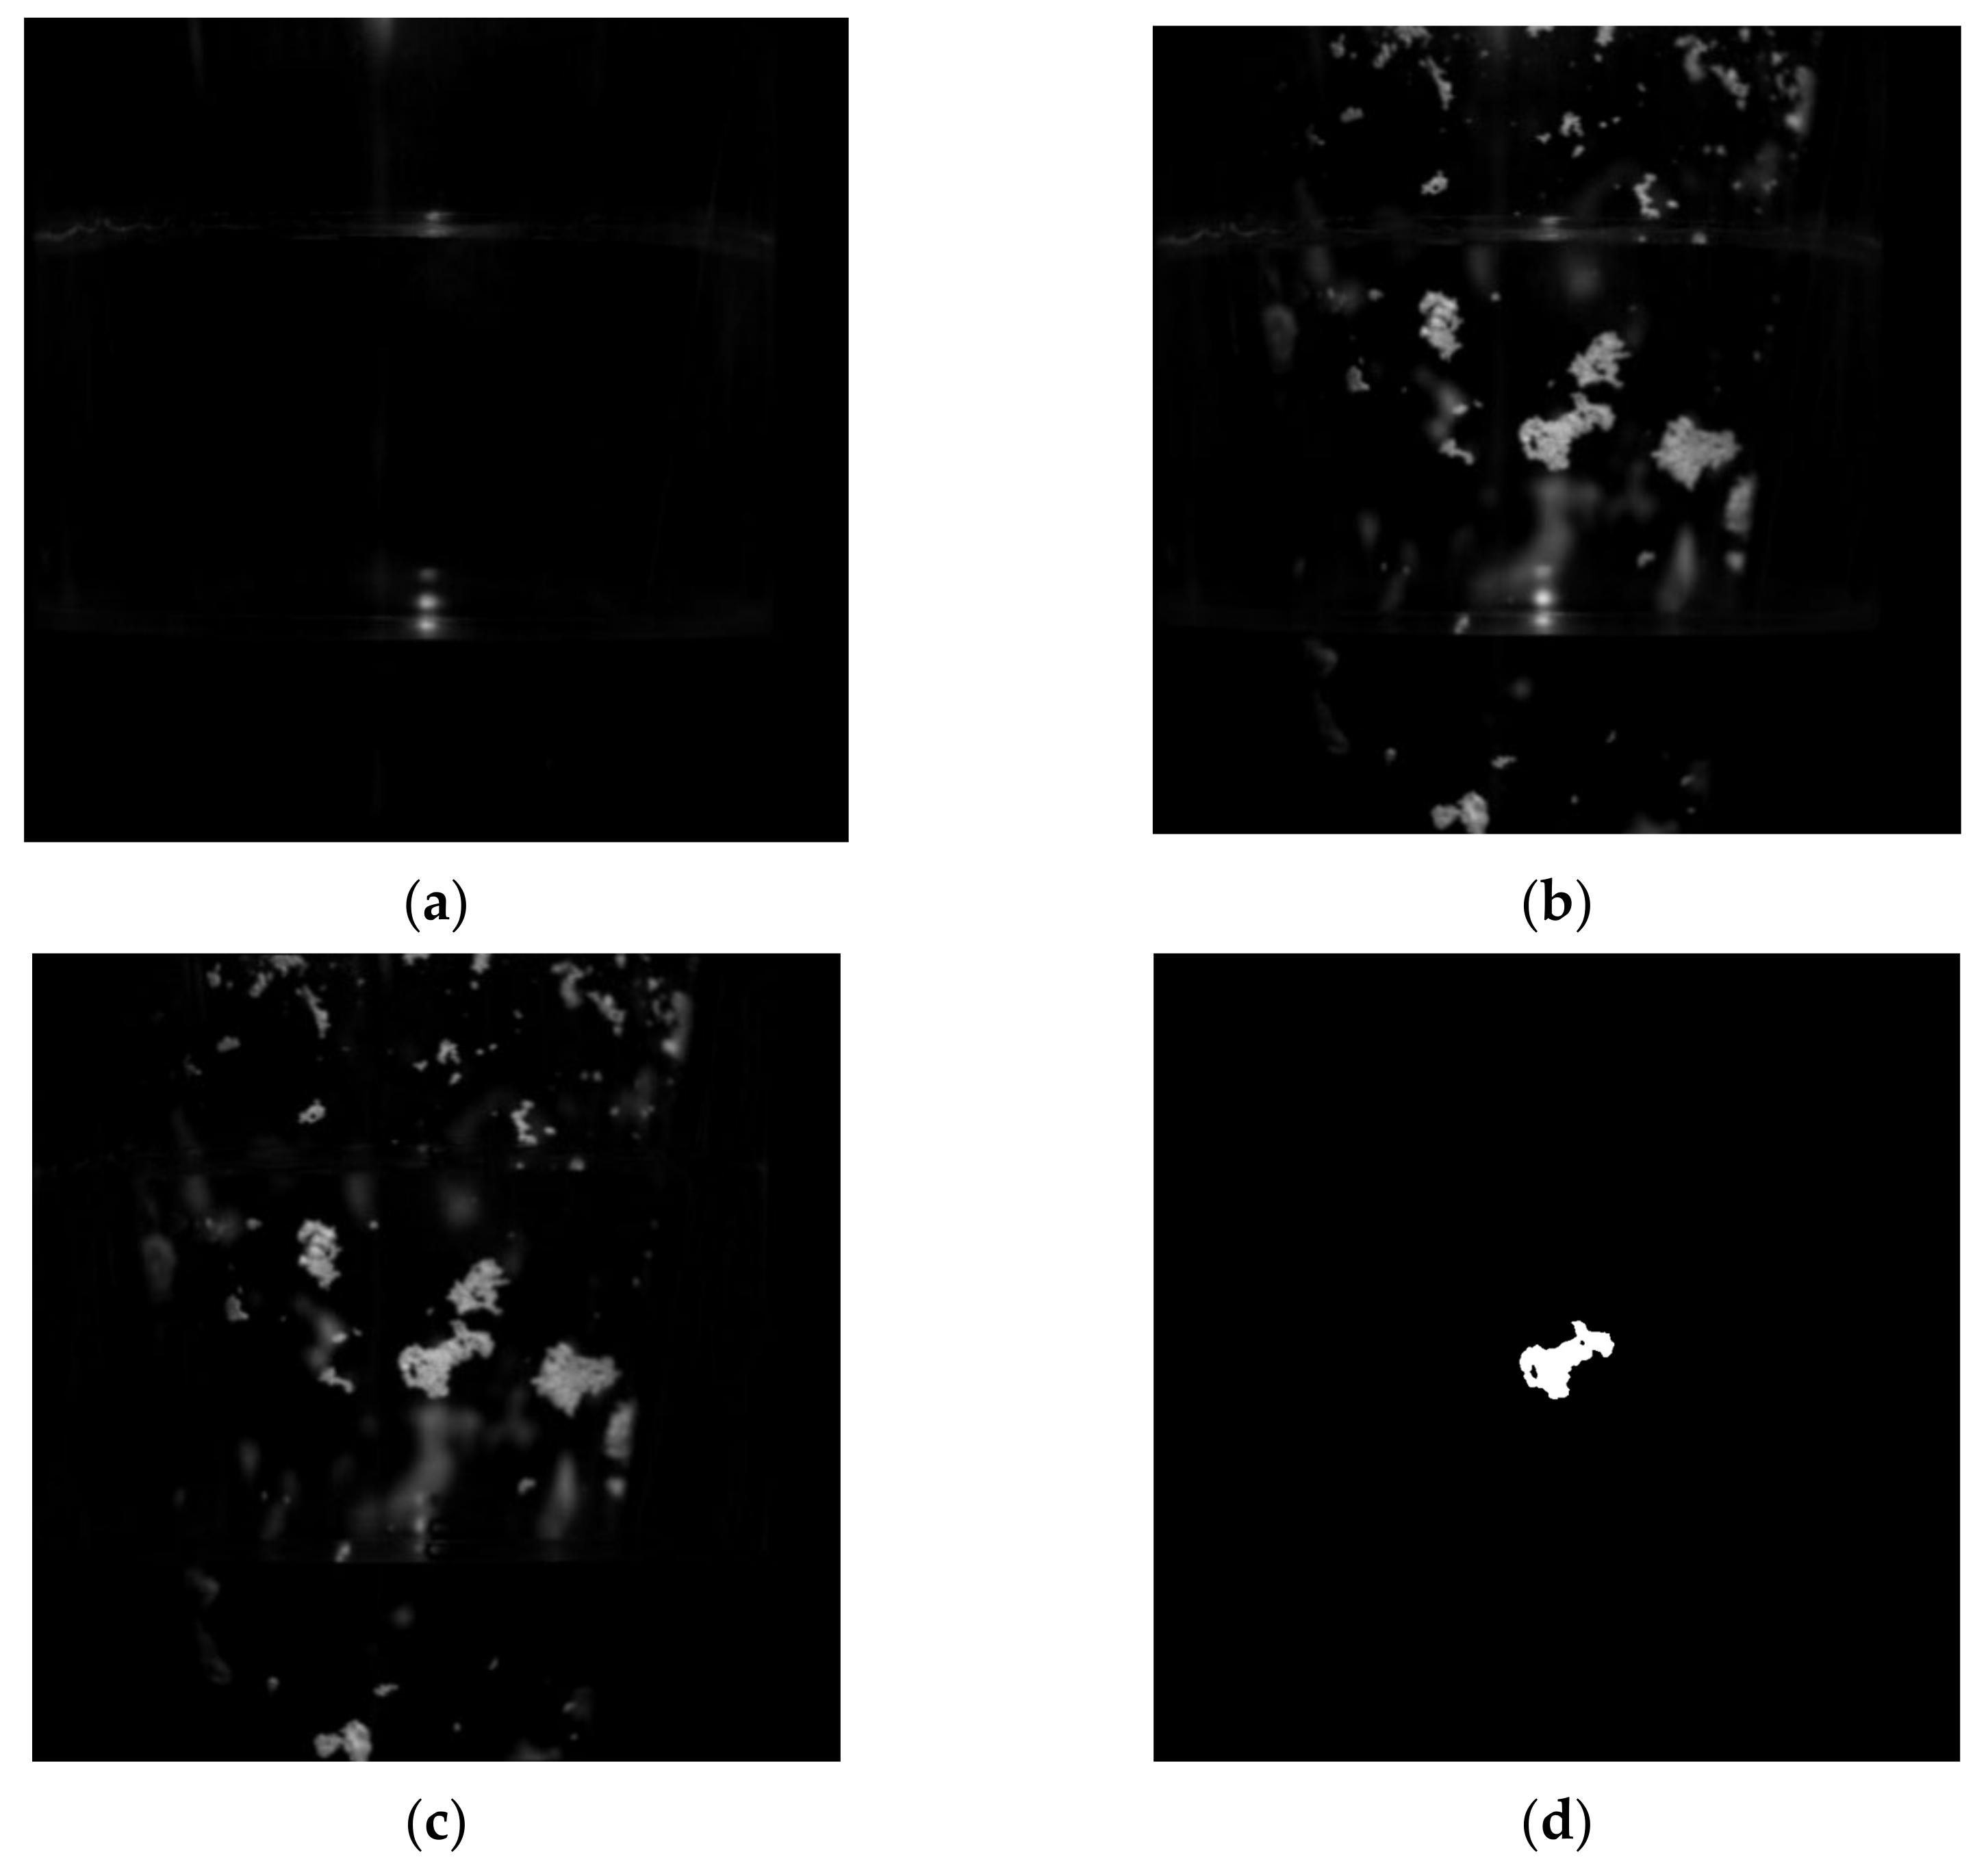
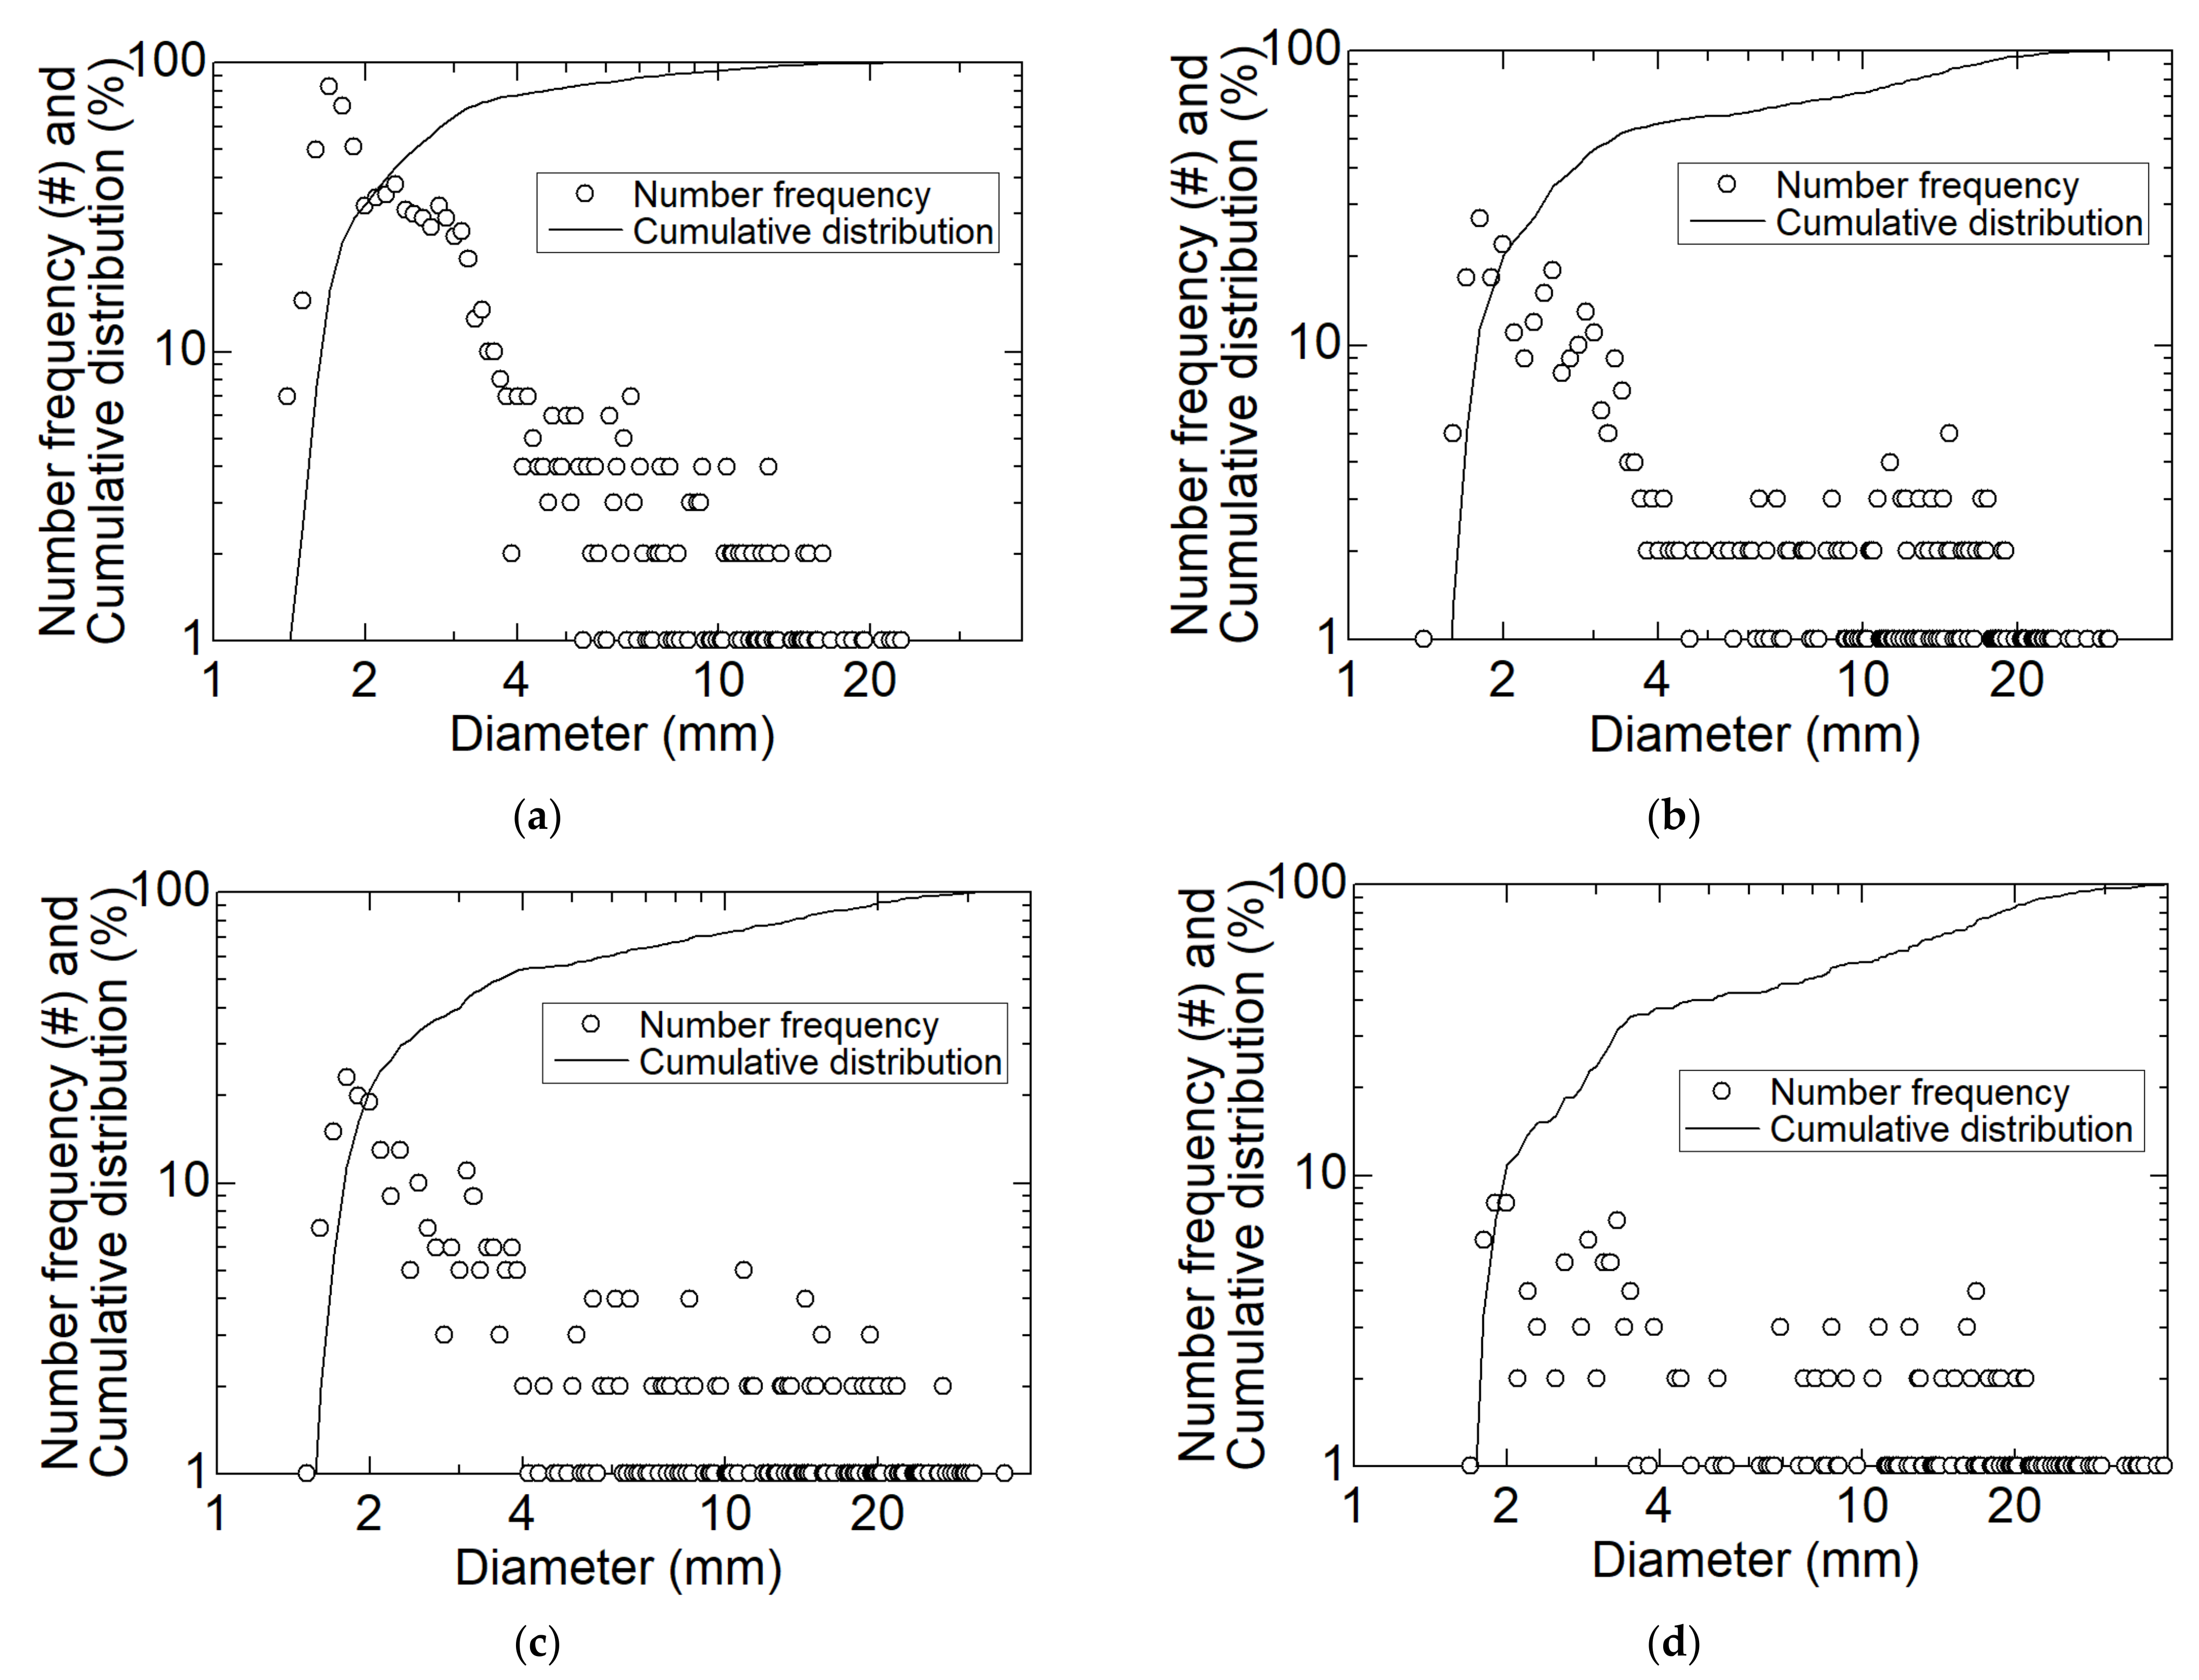
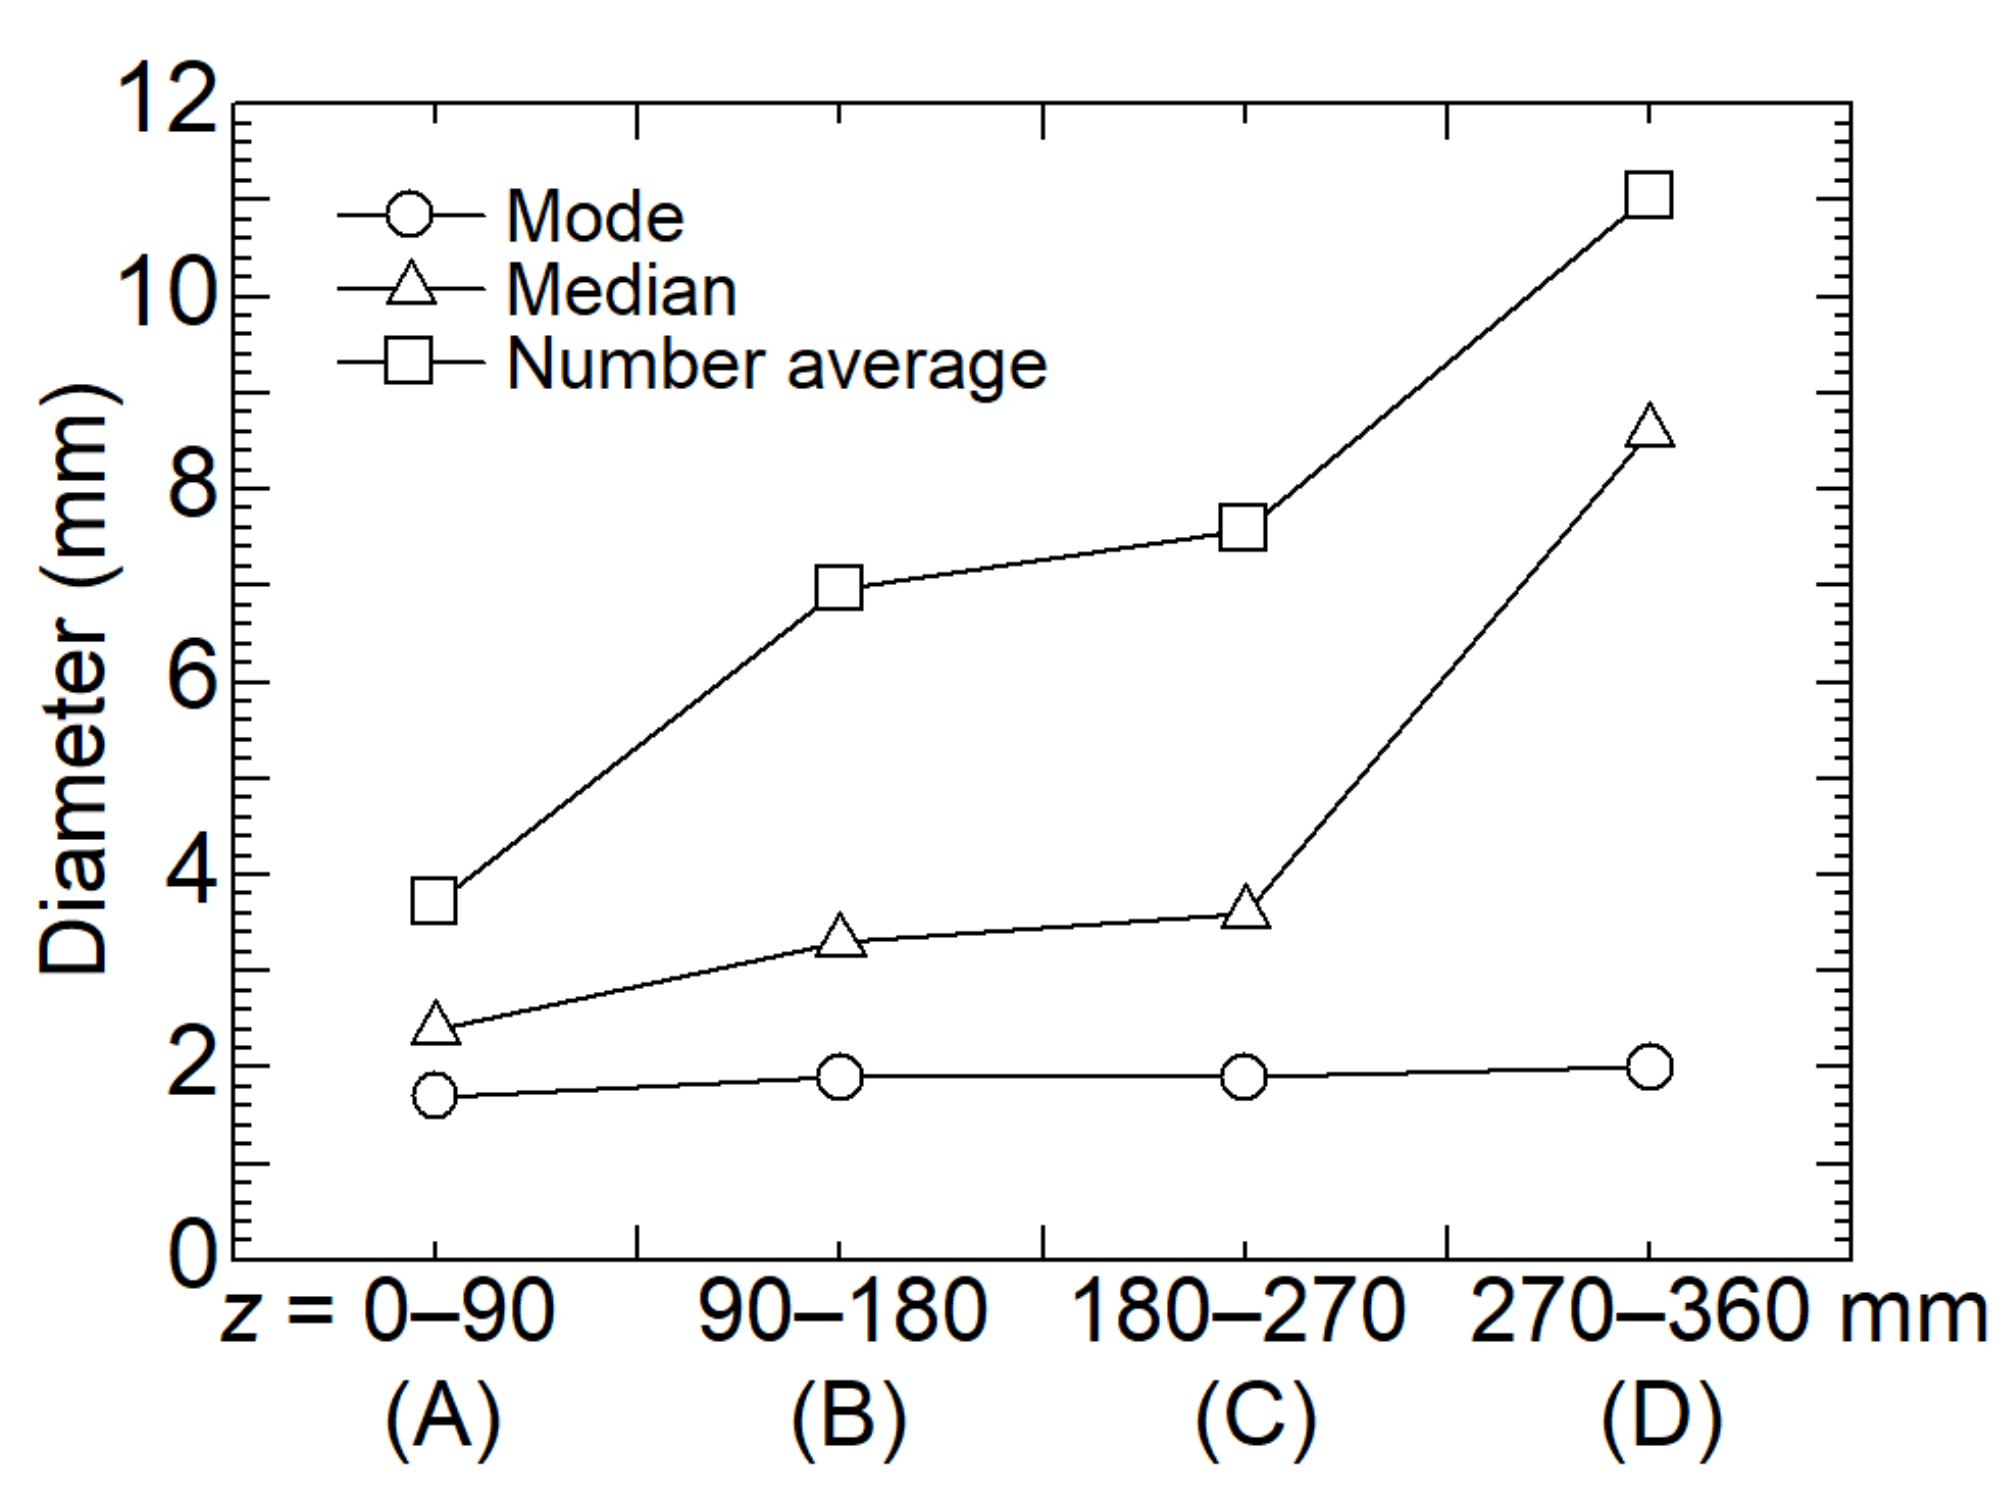
3.1. Size of Dry Ice Particles

The number frequency of particles and the cumulative distribution in each visualization region (A)–(D) of the separation chamber are shown in Figure 7a–d. Note that both the horizontal and vertical axes were expressed in logarithmic scales. The number of plots in Figure 7a–d are 955, 442, 404, and 211, respectively, and the number of particles decreases due to the agglomeration of dry ice as the distance increases in the z-direction. In Figure 7a, the particles are widely distributed up to 23 mm in diameter, with more than 30 particles in the range from 1.6 to 2.5 mm. In particular, the figure shows that several small dry ice particles near 1.7 mm in diameter are present. The median diameter at which the cumulative distribution is 50% is 2.4 mm. In Figure 7b, as in Figure 7a, the particles have large extrema in size range from 0 to 4.0 mm in diameter; however, the number of particles is lower, with no more than 30 particles. Compared to Figure 7a, the number of relatively large particles (10–20 mm) increases. The median diameter is 3.3 mm. In Figure 7c, significant differences are found in the distribution of small particles smaller than 4.0 mm compared to Figure 7b. Nevertheless, the number of medium and larger particles from 5 to 20 mm increases. The median diameter is 3.6 mm. Figure 7d shows an overall decrease in the number of particles in Figure 7c, particularly in the number of particles smaller than 4 mm in diameter. The median diameter is 8.6 mm. Figure 7 shows that in any of the separation chambers, the small particles of 4 mm or less existing in the upstream region (A) account for most of the particle size distribution. On the contrary, as the dry ice particles flow downstream, they coalesce, and the number of grown particles of approximately 10 mm increases.
Three representative particle sizes are used in more detail to analyze the results shown in Figure 7. Figure 8 shows the mode, median, and number average of the diameters in each visualization region (A)–(D). The mode diameter is the diameter of the most frequently occurring particle; the median diameter is the diameter at which 50% of large and small particle diameters are present. The average particle diameter dave is thus given in the following equation by the general arithmetic average:
d a v e = i = 1 n c i d i i = 1 n c i
where c is the number of particles at each particle size, and n is the number of particle sizes.
As shown in the figure, the mode diameter remains approximately 1.9 mm in all regions. This implies that dry ice particles do not separate into smaller particles as they flow downstream of the separation section. Moreover, it is understood that a certain amount of initially formed smaller dry ice particles does not contribute to coalescence. The median diameter increases gradually from the region (A) to (C) and increases rapidly in the region (D). This is because in regions (A)–(C), several small particles of 4.0 mm or less are present, and a wide number of particles are from 4.0 to 30 mm. However, in the region (D), the number of particles smaller than 4.0 mm is much smaller than in regions (A)–(C), and particles are widely distributed in size from 2.0 to 40 mm. This causes the median diameter to increase rapidly in the region (D). In other words, particles appear to grow into larger particles from the region (C) to (D). The number average particle diameter increases from the region (A) to (D). The difference in the increasing trend with median diameter in regions (A) through (C) is due to the difference in the number of particles in regions (A) and (B) by twice or more. This difference in the number of particles can be attributed to three factors: outflow of particles from the outlet channel, particle coalescence, and particle sublimation. The collection efficiency of particles under the same conditions of pressure difference in the previous study [23] was 62%. Therefore, the main reason for the difference in the number of particles from the region (A) to (B) could be an outflow of particles. This is considered to be affected by the different flow modes in the separation section described below.

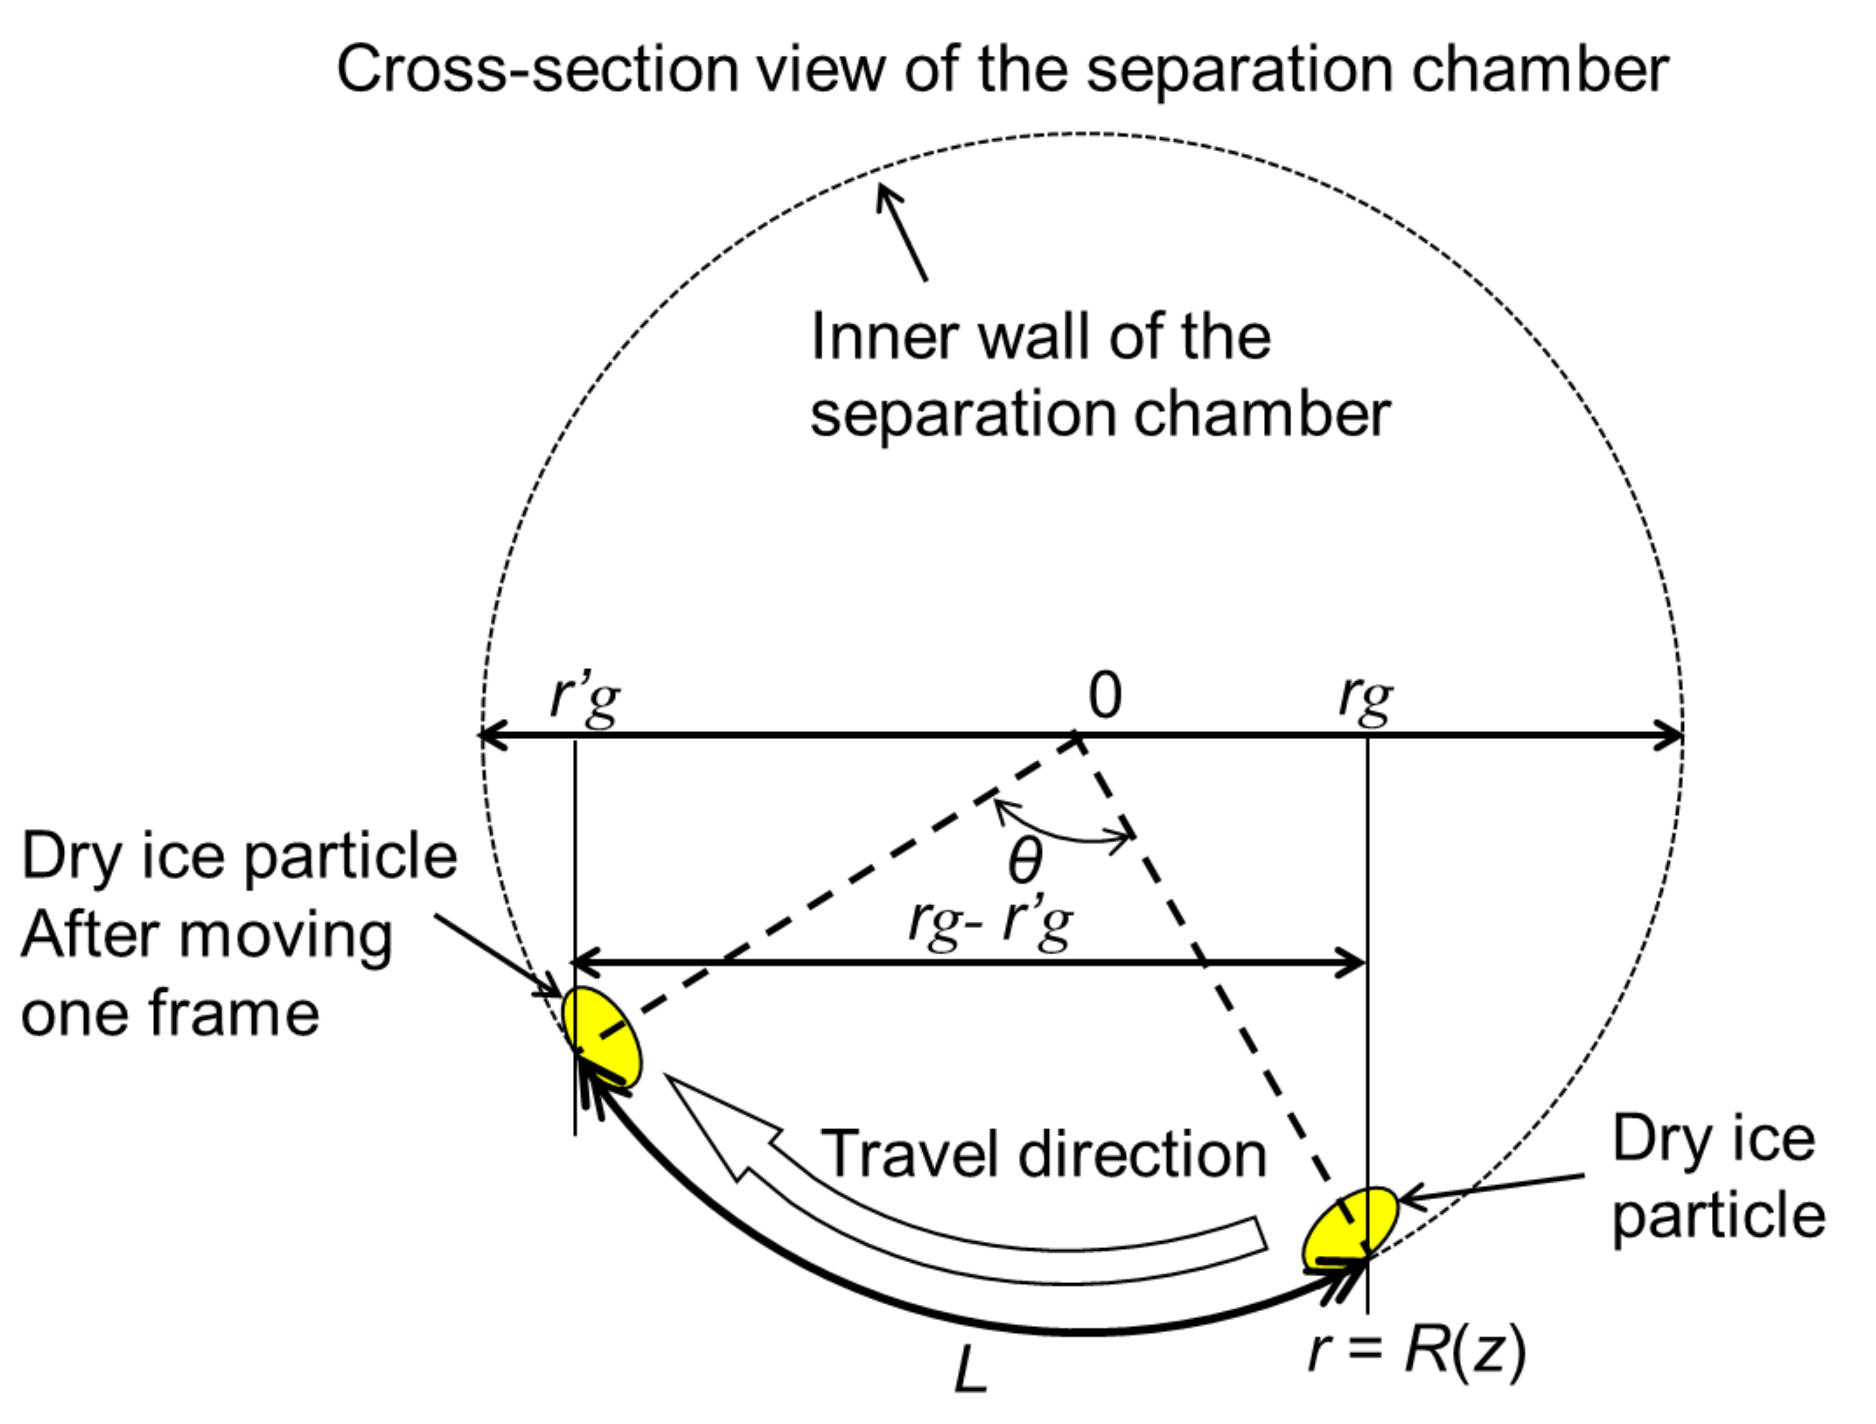
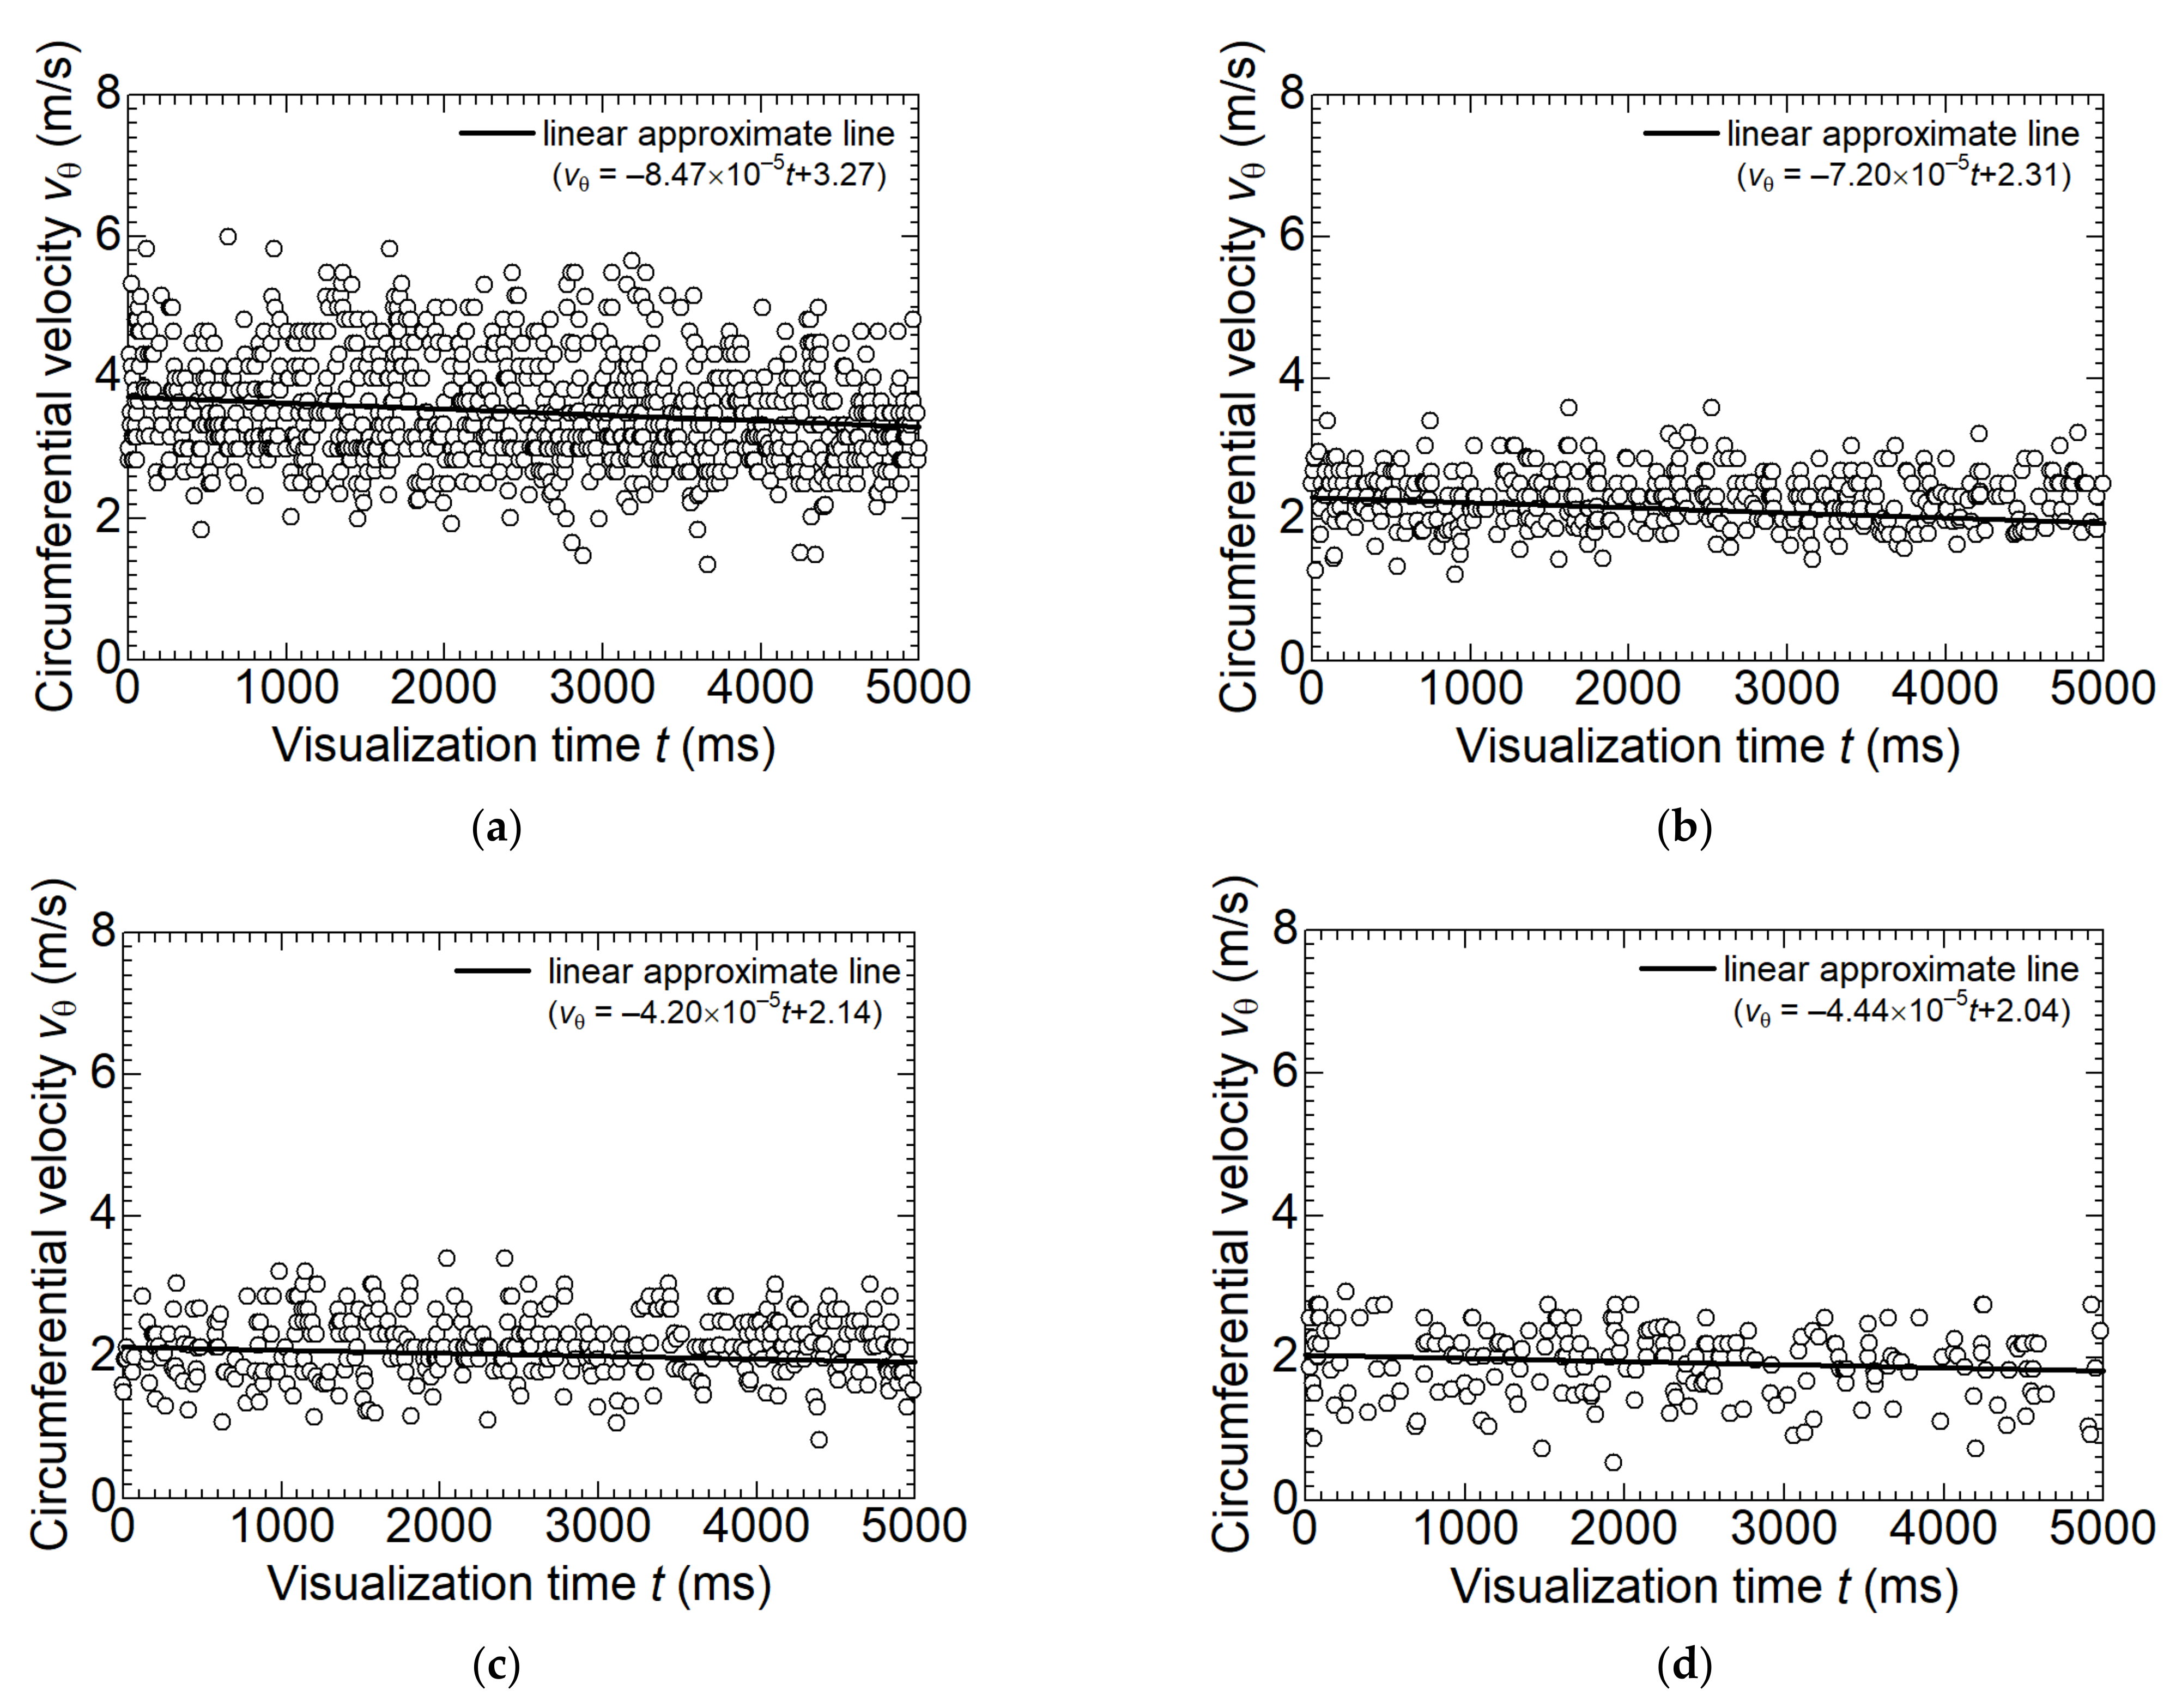
3.2. Dynamic Behavior of Dry Ice Particles

Figure 9a–d shows the time-dependent circumferential velocity in the visualization region (A)–(D). The amount of data for each figure is the same as the number of particle size data shown in Figure 7a–d. Figure 9a shows that the circumferential velocity is distributed from approximately 2.0 to 6.0 m/s from 0 to 5000 ms. The approximate linear line shows a slight decrease with time. The reason is due to the slight increase in particle collisions with time. However, the decrease rate is low, and the phenomenon is considered stationary. In Figure 9b, the circumferential velocity distribution and average velocity decrease compared to (a), and the distribution is between 2.0 m/s and 3.0 m/s. Figure 9c shows the same trend as Figure 9b; however, the circumferential velocity variation increases. Figure 9d shows an increase in the variation in low velocities. The decrease in circumferential velocity is due to the decrease in centrifugal force received by dry ice particles as they flow downstream due to the decrease in radius of the separation section and the increase in drag force received from the surrounding gas due to the increase in particle size.
Subsequently, the relationship between the particle size and the circumferential velocity is shown in Figure 10. The circumferential velocity is classified by particle size in three different plots: small (–4 mm), medium (4–8 mm), and large (8 mm–). Small particles are widely distributed from 1.5 to 6.0 m/s. Region (A) comprises particles with flow velocities of 3.6 m/s or faster, and their circumferential velocity increases due to the strong inertial force of the solid–gas two-phase flow entering from the inlet channel. Particles of medium size have a smaller dispersion of circumferential velocity below 3.6 m/s compared to other particle sizes. Large size particles have more particles with lower flow velocities. Moreover, their dispersion increases compared to medium diameters. This is due to the increase in drag force on the surrounding gas as the particle size increases. However, the received centrifugal force increases with larger particles, and the grown dry ice particles split. Therefore, as shown in Figure 9c, large particles split downstream of the separation section, resulting in a larger change in circumferential velocity dispersion. In addition, as the dispersion of the circumferential velocity of the medium diameter is small, some split particles are larger than 8.0 mm in diameter.
Figure 11a,b show the variations in the circumferential and axial velocities along the z-axis. From Figure 11a, in region (A) at z = 20–45 mm, some particles present a high circumferential velocity of 4.0–6.0 m/s. The reason is that region (A) is a jet region, where the cyclonic flow is undeveloped because it occurs just after the inflow of the CO2 solid–gas two-phase flow. The circumferential velocity decreases in regions (b)–(d) as z increases. However, the circumferential velocity increases or decreases in region (C) around z = 230 mm. This is considered the point of growth for dry ice particles. As shown in Figure 7, the number of particles as small as 3.0 mm decreases from region (B) to (C), and the number of particles as large as 5.0 mm to 20 mm increases, indicating that small particles are retained at z = 135–230 mm, and their growth is accelerated. In general, particles in a cyclone separator are acted upon by centrifugal forces, reaction forces from the wall surface, and gravity; moreover, the particles tend to stay at the point where these forces balance. Therefore, the particles grow before z = 230 mm, and the circumferential velocity decrease. Subsequently, in region (D), the centrifugal force received by the particles increases due to the decrease in the inner diameter of the separation section and the growth of the particles, and the circumferential velocity increases.
Figure 11b shows that the axial velocity increases at z = 20–45 mm and decreases after z = 45 mm due to the jet and circumferential velocity. In particular, the axial velocity decreases once in region (B) and gradually increases with increasing z in regions (C) and (D). The reason is due to the circumferential retention of particles in regions (B) and (C) and the formation of downward flow in regions (C) and (D). In regions (B) and (C), the forces acting on the small particles are balanced. Moreover, the circumferential retention decreases the axial velocity. In contrast, in a cyclone separator, in the latter half of the separation section, a downward flow is formed in the center of the separator due to the pressure difference with the collection section. Therefore, the axial velocity increases in regions (C) and (D).
The dynamic behavior of dry ice particles is shown in Figure 12. In particular, the figure shows the experimental results, simulation results, and evaluation curve using the model. For comparison purposes, the experimental results were averaged every 5 mm from the results in Figure 11a. Because of the theoretical difficulty of simulating the motion of dry ice particles with sublimation, in this study, the gaseous phase flow field was calculated to study a kinetic model of dry ice particles. The flow velocity distribution near the same inner wall surface as the visualization region was calculated as the simulation result. The equation of motion used for the estimation curve is as follows:
m ¯ d v θ d t = c p ¯ v θ v θ , g a s
where m ¯ is the average mass of particles, c p ¯ is the average drag coefficient received by particles, vθ,gas is the circumferential velocity of the gas phase calculated by simulation. The average value is calculated from the experimental results in the visualization regions (A)–(D). Equation (11) is discretized to obtain
v θ t + Δ t = c p ¯ m ¯ Δ t v θ ( t ) v θ , g a s ( z ) + v θ ( t )
where Δt is set as 0.01 s. In this study, the unsteady displacement in the z-direction was obtained by linear interpolation from the average experimental results of the visualization regions (A)–(D). As an initial condition of the model, the average of the measured values at z = 323 mm was substituted, and the circumferential velocities at other z points were obtained from Equation (12). The estimation curve shown in the figure is the circumferential velocity in Equation (12), which was calculated using the experimental values of c p ¯ , m ¯ , and z. It is noted that for the simulation results for vθ,gas, no fitting parameter was used.
The simulation results in Figure 12 show high circumferential velocities in the region below z = 65 mm, clearly indicating that the region is jet flow. Then, the cyclonic flow develops, and the circumferential velocity decreases. In the cyclonic flow region, the gas and the particle velocities approach and then reverse because the particles are subjected to strong centrifugal forces. In the range z = 0–30 mm, there is a difference between the estimation curve and the experimental results. This is caused by using the average mass and drag coefficient for each region when obtaining the estimation curve. In region (A), as shown in Figure 11a, there is a large change in circumferential velocity in contrast to the other regions. Moreover, in region (A), there are many particles with small diameters, as shown in Figure 7a. As a fundamental phenomenon observed in the present study, smaller particle size increases the drag force coefficient, as shown in Equation (12), followed by decreasing the mass of particles as the circumferential velocity increases. However, using the average values of drag coefficient and mass of particles causes some differences between the experimental results and estimation curve of circumferential velocity. This is due to the fact that estimated values tend to suppress rapid changes in gas velocity due to the decrease in drag coefficient and increase in the mass of particles. On the other hand, the estimation curve and the experimental results agree on the cyclonic flow region. This result indicates that the motion of the dry ice particles is dominated by the drag force from the CO2 gas flow.

4. Conclusions

In this study, as a preliminary step in applying dry ice separator-evaporator to refrigeration systems, a prototype visualization device for dry ice separators was built. Moreover, the size and velocity of dry ice particles were measured and analyzed using a high-speed camera. The results are summarized as follows:
  • After passing through the expansion valve, the high-pressure CO2 gas becomes a dry ice solid–gas two-phase flow, and the dry ice particles move on the inner wall by centrifugal force in the tapered channel of the cyclone separator-evaporator;
  • The largest number of dry ice particles generated at any location in the cyclone separation section had an equivalent diameter of 2.0 mm. It was found that a certain amount of initially formed smaller dry ice particles does not necessarily contribute to coalescence. As the inner diameter of the separation section decreased, the dry ice particles coalesced and grew from 4.0 mm to up to 40 mm in equivalent diameter. However, particles as small as 2.0 mm may flow out of the separator outlet by approximately half;
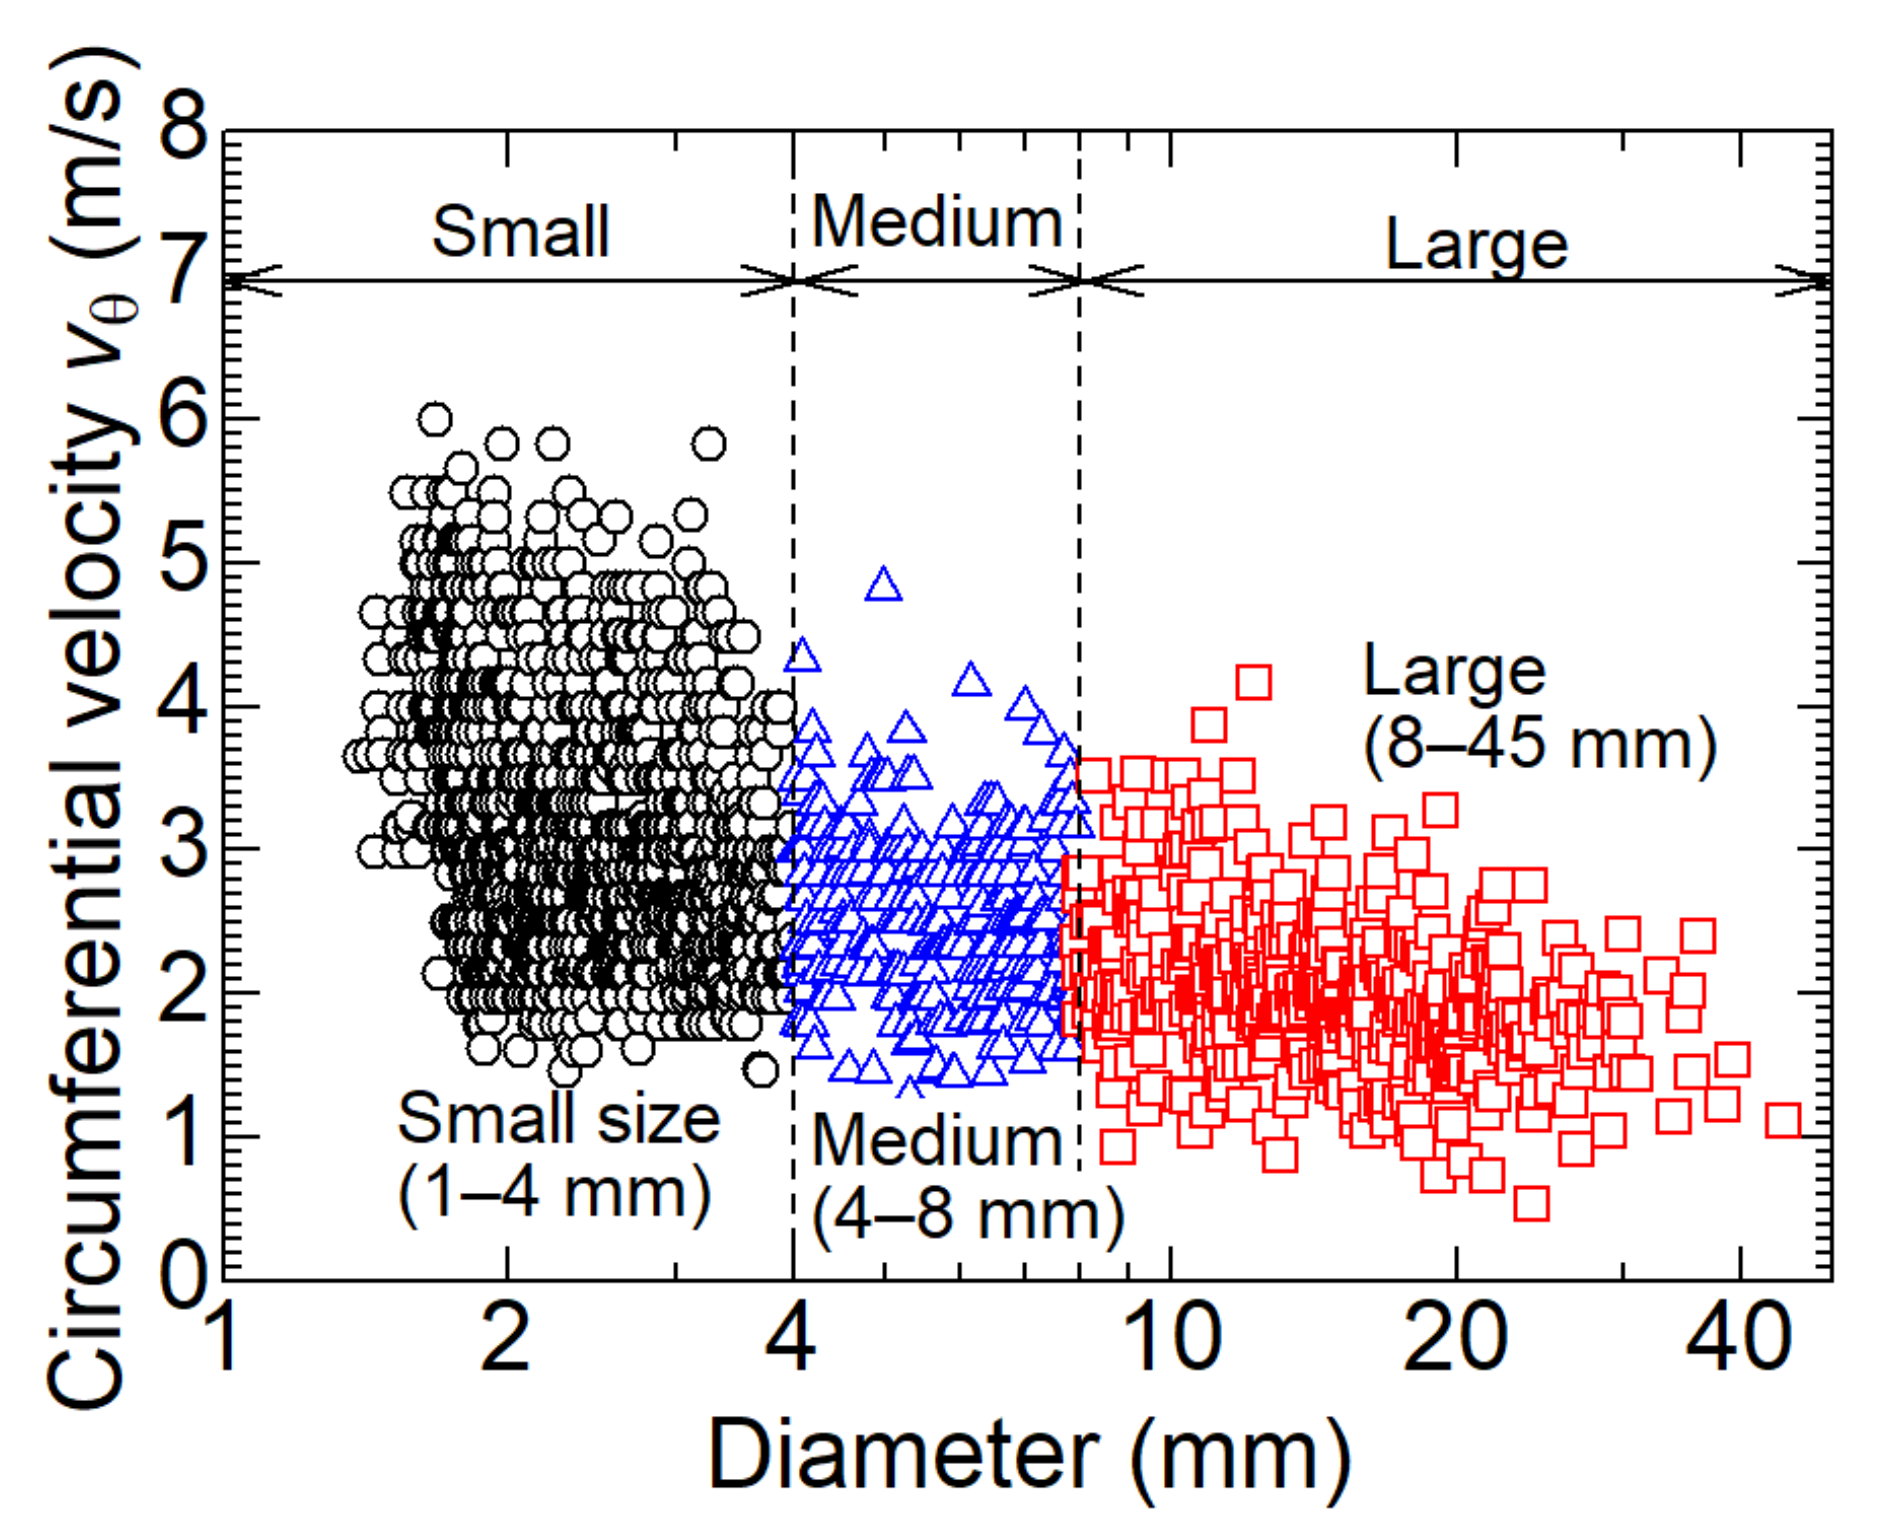
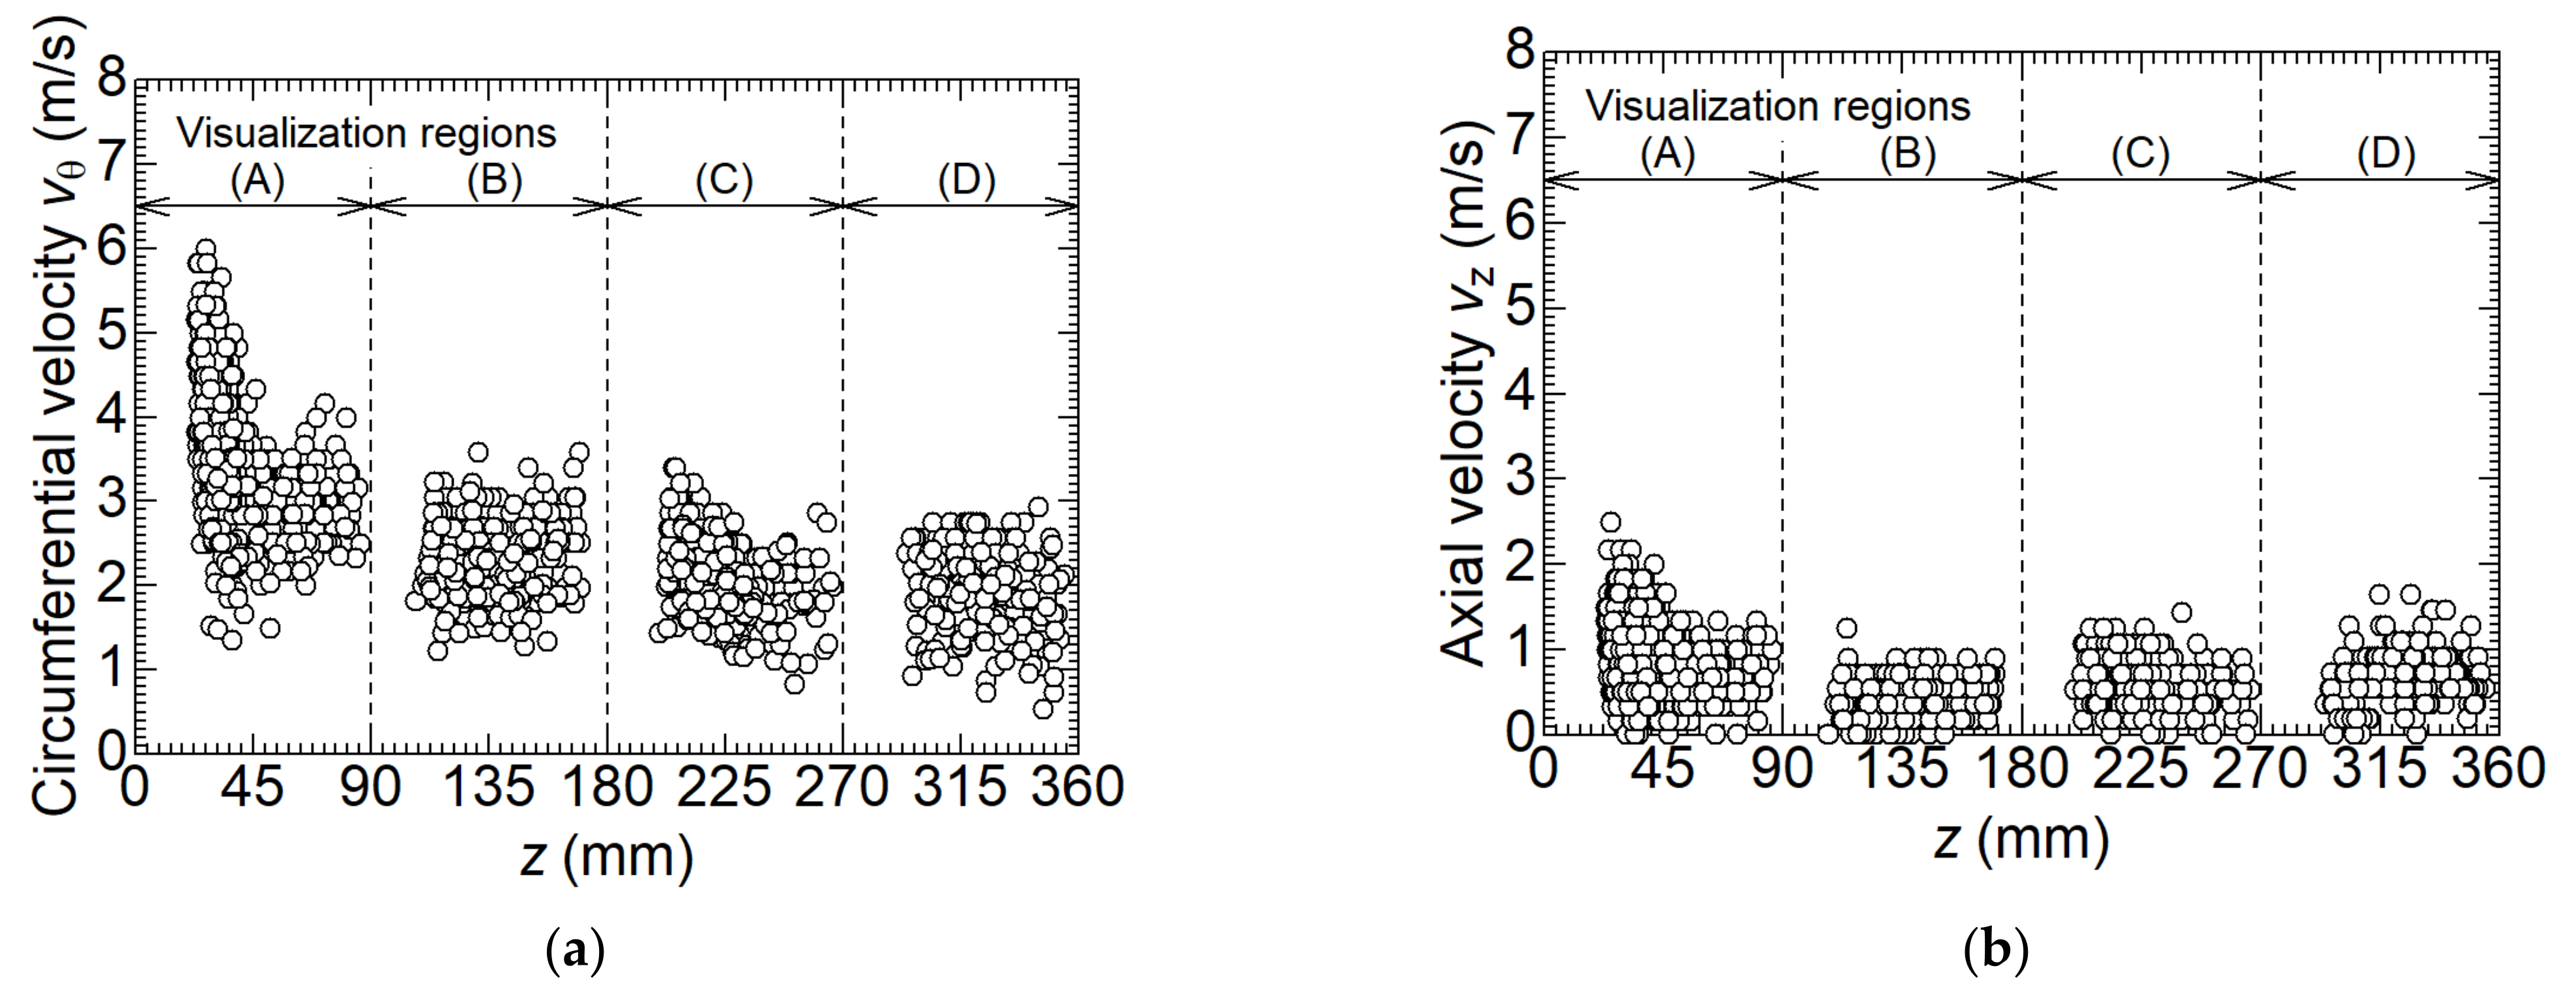
  • In the separation chamber, the circumferential velocity decreases with increasing dry ice particle size. This is due to the increase in drag force on the surrounding gas as the particle size increases. The receiving centrifugal force increases the size of particles. The grown dry ice particles split as the circumferential velocity distribution increases. In addition, in the middle of the separation chamber, there are areas of particle retention due to the balance of centrifugal force, the normal reaction force from the wall surface, and gravity acting on the particles, which contribute to an increase in particle size;
  • A particle motion model due to the drag force between CO2 gas and dry ice was formulated to compare the experimental and simulation results. The model showed good agreement with the experimental results, indicating that the drag force was dominant in the circumferential velocity of the dry ice particles;
  • The kinetic model identified in this study can be used to advanced design a cyclone separator-evaporator for dry ice particles. The heat extracted from the sublimation of dry ice can be estimated from the particle size distribution, which can be realized for a new evaporator design in future heat pump systems.

Author Contributions

Conceptualization, H.Y. (Haruhiko Yamasaki) and H.Y. (Hiroshi Yamaguchi); methodology, H.Y. (Haruhiko Yamasaki); formal analysis, H.Y. (Haruhiko Yamasaki); investigation, H.W.; resources, H.Y. (Haruhiko Yamasaki); data curation, H.Y. (Haruhiko Yamasaki), K.H. and T.K.; writing—original draft preparation, H.Y. (Haruhiko Yamasaki); writing—review and editing, K.H., T.K., P.N. and H.Y. (Hiroshi Yamaguchi); visualization, H.W.; supervision, P.N. and H.Y. (Hiroshi Yamaguchi); project administration, H.Y. (Hiroshi Yamaguchi); funding acquisition, P.N. and H.Y. (Hiroshi Yamaguchi). All authors have read and agreed to the published version of the manuscript.

Funding

This publication has been funded by HighEFF-Centre for an Energy Efficient and Competitive Industry for the Future. The authors gratefully acknowledge the financial support from the Research Council of Norway and user partners of HighEFF (Centre for Environment-friendly Energy Research, 257632/E20).

Institutional Review Board Statement

Not applicable.

Informed Consent Statement

Not applicable.

Data Availability Statement

Data are contained within the article.

Acknowledgments

The authors would like to thank K. Kakuda, undergraduate student, and Y. Ishikawa, graduate student, at Doshisha University, for their help in conducting the experiments.

Conflicts of Interest

The authors declare no conflict of interest.

Nomenclature

CO2Carbon dioxide
HCFCsHydrochlorofluorocarbons
HCFsHydrofluorocarbons
SSTShear-stress transport
cNumber of particles at each particle size
c p ¯ Average drag coefficient
DaveAverage particle diameter
EEnergy
gGravitational acceleration
iHorizontal pixel number
jVertical pixel number
LCircumferential movement distance
m ¯ Average mass of particles
nNumber of particle sizes
pPressure
PcSaturated pressure of CO2
RGas constant
rgPixel center position
rpPixel coordinates
RsSwirl radius
SpProjection is of dry ice particles
TTemperature
TcSaturated temperature of CO2
uVelocity vector of CO2 gas phase
VVolume
vzAxial velocity of dry ice particles
vθCircumferential velocity of dry ice particles
vθ,gasCircumferential velocity of gas phase calculated by simulation
wVariable that distinguishes between particles and non-particle
θAngle between the particle centers of the dry ice particles in each frame
λThermal conductivity
μViscosity of CO2 gas phase
ρDensity of CO2 gas phase
ΨDDissipation loss

References

  1. Tsai, W.T. An overview of environmental hazards and exposure risk of hydrofluorocarbons (HFCs). Chemosphere 2005, 61, 1539–1547. [Google Scholar] [CrossRef]
  2. Norman, C.; DeCanio, S.; Fan, L. The Montreal Protocol at 20: Ongoing opportunities for integration with climate protection. Glob. Environ. Change 2008, 18, 330–340. [Google Scholar] [CrossRef]
  3. Harby, K. Hydrocarbons and their mixtures as alternatives to environmental unfriendly halogenated refrigerants: An updated overview. Renew. Sustain. Energy Rev. 2017, 73, 1247–1264. [Google Scholar] [CrossRef]
  4. Velders, G.J.M.; Fahey, D.W.; Daniel, J.S.; Andersen, S.O.; McFarland, M. Future atmospheric abundances and climate forcings from scenarios of global and regional hydrofluorocarbon (HFC) emissions. Atmos. Environ. 2015, 123, 200–209. [Google Scholar] [CrossRef]
  5. Lorentzen, G. The use of natural refrigerants: A complete solution to the CFC/HCFC predicament. Int. J. Refrig. 1995, 18, 190–197. [Google Scholar] [CrossRef]
  6. Bamigbetan, O.; Eikevik, T.M.; Nekså, P.; Bantle, M. Review of vapour compression heat pumps for high temperature heating using natural working fluid. Int. J. Refrig. 2017, 80, 197–211. [Google Scholar] [CrossRef]
  7. Lorentzen, G. Revival of carbon dioxide as a refrigerant. Int. J. Refrig. 1994, 17, 292–301. [Google Scholar] [CrossRef]
  8. Rony, R.U.; Yang, H.; Krishnan, S.; Song, J. Recent advances in transcritical CO2 (R774) heat pump system: A review. Energies 2019, 12, 457. [Google Scholar] [CrossRef] [Green Version]
  9. Gullo, P.; Hafner, A.; Banasiak, K. Transcritical R744 refrigeration systems for supermarket applications: Current status and future perspectives. Int. J. Refrig. 2018, 93, 269–310. [Google Scholar] [CrossRef]
  10. Feng, F.; Zhang, Z.; Liu, X.; Liu, C.; Hou, Y. The Influence of internal heat exchanger on the performance of transcritical CO2 water source heat pump water heater. Energies 2020, 13, 1787. [Google Scholar] [CrossRef] [Green Version]
  11. Flores, J.M.B.; García, V.P.; Yudonago, J.F.I.; Muñoz, J.L.R.; Minguela, J.J.R. General aspects of carbon dioxide as a refrigerant. J. Energy South. Afr. 2014, 25, 96–106. [Google Scholar] [CrossRef] [Green Version]
  12. Yilmaz, B.; Mancuhan, E.; Erdonmez, N. A parametric study on a subcritical CO2/NH3 cascade Refrigeration system for low temperature applications. ASME J. Energy Resour. Technol. 2018, 140, 092004. [Google Scholar] [CrossRef]
  13. Aminyavari, M.; Najafi, B.; Shirazi, A.; Rinaldi, F. Exergetic, economic and environmental (3E) analyses, and multi-objective optimization of a CO2/NH3 cascade refrigeration system. Appl. Therm. Eng. 2014, 65, 42–50. [Google Scholar] [CrossRef]
  14. Gholamian, E.; Hanafizadeh, P.; Ahmadi, P. Advanced exergy analysis of a carbon dioxide ammonia cascade refrigeration system. Appl. Therm. Eng. 2018, 137, 689–699. [Google Scholar] [CrossRef]
  15. Bansal, P. A review—Status of CO2 as a low temperature refrigerant: Fundamentals and R&D opportunities. Appl. Therm. Eng. 2012, 41, 18–29. [Google Scholar]
  16. Huang, D.; Ding, G.; Quack, H. New refrigeration system using CO2 vapor-solid as refrigerant. Front. Energy Power Eng. China 2008, 2, 494–498. [Google Scholar] [CrossRef]
  17. Liu, Y.H.; Maruyama, H.; Matsusaka, S. Agglomeration process of dry ice particles produced by expanding liquid carbon dioxide. Adv. Powder Technol. 2010, 21, 652–657. [Google Scholar] [CrossRef] [Green Version]
  18. Liu, Y.H.; Calvert, G.; Hare, C.; Ghadiri, M.; Matsusaka, S. Size measurement of dry ice particles produced from liquid carbon dioxide. J. Aerosol. Sci. 2012, 48, 1–9. [Google Scholar] [CrossRef] [Green Version]
  19. Yamaguchi, H.; Zhang, X.R. A novel CO2 refrigeration system achieved by CO2 solid-gas two-phase fluid and its basic study on system performance. Int. J. Refrig. 2009, 32, 1683–1693. [Google Scholar] [CrossRef]
  20. Yamaguchi, H.; Niu, X.D.; Sekimoto, K.; Nekså, P. Investigation of dry ice blockage in an ultra-low temperature cascade refrigeration system using CO2 as a working fluid. Int. J. Refri. 2011, 34, 466–475. [Google Scholar] [CrossRef]
  21. Yamasaki, H.; Yamaguchi, H.; Hattori, K.; Nekså, P. Experimental observation of CO2 dry-ice behavior in an evaporator/sublimator. Energy Procedia 2017, 143, 375–380. [Google Scholar] [CrossRef]
  22. Yamasaki, H. Boiling flow and heat transfer of CO2 in an evaporator. In Transcritical CO2 Heat Pump: Fundamentals and Applications; Zhang, X.R., Yamaguchi, H., Eds.; John Wiley & Sons Inc.: New York, NY, USA, 2021. [Google Scholar]
  23. Yamasaki, H.; Önder, K.; Yamaguchi, H.; Kamimura, T.; Hattori, K.; Nekså, P. Experimental investigation of dry ice cyclone separator for ultra-low temperature energy storage using carbon dioxide. Energy Storage 2020, 2, e149. [Google Scholar] [CrossRef]
  24. OpenCV. Available online: https://opencv.org/ (accessed on 17 May 2022).
  25. Hoekstra, A.J.; Derksen, J.J.; Van Den Akker, H.E.A. An experimental and numerical study of turbulent swirling fliw in gas cyclones. Chem. Eng. Sci. 1999, 54, 2055–2065. [Google Scholar] [CrossRef] [Green Version]
  26. Sterczynska, M.; Stachnik, M.; Poreda, A.; Piepiórka-Stepuk, J.; Zdaniewicz, M.; Jakubowski, M. The improvement of flow conditions in a whirlpool with a modified bottom: An experimental study based on particle image velocimetry (PIV). J. Food Eng. 2021, 289, 110164. [Google Scholar] [CrossRef]
  27. Zhao, B.; Su, Y.; Zhang, J. Simulation of gas flow patter and separation efficiency in cyclone with conventional single and spiral double inlet configuration. Chem. Eng. Res. Des. 2006, 84, 1158–1165. [Google Scholar] [CrossRef]
  28. Redlich, O.; Kwong, J.N.S. On the thermodynamics of solutions. V. An equation of state. Fugacities of gaseous solutions. Chem. Rev. 1949, 44, 233–244. [Google Scholar] [CrossRef]
  29. Stachnik, M.; Jalubowski, M. Multiphase model of flow and separation phases in a whirlpool: Advanced simulation and phenomena visualization approach. J. Food Eng. 2020, 274, 109846. [Google Scholar] [CrossRef]
  30. Chlebnikovas, A.; Kilikevičius, A.; Selech, J.; Matijošius, J.; Kilikevičienė, K.; Vainorius, D.; Passerini, G.; Marcinkiewicz, J. The Numerical Modeling of Gas Movement in a Single Inlet New Generation Multi-Channel Cyclone Separator. Energies 2021, 14, 8092. [Google Scholar] [CrossRef]
Figure 1. Schematic of the experimental setup of CO2 cyclone separator-evaporator.
Energies 15 04128 g001
Figure 2. Schematic detailed view of the CO2 cyclone separator-evaporator.
Energies 15 04128 g002
Figure 3. Images during the image processing: (a) cyclone separator-evaporator without dry ice particles; (b) cyclone separator-evaporator with dry ice particles; (c) dry ice particles after filtering light reflection; (d) binarized image of targeted particle.
Energies 15 04128 g003
Figure 4. Diagram of the circumferential distance correction of the dry ice particles between images.
Energies 15 04128 g004
Figure 5. Three-dimensional flow field configuration and schematic diagram of the model.
Energies 15 04128 g005
Figure 6. Computational grids and cells for the numerical calculations (total of 391,720 cells).
Energies 15 04128 g006
Figure 7. Particle size distribution with cumulative distribution: (a) in visualization region (A); (b) in visualization region (B); (c) in visualization region (C); (d) in visualization region (D).
Energies 15 04128 g007
Figure 8. Mode, median, and number average diameter in the visualization regions (A)–(D).
Energies 15 04128 g008
Figure 9. Time-dependent circumferential velocity vθ: (a) in visualization region (A); (b) in visualization region (B); (c) in visualization region (C); (d) in visualization region (D).
Energies 15 04128 g009
Figure 10. Relationship between the particle diameter and the circumferential velocity vθ.
Energies 15 04128 g010
Figure 11. Variations in particle velocities along the z-axis: (a) circumferential velocity vθ; (b) axial velocity vz.
Energies 15 04128 g011
Figure 12. Variations in estimated and experimental circumferential velocity vθ and simulated gas velocity along the z-axis.
Energies 15 04128 g012
Publisher’s Note: MDPI stays neutral with regard to jurisdictional claims in published maps and institutional affiliations.

