
A Comprehensive Electric Vehicle Model for Vehicle-to-Grid Strategy Development

 , , , , and
Abstract
:
1. Introduction
- (a)
- Electro-thermal model of an EV battery pack
- (b)
- Traction battery break-down (materials, volume and weight distribution)
- (c)
- Accelerated cycle and calendar aging tests of EV battery cell
- (d)
- Efficiency measurements of the on-board charger
- (e)
- Parameterization of the control of the charging process according to IEC 61851-1
Literature Review
2. Methodology
2.1. Electric Vehicle Model
- Traction battery model
- (a)
- General (Section 2.1.1)
- (b)
- Electrical model (Section 2.1.2 and Section 3.1))
- (c)
- Thermal model and traction battery pack materials, volume and weight distributions (Section 2.1.3 and Section 3.2)
- (d)
- Aging model (Section 2.1.4 and Section 3.3)
- BMS and charger model (Section 2.2 and Section 3.5)
- (a)
- Charger efficiency
- (b)
- Charging control model
2.1.1. Traction Battery
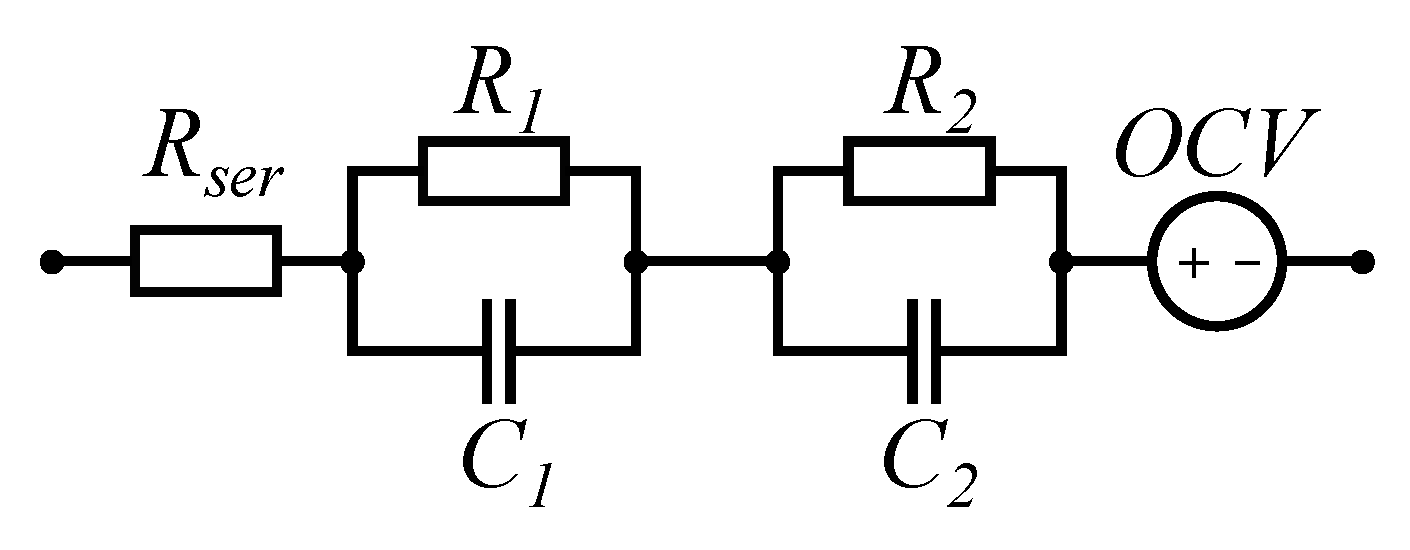
2.1.2. Electrical Model
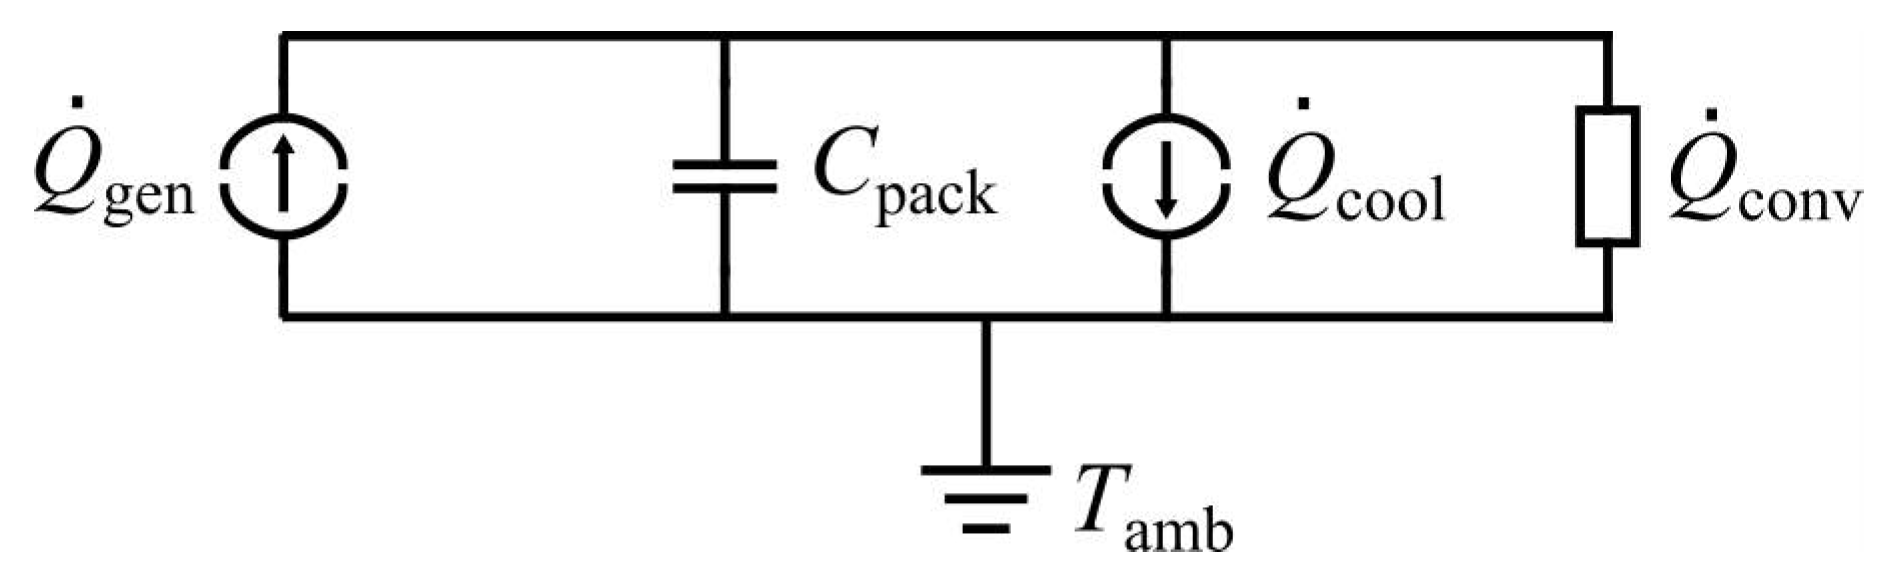
2.1.3. Thermal Model
- is the irreversible ohmic heat generation,
- is the reversible heat generation due to the intercalation and deintercalation of ions at the electrodes,
- is the heat generation due to side reactions of the electrolyte with the electrodes (i.e., phase changes) and
- is the heat generation associated to the relaxation of concentration profiles.
2.1.4. Aging Tests
Calendar Aging
Cycle Aging
2.2. Charger and BMS Charge Control
3. Results
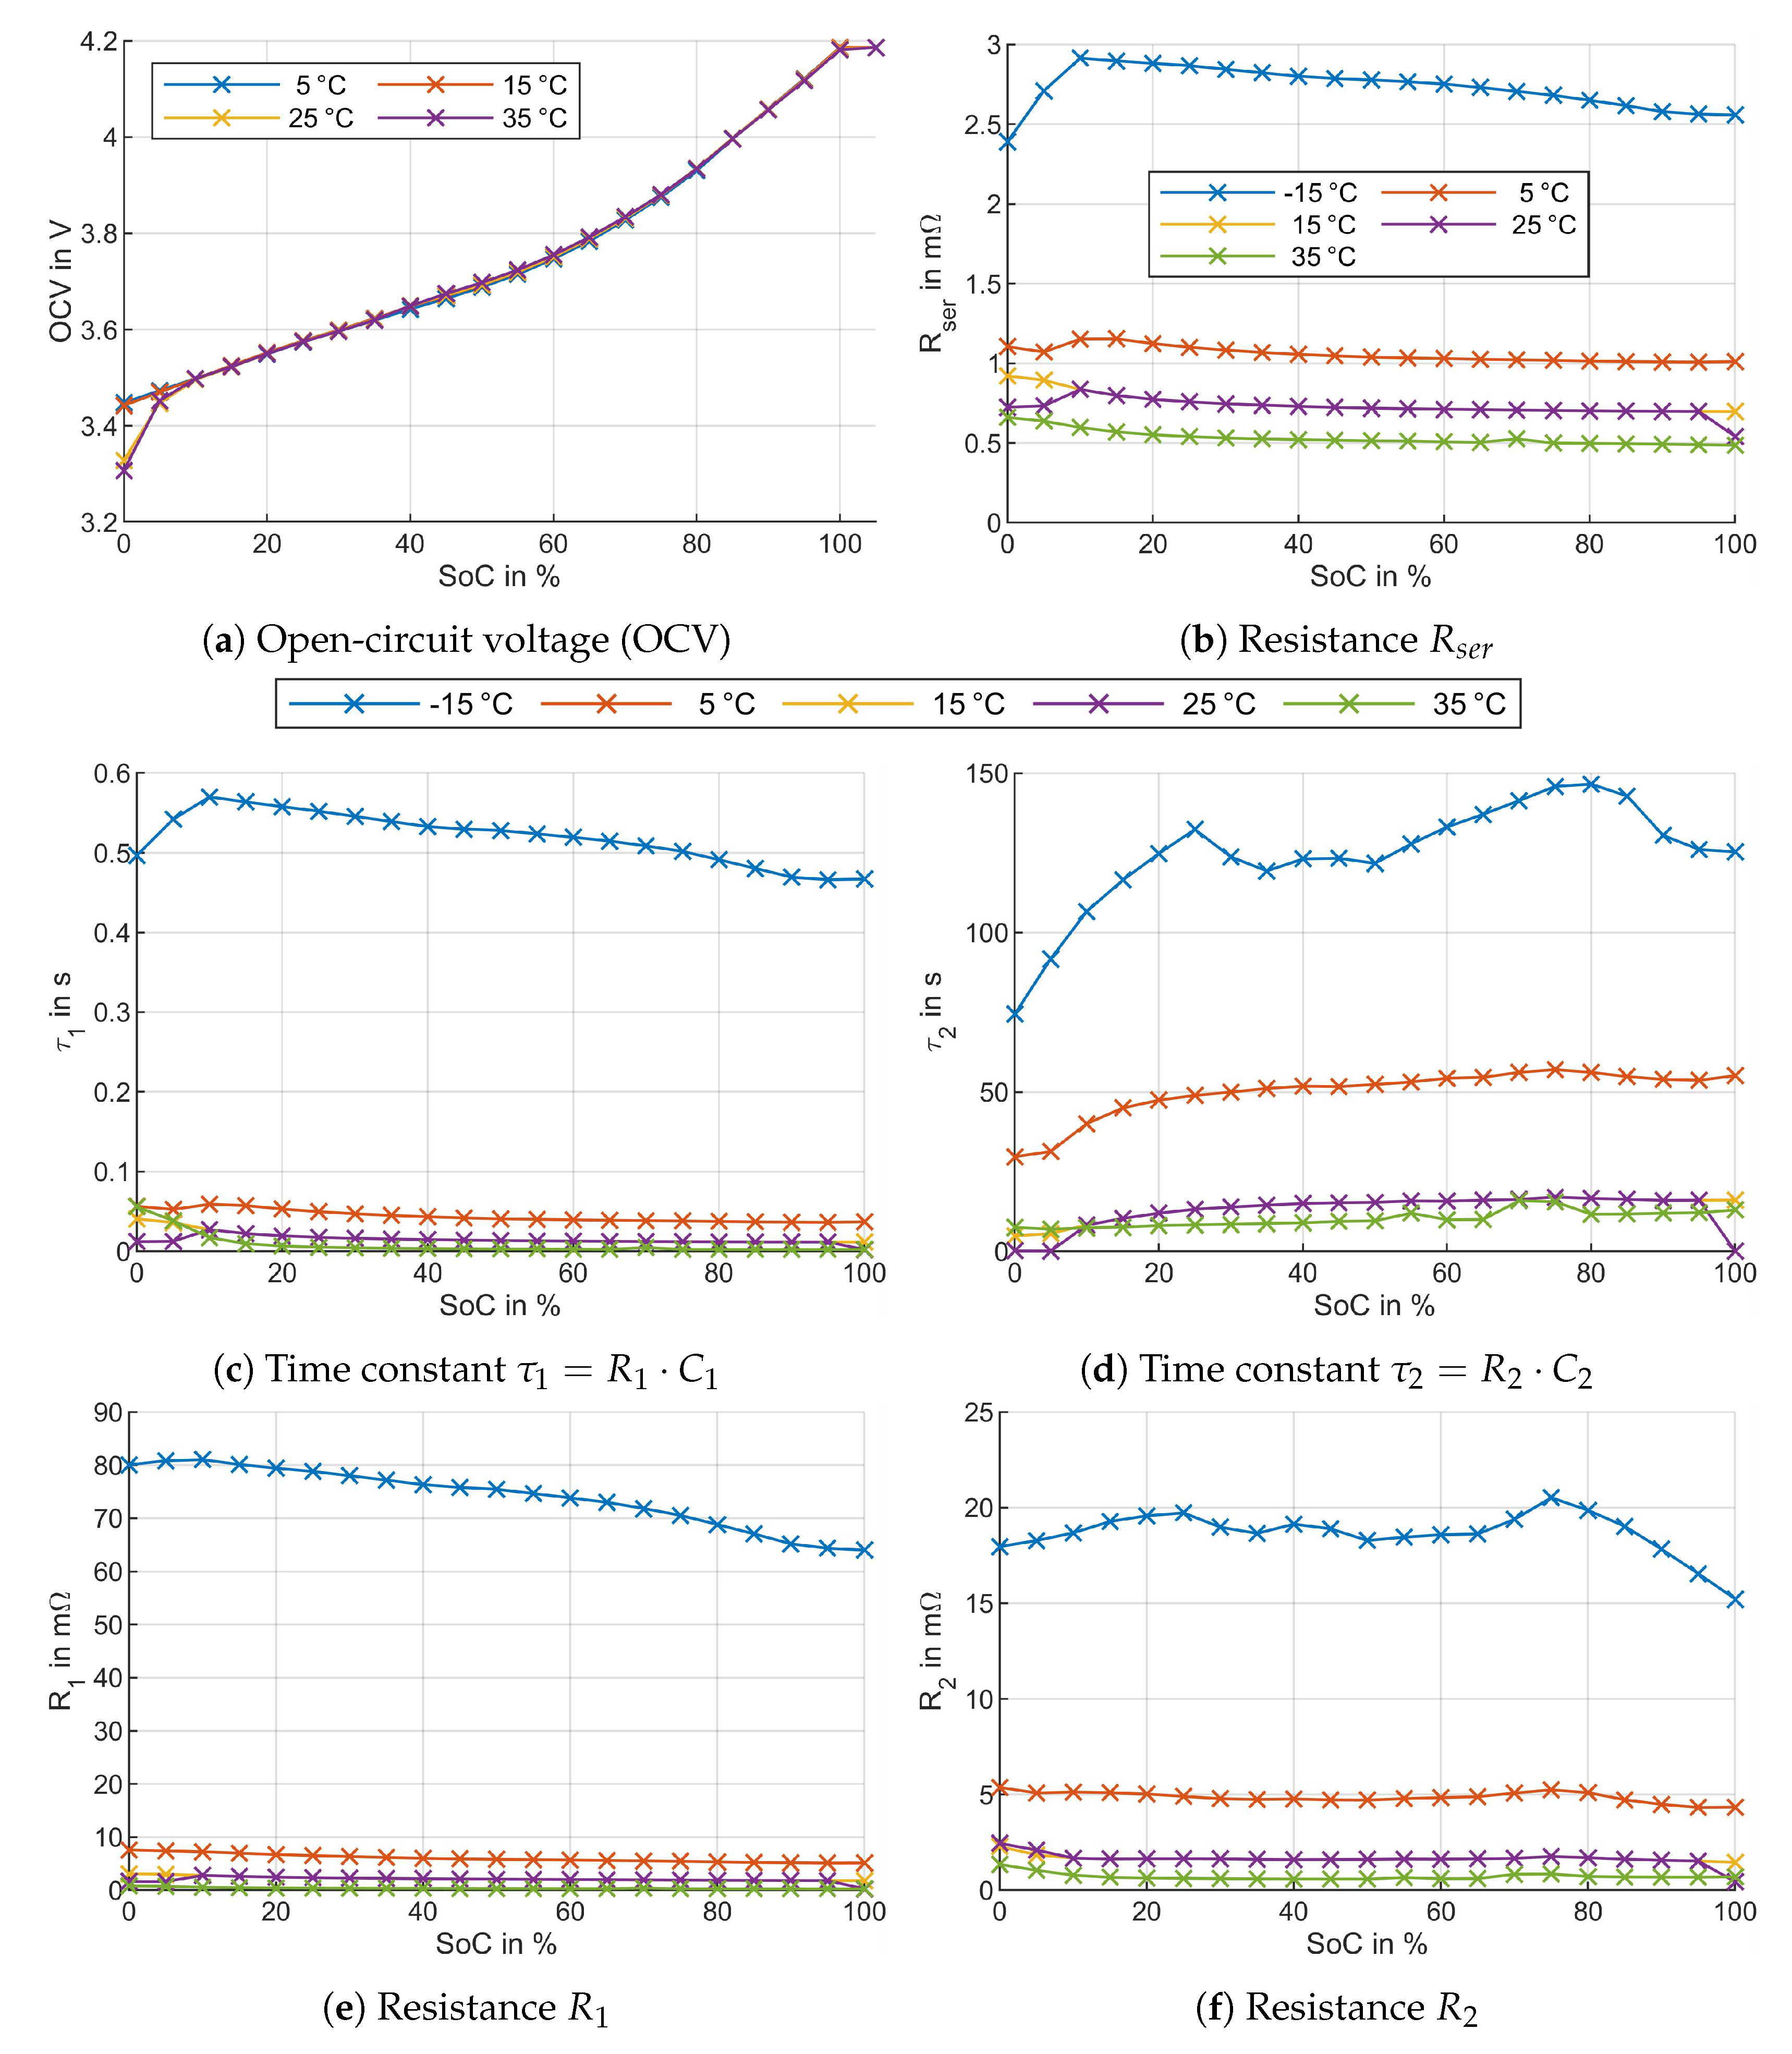
3.1. Electrical Model Parameters
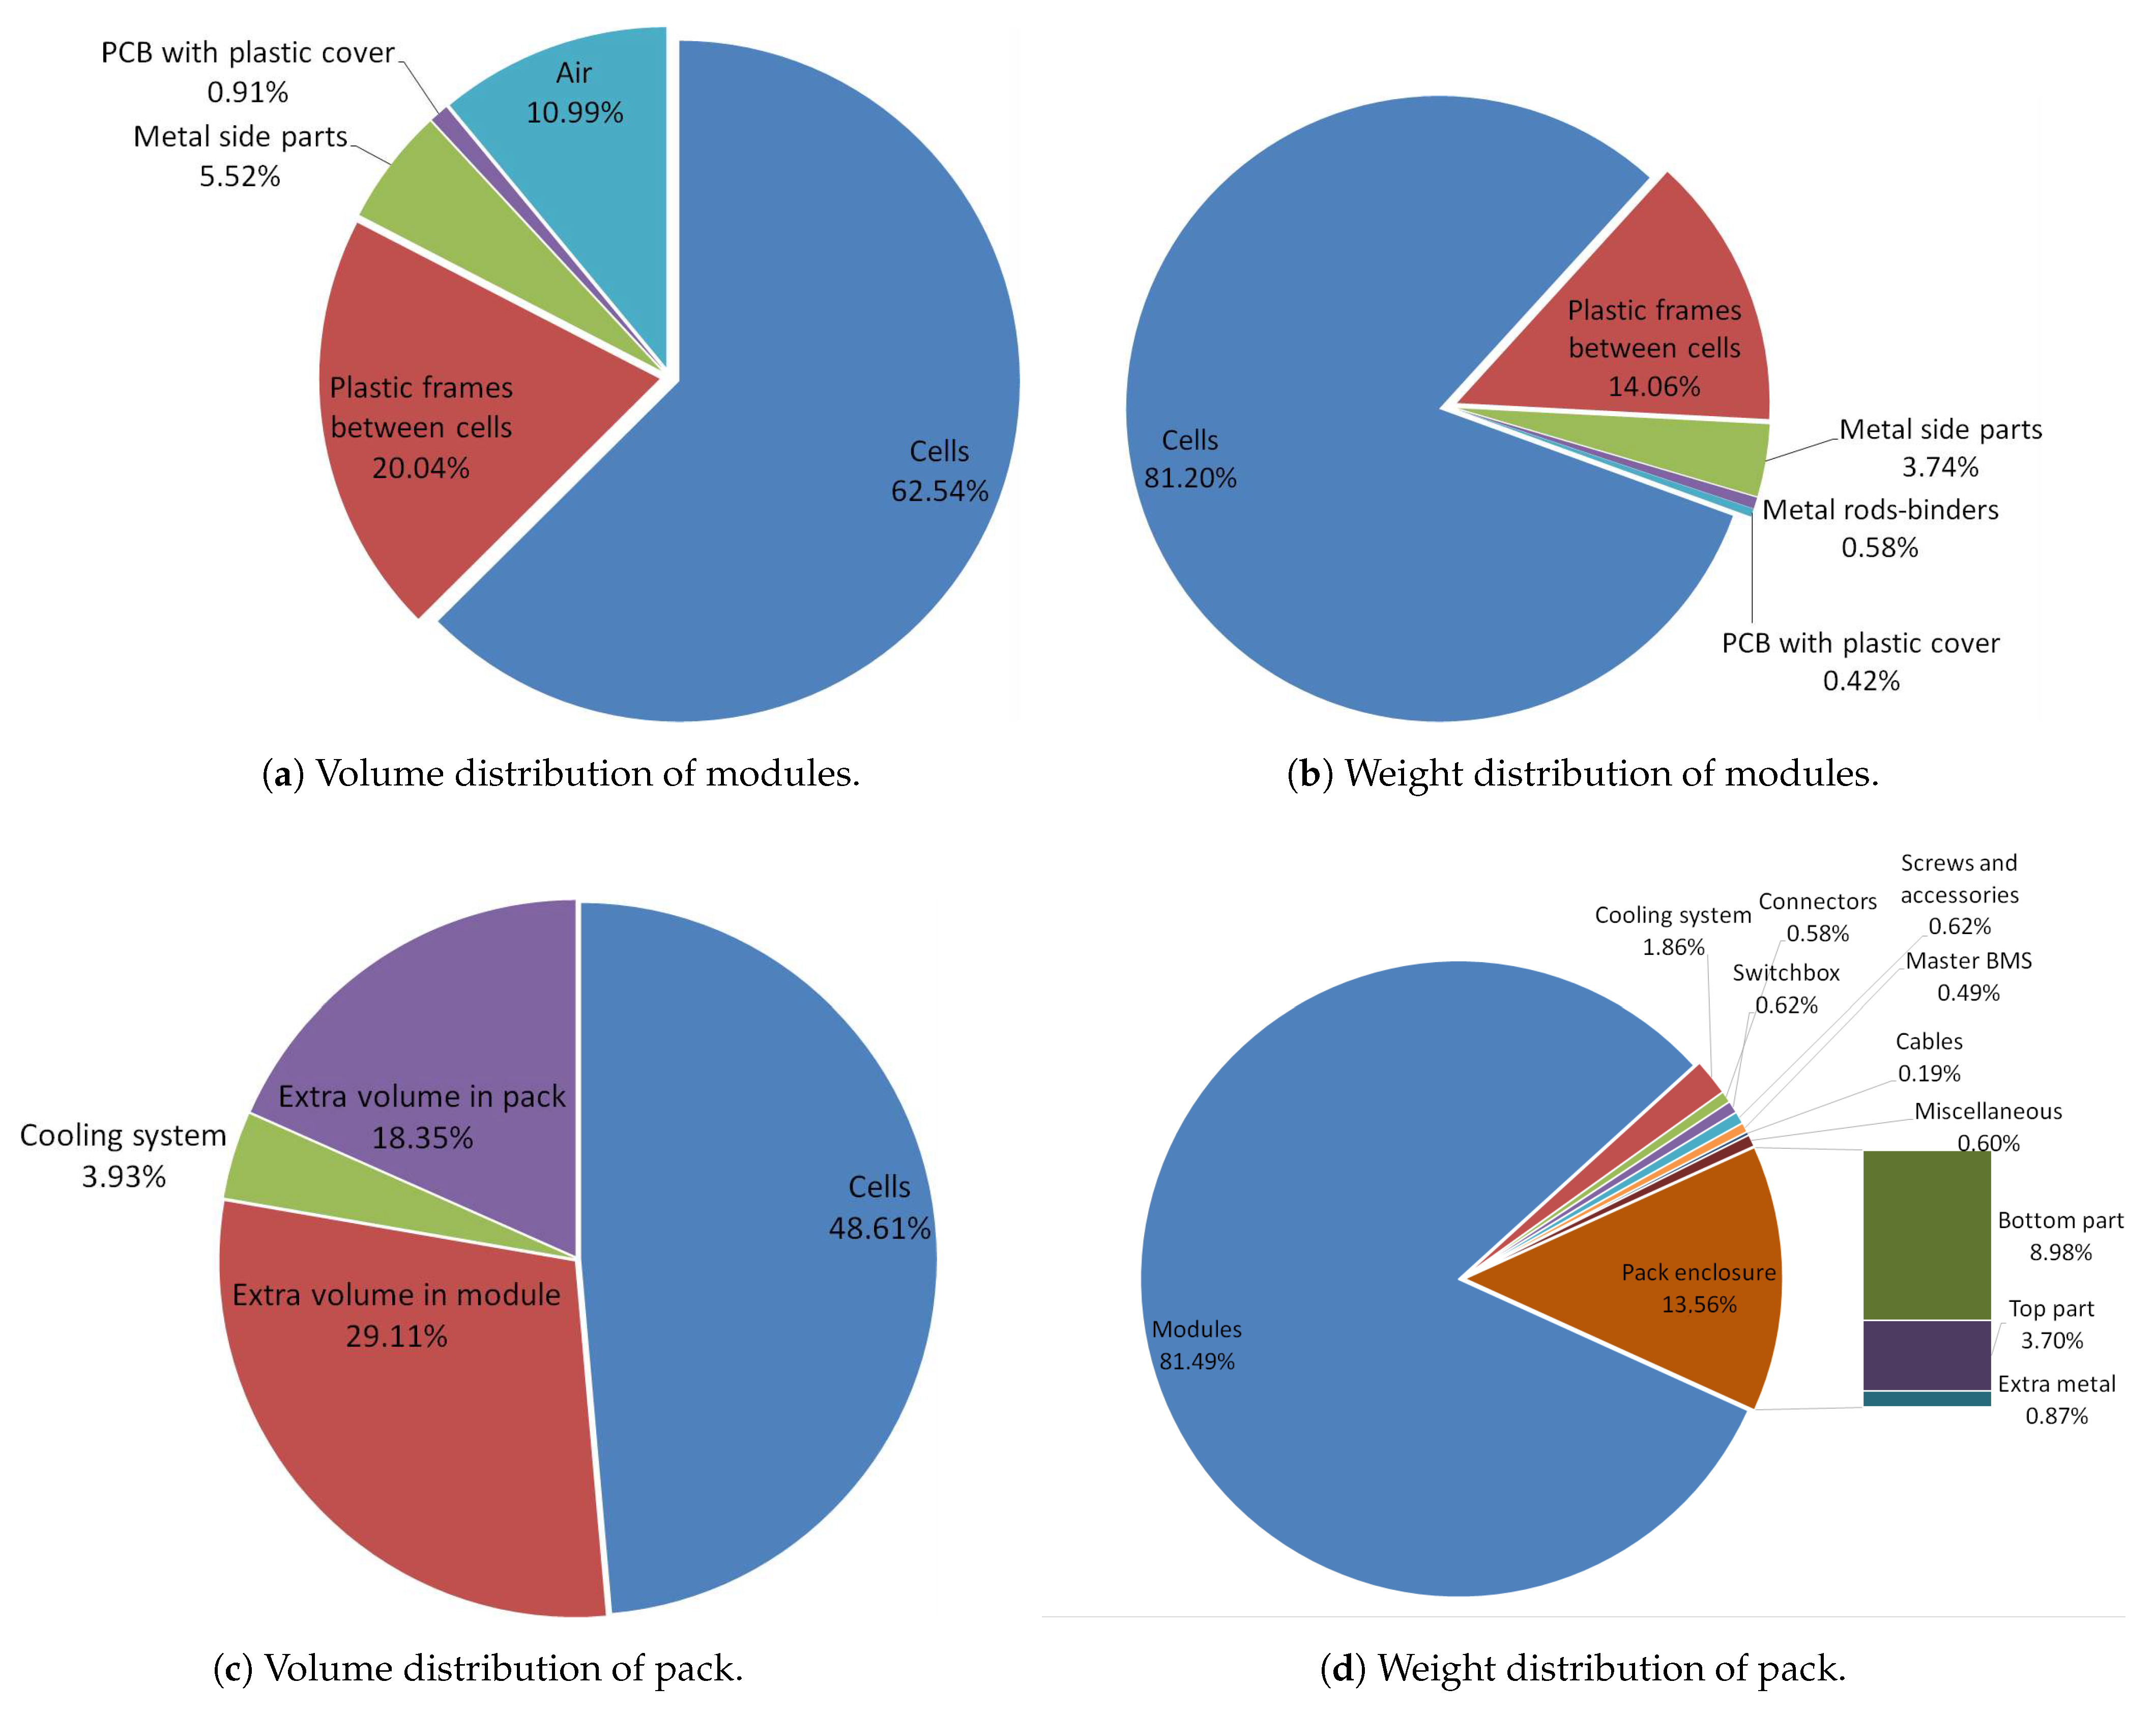
3.2. Thermal Model Parameters
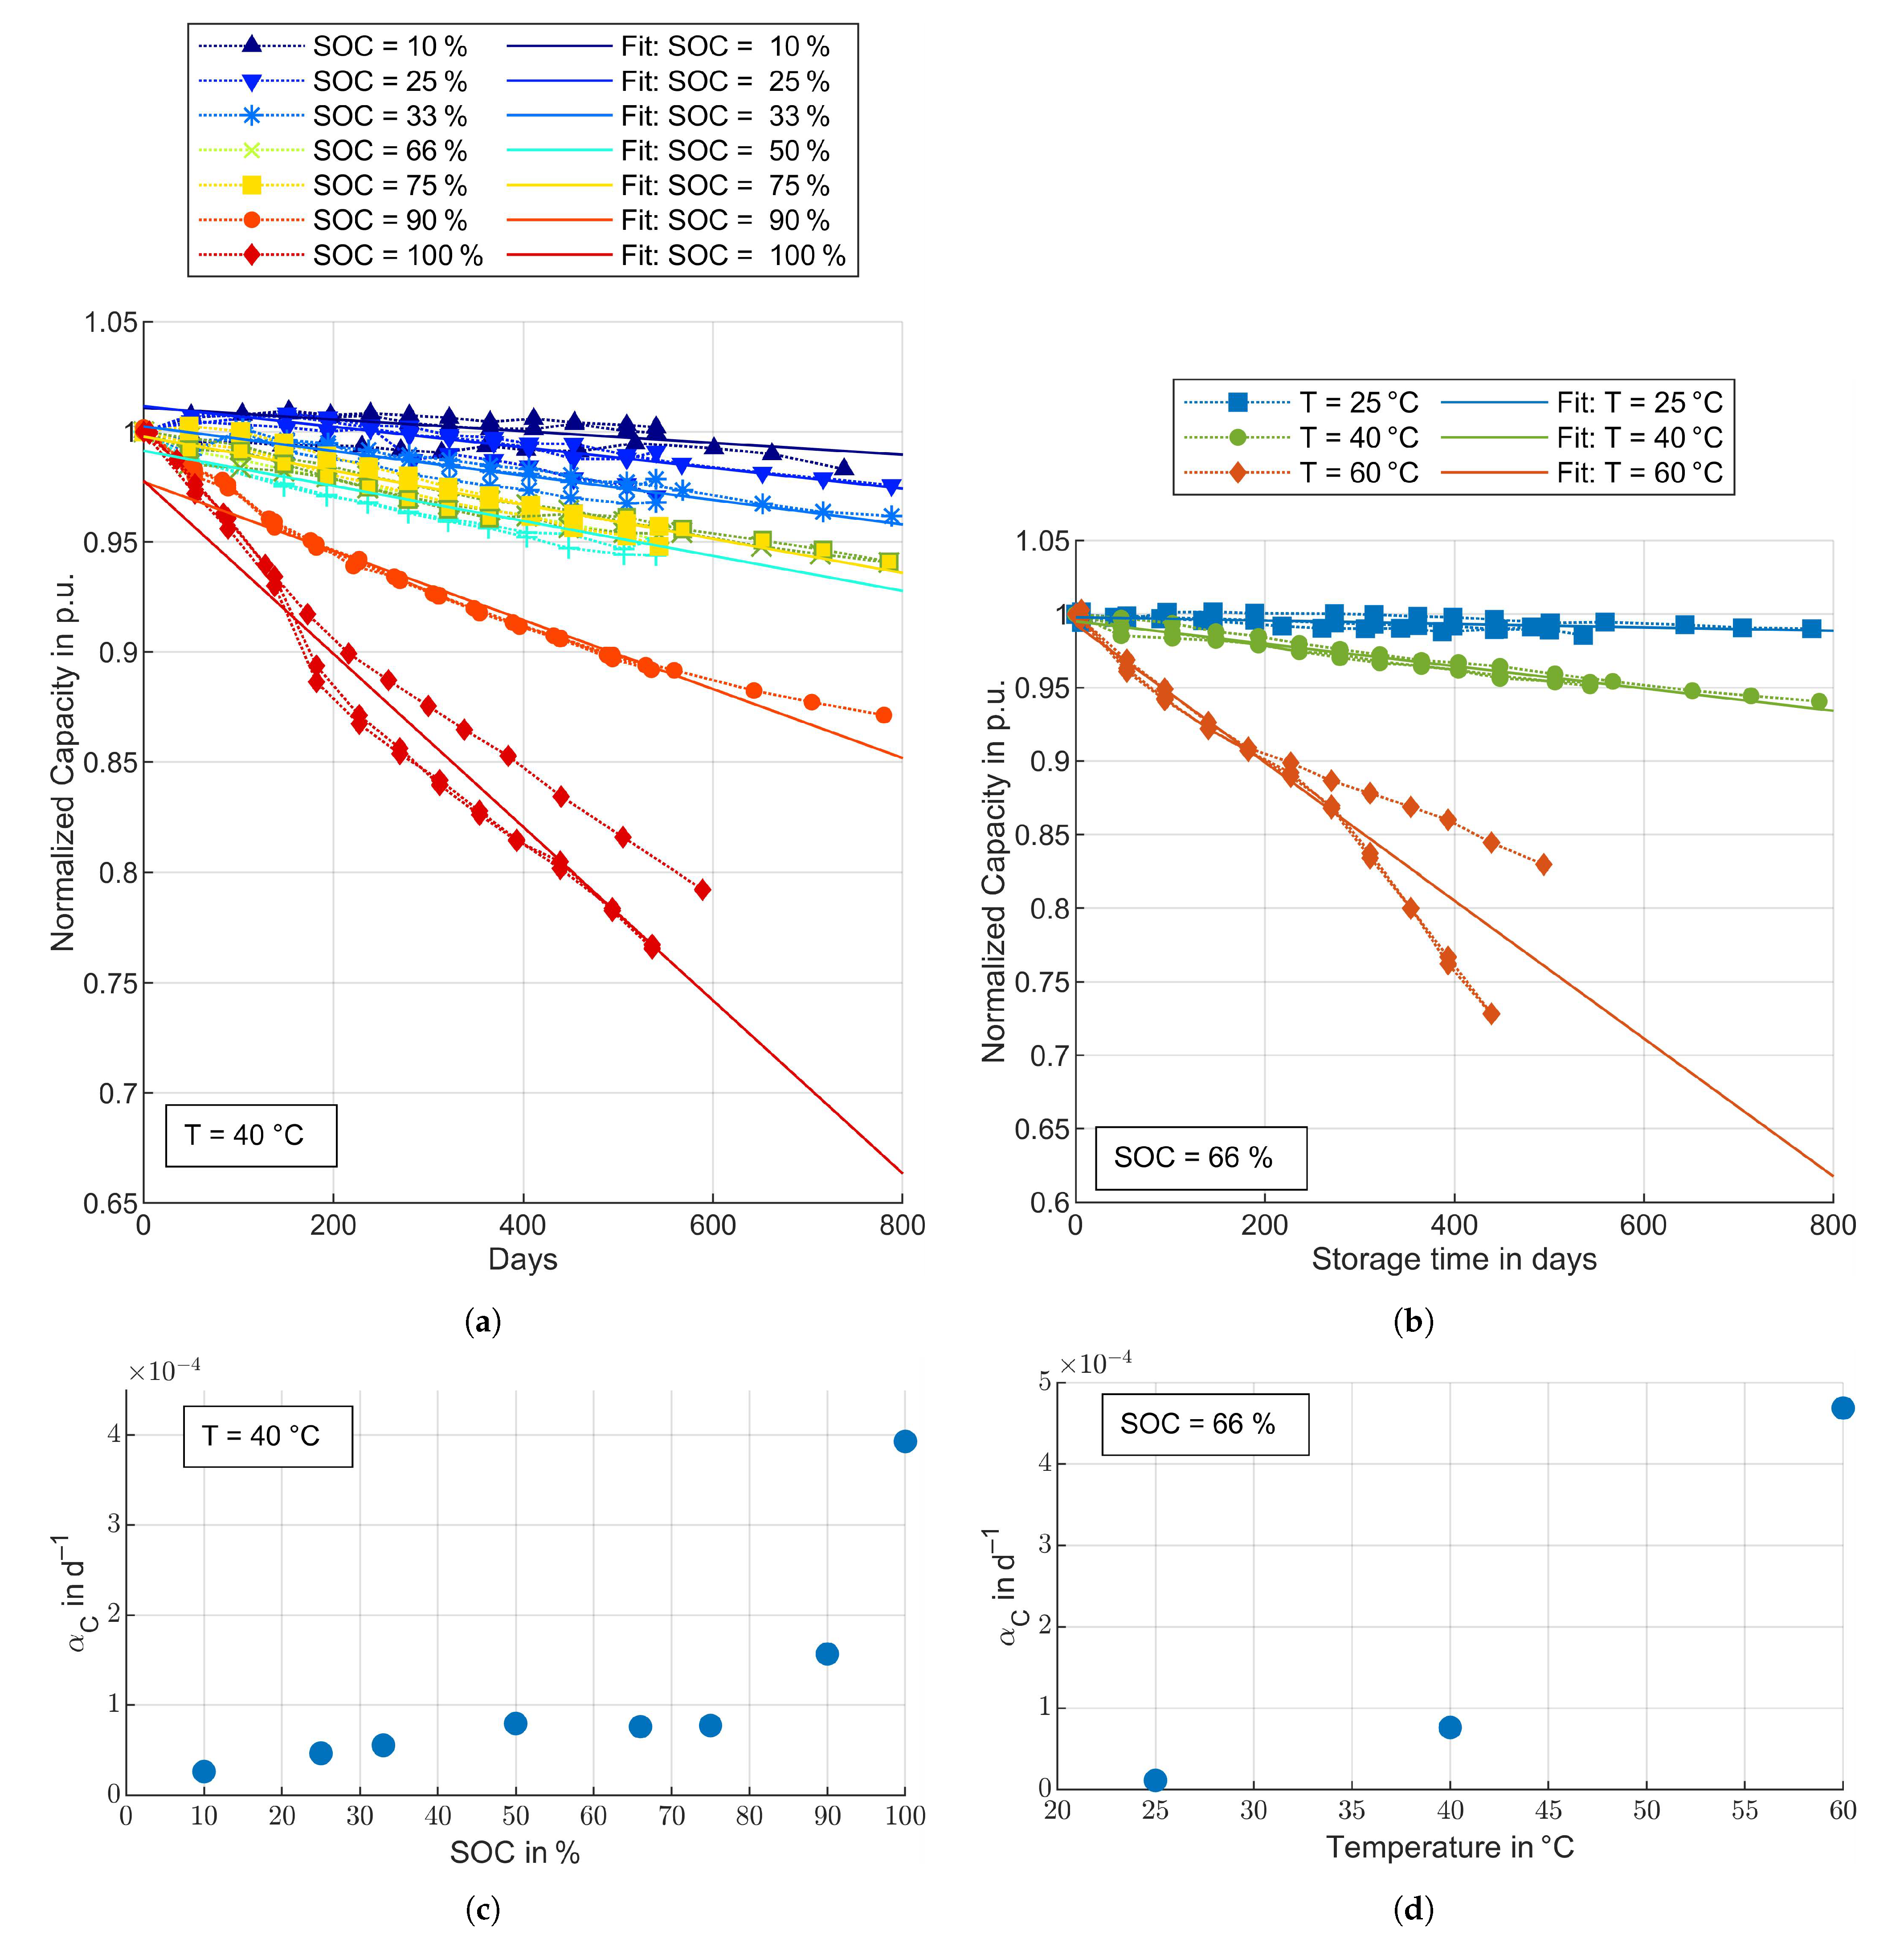
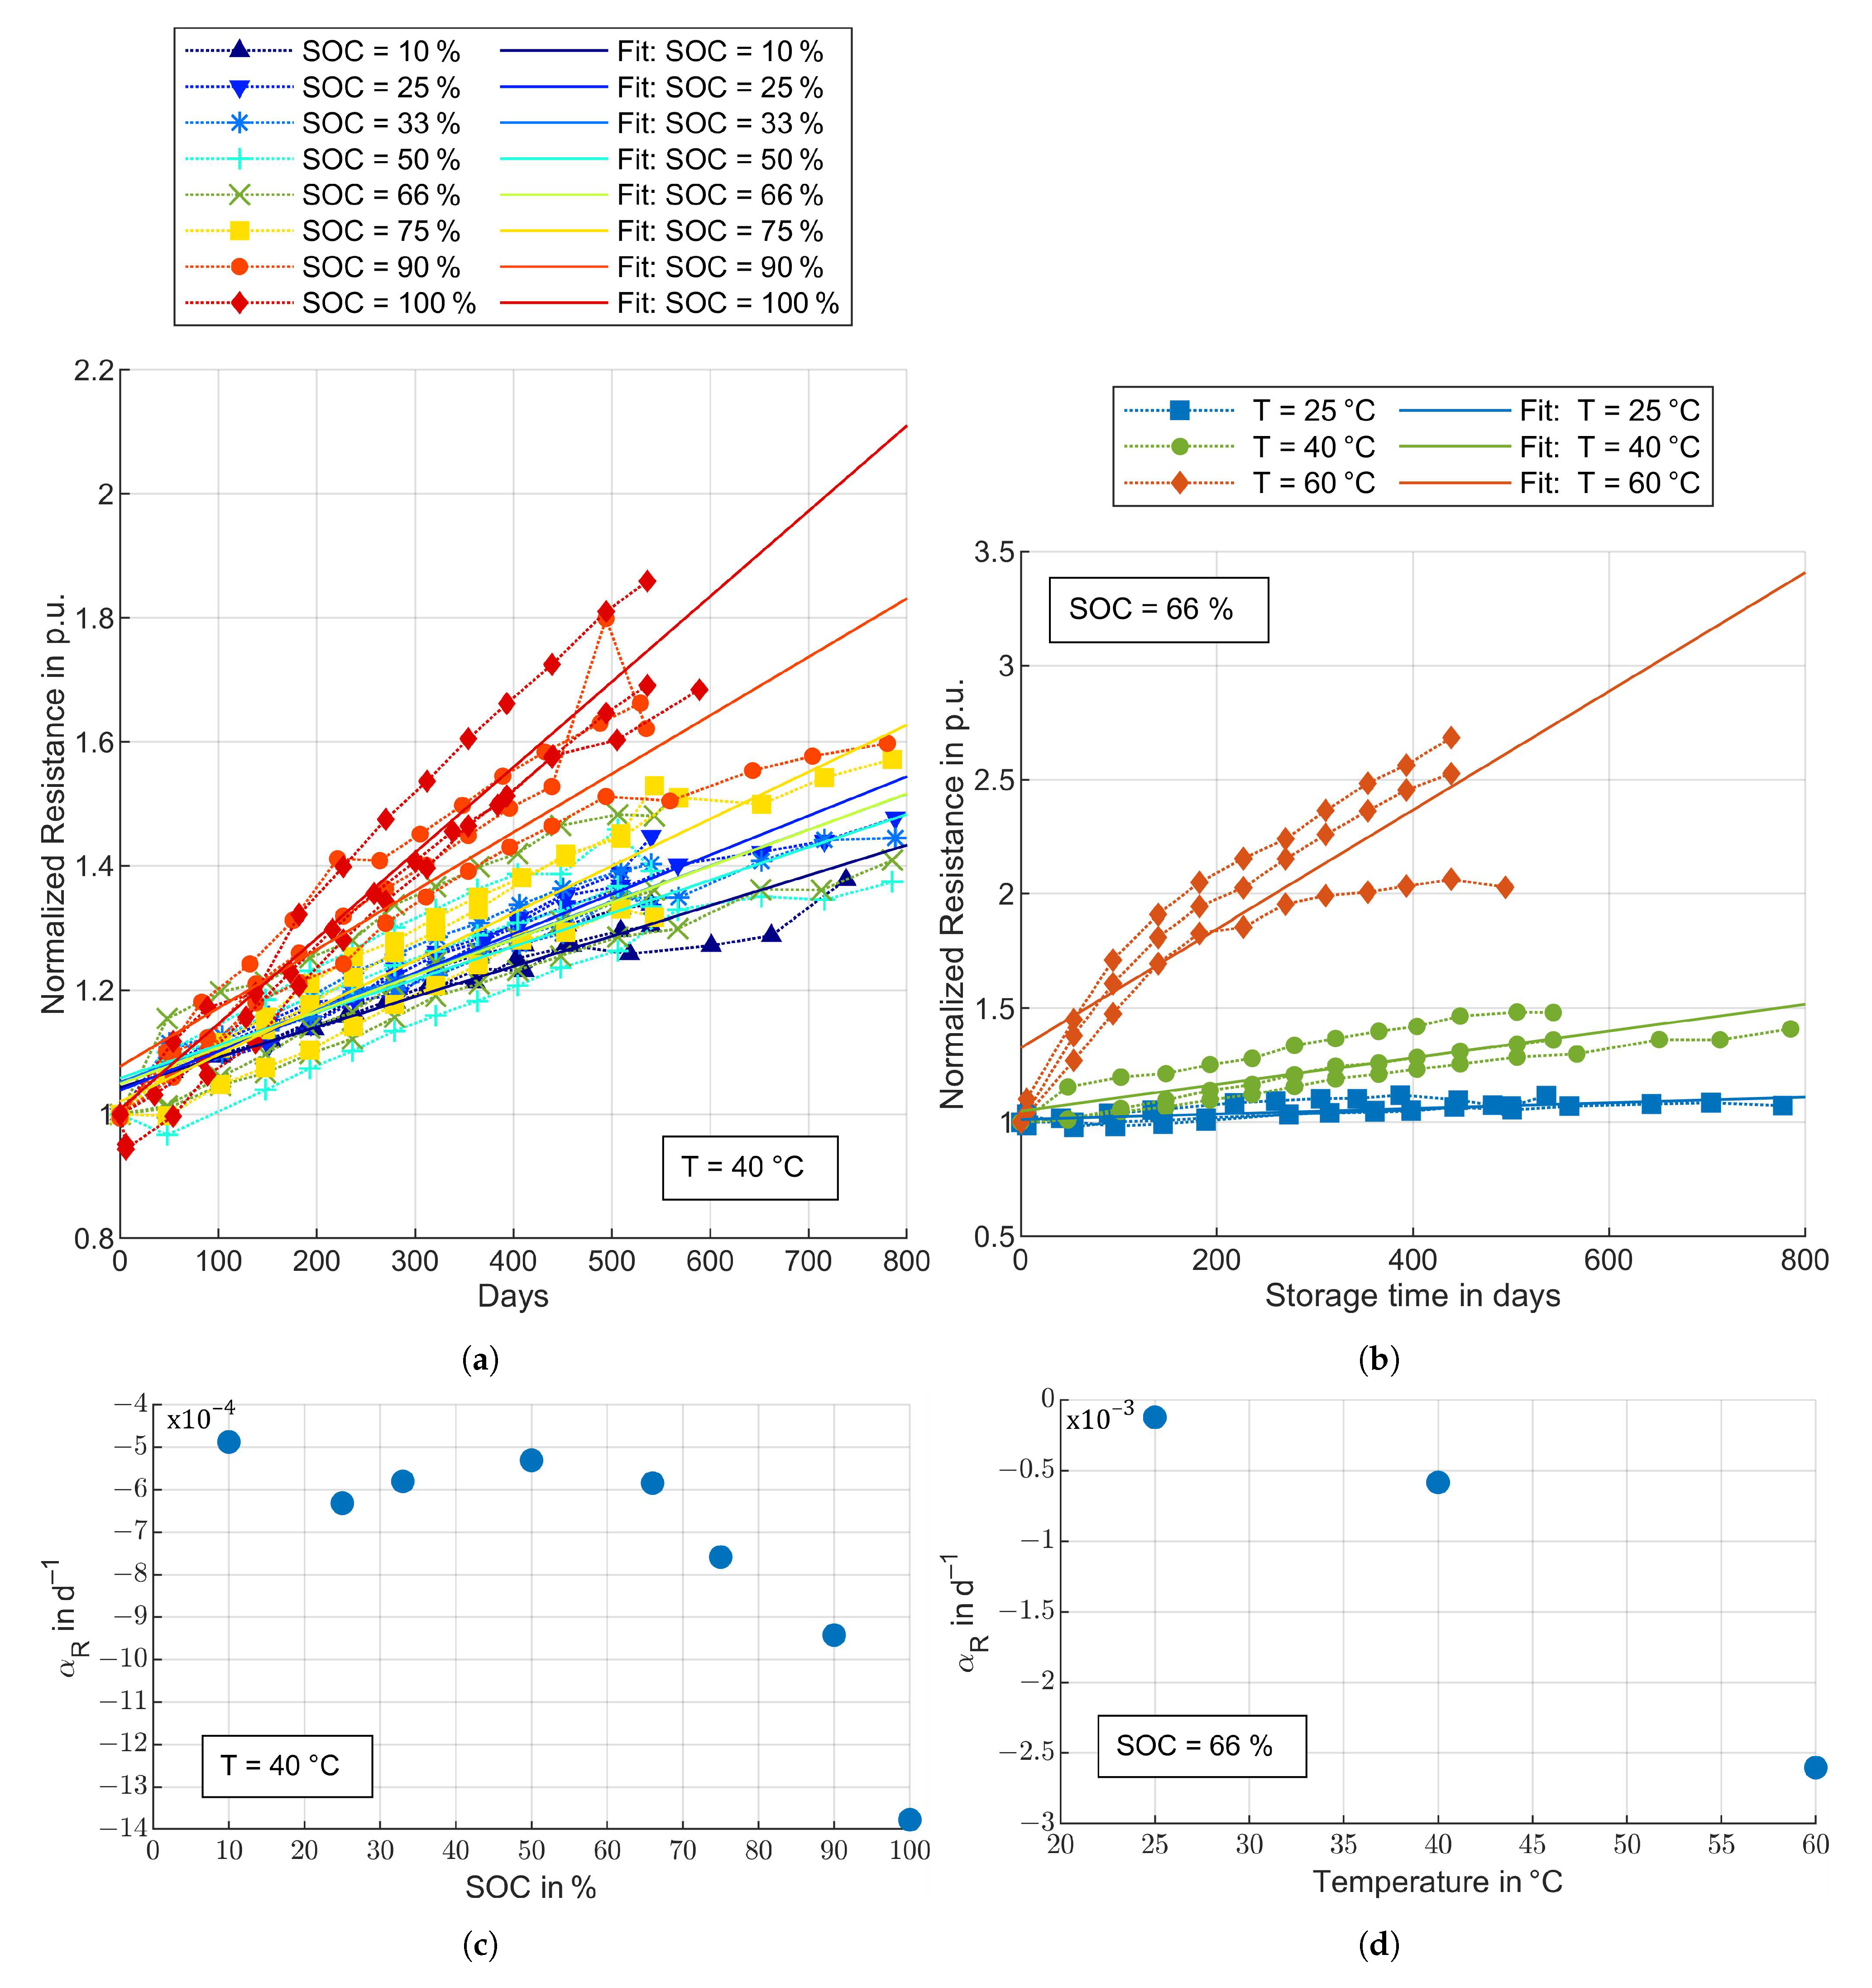
3.3. Aging Model Parameters
3.3.1. Calendar Aging
3.3.2. Cycle Aging
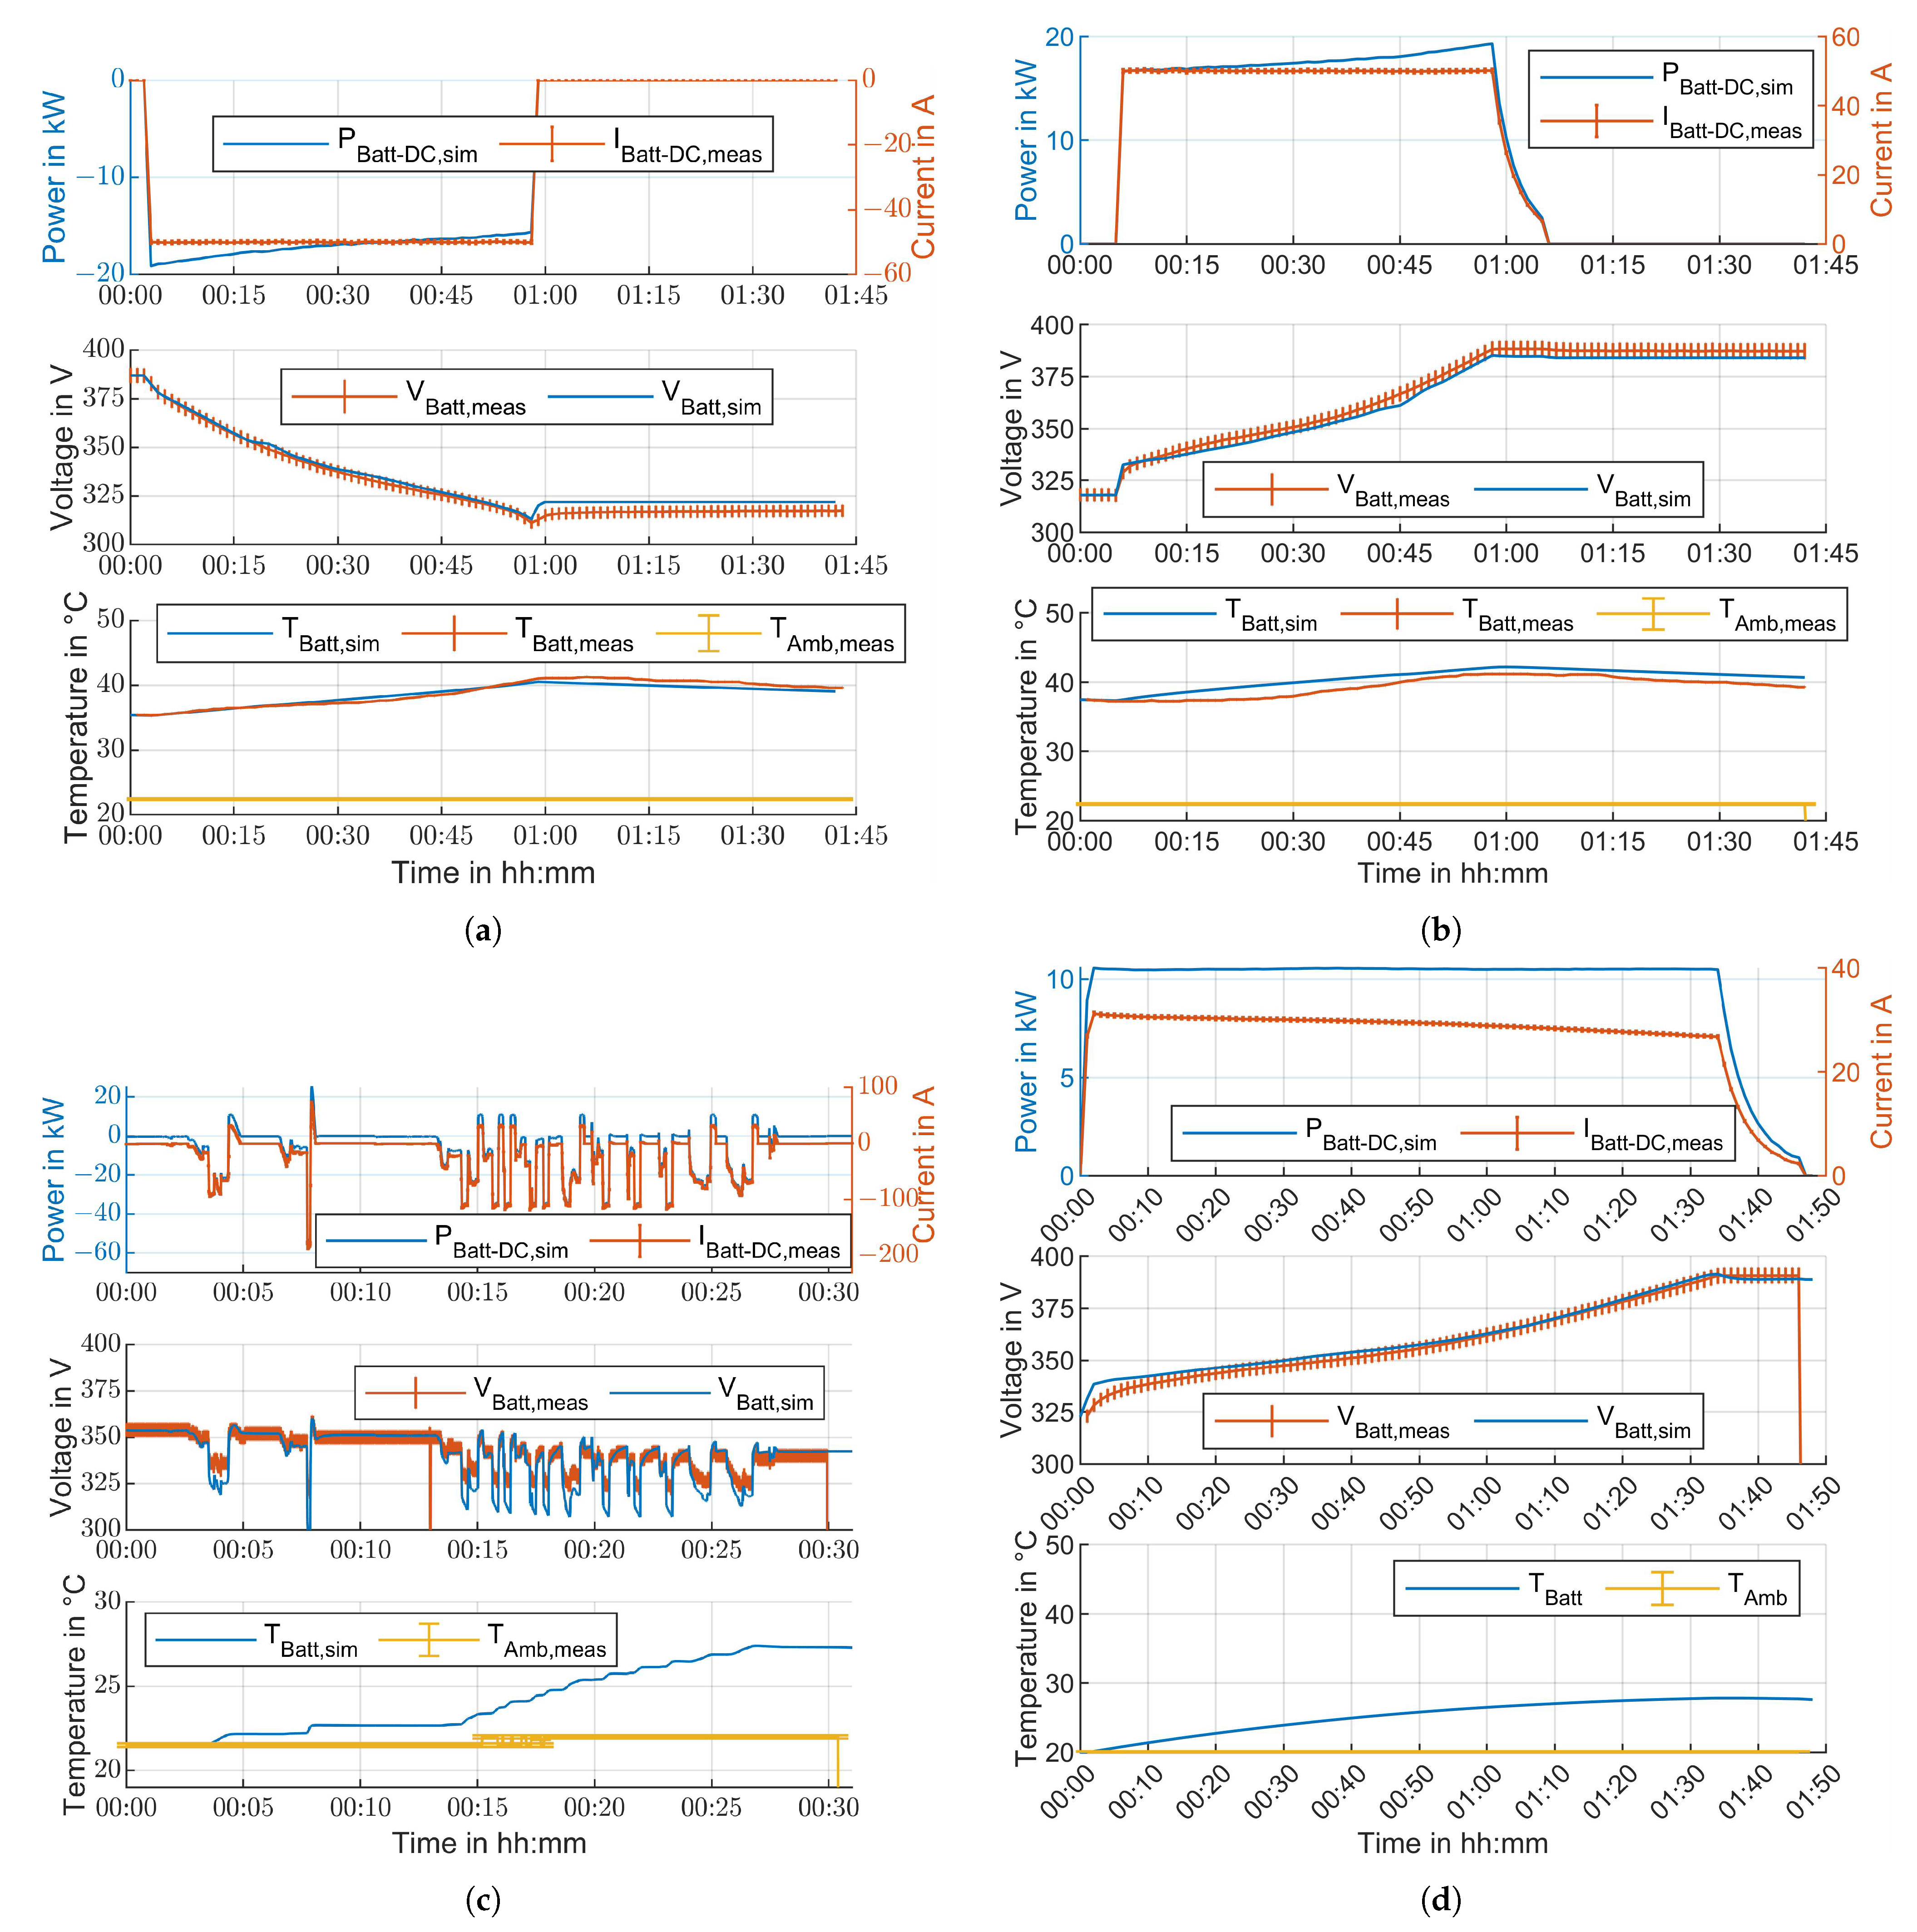
3.4. Validation of Traction Battery Model
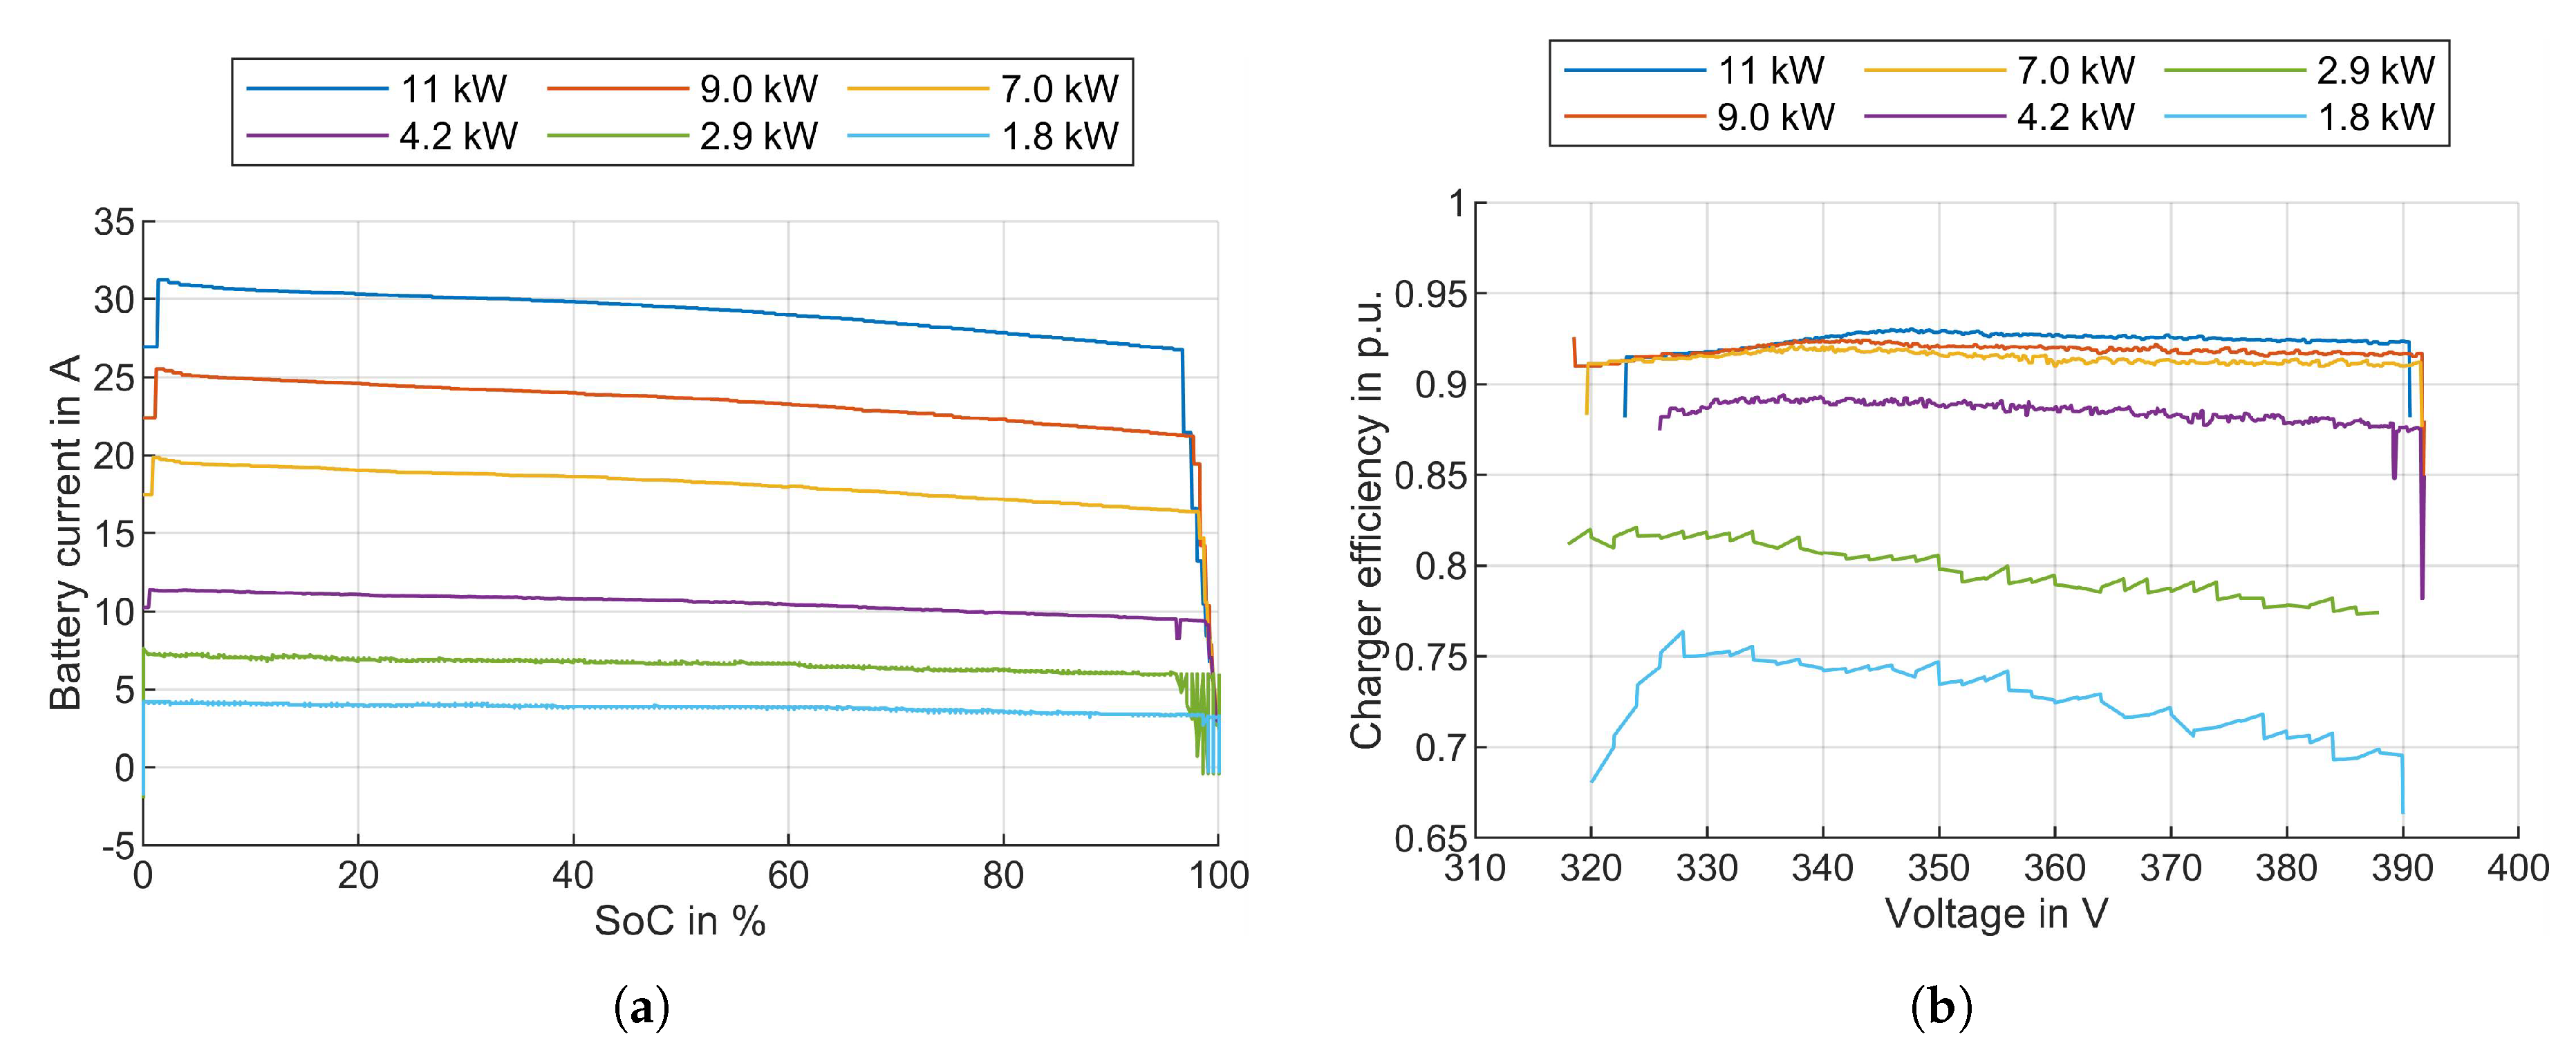
3.5. Charger
3.5.1. Charger Efficiency
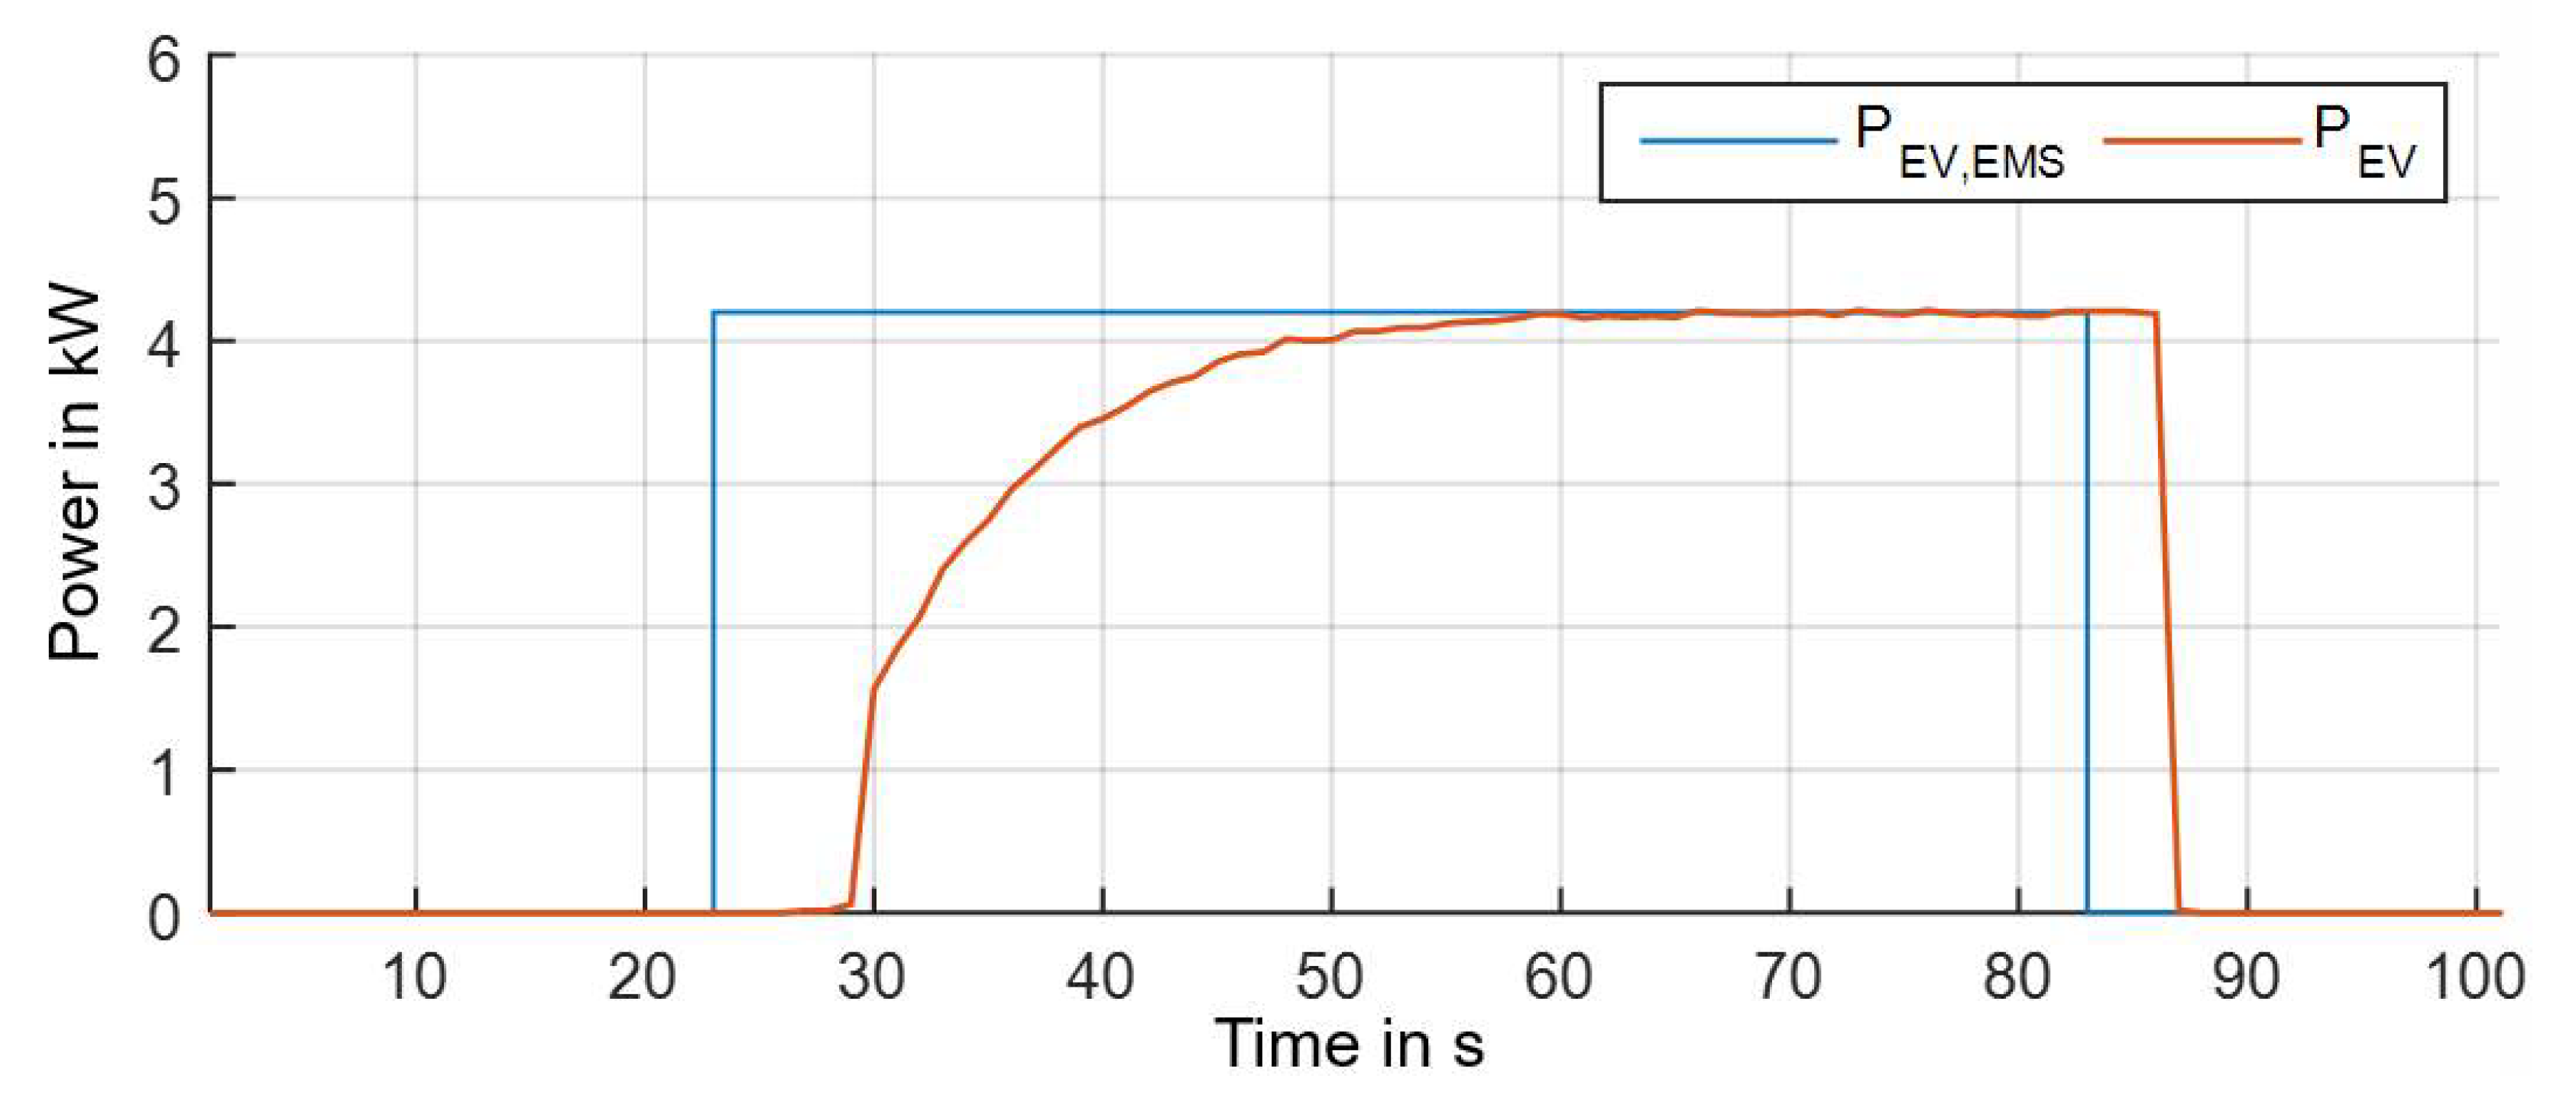
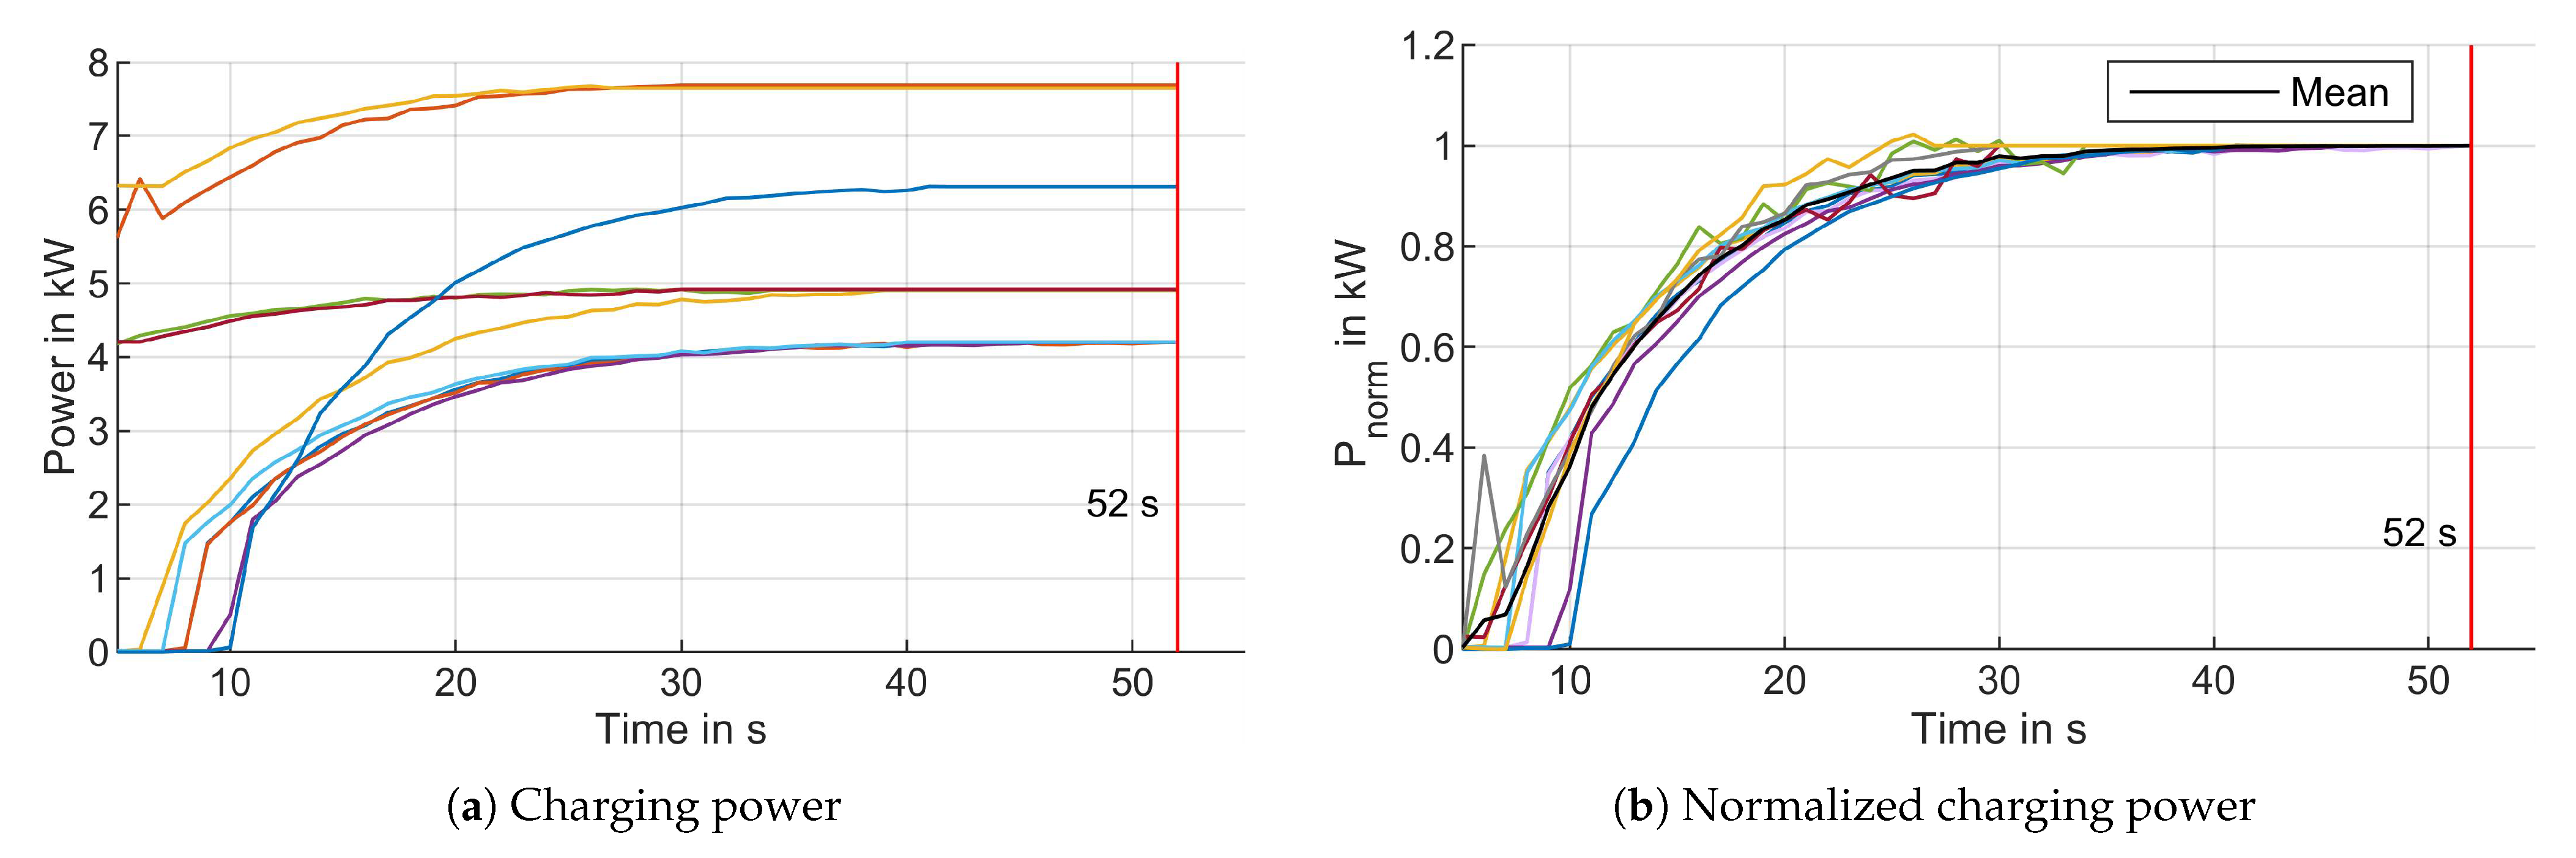
3.5.2. Charge Control
4. Conclusions
Author Contributions
Funding
Data Availability Statement
Conflicts of Interest
Abbreviations
| AC | Alternating Current |
| BMS | Battery Management System |
| CCS | Combined Charging System |
| CC | Constant Current |
| CP | Control Pilot |
| CV | Constant Voltage |
| DC | Direct Current |
| DOD | Depth-of-Discharge |
| DSO | Distribution System Operator |
| ECD | Equivalent Circuit Diagram |
| ECM | Equivalent Circuit Model |
| EOL | End-of-life |
| EQFC | Equivalent full Cycles |
| EV | Electric Vehicle |
| EU | European Union |
| ISEA | Institute for Power Electronics and Electrical Drives |
| GHG | Greenhouse Gas |
| LFP | Lithium-Iron-Phosphate |
| LMO | Lithium-Manganese-Oxide |
| NCA | Nickel-Cobalt-Aluminum |
| NMC | Nickel-Manganese-Cobalt |
| OCV | Open Circuit Voltage |
| P2D | Pseudo-two-dimensional |
| PWM | Pulse-width Modulation |
| PSO | Particle Swarm Optimization |
| RMSE | Root Mean Square Error |
| SECC | Supply Equipment Communication Controller |
| SEI | Solid Electrolyte Interface |
| SOC | State of Charge |
| TIM | Thermal Interface Material |
| TSO | Transmission System Operator |
| UDSS | Urban Dynanometer Driving Schedule |
| UPS | Uninterruptible Power Supply |
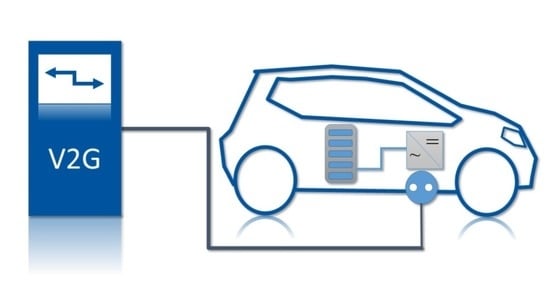
| V2G | Vehicle-to-Grid |
| WLTP | World Harmonized Light-duty Vehicle Test Procedure |
Appendix A

| SOC | °C | °C | °C | °C | °C | °C |
|---|---|---|---|---|---|---|
| 0 | 6.2036 | 7.9584 | 7.4502 | 13.0975 | 7.3923 | 67.3145 |
| 5 | 6.7057 | 7.9584 | 7.0831 | 12.0634 | 7.6907 | 52.7914 |
| 10 | 7.0351 | 7.9058 | 8.1745 | 9.7993 | 9.7993 | 31.2679 |
| 15 | 7.0362 | 7.7804 | 8.2376 | 8.5921 | 8.5921 | 20.3526 |
| 20 | 7.025 | 7.6302 | 7.8927 | 7.8728 | 7.8728 | 15.4208 |
| 25 | 7.0074 | 7.5035 | 7.6377 | 7.4329 | 7.4329 | 12.8902 |
| 30 | 6.9953 | 7.3938 | 7.4458 | 7.1292 | 7.1292 | 11.4807 |
| 35 | 6.9859 | 7.321 | 7.3006 | 6.9232 | 6.9232 | 10.5764 |
| 40 | 6.9818 | 7.2501 | 7.1929 | 6.766 | 6.766 | 9.9806 |
| 45 | 6.9876 | 7.2037 | 7.1078 | 6.647 | 6.647 | 9.6004 |
| 50 | 6.9984 | 7.1727 | 7.0403 | 6.5529 | 6.5529 | 9.2664 |
| 55 | 7.0174 | 7.1526 | 6.9983 | 6.4947 | 6.4947 | 9.1936 |
| 60 | 7.0358 | 7.1427 | 6.9704 | 6.4468 | 6.4468 | 8.8458 |
| 65 | 7.0524 | 7.1361 | 6.9536 | 6.4166 | 6.4166 | 8.6808 |
| 70 | 7.0797 | 7.1536 | 6.9604 | 6.4035 | 6.4035 | 11.7327 |
| 75 | 7.1131 | 7.1699 | 6.9866 | 6.4153 | 6.4153 | 8.769 |
| 80 | 7.1384 | 7.2062 | 7.0192 | 6.44 | 6.44 | 8.891 |
| 85 | 7.1669 | 7.2432 | 7.0495 | 6.4431 | 6.4431 | 8.9094 |
| 90 | 7.2004 | 7.272 | 7.0808 | 6.4539 | 6.4539 | 8.9672 |
| 95 | 7.2463 | 7.3147 | 7.1279 | 6.4731 | 6.4731 | 9.121 |
| 100 | 7.2979 | 7.4146 | 7.2229 | 6.5136 | 8.3874 | 9.2603 |
| SOC | °C | °C | °C | °C | °C | °C |
|---|---|---|---|---|---|---|
| 0 | 4141.5919 | 4286.6052 | 5516.4437 | 2118.5361 | 60.0993 | 5531.9622 |
| 5 | 5022.3094 | 4286.6052 | 6159.9236 | 3033.2749 | 58.1937 | 6678.5867 |
| 10 | 5708.5295 | 4697.046 | 7798.3847 | 4918.0826 | 4918.0826 | 9448.3505 |
| 15 | 6041.7281 | 5284.4166 | 8813.2291 | 6317.1787 | 6317.1787 | 11,285.6717 |
| 20 | 6374.0387 | 5884.8955 | 9432.6452 | 7257.1822 | 7257.1822 | 12,596.6965 |
| 25 | 6708.384 | 6360.1984 | 9963.4325 | 7980.8923 | 7980.8923 | 13,341.3285 |
| 30 | 6518.6387 | 6706.3331 | 10,449.2833 | 8444.132 | 8444.1321 | 13,997.3891 |
| 35 | 6397.0799 | 7245.0718 | 10,766.5061 | 8976.0607 | 8976.0606 | 14,755.9898 |
| 40 | 6431.3843 | 7358.5873 | 10,865.4071 | 9414.1746 | 9414.1746 | 15,398.4024 |
| 45 | 6525.6152 | 7433.5444 | 10,937.0734 | 9504.4511 | 9504.451 | 16,183.0849 |
| 50 | 6657.4635 | 7507.8527 | 11,099.9621 | 9544.943 | 9544.943 | 16,387.729 |
| 55 | 6923.1851 | 7640.8721 | 11,096.09 | 9674.996 | 9674.996 | 17,946.6885 |
| 60 | 7163.0191 | 7773.424 | 11,214.6962 | 9685.1701 | 9685.1701 | 16,451.9069 |
| 65 | 7360.0617 | 7546.9592 | 11,164.4429 | 9733.1104 | 9733.1105 | 16,327.2941 |
| 70 | 7291.066 | 7660.2968 | 11,049.7543 | 9769.1101 | 9769.1101 | 19,108.3983 |
| 75 | 7107.4896 | 7490.5601 | 10,869.0289 | 9647.1047 | 9647.1047 | 18,348.4586 |
| 80 | 7378.1886 | 7369.5919 | 11,006.2558 | 9745.2247 | 9745.2247 | 16,253.7877 |
| 85 | 7507.6149 | 7374.4778 | 11,587.7219 | 10,077.6235 | 10,077.6234 | 16,871.9588 |
| 90 | 7317.6989 | 7519.7098 | 12,025.6155 | 10,226.4339 | 10,226.4339 | 17,445.8639 |
| 95 | 7615.8306 | 7787.3085 | 12,402.6332 | 10,509.1678 | 10,509.1677 | 17,726.0212 |
| 100 | 8229.7746 | 8162.5097 | 12,688.7936 | 10,981.5609 | 63.7065 | 18,549.9549 |
| SOC | °C | °C | °C | °C | °C | °C |
|---|---|---|---|---|---|---|
| 0 | 0.080049 | 0.022681 | 0.0075994 | 0.0031085 | 0.0016543 | 0.00083272 |
| 5 | 0.080813 | 0.022681 | 0.0074289 | 0.0029965 | 0.0016361 | 0.00072845 |
| 10 | 0.081019 | 0.022443 | 0.0072283 | 0.0027771 | 0.0027771 | 0.00055252 |
| 15 | 0.080114 | 0.02204 | 0.0069696 | 0.0026011 | 0.0026011 | 0.00047537 |
| 20 | 0.079403 | 0.02157 | 0.0067263 | 0.0024714 | 0.0024714 | 0.00043031 |
| 25 | 0.07879 | 0.021096 | 0.006519 | 0.0023783 | 0.0023783 | 0.00040173 |
| 30 | 0.077989 | 0.020618 | 0.0063371 | 0.0022976 | 0.0022976 | 0.00037995 |
| 35 | 0.07717 | 0.020242 | 0.0061748 | 0.0022282 | 0.0022282 | 0.00036301 |
| 40 | 0.076315 | 0.019882 | 0.0060269 | 0.0021654 | 0.0021654 | 0.00034835 |
| 45 | 0.075792 | 0.01956 | 0.0059057 | 0.0021135 | 0.0021135 | 0.00033465 |
| 50 | 0.075435 | 0.019288 | 0.0058104 | 0.0020704 | 0.0020704 | 0.00032324 |
| 55 | 0.074636 | 0.019064 | 0.0057405 | 0.0020316 | 0.0020316 | 0.00031829 |
| 60 | 0.073822 | 0.01886 | 0.0056725 | 0.0019981 | 0.0019981 | 0.00030497 |
| 65 | 0.072979 | 0.018613 | 0.005597 | 0.0019707 | 0.0019707 | 0.00029527 |
| 70 | 0.071834 | 0.018422 | 0.0055279 | 0.0019368 | 0.0019368 | 0.00040059 |
| 75 | 0.070536 | 0.018181 | 0.0054476 | 0.0019037 | 0.0019037 | 0.00028212 |
| 80 | 0.068815 | 0.017865 | 0.0053462 | 0.0018703 | 0.0018703 | 0.00027528 |
| 85 | 0.067044 | 0.01751 | 0.0052494 | 0.0018425 | 0.0018425 | 0.00026975 |
| 90 | 0.065175 | 0.017177 | 0.0051842 | 0.0018259 | 0.0018259 | 0.00026606 |
| 95 | 0.064342 | 0.01697 | 0.0051215 | 0.0018122 | 0.0018122 | 0.00026224 |
| 100 | 0.063995 | 0.017087 | 0.005135 | 0.0017995 | 0.00025511 | 0.00026057 |
| SOC | °C | °C | °C | °C | °C | °C |
|---|---|---|---|---|---|---|
| 0 | 0.017962 | 0.0064332 | 0.0053752 | 0.0022864 | 0.0024531 | 0.0013569 |
| 5 | 0.018272 | 0.0064332 | 0.0050855 | 0.0018491 | 0.0020993 | 0.0010403 |
| 10 | 0.018677 | 0.0064312 | 0.0051359 | 0.0016798 | 0.0016798 | 0.00078285 |
| 15 | 0.019272 | 0.0063328 | 0.0051021 | 0.001635 | 0.001635 | 0.00067566 |
| 20 | 0.019571 | 0.0062175 | 0.0050268 | 0.0016498 | 0.0016498 | 0.00064434 |
| 25 | 0.019723 | 0.0061373 | 0.0049072 | 0.0016547 | 0.0016547 | 0.00062327 |
| 30 | 0.018976 | 0.0060186 | 0.0047806 | 0.0016445 | 0.0016445 | 0.0006072 |
| 35 | 0.018648 | 0.0060566 | 0.0047452 | 0.0016123 | 0.0016123 | 0.00059305 |
| 40 | 0.019136 | 0.0059892 | 0.0047685 | 0.0015945 | 0.0015945 | 0.00058318 |
| 45 | 0.01889 | 0.0060495 | 0.0047247 | 0.0016043 | 0.0016043 | 0.00058044 |
| 50 | 0.018277 | 0.0060949 | 0.0047132 | 0.0016106 | 0.0016106 | 0.00058404 |
| 55 | 0.01845 | 0.0061307 | 0.0047856 | 0.0016312 | 0.0016312 | 0.00066865 |
| 60 | 0.018579 | 0.0061718 | 0.0048406 | 0.0016228 | 0.0016228 | 0.00060349 |
| 65 | 0.018618 | 0.005976 | 0.0048874 | 0.0016475 | 0.0016475 | 0.00061131 |
| 70 | 0.019384 | 0.0059645 | 0.00508 | 0.0016698 | 0.0016698 | 0.00083064 |
| 75 | 0.020515 | 0.0061409 | 0.0052437 | 0.001762 | 0.001762 | 0.0008464 |
| 80 | 0.019859 | 0.0062924 | 0.0051007 | 0.001704 | 0.001704 | 0.0007167 |
| 85 | 0.01902 | 0.0060444 | 0.0047286 | 0.0016229 | 0.0016229 | 0.00069362 |
| 90 | 0.017825 | 0.0055591 | 0.0044844 | 0.0015623 | 0.0015623 | 0.00068559 |
| 95 | 0.016545 | 0.0053424 | 0.0043247 | 0.0015262 | 0.0015262 | 0.00068296 |
| 100 | 0.015225 | 0.0050156 | 0.0043414 | 0.0014648 | 0.00043849 | 0.00070003 |
| SOC | °C | °C | °C | °C | °C | °C |
|---|---|---|---|---|---|---|
| 0 | 0.0023895 | 0.0018717 | 0.0011043 | 0.00092052 | 0.00072483 | 0.00066083 |
| 5 | 0.002708 | 0.0018717 | 0.0010703 | 0.00089389 | 0.00073228 | 0.00063753 |
| 10 | 0.0029141 | 0.0018574 | 0.0011518 | 0.00083587 | 0.00083587 | 0.00059699 |
| 15 | 0.0028961 | 0.0018258 | 0.0011529 | 0.00079821 | 0.00079821 | 0.00056968 |
| 20 | 0.0028806 | 0.0017895 | 0.0011236 | 0.00077344 | 0.00077344 | 0.00055148 |
| 25 | 0.0028664 | 0.0017592 | 0.0011007 | 0.00075798 | 0.00075798 | 0.00053972 |
| 30 | 0.0028439 | 0.0017321 | 0.0010823 | 0.00074604 | 0.00074604 | 0.00053164 |
| 35 | 0.0028218 | 0.0017115 | 0.0010676 | 0.00073729 | 0.00073729 | 0.00052591 |
| 40 | 0.0028001 | 0.0016923 | 0.0010559 | 0.00072961 | 0.00072961 | 0.00052104 |
| 45 | 0.0027863 | 0.0016799 | 0.0010462 | 0.00072353 | 0.00072353 | 0.00051694 |
| 50 | 0.0027766 | 0.0016695 | 0.0010386 | 0.0007186 | 0.0007186 | 0.00051324 |
| 55 | 0.0027659 | 0.0016603 | 0.0010338 | 0.00071487 | 0.00071487 | 0.00051207 |
| 60 | 0.0027513 | 0.001653 | 0.0010291 | 0.00071147 | 0.00071147 | 0.00050736 |
| 65 | 0.0027293 | 0.001643 | 0.0010244 | 0.00070907 | 0.00070907 | 0.00050419 |
| 70 | 0.0027054 | 0.001637 | 0.0010215 | 0.0007063 | 0.0007063 | 0.0005252 |
| 75 | 0.0026805 | 0.0016297 | 0.0010183 | 0.00070426 | 0.00070426 | 0.00049973 |
| 80 | 0.0026493 | 0.0016201 | 0.0010142 | 0.00070208 | 0.00070208 | 0.00049713 |
| 85 | 0.0026158 | 0.0016098 | 0.0010108 | 0.00070045 | 0.00070045 | 0.00049454 |
| 90 | 0.0025779 | 0.0016007 | 0.0010086 | 0.00069938 | 0.00069938 | 0.00049214 |
| 95 | 0.0025621 | 0.0015961 | 0.0010072 | 0.00069868 | 0.00069868 | 0.00048918 |
| 100 | 0.0025566 | 0.0016054 | 0.0010105 | 0.0006979 | 0.00054062 | 0.00048606 |
| SOC | °C | °C | °C | °C | °C |
|---|---|---|---|---|---|
| −5 | 3.3785 | 3.4228 | 3.4152 | 3.2082 | 3.1035 |
| 0 | 3.4064 | 3.4481 | 3.4427 | 3.3287 | 3.3076 |
| 5 | 3.4342 | 3.4734 | 3.4703 | 3.4477 | 3.4526 |
| 10 | 3.4621 | 3.4987 | 3.4978 | 3.4963 | 3.498 |
| 15 | 3.49 | 3.524 | 3.5254 | 3.5223 | 3.5229 |
| 20 | 3.5178 | 3.5494 | 3.5523 | 3.5498 | 3.5499 |
| 25 | 3.5457 | 3.5746 | 3.577 | 3.5754 | 3.5748 |
| 30 | 3.5735 | 3.5965 | 3.5991 | 3.5974 | 3.5967 |
| 35 | 3.6014 | 3.6194 | 3.6234 | 3.6214 | 3.6204 |
| 40 | 3.6292 | 3.6427 | 3.6485 | 3.6498 | 3.6496 |
| 45 | 3.6571 | 3.6648 | 3.6702 | 3.6715 | 3.6749 |
| 50 | 3.685 | 3.6884 | 3.6927 | 3.6936 | 3.6978 |
| 55 | 3.7128 | 3.715 | 3.7192 | 3.7201 | 3.7241 |
| 60 | 3.7451 | 3.7469 | 3.7509 | 3.7516 | 3.7553 |
| 65 | 3.7825 | 3.7839 | 3.7887 | 3.7892 | 3.7922 |
| 70 | 3.8254 | 3.8274 | 3.8313 | 3.8316 | 3.8341 |
| 75 | 3.8746 | 3.8751 | 3.8789 | 3.8794 | 3.8805 |
| 80 | 3.9326 | 3.9303 | 3.934 | 3.9357 | 3.9342 |
| 85 | 3.9954 | 3.996 | 3.9978 | 3.998 | 3.9966 |
| 90 | 4.0589 | 4.0586 | 4.0584 | 4.0574 | 4.0564 |
| 95 | 4.1242 | 4.1209 | 4.1198 | 4.1176 | 4.1165 |
| 100 | 4.1862 | 4.1862 | 4.1862 | 4.1835 | 4.1816 |
| 105 | 4.1862 | 4.1862 | 4.1862 | 4.1862 | 4.1862 |
References
- European Comission. A European Strategy for Low-Emission Mobility, SWD(2016) 244 Final; European Comission: Brussel, Belgium, 2016.
- European Commission Eurostat, Energy Dashboard. Available online: https://ec.europa.eu/eurostat/cache/infographs/energy_dashboard/endash.html (accessed on 10 October 2021).
- IEA. Global EV Outlook 2020; Technical Report; International Energy Agency: Paris, France, 2020.
- Infas Institut für Angewandte Sozialwissenschaft GmbH. Mobilität in Deutschland 2017-Ergebnisbericht; Infas Institut für Angewandte Sozialwissenschaft GmbH: Bonn, Germany, 2017. [Google Scholar]
- Osieczko, K.; Zimon, D.; Płaczek, E.; Prokopiuk, I. Factors that influence the expansion of electric delivery vehicles and trucks in EU countries. J. Environ. Manag. 2021, 296, 113177. [Google Scholar] [CrossRef]
- Englberger, S.; Abo Gamra, K.; Tepe, B.; Schreiber, M.; Jossen, A.; Hesse, H. Electric vehicle multi-use: Optimizing multiple value streams using mobile storage systems in a vehicle-to-grid context. Appl. Energy 2021, 304, 117862. [Google Scholar] [CrossRef]
- Heilmann, C.; Friedl, G. Factors influencing the economic success of grid-to-vehicle and vehicle-to-grid applications—A review and meta-analysis. Renew. Sustain. Energy Rev. 2021, 145, 111115. [Google Scholar] [CrossRef]
- Golmohamadi, H. Virtual storage plants in parking lots of electric vehicles providing local/global power system support. J. Energy Storage 2021, 43, 103249. [Google Scholar] [CrossRef]
- Wang, Y.; Tian, J.; Sun, Z.; Wang, L.; Xu, R.; Li, M.; Chen, Z. A comprehensive review of battery modeling and state estimation approaches for advanced battery management systems. Renew. Sustain. Energy Rev. 2020, 131, 110015. [Google Scholar] [CrossRef]
- Mesbahi, T.; Sugrañes, R.B.; Bakri, R.; Bartholomeüs, P. Coupled electro-thermal modeling of lithium-ion batteries for electric vehicle application. J. Energy Storage 2021, 35, 102260. [Google Scholar] [CrossRef]
- Li, Y.; Li, K.; Xie, Y.; Liu, B.; Liu, J.; Zheng, J.; Li, W. Optimization of charging strategy for lithium-ion battery packs based on complete battery pack model. J. Energy Storage 2021, 37, 102466. [Google Scholar] [CrossRef]
- Schmid, M.; Vögele, U.; Endisch, C. A novel matrix-vector-based framework for modeling and simulation of electric vehicle battery packs. J. Energy Storage 2020, 32, 101736. [Google Scholar] [CrossRef]
- Zhu, R.; Duan, B.; Zhang, C.; Gong, S. Accurate lithium-ion battery modeling with inverse repeat binary sequence for electric vehicle applications. Appl. Energy 2019, 251, 113339. [Google Scholar] [CrossRef]
- Wen, F.; Duan, B.; Zhang, C.; Zhu, R.; Shang, Y.; Zhang, J. High-Accuracy Parameter Identification Method for Equivalent-Circuit Models of Lithium-Ion Batteries Based on the Stochastic Theory Response Reconstruction. Electronics 2019, 8, 834. [Google Scholar] [CrossRef] [Green Version]
- Irimia, C.; Grovu, M.; Sirbu, G.M.; Birtas, A.; Husar, C.; Ponchant, M. The modeling and simulation of an Electric Vehicle based on Simcenter Amesim platform. In Proceedings of the 2019 Electric Vehicles International Conference (EV), Bucharest, Romania, 3–4 October 2019; pp. 1–6. [Google Scholar] [CrossRef]
- Hosseinzadeh, E.; Genieser, R.; Worwood, D.; Barai, A.; Marco, J.; Jennings, P. A systematic approach for electrochemical-thermal modelling of a large format lithium-ion battery for electric vehicle application. J. Power Sources 2018, 382, 77–94. [Google Scholar] [CrossRef] [Green Version]
- Jafari, M.; Gauchia, A.; Zhao, S.; Zhang, K.; Gauchia, L. Electric Vehicle Battery Cycle Aging Evaluation in Real-World Daily Driving and Vehicle-to-Grid Services. IEEE Trans. Transp. Electrif. 2018, 4, 122–134. [Google Scholar] [CrossRef]
- Gao, Y.; Jiang, J.; Zhang, C.; Zhang, W.; Ma, Z.; Jiang, Y. Lithium-ion battery aging mechanisms and life model under different charging stresses. J. Power Sources 2017, 356, 103–114. [Google Scholar] [CrossRef]
- Schmalstieg, J.; Käbitz, S.; Ecker, M.; Sauer, D.U. A holistic aging model for Li(NiMnCo)O2 based 18,650 lithium-ion batteries. J. Power Sources 2014, 257, 325–334. [Google Scholar] [CrossRef]
- Newman, J.; Tiedemann, W. Porous-electrode theory with battery applications. Aiche J. 1975, 21, 25–41. [Google Scholar] [CrossRef] [Green Version]
- Fuller, T.F.; Doyle, M.; Newman, J. Simulation and optimization of the dual lithium ion insertion cell. J. Electrochem. Soc. 1994, 141, 1. [Google Scholar] [CrossRef] [Green Version]
- Newman, J.; Thomas-Alyea, K.E. Electrochemical Systems, 3rd ed.; Wiley-Interscience: New York, NY, USA, 2004. [Google Scholar]
- Romero-Becerril, A.; Alvarez-Icaza, L. Comparison of discretization methods applied to the single-particle model of lithium-ion batteries. J. Power Sources 2011, 196, 10267–10279. [Google Scholar] [CrossRef]
- Johnson, V. Battery performance models in ADVISOR. J. Power Sources 2002, 110, 321–329. [Google Scholar] [CrossRef]
- Liaw, B.; Nagasubramanian, G.; Jungst, R.; Doughty, D. Modeling of lithium ion cells—A simple equivalent-circuit model approach. Solid State Ion. 2004, 175, 835–839. [Google Scholar] [CrossRef]
- Mingant, R.; Petit, M.; Belaïd, S.; Bernard, J. Data-driven model development to predict the aging of a Li-ion battery pack in electric vehicles representative conditions. J. Energy Storage 2021, 39, 102592. [Google Scholar] [CrossRef]
- Tang, X.; Zou, C.; Yao, K.; Lu, J.; Xia, Y.; Gao, F. Aging trajectory prediction for lithium-ion batteries via model migration and Bayesian Monte Carlo method. Appl. Energy 2019, 254, 113591. [Google Scholar] [CrossRef] [Green Version]
- Tang, X.; Liu, K.; Li, K.; Widanage, W.D.; Kendrick, E.; Gao, F. Recovering large-scale battery aging dataset with machine learning. Patterns 2021, 2, 100302. [Google Scholar] [CrossRef] [PubMed]
- Carlier, D.; Saadoune, I.; Ménétrier, M.; Delmas, C. Lithium Electrochemical Deintercalation from O 2 LiCoO2: Structure and Physical Properties. J. Electrochem. Soc. 2002, 149, A1310. [Google Scholar] [CrossRef]
- Tran, M.K.; Mevawala, A.; Panchal, S.; Raahemifar, K.; Fowler, M.; Fraser, R. Effect of integrating the hysteresis component to the equivalent circuit model of Lithium-ion battery for dynamic and non-dynamic applications. J. Energy Storage 2020, 32, 101785. [Google Scholar] [CrossRef]
- Tran, M.K.; DaCosta, A.; Mevawalla, A.; Panchal, S.; Fowler, M. Comparative Study of Equivalent Circuit Models Performance in Four Common Lithium-Ion Batteries: LFP, NMC, LMO, NCA. Batteries 2021, 7, 51. [Google Scholar] [CrossRef]
- Zou, C.; Zhang, L.; Hu, X.; Wang, Z.; Wik, T.; Pecht, M. A review of fractional-order techniques applied to lithium-ion batteries, lead-acid batteries, and supercapacitors. J. Power Sources 2018, 390, 286–296. [Google Scholar] [CrossRef] [Green Version]
- Habedank, J.B.; Kraft, L.; Rheinfeld, A.; Krezdorn, C.; Jossen, A.; Zaeh, M.F. Increasing the Discharge Rate Capability of Lithium-Ion Cells with Laser-Structured Graphite Anodes: Modeling and Simulation. J. Electrochem. Soc. 2018, 165, A1563–A1573. [Google Scholar] [CrossRef]
- Yang, R.; Xiong, R.; Shen, W.; Lin, X. Extreme Learning Machine-Based Thermal Model for Lithium-Ion Batteries of Electric Vehicles under External Short Circuit. Engineering 2020, 7, 395–405. [Google Scholar] [CrossRef]
- Ecker, M.; Gerschler, J.B.; Vogel, J.; Käbitz, S.; Hust, F.; Dechent, P.; Sauer, D.U. Development of a lifetime prediction model for lithium-ion batteries based on extended accelerated aging test data. J. Power Sources 2012, 215, 248–257. [Google Scholar] [CrossRef]
- Ecker, M.; Nieto, N.; Käbitz, S.; Schmalstieg, J.; Blanke, H.; Warnecke, A.; Sauer, D.U. Calendar and cycle life study of Li(NiMnCo)O2-based 18,650 lithium-ion batteries. J. Power Sources 2014, 248, 839–851. [Google Scholar] [CrossRef]
- Lewerenz, M.; Marongiu, A.; Warnecke, A.; Sauer, D.U. Differential voltage analysis as a tool for analyzing inhomogeneous aging: A case study for LiFePO4|Graphite cylindrical cells. J. Power Sources 2017, 368, 57–67. [Google Scholar] [CrossRef]
- Renganathan, S.; Sikha, G.; Santhanagopalan, S.; White, R.E. Theoretical Analysis of Stresses in a Lithium Ion Cell. J. Electrochem. Soc. 2010, 157, A155. [Google Scholar] [CrossRef]
- Laresgoiti, I.; Käbitz, S.; Ecker, M.; Sauer, D.U. Modeling mechanical degradation in lithium ion batteries during cycling: Solid electrolyte interphase fracture. J. Power Sources 2015, 300, 112–122. [Google Scholar] [CrossRef]
- Arora, P.; Doyle, M.; White, R.E. Mathematical modeling of the lithium deposition overcharge reaction in lithium-ion batteries using carbon-based negative electrodes. J. Electrochem. Soc. 1999, 146, 3543. [Google Scholar] [CrossRef] [Green Version]
- Diaz, A.G.J. Advanced Vehicle Testing and Evaluation. Technical Report, Intertek. 2018. Available online: https://www.osti.gov/servlets/purl/1481912 (accessed on 6 March 2022).
- Kim, D.H.; Kim, M.J.; Lee, B.K. An Integrated Battery Charger with High Power Density and Efficiency for Electric Vehicles. IEEE Trans. Power Electron. 2017, 32, 4553–4565. [Google Scholar] [CrossRef]
- Radimov, N.; Li, G.; Tang, M.; Wang, X. Three-stage SiC-based bi-directional on-board battery charger with titanium level efficiency. IET Power Electron. 2020, 13, 1477–1480. [Google Scholar] [CrossRef]
- Schram, W.; Brinkel, N.; Smink, G.; van Wijk, T.; van Sark, W. Empirical Evaluation of V2G Round-trip Efficiency. In Proceedings of the 2020 International Conference on Smart Energy Systems and Technologies (SEST), Istanbul, Turkey, 7–9 September 2020; pp. 1–6. [Google Scholar] [CrossRef]
- Rajendran, G.; Vaithilingam, C.A.; Misron, N.; Naidu, K.; Ahmed, M.R. A comprehensive review on system architecture and international standards for electric vehicle charging stations. J. Energy Storage 2021, 42, 103099. [Google Scholar] [CrossRef]
- Dini, P.; Saponara, S. Electro-Thermal Model-Based Design of Bidirectional On-Board Chargers in Hybrid and Full Electric Vehicles. Electronics 2021, 11, 112. [Google Scholar] [CrossRef]
- Andersen, P.B.; Toghroljerdi, S.H.; Sörensen, T.M.; Christensen, B.E.; Lodberg Höj, J.C.M.; Zecchino, A. The Parker Project 2019. Available online: https://parker-project.com/wp-content/uploads/2019/03/Parker_Final-report_v1.1_2019.pdf (accessed on 6 March 2022).
- Arnold, G.; Brandl, R.; Degner, T.; Gerhardt, N.; Landau, M.; Nestle, D.; Portula, M.; Scheidler, A.; Schwinn, R.; Baumbusch, K.; et al. Intelligente Netzanbindung von Elektrofahrzeugen zur Erbringung von Systemdienstleistungen—INEES. Technical report, Fraunhofer IWES, LichtBlick SE, SMA AG, Volkswagen AG, 2018. Available online: https://www.erneuerbar-mobil.de/sites/default/files/2016-09/INEES_Abschlussbericht.pdf (accessed on 6 March 2022).
- Degner, T.; Arnold, G.; Brandl, R.; Dollichon, J.; Scheidler, A. Grid Impact of Electric Vehicles with Secondary Control Reserve Capability. In Proceedings of the 1st E-Mobility Power System Integration Symposium, Berlin, Germany, 24–27 October 2017. [Google Scholar]
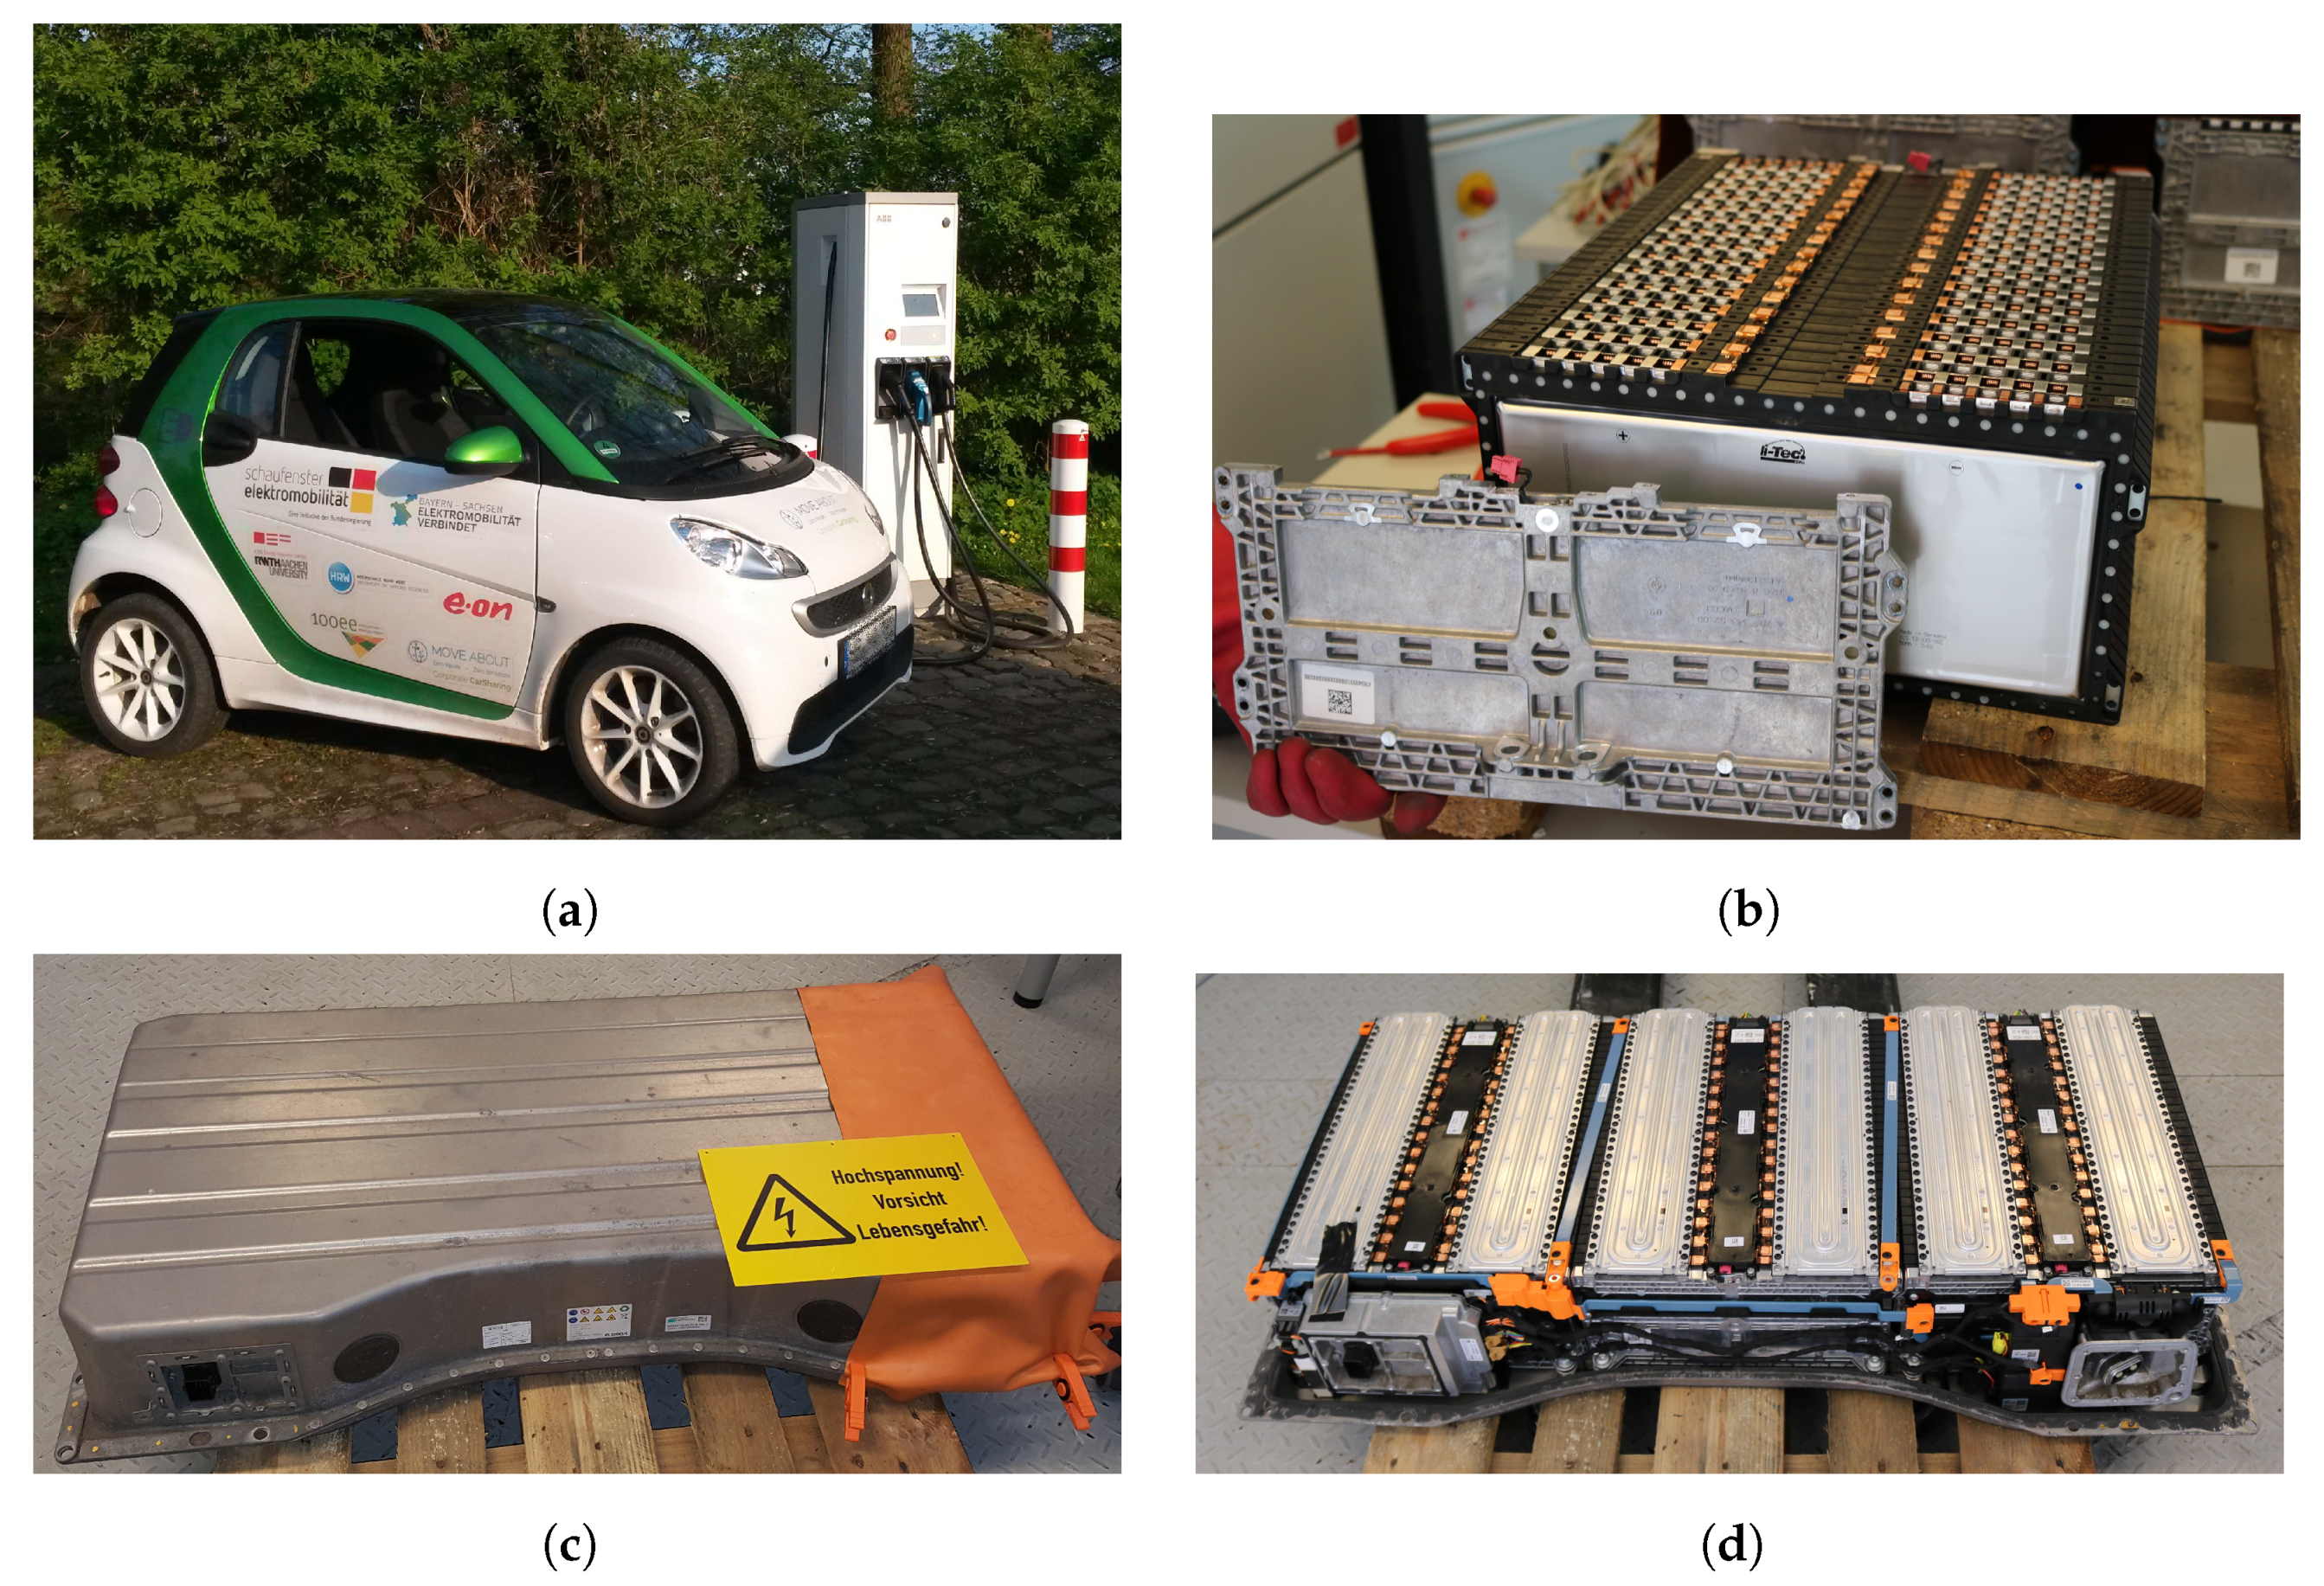
- Daimler, A.G. Available online: https://media.daimler.com/marsMediaSite/ko/en/9920260 (accessed on 20 April 2020).
- Daimler, A.G. Introduction of the Smart Fortwo ELECTRIC Drive (3rd Generation) Model Series 451: Introduction into Service Manual; Technical Report. Available online: https://moba.i.mercedes-benz.com/markets-smart/ece-row/baix/cars/smart-fortwo-ed-451/en_GB/downloads/BA_smart_451_ECE_ev_AEJ2014_en_GB.pdf (accessed on 6 March 2022).
- Li-Tec Battery GmbH. MS-TD-058 Technisches Datenblatt HEA 50; Rev. 2.0; Technical Report; Li-Tec Battery GmbH: Kamenz, Germany, 2015. [Google Scholar]
- Witzenhausen, H. Elektrische Batteriespeichermodelle: Modellbildung, Parameteridentifikation und Modellreduktion; 1. Auflage. Ph.D. Thesis, RWTH Aachen University, Aachen, Germany, 2017. [Google Scholar] [CrossRef]
- Abada, S.; Marlair, G.; Lecocq, A.; Petit, M.; Sauvant-Moynot, V.; Huet, F. Safety focused modeling of lithium-ion batteries: A review. J. Power Sources 2016, 306, 178–192. [Google Scholar] [CrossRef]
- Schmidt, J.P. Verfahren zur Charakterisierung und Modellierung von Lithium-Ionen Zellen. Ph.D. Thesis, Karlsruhe Institute for Technologie, Institute for applied materials - Electrochemical Technologies, Karlsruhe, Germany, 2013. [Google Scholar] [CrossRef]
- Hu, X.; Li, S.; Peng, H. A comparative study of equivalent circuit models for Li-ion batteries. J. Power Sources 2012, 198, 359–367. [Google Scholar] [CrossRef]
- Schmalstieg, J. Physikalisch-Elektrochemische Simulation von Lithium-Ionen-Batterien: Implementierung, Parametrierung und Anwendung. Ph.D. Thesis, RWTH Aachen University, Aachen, Germany, 2017. [Google Scholar] [CrossRef]
- Zhang, Q.Z.; Wang, X.Y.; Yuan, H.M. Estimation for SOC of Li-ion battery based on two-order RC temperature model. In Proceedings of the 2018 13th IEEE Conference on Industrial Electronics and Applications (ICIEA), Wuhan, China, 31 May–2 June 2018; pp. 2601–2606. [Google Scholar] [CrossRef]
- Kumar, M.S.; Manasa, T.R.; Raja, B.; Selvajyothi, K. Estimation of State of Charge and Terminal Voltage of Li-ion Battery using Extended Kalman Filter. In Proceedings of the 2020 6th IEEE International Energy Conference (ENERGYCon), Tunis, Tunisia, 28 September–1 October 2020; pp. 515–520. [Google Scholar] [CrossRef]
- Kiel, M. Impedanzspektroskopie an Batterien unter Besonderer Berücksichtigung von Batteriesensoren für den Feldeinsatz. Ph.D. Thesis, RWTH Aachen University, Aachen, Germany, 2013. [Google Scholar]
- Bernardi, D.; Pawlikowski, E.; Newman, J. A General Energy Balance for Battery Systems. J. Electrochem. Soc. 1985, 132, 5–12. [Google Scholar] [CrossRef] [Green Version]
- Magnor, D.T. Globale Optimierung netzgekoppelter PV-Batteriesysteme unter besonderer Berücksichtigung der Batteriealterung. Ph.D. Thesis, RWTH Aachen University, Aachen, Germany, 2017. [Google Scholar] [CrossRef]
- Hust, F.E. Physico-Chemically Motivated Parameterization and Modelling of Real-Time Capable Lithium-Ion Battery Models: A Case Study on the Tesla Model S battery. Ph.D. Thesis, RWTH Aachen University, Aachen, Germany, 2019. [Google Scholar] [CrossRef]
- DLR. Mobilitaet in Tabellen. 2017. Available online: https://mobilitaet-in-tabellen.dlr.de/mit/ (accessed on 24 June 2021).
- Ange-Etienne Acquaviva, Cédric. Development and Validation of a Plant Model for Battery Monitoring Systems (BMS) for High Voltage Batteries. Diploma Thesis, INSA Strasbourg, Strasbourg, France, 2012.
- Friesen, A.; Horsthemke, F.; Mönnighoff, X.; Brunklaus, G.; Krafft, R.; Börner, M.; Risthaus, T.; Winter, M.; Schappacher, F.M. Impact of cycling at low temperatures on the safety behavior of 18650-type lithium ion cells: Combined study of mechanical and thermal abuse testing accompanied by post-mortem analysis. J. Power Sources 2016, 334, 1–11. [Google Scholar] [CrossRef]
- Ziebert, C.; Uhlmann, N.; Ouyang, S.; Lei, B.; Zhao, W.; Rohde, M.; Seifert, H.J. Seifert. Battery Calorimetry of Li-Ion Cells to Prevent Thermal Runaway and Develop Safer Cells; Technical Report; Karlsruhe Institute of Technology; Institute for Applied Materials: Mainz, Germany, 2018. [Google Scholar]
- Baehr, H.D.; Stephan, K. Wärme- und Stoffübertragung, 9. Auflage; Springer: Berlin/Heidelberg, Germany; New York, NY, USA, 2016. [Google Scholar]
- Downie, D.; Martin, J. An adiabatic calorimeter for heat-capacity measurements between 6 and 300 K. The molar heat capacity of aluminium. J. Chem. Thermodyn. 1980, 12, 779–786. [Google Scholar] [CrossRef]
- Weidenfeller, B.; Höfer, M.; Schilling, F.R. Thermal conductivity, thermal diffusivity, and specific heat capacity of particle filled polypropylene. Compos. Part A Appl. Sci. Manuf. 2004, 35, 423–429. [Google Scholar] [CrossRef]
- Baumhöfer, T.; Brühl, M.; Rothgang, S.; Sauer, D.U. Production caused variation in capacity aging trend and correlation to initial cell performance. J. Power Sources 2014, 247, 332–338. [Google Scholar] [CrossRef]
- Krupp, A.; Beckmann, R.; Diekmann, T.; Ferg, E.; Schuldt, F.; Agert, C. Calendar aging model for lithium-ion batteries considering the influence of cell characterization. J. Energy Storage 2022, 45, 103506. [Google Scholar] [CrossRef]
- de Hoog, J.; Timmermans, J.M.; Ioan-Stroe, D.; Swierczynski, M.; Jaguemont, J.; Goutam, S.; Omar, N.; Van Mierlo, J.; Van Den Bossche, P. Combined cycling and calendar capacity fade modeling of a Nickel-Manganese-Cobalt Oxide Cell with real-life profile validation. Appl. Energy 2017, 200, 47–61. [Google Scholar] [CrossRef]


| Source | Date | Focus and Results | Model | Level | ||
|---|---|---|---|---|---|---|
| Electrical | Thermal | Aging | ||||
| Meshabi et al. [10] | 2021 | - Electro-thermal model for a LiNiMnCoO2 pouch cell with distributed dual polarization (2RC) electrical circuits and distributed thermal (RC) circuits. - Relative error of less than 1.35 °C was achieved in a constant current discharge profile with a rate. | √ | √ | × | Cell |
| Li et al. [11] | 2021 | - Modeling of a lithium-ion (LiNiCoAlO2) battery pack - 2-D battery pack electro-thermal model with aging, cooling and pack equilibrium management - First order RC electrical model and thermal model considering single cells and cooling system - Genetic algorithm optimization of battery pack charging strategy considering charging time, aging, and energy loss | √ | √ | √ | Pack & Cell |
| Schmid et al. [12] | 2020 | - Matrix-vector-based framework for modeling and simulation of EV battery packs with LiNiMnCoO2 automotive cells - Dual polarization electrical model (2RC) - Modified Cauer thermal model for each cell in a battery pack and heat transfer between cells, contacts and bus bars of the pack - Holistic aging model for calendar and cycle aging - Model allows for the investigation of three fault cases in the battery pack: Increased contact resistance, external short circuit, internal short circuit | √ | √ | √ | Pack & Cell |
| Zhu et al. [13] | 2019 | - Dual polarization electrical model (2RC) of a LiNiMnCoO2 cell - Excitation of the battery by inverse binary sequences which eliminates drift of operating conditions and even-order non-linearities - Parameter identification by particle swarm optimization (PSO). The RMSE under the urban dynanometer driving schedule (UDSS) of the terminal voltage was . | √ | × | × | Cell |
| Wen et al. [14] | 2019 | - Dual polarization electrical model (2RC) of a LiNiMnCoO2 cell - Parameter identification via recursive least square method with data from pseudo random binary sequence tests - Improved precision for parameters via stochastic theory response reconstruction in contrast to the use of a butterworth filter. | √ | × | × | Cell |
| Irima et al. [15] | 2019 | - EV model of a Renault Zoe consisting of the following parts: Vehicle, Driver, Vehicle Control Unit, Electric Motor and Battery. - Two electrical equivalent models: RC model and 3RC Thevenin model. - Simulation of a speed profile with the Simcenter Amesim platform. | √ | × | × | Pack & Cell |
| Hosseinzadeh et al. [16] | 2018 | - 1D electrochemical-thermal model of a LiNiMnCoO2 pouch cell for an EV. - 3D lumped thermal model of cell. - Decrease of ambient temperature from 45 °C to 5 °C leads to a capacity drop by 17.1% for a discharge and a power loss of 7.57% under WLTP drive cycle. | √ | √ | × | Cell |
| Jafari et al. [17] | 2018 | - EV battery cycle aging evaluation for driving and vehicle-to-grid services - Cycle aging model for LiFePO4 cells with dependency on C-rate, total Ah throughput and temperature | × | × | √ | Cell |
| Gao et al. [18] | 2017 | - Measurement of capacity degradation and resistance increase for LiCoO2 18,650 cells - Aging mechanisms are identified via incremental capacity analysis: Loss of active material and loss of lithium inventory. - Overall aging accelerates dramatically for rates over and when the cut-off voltage exceeds . -Establishment of a capacity degradation model. | × | × | √ | Cell |
| Schmalstieg et al. [19] | 2014 | - Holistic aging model for LiNiMnCoO2 based 18,650 lithium-ion cells - Calendar aging tests for different storage SOCs and temperatures and cycle aging tests for different DODs and average SOCs. - Capacity and inner resistance trend measured with a discharge and pulse power characterization profile respectively. - Electric model consists of series resistance, two ZARC elements and an OCV source parameterized by EIS measurements. | √ | √ | √ | Cell |
| General Specifications | |
|---|---|
| Max. speed | 125 |
| Acceleration 0– 100 | |
| Weight | 900 |
| Traction Battery | |
| Chemistry | Li-Ion (NMC/Graphite) |
| Nominal Capacity | |
| Rated/Max Voltage | 339 / 391 |
| Rated capacity | 52 |
| Layout | 93s1p |
| Weight | |
| Permissible Temperature | −25–55 |
| Cooling | liquid cooling (water/glycol mixture) |
| Electric Motor | |
| Motor type | AC synchronous motor |
| Max. output | 55 |
| Max. continuous output | 35 |
| Peak Torque | 130 Nm |
| Max. rpm | 11,800 |
| On-Board Charger | |
| Standard | IEC62196-2 & ISO 155118 |
| Type | 1-phase AC & 3-phase AC |
| Max. Power | 22 |
| Battery Cell Specifications: | |
|---|---|
| Name | HEA50 high energy cell |
| Type specification | ICS 13/330/162, IMP 13/330/162 |
| Manufacturer | li-Tec (Daimler AG) |
| SOC operation limit | 3.2–95.3% |
| Nominal capacity | 52 ( C discharge) |
| Nominal voltage | |
| Voltage range | 3.0–4.2 |
| Temperature range | −25–55 |
| Gravimetric energy density | 147 / |
| Volumetric energy density | 280 / |
| Inner resistance | ≤ ( 5 , 200 , 50% SOC) |
| Cathode | Li-Ion with LITARION® NMC |
| (33% Ni, 33% Co, 33% Mn [53]) | |
| Anode | Graphite |
| Anode terminal | Copper |
| Cathode terminal | Aluminum |
| Separator | Ceramic (SEPARION®) |
| Cell case material | PET |
| Width × length × depth | × × ( 50% SOC) |
| Weight | |
| Material | Specific Heat Capacity in kJ/(kg K) |
|---|---|
| Cell | 1095 [67] |
| Steel | 502 [68] |
| Aluminum | 891 [69] |
| Plastic (PP) | 1570 [70] |
| Air | 1.01 [67] |
| Charging Mode | Possible Setpoints |
|---|---|
| 1-phase charging | and |
| 3-phase charging | – 11 in 690 steps |
| Parameter | Pack | Modules with Slave BMS |
|---|---|---|
| Volume in | 95.86 | 74.5 |
| Mass in | 179.6 | 146.5 |
| Surface area in | 1.69 | 1.36 |
| Parameter | EV Operation | Lab Pack Test |
|---|---|---|
| in | ||
| in | ||
| in | ||
| in |
| Laboratory Pack Test | EV Operation | |||
|---|---|---|---|---|
| Profile parameters: | ||||
| Profile | Discharge | Charge | Driving | Charge () |
| Figure | Figure 11a | Figure 11b | Figure 11c | Figure 11d |
| Charge in Ah | ||||
| Energy in kWh | ||||
| Duration in min | 55.95 | 60.78 | 29.88 | 105 |
| Cell voltage deviation: | ||||
| RMSE in mV | 18.49 | 31.26 | 67.17 | 30.22 |
| Max. abs. error in mV | 80.92 | 59.45 | 278.87 | 43.59 |
| Pack temperature deviation: | ||||
| RMSE in K | 0.36 | 1.29 | n.a. | n.a. |
| Max. abs. error in K | 1.05 | 1.99 | n.a. | n.a. |
Publisher’s Note: MDPI stays neutral with regard to jurisdictional claims in published maps and institutional affiliations. |
© 2022 by the authors. Licensee MDPI, Basel, Switzerland. This article is an open access article distributed under the terms and conditions of the Creative Commons Attribution (CC BY) license (https://creativecommons.org/licenses/by/4.0/).
Share and Cite
Rücker, F.; Schoeneberger, I.; Wilmschen, T.; Chahbaz, A.; Dechent, P.; Hildenbrand, F.; Barbers, E.; Kuipers, M.; Figgener, J.; Sauer, D.U. A Comprehensive Electric Vehicle Model for Vehicle-to-Grid Strategy Development. Energies 2022, 15, 4186. https://doi.org/10.3390/en15124186
Rücker F, Schoeneberger I, Wilmschen T, Chahbaz A, Dechent P, Hildenbrand F, Barbers E, Kuipers M, Figgener J, Sauer DU. A Comprehensive Electric Vehicle Model for Vehicle-to-Grid Strategy Development. Energies. 2022; 15(12):4186. https://doi.org/10.3390/en15124186
Chicago/Turabian StyleRücker, Fabian, Ilka Schoeneberger, Till Wilmschen, Ahmed Chahbaz, Philipp Dechent, Felix Hildenbrand, Elias Barbers, Matthias Kuipers, Jan Figgener, and Dirk Uwe Sauer. 2022. "A Comprehensive Electric Vehicle Model for Vehicle-to-Grid Strategy Development" Energies 15, no. 12: 4186. https://doi.org/10.3390/en15124186
APA StyleRücker, F., Schoeneberger, I., Wilmschen, T., Chahbaz, A., Dechent, P., Hildenbrand, F., Barbers, E., Kuipers, M., Figgener, J., & Sauer, D. U. (2022). A Comprehensive Electric Vehicle Model for Vehicle-to-Grid Strategy Development. Energies, 15(12), 4186. https://doi.org/10.3390/en15124186