
Numerical Study of the Thermal and Fluid Behavior of Three-Dimensional Microstructures for Efficient Catalytic Converters


Abstract
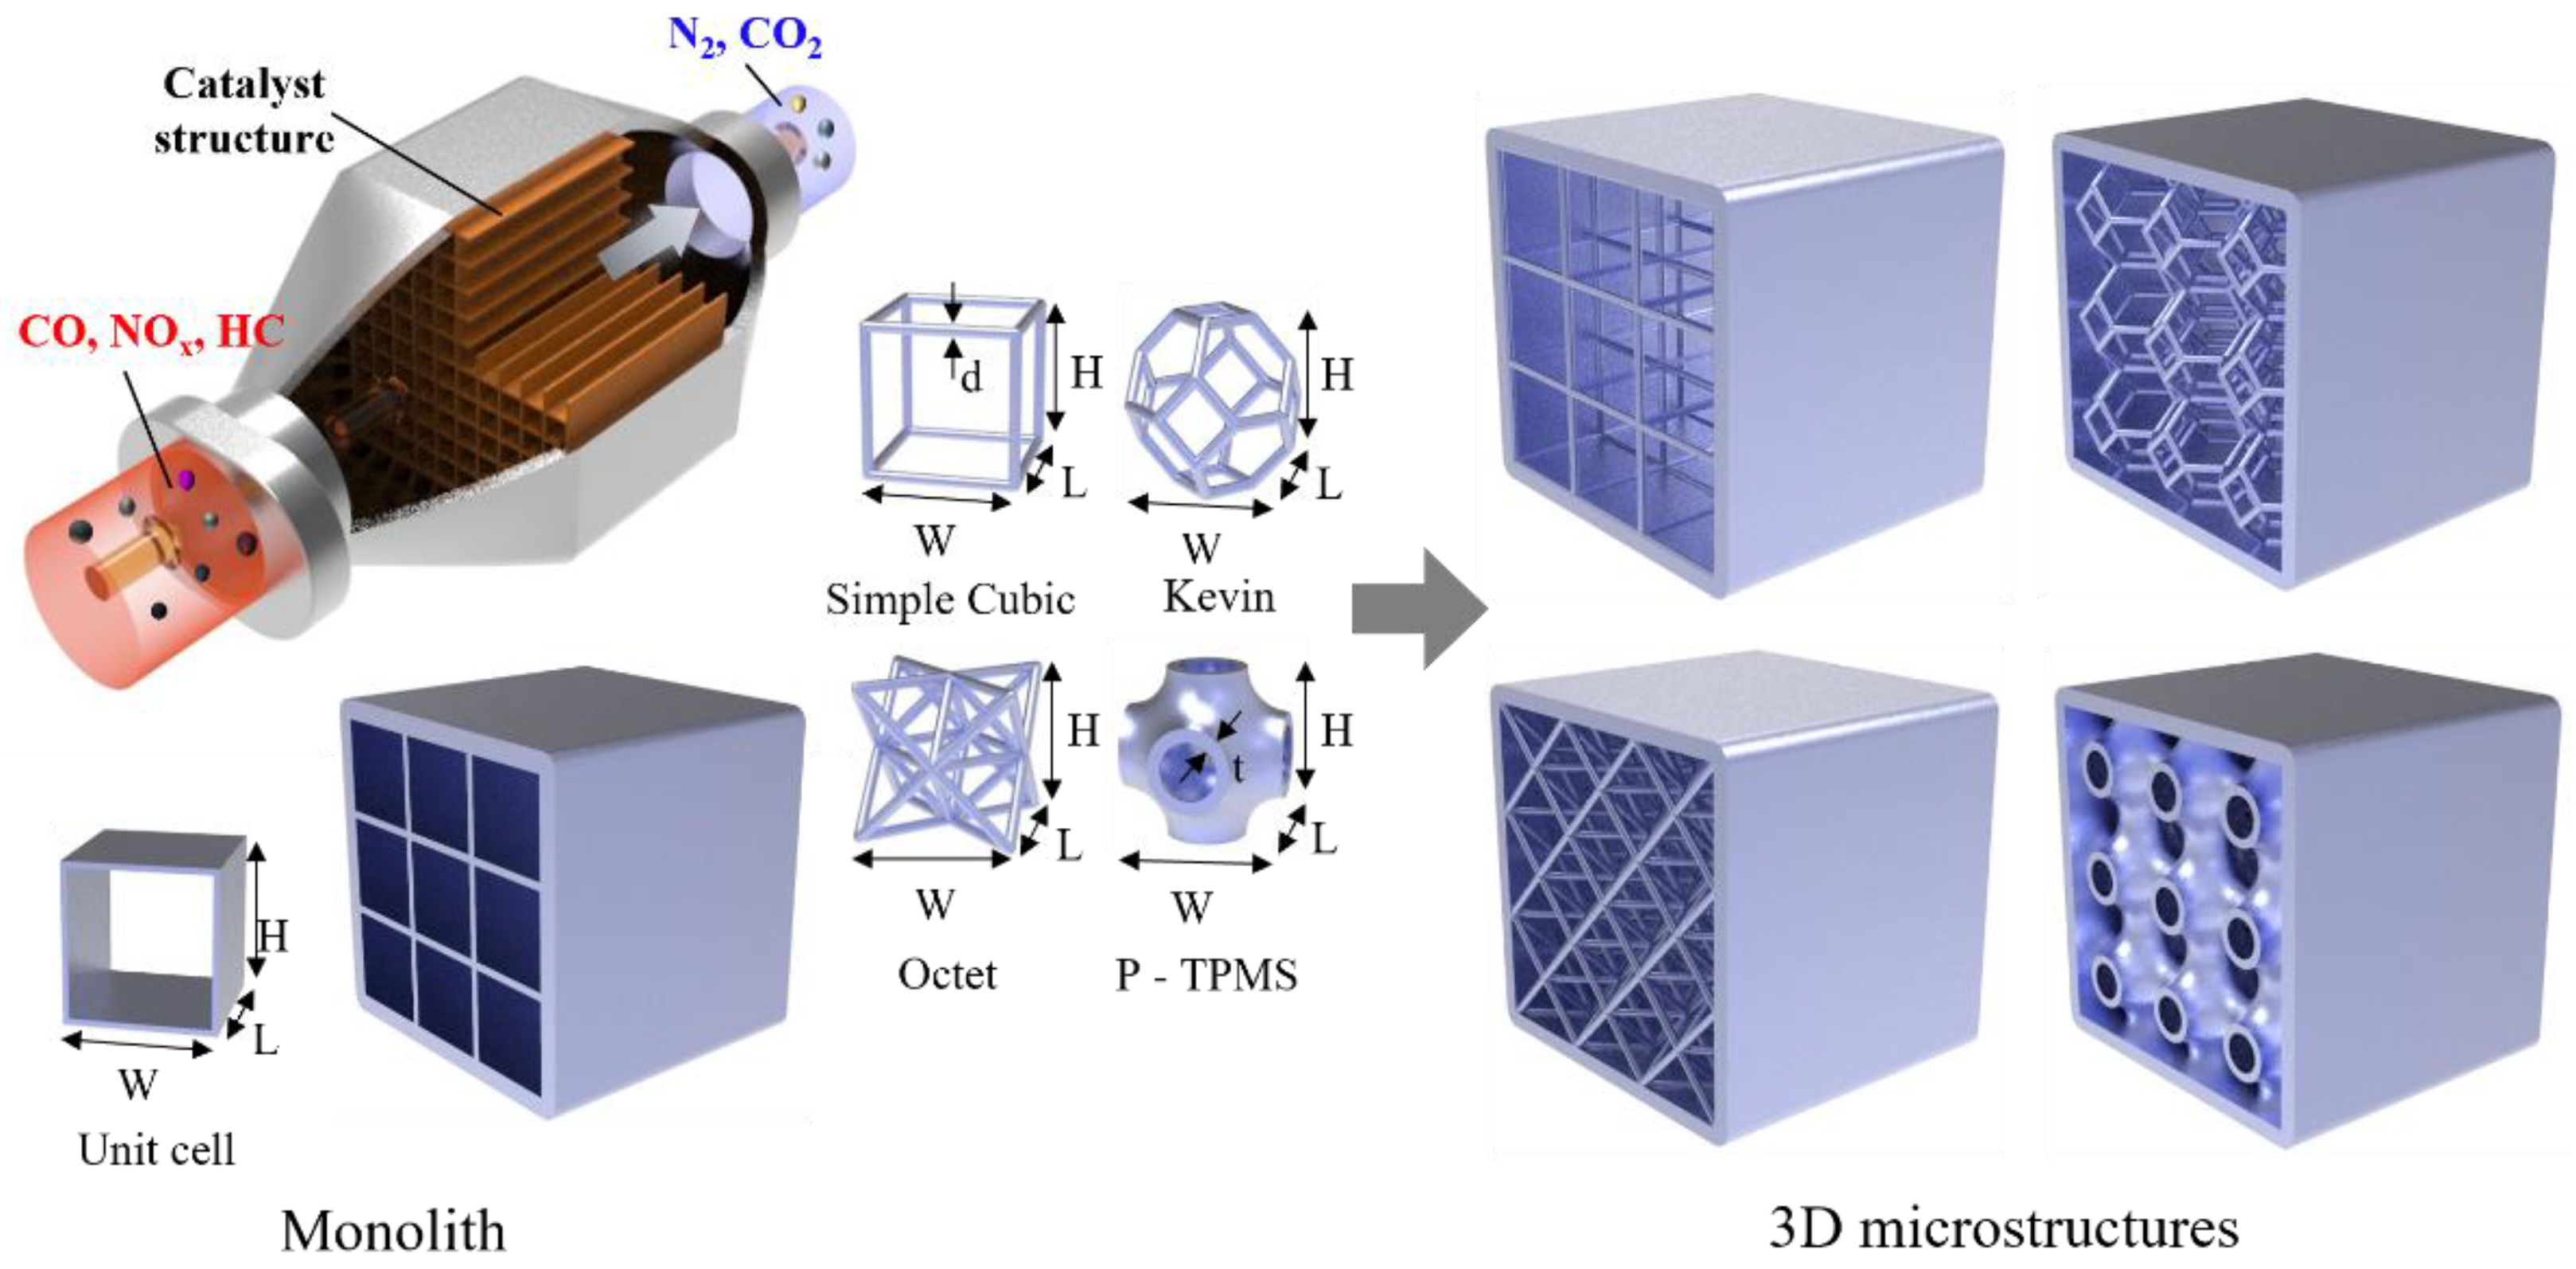
:1. Introduction
2. Materials and Methods
2.1. Methods
2.2. Governing Equations
2.3. Modeling and Boundary Conditions
3. Results and Discussion
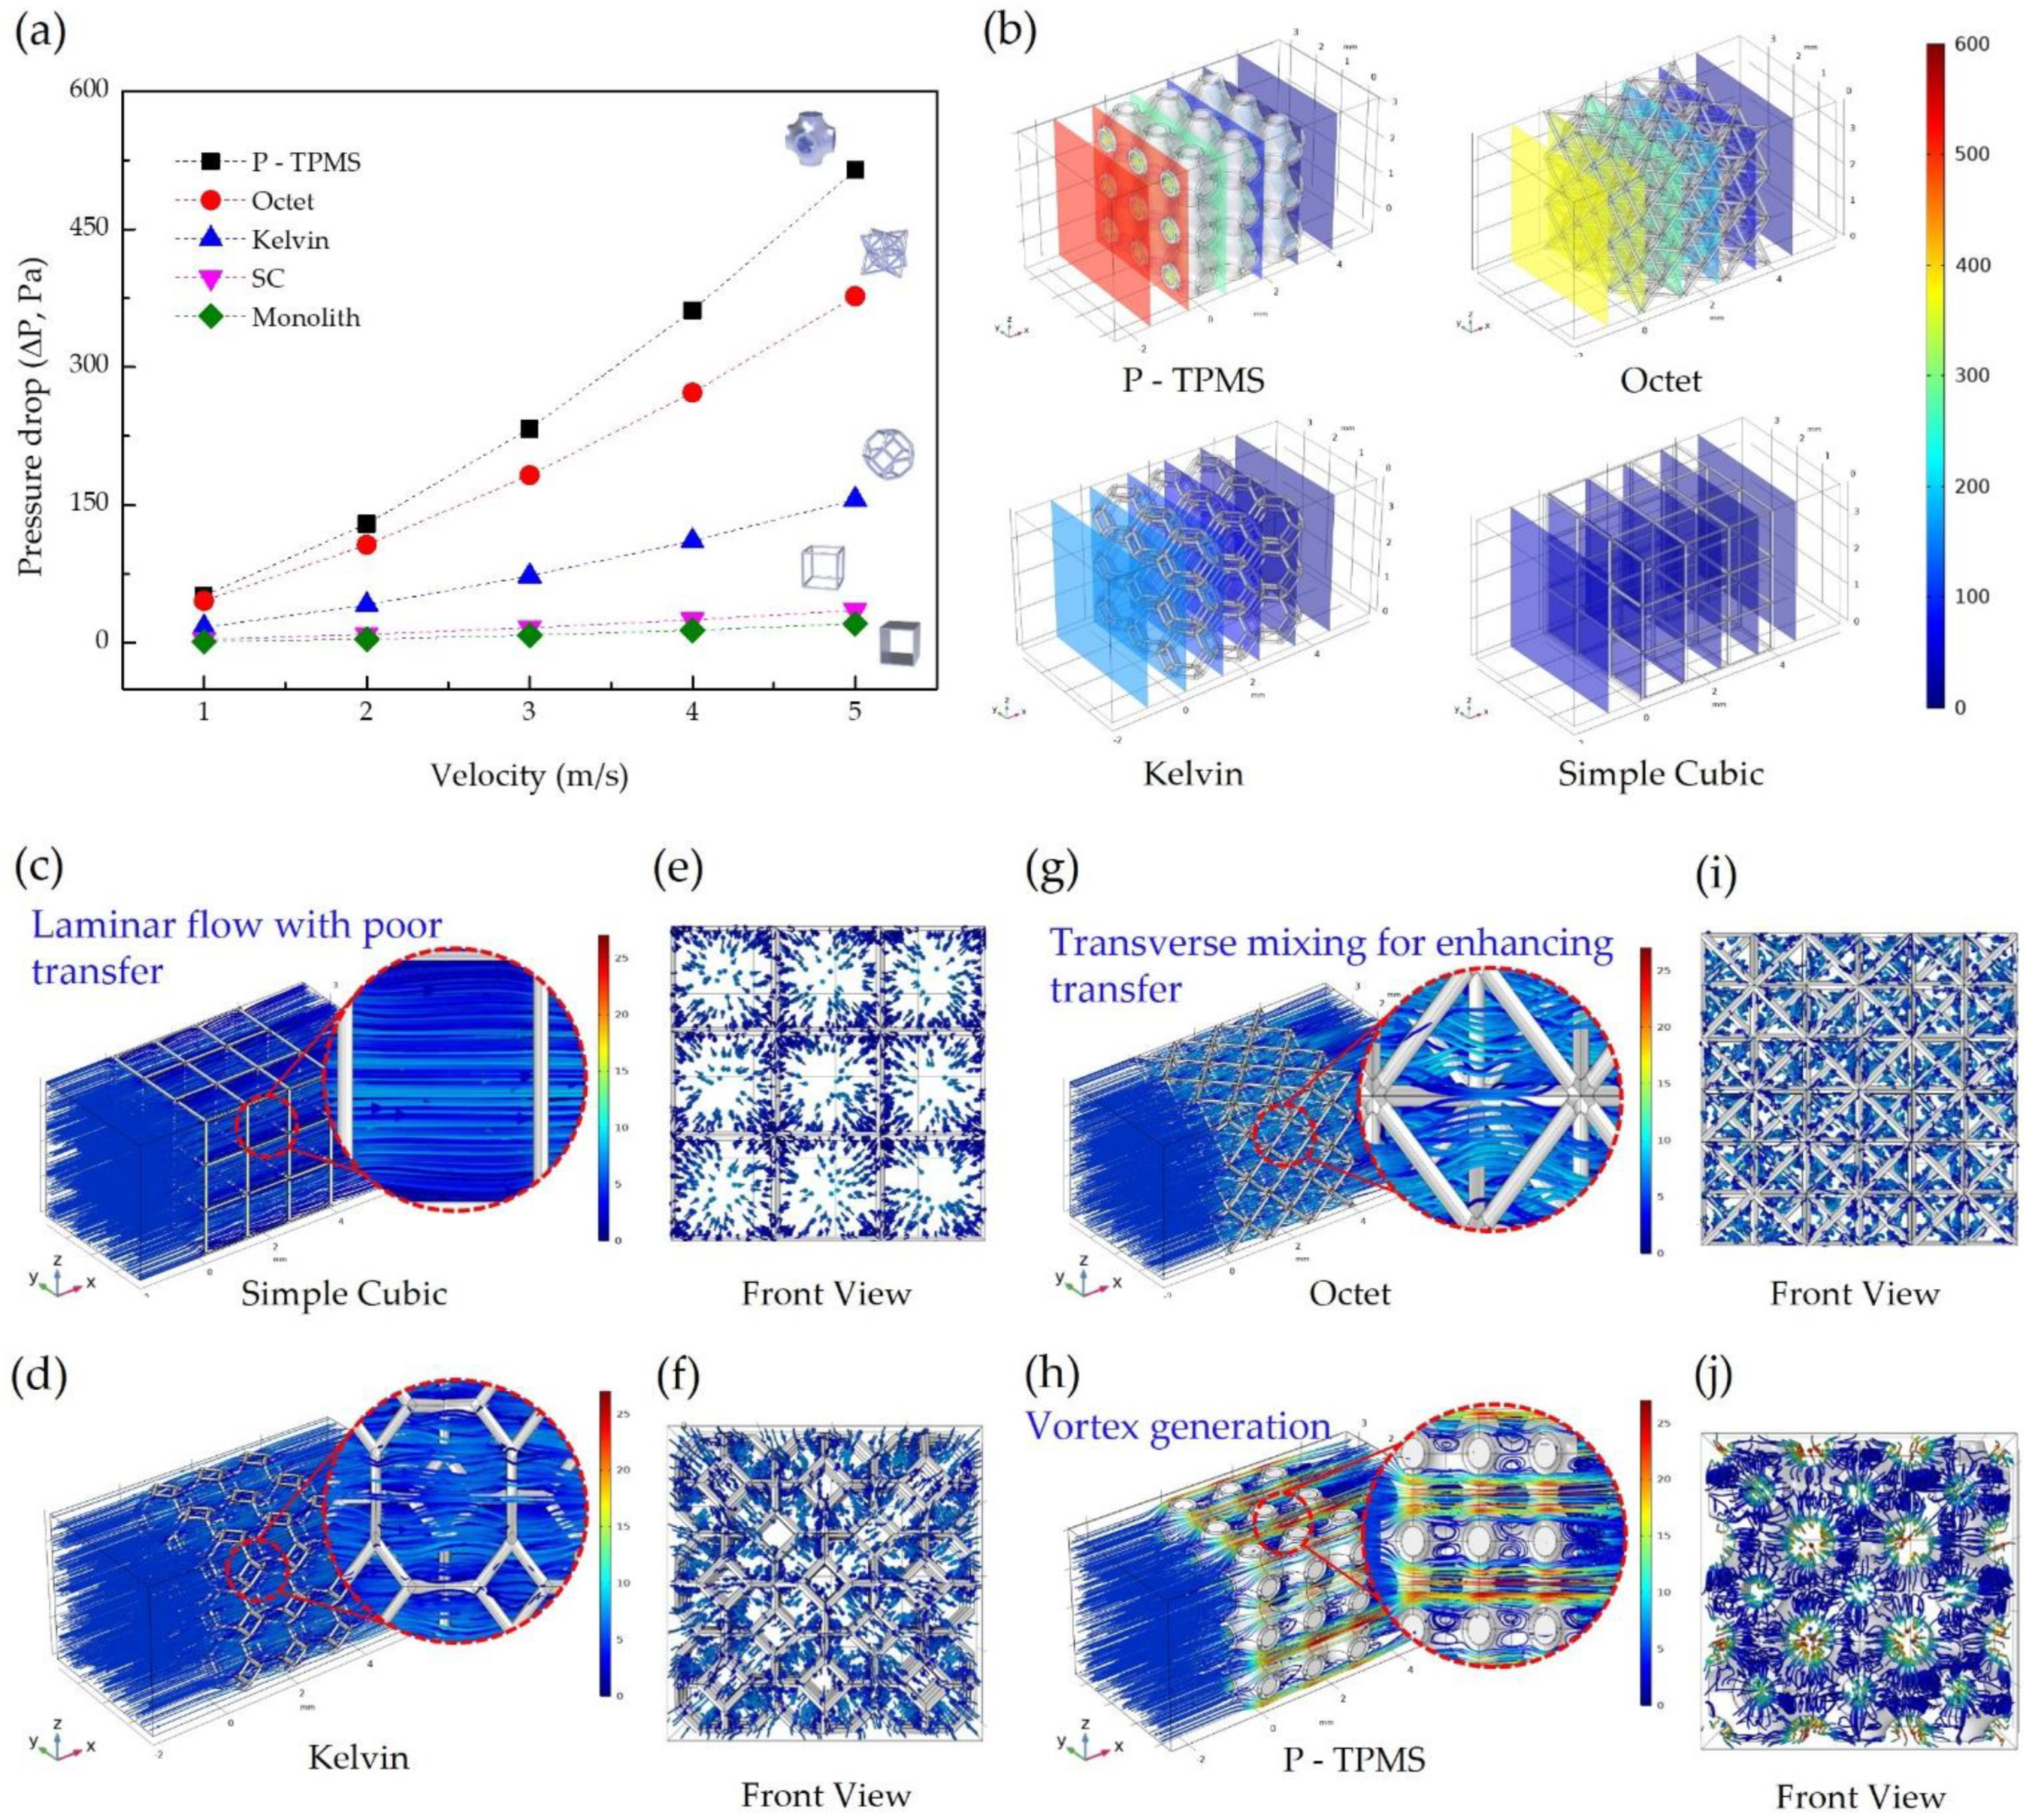
3.1. Pressure Drop
3.2. Velocity Distribution
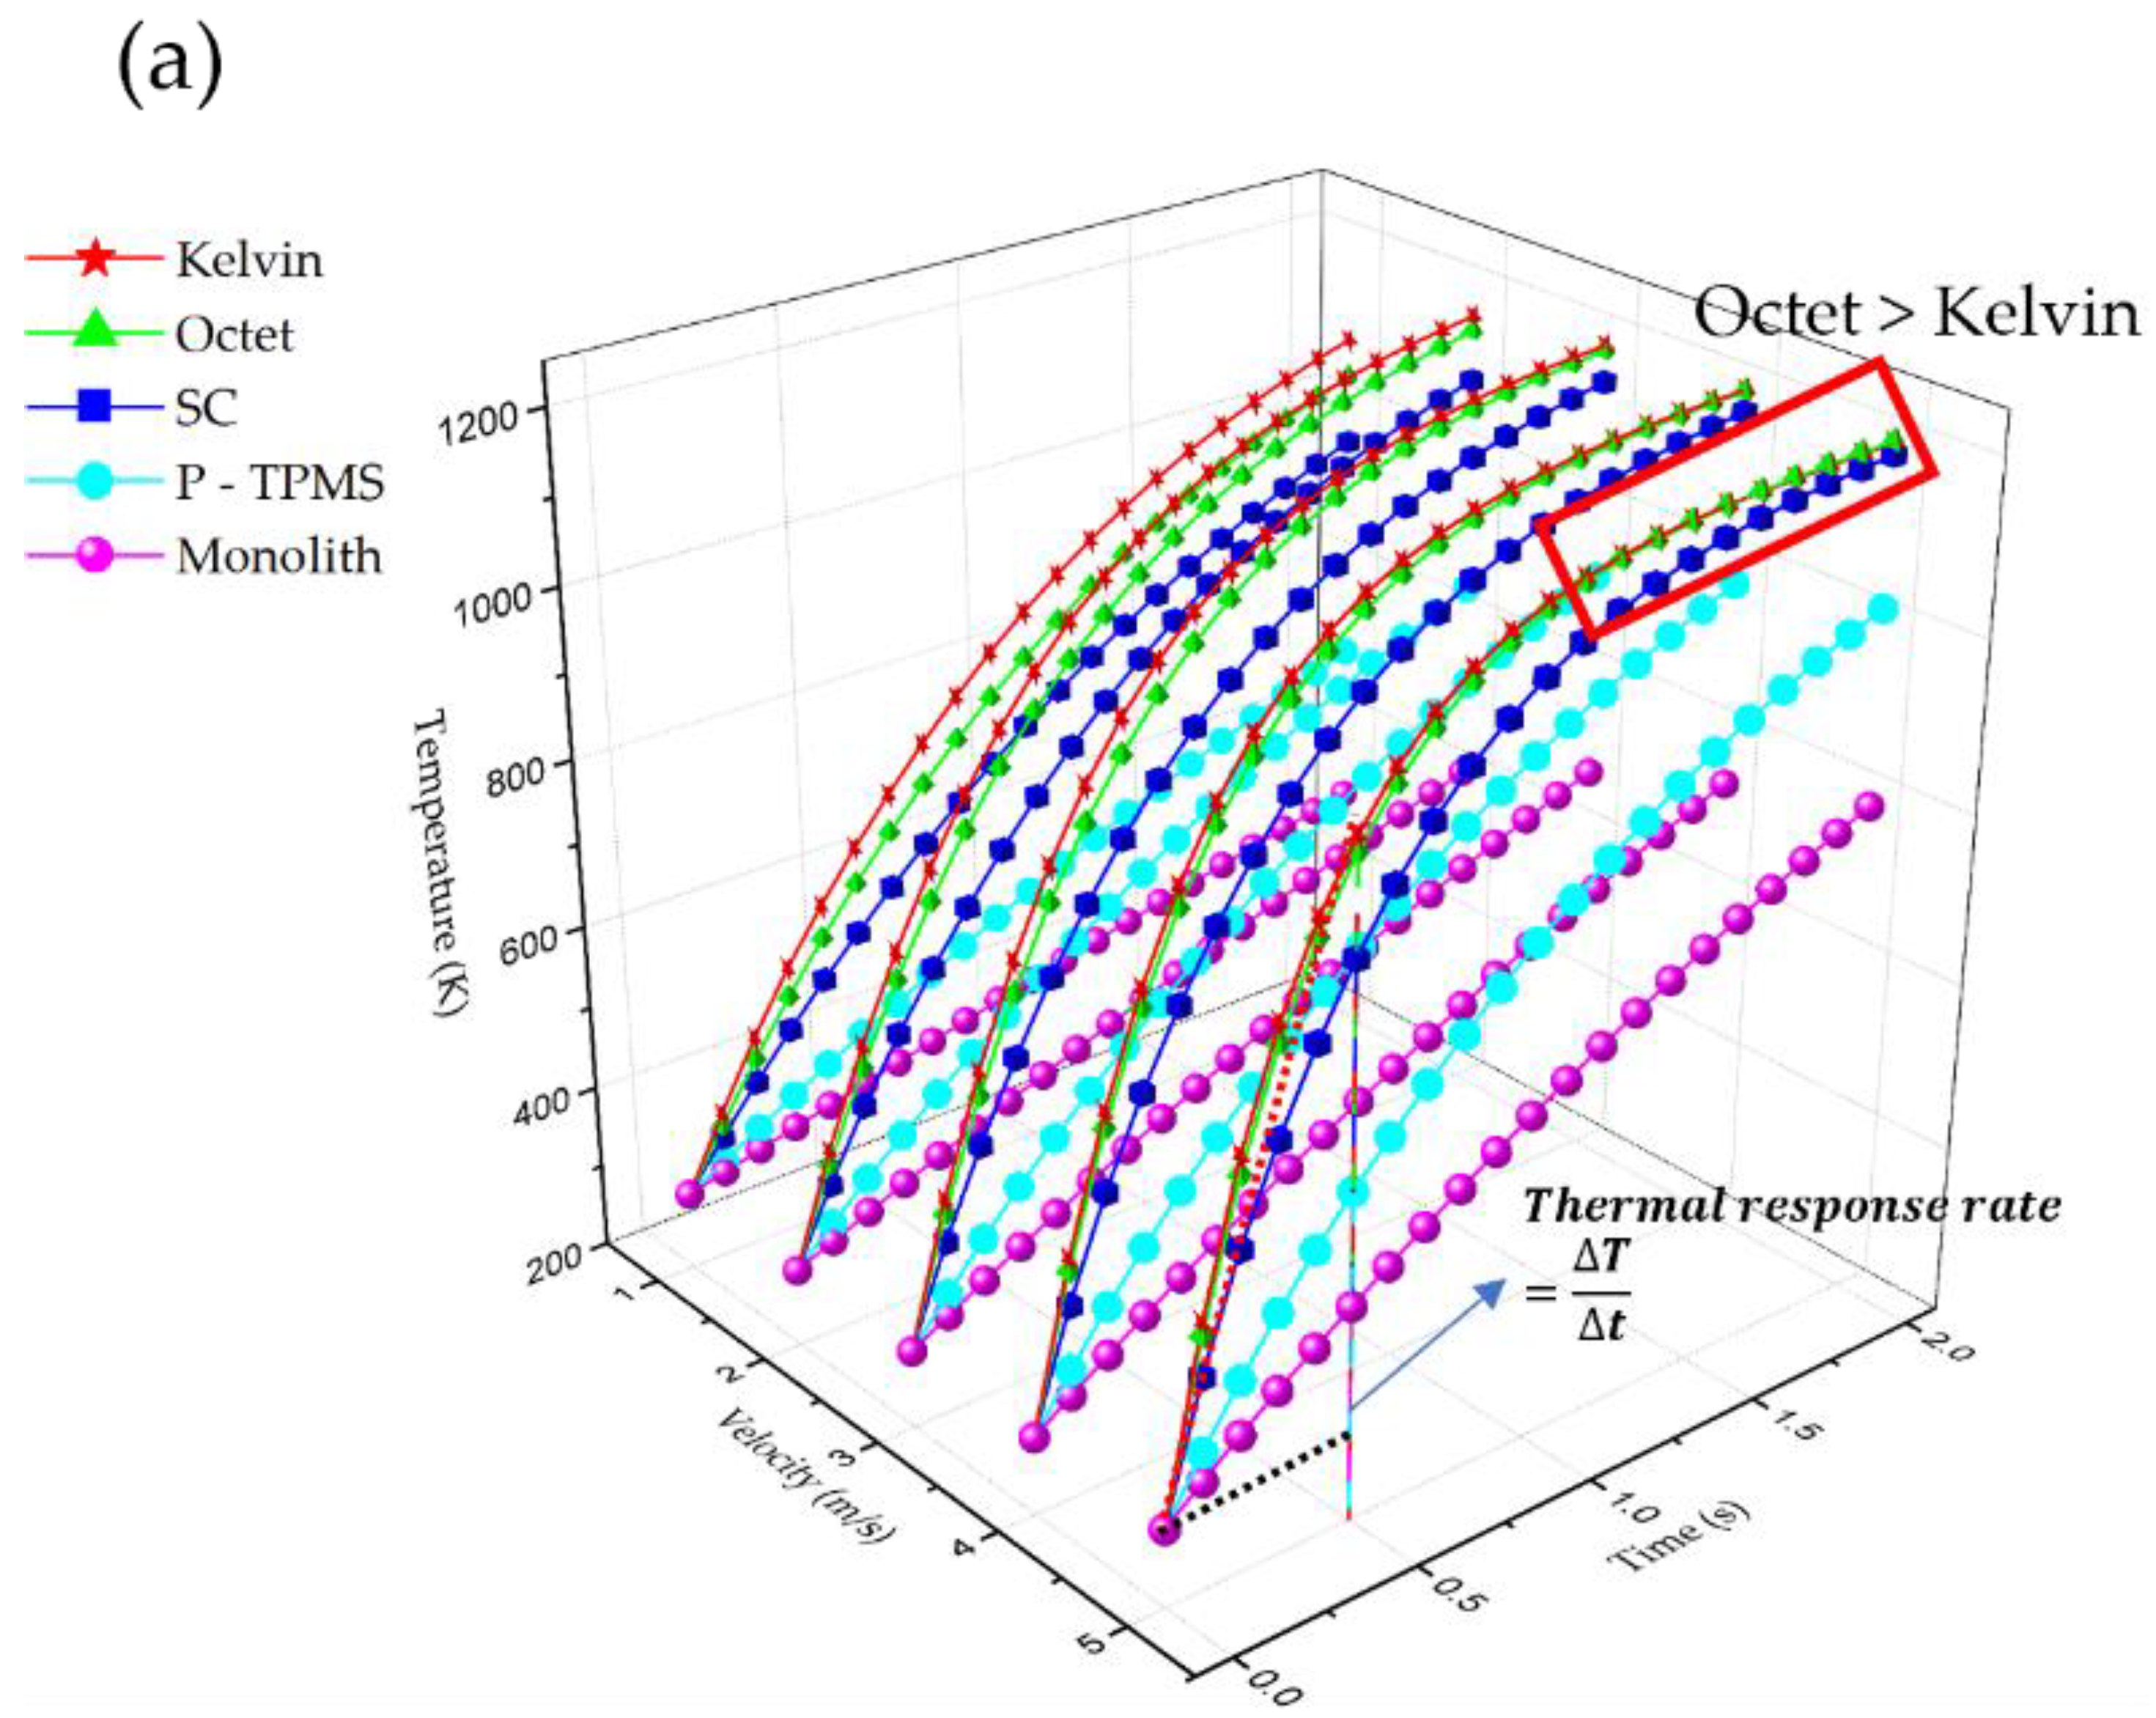
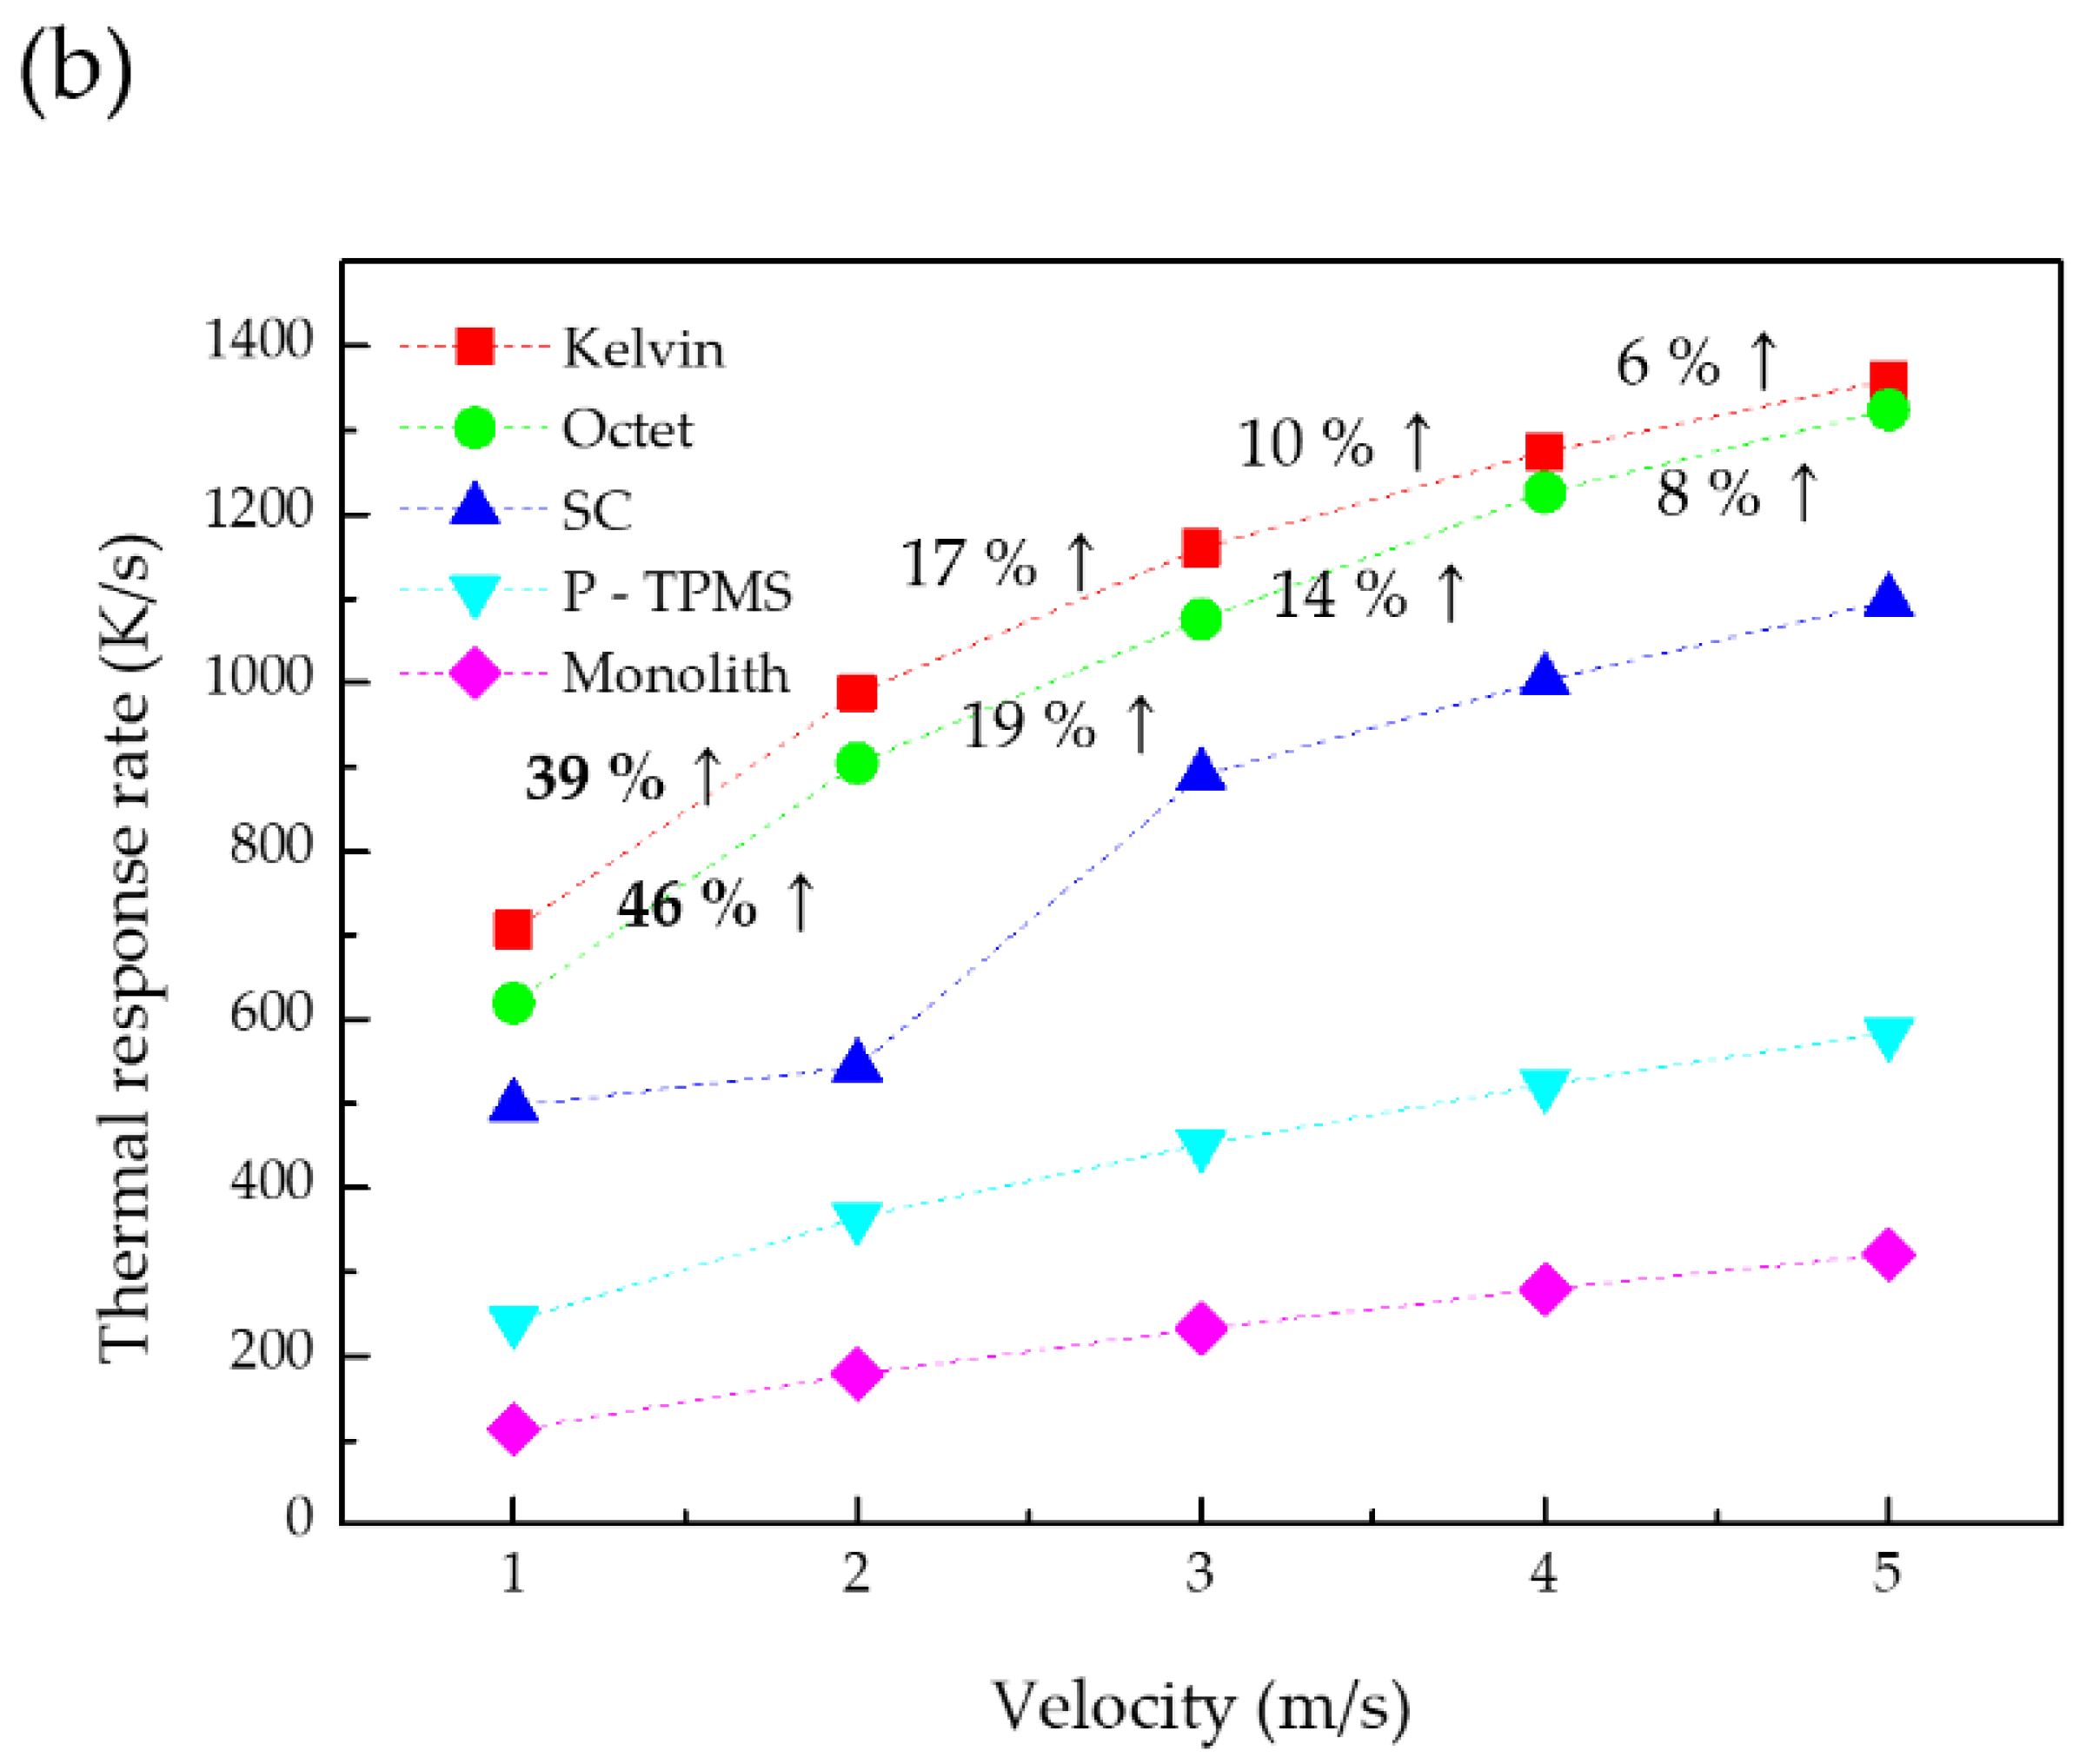
3.3. Thermal Response
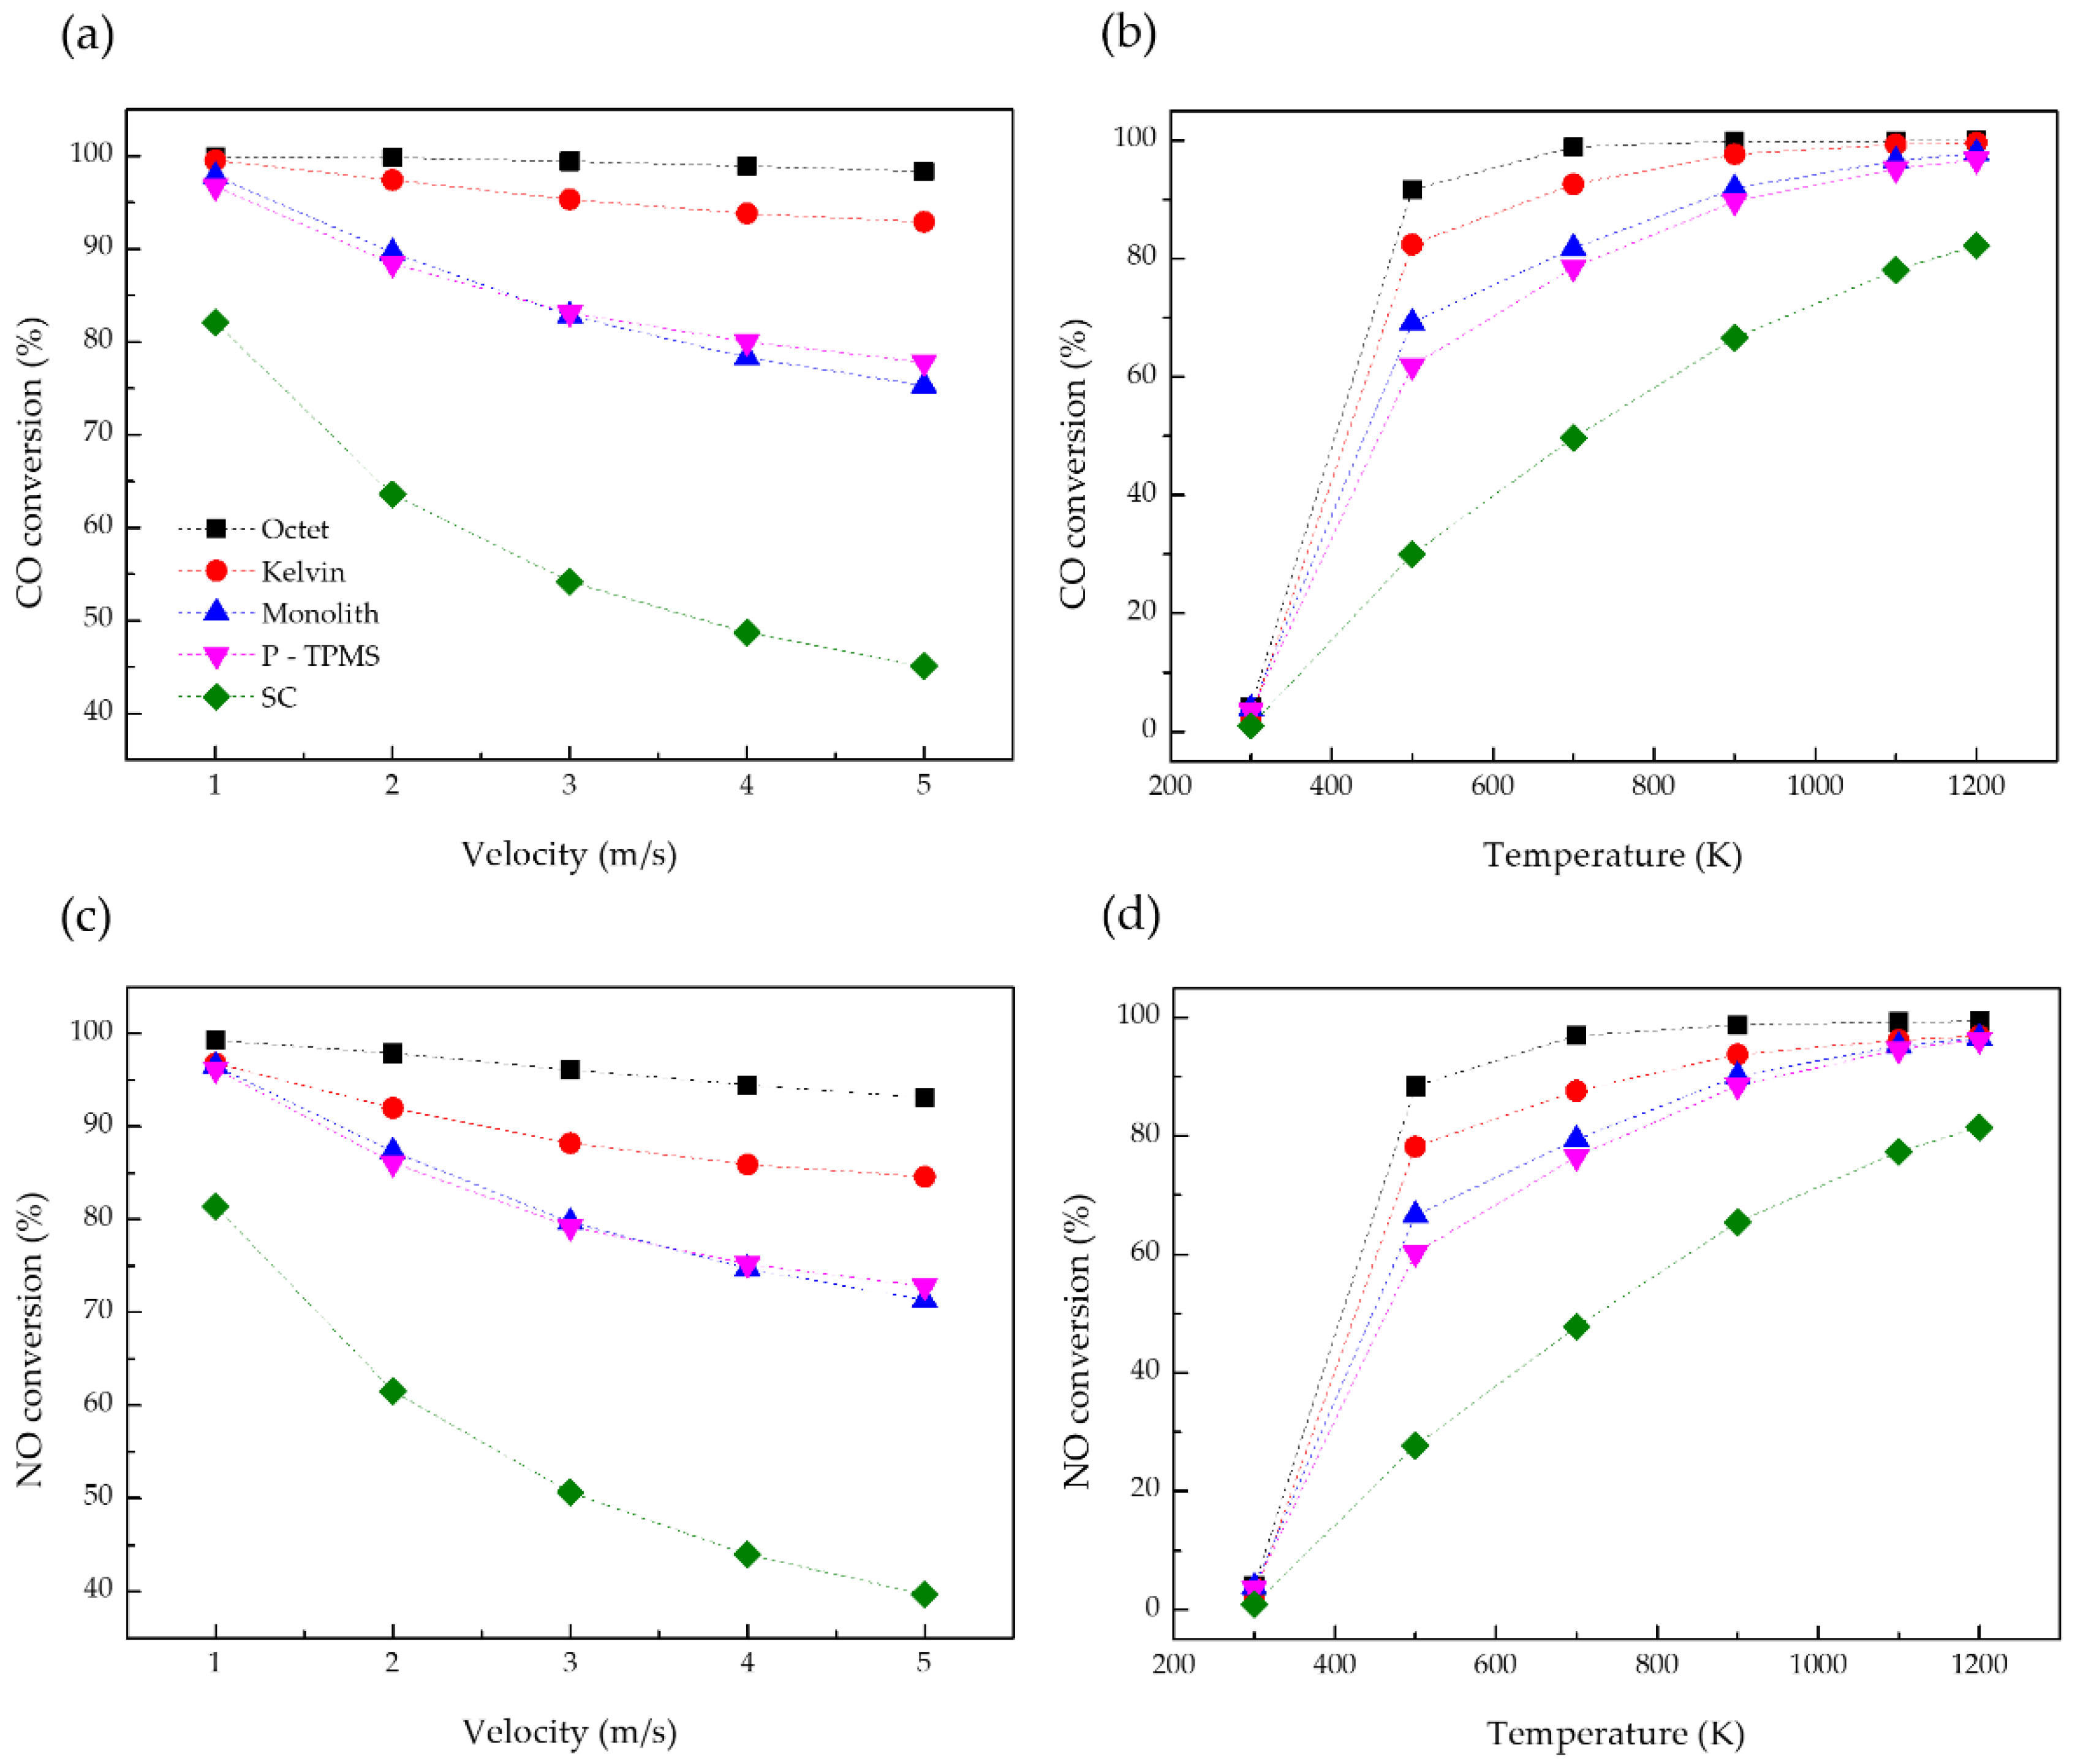
3.4. Chemical Reactions
4. Conclusions
- (1)
- Pressure drop and thermal reaction rate are significant variables that affect the efficiency of the catalytic converter. Pressure drop affects the vehicle’s driving efficiency and, thus, overall vehicle efficiency. The pressure drop of the octet structure can be large depending on the flow rate, but catalytic conversion efficiency does not decrease owing to the turbulent flow mixing in the structure. These results can help save energy by assessing the problems that lead to energy loss.
- (2)
- Considering the overall catalytic conversion efficiency and driving efficiency, it was concluded that the Kelvin structure is the most suitable for catalytic converters.
- (3)
- Finally, to increase the efficiency of the catalyst, the applied structure should have a high thermal response rate and a large surface area. The SAV ratio should not be considered the only parameter when designing the catalyst substrate. The SC structure had the highest SAV ratio among the studied structures, but it showed the lowest catalytic conversion efficiency in simulations. The SC structure has an extremely low relative density in comparison with the other structures; consequently, its thermal response was rapid. However, its catalytic conversion efficiency was low because the total reactive surface area was small. Thus, although it is crucial to reach the light-off temperature rapidly, the surface area of the catalyst structure is the most important variable in terms of catalyst conversion efficiency.
Author Contributions
Funding
Institutional Review Board Statement
Informed Consent Statement
Data Availability Statement
Conflicts of Interest
References
- Shen, H.; Shamim, T.; Sengupta, S. An investigation of catalytic converter performances during cold starts. SAE Tech. Pap. 1999, 1, 3473. [Google Scholar] [CrossRef]
- Yusuf, A.A.; Inambao, F.L. Effect of cold start emissions from gasoline-fueled engines of light-duty vehicles at low and high ambient temperatures: Recent trends. Case Stud. Therm. Eng. 2019, 14, 100417. [Google Scholar] [CrossRef]
- Baba, N.; Ohsawa, K.; Sugiura, S. Numerical approach for improving the conversion characteristics of exhaust catalysts under warming-up condition. SAE Trans. 1996, 105, 2064–2079. [Google Scholar] [CrossRef]
- Favez, J.Y.; Weilenmann, M.; Stilli, J. Cold start extra emissions as a function of engine stop time: Evolution over the last 10 years. Atmos. Environ. 2009, 43, 996–1007. [Google Scholar] [CrossRef]
- Li, G.; Li, L.; Liu, Z.; Li, Z. Real time NO emissions measurement during cold start in LPG SI engine. Energy Convers. Manag. 2007, 48, 2508–2516. [Google Scholar] [CrossRef]
- Sabatini, S.; Kil, I.; Dekar, J. A new semi-empirical temperature model for the three way catalytic converter. IFAC-Pap. 2015, 48, 434–440. [Google Scholar] [CrossRef]
- Giani, L.; Groppi, G.; Tronconi, E. Mass-transfer characterization of metallic foams as supports for structured catalysts. Ind. Eng. Chem. Res. 2005, 44, 4993–5002. [Google Scholar] [CrossRef]
- Lucci, F.; Della Torre, A.; Montenegro, G. On the catalytic performance of open cell structures versus honeycombs. Chem. Eng. J. 2015, 264, 514–521. [Google Scholar] [CrossRef]
- Von Rickenbach, J.; Lucci, F.; Eggenschwiler, P.D. Pore scale modeling of cold-start emissions in foam based catalytic reactors. Chem. Eng. Sci. 2015, 138, 446–456. [Google Scholar] [CrossRef]
- Moon, C.; Kim, D.; Abadi, G.B.; Yoon, S.Y. Effect of ligament hollowness on heat transfer characteristics of open-cell metal foam. Int. J. Heat Mass Transf. 2016, 102, 911–918. [Google Scholar] [CrossRef]
- Kopanidis, A.; Theodorakakos, A.; Gavaises, E. 3D numerical simulation of flow and conjugate heat transfer through a pore scale model of high porosity open cell metal foam. Int. J. Heat Mass Transf. 2010, 53, 2539–2550. [Google Scholar] [CrossRef]
- Lu, W.; Zhao, C.Y.; Tassou, S.A. Thermal analysis on metal-foam filled heat exchangers. Part I: Metal-foam filled pipes. Int. J. Heat Mass Transf. 2006, 49, 2751–2761. [Google Scholar] [CrossRef]
- Tanner, C.W.; Twiggs, K.; Tao, T.; Bronfenbrenner, D. High porosity substrates for fast-light-off applications. SAE Tech. Pap. 2015, 1, 1009. [Google Scholar] [CrossRef] [Green Version]
- Zhu, C.; Qi, Z.; Beck, V.A.; Luneau, M.; Lattimer, J.; Chen, W.; Worsley, M.A.; Ye, J.; Duoss, E.B.; Spadaccini, C.M.; et al. Toward digitally controlled catalyst architectures: Hierarchical nanoporous gold via 3D printing. Sci. Adv. 2018, 4, eaas9459. [Google Scholar] [CrossRef] [PubMed] [Green Version]
- Blanchette, C.D.; Knipe, J.M.; Stolaroff, J.K.; De Otte, J.R.; Oakdale, J.S.; Maiti, A.; Lenhardt, J.M.; Sirajuddin, S.; Rosenzweig, A.C.; Baker, S.E. Printable enzyme-embedded materials for methane to methanol conversion. Nat. Commun. 2016, 7, 11900. [Google Scholar] [CrossRef] [Green Version]
- Kim, S.; Handler, J.J.; Cho, Y.T.; Barbastathis, G.; Fang, N.X. Scalable 3D printing of aperiodic cellular structures by rotational stacking of integral image formation. Sci. Adv. 2021, 7, eabh1200. [Google Scholar] [CrossRef]
- Schaedler, T.A.; Carter, W.B. Architected Cellular Materials. Annu. Rev. Mater. Res. 2016, 46, 187–210. [Google Scholar] [CrossRef]
- Kim, S.; Kim, D.H.; Kim, W.; Cho, Y.T.; Fang, N.X. Additive Manufacturing of Functional Microarchitected Reactors for Energy, Environmental, and Biological Applications. Int. J. Precis. Eng. Manuf.-Green Tech. 2021, 8, 303–326. [Google Scholar] [CrossRef]
- Beck, V.A.; Ivanovskaya, A.N. Inertially enhanced mass transport using 3D-printed porous flow-through electrodes with periodic lattice structures. Proc. Natl. Acad. Sci. USA 2021, 118, e2025562118. [Google Scholar] [CrossRef]
- Steiner, T.; Neurauter, D.; Moewius, P.; Pfeifer, C.; Schallhart, V.; Moeltner, L. Heat-Up Performance of Catalyst Carriers—A Parameter Study and Thermodynamic Analysis. Energies 2021, 14, 964. [Google Scholar] [CrossRef]
- Ibrahim, H.A.; Ahmed, W.H.; Abdou, S.; Blagojevic, V. Experimental and numerical investigations of flow through catalytic converters. Int. J. Heat Mass Transf. 2018, 127, 546–560. [Google Scholar] [CrossRef]
- Amirnordin, S.H.; Seri, S.M.; Salim, W.S.W.; Rahman, H.A.; Hasnan, K. Pressure drop analysis of square and hexagonal cells and its effects on the performance of catalytic converters. Int. J. Environ. Sci. Dev. 2011, 2, 239–247. [Google Scholar] [CrossRef]
- Hajimirzaee, S.; Doyle, A.M. 3D printed catalytic converters with enhanced activity for low-temperature methane oxidation in dual-fuel engines. Fuel 2020, 274, 117848. [Google Scholar] [CrossRef]
- Cornejo, I.; Nikrityuk, P.; Hayes, R.E. The influence of channel geometry on the pressure drop in automotive catalytic converters: Model development and validation. Chem. Eng. Sci. 2020, 212, 115317. [Google Scholar] [CrossRef]
- COMSOL Multiphysics Reference Manual. Available online: https://doc.comsol.com/5.6/docserver/#!/com.comsol.help.comsol/helpdesk/helpdesk.html (accessed on 27 April 2022).
- García-Vázquez, M.; Zhang, G.; Hong, Z.; Gu, X.; Garcia-Garcia, F.R. Micro-structured catalytic converter for residual methane emission abatement. Chem. Eng. J. 2020, 396, 125379. [Google Scholar] [CrossRef]
- Zhu, J.; Wu, P.; Chao, Y.; Yu, J.; Zhu, W.; Liu, Z.; Xu, C. Recent advances in 3D printing for catalytic applications. Chem. Eng. J. 2021, 433, 134341. [Google Scholar] [CrossRef]
- Papetti, V.; Eggenschwiler, P.D.; Della Torre, A.; Lucci, F.; Ortona, A.; Montenegro, G. Additive manufactured open cell polyhedral structures as substrates for automotive catalysts. Int. J. Heat Mass Transf. 2018, 126, 1035–1047. [Google Scholar] [CrossRef]
- Zhang, X.; Zhang, K.; Zhang, L.; Wang, W.; Li, Y.; He, R. Additive manufacturing of cellular ceramic structures: From structure to structure-function integration. Mater. Des. 2022, 215, 110470. [Google Scholar] [CrossRef]
- Oskooei, A.B.; Koohsorkhi, J.; Mehrpooya, M. Simulation of plasma-assisted catalytic reduction of NOx, CO, and HC from diesel engine exhaust with COMSOL. Chem. Eng. Sci. 2019, 197, 135–149. [Google Scholar] [CrossRef]
- Hayes, R.E.; Fadic, A.; Mmbaga, J.; Najafi, A. CFD modelling of the automotive catalytic converter. Catal. Today 2012, 188, 94–105. [Google Scholar] [CrossRef]
- Pontikakis, G.N.; Stamatelos, A.M. Identification of catalytic converter kinetic model using a genetic algorithm approach. Proc. Inst. Mech. Eng. Part D J. Automob. Eng. 2004, 218, 1455–1472. [Google Scholar] [CrossRef]
- Santos, H.; Costa, M. Modelling transport phenomena and chemical reactions in automotive three-way catalytic converters. Chem. Eng. J. 2009, 148, 173–183. [Google Scholar] [CrossRef]
- Ferguson, N.B.; Finlayson, B.A. Transient modeling of a catalytic converter to reduce nitric oxide in automobile exhaust. AIChE J. 1974, 20, 539–550. [Google Scholar] [CrossRef]
- Kočí, P.; Kubíček, M.; Marek, M. Modeling of three-way-catalyst monolith converters with microkinetics and diffusion in the washcoat. Ind. Eng. Chem. Res. 2004, 43, 4503–4510. [Google Scholar] [CrossRef]
- Kato, S.; Ozeki, H.; Yamada, H.; Tagawa, T.; Takahashi, N.; Shinjoh, H. Analysis of the gas diffusivity in the simulated washcoat layer based on mean transport pore model and the mean molecular speed. Chem. Eng. Trans. 2015, 43, 1591–1596. [Google Scholar] [CrossRef]
- Bohm, M.; Stetina, J.; Svida, D. Exhaust Gas Temperature Pulsations of a Gasoline Engine and Its Stabilization Using Thermal Energy Storage System to Reduce Emissions. Energies 2022, 15, 2365. [Google Scholar] [CrossRef]
- Kim, T.; Hodson, H.P.; Lu, T.J. Contribution of vortex structures and flow separation to local and overall pressure and heat transfer characteristics in an ultralightweight lattice material. Int. J. Heat Mass Transf. 2005, 48, 4243–4264. [Google Scholar] [CrossRef]
- Pazmiño, G.A.A.; Lee, D.W.; Jung, S. Dynamic modeling of preferential CO oxidation in monolithic catalytic reactor using Pt–Fe/γ-Al2O3 catalyst. Int. J. Hydrog. Energy 2021, 46, 15203–15218. [Google Scholar] [CrossRef]


| 3D Microstructure | Monolith | P-TPMS | SC | Kelvin | Octet |
|---|---|---|---|---|---|
| Surface area (mm2) (SA) | 228.7 | 206.6 | 47.2 | 90.9 | 173.3 |
| ) | 8.6 | 10 | 0.94 | 2.2 | 4.3 |
| Surface area/Solid volume (1/mm) (SAV) | 26.6 | 20.7 | 50.2 | 41.3 | 40.3 |
| 0.15 | 0.18 | 0.017 | 0.04 | 0.078 |
Publisher’s Note: MDPI stays neutral with regard to jurisdictional claims in published maps and institutional affiliations. |
© 2022 by the authors. Licensee MDPI, Basel, Switzerland. This article is an open access article distributed under the terms and conditions of the Creative Commons Attribution (CC BY) license (https://creativecommons.org/licenses/by/4.0/).
Share and Cite
Jeong, G.H.; Kim, S.; Cho, Y.T. Numerical Study of the Thermal and Fluid Behavior of Three-Dimensional Microstructures for Efficient Catalytic Converters. Energies 2022, 15, 4200. https://doi.org/10.3390/en15124200
Jeong GH, Kim S, Cho YT. Numerical Study of the Thermal and Fluid Behavior of Three-Dimensional Microstructures for Efficient Catalytic Converters. Energies. 2022; 15(12):4200. https://doi.org/10.3390/en15124200
Chicago/Turabian StyleJeong, Gwang Ho, Seok Kim, and Young Tae Cho. 2022. "Numerical Study of the Thermal and Fluid Behavior of Three-Dimensional Microstructures for Efficient Catalytic Converters" Energies 15, no. 12: 4200. https://doi.org/10.3390/en15124200