Abstract
Energy storage fracturing technology is a technical means by which oil displacement fluid is injected into the reservoir before the traditional hydraulic fracturing and subsequent implement fracturing. It provides a good solution for developing tight oil reservoirs. The efficiency of this technology significantly depends on the injection performance of the fracturing fluid, and the ability of its liquid phase to penetrate the formation. According to the needs of energy storage fracturing, four surfactants were selected. Then, based on the performance evaluation of the four surfactants, the compositions of two surfactant systems were determined. The performance of slickwater fracturing fluids for energy storage hydraulic fracturing was evaluated. The mechanism of tight oil displacement in energy storage hydraulic fracturing was analyzed. The results showed that the compositions of oil–displacement agents 1 and 2 for energy storage fracturing were successfully acquired. The performance of oil–displacement agent 2 was slightly better than that of oil–displacement agent 1 at a concentration of 0.25 wt%. The defined composition of the fracturing fluid met requirements for energy storage hydraulic fracturing. It was demonstrated that the tight oil in small pores was effectively substituted by the fracturing fluid, and subsequently aggregated in the large pores. The tight oil displacement ratio increased with an increase in temperature, and the difference among the tight oil displacement ratios of tight sandstone cores increased with increases in their permeability differences.
1. Introduction
With the increase in energy demand, unconventional resources have gradually become one of the major sources of hydrocarbon production [1,2,3,4]. The development of unconventional resources successfully progressed in the United States [5,6]. Following the successful experience of the United States, the development of tight oil reservoirs in China became an issue of interest [7,8,9,10]. Estimated total geological resources of tight oil in China are about 125 × 108 t [11], which makes it a realistic alternative resource. Tight oil reservoirs have some unique characteristics, such as heterogeneity, extra–low permeability, and distinctive fluid–phase properties [12,13,14]. Staged multi–cluster fracturing technology is widely recognized as a good choice for the development of tight oil reservoirs [15,16]. This method can both break the effective reservoir and connect the micro–fracture, induced fracture, and artificial fracture to the maximum extent, and a fracture network is generally created as a result. The contact area between the fracture network and the reservoir matrix is the largest, but the seepage distance from the matrix to the fracture network is the shortest in any direction. Therefore, staged multi–cluster fracturing technology can improve the overall permeability of a reservoir, and realize reservoir reconstruction in a three–dimensional direction [17,18]. Consequently, tight oil can migrate effectively from reservoir matrix to wellbore through the complex fracture network.
However, the development of tight oil reservoirs still faces significant technical problems [19,20,21]. Stimulated wells in tight oil reservoirs can demonstrate high early production rates; however, the productivity of such wells cannot be sustained for a long time period due to formation energy depletion. When the production reduces to a certain extent, it will remain low for a long time. Attempts to maintain formation pressure in the production zones by injecting water are typically not effective. Injected water predominantly influxes along the dominant channel, which results in an uneven water injection profile and high water cut during the subsequent production period. Many methods have been recommended for the development of tight oil reservoirs, such as CO2 flooding, water–alternating–CO2 flooding, miscible and immiscible gas flooding, and carbonated water injection [22,23,24,25,26]. However, there is no definite conclusion as for which method is most suitable for the development of tight oil reservoirs. Nevertheless, energy storage fracturing is basically recognized as a reasonable means for tight oil reservoir development.
Energy storage fracturing technology is a technical means used to inject oil displacement fluid into the reservoir before the traditional hydraulic fracturing and subsequent implement fracturing. Compared to traditional hydraulic fracturing, it is a recommended reservoir stimulation technique especially for tight oil reservoirs. Due to the tightness of tight oil reservoirs and the small sizes of their pore throats, capillary forces play a major role for fluid migration [27,28]. With the help of capillary forces, the fracturing fluid is driven into a narrow pore throat, which replaces tight oil from the matrix with extra–low permeability into a high permeability zone; this realizes the effective utilization of the tight oil distributed in the pore throat of the matrix in a deep reservoir [29]. This effect has an important leading role in the production of tight oil reservoirs [30]. Energy storage fracturing technology is a new attempt in the development of tight oil reservoirs that improves the reservoir exploitation extent, and realizes the excavation of deep reservoirs. Fracturing fluids’ extra–low permeability and petrophysical differences provide conditions for fluid displacement. During energy storage hydraulic fracturing, a large volume of fracturing fluid is injected into the formation. The resulting displacement that occurs between the fracturing fluid and the oil improves the development of tight oil reservoirs.
Energy storage hydraulic fracturing technology has a unique advantage in the development of tight oil reservoirs as a result of the engineered oil displacement from micropores. Because of its advantage in aiding the development of tight oil reservoirs, it has always been an issue of interest since it was recommended. Currently, research in energy storage fracturing focuses mainly on its oil displacement process, such as the oil displacement mechanism, the soaking time, and their influence on enhancing tight oil recovery, the dynamics distribution of oil and water, etc. However, there are few reports which address optimization of the compositions of fracturing fluids used for energy storage fracturing. In the limited reports available, the oil displacement evaluation of energy storage fracturing was usually carried out using water or slickwater fracturing fluids. However, the water or slickwater fracturing fluids used were not the study focus, and their roles were only in aiding the study of oil–water displacement during the oil displacement stage.
In this study, the oil–displacement agent for energy storage fracturing was optimized based on the performance evaluation, and the performance of slickwater fracturing fluid was also evaluated. Then, the tight oil–fracturing fluid dynamics during the oil displacement stage were investigated using nuclear magnetic resonance technology. This study was particularly helpful for defining the most effective oil–displacement agent for use as the fracturing fluid, and for understanding the oil displacement mechanism.
2. Reservoir Rock Physical Property
The tight sandstone cores from Q1 and L66 of Liaohe Oilfield, and the basic information of these tight sandstone cores in the experiments, are shown in Table 1. It shows that the porosity of tight sandstone cores was about 2.48–14.45%, averaging 5.57%, while the gas permeability was about 0.0019 × 10⁻³ μm2~15.6074 × 10⁻³ μm2, averaging 2.43728 × 10⁻³ μm2. Some of the tight sandstone cores were with fractures, thus their porosity and gas permeability were higher than those without fractures.

Table 1.
Basic physical properties of tight sandstone cores.
3. Experimental Chemicals and Apparatus
3.1. Experimental Chemicals
The experimental chemicals used included viscosifying agent (supplied by Liaohe Oilfield), surfactants FC, AS, CA, and OA, cleanup additive (supplied by Liaohe Oilfield), bentonite, potassium chloride, etc.
3.2. Experimental Apparatus
The main experimental apparatus use included a K100 surface–interfacial tension measuring instrument, a balance, analytical balance, blender, HWY–10 thermostat water bath, JGW–360a contact angle meter, rotary viscometer, RS6000 rheometer, cylinder, centrifuge, ICS 5000 ion chromatography, fracturing fluid friction test apparatus, etc.
4. Optimal Oil–Displacement Agent for Energy Storage Hydraulic Fracturing Fluid
4.1. Optimization of Oil–Displacement Agent for Energy Storage Fracturing
Surfactant is considered an oil–displacement agent for energy storage fracturing, for it can change both the rock wettability and the contact angle. However, the mechanisms of different surfactants are different, thus the final effect varies. The criteria for surfactant selection for oil–displacement application include: (1) xcellent wetting performance; (2) fast adsorption and wetting; (3) suitable adsorbability; (4) reasonable interfacial tension at low concentration.
The fluorocarbon non–ionic surfactant, anionic surfactant, and amphoteric surfactant were optimized and compounded in the laboratory. The fluorocarbon non–ionic surfactant FC, anionic surfactant AS, amphoteric surfactant CA, and amphoteric surfactant OA were preliminarily screened out, and were used to compound with the conventional slickwater fracturing fluid to form a slickwater fracturing fluid system for energy storage fracturing.
4.2. Compatibility
The optimal four surfactants were used to carry out the compounding experiment, and their content in the distilled water was 1.0 wt%. Then, the aqueous solutions of the optimal four surfactants were mixed with each other, standing at 30 °C for 4 h. The mixtures remained stable, without any flocculation or sedimentation; thus, the optimal four surfactants had good compatibility.
4.3. Surface/Interfacial Tension
The ability to reduce the surface/interfacial tensions of different surfactants was different; the surfactant concentrations were also different in the evaluation of their surface/interfacial tensions.
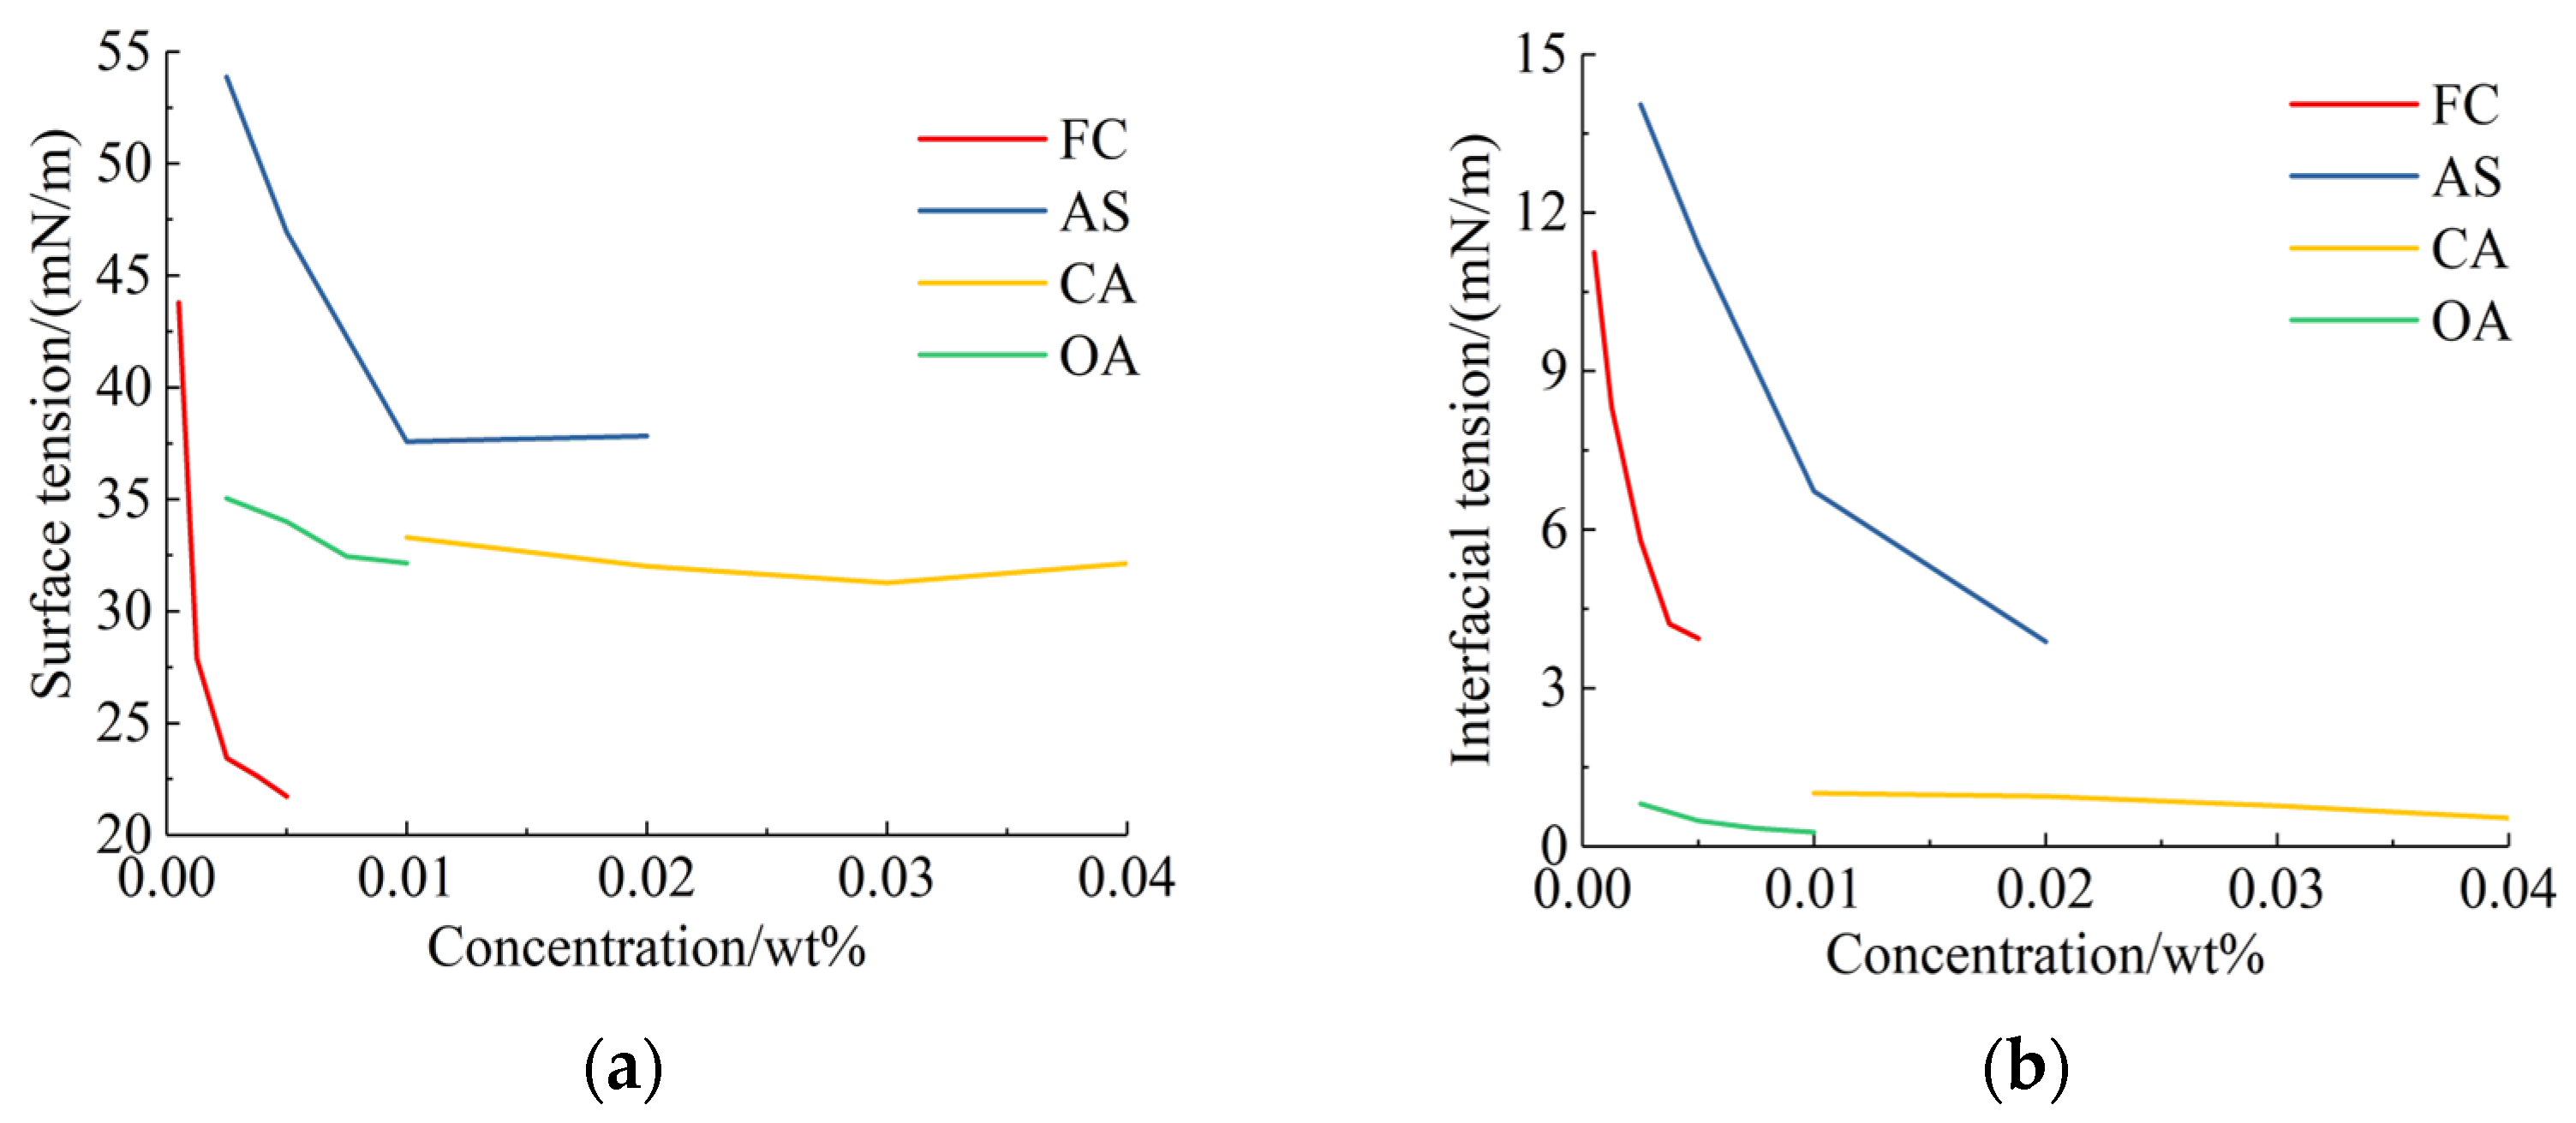
During the surface/interfacial tension test, the 0.5 wt% fluorocarbon non–ionic surfactant FC aqueous solution, 1.0 wt% anionic surfactant AS aqueous solution, 4.0 wt% amphoteric surfactant CA aqueous solution, and 1.0 wt% amphoteric surfactant OA aqueous solution were prepared; then, they were each diluted to the corresponding concentration. Their surface tensions, and their interfacial tensions between their aqueous solution and tight oil were measured by a K100 surface–interfacial tension measuring instrument. The results are shown in Figure 1. The fluorocarbon non–ionic surfactant FC had the best ability to reduce the surface tension. When its concentration was only 0.00125 wt%, the surface tension of its aqueous solution could be reduced to below 28 mN/m, and the surface tension of its aqueous solution continued to reduce to 21 mN/m with its concentration increasing. However, its effect on reducing interfacial tension was limited, and when its concentration reached 0.005 wt%, the interfacial tension between its aqueous solution and tight oil was the minimum, 3.94 mN/m. Amphoteric surfactant OA had the most obvious ability to reduce the interfacial tension. When its concentration was only 0.0025 wt%, the interfacial tension between its aqueous solution and tight oil reduced to 0.81 mN/m; then, the interfacial tension decreased slowly with its concentration increasing. Finally, the interfacial tension reached 0.27 mN/m when its concentration was 0.01 wt%. Its ability to reduce the surface tension increased with an increase in concentration, and the surface tension was lowest at 32.1 mN/m.
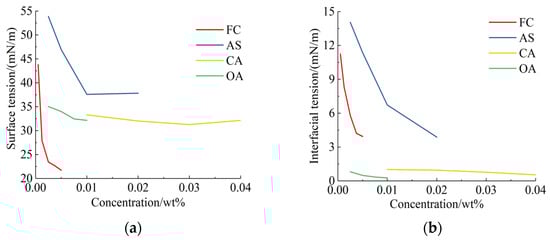
Figure 1.
Surface/interfacial tensions of four surfactants. (a) Surface tension; (b) interfacial tension.
Amphoteric ionic surfactant CA had a good ability to reduce the interfacial tension. When its concentration was 0.01 wt%, the interfacial tension between its aqueous solution and tight oil decreased to 1.0 mN/m. Its ability to reduce surface tension increased when its concentration was increased; when its concentration was less than 0.03 wt%, the minimum interfacial tension observed was 32.1 mN/m. When its concentration was greater than 0.03 wt%, its surface tension showed a slight increasing trend. However, both the surface tension and the interfacial tension of amphoteric surfactant CA aqueous solution generally showed a relatively stable distribution with its concentration increasing. The surface tension of anionic surfactant AS aqueous solution decreased rapidly with an increase in its concentration. When its concentration was 0.01 wt%, the surface tension of its aqueous solution decreased to 37.0 mN/m. As its concentration continually increased, the surface tension basically remained stable, but its ability to reduce the interfacial tension increased with its concentration increasing, to a minimum of 3.88 mN/m.
4.4. Oil–Displacement Agent for Energy Storage Fracturing
According to the surface/interfacial tension evaluation of the surfactants, fluorocarbon surfactant FC could significantly reduce the surface tension, and both amphoteric surfactants CA and OA had a good ability to reduce the interfacial tension. Meanwhile, anionic surfactant AS’s negative charge with the tight sandstone core’s negative charge meant that the anionic surfactant could effectively reduce the adsorption of surfactants on the rock. Based on the performed experiments, two oil displacement compositions were proposed for the following studies, and they are shown in Table 2.
Table 2.
Formulas of oil–displacement agents.
The appearance of both of the two oil–displacement agents for energy storage fracturing was light yellow, and their pH values were both around 7~8. The densities of oil–displacement agents CBA and OBA were 1.001 g/cm3 and 1.002 g/cm3, respectively. The water solubility and the compatibility were both good, and they were placed at 30 °C for 10 days without any flocculation or precipitation.
4.4.1. Surface/Interfacial Tensions for CBA and OBA Compositions
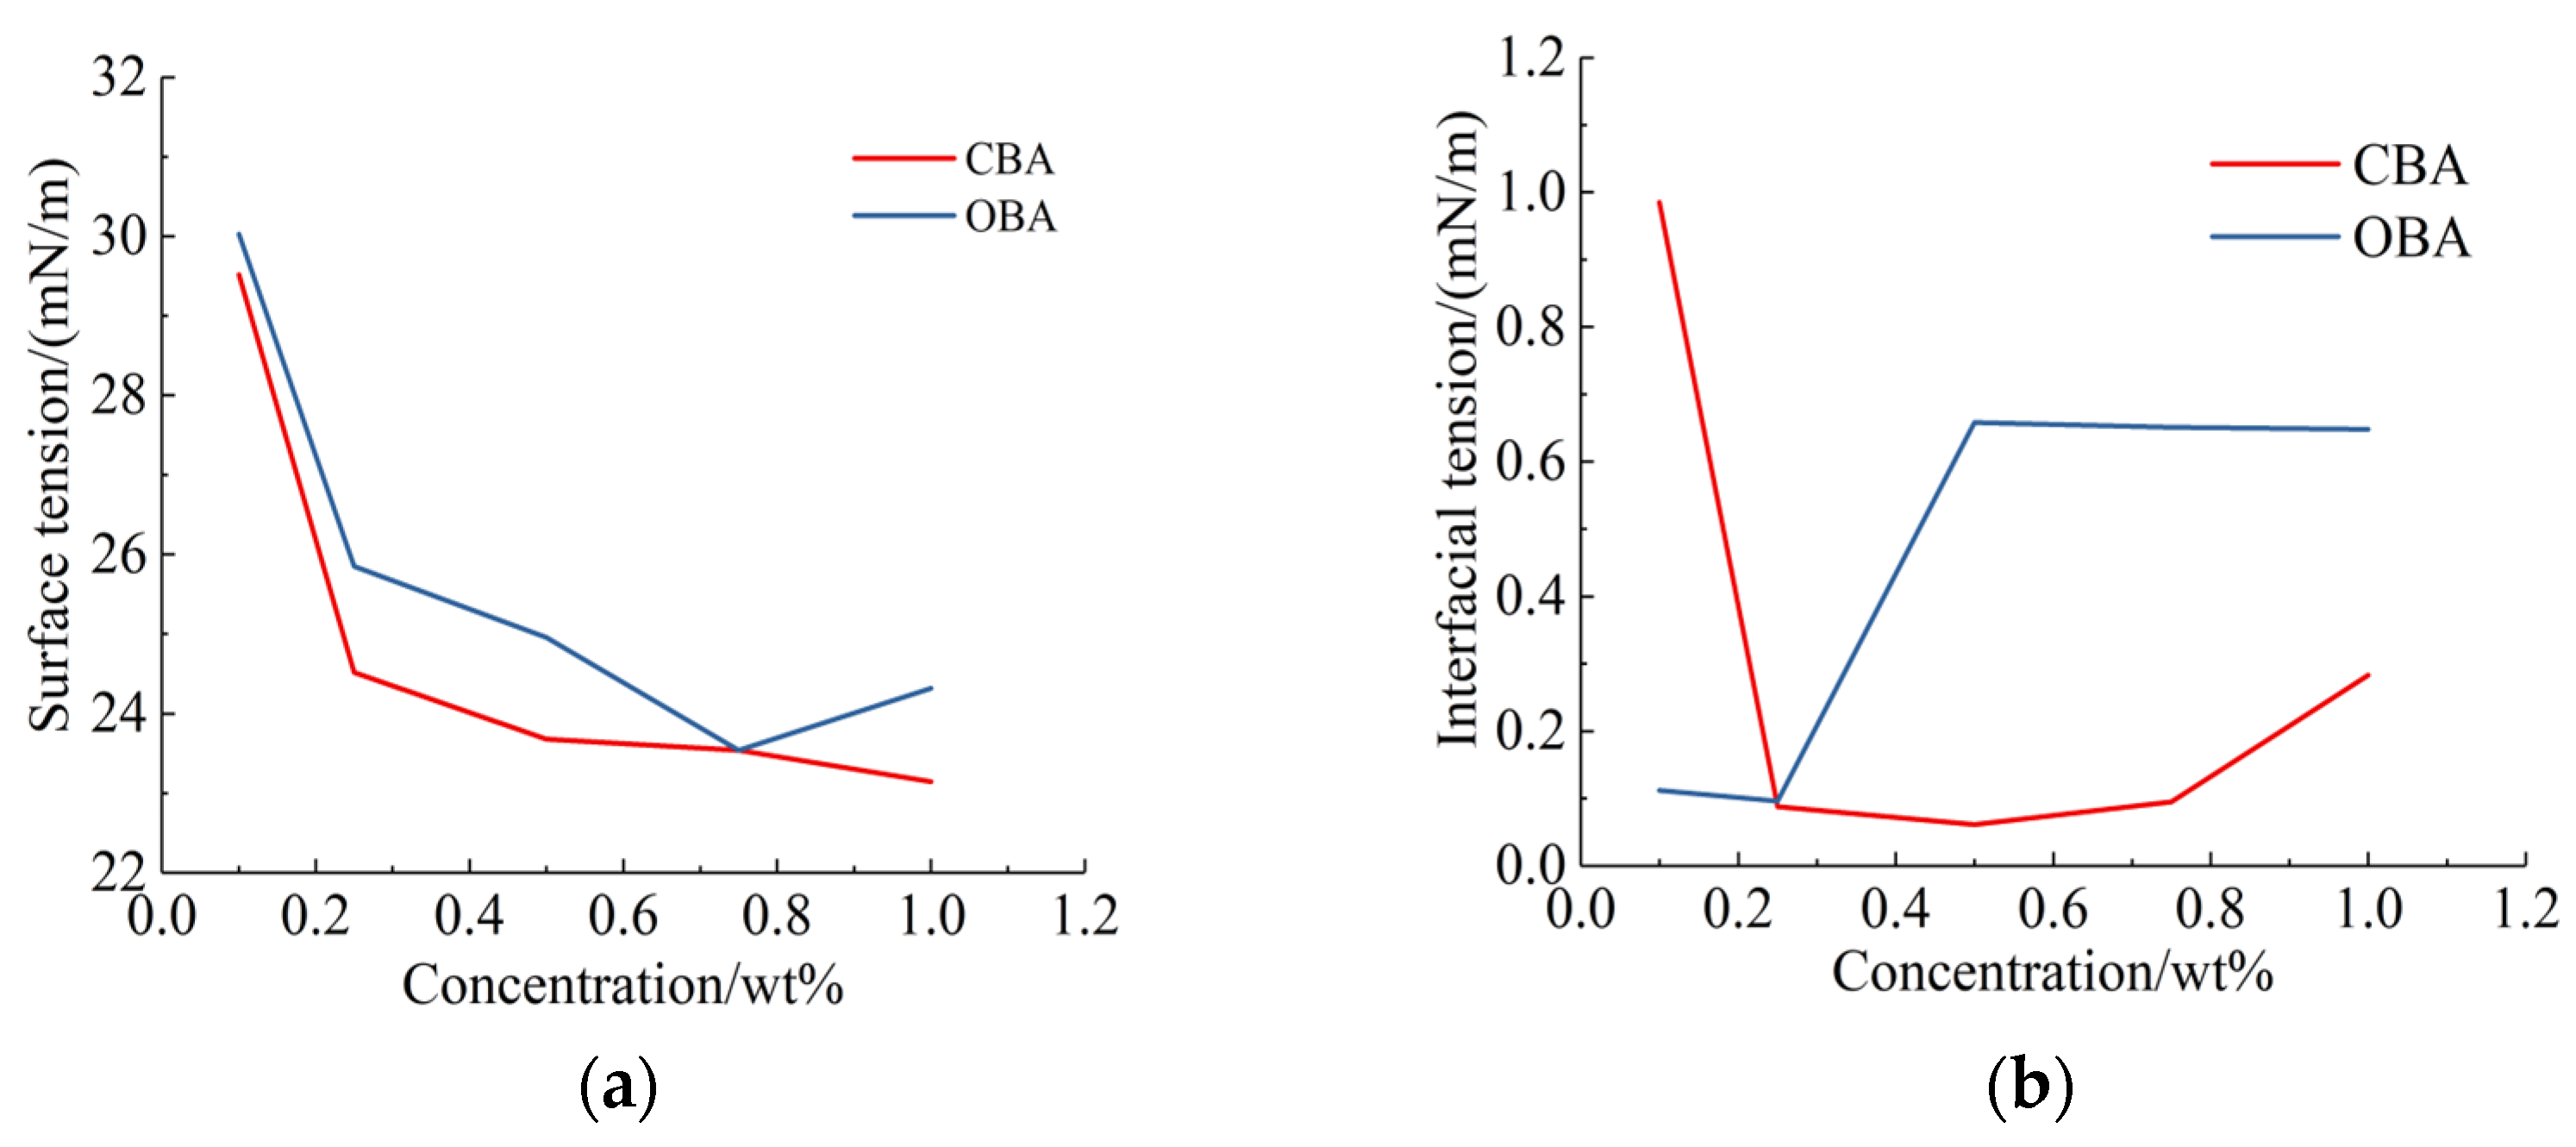
Different concentrations (0.1 wt%, 0.25 wt%, 0.5 wt%, 0.75 wt%, and 1.0 wt%) of oil–displacement agents CBA and OBA were prepared, and their surface/interfacial tensions were evaluated at 30 °C; the results are shown in Figure 2. Both oil–displacement agents OBA and CBA had a good ability to reduce surface/interfacial tension. When the concentration of CBA was 0.25 wt%, the surface tension of its aqueous solution decreased to less than 25.4 mN/m, and with an increase in its concentration, the surface tension could continue to decrease to 23.1 mN/m. When the concentration of OBA was 0.25 wt%, the surface tension of its aqueous solution reduced to below 25.8 mN/m, and the surface tension continued to decrease to 24.3 mN/m with an increase in its concentration. The oil displacement agent CBA had a slightly better ability to reduce surface tension than OBA, but their performances were basically the same. When the concentration of CBA was 0.25 wt%, the interfacial tension between CBA and tight oil decreased to below 0.088 mN/m. With an increase in its concentration, the interfacial tension decreased initially and then increased, and the minimum was 0.061 mN/m. When the concentration of OBA was 0.25 wt%, the interfacial tension reduced to below 0.096 mN/m, then the interfacial tension increased with an increase in its concentration. The oil–displacement agent CBA had a slightly better ability to reduce oil–water interfacial tension than OBA; however, OBA had a better ability to reduce interfacial tension at low concentrations. According to their surface/interfacial tension performance, and taking cost into consideration, the concentration of 0.25 wt% was selected as a better choice for the subsequent evaluation.
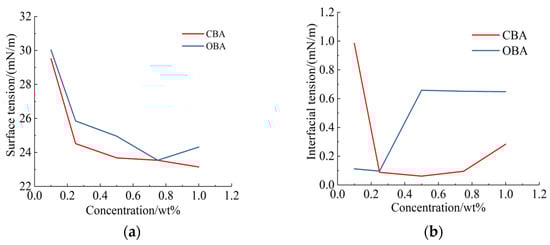
Figure 2.
Surface/Interfacial tension of oil–displacement agents. (a) Surface tension; (b) interfacial tension.
4.4.2. Mineralization Intensity
During the mineralization test, the detailed ion compositions and their proportions of mineralized water were consistent with that of formation water. Mineralization in the test ranged from 500 mg/L to 5000 mg/L. The ion types and proportions of the mineralized water with mineralization 5000 mg/L are shown in Table 3.
Table 3.
Detail compositions of the mineralized water with mineralization 5000 mg/L.
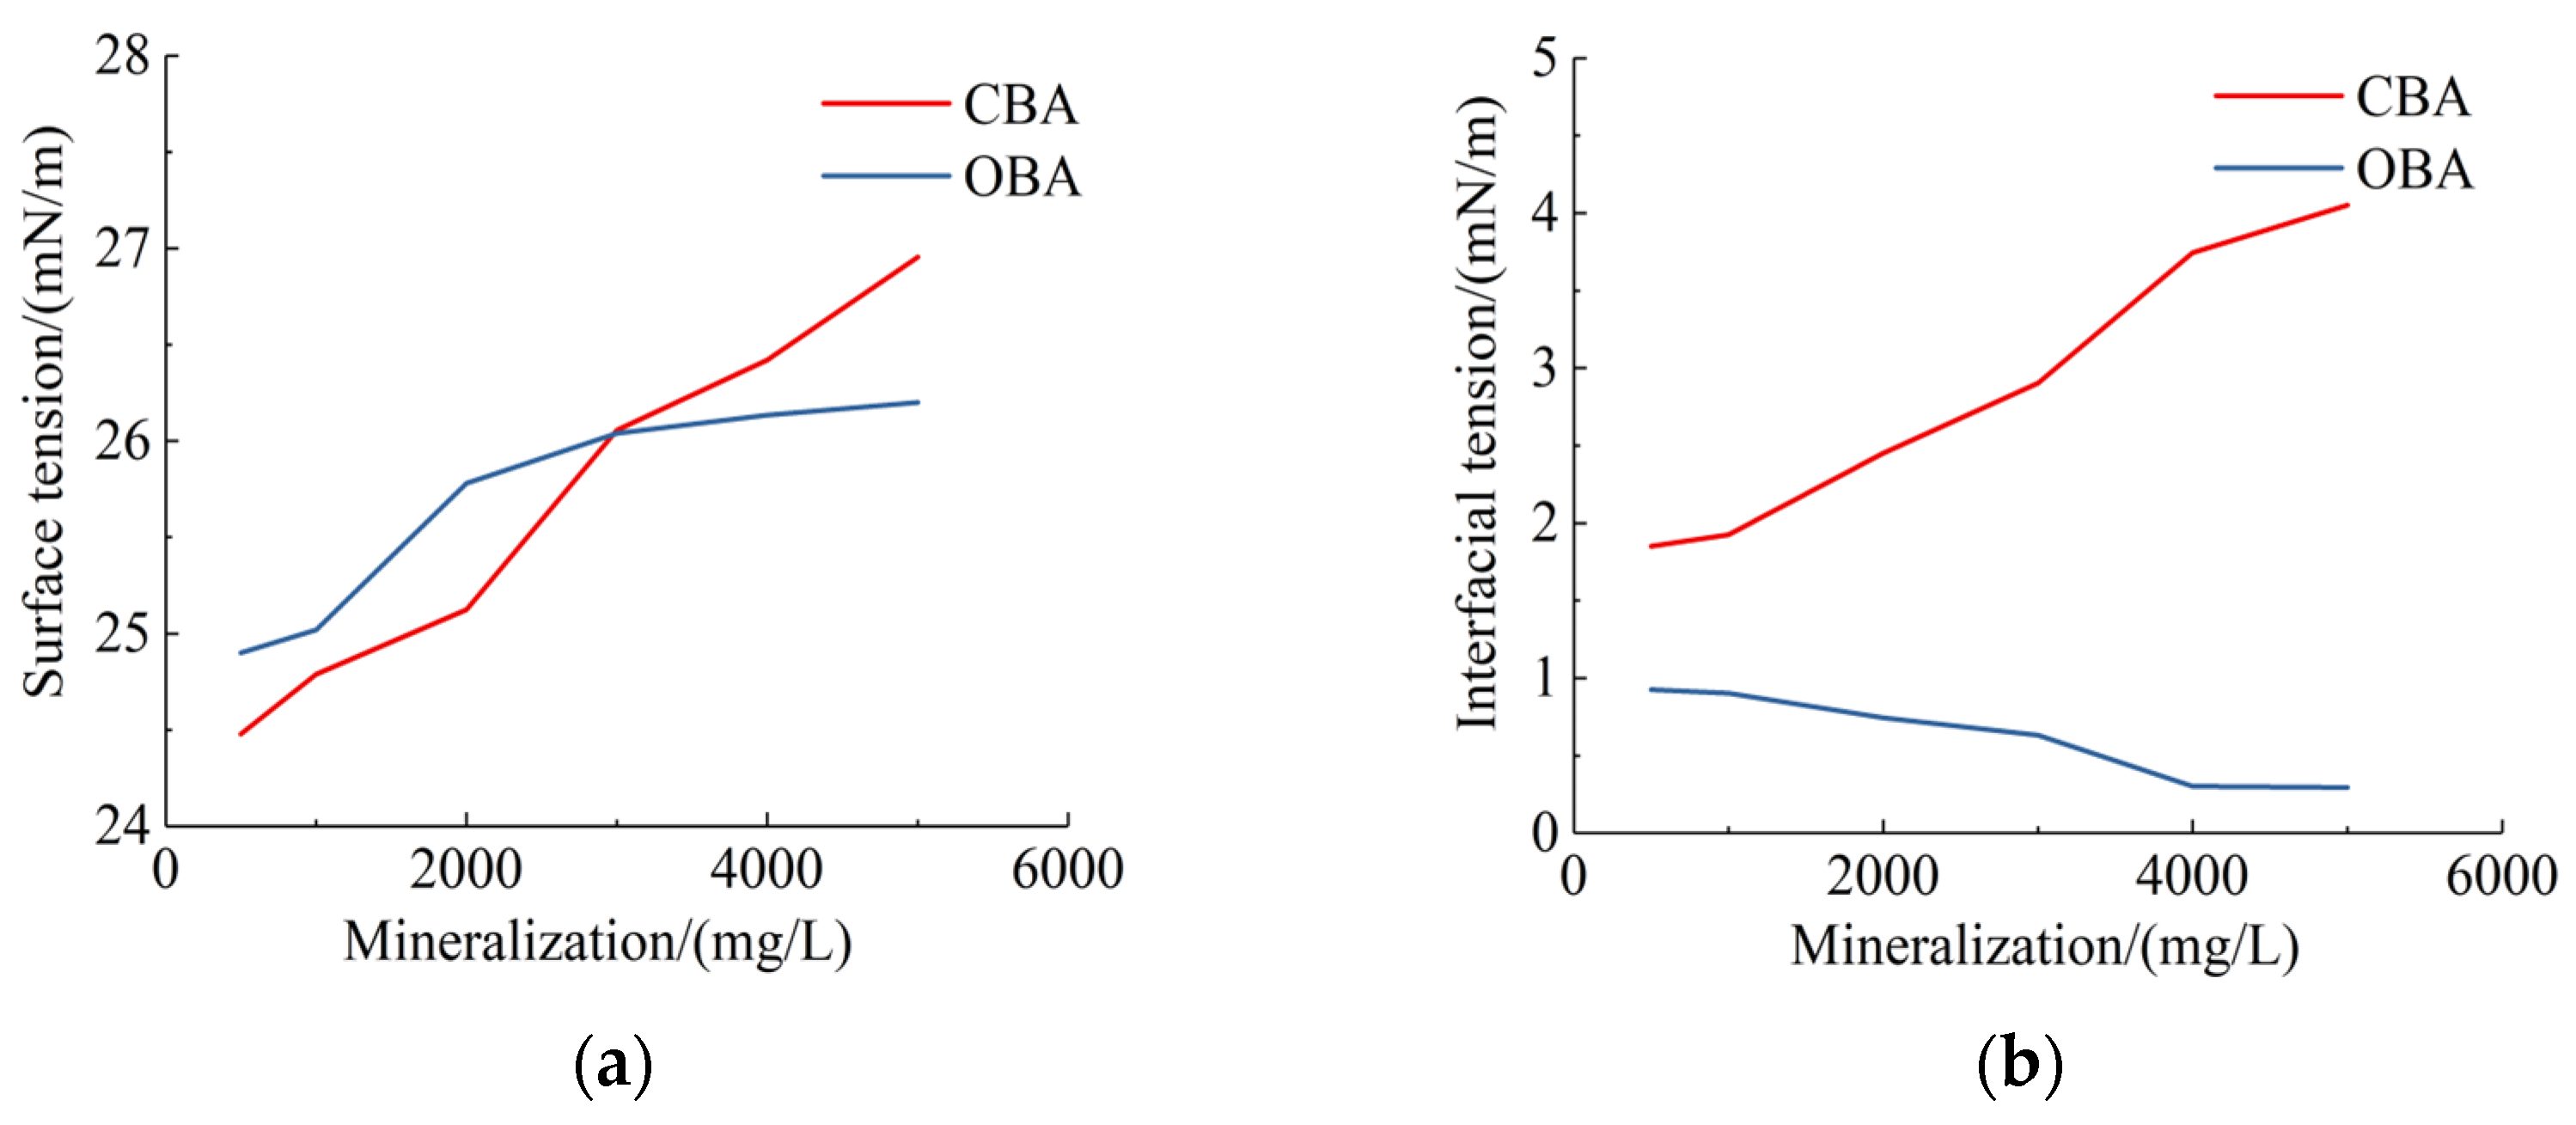
Mineralized water with different mineralizations was prepared, and other mineralized water with different mineralization intensities were diluted by distilled water from the mineralized water, with a mineralization intensity of 5000 mg/L. During the test, the concentrations of the oil–displacement agents CBA and OBA were both 0.25 wt%. The surface/interfacial tensions were evaluated at 30 °C using a K100 surface–interfacial tension measuring instrument, and the results are shown in Figure 3.
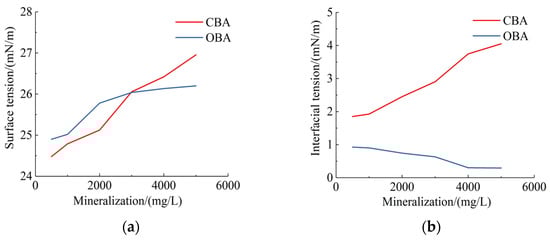
Figure 3.
Effect of mineralization intensity on the surface/interfacial tension. (a) Surface tension; (b) interfacial tension.
The results showed that the mineralization had little effect on the surface tension of oil–displacement agent OBA, but a greater effect on that of oil–displacement agent CBA. When the mineralization was greater than 3000 mg/L, the surface tension of oil–displacement agent CBA showed an obvious increasing trend, while that of oil–displacement agent OBA showed a stable trend without obvious increasing.
However, the mineralization had a significant impact on the interfacial tension. The interfacial tension between OBA and tight oil decreased with an increase in mineralization, but the interfacial tension between CBA and tight oil showed an opposite trend. According to the evaluation, the salt tolerance of OBA was slightly better than that of CBA.
4.4.3. Wettability
The wettability of different rocks was significantly different, the tight sandstone cores Q2–14 and L54–350–21 were selected in order to test the wettability of the oil–displacement agents, and the results are shown in Table 4. The tight sandstone core Q2–14 showed weak hydrophilic characteristics, while tight sandstone core L54–350–21 showed strong hydrophilic characteristics.
Table 4.
Contact angles of oil–displacement agents.
The wettability of oil–displacement agents CBA and OBA on rock surfaces was similar. The tight sandstone core Q2–14 showed medium hydrophilic characteristics, while the tight sandstone core L54–350–21 still showed strong hydrophilic characteristics. Both oil–displacement agents CBA and OBA had an obvious effect on the weak hydrophilic core, but had little effect on the strong hydrophilic core. As shown in Table 4, the contact angle between core L54–350–21 and distilled water was 12.9°, while the contact angle between core L54–350–21 and the oil–displacement agent CBA was 17.25°, and that of oil–displacement agent OBA was 12.45°. Thus, both oil–displacement agents had little effect on core L54–350–21.
5. Performance Evaluation of Fracturing Fluid for Energy Storage Fracturing
The slickwater fracturing fluid in the performance evaluation study was viscoelastic surfactant–based fracturing fluid, with 0.25 wt% oil–displacement agent OBA.
5.1. Viscosity
The slickwater fracturing fluids were prepared by adding 0.5–2.0 wt% viscosifying agent into 300 mL of water; then, the mixture was stirred for 1–3 min. The viscosity of slickwater fracturing fluid at 30 °C was measured by an RS6000 rheometer, and the results are shown in Table 5.
Table 5.
Properties of slickwater fracturing fluid.
Data show that the slickwater fracturing fluid with 0.5–2.0 wt% viscosifying agent had a certain thickening effect, and both their viscosity and pH values met the technical specifications in NB/T 14003.1–2015 ‘Shale Gas Fracturing fluid Part 1: Slick Water Fracturing Fluid Performance Index and Evaluation Method’ [31].
5.2. Stability
Slickwater fracturing fluids were prepared with 0.5–2.0 wt% viscosifying agent. Then, 100–milliliter samples of each were taken and kept at 30 °C, 50 °C, and 70 °C for 4 h. All of them remained stable, without any precipitation.
5.3. Rheology
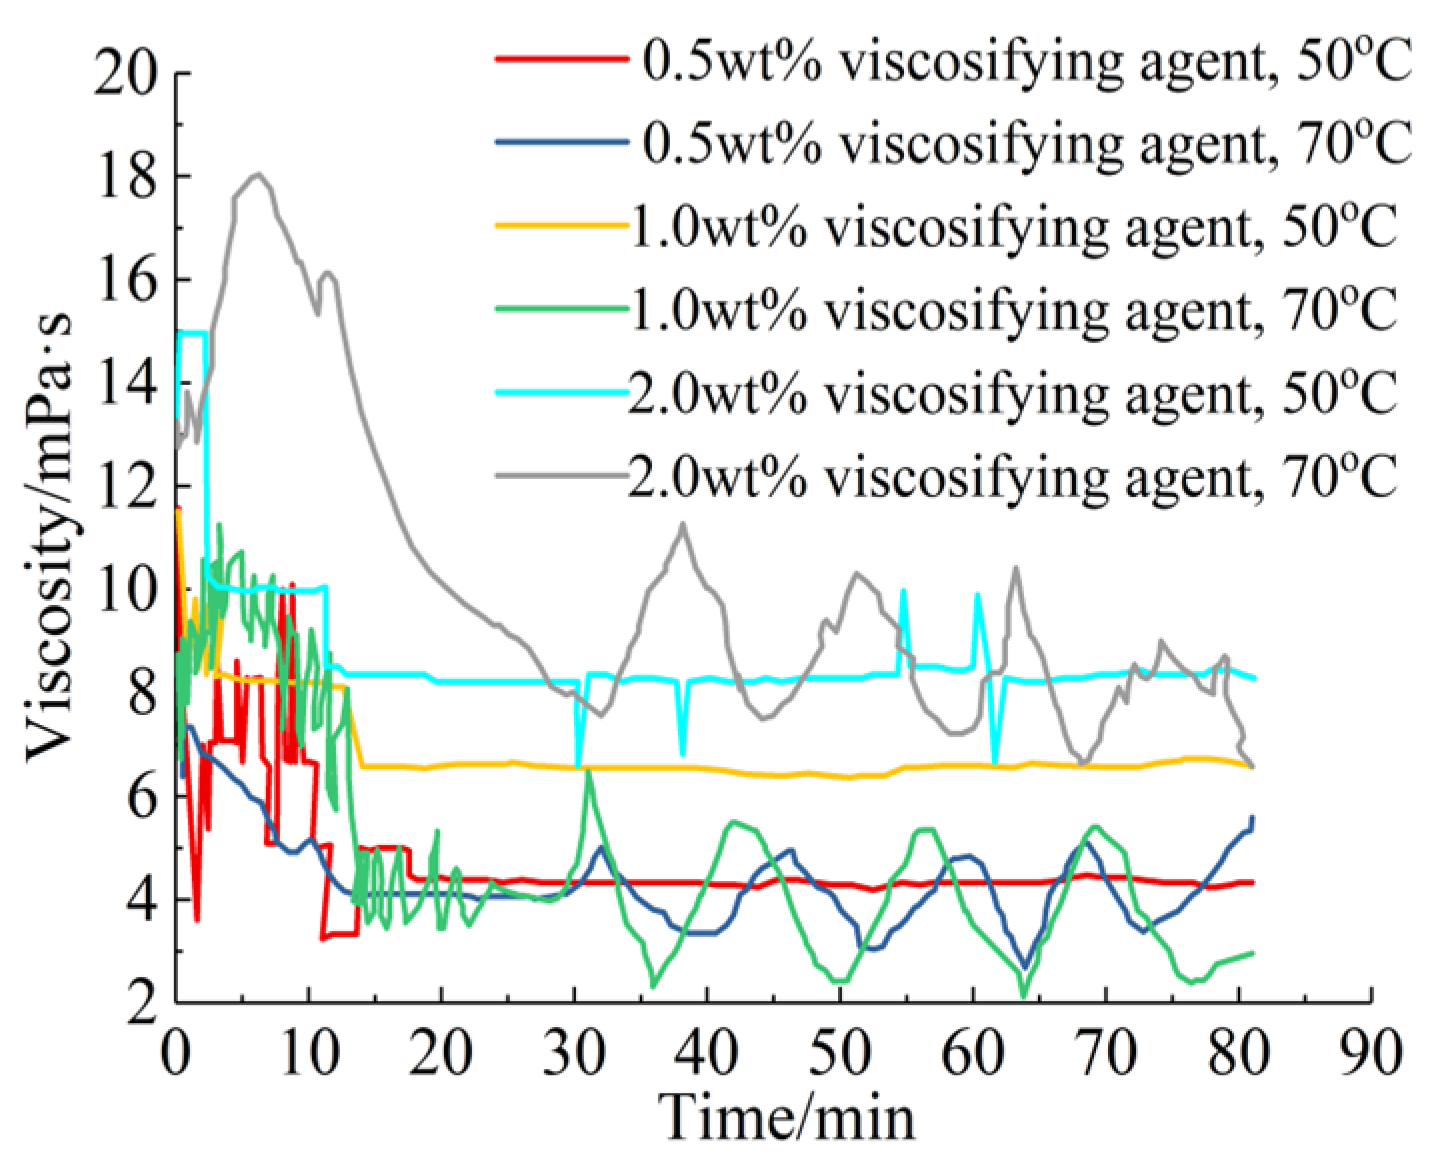
The slickwater fracturing fluids were prepared, and an RS6000 rheometer was employed to measure their rheology. The results are shown in Figure 4.

Figure 4.
Rheology of slickwater fracturing fluid at a shear rate of 170 s−1.
Temperature had a significant effect on the viscosity of the slickwater fracturing fluid, and the viscosity at 50 °C was generally higher than that at 70 °C when the viscosifying agent was 0.5 wt% and 1.0 wt%. However, when the viscosifying agent was 2.0 wt%, the viscosity at 50 °C seemed more stable than that at 70 °C. When the temperature was 70 °C, the viscosity fluctuated greatly, but the fluctuation range basically did not change with time. At 70 °C, the viscosity of the slickwater fracturing fluid was basically similar when the viscosifying agent concentrations were 0.5 wt% and 1.0 wt%; however, the viscosity increased significantly when the viscosifying agent concentration was 2.0 wt%. At 50 °C, the concentration of viscosifying agent had a significant influence on the viscosity, and the viscosity increased significantly with increasing viscosifying agent concentration.
5.4. Surface/Interfacial Tension
Slickwater fracturing fluids were prepared with 0.5–2.0 wt% viscosifying agent, and they were placed at 30 °C for 2 h. The surface/interfacial tensions between slickwater fracturing fluid and tight oil were measured using a K100 surface/interfacial tensiometer. The results are shown in Table 6.
Table 6.
Surface/interfacial tensions.
The surface tensions of slickwater fracturing fluids were around 27.047 mN/m~30.257 mN/m, while their interfacial tensions were around 0.391 mN/m~0.784 mN/m. As the content of viscosifying agent increased, both the surface tension and the interfacial tension basically showed a decreasing trend.
5.5. Proppant Settling
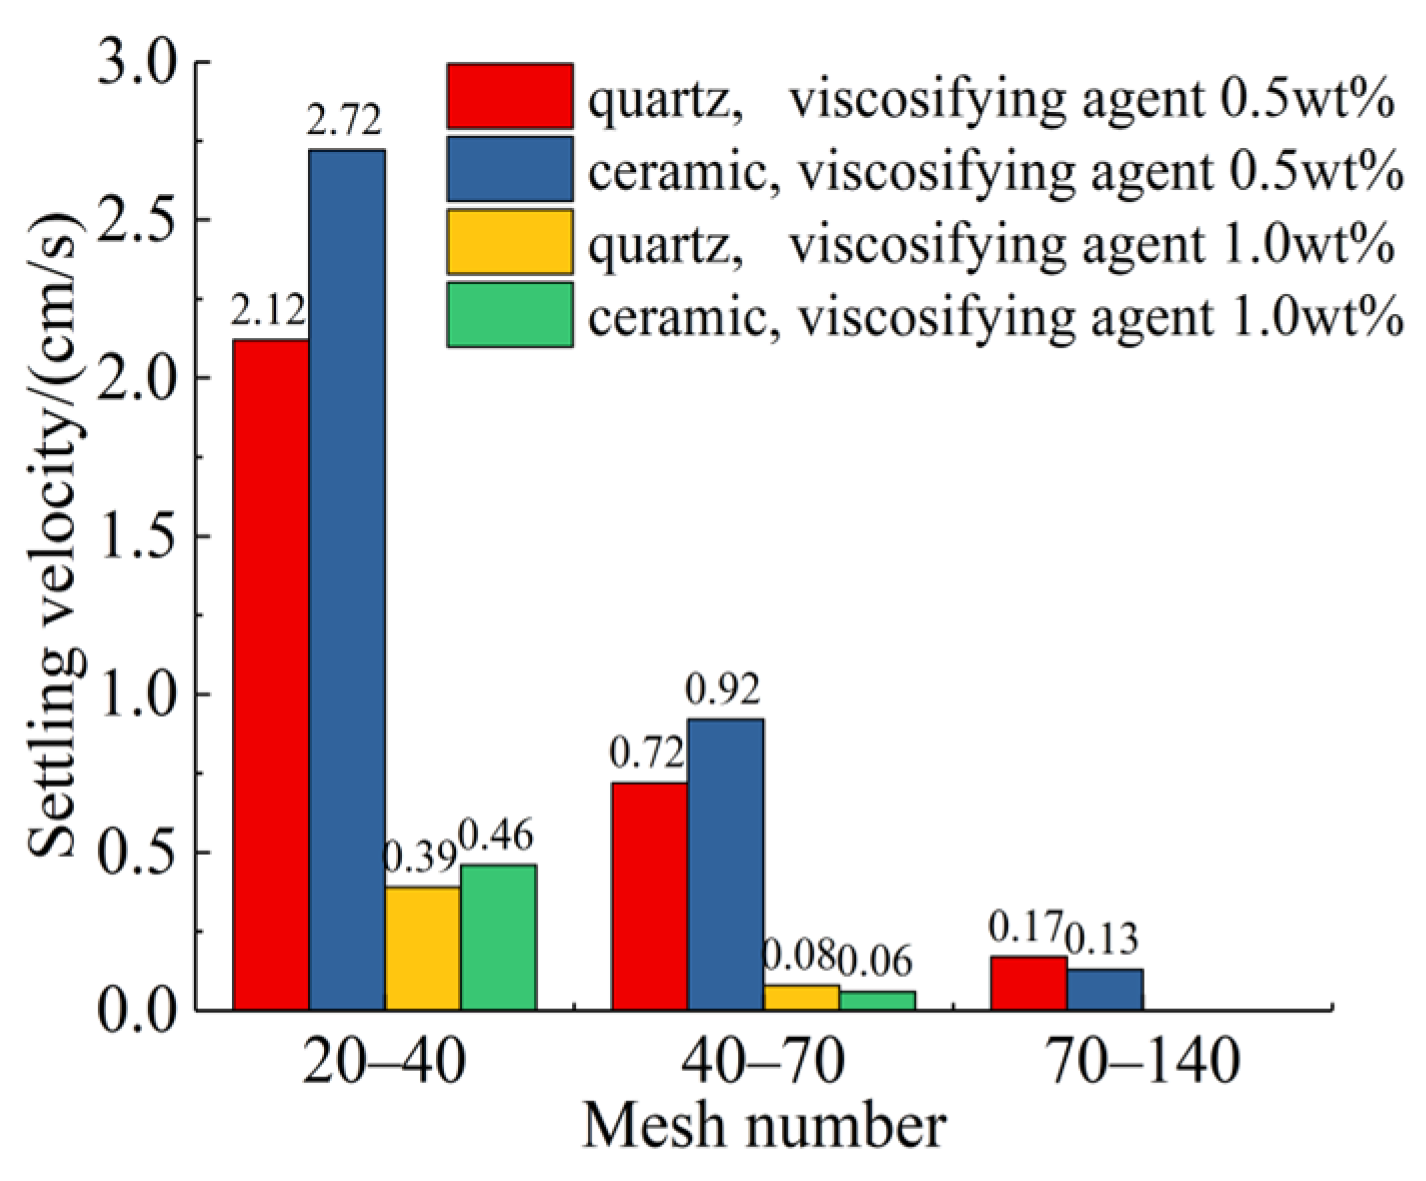
Slickwater fracturing fluid was filled in a 50–milliliter cylinder. Then, 3–5 particles of different proppants were added into the cylinder, and the time of proppant particles falling a certain height was recorded, obtaining the static settling velocity of proppant in fracturing fluid. The results are shown in Figure 5.

Figure 5.
Proppant settling.
Generally, as the particle size of the proppant increased, the settling velocity showed a decreasing trend. When the viscosifying agent of slickwater was 0.5 wt%, the particle size of 40–70 mesh was the pivotal point [32]. When the particle size was not less than 40–70 mesh, the settling velocity of quartz was less than that of ceramic; otherwise, the settling velocity of quartz was a little greater than that of ceramic. When the viscosifying agent of slickwater was 1.0 wt%, the proppant settling velocity was much less than that when the viscosifying agent was 0.5 wt%. The above phenomenon was mainly related to the differences in proppant properties.
5.6. Fluid Friction Reduction
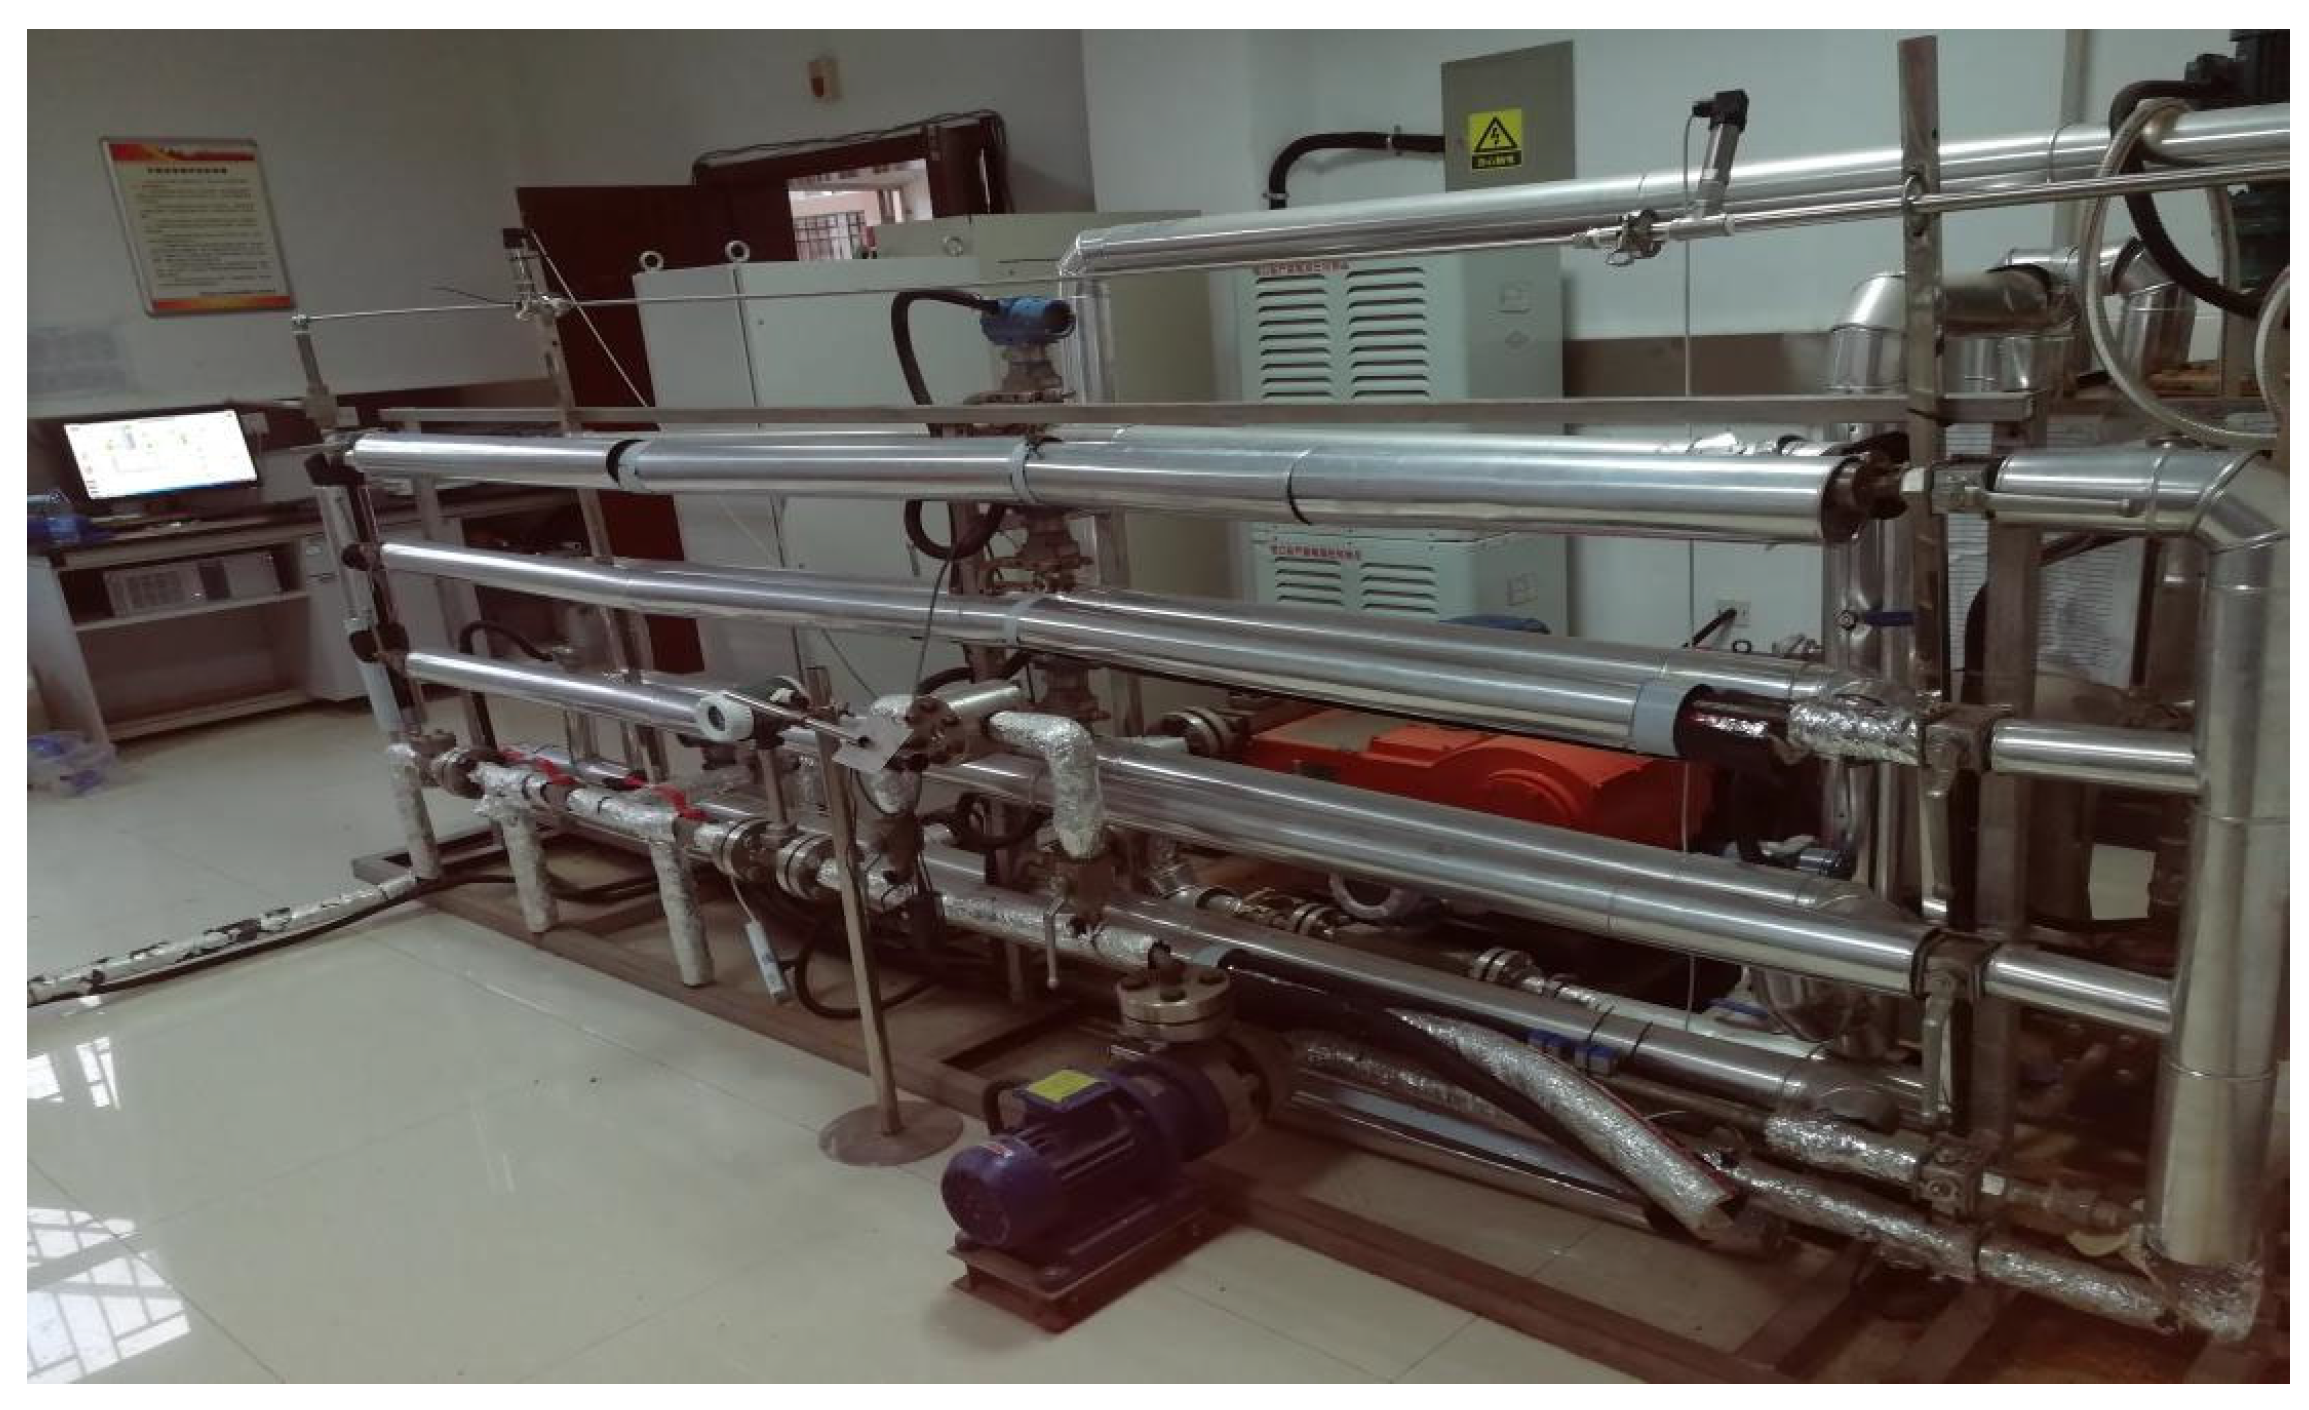
A certain pressure difference will be produced when the slickwater fracturing fluid flows through a certain diameter pipeline at a certain pumping rate. The fluid friction reduction efficiency of the slickwater fracturing fluid was calculated according to the pressure difference between the slickwater fracturing fluid and raw water (tap water in the experiment). This experiment was carried out at room temperature, and the flow regime of the slickwater fracturing fluid was laminar flow in the experiment. The experimental apparatus is shown in Figure 6.

Figure 6.
Fracturing fluid friction test apparatus.
Slickwater fracturing fluid was prepared with 1.0 wt% viscosifying agent, hydrated for 30 min at 30 °C. Then, the fluid friction was measured, and the fluid friction reduction efficiency of the slickwater fracturing fluid could be calculated using Equation (1). The experimental conditions and results are shown in Table 7.
Table 7.
Fluid friction reduction efficiencies for the slickwater fracturing fluid.
Compared to tap water, the slickwater fracturing fluid showed an obvious fluid friction reduction property, and its fluid friction reduction efficiency increased as the pumping rate increased. When the pumping rate was 701.61 kg/h, the drag reduction efficiency reached a maximum of 55.78%.
5.7. Gel Breaking
The slickwater fracturing fluid with 1.0 wt% viscosifying agent was mixed with 1.0 wt% formation oil, and stood for 2 h at 70 °C. As slickwater fracturing fluid is a viscoelastic surfactant–based fracturing fluid, the viscosity of the mixture was significantly reduced. Then, the surface/interfacial tension between gel–breaking fluid and tight oil was measured using a K100 surface/interfacial tensiometer. The results show that compared to the viscosity of the slickwater fracturing fluid (9.84 mPa·s), the viscosity of the gel–breaking fluid was only 1.79 mPa·s. The surface tension of gel–breaking fluid was 26.721 mN/m, and its interfacial tension was 0.458 mN/m.
5.8. Fracturing Fluid Cleanup Performance
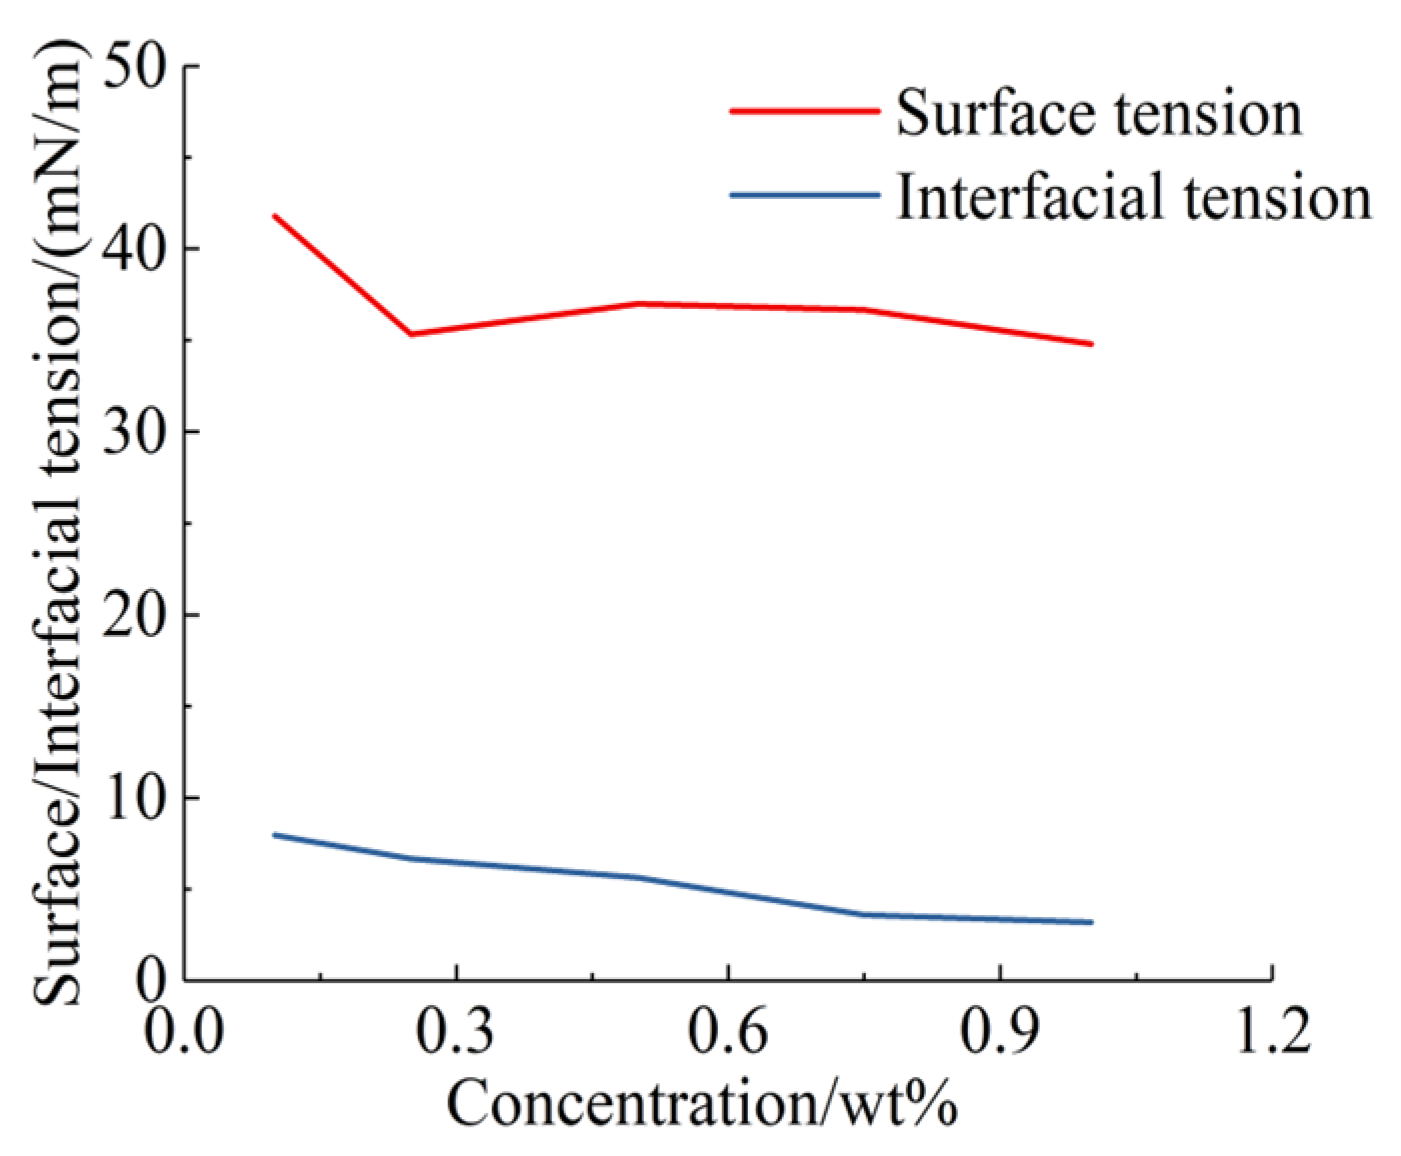
Cleanup additive is important for slickwater fracturing fluid; it can reduce surface/interfacial tension and capillary resistance, and improve the flowback efficiency of the residual fluid. The cleanup additive was supplied by Liaohe Oilfield. Aqueous solutions of cleanup additive were prepared by mixing the cleanup additive and distilled water. Then, the surface/interfacial tensions of the mixtures were measure using a K100 surface–interfacial tension measuring instrument, and the results are shown in Figure 7.
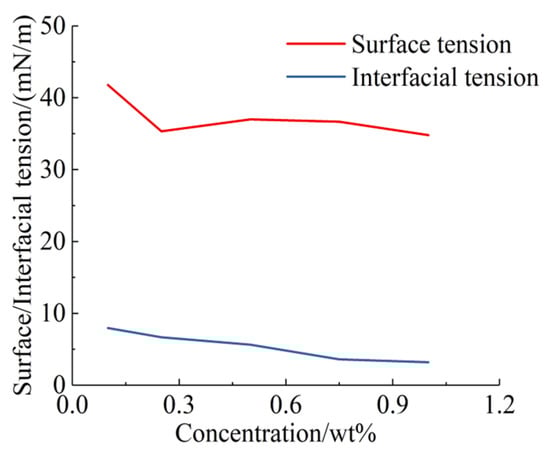
Figure 7.
Surface/interfacial tensions between different cleanup additive concentrations and tight oil.
Generally, as the concentration of cleanup additive increased, both the surface tension and the interfacial tension of the aqueous solution of cleanup additive showed a decreasing trend. When the concentration of cleanup additive was 0.1 wt%, its surface tension was 41.76 mN/m and the interfacial tension between the aqueous solution of cleanup additive and tight oil was 7.962 mN/m. When the concentration of cleanup additive increased to 1.0 wt%, the surface tension decreased to 34.796 mN/m, about 83.3% of that when the concentration of cleanup additive was 0.1 wt%. Moreover, the interfacial tension between the aqueous solution of cleanup additive and tight oil decreased to 3.193 mN/m, about 40.3% of that when the concentration of cleanup additive was 0.1 wt%.
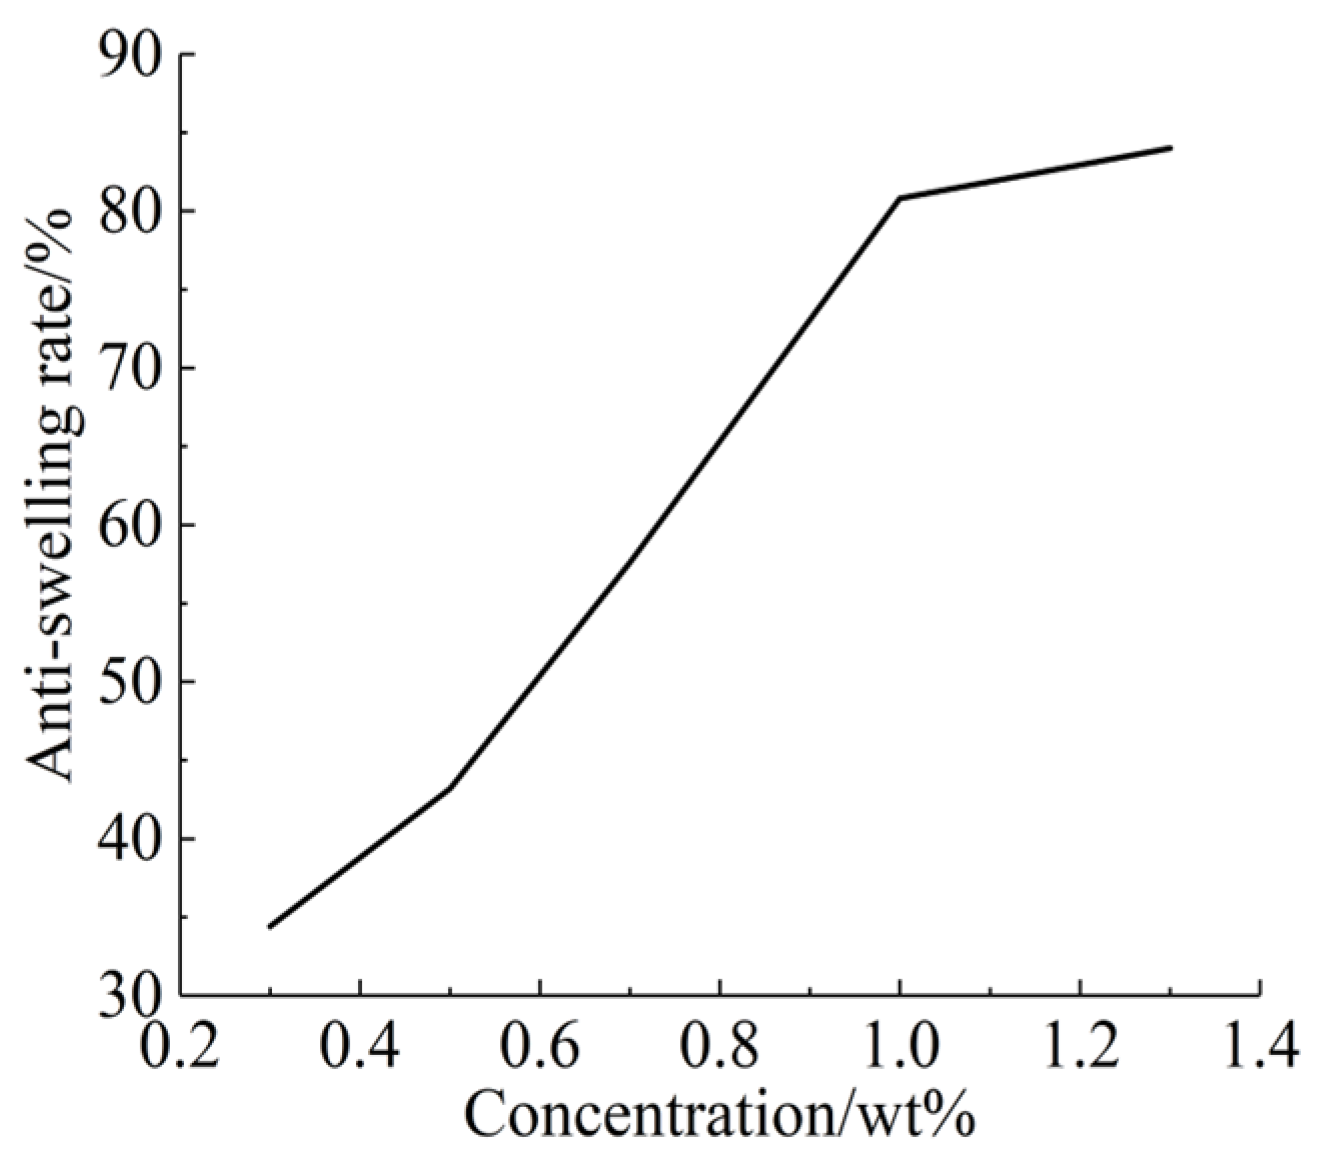
5.9. Clay Stabilization
According to SYT 5971–2016 ’Performance evaluation method of clay stabilizer for fracturing acidification and water injection in oil and gas fields’ [33], bentonite was employed to measure the anti–swelling performance of potassium chloride solution by the method of clay volume expansion centrifugation. The results are shown in Figure 8. Potassium chloride was employed as the clay stabilizer. With an increase in potassium chloride concentration, the anti–swelling efficiency increased continuously. When the concentration of potassium chloride was 1.0 wt%, the anti–swelling rate exceeded 80%.

Figure 8.
The anti–swelling performance of potassium chloride solution.
6. Oil Displacement Efficiency
During the oil displacement evaluation of energy storage fracturing, the slickwater fracturing fluid was composed of 1.0 wt% thickening agent, 0.25 wt% surfactant OBA, 1.0 wt% potassium chloride, 0.25 wt% cleanup additive, and water.
The oil displacement efficiency was measured using the weight method, and the weight of the tight sandstone core at different times was measured using an analytical balance. During the soak stage, the tight oil that was saturated in the tight sandstone core was substituted by the slickwater fracturing fluid as a result of capillary forces. The weight of the tight sandstone core would change because of the density difference between tight oil and the slickwater fracturing fluid that replaced it; thus, the tight oil saturated in tight sandstone core could be obtained by recording the core weight at different times, after which the weight of the tight oil substituted could be calculated with Equation (2):
Moreover, the formation oil displacement ratio could be obtained with Equation (3):
6.1. Studying the Impact of Factors Affecting Oil Displacement
6.1.1. Permeability
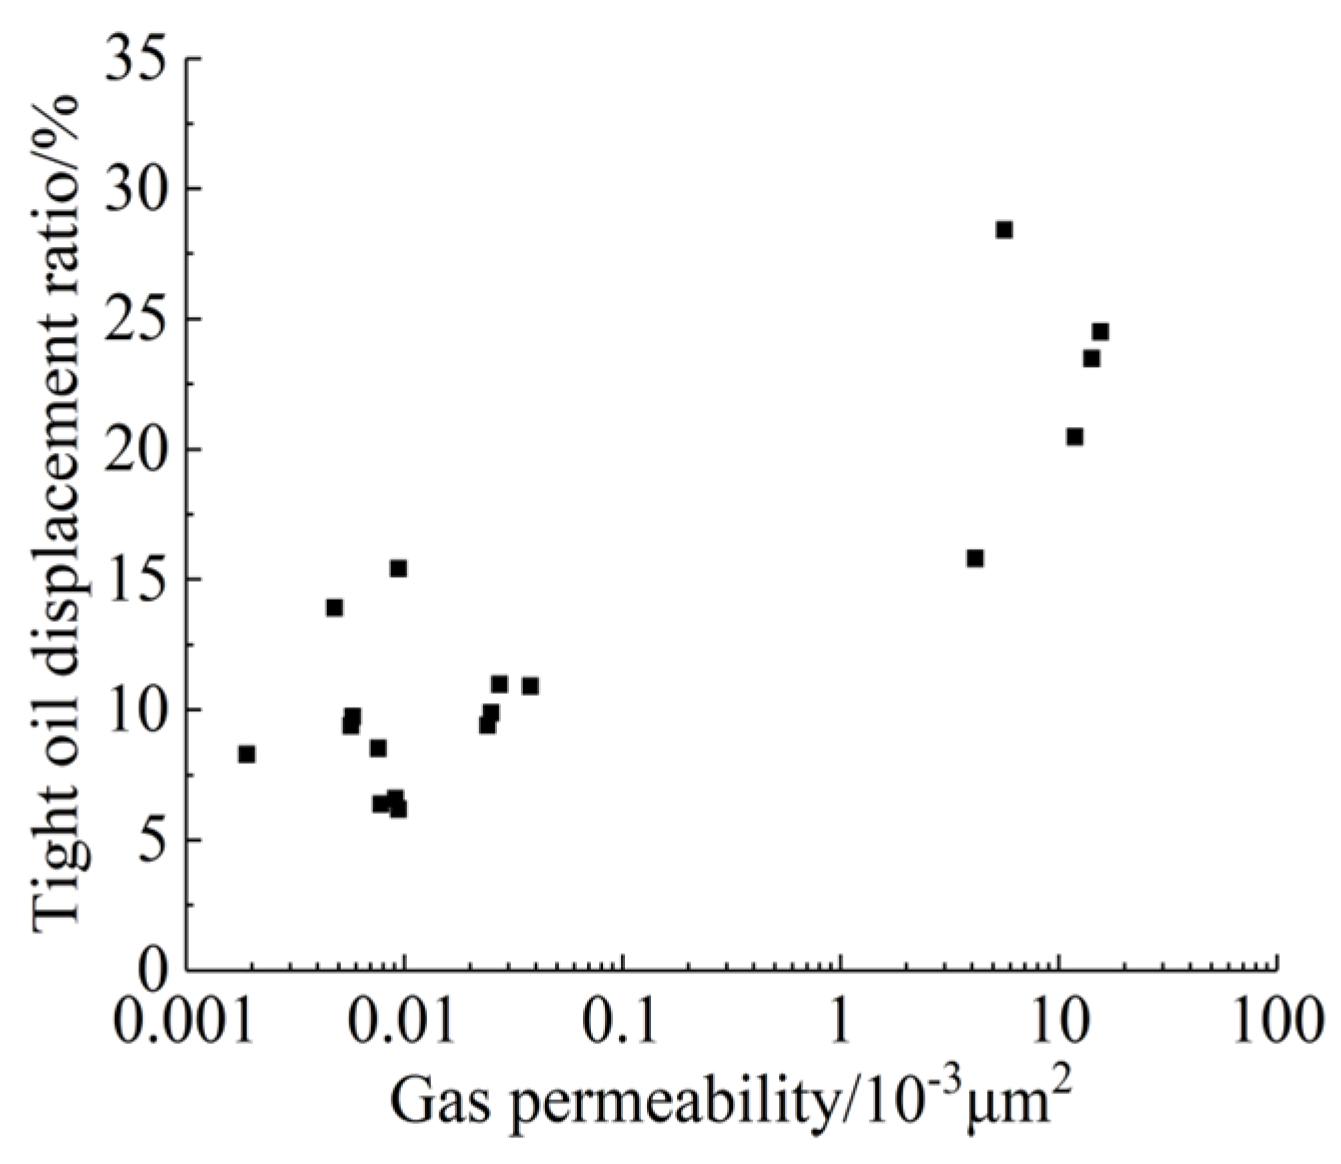
Permeability is a basic parameter used to characterize physical properties of tight oil reservoirs, and is a direct reflection of rock property. The gas permeability of tight sandstone cores was measured using a pulse attenuation permeability testing instrument. The relationship between permeability and tight oil displacement ratio is shown in Figure 9. The tight oil displacement ratio basically shows a positive correlation. The tight oil displacement ratio increases with an increase in tight sandstone core permeability. If the permeability is higher, the pore throat connectivity is better, hence the tight oil seepage resistance is relatively smaller. Thus, the tight oil displacement ratio is basically higher. The experimental results validated this viewpoint. When the permeability of tight sandstone core was around 0.001 × 10⁻³ μm2~0.04 × 10⁻³ μm2, the tight oil displacement ratio was around 6.18–15.42%. When the permeability was around 4 × 10⁻³ μm2~20 × 10−3 μm2, the tight oil displacement ratio was around 15.8–28.41%.
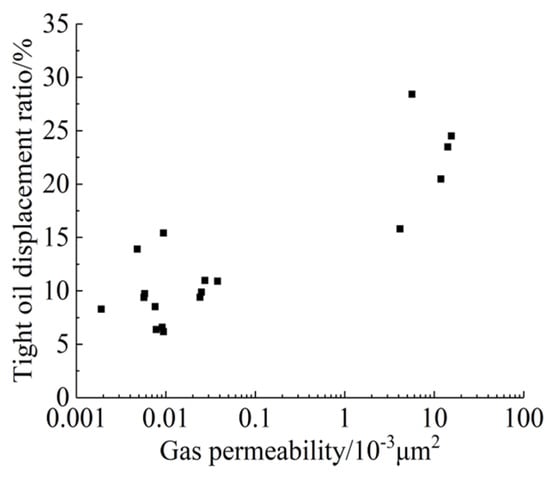
Figure 9.
The relationship between permeability and tight oil displacement ratio.
6.1.2. Temperature
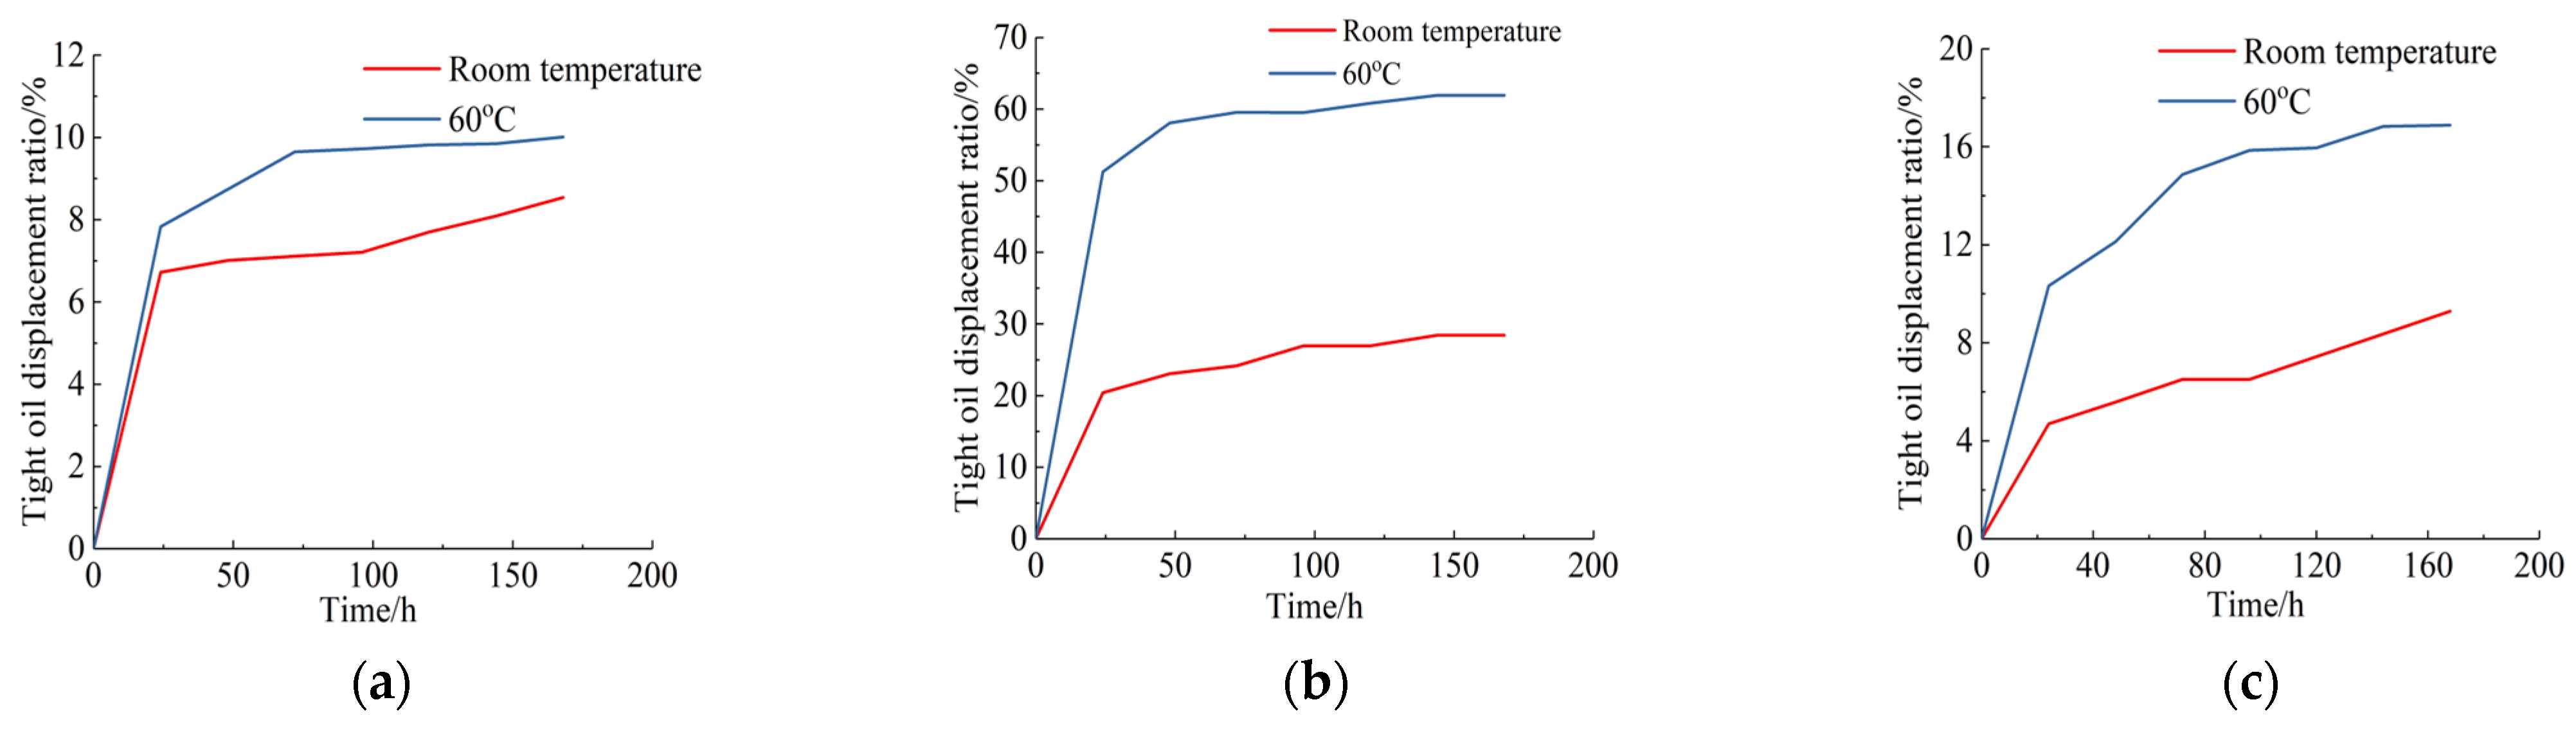
The tight sandstone cores Q1–16, L66–348–18, and Q1–19 were randomly selected to study the influence of temperature, using water in order to keep the temperature constant. Their permeabilities were 0.0019 × 10⁻³ μm2, 5.4823 × 10⁻³ μm2, and 0.0056 × 10⁻³ μm2, respectively. A temperature of 60 °C was selected to simulate reservoir temperature. As shown in Figure 10, the tight oil displacement ratio at 60 °C was much higher than that at room temperature, for the molecular activity of tight oil and the active compounds increased as the temperature increased. Moreover, the difference of the tight oil displacement ratio increased with an increase in permeability difference.
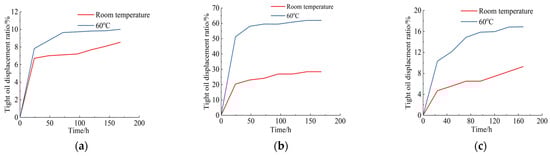
Figure 10.
The relationship between temperature and tight oil displacement ratio. (a) Core Q1–16; (b) core L66–348–18; (c) core Q1–19.
6.2. Using Nuclear Magnetic Resonance for Studying Oil Displacement
6.2.1. Using Nuclear Magnetic Resonance (NMR) for Studying Oil Displacement Process
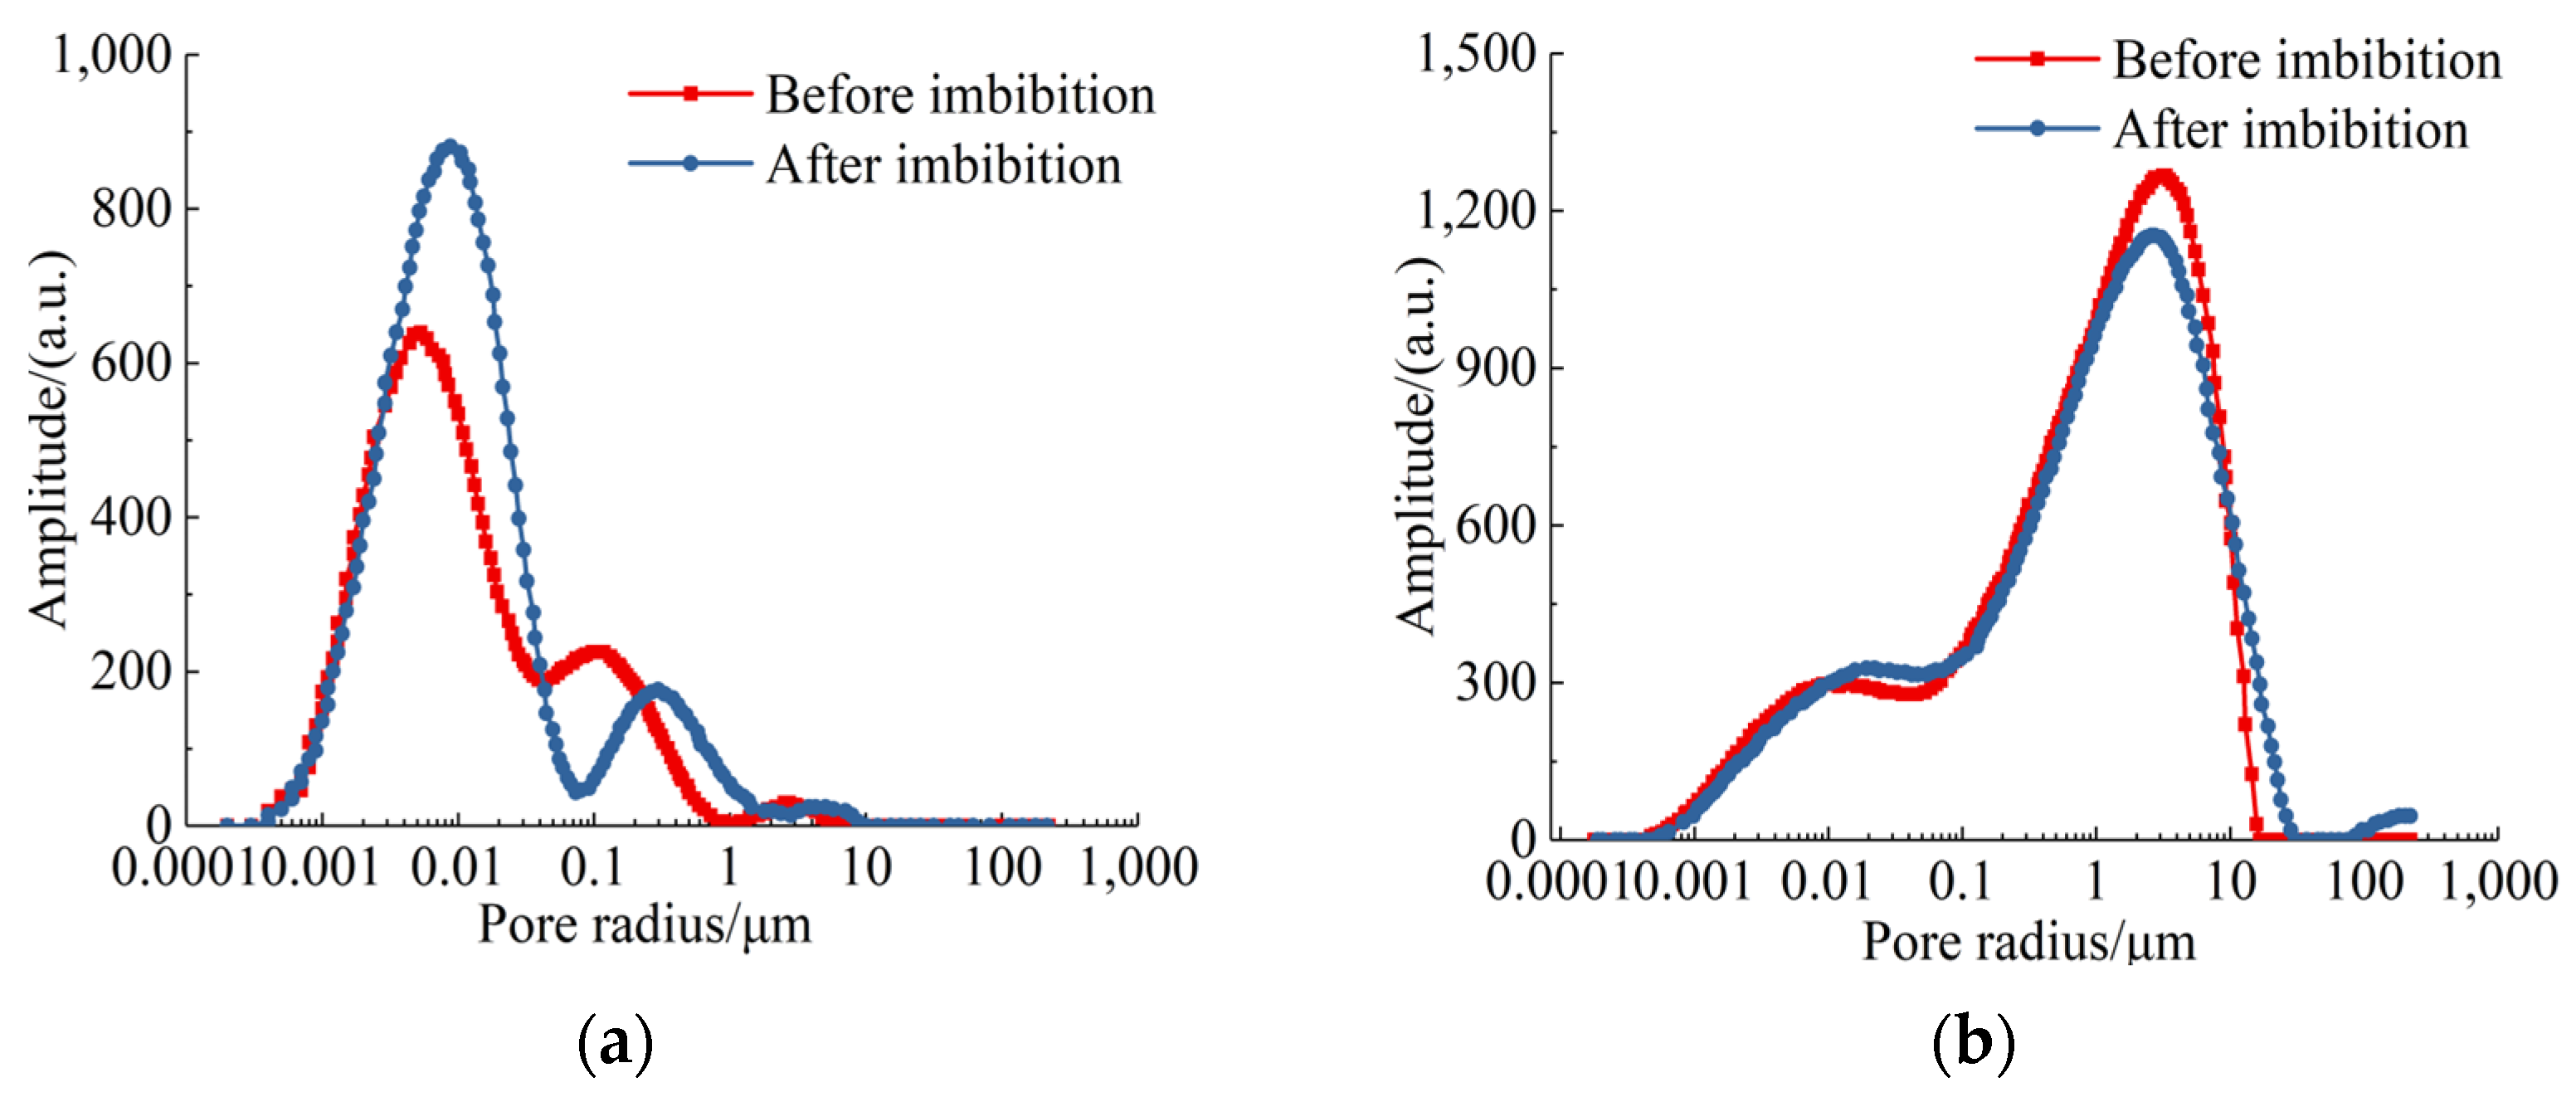
The tight sandstone cores Q3–8 and L54–350–21 were randomly selected to analyse fluid dynamics in the pores during the oil displacement process by T2 spectrum. The results are shown in Figure 11. For the core Q3–8, the amplitudes of the small pores after oil displacement became larger than that before oil displacement, meaning that the small pores were saturated with the oil displacement fluid. Meanwhile, for the medium pores, their amplitudes after oil displacement became smaller than that before oil displacement, meaning that the medium pores released fluid. The amplitudes of the large pores fluctuated as the pore diameter varied, meaning that the fluid distribution in the large pores varied as oil displacement carried on. For the core L54–350–21, its physical properties were much better than those of core Q3–8, and its T2 spectrum was simpler than that of core Q3–8. The amplitudes of the small pores became larger after oil displacement, but the amplitudes of medium pores became smaller while those of the large pores showed fluctuation. Based on the T2 spectrum analysis of two tight sandstone cores, it could be concluded that the tight oil in the small pores was substituted by oil displacement fluid, and the substituted oil accumulated in medium pores. Then, oil in medium pores was driven into the large pores, changing the oil/water distribution in large pores.

Figure 11.
NMR of tight sandstone cores for oil displacement analysis. (a) Core Q3–8; (b) core L54–350–21. Annotation: a.u. is the the universal unit in NMR, meaning the amplitude of the pulse signal.
6.2.2. Oil Displacement Dynamics
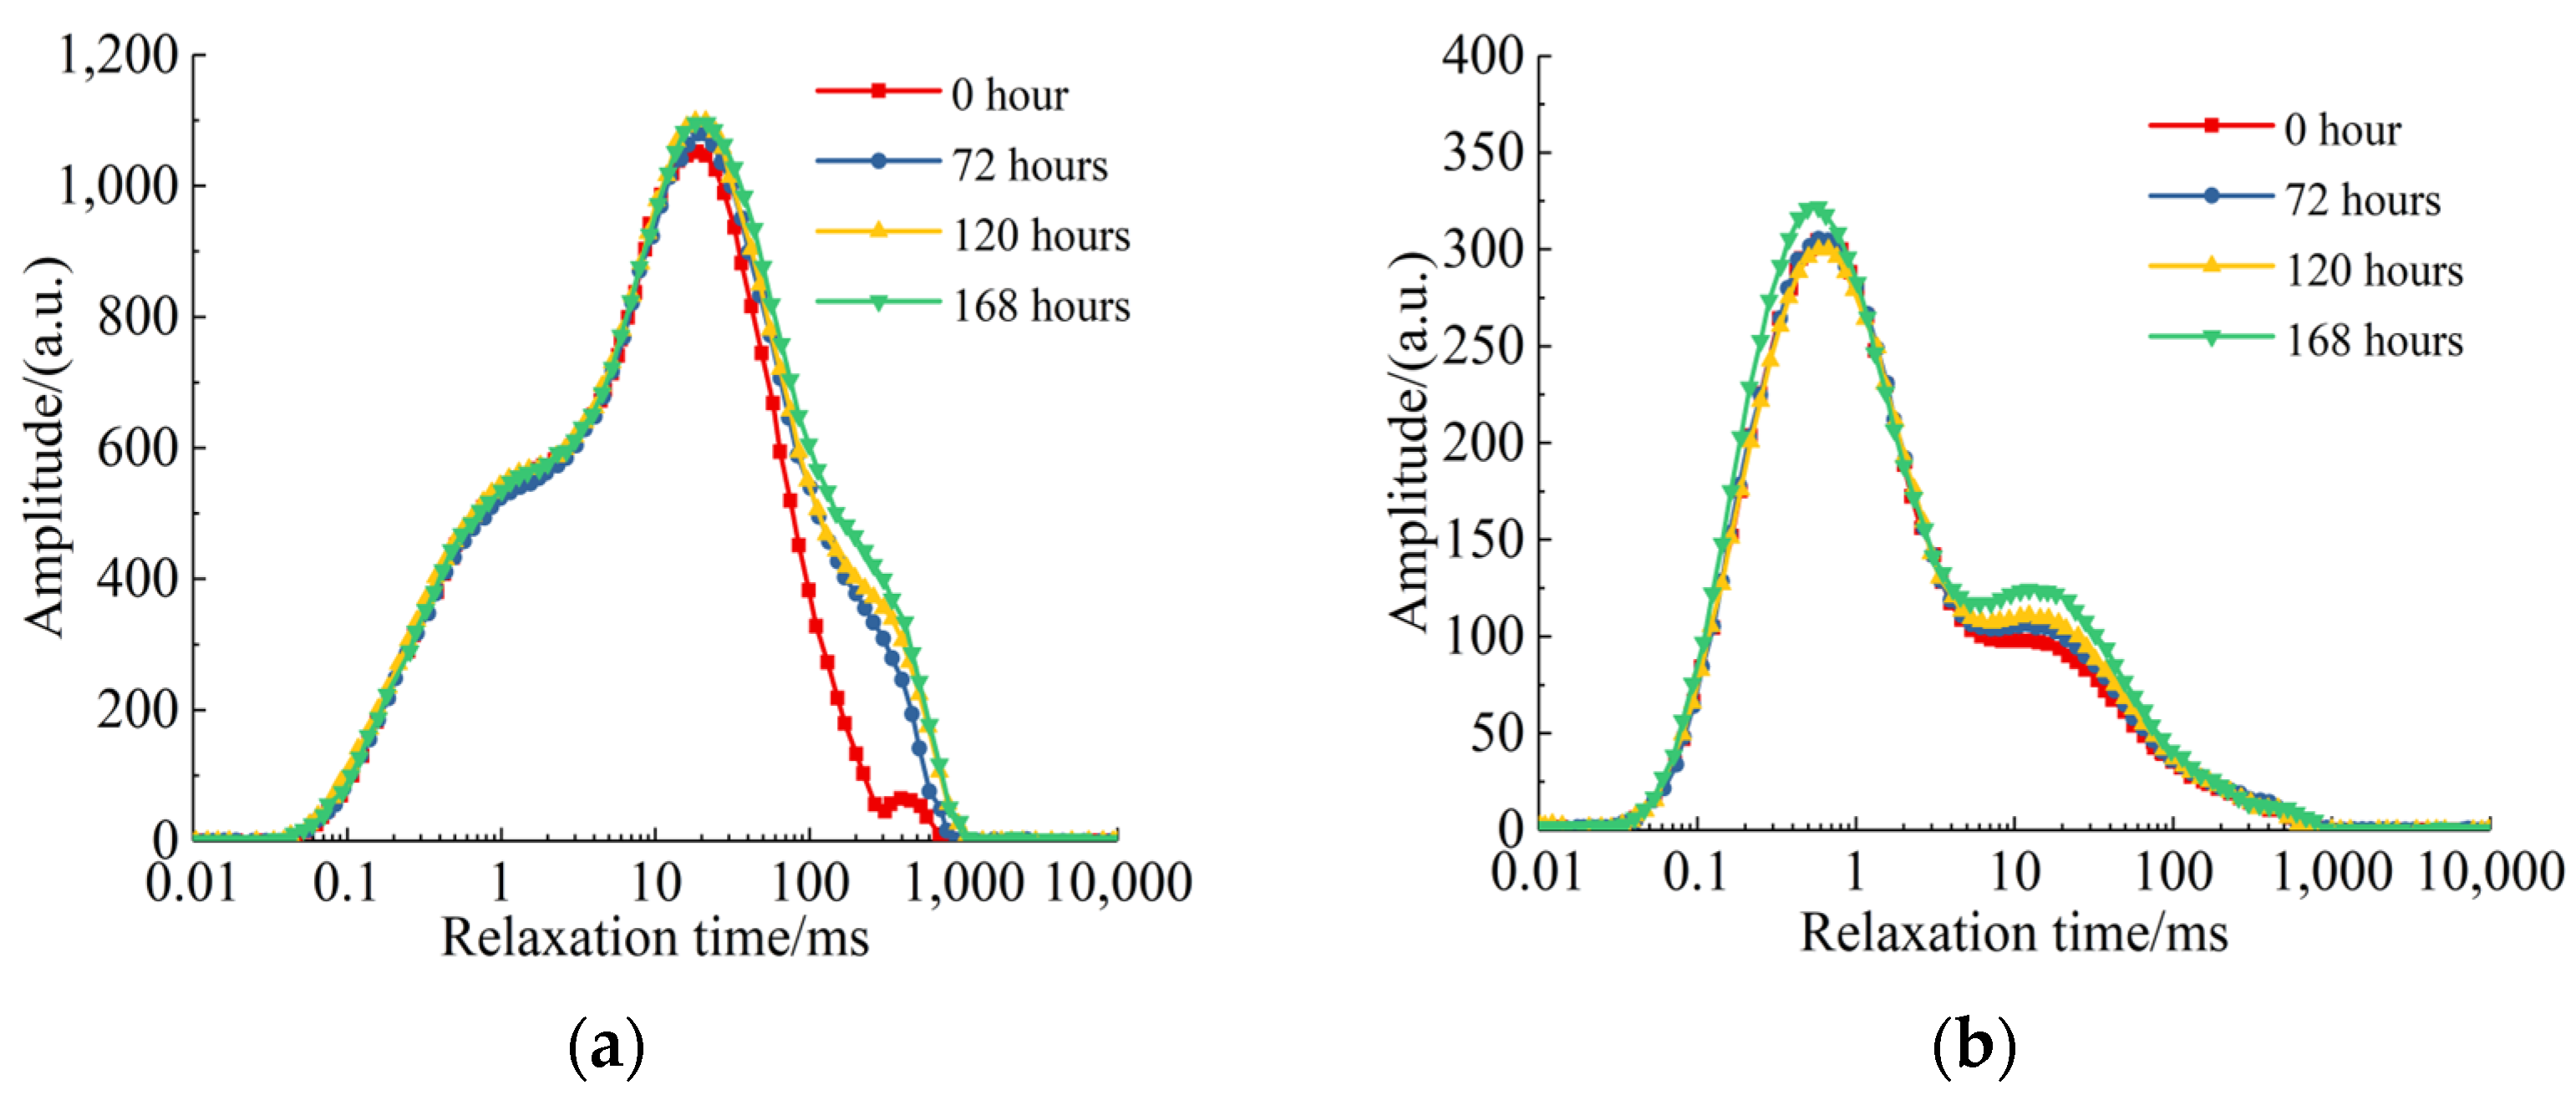
The tight sandstone cores L54–350–5 and Q1–10 were randomly selected for use in studying oil displacement dynamics during energy storage fracturing. NMR technology was employed to understand the fluid dynamics during the oil displacement stage of energy storage fracturing, and the results are shown in Figure 12. For the tight sandstone core L54–350–5, the obvious oil–water displacement occurred after 72 h, and the displacement ratio increased slowly over time. In the experiment, the oil–water displacement mainly occurred in the large pores of the tight sandstone core L54–350–5. For the tight sandstone core Q1–10, obvious oil–water displacement occurred both in small and medium pores. In contrast with the core L54–350–5, the most obvious oil–water displacement occurred during the period from 120 h to 168 h of the experiment. Furthermore, the displacement ratio showed a slow growth trend during the first 120 h. The difference in physical properties between the two cores resulted in the distinction of fluid dynamic distribution. The physical properties of core L54–350– 5 were much better than those of core Q1–10; hence, the obvious oil–water displacement occurred relatively earlier, and the oil–water displacement efficiency was much higher than that of Q1–10. After 168 h, the oil–water displacement ratio of Q1–10 was about 9.74%, but the oil–water displacement ratio of core L54–350–5 was about 23.48%, approximately 2.4 times that of Q1–10.

Figure 12.
NMR of tight sandstone cores for fluid dynamics analysis. (a) Core L54–350–5; (b) core Q1–10.
6.3. Pore Size Utilized by Oil Displacement Process of Energy Storage Fracturing
Pores utilized by the oil displacement process of energy storage fracturing were the minimum size that could be effectively developed using current technical means. The smaller the minimum pore utilized was, the more tight oil could be displaced at this stage. Therefore, the minimum utilized pore size is also one of the key indicators required to measure the results of energy storage fracturing. With the help of NMR technology, eight tight sandstone cores were employed to study the pore sizes utilized by the oil displacement process, and the results are shown in Table 8.
Table 8.
Pore threshold analysis.
The C coefficient was employed to analyse the T2 spectrum, obtaining the pore distribution of the tight sandstone cores. The minimum pore size utilized during the oil displacement process was about 0.002999 μm~0.012885 μm, while the maximum pore sized utilized during the oil displacement process was approximately 0.18022 μm~114.7688 μm. There were fractures in core L66–348–18, hence its maximum pore measured was an exception. Specifically considering the tight sandstone core L66–348–18, the maximum pore utilized during the oil displacement process was around 0.18022 μm~6.215132 μm, roughly a 35–fold difference.
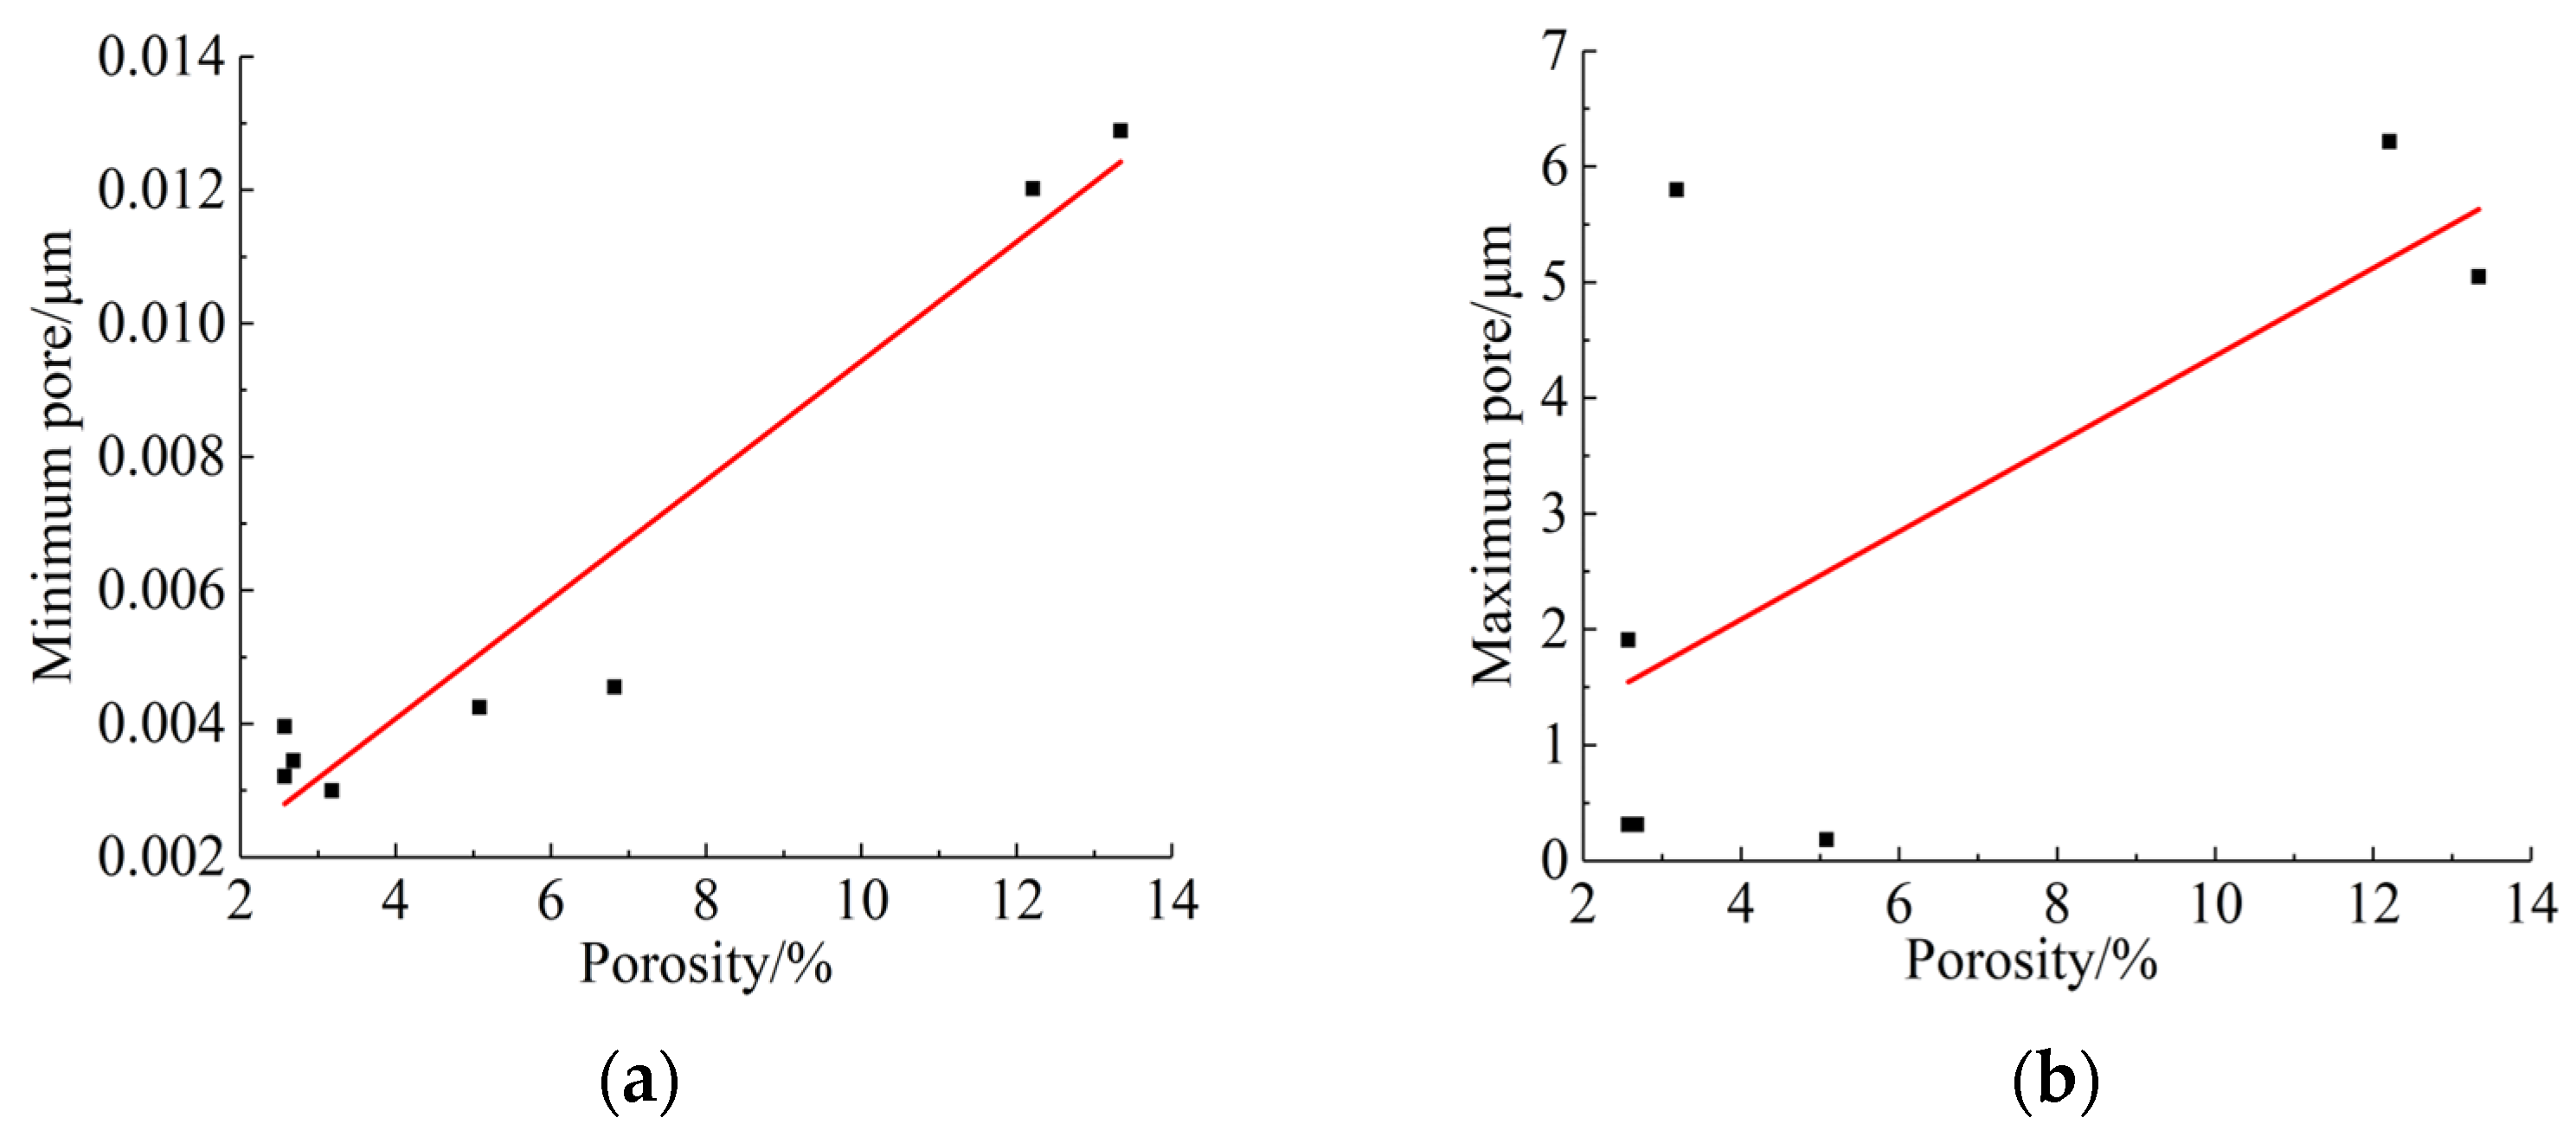
Permeability and porosity are both characteristic parameters of tight sandstone cores. As oil displacement occurred in the pores, this process was closely related to pore distribution characteristics. Therefore, it was necessary to understand the relationship between the pore threshold and the corresponding physical property of tight sandstone cores. The relationship between the porosity of tight sandstone cores and the pore threshold of the oil displacement process was determined. The details are shown in Figure 13.
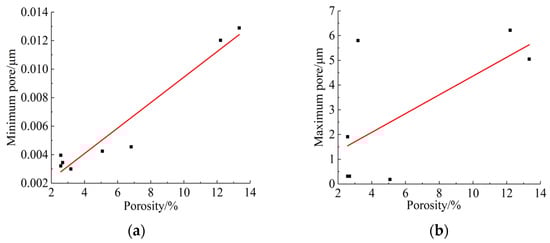
Figure 13.
The relationship between porosity and pore threshold. (a) The minimum pore size; (b) the maximum pore size.
There was a general positively correlated linear relationship between the minimum pore size and porosity. Thus, the minimum pore size for the oil displacement process during energy storage fracturing depends on this physical property of the tight sandstone cores. There was also a positive relationship between the maximum pore size and porosity; however, the relationship between them was a somewhat complex, and not as obvious as that between minimum pore size and porosity. The details of the relationship between porosity and the minimum pore and maximum pore size were fitted as Equations (4) and (5), with the fitting coefficients R2 0.93675 and 0.42728, respectively.
According to the previous analysis, during the oil displacement process, small pores were mainly involved in oil drainage, while large pores were involved with oil–water coexistence. Capillary forces were principally involved during the oil displacement stage, and could be calculated using Equation (6):
Obviously, there was an inverse correlation between the capillary force and pore radius; the smaller the pore radius, the greater the capillary force. The minimum pore size that could be utilized showed an increasing trend with increasing porosity, as the capillary force decreased when the pore radius increased. The tight oil that was substituted from the smaller pores accumulated in the larger pores, with the capillary forces in the larger pores playing a certain but limited role. Although there was a positive correlation between porosity and the maximum pore size, their relationship was not as regular as that in the minimum pore.
7. Conclusions
(1) The oil–displacement agents CBA and OBA for energy storage fracturing were made up of the fluorocarbon non–ionic surfactant FC, anionic surfactant AS, amphoteric surfactant CA and OA. The performance of both CBA and OBA were comprehensively evaluated. In general, the performance of OBA was slightly better than that of CBA when the concentration was more than 0.25 wt%.
(2) The tight oil distributed in smaller pores was substituted by slickwater fracturing fluid, and then aggregated into larger pores. The oil–water substitution and the aggregation of tight oil occurred simultaneously in larger pores. With an increase in mineralization intensity, the tight oil displacement ratio showed a downward trend.
(3) The tight oil displacement ratio basically showed an increasing trend with increasing tight sandstone core permeability. The tight oil displacement ratio increased as the temperature increased, and the tight oil displacement ratio difference for different temperatures actually grew with increasing tight sandstone core permeability differences.
(4) The pore size utilized during the oil displacement stage of energy storage fracturing was determined with the use of nuclear magnetic resonance technology. In the experiment, the minimum pore utilized was around 0.002999 μm~0.012885 μm, while the maximum pore utilized was around 0.18022 μm~114.7688 μm. There was an obvious positive linear relationship between the minimum pore size utilized and porosity.
Author Contributions
Conceptualization, G.Q. and J.S.; Formal analysis, M.Z. and J.P.; Methodology, G.Q. and J.S.; Project administration, G.Q. and J.S.; Resources, J.S. and X.B.; Writing—original draft, G.Q. and C.Y. All authors have read and agreed to the published version of the manuscript.
Funding
The authors acknowledge the financial support by the Youth Program of National Natural Science Foundation of China (51804255), the Opening Fund of Key Laboratory of Unconventional Oil & Gas Development (China University of Petroleum (East China) (19CX05005A–6)), the Ministry of Education, and the Fundamental Research Funds for the Central Universities (19CX05005A–6).
Institutional Review Board Statement
Not applicable.
Informed Consent Statement
Not applicable.
Data Availability Statement
The data presented in this study are available on request from the corresponding author.
Conflicts of Interest
The authors declare no conflict of interest.
Nomenclature
DR—fluid friction reduction efficiency of slickwater fracturing fluid, %; Δρ1—pressure difference of tap water flowing through pipeline, kPa; Δρ2—pressure difference of slickwater fracturing fluid flowing through pipeline, kPa; ρw, ρo—densities of fracturing fluid and tight oil, respectively; M—weight of tight oil produced by imbibition; Mo—initial weight of the tight sandstone core when imbibition begins; Mt—weight of the tight sandstone core at time t after imbibition begins; R—tight oil displacement ratio; ΔM—tight oil saturated in the tight sandstone core; Pc—capillary force, N; σ—interfacial intension, mN/m; θ—contact angle, °; r—pore radius, mm; ymin—minimum pore, m; ymax—maximum pore, e; x—porosity, %.
References
- Jarvie, D. Components and processes affecting producibility and commerciality of shale resource systems. Geol. Acta Int. Earth Sci. J. 2014, 12, 307–325. [Google Scholar]
- Kaiser, M.J. Profitability assessment of Haynesville Shale gas wells. Energy 2012, 38, 315–330. [Google Scholar] [CrossRef]
- Neff, S.; Coleman, M. EIA outlook: Reversal in U.S. oil import dependency. Energy Strategy Rev. 2014, 5, 6–13. [Google Scholar] [CrossRef]
- Kuang, L.; Tang, Y.; Lei, D.; Chang, Q.; Ouyang, M.; Hou, L.; Liu, D. Formation conditions and exploration potential of tight oil in the permian saline lacustrine dolomitic rock, Junggar basin, NW China. Pet. Explor. Dev. 2012, 39, 700–711. [Google Scholar] [CrossRef]
- Song, Z.; Li, Y.; Song, Y.; Bai, B.; Hou, J.; Song, K.; Jiang, A.; Shan, S. A Critical Review of CO2 Enhanced Oil Recovery in Tight Oil Reservoirs of North America and China. In Proceedings of the SPE/IATMI Asia Pacific Oil & Gas Conference and Exhibition, Bali, Indonesia, 29–31 October 2019. [Google Scholar]
- Ghaderi, S.M.; Clarkson, C.R.; Ghanizadeh, A.; Barry, K.; Fiorentino, R. Improved Oil Recovery in Tight Oil Formations: Results of Water Injection Operations and Gas Injection Sensitivities in the Bakken Formation of Southeast Saskatchewan. In Proceedings of the SPE Unconventional Resources Conference, Calgary, AB, Canada, 15–16 February 2017. [Google Scholar]
- Fan, C.; Tang, X.; Zhang, Y.; Song, Y.; Jiang, Z.; Luo, Q.; Li, B. Characteristics and formation mechanisms of tight oil: A case study of the huahai depression, Jiuquan basin, northwest China. Energy Explor. Exploit. 2019, 37, 296–314. [Google Scholar] [CrossRef]
- Jingli, Y.; Xiuqin, D.; Yande, Z.; Tianyou, H.; Meijuan, C.; Jinlian, P. Characteristics of tight oil in triassic Yanchang formation, Ordos basin. Pet. Explor. Dev. 2013, 40, 161–169. [Google Scholar]
- Wang, F.; Zeng, F.; Wang, L.; Hou, X.; Cheng, H.; Gao, J. Fractal analysis of tight sandstone petrophysical properties in unconventional oil reservoirs with nmr and rate–controlled porosimetry. Energy Fuels 2021, 35, 3753–3765. [Google Scholar] [CrossRef]
- Liang, X.; Zhou, F.; Liang, T.; Wang, R.; Su, H.; Yuan, S. Mechanism of using liquid nanofluid to enhance oil recovery in tight oil reservoirs. J. Mol. Liq. 2021, 324, 114682. [Google Scholar] [CrossRef]
- Longde, S.; Caineng, Z.; Ailin, J.; Yunsheng, W.; Rukai, Z.; Songtao, W.; Zhi, G. Development characteristics and orientation of tight oil and gas in china. Pet. Explor. Dev. 2019, 46, 1073–1087. [Google Scholar]
- Cao, Z.; Liu, G.; Xiang, B.; Wang, P.; Niu, G.; Niu, Z.; Li, C.; Wang, C. Geochemical characteristics of crude oil from a tight oil reservoir in the Lucaogou formation, Jimusar sag, Junggar Basin. AAPG Bull. 2017, 101, 39–72. [Google Scholar] [CrossRef]
- Jiang, Y.; Liu, Y.; Yang, Z.; Nan, Y.; Zhou, N. Characteristics and origin of tuff–type tight oil in Jimusaer sag, Junggar Basin, NW China. Pet. Explor. Dev. 2015, 42, 810–818. [Google Scholar] [CrossRef]
- Chen, Z.; Liao, X.; Zhao, X.; Li, X. Appraising carbon geological–storage potential in unconventional reservoirs: Engineering–parameters analysis. SPE Reserv. Eval. Eng. 2018, 21, 476–488. [Google Scholar] [CrossRef]
- Jabbari, H.; Zeng, Z. Hydraulic fracturing design for horizontal wells in the Bakken formation. In Proceedings of the 46th US Rock Mechanics/Geomechanics Symposium, Chicago, IL, USA, 24–27 June 2012; American Rock Mechanics Association: Alexandria, VA, USA, 2012. [Google Scholar]
- Montgomery, J.B.; O’Sullivan, M. Spatial variability of tight oil well productivity and the impact of technology. Appl. Energy 2017, 195, 344–355. [Google Scholar] [CrossRef]
- Guo, C.; Xu, J.; Wei, M.; Jiang, R. Experimental study and numerical simulation of hydraulic fracturing tight sandstone reservoirs. Fuel 2015, 159, 334–344. [Google Scholar] [CrossRef]
- Guo, T.; Tang, S.; Liu, S.; Liu, X.; Rui, Z. Physical simulation of hydraulic fracturing of large–sized tight sandstone outcrops. SPE J. 2020, 26, 372–393. [Google Scholar] [CrossRef]
- Chen, Y.; Ma, G.; Jin, Y.; Wang, H.; Wang, Y. Productivity evaluation of unconventional reservoir development with three–dimensional fracture networks. Fuel 2019, 244, 304–313. [Google Scholar] [CrossRef]
- Lin, L.; Lin, W.; Xiong, S.; Yang, Z. Supplementary energy development boundaries of staged fracturing horizontal wells in tight oil reservoirs. Energy Explor. Exploit. 2020, 38, 014459872091632. [Google Scholar] [CrossRef]
- Wang, L.; Yu, W. Mechanistic simulation study of gas puff and huff process for bakken tight oil fractured reservoir. Fuel 2019, 239, 1179–1193. [Google Scholar] [CrossRef]
- Yu, W.; Lashgari, H.R.; Wu, K.; Sepehrnoori, K. CO2 injection for enhanced oil recovery in Bakken tight oil reservoirs. Fuel 2015, 159, 354–363. [Google Scholar] [CrossRef]
- Wei, J.; Zhou, X.; Zhou, J.; Li, J.; Wang, A. CO2 Huff-n-Puff after Surfactant-Assisted Imbibition to Enhance Oil Recovery for Tight Oil Reservoirs. Energy Fuels 2020, 34, 7058–7066. [Google Scholar] [CrossRef]
- Yang, D.; Song, C.; Zhang, J.; Zhang, G.; Ji, Y.; Gao, J. Performance evaluation of injectivity for water–alternating–CO2 processes in tight oil formations. Fuel 2015, 139, 292–300. [Google Scholar] [CrossRef]
- Luo, P.; Luo, W.; Li, S. Effectiveness of miscible and immiscible gas flooding in recovering tight oil from Bakken reservoirs in Saskatchewan, Canada. Fuel 2017, 208, 626–636. [Google Scholar] [CrossRef]
- Zou, J.; Liao, X.; Chen, Z.; Zhao, X.; Mu, L.; Chu, H.; Dong, P.; Guan, C. Integrated PVT and coreflooding studies of carbonated water injection in tight oil reservoirs: A case study. Energy Fuels 2019, 33, 8852–8863. [Google Scholar] [CrossRef]
- Ren, X.; Li, A.; Wang, G.; He, B.; Fu, S. Study of the imbibition behavior of hydrophilic tight sandstone reservoirs based on nuclear magnetic resonance. Energy Fuels 2018, 32, 7762–7772. [Google Scholar] [CrossRef]
- Peng, X.; Wang, X.; Zhou, X.; Lin, Z.; Huang, X. Lab–on–a–chip systems in imbibition processes: A review and applications/issues for studying tight formations. Fuel 2021, 306, 121603. [Google Scholar] [CrossRef]
- Dou, L.; Xiao, Y.; Gao, H.; Wang, R.; Liu, C.; Sun, H. The study of enhanced displacement efficiency in tight sandstone from the combination of spontaneous and dynamic imbibition. J. Pet. Sci. Eng. 2021, 199, 108327. [Google Scholar] [CrossRef]
- Tian, W.; Wu, K.; Gao, Y.; Chen, Z.; Li, J. A critical review of enhanced oil recovery by imbibition: Theory and practice. Energy Fuels 2021, 35, 5643–5670. [Google Scholar] [CrossRef]
- NB/T 14003.1–2015; Shale Gas Fracturing fluid Part 1: Slick Water Fracturing Fluid Performance Index and Evaluation Method. National Energy Administration: Beijing, China, 2015.
- SY/T5108–2006; Specification and recommended testing practice for proppants used in hydraulic fracturing operations. National Development and Reform Commission: Beijing, China, 2006.
- SY/T 5971–2016; Performance Evaluation Method of Clay Stabilizer for Fracturing Acidification and Water Injection in Oil and Gas Fields. National Development and Reform Commission: Beijing, China, 2016.
Publisher’s Note: MDPI stays neutral with regard to jurisdictional claims in published maps and institutional affiliations. |
© 2022 by the authors. Licensee MDPI, Basel, Switzerland. This article is an open access article distributed under the terms and conditions of the Creative Commons Attribution (CC BY) license (https://creativecommons.org/licenses/by/4.0/).