Article

Perspectives of Biodiesel Development in Poland against the Background of the European Union

by
Piotr Bórawski
1,*,
Lisa Holden
2,
Marek Bartłomiej Bórawski
3 and
Bartosz Mickiewicz
4
1
Department of Agrotechnology and Agribusiness, Faculty of Agriculture and Forestry, University of Warmia and Mazury in Olsztyn, 10-719 Olsztyn, Poland
2
Department of Animal Science, Faculty of Agricultural Sciences, Pennsylvania State University, State College, PA 16802, USA
3
Faculty of Law and Administration, University of Warmia and Mazury in Olsztyn, 10-725 Olsztyn, Poland
4
Faculty of Economics, West Pomeranian University of Technology, 70-310 Szczecin, Poland
*
Author to whom correspondence should be addressed.
Energies 2022, 15(12), 4332; https://doi.org/10.3390/en15124332
Submission received: 25 May 2022 / Revised: 10 June 2022 / Accepted: 11 June 2022 / Published: 13 June 2022
(This article belongs to the Special Issue Energy Crops Production in Central and Eastern Europe)

Abstract

:
Biofuels are becoming more important in the renewable energy sources mix. Liquid biofuels are products of agriculture. Bioethanol can be prepared from corn, beetroot and other plants. Biodiesel is mainly made from rapeseed. This paper presents information about biodiesel development in Poland, as well as some background information about its development in the European Union (EU). We analyzed the data about biofuels in the literature, and provide statistical data about liquid biofuel in Poland and other countries of the EU. The aim of the study is to assess the viability of liquid biofuel development in Poland. The base for biodiesel production in Poland and the EU is rapeseed. The production yields and sown area of rapeseed increased in Poland from 2005–2020. This was due to integration and European Union policies which aim to supply clean energy. The energy mix in Poland differs from that of the EU. Solid biofuels have made up the biggest share of renewable energy sources in Poland (73.4%) and the EU (40.1%). Poland has smaller share of wind energy, biogas, heat pump, water energy, solar anergy, municipal waste and geothermal energy in its renewable energy sources compared to the rest of the EU. Only with solid and liquid biofuels is the share of renewable energy sources larger in Poland compared to the EU averages. Poland has decreased its share of solid biofuels and water energy among its renewable energy sources, while other sources have increased. Poland is investing to increase its renewable energy sources. To analyze the opportunities for biodiesel production in Poland, we used the scenario method of analysis. We outlined three scenarios. The first is increasing the production of biodiesel by 3% each year for the next three years. The second is production remains unchanged, i.e., at the 2020 level. The last scenario is decreasing production by 3% each year. According to the first scenario, the total demand for rapeseed for energy and food purposes will be 375 thousand tons in 2025. Such a scenario is very likely to occur because of the growing demand for biodiesel and edible oil. The current situation with Ukraine and the Russian Federation will create an increase in demand for rapeseed, leading to higher prices.

1. Introduction

Renewable energy sources include solid biomass, biofuels, wind energy, geothermal and solar energy. The share of solid biomass in the renewable energy sources mix is decreasing while the that of biofuels, wind and solar energy is increasing [1].
The global energy situation is not stable at present because of global warming, greenhouse (GHG) gas emissions and the depletion of fossil fuels. Fossil fuels such as oil, coal and gas are becoming increasingly scarce [2]. Additionally, these resources are risky because they are non-renewable, and are expensive because their consumption creates greenhouse gasses (GHG) [3]. Global warming and energy security concerns have moved attention to renewable energy sources, which play a significant role in energy security, sustainable development and the preservation of the environment [4]. Energy security is a key issue which is facing many challenges, for example: energy price changes, increasing demand, production growth, dependence on inputs, geopolitical uncertainties, wars and others [5].
The biggest CO2 emitter is China; however, this country is also the biggest producer of photovoltaic (PV) and wind power (WP) [6]. Developed and developing countries with adequate solar radiation are moving toward photovoltaic energy and wind [7]. The efficiency of renewable energy sources depends on many factors, for example, production costs, improvements in the performance of photovoltaics and wind turbines, the growth of industries and global conditions [8]. Global changes have been observed in the energy sector; for example, savings on demand side, energy production efficiency improvements and reduced use of fossil fuels [9,10,11,12,13,14]. Renewable energy sources such as wind and solar have great potential; however, their share is smaller [15].
Liquid biofuels are becoming increasingly important in the energy mix in the European Union (EU). Concern about reducing emissions of CO2 and other harmful gasses has forced the EU to look for renewable energy sources. The depletion of coal, gas and oil could threaten the world’s energy needs [16]. The rapid development of renewable energy has attracted significant attention because of its economic benefits, security and advantages in terms of climate change [17]. However, the energy from renewable sources has disadvantages, because it needs to be procured, delivered and stored.
Access to and the costs of biocomponents are becoming threats to the development of the energy sector. The demand and profitability of biofuels are determined by governmental regulations, import taxes, subsidies, etc. [18].
The development of biofuels has created green workplaces in the sector and is helping to achieve sustainable development [19]. However, such development, as well as that of other renewable energy sources such as biomass, wind, solar and others, depends on environmental, economic and social factors [20].
One of the most important problems in the development of biofuels is the supply chain. Problems with the supply of rapeseed, corn, and other basic resources for biofuel production create uncertainty [21]. However, biofuels are the most promising potential alternative to reduce dependency on fossil fuels. Previously, biofuels were a niche energy source. However, they have since become relevant to the global market [22].
The development of liquid biofuels and other renewable energy sources is helping to achieve sustainable development, focusing on economic, social, and environmental issues. Moreover, the sustainable development concept can encompass institutional, cultural, organizational, and technical issues [23].
Agriculture is important factor in the production of biodiesel and bioethanol [24]. The Common Agricultural Policy (CAP) of the EU supports a better standard of living of farmers and care for the natural environment [25]. Agriculture is an important supplier of public goods for sustainable development [26]. The classical three-dimensional approach for sustainability is not exhausting for farms. They are important in the self-provision of nutritious food [27]. Farms are also important in biodiesel and solid biofuels development, so the energy and food nutritious approach should be incorporated within the framework of classical sustainability.
The growing demand for energy in the twenty-first century and increasing concern about the environment have forced the world to look for renewable energy sources (RES). Biodiesel, bioethanol, biomass, wind, solar, and geothermal can replace fossil fuels to meet energy needs [28,29].
The EU is the most important producer of biodiesel; the United States (US) produces mostly bioethanol. Biodiesel can be used in a clean form or together with diesel. Biodiesel can be produced from a wide range of feedstock [30], such as rapeseed, soybeans, sunflower, palm oil, and others. It can also be blended with fossil diesel and can be used as stable biodiesel. It also has an impact on the development of farms and boosts their incomes. Nowadays, rapeseed production is the most promising, which has led to price increases [31].
Bioethanol can be made from corn. Although crops comprise the main costs of biofuel production, they are the most important part of future energy sources [32]. The use of bioethanol requires construction changes in internal combustion engines [33].
There are four generations of biofuels [29]:
1st generation: produced mainly from rapeseed and corn;
2nd generation: produced from products having no nutritional basis;
3rd generation: made from genetically modified biomass;
4th generation: made from non-conventional biomass and other products such as algae.
The profitability of the biofuel sector is determined by new processing technologies. The aim of these technologies is to reduce the cost of production of biofuels [18].
The development of liquid biofuels depends on legal conditions. The European Union declared its intention to derive at least 10% of its energy from renewable sources by 2020 [19].
The development of liquid biofuels depends on EU policy. Its aim is to increase energy efficiency and security, the development of renewable energy sources, the development of competitiveness, and to reduce the impact on the environment [34]. The EU is supporting renewable energy development and stimulates the promotion of environmentally friendly products [35]. In this regard, the EU is using tools such as direct payments support, climate protection, and pro-ecological sources of heat and fuel for farms [24]. The most important driver for the development of global biodiesel production is the Common Agricultural Policy (CAP) of the EU. The development requires that more arable land be devoted to rapeseed production [36].
The European Commission is managing the development of renewable energy sources. The Green Deal is an example of European policy aiming at achieving climate neutrality by 2050 [37,38]. Policy actions include investments of at least €1 trillion in renewable energy sources [39]. As such, the European Union can be described as a leader in actions aimed at looking for alternative energy sources [40].
Another driver for the development of biofuels is global prices of raw materials. These prices depend on various factors such as yields, production, and global conditions such as international trade, wars, and weather conditions [36].
The development of biodiesel production depends on the expanded production of future raw material such as oilseed. Vegetable oil is converted to biodiesel in the process of transesterification [41].
The aim of this research is to describe the development of biodiesel in Poland against the background of the EU. In more detail, the primary aim is to determine the share of liquid biofuels in the renewable energy mix in Poland and in other countries of the EU.
To achieve this goal, we had to answer the following questions:
  • What is the share of liquid biofuels and how has it changed?
  • What factors determine the development of liquid biofuel development in the EU?
Hypothesis 1 (H1). 
Biodiesel production in the EU is strongly correlated with rapeseed production.
Hypothesis 2 (H2). 
Liquid biofuels cause the competition between the nutrition, fodder, and petrochemical sectors.
The paper is organized as follows. First, we present the historical development of liquid biofuels in the EU. Second, we present the methodology for our analyses. Third, we describe the research results. Next, the authors of the paper present a discussion. The final part is our conclusion.

2. Materials and Methods

2.1. Material

The main sources of data for our analyses were Eurostat and Statistics Poland. We analyzed biofuel development from 2000–2020.
Rapeseed is the main source for biodiesel production in Poland. The development of biodiesel has created competition between the fodder, food, and petrol industries in Poland. Moreover, the war in Ukraine has impacted biodiesel production and increased the price of rapeseed. First-generation biofuels are produced from rapeseed. Polish accession to the EU had an impact on the area of rapeseed sown, which increased from 550 thousand hectares to 900 thousand hectares from 2005–2020. Rapeseed yield also increased from 30.3 dt/ha to 31.5 dt/ha in 2005–2020. As a consequence, the harvest of rapeseed increased from 1632 thousand tons to 3124.8 thousand tons during this the period. The COVID-19 pandemic did not have a strong negative impact on sown area, yields, or the harvest of rapeseed in Poland (Figure 1).

2.2. Methods

The scenario method was used to check the perspectives for biodiesel production in Poland. Scenario methods are used to analyze discontinuous changes, i.e., changes that are not an extrapolative continuation of the processes taking place in the environment in the past at a given time. Their use dates back to the early 1970s. General Electric and Shell Nederland are the precursors in this field [43].
The scenario method is particularly valuable in the process, as opposed to the result. With this method, alternative strategies can be developed and assessed, managers can be encouraged to think more flexibly, and consensuses can be built. Assessing the likely outcomes of using different strategies in different scenarios will help identify which are the best and facilitate the development of a contingency plan [44].
We have elaborated three scenarios for biodiesel production:
-
The first, in which the production of biodiesel will increase by 3% each year;
-
The second, in which production will stay at 2020 levels;
-
The third, in which production will decrease each year by 3%.
In order to elaborate these scenarios, we used following variables: diesel consumption, demand for esters, demand for rapeseed, processing of rapeseed, edible oil, nutritious aims, loses, and total demand. One of the most important problems in preparing these scenarios was to evaluate the contribution of raw materials. It was assumed that Poland is self-sufficient in rapeseed and biodiesel production. The scenarios were elaborated based on the OECD-FAO prognosis. Although such prognoses can be prepared using different methods [45,46,47,48,49,50,51], the OECD-FAO one is considered to be the most precise.

3. Results

3.1. Renewable Energy Production in Poland against the Background of the European Union

Renewable energy sources are among the most important factors determining economic growth in Poland and elsewhere [52,53]. The share of individual renewable energy sources carriers in Poland changed in 2007–2019. The shares of solid biofuels and water energy decreased by 28% and 47.7%, respectively.
The most promising source of renewable energy is wind, which increased from 0.9% to 13.7% in 2007–2019 (Table 1). Wind farms are continuing to expand in Poland, and several are planned on the Baltic Sea to create energy from offshore farms.
Liquid biofuels are a promising energy source; their share increased from 2.3% to 10.36% in 2007–2019. They are important because they can reduce GHG emissions. Moreover, Poland is a big producer rapeseed, which is a basic product for biodiesel production. Polish farms are eager to harvest rapeseed because of higher prices.
Biogas also has great potential for development in the future. Its share increased from 1.3% to 3.15% over the same period. There are about 300 biogas plants in Poland, whereas in Germany, there are about 10,000. However, Poland has great potential for the production of biogas. The development of this renewable energy source requires further investments on farms to produce biogas from agricultural manure.
Geothermal, municipal waste, and solar energy make up the smallest shares in renewable energy sources, at 0.26%, 1.08%, and 1.40%, respectively.
As we can see from Figure 2, Poland has great potential for the development of renewable energy sources, because its share of carriers is smaller than that of the EU. Only in solid and liquid biofuels does Poland have a bigger share in renewable energy sources compared to the EU. These differences are the effect of different energy sources in Poland compared to other countries in Europe. Poland has extensive forest resources, accounting for 31% of its total land. Agriculture also produces straw, which can be effectively used for energy purposes. Other countries in Europe, i.e., mainly Mediterranean countries, have better access to water and can produce more energy from onshore and offshore wind farms. Moreover, photovoltaics in many European Union countries are better developed than in Poland because of higher economic incentives and longer sunny days. The possibility of gathering energy from photovoltaics in Poland is rather limited; energy produced in this way is bought by the Polish national company ENERGA mostly in summer and autumn, when the days are longer.

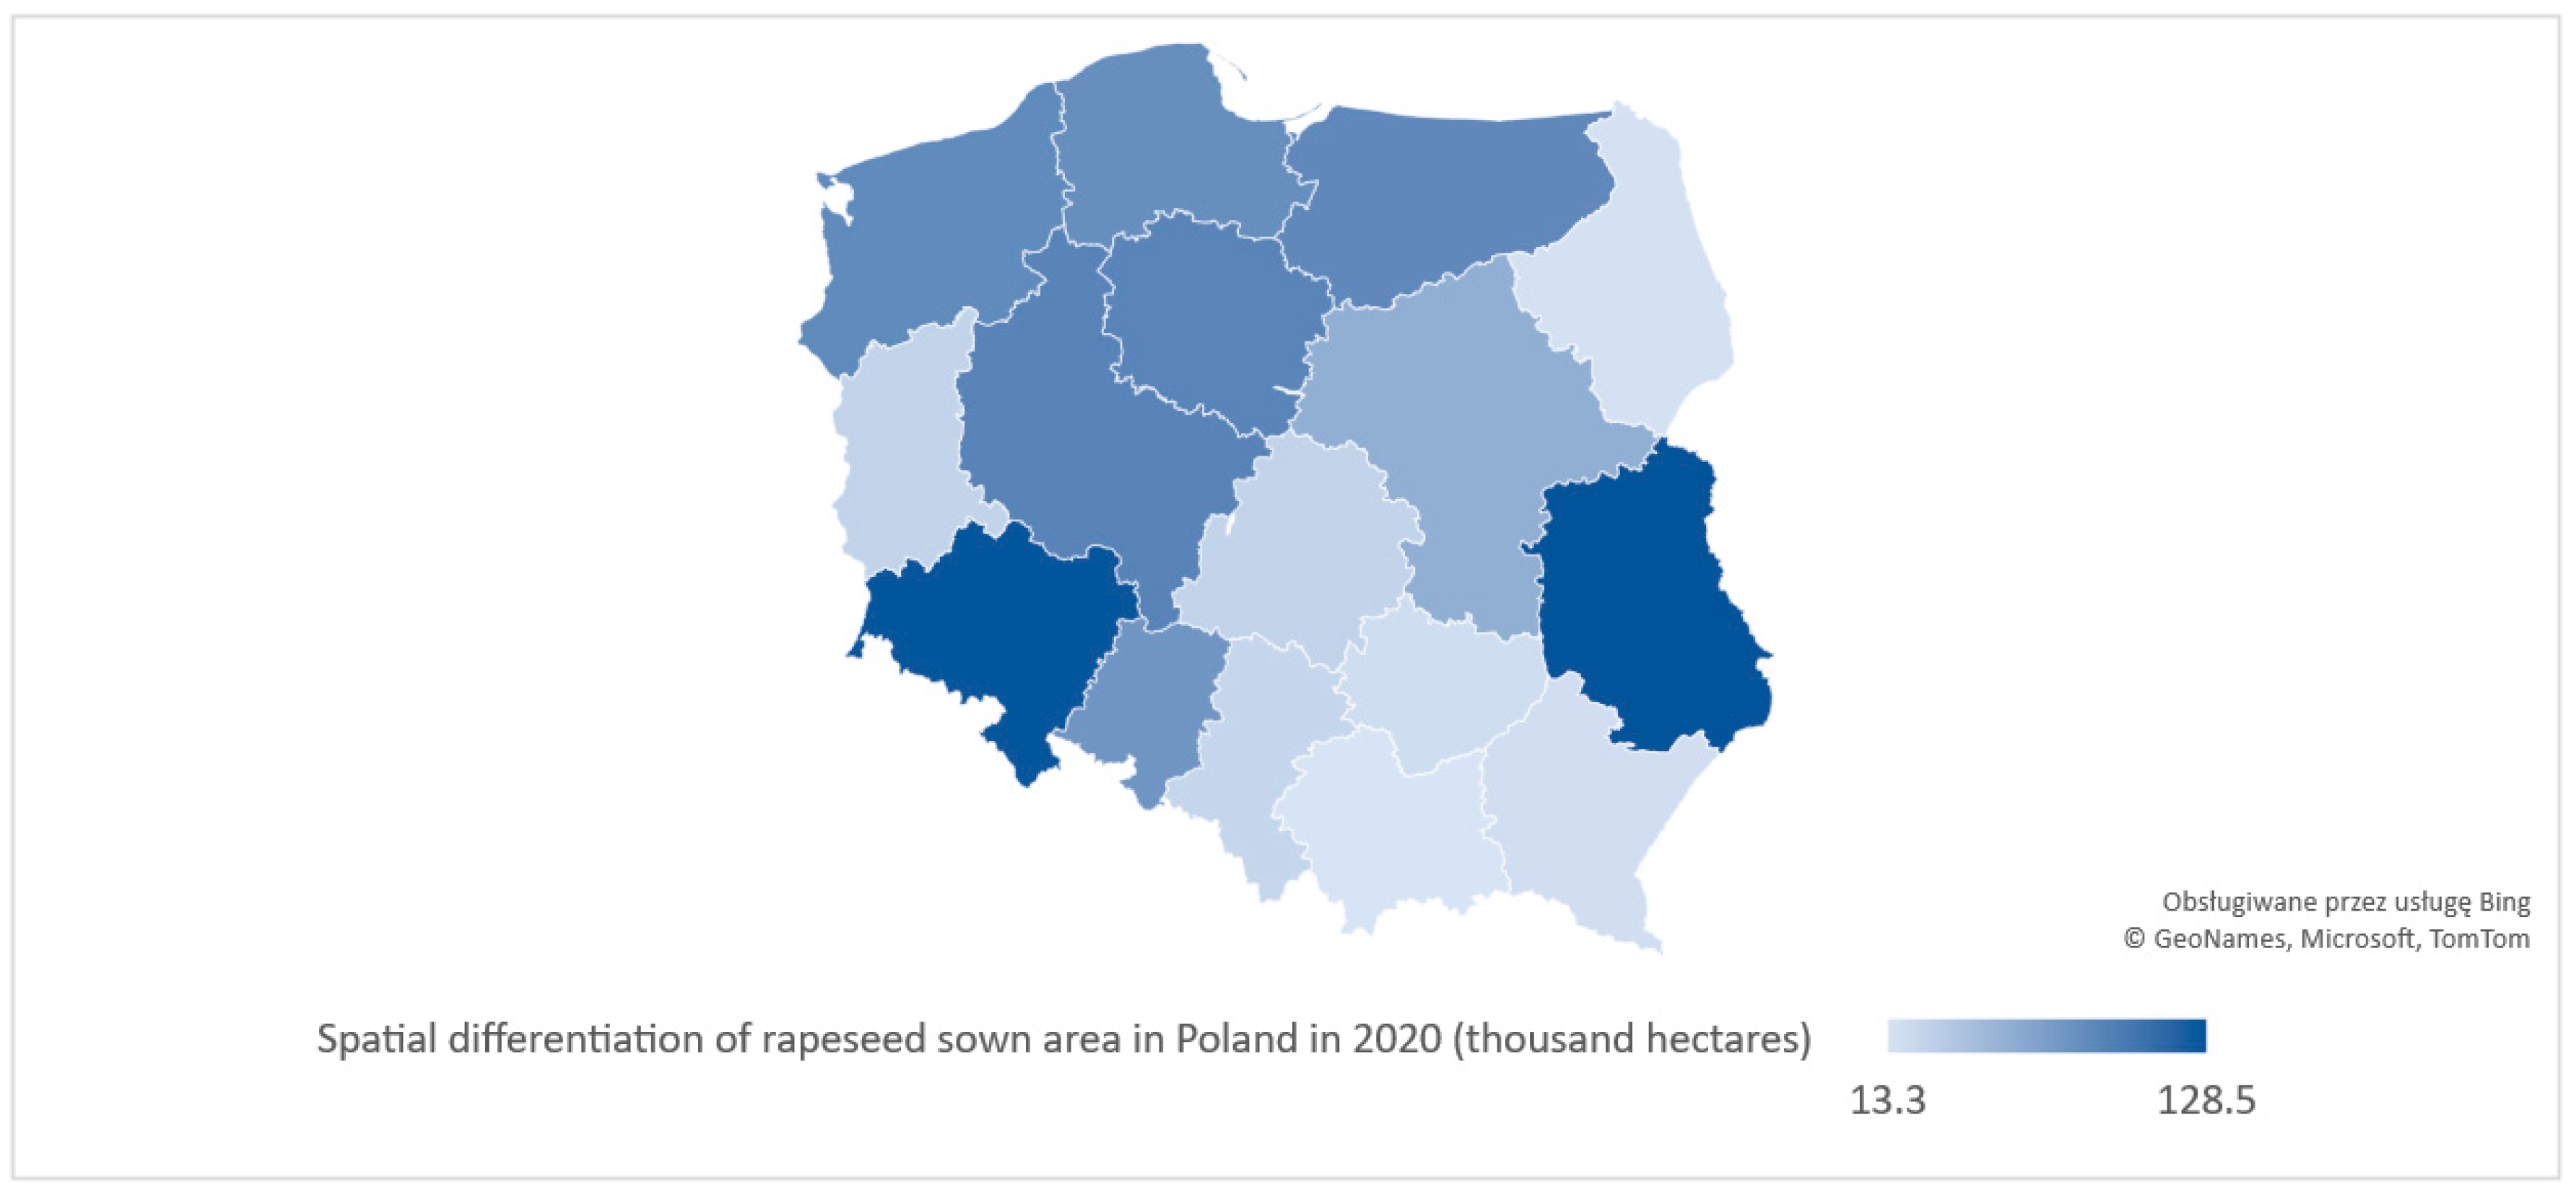
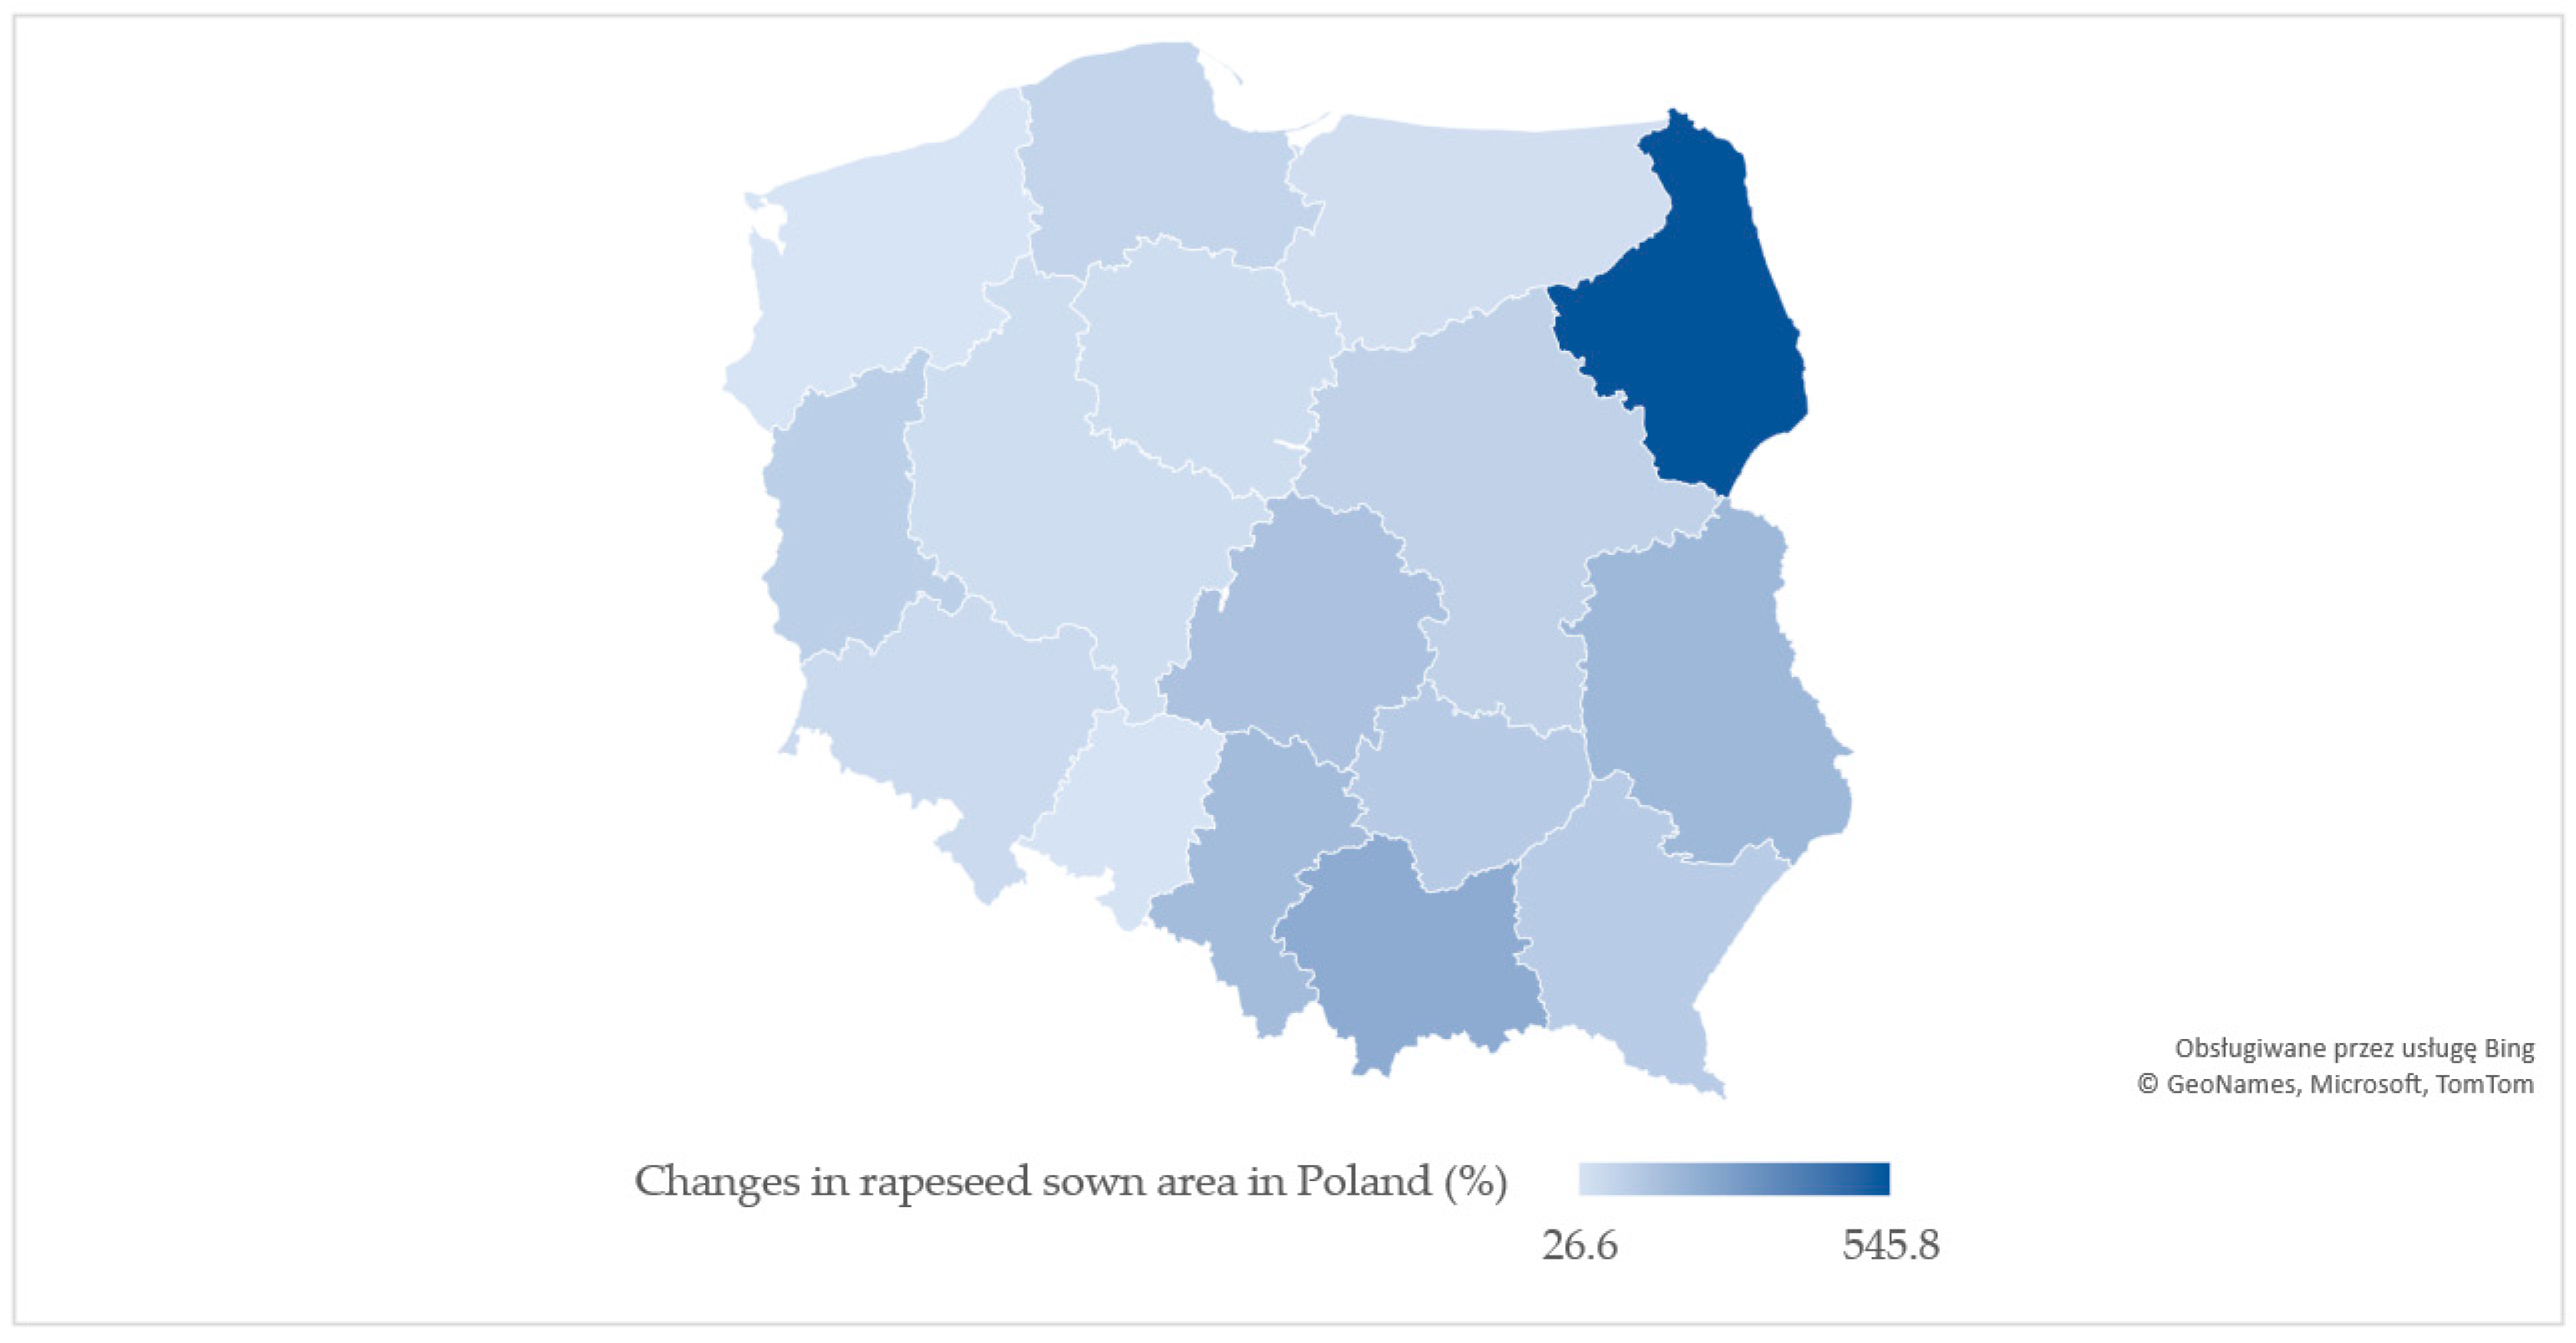
3.2. Rapeseed Production in Poland as the Main Source for Biodiesel

The sown area of rapeseed changed in Poland in 2005–2020. The biggest sown areas were in 2014 (951 thousand hectares), 2015 (947 thousand hectares), and 2010 (624 thousand hectares). The smallest sown areas were in 2005 (550 thousand hectares) and 2006 (624 thousand hectares). The changes of sown area were due to individual decisions of farmers and the effect of subsidies and increasing prices for rapeseed (Figure 3).
Poland achieved the highest yields of rapeseed in 2014 (34.4 dt/ha), 2020 (31.5 dt/ha) and 2009 (30.8 dt/ha). The smallest yields occurred in 2011 (22.4 dt/ha), 2010 (23.6 dt/ha), and 2012 (25.9 dt/ha). Yields of rapeseed are the effect of weather and the extent of usage of mineral fertilizers. Land quality is also important for yields, because rapeseed is a very demanding plant. Rapeseed yields are regionally diverse in Poland. The highest yields were achieved in Podkarpackie and Wielkopolskie voivodeship (33.6 dt/ha), Pomorskie voivodeship (33.4 dt/ha) and Kujawsko-pomorskie voivodeship (33.3 dt/ha) in 2020. In the same year, the lowest yields were observed in Świętkorzyskie voivodeship (27.4 dt/ha), Lubuskie voivodeship (28.5 dt/ha) and Lubelskie voivodeship (29.8 dt/ha).
The collection of rapeseed depends on sown area and yields. The biggest collections of rapeseed were in 2014 (3276 thousand tons) and 2015 (2700 thousand tons) and 2017 (272 thousand tons), when the sown area was above 910 thousand hectares. In 2020, the rapeseed sown area accounted for 980.9 thousand hectares, yields 31.9 dt/ha, and production 2400 thousand tons [42].
The production of rapeseed is regionally diverse. Germany, France, and Poland are considered to be the main producers, with these three countries being responsible for 52% of Europe’s rapeseed production. However, countries such as Romania, Czechia, Hungary, Denmark, and Slovakia are also substantial producers [53]. The European Union is the biggest producer of rapeseed, followed by Canada, China, India, Australia, and Ukraine [54].
In Poland, the biggest areas of rapeseed cultivation were Lubelskie voivodeship (128.5 thousand hectares), Dolnośląskie voivodeship (127 thousand hectares), and Wielkopolskie voivodeship (91 thousand hectares). The smallest sown areas in 2020 were Małopolskie voivodeship (13.3 thousand hectares), Świętokrzyskie voivodeship (18.6 thousand hectares), and Podlaskie voivodeship (18.3 thousand hectares). Such variation is the effect of the feasibility of plant production in Poland. West and north Poland have the best conditions for the development of rapeseed.
Rapeseed collection is based on sown area and yields. The highest collections were in 2020 in Dolnośląskie voivodeship (390.5 thousand tons), Lubelskie voivodeship (383.5 thousand tons), and Wielkopolskie Voivodeship (305.8 thousand tons). The smallest were in Małopolskie voivodeship (42.5 thousand tons), Świętokrzyskie voivodeship (50.8 thousand tonnes), and Podlaskie voivodeship (59.2 thousand tons).
The Renewable Energy Directive required the EU to derive at least 20% of its total energy from renewables by 2020. At least 10% of transport fuels came from renewable sources in 2020. Another Directive, i.e., (EU) 2015/51, or the so called “iLUC Directive”, set out a cap for the contribution of biofuels at 7% [56,57,58,59,60,61].
All voivodeships in Poland increased their share of sown area after accession to the EU. The biggest increases of rapeseed area occurred in Podlaskie voivodeship (546%), Małopolskie voivodeship (239.3%), and Śląskie voivodeship (174.6%). The smallest increases were in Zachodniopomorskie voivodeship (26.6%), Opolskie voivodeship (29.2%), and Warmińsko-mazurskie voivodeship (48%). This research proves that voivodeships with the smallest sown areas of rapeseed increased their sown areas the most, while those with the biggest sown area increased it the least (Figure 4).
Rapeseed production helps to achieve sustainability. This plant can improve soil fertility, serving as a good crop between corn harvests, as well as delivering oxygen (CO2) and organic material to the land. However, this plant requires further genetic diversity [53].

3.3. Scenarios for Rapeseed Production in Poland

One of the research aspects was the preparation of scenarios regarding the production of biodiesel and rapeseed in 2021–2025 in Poland, considering the forecasts of the OECD-FAO (Figure 5). Three scenarios were developed: an increase in production by 3% per year, a decrease by 3% per year, and no change in demand. To develop these scenarios, the following variables were applied: use of rapeseed for food purposes; use for the production of biodiesel; and losses. The assumptions were based on the generally available data of the Central Statistical Office (CSO) [42] for the years 2005–2020 and data on NCW (National Indicative Targets).
The scenarios for the years 2013–2020 were prepared by Boczar [62]. He assumed consumption of rapeseed for food purposes at a level of 800 thousand tons for the scenario assuming a decrease in demand, 1 million tons for the scenario assuming no change, and 1.2 million tons for the scenario assuming an increase in demand in 2013–2020. These assumptions are consistent with the data presented in the literature, which show that the consumption of rapeseed for food purposes amounted to 1.3 million tons in 2020 [63,64].
The forecast of changes in the developed scenarios covered a period of five years, which made it possible to capture upward or downward trends in rapeseed production.
Before developing the three scenarios, we analyzed the outlook presented in the OECD-FAO. As shown in Figure 4, both biodiesel and bioethanol production will decrease in EU and OECD countries in 2023–2027. Ethanol production will decrease by 1% and 0.5% in OECD and EU countries, respectively, from 2023–2027. Biodiesel production will decrease in OECD-FAO countries by 3.5%, and in the EU by 4%.
Rapeseed market analyses showed that since Poland’s accession to the EU, there have been upward trends in all variables; these formed the basis for the development of scenarios in this research (Table 2).
The first scenario assumes an increase in the demand for rapeseed of 3%. The basis of this analysis was data from 2020 (Table 2). Our scenarios are prepared for 2022–2025, so they are newer than those elaborated by Boczar [62]. Our scenarios also add additional variables, such as losses of rapeseed and crude edible and technical rapeseed oil. The global conditions in which the scenarios will be verified are completely different. This scenario considers an increase in the demand for rapeseed for food purposes by 1% and an increase in the demand for biodiesel of 3% per year. The need to increase the production of rapeseed and biodiesel will increase demand. This scenario is in opposition to the OECD-FAO’s prognosis for EU countries. Increasing the demand for rapeseed oil for energy purposes will necessitate the allocation of larger areas of land for its cultivation. In this day and age, given Ukraine’s war with the Russian Federation and the reduction of grain and oil production in Ukraine, this scenario seems unlikely. Although the increase in rapeseed and cereal prices will encourage farmers to increase production, it will also increase the cost of fuels. It is also unreasonable to expect an increase in imports from the East to Poland, given the situation in Ukraine. In the global biodiesel market, other factors will also be decisive, such as the sales of esters, crude oil prices, changes in GDP, inflation index, the USD/PLN exchange rate, the production and export of rapeseed oil, and the prices of agricultural raw materials [65].
The demand for rapeseed for food purposes will be stable in the analyzed period, accounting for around 1010 thousand tons. Such an evaluation assumes the stable consumption of edible oils in Poland.
This scenario is likely to occur in Poland. According to statistics in Poland, the sown area, yield, and collection of rapeseed as the main source for biodiesel production increased by 1% in 2021 compared to 2020 [42]. Taking into account even a smaller increase in area and rapeseed production at the level of 1% per year, this would require a much larger area for sowing.
The second scenario assumes no changes in the demand for rapeseed. Data from 2020 were used as the basis (Table 3) for this scenario. At the same time, no change in the use of turnips for food and non-food purposes was assumed. The total annual demand for rapeseed would amount to approximately 3450 thousand tons per year, of which 1010 thousand tons would be for food purposes and 2440 thousand tons for esters. This demand for rapeseed would be covered by domestic production on an area of approximately 950 thousand square meters, with a yield of 29 dt/ha and imports of about 500 thousand tons. Such a situation would cause some stabilization on the market, and the growing demand for rapeseed to produce biofuels could be supplemented with second and third generation biofuels. Such a scenario is related to the constant production of rapeseed, which means no change in the rapeseed cultivation area for existing producers, thereby hindering access to the market for new suppliers. Moreover, stabilization in production could limit the development of rapeseed processing in the country. This scenario will probably not occur for various reasons. First, it is impossible for production to be stable. Second, the conditions for agricultural production are very dynamic. The unstable situation in Ukraine will have an impact on food production worldwide. Third, EU policy for renewable energy sources will also have impact on the production of edible oil and biodiesel.
The third scenario assumes a reduction in the demand for rapeseed by 3% per annum (Table 4). The adoption of such a level resulted from the observed decrease in the production of crude rapeseed oil in 2018 compared to 2017 [42]. With a total demand for rapeseed in 2025 amounting to 2241 thousand tons and the harvest of 28 dt/ha, the cultivation area will be 714.3 thousand hectares. Such a situation would result in an increase in the acreage of cultivation. However, such an increase in sowing would be an unfavorable phenomenon for the natural environment [66]. A share of cereals in the structure of crops above 70% may result in the sterilization of the soil, greater occurrence of fungal diseases, and a reduction in yields. Moreover, the implementation of this scenario would result in a limited possibility of meeting the EU obligations and obtaining a 10% share of biofuels in the total fuel consumption. This scenario is like the prognosis of OECD-FAO. However, Poland is a rather agricultural country and higher prices will be an incentive for rapeseed producers to increase production.
There is a possibility that this scenario will not occur in the market. The conditions in the Polish rapeseed market are determined by the situation in the EU. The production of rapeseed in the EU in 2022 should increase significantly compared to that of 2021. Ukraine will produce about 3 million fewer tons in 2022 compared to 2021. This will create a shortage in the European and world rapeseed markets which will have to be compensated for by production in other countries.

4. Discussion

The production of renewable energy sources is increasing in the European Union as a result of environmental policies. Concerns about global warming and CO2 emissions, as well as the need to provide enough energy, have forced governments and policy-makers to look for renewable energy sources [4].
Poland has good sources for renewable energy production, i.e., biodiesel. In Poland, more than 50% of rapeseed production is dedicated to biodiesel. Such a situation proves that the potential for rapeseed and biodiesel production are high. Rapeseed still has potential for further development in Poland and the EU. Its production can be affected by better varieties and improved technology. However, the possibilities of increasing the sown area are limited.
Biodiesel is an old and well-known source of energy. It was developed by Rudolph Diesel in 1900 using peanut oil. Its application in compression ignition (CI) engines revolutionized the world [67]. Biodiesel is an important source of energy because it is helping to achieve energy security in Poland, Europe and other countries. However, its production depends on natural strategies which may change over time [5].
Biodiesel is mainly produced in west and north Poland. Such locations are due to the natural resources there. The share of liquid biofuels in Poland is bigger than in the EU. Poland is a rather agricultural country with good conditions for rapeseed production. Such a situation and unstable market conditions in Ukraine, which is an important producer of grains and oils, will encourage Polish producers to increase production. The shortage of rapeseed in the Ukrainian market in 2022 will have to be compensated for by production in other countries. This will result in greater hunger and will increase the migration of people, especially from the Middle East, who will move in search of food.

5. Conclusions

Improving energy security is a central element of sustainable development in the European Union (EU). Renewable energy sources are gaining attention worldwide because they are considered to be clean and environmentally friendly. The data and analysis presented in this study showed an increase in the use of liquid biofuels in the renewable energy sources mix in the EU. The development of renewable energy sources such as biofuels, biomass, photovoltaic, and wind can help achieve sustainable development. However, this development needs to be supported by stricter policies [2]. The sustainable development concept concerns not only the environment and the economy, but also the social, energy conservation, production, and consumption dimensions [67]. There are many kinds of biofuels, among which biodiesel and bioethanol are the most important [68,69,70].
Our research proved that Poland is an important producer of rapeseed and biodiesels which are the first generation of biofuels. Such a situation is a consequence of good conditions for rapeseed production, particularly in west and north Poland, where the biggest farms are located. Poland has increased the sown area and yields of rapeseed. Production technology has improved as a result of new machinery implementation and new varieties of rapeseed being used.
Our research demonstrates the development of rapeseed production in Poland as the main source of first-generation biodiesel. After Polish accession to the EU, the rapeseed sown area increased from 550 thousand hectares to 900 thousand hectares. Moreover, the harvest of rapeseed increased from 1632 thousand tons to 3124.8 thousand tons.
It is difficult to predict the situation in the rapeseed market and the production of biodiesel in Poland and other EU countries. Ukraine’s war with the Russian Federation will have a negative impact on the production of sunflower oil and rapeseed oil. This will encourage farmers in Poland and other countries of the EU to increase production, confirming the first scenario. As such, the situation in Poland will probably resemble the first scenario, i.e., with a 3% increase in rapeseed and biodiesel production each year. This may occur because the war in Ukraine will shorten the supply of grains and oils due to production and supply chain delivery problems. The increasing demand for rapeseed in Poland will have an impact on prices. This will cause good conditions for producers, on one hand encouraging them to increase production and, on the other, increasing the prices of edible oils and biodiesel.
According to an OECD-FAO prognosis, the production of biodiesel will decrease by 4% in the next years. Global trends will be supported by scenario three, i.e., the reduction of biodiesel and rapeseed production. However, Poland will not probably follow this trend. It is worth mentioning that the prognosis was elaborated before the war in Ukraine, and it is impossible to predict the situation in the future because it is changing.
Our research confirms hypothesis 1 (H1), according to which biodiesel production in the EU is strongly correlated with rapeseed production. Most biodiesel is classified as first generation. Second, third, and fourth generation biofuels are in the early stages of introduction into the market.
The second hypothesis 2 (H2), i.e., that liquid biofuels cause competition between the nutrition, fodder, and petrochemical industries, was also positively verified. A lack of rapeseed in the market causes an increase in its prices. Moreover, the war is leading to increased prices, causing global problems.

Author Contributions

Conceptualization, P.B.; methodology, P.B.; software, P.B.; validation, P.B.; formal analysis, P.B.; investigation, P.B.; resources, P.B.; data curation, P.B., writing—original draft preparation, P.B., L.H., M.B.B. and B.M.; writing—review and editing P.B., L.H., M.B.B. and B.M.; visualization, P.B.; supervision, P.B.; project administration, P.B., funding acquisition, P.B. All authors have read and agreed to the published version of the manuscript.

Funding

The results presented in this paper were obtained as part of a comprehensive study financed by the University of Warmia and Mazury in Olsztyn, Faculty of Agriculture and Forestry, Department of Agrotechnology and Agribusiness grant number 30.610.012-110. Project financially supported by the Minister of Education and Science under the program entitled “Regional Initiative of Excellence” for the years 2019–2022, Project No. 010/RID/2018/19, amount of funding 12.000.000 PLN.

Institutional Review Board Statement

Not applicable.

Informed Consent Statement

Not applicable.

Data Availability Statement

Not applicable.

Conflicts of Interest

The authors declare no conflict of interest.

Nomenclature

CAPCommon Agricultural Policy
CICompression ignition
CO2carbon dioxide
CSOCentral Statistical Office
Dt/ha100 kg per hectare
EUEuropean Union
FAOSTATUnited Nations Statistics Division of the Food and Agriculture Organization
GDPGross Domestic Product
GHGgreenhouse gasses
NCWNational Indicative Targets
OECD-FAOFood and Agriculture Organization of the United Nations
PLNPolish currency
PVphotovoltaics
RESRenewable energy sources
USUnited States
USDUnited State Dollar
WPwind power

References

  1. Kan, A.; Zeng, Y.; Meng, X.; Wang, D.; Xina, J.; Yang, X.; Tesren, L. The linkage between renewable energy potential and sustainable development: Understanding solar energy variability and photovoltaic power potential in Tibet, China. Sustain. Energy Technol. Assess. 2021, 48, 101551. [Google Scholar] [CrossRef]
  2. Pillot, B.; Muselli, M.; Poggi, P.; Dias, J.B. Historical trends in global energy policy and renewable power system issues in Sub-Saharan Africa: The case of solar PV. Energy Policy 2019, 127, 113–124. [Google Scholar] [CrossRef]
  3. Van Duren, I.; Voinov, A.; Arodudu, O.; Firrisa, M.T. Where to produce rapeseed biodiesel and why? Mapping European rapeseed energy efficiency. Renew. Energy 2015, 74, 49–59. [Google Scholar] [CrossRef] [Green Version]
  4. Bastida-Molina, P.; Hurtado-Pérez, E.; Moros Gómez, M.C.; Cárcel-Carrasco, J.; Pérez-Navarro, Á. Energy sustainability evolution in the Mediterranean countries and synergies a global energy scenario for the area. Energy 2022, 252, 124067. [Google Scholar] [CrossRef]
  5. De Rosa, M.; Gainsford, K.; Pollaretto, F.; Finn, D.P. Diversification, concentration and renewability of the energy supply in the European Union. Energy 2022, 253, 124097. [Google Scholar] [CrossRef]
  6. Zhou, Y.; Pan, M.; Urban, F. Comparing the international knowledge flow of China’s wind and solar photovoltaic (PV) industries: Patent analysis and implications for sustainable development. Sustainability 2018, 10, 1883. [Google Scholar] [CrossRef] [Green Version]
  7. Mala, K.; Schläpfer, A.; Pryor, T. Better or worse? The role of solar photovoltaic (PV) systems in sustainable development: Case studies of remote atoll communities in Kiribati. Renew. Energy 2009, 34, 358–361. [Google Scholar] [CrossRef]
  8. Buitenhuis, A.J.; Pearce, J.M. Open-source development of solar photovoltaic technology. Energy Sustain. Dev. 2012, 16, 379–388. [Google Scholar] [CrossRef] [Green Version]
  9. Blok, K. Enhanced policies for the improvement of electricity efficiencies. Energy Policy 2005, 33, 1635–1641. [Google Scholar] [CrossRef]
  10. Lund, H. Implementation of energy-conservation policies: The case of electric heating conversion in Denmark. Appl. Energy 1999, 64, 117–127. [Google Scholar] [CrossRef]
  11. Lior, N. Advanced energy conversion to power. Energy Convers. Manag. 1997, 38, 941–955. [Google Scholar] [CrossRef]
  12. Lior, N. Thoughts about future power generation systems and the role of exergy analysis in their development. Energy Convers. Manag. 2002, 43, 1187–1198. [Google Scholar] [CrossRef]
  13. Afgan, N.H.; Carvalho, M.G. Multi-criteria assessment of new and renewable energy power plants. Energy 2002, 27, 739–755. [Google Scholar] [CrossRef]
  14. Afgan, N.H.; Carvalho, M.G. Sustainability assessment of hydrogen energy systems. Int. J. Hydrogen Energy 2004, 29, 1327–1342. [Google Scholar] [CrossRef]
  15. Lund, H. Renewable energy strategies for sustainable development. Energy 2007, 32, 912–919. [Google Scholar] [CrossRef] [Green Version]
  16. Kupczyk, A. Stan obecny i perspektywy wykorzystania biopaliw transportowych w Polsce na tle UE. Część II. Wybrane aspekty zasobowe, techniczno-technologiczne i ekonomiczne. Energetyka i Ekol. 2007, 6–7, 131–137. [Google Scholar]
  17. Heydari, A.; Askarzadeh, A. Optimization of a biomass-based photovoltaic power plant for an off-grid application subject to loss of power supply probability concept. Appl. Energy 2016, 165, 601–611. [Google Scholar] [CrossRef]
  18. Wójcik-Czerniawska, A. Perspektywy rozwoju sektora biopaliw. Zesz. Nauk. Politech. Częstochowskiej Zarządzanie 2015, 18, 138–146. [Google Scholar]
  19. Kupczyk, A.; Mączyńska, J.; Sikora, M.; Tucki, K.; Żelaziński, T. Stan i perspektywy oraz uwarunkowania prawne funkcjonowania sektorów biopaliw transportowych w Polsce. Rocz. Nauk. Ekon. Rol. Rozw. Obsz. Wiej. 2017, 104, 39–55. [Google Scholar] [CrossRef] [Green Version]
  20. Mauleón, I. Phtovoltaic investment roadmaps and sustainable development. J. Clean. Prod. 2017, 167, 1112–1121. [Google Scholar] [CrossRef]
  21. Alizadeh, R.; Lund, P.D.; Soltanisehat, L. Outlook on biofuels in future studies: A systematic literature review. Renew. Sustain. Energy Rev. 2020, 134, 110326. [Google Scholar] [CrossRef]
  22. Masjuki, H.H.; Kalam, M.A.; Mofijur, M.; Shahabuddin, M. Biofuel: Policy, standardization and recommendation for syustainable future energy supply. Energy Procedia 2013, 42, 577–586. [Google Scholar] [CrossRef] [Green Version]
  23. Brunet, C.; Savadogo, O.; Baptiste, P.; Bouchard, M.A.; Rakotoary, J.C.; Ravoninjatovo, A.; Cholez, C.; Gendron, C.; Merveille, N. Impacts generated by a large-scale solar photovoltaic power plant can lead to conflicts between sustainable development goals: A review of key lessons learned in Madagaskar. Sustainability 2020, 12, 7471. [Google Scholar] [CrossRef]
  24. Czyżewski, B.; Matuszczak, A.; Grzelak, A.; Guth, M.; Majchrzak, A. Environmental sustainable value in agriculture revisited: How does Common Agricultural Policy contribute to eco-efficiency? Sustain. Sci. 2021, 16, 137–152. [Google Scholar] [CrossRef]
  25. Czyżewski, B.; Guth, M. Impact of policy and factor intensity on sustainable value of European Agriculture: Exploring trade-offs of environmental, economic and social efficiency at the regional level. Agriculture 2021, 11, 78. [Google Scholar] [CrossRef]
  26. Czyżewski, B.; Majchrzak, A. Market versus agriculture in Poland-macroeconomic relations of income, prices and productivity in terms of the sustainable development paradigm. Technol. Econ. Dev. Econ. 2018, 24, 318–334. [Google Scholar] [CrossRef] [Green Version]
  27. Borychowski, M.; Sapa, A.; Czyżewski, B.; Stępień, S.; Poczta-Wajda, A. Interactions between food and nutrition security and the socio-economic and environmental dimensions of sustainability in small-scale farms: Evidence from a simultaneous confirmatory factor analysis in Poland. Int. J. Agric. Sustain. 2022. [Google Scholar] [CrossRef]
  28. Guaita-Prasas, I.; Marques-Perez, I.; Gallego, A.; Segura, B. Analyzing territory for sustainable development of solar photovoltaic power using GIS databases. Environ. Monit. Assess. 2019, 191, 764. [Google Scholar] [CrossRef] [Green Version]
  29. Biernat, K. Perspektywy rozwoju biopaliw. Paliwa 2013, 4, 56–59. [Google Scholar]
  30. Januan, J.; Ellis, N. Perspectives on biodiesel as a sustainable fuel. Renew. Sustain. Energy Rev. 2010, 14, 1312–1320. [Google Scholar] [CrossRef]
  31. Lin, L.; Zhou, C.; Vittayapadung, S.; Shen, X.; Dong, M. Opportunities and challenges for biodiesel fuel. Appl. Energy 2011, 88, 1020–1031. [Google Scholar] [CrossRef]
  32. Kligerman, D.C.; Bouwer, E.J. Prospects for biodiesel production from algae-based wastewater treatment in Brazil: A review. Renew. Sustain. Energy Rav. 2015, 52, 1834–1846. [Google Scholar] [CrossRef]
  33. Kupczyk, A. Stan obecny i perspektywy wykorzystania biopaliw transportowych w Polsce na tle UE. Część IV. Aktualne uwarunkowania i wykorzystanie biopaliw transportowych w Polsce. Biopaliwa II generacji. Energetyka Ekol. 2008, 6–7, 149–153. [Google Scholar]
  34. Kachel-Jakubowska, M.; Szpryngiel, M. Analiza perspektyw wytwarzania bipaliw płynnych w Polsce. Inżynieria Rol. 2009, 8, 47–53. [Google Scholar]
  35. Piasecka, I.; Tomporowski, A. Analysis of Environmental and Energetical and Energetic Possibilities of Sustainable Development of wind and Photovoltaic Power Plants. Probl. Ekorozw. Probl. Sustain. Dev. 2018, 13, 125–130. [Google Scholar]
  36. Bockey, D. The significance and perspectives of biodiesel production—And European and global review. Oilseed Fats Crops Liq. 2019, 26, 40. [Google Scholar] [CrossRef]
  37. European Commission. A European Green Deal. Available online: https://ec.europa.eu/info/strategy/priorities-2019-2024/european-green-deal_ (accessed on 1 January 2021).
  38. European Commission. The European Commission’s Priorities. Available online: https://ec.europa.eu/info/sites/default/files/Brexitfiles/info_site/energy_origin_en.pdf (accessed on 1 January 2021).
  39. European Commission. Investing in a Climate-Neutral and Circular Economy: The European Green Deal; European Union: Brussels, Belgium, 2020. [Google Scholar]
  40. Wang, W.H.; Moreno-Casas, V.; Huerta de Soto, J. A Free-Market Environmentalist Transition toward Renewable Energy: The Cases of Germany, Denmark, and the United Kingdom. Energies 2021, 14, 4659. [Google Scholar] [CrossRef]
  41. Hanna, M.A.; Islam, L.; Campbell, J. Biodiesel: Current perspectives and future. J. Sci. Ind. Res. 2005, 64, 854–857. [Google Scholar]
  42. Rosiak, E. Rynek Rzepaku stan i Perspektywy Rapeseed Market—State and Perspectives; Instytut Ekonomiki Rolnictwa i Gospodarski Żywnościowej-Państwowy Instytut Badawczy w Warszawie: Warsaw, Poland, 2021. [Google Scholar]
  43. Gierszewska, G.; Romanowska, M. Analiza Strategiczna Przedsiębiorstwa; Polskie Wydawnictwo Ekonomiczne: Warsaw, Poland, 2017. [Google Scholar]
  44. Penc, J. Encyklopedia Zarządzania. Podstawowe Kategorie i Terminy; Wyższa Szkoła Studiów Międzynarodowych w Łodzi: Lodz, Poland, 2008. [Google Scholar]
  45. Dickey, D.A.; Fuller, W.A. Distribution of the Estimators for Autoregressive Time Series with a Unit Root. J. Am. Stat. Assoc. 1979, 74, 427–431. [Google Scholar]
  46. Fattah, J.; Ezzine, L.; Aman, Z.; Moussami, H.E.; Lachhab, A. Forecasting of demand using ARiMA model. Int. J. Eng. Bus. Manag. 2018, 10, 1–9. [Google Scholar] [CrossRef] [Green Version]
  47. Boountome, P.; Therdyothin, A.; Chontanawat, J. Investing the casual relationship between non-renewable and renewable energy consumption, CO2 emissions and economic growth in Thailand. Energy Procedia 2017, 138, 925–930. [Google Scholar] [CrossRef]
  48. Ozturk, S.; Ozturk, F. Forecasting energy consumption of Turkey by ARIMA model. J. Asian Sci. Res. 2018, 8, 52–60. [Google Scholar] [CrossRef] [Green Version]
  49. Jamil, R. Hydroelectricity consumption forecast for Pakistan using ARIMA modeling and supply-demand analysis for the year 2030. Renew. Energy 2020, 154, 1–10. [Google Scholar] [CrossRef]
  50. Koutroumanidis, T.; Ioannou, K.; Arabatzis, G. Predicting fuelwood prices in Greece with the use of ARIMA models, artificial natural networks and a hybrid ARIMA-ANN model. Energy Policy 2009, 37, 3627–3634. [Google Scholar] [CrossRef]
  51. Singh, A.S.N.; Mohapatra, A. Repeated wavelet transform based ARIMA model for very short-term wind speed forecasting. Renew. Energy 2019, 136, 758–768. [Google Scholar] [CrossRef]
  52. Hajjari, M.; Tabatabaei, M.; Aghbashlo, M.; Ghanavati, M. A review on the prospects of sustainable biodiesel production: A global scenario with emphasis on waste-oil biodiesel utilization. Renew. Sustain. Energy Rev. 2017, 72, 445–464. [Google Scholar] [CrossRef]
  53. Woźniak, E.; Wachowska, E.; Zimny, T.; Sowa, S.; Twardowski, T. The rapeseed potential in Poland and Germany in the context of production, legislation, and intellectual property rights. Front. Plant Sci. 2019, 10, 1423. [Google Scholar] [CrossRef] [Green Version]
  54. FAOSTAT 2018. OECD-FAO Agricultural Outlook 2018–2027: BIOFUEL—OECD-FAO Agricultural Outlook 2018–2027. Available online: https://stats.oecd.org/Index.aspx?DataSetCode=HIGH_AGLINK_2018 (accessed on 1 January 2020).
  55. GUS—Energia ze źródeł odnawialnych w 2020 r. Available online: https://stat.gov.pl/obszary-tematyczne/srodowisko-energia/energia/energia-ze-zrodel-odnawialnych-w-2020-roku,3,15.html (accessed on 1 January 2020).
  56. Iriarte, A.; Rieradevall, J.; Gabarrell, X. Life cycle assessment of sunflower and rapeseed as energy crops under Chilean conditions. J. Clean. Prod. 2010, 18, 336–345. [Google Scholar] [CrossRef]
  57. Schmidt, J.H. Life Cycle Assessment of Rapeseed Oil and Palm Oil. Part 3: Life Cycle Inventory of Rapeseed Oil and Palm Oil. Ph.D. Thesis, Aalborg University, Aalborg, Denmark, 2007. [Google Scholar]
  58. Queirós, J.; Malça, J.; Freire, F. Environmental life-cycle assessment of rapeseed produced in Central Europe: Addressing alternative fertilization and management practices. J. Clean. Prod. 2015, 99, 266–274. [Google Scholar] [CrossRef]
  59. Katanenko, S.; (Uzvara lauks Ltd., Bauska Municipality, Latvia). Personal communication, 2017.
  60. Nemecek, T.; Kagi, T. Life Cycle Inventories of Swiss and European Agricultural Production Systems; Final Report Ecoinvent; V.2.0 No. 15a; Ecoinvent Centre: Zurich, Switzerland, 2007; p. 360. [Google Scholar]
  61. Malça, J.; Coelho, A.; Freire, F. Environmental life-cycle assessment of rapeseed-based biodiesel: Alternative cultivation systems and locations. Appl. Energy 2014, 114, 837–844. [Google Scholar] [CrossRef]
  62. Boczar, P. Możliwości Produkcji Rzepaku w Polsce i Zmiany Kierunków Jego Wykorzystania; Wyd. Uniwersytetu Przyrodniczego w Poznaniu: Poznań, Poland, 2014. [Google Scholar]
  63. Kuś, J.; Krasowicz, S.; Igras, J. Przewidywane kierunki zmian w produkcji rolniczej w Polsce. Studia I Rap. IUNG-PIB 2009, 17, 73–92. [Google Scholar]
  64. Rosiak, E. Rynek rzepaku w Polsce na świecie w sezonie 2011/2012; Wieś Jutra: Warsaw, Poland, 2011; pp. 39–42. [Google Scholar]
  65. Borychowski, M.; Czyżewski, B. Rozwój Sektora Biopaliw Ciekłych w Polsce i Niemczech. Determinanty Ekonomiczne i Uwarunkowania Instytucjonalne; PWN Warszawa: Warsaw, Poland, 2017. [Google Scholar]
  66. Gradziuk, P. Możliwości i Bariery Rozwoju Zaawansowanych Biopaliw w Polsce; Polski Klub Ekologiczny: Warsaw, Poland, 2017. [Google Scholar]
  67. Sharma, Y.C.; Singh, B. Development of biodiesel, current scenario. Renew. Sustain. Energy Rev. 2009, 13, 1646–1651. [Google Scholar] [CrossRef]
  68. Chel, A.; Kaushik, G. Renewable energy technologies for sustainable development of energy efficient building. Alex. Eng. J. 2018, 57, 655–669. [Google Scholar] [CrossRef]
  69. Biernat, K. Perspektywy rozwoju technologii biopaliwowych w świecie do 2050 roku. Chemik 2012, 33, 1178–1189. [Google Scholar]
  70. Fridrihsone, A.; Romagnoli, F.; Cabulis, U. Environmental Life Cycle assessment of rapeseed and rapeseed oil produced in northern Europe: A Latvian case study. Sustainability 2020, 12, 5699. [Google Scholar] [CrossRef]
Figure 1. Sown area, yields, and collection of rapeseed in Poland. Source: own elaborations based on the rapeseed market [42].
Energies 15 04332 g001
Figure 2. Obtaining energy from renewable sources in the EU-28 and Poland. Source: GUS—Energia ze źródeł odnawialnych w 2020 [55].
Energies 15 04332 g002
Figure 3. Spatial differences of rapeseed sown area in Poland in 2020 (in thousands of hectares). Source: own elaborations based on the rapeseed market [42].
Energies 15 04332 g003
Figure 4. Changes in rapeseed production in Poland in 2005–2020 (%). Source: own elaborations based on rapeseed market [42].
Energies 15 04332 g004
Figure 5. Biodiesel and ethanol production and outlook. Source: FAOSTAT 2018. OECD-FAO Agricultural Outlook 2018–2027: BIOFUEL—OECD-FAO Agricultural Outlook 2018–2027. https://stats.oecd.org/Index.aspx?DataSetCode=HIGH_AGLINK_2018 (accessed on 10 June 2021) [54].
Energies 15 04332 g005
Table 1. The share of individual renewable energy sources in Poland in 2007–2019 (%).
Specification2007200820092010201120122013201420152016201720182019
Solid biofuels91.187.485.785.085.282.479.876.174.270.667.868.165.56
Solar energy0.00.020.10.10.20.20.30.40.50.70.70.91.40
Water energy3.43.43.33.62.72.12.42.31.72.02.41.91.78
Wind energy0.91.11.52.03.74.86.08.110.511.914.012.213.72
Biogas1.31.71.61.61.82.02.12.52.52.83.03.23.15
Liquid biofuels2.35.47.06.65.88.08.19.19.110.110.010.010.36
Geothermal energy0.20.230.240.20.20.170.220.250.240.240.250.30.26
Municipal waste0.00.000.010.040.40.40.390.450.450.851.011.11.08
Heat pumps-0.270.300.310.300.310.440.550.550.580.622.42.69
Source: own elaborations based on [54].
Table 2. Assumptions for the scenario of an increase in demand for rapeseed by 3% annually.
YearsNCW (%)Diesel Oil Consumption (in Thousands of Tons)Demand for Esters (in Thousands of Tons)Rapeseed Demand for Energy Purposes (in Thousands of Tons)Processing (in Thousands of Tons)Crude Edible and Technical Rapeseed Oil (Thousands of Tons)Food Purpose (Thousands of Tons)Losses
(in Thousands of Tons)
Total Demand for Rapeseed (in Thousands of Tons)
20228.516,19211142513320513061010983523
20238.516,677114825883302134510101013598
20248.517,178118226663401138610101043676
20258.517,693121827463503142710101073756
Source: own elaboration based on [42].
Table 3. Assumptions for the scenario of no change in the demand for rape.
YearsNCW (%)Diesel Oil Consumption (in Thousands of Tons)Demand for Esters (in Thousands of Tons)Rapeseed Demand for Energy Purposes (in Thousands of Tons)Processing (in Thousands of Tons)Crude Edible and Technical Rapeseed Oil (Thousands of Tons)Food Purpose (Thousands of Tons)Losses
(in Thousands of Tons)
Total Demand for Rapeseed (Thousands of Tons)
20228.515,72010822440311212681010953450
20238.515,72010822440311212681010953450
20248.515,72010822440311212681010953450
20258.515,72010822440311212681010953450
Source: own elaboration based on [42].
Table 4. Assumptions for the scenario of a 3% decrease in demand for rapeseed.
YearsNCW (%)Diesel Oil Consumption (in Thousands of Tons)Demand for Esters (in Thousands of Tons)Rapeseed Demand for Energy Purposes (in Thousands of Tons)Processing (in Thousands of Tons)Crude Edible and Technical Rapeseed Oil (Thousands of Tons)Food Purposes (Thousands of Tons)Losses
(in Thousands of Tons)
Total Demand for Rapeseed (Thousands of Tons)
20228.515,248104923673018123097892.22459.2
20238.514,791101822962928119395089.42385.4
20248.514,34798822272840115792286.72314.0
20258.513,91795821602755112389484.12244.1
Source: calculations based on [42].
Publisher’s Note: MDPI stays neutral with regard to jurisdictional claims in published maps and institutional affiliations.

