Article

Using Virtual Choreographies to Identify Office Users’ Behaviors to Target Behavior Change Based on Their Potential to Impact Energy Consumption

1
Institute for Systems and Computing Engineering, Tecnology and Science (INESC TEC), Campus da Faculdade de Engenharia da Universidade do Porto, Rua Dr. Roberto Frias, 4200-465 Porto, Portugal
2
Faculdade de Engenharia, Universidade do Porto (FEUP), 4200-465 Porto, Portugal
3
Department of Science and Technology, Universidade Aberta, 1250-100 Lisboa, Portugal
4
School of Science and Technology, Universidade de Trás-os-Montes e Alto Douro (UTAD), 5000-801 Vila Real, Portugal
5
Vestas Wind Systems, 4465-671 Porto, Portugal
*
Author to whom correspondence should be addressed.
Energies 2022, 15(12), 4354; https://doi.org/10.3390/en15124354
Submission received: 26 April 2022 / Revised: 9 June 2022 / Accepted: 10 June 2022 / Published: 14 June 2022
(This article belongs to the Special Issue Energy Efficiency and Behavioral Change through ICT)

Abstract

:
Reducing office buildings’ energy consumption can contribute significantly towards carbon reduction commitments since it represents ∼40% of total energy consumption. Major components of this are lighting, electrical equipment, heating, and central cooling systems. Solid evidence demonstrates that individual occupants’ behaviors impact these energy consumption components. In this work, we propose the methodology of using virtual choreographies to identify and prioritize behavior-change interventions for office users based on the potential impact of specific behaviors on energy consumption. We studied the energy-related office behaviors of individuals by combining three sources of data: direct observations, electricity meters, and computer logs. Data show that there are behaviors with significant consumption impact but with little potential for behavioral change, while other behaviors have substantial potential for lowering energy consumption via behavioral change.

1. Introduction

Decreasing carbon emissions has been one of the most recent global struggles, and reducing energy consumption in buildings has been a widely researched and worked upon topic [1] because it represents approximately 40% of total energy consumption [2]. Aiming at sustainability, a case study conducted in the UK [3] indicates that the way forward is to implement automation systems, but where this is not possible, improving users’ individual behavior will remain the next best approach.
Individual user behaviors and choices may influence consumption patterns. For instance, in the United States alone, those behaviors are responsible for 30 to 40% of the total annual CO2 emissions [4]. Occupants’ behaviors are a significant factor influencing the relevant discrepancies between buildings with the same climate location and functionalities [5]. In a typical office building, lights consume 40% of total energy, heating and central cooling systems around 25%, and the rest is from computers, printers and other electrical equipment (35%) [6].
Several authors [7,8,9] state that office building users’ behaviors are the most relevant aspect that influences energy consumption. Sometimes office users leave their computers turned on needlessly (e.g., on lunch breaks, on weekends, and during night periods). These behaviors increase electricity bills and are difficult to change with automation systems, demonstrating their energy inefficiency [10].
In this paper, we propose a methodology to identify user behaviors for potential behavior-change interventions. Sets of behaviors, interactions, and associated events that occur in a given time and space, with well-defined objectives and rules, can be defined as virtual choreographies [11]. This concept sees such virtual representations as being independent from the platform on which they are recorded and later analyzed or replayed. It emerged from efforts at analysis of multi-user behaviors in virtual training scenarios where users interact with the environment collaboratively [12].
Therefore, considering the role of individual behaviors in energy consumption, this work proposes as a methodology employing virtual choreographies to identify behaviors and prioritizing them for behavior-change interventions. The prioritization is based on two factors: the impact of each choreography on energy consumption, and its potential for behavioral change.
Identifying behaviors is a challenge because, for example, the same action in different contexts may actually represent different behaviors. Moreover, an action may depend not only on its overall context but on its place in a sequence of actions. On the other hand, even if all the behaviors are known, it is likely that not all of them can be modified because that could imply generating multiple and even potentially contradictory incentives.
For instance, if, with the aim of saving energy, one is encouraged to turn off the computer when going to the bathroom, this is contradictory with maintaining productivity at work, because when returning from the bathroom it is necessary to wait for the computer to turn on again. This may be deemed unfeasible for such a short absence and possibly lead to little energy savings. In other words, to achieve effectiveness it is relevant to consider the relationship between efficiency and context.
We demonstrate the method by showing how we identified relevant virtual choreographies related to office building energy consumption, and how we analyzed them according to two factors: energy consumption impact and potential for behavioral change. The results revealed which choreographies should be prioritized as targets for behavior change. This demonstrates the method’s relevance for application in wider contexts.
This paper is structured as follows: we present the literature on the role of individual behavior in energy consumption in office buildings, and on the representation of virtual choreographies. We then describe how behaviors were identified as choreographies and how each was assessed regarding energy consumption and behavior change potential. Then we discuss these results and conclusions alongside present limitations and future work suggestions.

2. Background

According to the objectives presented in the introduction, we will now look at the state of the art regarding the role played by individual behaviors in energy consumption. We will also look at how human behaviors can be represented, concluding with the theoretical approach regarding virtual choreographies.

2.1. Role of Individual Behaviors in Energy Consumption

Reducing the energy consumption in buildings is a critical component of carbon reduction commitments and has become a growing relevant area of work and research [1]. Buildings represent approximately 40% of the total energy consumption [13]. According to the Buildings Performance Institute Europe report of 2011 [14], office buildings alone account for 26% of the total energy consumption within the building sector.
Studies on low carbon emissions [3] recommend transitioning towards greener business practices and improving automation systems, not forgetting individual behaviors. The behaviors and choices of individual users may influence the consumption patterns, and those individual behaviors are responsible for 30 to 40% of the total annual CO2 emissions in the United States [4]. However, few studies have addressed the issue of the behavior of individuals in organizations/companies, as discussed below: prior research has mostly looked into the actions of users in the context of households.
There are two components of energy consumption in buildings: regulated and unregulated [15]. The total operational energy consumption of regulated components, such as heating, cooling, hot water, fans, and pumps, is generally well optimized. However, the consumption patterns associated with unregulated elements in office buildings like IT equipment (office printers, desktop and laptop computers), lab equipment, catering facilities, localized heating or cooling, lighting, etc., cannot be easily controlled by automation systems because they depend mainly on human behaviors [16].
Occupants’ behaviors significantly influence the relevant discrepancies between buildings with the same climate location and functionalities [5]. The way that building occupants set their comfort levels and related criteria (for instance, thermal and visual) influences the building energy systems. In addition, the responses to those environmental changes, to achieve comfort levels, directly affect energy use and the overall operation of buildings [5].
In a typical office building, lights consume 40% of total energy, heating and central cooling systems around 25%, and the rest is from plugged-in electrical equipment (35%) [6]. Even more relevant, if analyzing the electricity use in buildings with high-efficiency systems, the plugs’ electrical load can represent 50% of total consumption [17]. We can divide the energy consumption of these types of buildings into lighting, computers, and air conditioning. Several studies [17,18,19] indicate that it is possible to optimize the usage of these three vectors of office equipment with considerable energy savings by changing individual users’ behaviors.
There are several factors upon which those users’ behaviors depend (economic, ethical, and social-related) making it difficult to change their impacts solely with automation systems increasing electricity consumption. For instance, sometimes users frequently leave the computers turned on for long periods intentionally to minimize boot-up time (lunch, weekends, etc.) [10].
A study conducted in the USA on office buildings [20] found that most electric equipment is always on, almost 90% of desktop computers are not configured to enter low-power mode, and 50% of computer monitors enter safe mode. Another study [21] based on the quantities of energy wasted during non-occupied hours in commercial buildings highlights opportunities for implementing individual behavioral changes in service buildings.
Many mechanisms are used in the design phase of buildings that can predict, using simulations, the total energy consumption. However, there is a considerable difference between the expected consumption and the effective one. Individual behaviors and the occupants’ preferences are some of the most relevant factors that influence that identified difference [22]. So there must exist effective strategies aiming to understand user awareness of its impact and their expectations and concerns. Many research surveys [23,24,25] have sought to understand these consumer preferences about energy consumption and their perceptions related to demand response and energy efficiency behaviors. Several authors [7,8,9,26] state that individual behaviors of office buildings users are the most relevant aspect that influences energy consumption.
There are several research efforts that have sought to influence occupants’ behaviors. Hoes et al. [27] propose simulation tools; however, this kind of approach does not deal with the diversity and complexity of users’ behaviors. Another approach was the use of power meters to provide the basic information on appliance consumption, but this approach is unable to define usage patterns because they were not made to discriminate energy consumption at the individual user level [28].
Although some approaches [29,30,31] explore non-intrusive load monitoring in order to obtain data on the energy consumption of buildings at the equipment level, they still fail to correlate the consumption with the occupants’ activities. However, even if it were possible to differentiate this information in some way, as Berges et al. [32] point out, care should always be taken to correlate consumption with behavior so as not to generate out-of-context results.

2.2. Virtual Choreographies: Concept and Representation

Understanding human behavior is fundamental in society. Computer-supported approaches for this understanding require methods to represent human behaviors in information systems. In this section we present an overview of this methods and how virtual choreographies in particular present novel potential in this regard.

2.2.1. Human Behavior Representation

The need to represent human behavior stems from the desire to analyze it with software tools. Such tools arose in the early 1990s when the Cold War’s culmination brought new military challenges and tasks to NATO [33]. All this was due to the advent of innovative technologies that were beginning to have a tremendous impact on implementing simulation systems and decision support tools. It was then that the digital representation of human behaviors became vital to empowering decision-support tools and simulators [33].
Uwe Dompke is a German Air Force officer who led studies in the NATO Research and Technology Organization (RTO now STO), namely in modelling and simulation to support training, education, and decision-making, especially in the area of human behavior representation. Regarding the term “human behavior”, he defined it as “a purposive reaction of a human being to an idiosyncratic meaningful situation” [33]. A few years later, Elizabeth Hutchinson [34] defined human behavior as the interaction between a person and the environment.
In practical terms, human behavior occurs when there is a change from one state into another (bodily and/or mentally) with a particular goal, which can be externally observable. It does not require an associated logic nor an appropriate reaction, and possesses three interconnected components (socio-affective, psycho-motor, and cognitive) [33]. In order to perceive human behavior, one also needs to consider a multidimensional approach (time, person, environment) [35].
There are several methods to model human behaviors. Schmidt [36] presents the PECS (physical conditions, emotional state, cognitive capabilities, social status) reference model that aims to replace the BDI (belief, desire, intention) model initially developed by the philosophical expert Michael Bratman [37]. However, the USA Department of Defense combined the PECS model and the BDI, thus presenting the Human Behavior Representation (HBR) framework to model human behavior [33,38].
Dompke [33] states the aspects that should be considered when modelling human behavior:
  • Considering that the human behavior has a purpose, besides modelling that behavior, there should always be associated a SMART (specific, measurable, acceptable, realistic, and timed) objective;
  • The associated goal should represent the optimal behavior;
  • In a simple way, to model a behavior, it should be necessary to determine the initial value(s), the process that leads to the result, and the change to achieve the goal;
  • One should represent behaviors that are relevant to one’s analysis needs;
The main goal of the HBR approach is to create a computational model of human behavior that can express the observed variability in behaviors according to differences in the person’s characteristics, in their situation, or in their interplay [39].

2.2.2. Onthologies

Another perspective in the area of behavior representation relates specifically to behavioral change, which is one of the pillars underpinning this research work. For behavioral change to occur, it is necessary to identify a set of activities specially designed to change specific behavior patterns. These patterns are measured by the number of times they occur in a given population group under study [40].
There are methods and ways to report, evaluate, and understand behavioral change interventions through specific rating techniques [41]. Medicine and the natural sciences are, in fact, the leading exponents of these approaches [42] with the use of taxonomies [43,44]. Ontologies, as described in a scoping review led by Norris et al. [41], “extend the hierarchical nature of taxonomies” by presenting the following advantages:
  • They allow unique identification of entity types (objects, attributes, processes), thus eliminating ambiguity;
  • They enable the precise definition and classification of these identifiers;
  • They also help organize the relationships between these identifiers.
Therefore, in comparison with taxonomies, ontologies allow a greater and more detailed knowledge at the level of the representation of behaviors [41]. They also allow different theoretical perspectives with the help of conceptual frameworks and make it possible to compare multiple fields of study with large datasets [45,46]. It is also a relevant fact that ontologies allow manual updates according to the evolution and development of the domain itself, enabling a permanent update [47].
The use of ontologies has indeed been revolutionary in several domains (e.g., computational modelling of biological systems [48], or the creation of repositories accessible to the scientific community [49]. Given the significant impact of ontologies in other areas of knowledge, the scope of behavioral change is also included, namely with the Human Behavior-Change project (https://www.humanbehaviorchange.org/, accessed on 2 December 2020) [50]. This results from a collaboration between several areas of science (behavioral scientists, computer scientists, and systems architects), proposing tools and guidelines that help researchers and others interested in behavioral change themes [41].
But how are ontologies used in information science?
There is space for the use of ontologies whenever semantic contexts are used or needed, i.e., giving meaning to information [47]. In this sense, the consortium responsible for standardizing the technologies associated with the World Wide Web (https://www.w3.org/OWL/, accessed on 2 December 2020) has defined an OWL (Web Ontology Language) [51] as being responsible for representing ontologies in information systems. In computer science, an ontology is defined as a formal definition (through a well-defined syntax and semantics language) of concepts and their relationships for a given domain [47].
In practice, two fundamental components allow designing the semantic application (knowledge base and inference engine). The knowledge base is entirely linked to the ontology schema (what kinds of statements are possible) and to the facts, represented through a formal language [47].

2.2.3. Understanding Virtual Choreographies

Despite the approaches previously listed (HBR and the pure use of ontologies) for representing human behavior in the context of behavioral change, it is considered that, given the need for a more simplified approach and the different characteristics present in the context of this thesis (behaviors related to energy consumption in office buildings), the use of virtual choreographies will be the approach to take into consideration.
Common use of the term choreography occurs when referring to “the skill of combining movements into dances to be performed” or “the movements used by dancers especially in performing ballet, or the art of planning such movements” [52].
From a computer science point of view, the term is also used as a new view on interacting services associated with the “Web Services” technology [53]. There is even a Web Service Choreography Description Language (WS-CDL (https://www.w3.org/TR/ws-cdl-10/ accessed on 5 March 2021) that supports a top-down approach in the design and implementation of those services.
However, the approach to the term that will be considered in this work corresponds to the following definition: Virtual choreographies are sets of behaviors, interactions, and associated events that occur in a given time and space, with well-defined objectives and rules [11]. Those virtual choreographies can be performed by human-controlled actors and/or computer-controlled actors (also known as “bots” or “non-player characters” [54]) or even by non-embodied entities, such as temperature or conceptual networks. They enable the analysis of the behaviors independently of the physical platform upon which they occur [55], and thus can be reproduced on different platforms to serve different needs [56].
There are several contexts that need to use collaborative virtual systems based on multi-user behaviors, and that can include choreographed scenarios (e.g., aircraft maintenance [57], industry simulation [58], disaster simulation [59]). Furthermore, in research, virtual choreographies are also included in some scientific experiments [12].
All these contexts allow us to test and validate hypotheses that would otherwise be difficult to execute, significantly improving our predictive capacity of phenomena [60,61]. On the other hand, using virtual choreographies enables them to be designed in a platform-independent way, looking more at the context of the knowledge domain and not so much at the technological platform itself [11]. This independence of the platform allows the choreographies to be applied to different areas, such as process management [12], generating models for training and certification scenarios [62], and also transporting them to be analyzed by other tools [63].
However, considering that this work aims to identify which behaviors can reduce energy consumption, it is relevant to identify how to represent these behaviors. In this sense, the direction of the present research will consider the reference identified in the previous section to the use of ontologies in behavioral change and the approach taken by Silva et al. [64], which presents the choreography representation through an ontology-based model.
It is necessary to create a choreography to take into account the following elements:
  • Actors: characters that perform the behaviors in a choreography. This includes both human-controlled and computer-controlled actors, and might include non-embodied concepts;
  • Action: this is a specific interaction within the environment; for instance, actors walking, gesturing, talking, manipulating, etc., and also automatic doors opening or machines running, or a conceptual element emerging or fading;
  • Objects: elements that are not actors but can be acted upon by actors;
  • Roles: higher-order semantic context of an actor or object, providing meaning for their actions, location, and overall features;
  • Scenario: the stage where a choreography takes place. It may include objects and general characteristics (such as daytime, gravity, etc.);
  • Space-time: dynamic changes and evolution of the choreography, as actors and objects have specific roles and interact with each other in the scenario over time.

3. Behavior Identification with Virtual Choreographies

In the present research, in order to be able to identify the choreographies that contribute the most to energy consumption, two relevant steps were carried out. Firstly, the individual behaviors performed in an office that potentially consume electricity (corresponding to this section) were identified, resulting in a set of choreographies. Then, following this, a process of calculating how much each of these identified choreographies consumes in terms of electricity was carried out (next section). As the study was part of a project that produced relevant tools (hardware and software), three data sources were considered (see Figure 1):
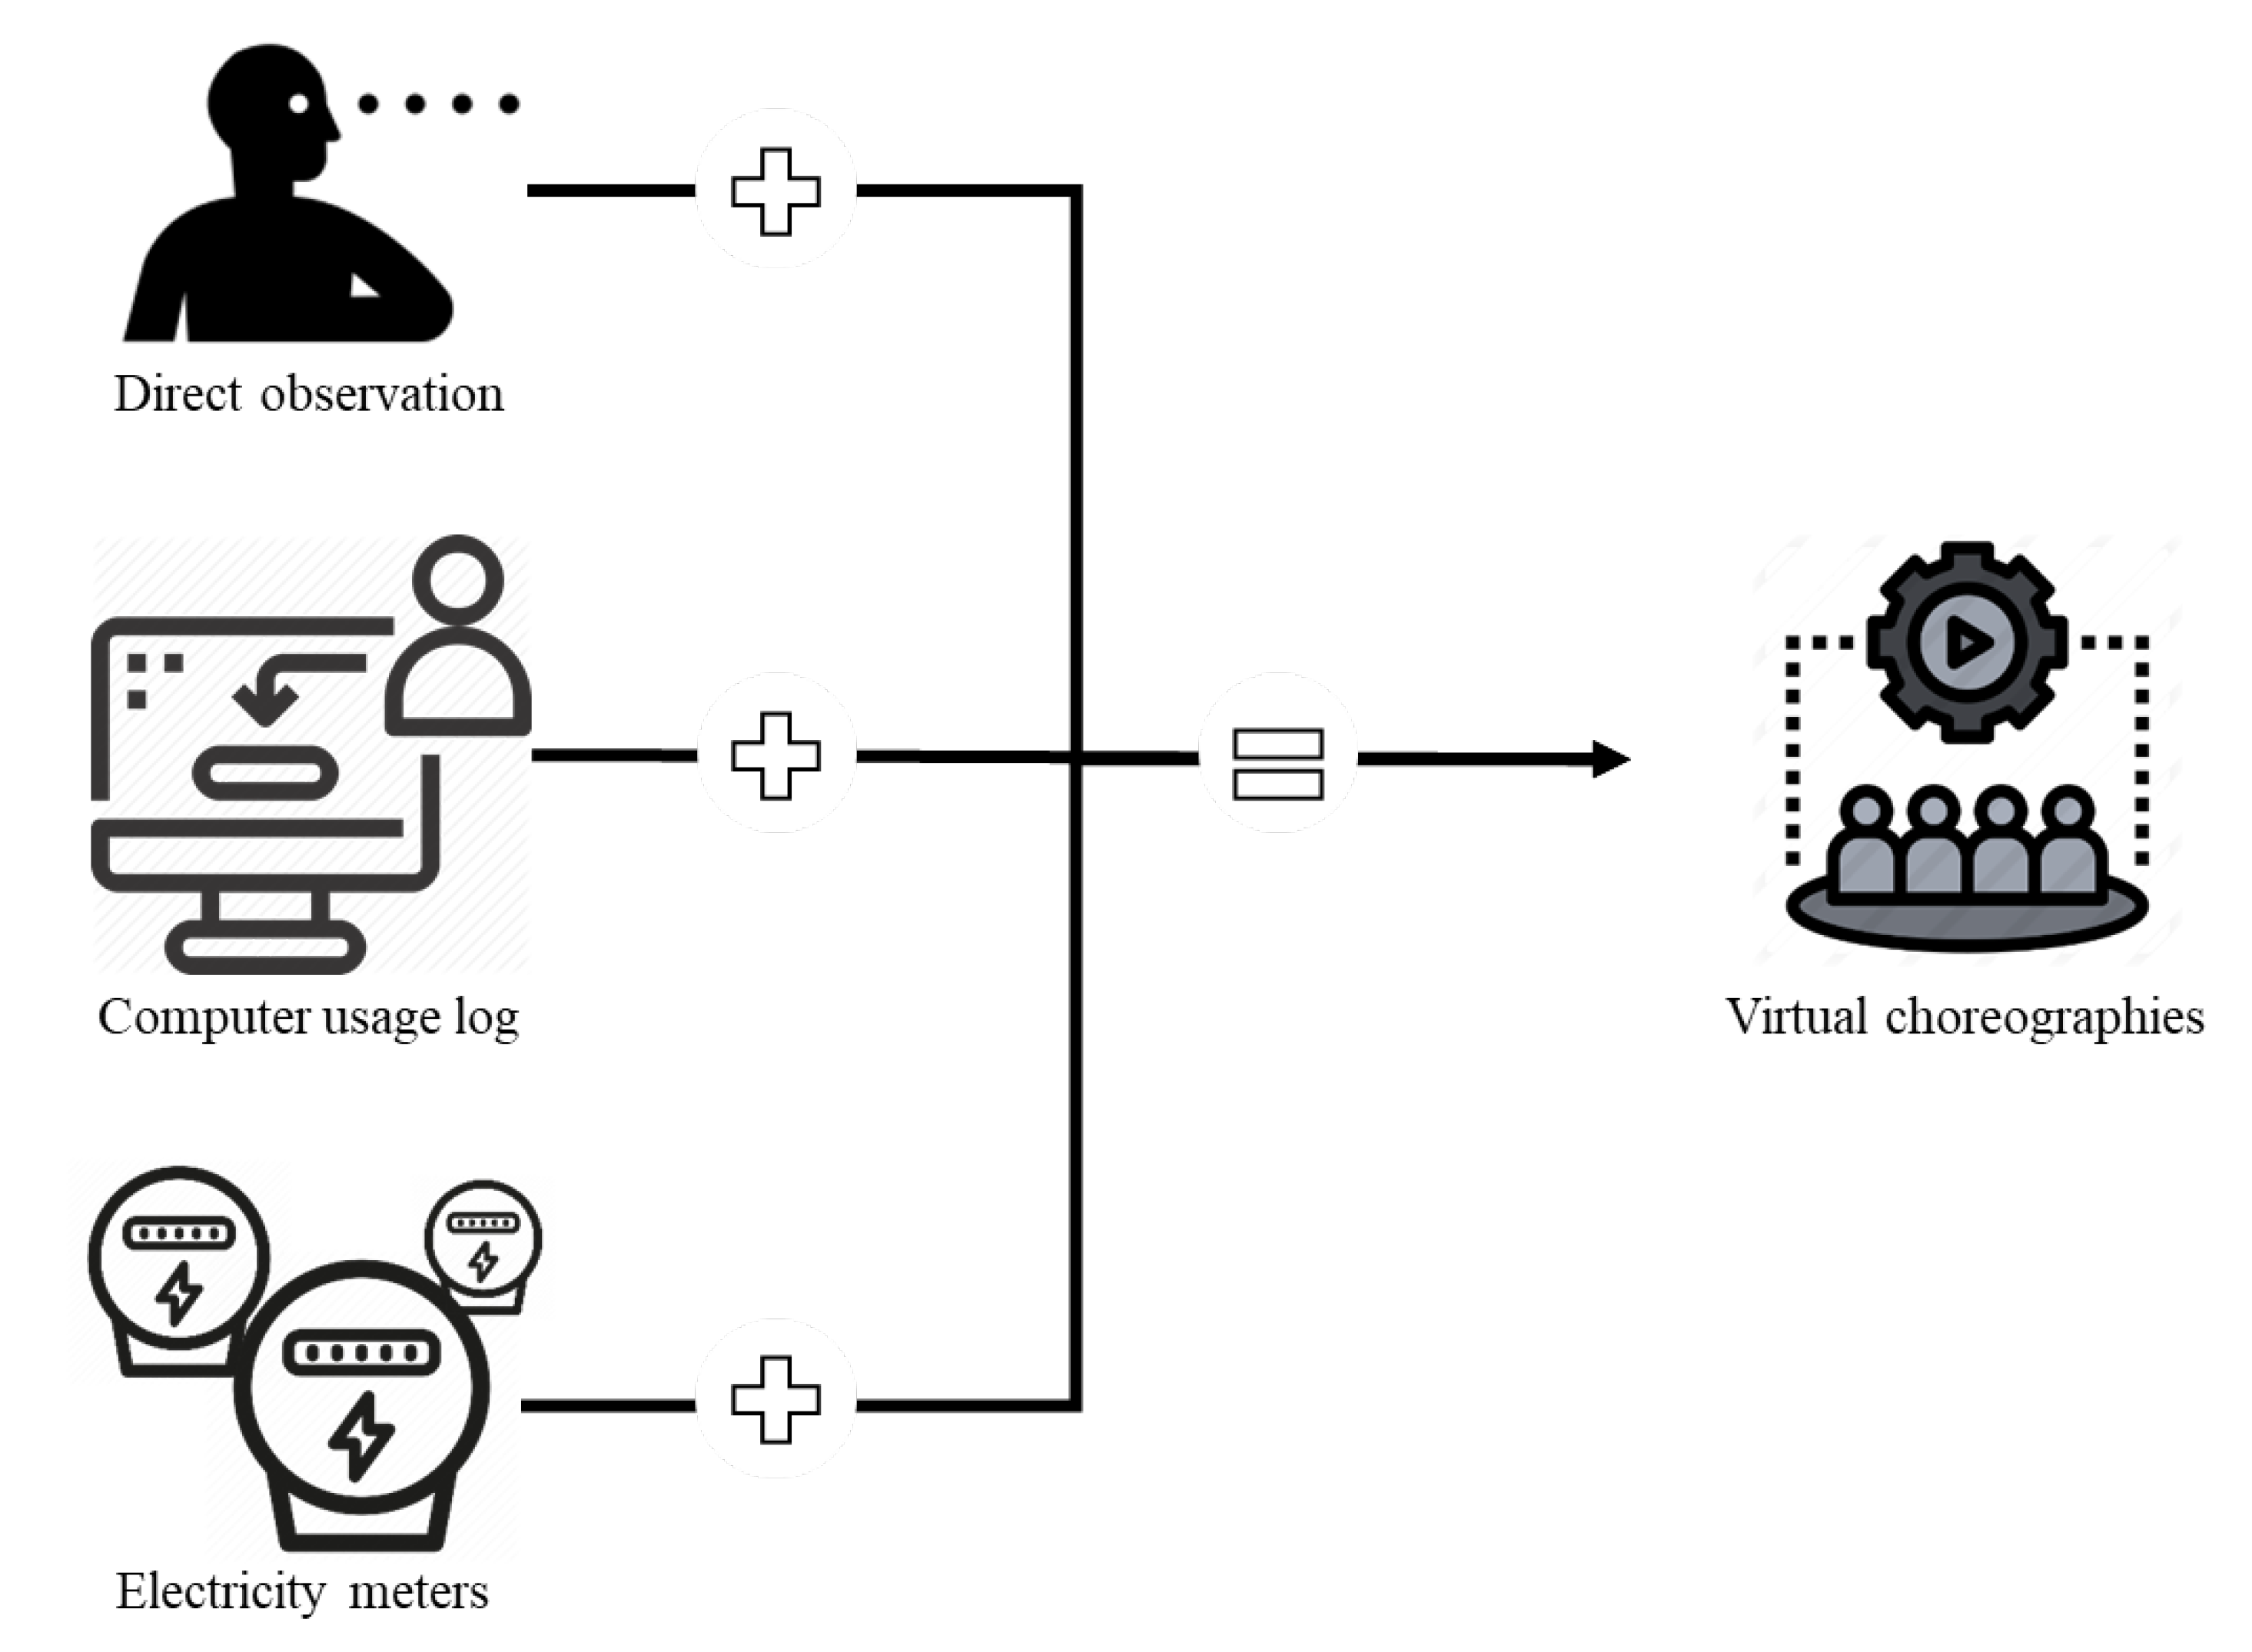
  • Direct observation (Section 3.1);
  • Computer software that registered when the computers were consuming energy (Section 3.2);
  • Electricity meters that showed the exact actual consumption (Section 3.3).

3.1. Field Observation

A direct observation methodology was conducted [65] on the INESC TEC open-space office to gather individual users’ behaviors related to energy consumption during a specific period (one week in November 2018). Without interfering with the users and their behaviors, a researcher was present in the open space between 8:30 and 18:30 to gather observational qualitative data.
Observation procedures followed recommendations by Fox [66]: observational research cannot record everything and thus responds to direct questions for which answers are sought. For this research, the observational questions were:
  • What are the usual energy-related behaviors of office users?
  • How often do the energy-related behaviors occur during the day?
Regarding the first item, the observer was attentive to actions related to the presence of people in the office space (which was related to lighting: no people means no need for lights) and desk work (computer usage is associated with desk work). Thus, we recorded not only direct computer use, but also activities such as “Enter the office” and “Leave the office” due to their relationship with lighting, and activities such as “Sitting on chair”, since computer-based information may be relevant during that period, even if the hardware is not actively being used.
The observational method requires a support that allows recording and subsequent evaluation of data. To minimize conditioning of people’s behavior [66], recording was carried out by taking notes of the following observed actions among the items of Spradley [67] recommendations:
  • Actor: the characters interacting with the environment;
  • Activity: the acts that the characters carry out;
  • Object: the things that are present in the scenario;
  • Act: the individual actions of the characters;
  • Time: the time at which the action begins.
This yielded the observational records, an extract of which is shown in Table 1.
These observational records were analyzed to identify distinct activity–object–act combinations, regardless of actors or time. These represent all the distinct behaviors related to energy consumption within the office, and are shown in Table 2, which answers the question: What are the usual energy-related behaviors of office users?

3.2. Electric Power Outlet Meters

The existing building energy management system (BEMS) on the INESC TEC infrastructure measures the aggregated electricity consumption of the building’s rooms, and separate consumption by computer workstations and lighting using a sub-metering system [68]. As presented by Barbosa et al. [68], the main goal of the equipment is to measure the energy consumption in the most relevant circuits of the building. The sub-metering system can be divided into three parts: energy meters, gateways, and a server. The energy meters are electronic devices equipped with three current transformers (one per phase) that allow obtaining energy-related information (voltage, electric-current, frequency, etc.).
At 15 min time intervals, these electronic devices captured measurements and sent them to the gateway. The gateway conveyed the meter measurements to the server (where the data was permanently stored) as seen in Table 3.

3.3. Computer Log

Following this path to identifying office users’ behaviors, after perceiving that, from the measurements of the meters, there was no possibility of knowing the individual’s actions because the meters are grouped by rooms, we devised a mechanism that allows discerning those individual behaviors.
Research studies about occupants’ energy-use behaviors at office buildings employ different approaches to collect energy-use data of individuals. Some install a plug-in meter at each workstation [69,70,71]. Others used a WiFi-based occupancy-sensing method [72] considered an easy solution in office buildings because most users have a smartphone, and there is high WiFi network coverage. Moreover, a computer software agent was developed and installed on each computer to evaluate usage patterns [73,74]. Even an RFID-based system installed on the office users was tested [75].
Considering these possibilities, a computer software was created that captures the state of the computer, thus obtaining a reliable and individualized record. The main task of this software is registering one of the following computer states: unlock, lock, or shutdown. The unlock state, which corresponds to the active state, is recorded when the user starts using the device. The lock that matches the low power state is recorded when the user logs out (i.e., locks the computer) and the operating system detects the low power mode. Lastly, the shutdown is recorded when the user turns off or suspends the device.
The computer status monitoring software was installed on every computer of the open space. Table 4 provides an example of a registry collected from an individual user.

3.4. Identification of Choreographies

In Table 2, we identified distinct behaviors. However, each of those single behaviors occurs within a wider context. For instance, leaving the office at lunchtime and returning afterwards indicates a longer period without computer use, for which users may be more willing to turn their machines off, whereas leaving the office midday might indicate a shorter absence. Choreography identification consists in considering this wider context to identify sequences of behaviors with such broader meanings. This contextual meaning was sought by triangulation of the three different data sources presented above: direct observation, electricity meters, and computer logs. The outcome, presented in Table 5, represents the choreographies that can be targeted for behavioral change.

4. Identifying Energy Consumption with Virtual Choreographies and Final Results

After the three different analyses, the need arises to understand how much each choreography weighs in terms of electrical consumption. A study was then carried out that encompassed data from meters with those from the computer log, which required the use of several calculations to achieve results. Let us now understand, in three steps, how these data were obtained.
First step
The first approach was to understand whether the identified behaviors through direct observation (Table 1) could be associated with the recorded data by the computer log application (Table 3).
Considering that the data collected by the observation were only relative to one week, the association between the two sources was made manually, that is, filtering the two datasets through the common values (user and day/time), which was translated into Table 6.
Second Step
Taking the scientific approach proposed by Silva et al. [76] that advocates the use of ontologies to represent virtual choreographies, in this way, taking the items that were presented in Section 2.2.3, it was thus possible to aggregate the following tables. Using the joined Table 6 (observation and computer log) and looking for the criteria and characteristics indicated in Table 5, a new table with data that contains the identified choreography for each recorded action was generated (see Table 7).
For instance, if the observation activity is “leave the office” and the computer log action registered is “lock”, there are several choreographies that can be matched. However, if we analyze the duration of the exit of that user, that is, if we look for the next record of “Sitting at chair” and the computer log records “unlock”, then we have the period of time of absence and we can identify the corresponding choreography.
After that, a new table can be obtained, Table 8, which contains the number of occurrences, by choreography for each period of the day (15 min slot).
Third step
After obtaining the number of occurrences of each choreography per day/hour, the challenge was to convert this data into energy consumption. To do this, we took Table 3, which contains the electric consumption (Watt-hour), and calculated the consumption for each 15 min slot. After that, we distributed this consumption over the number of occurrences of each of the choreographies, thus creating the effective weight that each behavior has in the global consumption of the space under study (Table 9).
This work has thus made it possible to present Table 10, which shows in the daily consumption, for the work week under study, for each of the identified choreographies. Which is nothing more than the sum of the daily records shown in Table 9.

5. Discussion

Figure 2, which corresponds exactly to the data in Table 10, presents what each choreography consumed, in kWh, throughout the study carried out. We can conclude that choreography 7 is the one that naturally has more power consumption, with 46% of total consumption, followed by 5 and 6, which correspond to 13% of consumption.
In accordance with to the information presented, there now follows a detailed analysis of each of the identified choreographies and the potential for energy consumption reduction if this behavior is changed. In this sense, for each action targets are pointed out that can be used to carry out the behavioral change.
Choreography 1—Enter the office (morning)
Objectively little can be done about this type of behavior, as it is related to the beginning of the working day.
Choreography 2—Small break <15″ (short meeting, coffee, toilet, snack, smoking, etc.)
This set of behaviors could be improved by turning off the monitor when the user gets up from his workstation. According to recent data [77], an LED monitor in 15 min has a power consumption of about 5 Wh, which is the savings potential.
Choreography 3—Medium break >15″ and <45″ (lunch, meeting, work in another place, etc.)
This set of behaviors could be improved by turning off the monitor when the user gets up from his workstation and also configuring the computer to enter power-save mode. According to recent data [77], an LED monitor in 45 min has a power consumption of about 15 Wh and a computer in idle mode reduces the power consumption by approximately 50%.
Choreography 4—Long break >45″ (meeting, work in other places, etc.) and Choreography 5—Lunchtime break
This set of behaviors could be improved by turning off the monitor when the user gets up from his workstation and also configuring the computer to enter power-save mode. According to recent data [77], an LED monitor per hour has a power consumption of about 20 Wh and a computer in idle mode reduces the power consumption by approximately 50%.
Choreography 6—Leave the office (end of the day)
This set of behaviors could be improved by turning off the monitor and the computer when the user gets up from his workstation at the end of a journey. The potential saving could correspond to a reduction of almost 100%; however, we know that some users may need the computer turned on to access it remotely or may be reluctant to deal with the long boot-up time at the beginning of the day.
Choreography 7—Working
Objectively little can be done about this type of behavior because it corresponds to the stage when the user is working on the computer.
Choreography 8—Turn lights on
Using the office lights can be improved by changing user habits, namely by using natural light when available and turning them off when all the users leave the room.
Choreography 9—Lunchtime break with shutdown
This is the desired type of behavior for power saving.
Choreography 10—Leave the office with shutdown (end of the day)
This is the desired type of behavior for power saving.
Choreography 11—Small break with shutdown (less than 15 min|short meeting, coffee, toilet, snack, smoking, etc.)
This is the desired type of behavior for power saving.
Choreography 12—Medium break with shutdown (between 15 min and 45 min|meeting, snack, etc.)
This is the desired type of behavior for power saving.
Choreography 13—Long break with shutdown (more than 45 min|meeting, etc.) This is the desired type of behavior for power saving.
Table 11 resumes the potential savings by choreography that was previously described.
In accordance with the data presented, we can conclude that:
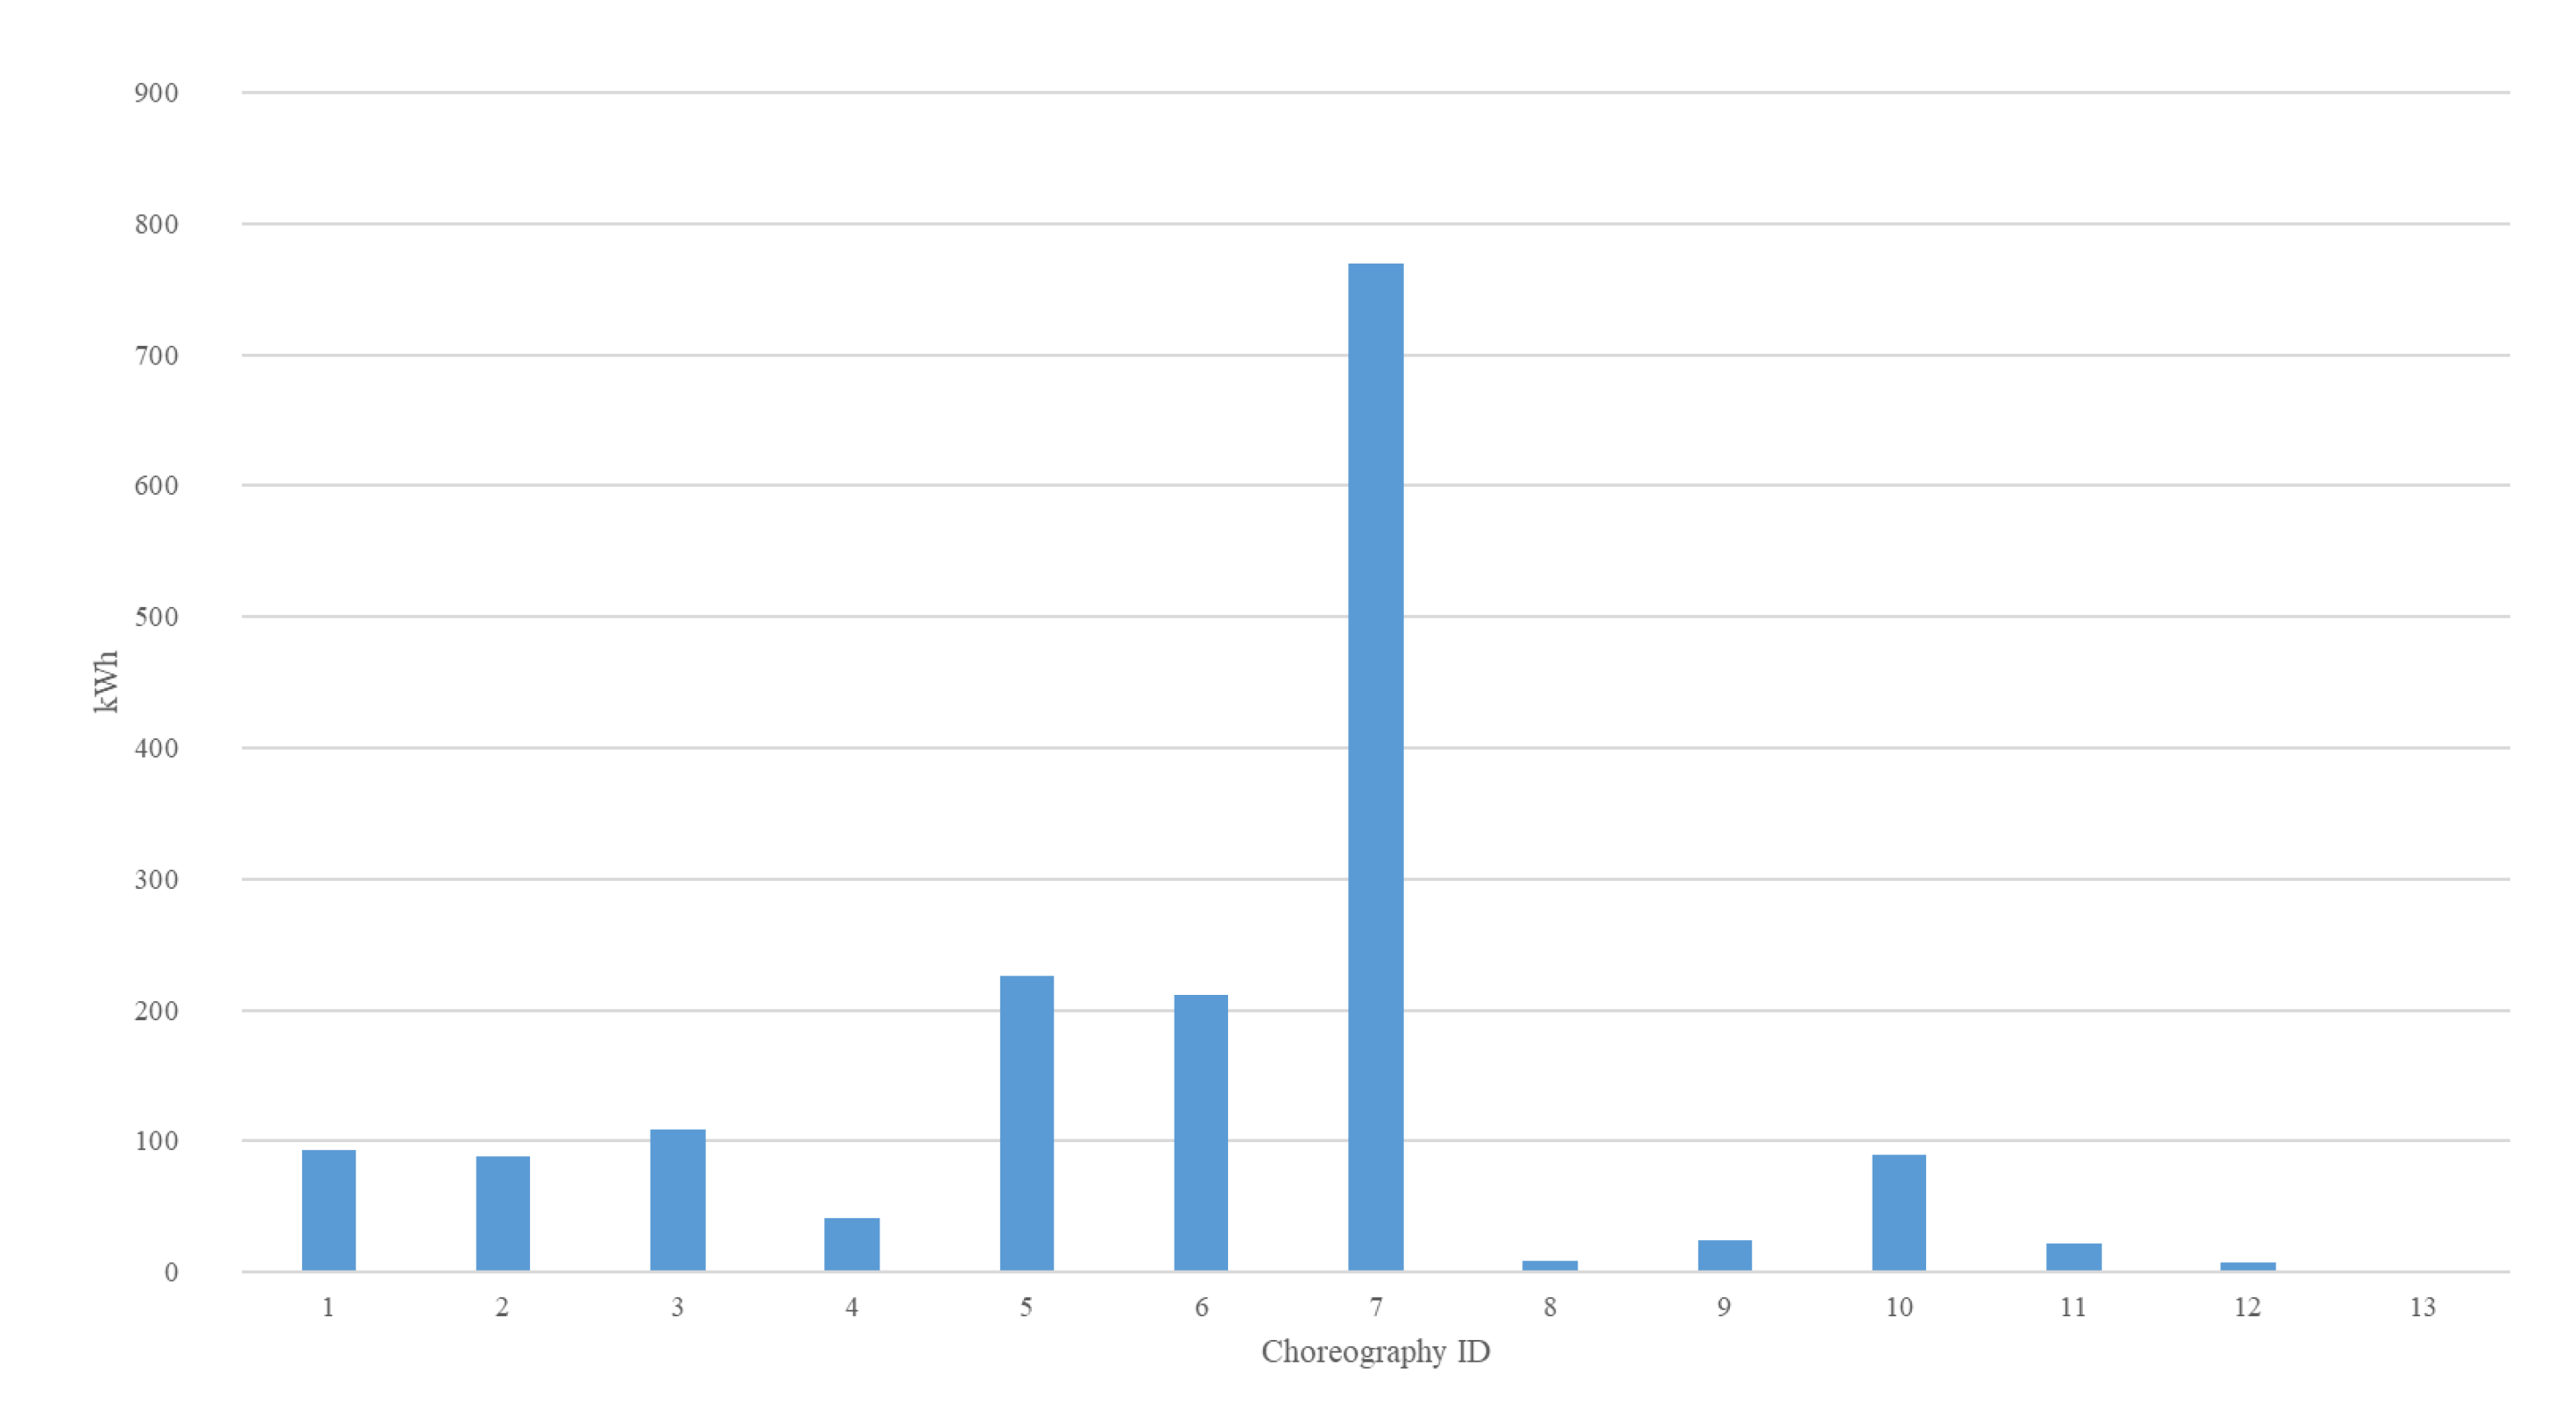
  • Choreography 7 corresponds to the use of the computer during work, concerning which, despite representing enormous consumption, in terms of behavioral change, no significant changes can be made;
  • Considering the consumption presented in choreography 5, there is space to act in terms of behavioral change during lunchtime;
  • It is also possible to address users’ behavior at the end of the working day, since choreography 6 indicates a relevant consumption rate, besides the fact that its optimization will certainly correspond to a considerable reduction in consumption due to what was presented before;
  • There is also a behavior that did not translate into choreography (although it is included in choreography 6), but that was observed through the analysis of meters and computer logs, which corresponds to the fact that during the weekend many of the equipment items are not turned off.
Thus, we can conclude that the behaviors that should be the targeted when designing solutions to decrease electricity consumption in the specific use case are those described in the following table.
The five targets presented in Table 12, correspond precisely to the behaviors that were identified through the study carried out of the virtual choreographies. In this sense, each of the targets has the corresponding choreographies that can be used to attack each of the behaviors. The first three targets point to behaviors related with computer use, namely to turn them off at night and on weekends, and also to put them in stand-by mode during lunchtime. The other two are directed towards the responsible use of lights, namely to switch them off during lunchtime and at the end of the day. It could be argued that an expert might identify all these energy conservation measures without previously identifying choreographies. However, such insights would be biased by the expert’s prior experience and might miss other relevant behaviors. Our approach relies on the data themselves to generate the relevant choreographies, thus ensuring a systematic approach for behavior identification.

6. Conclusions

In the section “Background”, which summarized what the scientific literature says about the role of individual behaviors in energy consumption, we presented the study carried out by Berges et al. [32] that states that there is a strong difficulty in correlating user behavior with energy consumption. Even when it is possible to differenciate individual user consumption, the authors claim that there are several out-of-context results.
Throughout this article, a method was presented which consists in identifying virtual choreographies as sets of behaviors within a broader context, by combining three sources of data—observations, meters, and computer logs—so that we can obtain more contextualized results regarding users’ final consumption, thus enabling the creation of new methodological approaches that help solve the problem identified by Berges et al. [32]. These choreographies can be assessed as targets for behavioral change by analysing their energy consumption impact and their potential for successful behavior change. If only isolated actions were used as an analysis parameter, behavior change success would be erratic because there would be no distinction, for example, between leaving the computer for a short while for nature’s call or leaving it for longer periods (e.g., lunchtime). This lack of contextual meaning would result in less targeted efforts. Moreover, the awareness of actual energy consumption impact by choreography instead of individual actions enables prioritization of behavior-change efforts, towards those with the greatest impact potential in energy consumption.
The proposed method makes it possible to identify behaviors with a richer semantic context (differentiating going out to lunch from going out to a meeting, for example), which allows for greater clarity in identifying the incentives to be generated for each action detected. Moreover, by associating each behavior with the effect on the target variable that is intended to be affected (in this case, energy consumption), we can identify the behaviors whose change is most effective, thus reducing the potential to generate contradictory incentives.
In the specific case under study, which aimed to identify the behaviors related to the energy consumption of users in office buildings, five of the actions studied were identified as actions that users usually perform and that can be subject to behavioral change, thus generating a reduction in energy consumption. In this sense, a direct implication of this methodology of identifying behaviors that could be changed was relevant for the design of a gamified mobile application aimed at reducing energy consumption in offices.
Thus, we can conclude that this method seems promising in systematically obtaining behaviors to be changed towards a goal. Considering that in a typical office building, as presented in the state of the art, the lights consume 40% of total energy and another 35% is from the electrical equipment [6], if we can promote the targeted identified behavior change choreographies, this can bring significant energy consumption reduction.
A limitation of this work was the fact that it was only applied in a single office context. Behaviors can differ from other offices, and indeed are different in wildly different contexts such as residential dwellings. Another limitation concerns the heuristic approach to triangulation of data to identify choreographies. There lies potential in extracting choreographies in a more systematic manner to lessen bias and reveal unexpected behaviors that observers may disregard. Although the presented method could be applicable to wider cases, there is also a limitation in terms of other energy-related behaviors that could arise due to the fact that only the consumption of computers and office lights was analyzed. Finally, this approach can also be limiting when ethical issues are considered because we are obtaining individual user behavior data, albeit anonymized.
The representation of virtual choreographies could have been better exploited through the use of ontologies or other computational formats, e.g., xAPI. This would, for example, enable the creation of a visual demonstrator to present the typified choreographies for richer human input concerning choreography identification. On the other hand, it would help in how the identified behaviors fit into a behavioral-change platform or appliance.
As future work, considering that the basis that allowed the identification of the behaviors is sustained in the direct observation of the use case, it will be relevant to be able to advance with other methodologies that allow identification of choreographies related to the topic to be studied without resorting to direct observation, given that, sometimes, situations may occur where such methodology cannot be applied. For instance, the proposed approach could be further enriched by modelling the choreographies as random variables to obtain a more insightful and explanatory model from the collected data.
Further, the qualification of behavior change potential could involve interdisciplinary experts, such as psychologists and energy auditors. The measures could be decided upon maybe by discussing examples of energy conservation measures. Such an interdisciplinary approach might also expose a situation that could not be identified using traditional auditing approaches, but could be identified using the approach based on virtual choreographies.
We argue that this approach of employing virtual choreographies for identification of user behaviors to target behavior change is a relevant contribution that allows us to outline methodological approaches and comparative effectiveness indicators that enhance behavioral change, as is the case with the use of gamification through mobile devices.

Author Contributions

Funding acquisition, H.T.; Project administration, F.S.; Resources, A.B.; Supervision, H.P.; Writing—original draft, F.C.; Writing—review & editing, L.M. and A.C. All authors have read and agreed to the published version of the manuscript.

Funding

Work financed by the funding from the European Research Council (ERC) under the European Union’s Horizon 2020 research and innovation programme (grant agreement No. 768935). Moreover, this work is financed by National Funds through the Portuguese funding agency, FCT—Fundação para a Ciência e a Tecnologia, within project LA/P/0063/2020.

Institutional Review Board Statement

Not applicable.

Informed Consent Statement

Not applicable.

Data Availability Statement

Not applicable.

Conflicts of Interest

The authors declare no conflict of interest.

References

  1. Janda, K.B. Buildings don’t use energy: People do. Arch. Sci. Rev. 2011, 54, 15–22. [Google Scholar] [CrossRef]
  2. Coraci, D.; Brandi, S.; Piscitelli, M.S.; Capozzoli, A. Online Implementation of a Soft Actor-Critic Agent to Enhance Indoor Temperature Control and Energy Efficiency in Buildings. Energies 2021, 14, 997. [Google Scholar] [CrossRef]
  3. Zierler, R.; Wehrmeyer, W.; Murphy, R. The energy efficiency behaviour of individuals in large organisations: A case study of a major UK infrastructure operator. Energy Policy 2017, 104, 38–49. [Google Scholar] [CrossRef] [Green Version]
  4. Sovacool, B.K. What are we doing here? Analyzing fifteen years of energy scholarship and proposing a social science research agenda. Energy Res. Soc. Sci. 2014, 1, 1–29. [Google Scholar] [CrossRef]
  5. Hong, T.; Lin, H.W. Occupant Behavior: Impact on energy use of private offices. In Proceedings of the ASim 2012—1st Asia Conference of International Building Performance Simulation Association, Shanghai, China, 25–27 November 2012. [Google Scholar]
  6. Kaneda, D.; Jacobson, B. Plug Load Reduction: The Next Big Hurdle for Net Zero Energy Building Design. In Proceedings of the ACEEE Summer Study on Energy Efficiency in Buildings, Pacific Grove, CA, USA, 15–20 August 2010; pp. 120–130. [Google Scholar]
  7. Chung, W. Review of building energy-use performance benchmarking methodologies. Appl. Energy 2011, 88, 1470–1479. [Google Scholar] [CrossRef]
  8. Roetzel, A.; Tsangrassoulis, A.; Dietrich, U.; Busching, S. A review of occupant control on natural ventilation. Renew. Sustain. Energy Rev. 2010, 14, 1001–1013. [Google Scholar] [CrossRef]
  9. Yun, G.Y.; Steemers, K. Time-dependent occupant behaviour models of window control in summer. Build. Environ. 2008, 43, 1471–1482. [Google Scholar] [CrossRef]
  10. Iria, J.; Fonseca, N.; Cassola, F.; Barbosa, A.; Soares, F.; Coelho, A.; Ozdemird, A. A gamification platform to foster energy efficiency in office buildings. Energy Build. 2020, 222, 110101. [Google Scholar] [CrossRef]
  11. Silva, E.; Silva, N.; Morgado, L. Model-driven generation of multi-user and multi-domain choreographies for staging in multiple virtual world platforms. In Proceedings of the International Conference on Model and Data Engineering, Larnaca, Cyprus, 24–26 September 2014; Volume 8748, pp. 77–91. [Google Scholar] [CrossRef] [Green Version]
  12. Weis, A.; Andrikopoulos, V.; Hahn, M.; Karastoyanova, D. Model-as-you-go for choreographies: Rewinding and repeating scientific choreographies. IEEE Trans. Serv. Comput. 2020, 13, 901–914. [Google Scholar] [CrossRef]
  13. European Parliament. Directive 2010/31/EU of the European Parliament and of the Council of 19 May 2010 on the energy performance of buildings. Off. J. Eur. Union 2010, 003, 124–146. [Google Scholar]
  14. New Building Institute. Guide to Energy Savings Plug Load Best Practices Guide; Technical Report; New Building Institute: Portland, OR, USA, 2012. [Google Scholar]
  15. Dougherty, K. Unregulated energy—Why we should care. Chart. Inst. Build. Serv. Eng. J. 2018, 6, 18–19. [Google Scholar]
  16. Mulville, M.; Jones, K.; Huebner, G.; Powell-Greig, J. Energy-saving occupant behaviours in offices: Change strategies. Build. Res. Inf. 2017, 45, 861–874. [Google Scholar] [CrossRef]
  17. Delzendeh, E.; Wu, S.; Lee, A.; Zhou, Y. The impact of occupants’ behaviours on building energy analysis: A research review. Renew. Sustain. Energy Rev. 2017, 80, 1061–1071. [Google Scholar] [CrossRef]
  18. Junnila, S. The potential effect of end-users on energy conservation in office buildings. Facilities 2007, 25, 329–339. [Google Scholar] [CrossRef]
  19. Zhang, T.; Siebers, P.O.; Aickelin, U. Modelling electricity consumption in office buildings: An agent based approach. Energy Build. 2011, 43, 2882–2892. [Google Scholar] [CrossRef] [Green Version]
  20. Webber, C.A.; Roberson, J.A.; McWhinney, M.C.; Brown, R.E.; Pinckard, M.J.; Busch, J.F. After-hours power status of office equipment in the USA. Energy 2006, 31, 2823–2838. [Google Scholar] [CrossRef] [Green Version]
  21. Masoso, O.T.; Grobler, L.J. The dark side of occupants’ behaviour on building energy use. Energy Build. 2010, 42, 173–177. [Google Scholar] [CrossRef]
  22. Paone, A.; Bacher, J.P. The impact of building occupant behavior on energy efficiency and methods to influence it: A review of the state of the art. Energies 2018, 11, 953. [Google Scholar] [CrossRef] [Green Version]
  23. Almeida, J.M.C.; Xavier, M.; Cardoso, G.; Gonçalves Pereira, M.; Gusmão, R.; Corrêa, B.; Gago, J.; Talina, M.; Silva, J.D.; Cerol, J.; et al. Estudo Epidemiológico Nacional de Saúde Mental 1º Relatório; Faculdade de Ciências Médicas, Universidade Nova de Lisboa: Lisboa, Portugal, 2013. [Google Scholar]
  24. Andersen, R.V.; Toftum, J.; Andersen, K.K.; Olesen, B.W. Survey of occupant behaviour and control of indoor environment in Danish dwellings. Energy Build. 2009, 41, 11–16. [Google Scholar] [CrossRef]
  25. Bonino, D.; Corno, F.; De Russis, L. Home energy consumption feedback: A user survey. Energy Build. 2012, 47, 383–393. [Google Scholar] [CrossRef] [Green Version]
  26. Charoen, P.; Kitbutrawat, N.; Kudtongngam, J. A Demand Response Implementation with Building Energy Management System. Energies 2022, 15, 1220. [Google Scholar] [CrossRef]
  27. Hoes, P.; Hensen, J.L.; Loomans, M.G.; de Vries, B.; Bourgeois, D. User behavior in whole building simulation. Energy Build. 2009, 41, 295–302. [Google Scholar] [CrossRef] [Green Version]
  28. McLauchlan, N.; Bessis, N. Towards remote monitoring of power use: A case for smart meters. In Proceedings of the 6th International Symposium on Parallel Computing in Electrical Engineering, Luton, UK, 3–7 April 2011. [Google Scholar] [CrossRef]
  29. Hart, G.W.; Warren, S.D.; Brandeis, L.D. Residential Energy Monitoring and Computerized Surveillance via Utility Power Flows. IEEE Technol. Soc. Mag. 1989, 8. [Google Scholar] [CrossRef]
  30. Jin, Y.; Tebekaemi, E.; Berges, M.; Soibelman, L. A time-frequency approach for event detection in non-intrusive load monitoring. In Proceedings of the Signal Processing, Sensor Fusion, and Target Recognition XX, Orlando, FL, USA, 25–29 April 2011; Volume 8050. [Google Scholar] [CrossRef]
  31. Tien, P.W.; Wei, S.; Calautit, J. A Computer Vision-Based Occupancy and Equipment Usage Detection Approach for Reducing Building Energy Demand. Energies 2020, 14, 156. [Google Scholar] [CrossRef]
  32. Berges, M.; Goldman, E.; Matthews, H.S.; Soibelman, L. Training Load Monitoring Algorithms on Highly Sub-Metered Home Electricity Consumption Data. Tsinghua Sci. Technol. 2008, 13, 406–411. [Google Scholar] [CrossRef]
  33. Dompke, U.D. Human Behaviour Representation-Definition. In Proceedings of the RTO SAS Lecture Series on “Simulation of and for Military Decision Making”, Rome, Italy, 15–16 October 2011; p. 32. [Google Scholar]
  34. Hutchison, E.D. Dimensions of Human Behavior: Person and Environment; Sage Publications: Thousand Oaks, CA, USA, 2019; p. 553. [Google Scholar]
  35. Kusumasari, T.F.; Surendro, K.; Sastramihardja, H.; Supriana, I. Human behavior conceptual model in collaborative software development product quality. In Proceedings of the 2013 International Conference on Advanced Computer Science and Information Systems, ICACSIS, Sanur Bali, Indonesia, 28–29 September 2013; pp. 89–94. [Google Scholar] [CrossRef]
  36. Schmidt, B. Human Factors in Complex Systems the Modelling of Human Behaviour. In Proceedings of the Simulation in Wider Europe, 19th European Conferance on Modelling and Simulation, Riga, Latvia, 1–4 June 2005. [Google Scholar]
  37. Bratman, M.E. Intention, Plans and Practical Reason; The David Hume Series; CSLI Publications: Stanford, CA, USA, 1987; p. 208. [Google Scholar]
  38. Engmo, V. Representation of Human Behavior in Military Simulations; Norwegian Defence Research Establishment: Oslo, Norway, 2008. [Google Scholar]
  39. Shi, S.; Tang, Z.; Ma, Q.; Wang, J. Human behavior representation theory progress in constructive simulation. In Proceedings of the Communications in Computer and Information Science, Shanghai, China, 27–30 October 2012; pp. 336–344. [Google Scholar] [CrossRef]
  40. Michie, S.; van Stralen, M.M.; West, R. The behaviour change wheel: A new method for characterising and designing behaviour change interventions. Implement. Sci. 2011, 6, 42. [Google Scholar] [CrossRef] [Green Version]
  41. Norris, E.; Finnerty, A.N.; Hastings, J.; Stokes, G.; Michie, S. A scoping review of ontologies related to human behaviour change. Nat. Hum. Behav. 2019, 3, 164–172. [Google Scholar] [CrossRef]
  42. Hollands, G.J.; Bignardi, G.; Johnston, M.; Kelly, M.P.; Ogilvie, D.; Petticrew, M.; Prestwich, A.; Shemilt, I.; Sutton, S.; Marteau, T.M. The TIPPME intervention typology for changing environments to change behaviour. Nat. Hum. Behav. 2017, 1, 1–9. [Google Scholar] [CrossRef]
  43. Howlett, N.; Trivedi, D.; Troop, N.A.; Chater, A.M. Are physical activity interventions for healthy inactive adults effective in promoting behavior change and maintenance, and which behavior change techniques are effective? A systematic review and meta-analysis. Transl. Behav. Med. 2019, 9, 147–157. [Google Scholar] [CrossRef]
  44. Michie, S.; Carey, R.N.; Johnston, M.; Rothman, A.J.; De Bruin, M.; Kelly, M.P.; Connell, L.E. From theory-inspired to theory-based interventions: A protocol for developing and testing a methodology for linking behaviour change techniques to theoretical mechanisms of action. Ann. Behav. Med. 2018, 52, 501–512. [Google Scholar] [CrossRef] [Green Version]
  45. Ashburner, M.; Ball, C.A.; Blake, J.A.; Botstein, D.; Butler, H.; Cherry, J.M.; Davis, A.P.; Dolinski, K.; Dwight, S.S.; Eppig, J.T.; et al. Gene ontology: Tool for the unification of biology. Nat. Genet. 2000, 25, 25–29. [Google Scholar] [CrossRef] [PubMed] [Green Version]
  46. Larsen, K.R.; Michie, S.; Hekler, E.B.; Gibson, B.; Spruijt-Metz, D.; Ahern, D.; Cole-Lewis, H.; Ellis, R.J.; Hesse, B.; Moser, R.P.; et al. Behavior change interventions: The potential of ontologies for advancing science and practice. J. Behav. Med. 2017, 40, 6–22. [Google Scholar] [CrossRef] [PubMed] [Green Version]
  47. Busse, J.; Humm, B.; Lübbert, C.; Moelter, F.; Reibold, A.; Rewald, M.; Schlüter, V.; Seiler, B.; Tegtmeier, E.; Zeh, T. Actually, what does “ontology” mean?: A term coined by philosophy in the light of different scientific disciplines. J. Comput. Inf. Technol. 2015, 23, 29–41. [Google Scholar] [CrossRef] [Green Version]
  48. Dessimoz, C.; Škunca, N. (Eds.) The Gene Ontology Handbook (Methods in Molecular Biology); Springer: New York, NY, USA, 2017; Volume 1446. [Google Scholar] [CrossRef]
  49. Smith, B.; Ashburner, M.; Rosse, C.; Bard, J.; Bug, W.; Ceusters, W.; Goldberg, L.J.; Eilbeck, K.; Ireland, A.; Mungall, C.J.; et al. The OBO Foundry: Coordinated evolution of ontologies to support biomedical data integration. Nat. Biotechnol. 2007, 25, 1251–1255. [Google Scholar] [CrossRef] [Green Version]
  50. Michie, S.; Thomas, J.; Johnston, M.; Aonghusa, P.M.; Shawe-Taylor, J.; Kelly, M.P.; Deleris, L.A.; Finnerty, A.N.; Marques, M.M.; Norris, E.; et al. The Human Behaviour-Change Project: Harnessing the power of artificial intelligence and machine learning for evidence synthesis and interpretation. Implement. Sci. 2017, 12, 121. [Google Scholar] [CrossRef] [Green Version]
  51. McGuinness, D.L.; Harmelen, F.V. OWL Web Ontology Language Overview. W3C Recomm. 2004, 10, 2004. [Google Scholar]
  52. CHOREOGRAPHY|Meaning in the Cambridge English Dictionary. Available online: https://dictionary.cambridge.org/dictionary/english/choreography (accessed on 8 June 2022).
  53. Dijkman, R.; Dumas, M. Service-oriented design: A multi-viewpoint approach. Int. J. Coop. Inf. Syst. 2004, 13, 337–368. [Google Scholar] [CrossRef]
  54. Kurillo, G.; Bajcsy, R.; Nahrsted, K.; Kreylos, O. Immersive 3D Environment for Remote Collaboration and Training of Physical Activities. In Proceedings of the 2008 IEEE Virtual Reality Conference, Reno, NV, USA, 8–12 March 2008; pp. 269–270. [Google Scholar] [CrossRef]
  55. Cassola, F.; Mendes, D.; Pinto, M.; Morgado, L.; Costa, S.; Anjos, L.; Marques, D.; Rosa, F.; Maia, A.; Tavares, H.; et al. Design and Evaluation of a Choreography-based Tool for Authoring Experiential Learning in Virtual Reality. IEEE Trans. Learn. Technol. 2022; in press. [Google Scholar]
  56. Lacet, D.; Penicheiro, F.; Morgado, L. Magical Board Theatre: Interactive stories that can be played on multiple boards—Two educational prototypes. In Proceedings of the Videojogos 2020, Mirandela, Portugal, 26–28 November 2020; pp. 1–13. [Google Scholar]
  57. Pinheiro, A.; Fernandes, P.; Maia, A.; Cruz, G.; Pedrosa, D.; Fonseca, B.; Paredes, H.; Martins, P.; Morgado, L.; Rafael, J. Development of a Mechanical Maintenance Training Simulator in OpenSimulator for F-16 Aircraft Engines. Procedia Comput. Sci. 2012, 15, 248–255. [Google Scholar] [CrossRef] [Green Version]
  58. Nakasone, A.; Prendinger, H.; Miska, M.; Lindner, M.; Horiguchi, R.; Ibarra, J.; Gajananan, K.; Mendes, R.; Madruga, M.; Kuwahara, M. OpenEnergySim: A 3D Internet Based Experimental Framework for Integrating Traffic Simulation and Multi-User Immersive Driving. In Proceedings of the SIMUTools ’11: 4th International ICST Conference on Simulation Tools and Techniques, Barcelona, Spain, 21–25 March 2011; pp. 490–498. [Google Scholar] [CrossRef]
  59. Ribeiro, J.; Almeida, J. Using serious games to train evacuation behaviour. In Proceedings of the 2012 7th Iberian Conference on Information Systems and Technologies (CISTI), Madrid, Spain, 20–23 June 2012; pp. 1–6. [Google Scholar]
  60. Deterding, S.; Sicart, M.; Nacke, L.; O’Hara, K.; Dixon, D. Gamification. using game-design elements in non-gaming contexts. In Proceedings of the 2011 Annual Conference Extended Abstracts on Human Factors in Computing Systems—CHI EA ’11, Vancouver, BC, Canada, 7–12 May 2011. [Google Scholar] [CrossRef]
  61. Young, R.; Riedl, M. An architecture for integrating plan-based behavior generation with interactive game environments. J. Game Dev. 2004, 1, 1–29. [Google Scholar]
  62. Cassola, F.; Pinto, M.; Mendes, D.; Morgado, L.; Ant, A.; Coelho, A.; Paredes, H. A Novel Tool for Immersive Authoring of Experiential Learning in Virtual Reality. In Proceedings of the IEEE Conference on Virtual Reality and 3D User Interfaces, Lisbon, Portugal, 27 March–1 April 2021. [Google Scholar] [CrossRef]
  63. Zhou, S.; Chen, D.; Cai, W.; Luo, L.; Low, M.Y.H.; Tian, F.; Tay, V.S.H.; Ong, D.W.S.; Hamilton, B.D. Crowd modeling and simulation technologies. ACM Trans. Model. Comput. Simul. 2010, 20, 1–35. [Google Scholar] [CrossRef] [Green Version]
  64. Silva, E.; Silva, N.; Morgado, L. Staging Choreographies for Team Training in Multiple Virtual Worlds Based on Ontologies and Alignments. In Virtual, Augmented and Mixed Reality: Applications of Virtual and Augmented Reality SE—10; Shumaker, R., Lackey, S., Eds.; Springer: Cham, Switzerland, 2014; Volume 8526, pp. 105–115. [Google Scholar] [CrossRef] [Green Version]
  65. Holmes, A. Direct Observation BT. In Encyclopedia of Autism Spectrum Disorders; Volkmar, F.R., Ed.; Springer: New York, NY, USA, 2013; pp. 980–981. [Google Scholar] [CrossRef]
  66. Fox, N. Trent Focus for Research and Development in Primary Health Care: How to Use Observations in a Research Project; Radcliffe Medical Press/Trent Focus: Abingdon, UK, 1998. [Google Scholar]
  67. Spradley, J.P. Participant Observation; Holt, Rinehart and Winston: New York, NY, USA, 1980. [Google Scholar]
  68. Barbosa, A.; Iria, J.; Cassola, F.; Coelho, A.; Portela, J.; Küçük, Ü.; Madureira, A.G.; Zehir, M.A.; Ozdemir, A.; Soares, F.J. GReSBAS project: A gamified approach to promote more energy efficient behaviours in buildings. In Proceedings of the 2017 10th International Conference on Electrical and Electronics Engineering (ELECO), Bursa, Turkey, 30 November–2 December 2017; pp. 1258–1261. [Google Scholar]
  69. Khosrowpour, A.; Gulbinas, R.; Taylor, J.E. Occupant workstation level energy-use prediction in commercial buildings: Developing and assessing a new method to enable targeted energy efficiency programs. Energy Build. 2016, 127, 1133–1145. [Google Scholar] [CrossRef] [Green Version]
  70. Rafsanjani, H.N.; Ahn, C.R.; Eskridge, K.M. Understanding the recurring patterns of occupants’ energy-use behaviors at entry and departure events in office buildings. Build. Environ. 2018, 136, 77–87. [Google Scholar] [CrossRef]
  71. Yun, R.; Lasternas, B.; Aziz, A.; Loftness, V.; Scupelli, P.; Rowe, A.; Kothari, R.; Marion, F.; Zhao, J. Toward the design of a dashboard to promote environmentally sustainable behavior among office workers. In Proceedings of the 8th International Conference, PERSUASIVE 2013, Sydney, NSW, Australia, 3–5 April 2013; Volume 7822, pp. 246–252. [Google Scholar] [CrossRef]
  72. Lassabe, F.; Canalda, P.; Chatonnay, P.; Spies, F.; Charlet, D. Refining WiFi indoor positioning renders pertinent deploying location-based multimedia guide. In Proceedings of the International Conference on Advanced Information Networking and Applications, Vienna, Austria, 18–20 April 2006; Volume 2, pp. 126–130. [Google Scholar] [CrossRef]
  73. Newsham, G.R.; Tiller, D.K. Energy consumption of desktop computers: Measurement and savings potential. IEEE Trans. Ind. Appl. 1994, 30, 1065–1072. [Google Scholar] [CrossRef]
  74. Pedro Lopes, R.; Pires, L.; Pedrosa, T.; Marian, V. Profiling computer energy consumption on organizations. In Proceedings of the 11th International Conference on Enterprise Information Systems, Milan, Italy, 6–10 May 2009; pp. 171–174. [Google Scholar] [CrossRef] [Green Version]
  75. Li, N.; Calis, G.; Becerik-Gerber, B. Measuring and monitoring occupancy with an RFID based system for demand-driven HVAC operations. Autom. Constr. 2012, 24, 89–99. [Google Scholar] [CrossRef]
  76. Silva, E.; Silva, N.; Morgado, L.; Martins, P.; Paredes, H. An Ontology-Oriented Architecture for Platform-Independent Mult-User Choreographies. Learn. Technol. 2012, 14, 2022040278. [Google Scholar]
  77. Pothitou, M.; Hanna, R.F.; Chalvatzis, K.J. ICT entertainment appliances’ impact on domestic electricity consumption. Renew. Sustain. Energy Rev. 2017, 69, 843–853. [Google Scholar] [CrossRef] [Green Version]
Figure 1. Sources of data that fed into the evaluation of the choreographies.
Energies 15 04354 g001
Figure 2. Overall consumption, in kWh, per choreography.
Energies 15 04354 g002
Table 1. Sample observational records.
ActorActivityObjectActTime
a3WorkComputerUse keyboard & Mouse08:31
a39WorkComputerUse keyboard & Mouse08:31
a42WorkComputerUse keyboard & Mouse08:31
a54WorkComputerUse keyboard & Mouse08:31
a1Enter the officeDoorOpen08:38
a1Sitting on chairDeskSit08:38
a1WorkComputerUse keyboard & Mouse08:38
a39Leave the officeDoorExit08:40
Table 2. Distinct energy-related behaviors.
ActivityObjectAct
Sitting on chairMonitorTurn on
WorkComputerUse keyboard & mouse
Leave the officeDoorOpen
Turn lightsLights switchInteract
Table 3. Meter table example.
idMeterdatetimeMeasurevalueMeasure (Wh)
PT58ABEM1253_21 January 2020 00:01282,679
PT58ABEM1248_11 January 2020 00:01357,781
PT58ABEM1249_21 January 2020 00:01330,716
PT58ABEM1255_21 January 2020 00:021,333,449
PT58ABEM1254_31 January 2020 00:0230,686
PT58ABEM1251_11 January 2020 00:0247,373
PT58ABEM1250_21 January 2020 00:03616,117
PT58ABEM1252_11 January 2020 00:03507,408
PT58ABEM1253_11 January 2020 00:03269,181
PT58ABEM1251_21 January 2020 00:04248
PT58ABEM1250_11 January 2020 00:04540,724
PT58ABEM1248_21 January 2020 00:04412,985
PT58ABEM1249_11 January 2020 00:051098
PT58ABEM1249_31 January 2020 00:0533,697
Table 4. Computer log registry from a user example.
Date TimeComputer State
09:53unlock
09:57lock
09:58unlock
11:35lock
11:38unlock
11:54lock
12:47unlock
12:49lock
13:09unlock
15:02lock
15:06unlock
16:01lock
17:00unlock
18:45lock
18:48unlock
20:35lock
Table 5. Characteristics to identify this choreography.
ChoreographyCharacteristics to Identify This Choreography (Extracted from the Observational Registry Log)
01
Enter the office (morning)
  • Must be the first record of the day;
  • Must occur in the morning (until midday);
  • Must include the activities:
    • Enter the office (opening the door)
    • Sitting on the chair (turned on the monitor)
02
Small break (less than 15 min|short meeting, coffee, toilet, snack, smoking, etc.)
  • Must include the activities:
    • Leave the office (exit through the door)
    • Enter the office (opening the door)
    • Sitting on the chair (turned on the monitor)
  • The difference (in minutes) between the activity (a) and (b) must be less than 15 min;
03
Medium break (between 15 min and 45 min|meeting, snack, etc.)
  • Must include the activities:
    • Leave the office (exit through the door)
    • Enter the office (opening the door)
    • Sitting on the chair (turned on the monitor)
  • The difference (in minutes) between the activity (a) and (b) must be more than 15 min and less than 45 min;
04
Long break (more than 45 min|meeting, etc.)
  • Must include the activities:
    • Leave the office (exit through the door)
    • Enter the office (opening the door)
    • Sitting on the chair (turned on the monitor)
  • The difference (in minutes) between the activity (a) and (b) must be more than 45 min;
05
Lunchtime break
  • Must include the activities:
    • Leave the office (exit through the door)
    • Enter the office (opening the door)
    • Sitting on the chair (turned on the monitor)
  • The activity (a) must occur during the lunchtime hours (12:00 to 14:30)
06
Leave the office (end of the day)
  • Must be the last record of the day
  • Must include the activity:
    • Leave the office (exit through the door)
07
Working
  • Must include the activity:
    • Work (using the computers keyboard and mouse)
08
Turn on the lights
  • Must include the activity:
    • Turn lights on (interact with the lights switch)
09
Lunchtime break with shutdown
  • Must include the activities:
    • Leave the office (exit through the door)
    • Enter the office (opening the door)
    • Sitting on the chair (turned on the monitor)
  • The activity (a) must occur during the lunchtime hours (12:00 to 14:30);
  • The computer log state “shutdown” must exist for the same timestamp.
10
Leave the office with shutdown (end of the day)
  • Must be the last record of the day
  • Must include the activity:
    • Leave the office (exit through the door)
  • The computer log state “shutdown” must exist for the same timestamp.
11
Small break with shutdown (less than 15 min | short meeting, coffee, toilet, snack, smoking, etc.)
  • Must include the activities:
    • Leave the office (exit through the door)
    • Enter the office (opening the door)
    • Sitting on the chair (turned on the monitor)
  • The difference (in minutes) between the activity (a) and (b) must be less than 15 min;
  • The computer log state “shutdown” must exist for the same timestamp.
12
Medium break with shutdown (between 15 min and 45 min | meeting, snack, etc.)
  • Must include the activities:
    • Leave the office (exit through the door)
    • Enter the office (opening the door)
    • Sitting on the chair (turned on the monitor)
  • The difference (in minutes) between the activity (a) and (b) must be more than 15 min and less than 45 min;
  • The computer log state “shutdown” must exist for the same timestamp.
13
Long break with shutdown (more than 45 min | meeting, etc.)
  • Must include the activities:
    • Leave the office (exit through the door)
    • Enter the office (opening the door)
    • Sitting on the chair (turned on the monitor)
  • The difference (in minutes) between the activity (a) and (b) must be more than 45 min;
  • The computer log state “shutdown” must exist for the same timestamp.
Table 6. Observation table with computer log action example.
ActorActivityObjectActTimeComputerlog Action
a8Leave the officeDoorExit16:10lock
a52Leave the officeDoorExit16:24lock
a50WorkComputerUse keyboard & Mouse16:34unlock
a8WorkComputerUse keyboard & Mouse16:34unlock
a52WorkComputerUse keyboard & Mouse16:34unlock
a32WorkComputerUse keyboard & Mouse16:36unlock
a50Leave the officeDoorExit16:41lock
a60Leave the officeDoorExit16:49lock
a50WorkComputerUse keyboard & Mouse16:54unlock
a47WorkComputerUse keyboard & Mouse17:00unlock
a52Leave the officeDoorExit17:00shutdown
a32Leave the officeDoorExit17:04shutdown
a9Leave the officeDoorExit17:21lock
a50Leave the officeDoorExit17:29lock
Table 7. Choreography identification for each observation with computer log action example.
ActorActivityObjectActTimeComputerlog ActionChor. ID
a8Leave the officeDoorExit16:10lock3
a52Leave the officeDoorExit16:24lock3
a50WorkComputerUse keyboard & Mouse16:34unlock8
a8WorkComputerUse keyboard & Mouse16:34unlock8
a52WorkComputerUse keyboard & Mouse16:34unlock8
a32WorkComputerUse keyboard & Mouse16:36unlock8
a50Leave the officeDoorExit16:41lock2
a60Leave the officeDoorExit16:49lock7
a50WorkComputerUse keyboard & Mouse16:54unlock8
a47WorkComputerUse keyboard & Mouse17:00unlock8
a52Leave the officeDoorExit17:00shutdown11
a32Leave the officeDoorExit17:04shutdown11
a9Leave the officeDoorExit17:21lock3
a50Leave the officeDoorExit17:29lock2
Table 8. Number of occurrences, by choreography example.
BeginEnd12345678910111213
08:0008:15-------------
08:1508:30-------------
08:3008:4531-----7-----
08:4509:0012-----2-----
09:0009:15212----2-----
09:1509:301------1-----
09:3009:452------2-----
09:4510:003------6-----
10:0010:15-3-----1-----
10:1510:30111----3-----
10:3010:451-2----3-----
10:4511:0022-----5-----
Table 9. Example of electricity consumption, in kWh, per choreography.
BeginEnd12345678910111213
08:0008:15-------------
08:1508:30-------------
08:3008:4521.37.1-----42.6-----
08:4509:009.919.8-----59.3-----
09:0009:1517.68.817.6----44.0-----
09:1509:3010.7------64.3-----
09:3009:4518.4------73.6-----
09:4510:0017.3------80.7-----
10:0010:15-31.8-----127.2-----
10:1510:3010.010.010.0----130.0-----
10:3010:458.0-16.0----112.0-----
10:4511:0016.316.3-----138.4-----
Table 10. Example of daily consumption, in kWh, per choreography.
Choreography IDDay 1Day 2Day 3Day 4Day 5Total
0122.718.316.820.914.793.3
0216.115.021.717.817.988.4
0315.225.923.524.020.0108.5
049.59.613.4-8.941.5
0531.661.159.737.236.6226.2
0644.144.649.345.727.8211.5
07155.0154.6151.0154.4154.5769.5
089.0----8.9
0910.4--13.8-24.2
1015.09.341.713.011.289.2
11-12.5-9.5-21.9
12---7.5-7.5
13------
TOTAL327.3350.6377.2343.9291.61690.7
Table 11. Potential savings by choreography.
Choreography IDPotential Savings
1Very low
25 Wh per monitor
315 Wh per monitor
420 Wh per monitor and 50% consumption per computer
520 Wh per monitor and 50% consumption per computer
6100% consumption per computer
7Very low
8Need more information
9Very low
10Very low
11Very low
12Very low
13Very low
Table 12. Identified targeted choreographies.
TargetDescriptionChoreography
ATurn off the computer during the night period (20:00–7:00) (during weekdays)6/10
BTurn off the computer all day (during the weekend)6/10
CStand by the computer during lunch period (12:00–14:00) (during weekdays)5/9
DTurn off the lights during the night period (20:00–7:00) (during weekdays)8
ETurn off the lights during the lunch period (12:00–14:00) (during weekdays)8
Publisher’s Note: MDPI stays neutral with regard to jurisdictional claims in published maps and institutional affiliations.

