Abstract
PV-Battery systems are commonly sized based on the lowest solar radiation of the site of implementation. This implies that during days of high solar radiation excess energy is available. This study investigated the potential of excess energy for thermal storage from PV systems for a case of a rural health center. The system components of a typical PV installation in a rural health center in Tigray, Ethiopia, were considered. The electricity load profile of the health center and solar radiation data available from Mekelle city were used as inputs to a TRNSYS model. Analysis of excess energy in the system at hourly and ten-minute time intervals was conducted. The analysis results indicate that during the months from September to May excess energy was available that could be thermally stored and utilized. During these months, the excess peak power ranged from 737 to 841 W and daily average excess energy ranged from 2070 to 2959 Wh. In contrast, in the months from June to August, no excess energy was available due to low solar radiation.
1. Introduction
Providing electricity to health facilities through renewable energy contributes to attaining sustainable development goals in clean energy (SDG 7) and in ensuring good health (SDG 3). The World Health Organization (WHO) and other international organizations are emphasizing the provision of electricity to healthcare facilities [1]. One of the twelve programs of the Sustainable Energy for All (SEforALL) initiative is powering healthcare. In 2021, multilateral action aimed at providing 25,000 healthcare facilities with clean energy was launched [2]. The International Renewable Energy Agency (IRENA) is also focusing attention on the use of renewable energy technologies in healthcare facilities, and organized an international conference on Renewable Energy Solutions for Healthcare Facilities in 2018 [3]. Solar PV is among the renewable technologies appropriate for implementation of such applications.
One area of application for solar PV in developing countries is providing electricity to rural health centers. Reports by the International Energy Agency [4] and World Health Organization [1] emphasize the need for providing electricity to health facilities using PV systems. Al-Akori [4] describes common electricity loads, PV components, and system configurations in health facilities in developing countries. Some experiences from countries such as Haiti, Guyana, Ethiopia, Tanzania, and Uganda, in addition to international organizations such as UNICEF, USAID, and GIZ, are presented. The report by WHO presents a review of the status, significance, challenges, and measurements relating to energy services for health facilities in rural areas. Both reports emphasize the importance of the PV system as a form of renewable energy in contributing to the improvement in communities’ health. Awareness of the importance of PV and the support of international organizations is growing; hence, further deployment of this technology is expected in the future.
A challenge in off-grid and mini-grid PV systems is energy storage. Battery storage is the common means of energy storage. Due to the high cost of battery storage, recent studies have looked at means of thermal energy storage (TES). TES, in grid-connected PV systems, has been studied for the purpose of increasing self-consumption and reducing energy costs. In the case of off-grid PV systems, the aim is to increase the performance and energy yield of the system. The following paragraphs describe current studies on TES included in PV systems.
A previous study compared a house with a 560 Wp PV system in Spain, having a 140 L TES tank, to a system without energy storage [5]. Energy cost savings of up to 58% were obtained for the system with TES. A similar study conducted in different European cities concluded that significant energy savings can be gained by introducing thermal energy storage in PV systems [6]. Residential apartments, office buildings, and hotels with a grid-connected PV (5–20 kWp) and heat pumps were considered in the study. The study considered the use of PV or electricity from the grid during off-peak periods as an input to thermal energy storage. It was found that energy cost savings of 30–35% in Helsinki, 49–55% in Strasbourg, and 83–90% in Athens were possible. Both studies suggest model predictive control, based on forecasting in advance all energy inputs into the system over a given period of time, for successful results.
A simulation study on a home PV system in Sweden, which compared thermal storage with battery storage, was reported by Thygessen and Karlsson [7]. The system was a grid-connected 5.19 kWp PV with electricity storage of 48 kWh and 12 V batteries. The thermal storage was a 185 L hot water tank. The study found that both storage types resulted in similar self-consumption but the battery storage was twice as expensive as the thermal storage. A domestic roof-top PV installation in Australia [8] yielded a reduction of more than 80% in purchased grid electricity with appropriate control methods. Yildiz et al. [9] examined the potential excess energy from household PV systems in Australia. The study analyzed the potential of excess energy from the domestic electric water heating systems using the TRNSYS energy modeling tool. According to the study, excess energy from a 4.5 kWp PV system can provide about 48% (about 2.8 kWh) of the daily heating of a typical household, which implied a 28% increase in self-consumption.
A study on a grid-connected school in South Africa indicated that installing a PV system and employing thermal energy storage could reduce energy costs [10]. The school under study had 34 class rooms and about 1000 students and staff. The grid electricity bill was not based on a flat energy rate; rather, it was based on the basic energy used and the monthly peak power demand. This meant that peak power, even for few minutes, would result in a high electricity bill. The study simulated a PV system having 35 kWp power and already existing electric water heating tanks (3 × 2 kW and 4 × 3 kW) as energy storage. Various control mechanisms were analyzed to minimize the overall energy use and reduce the peak power. Results of the analysis showed that the energy cost of the school could be reduced by 30%.
PV-Battery systems for off grid applications are normally sized considering the lowest solar radiation of the installation site. The limiting factor in sizing the system components is the cost of batteries for energy storage. This implies that during the days of high solar radiation there will be excess energy. The advantage of including TES is the utilization of energy during day time which would otherwise be wasted. Bhayo et al. [11] suggested the use of excess energy during the day for water pumping to elevated storage during the day. The study indicated that, for the solar radiation conditions of Malaysia, a PV system with 2.44 kWp, and battery storage of about 3.5 kWh, water pumping capacity of about 360 m3/day to 6 m elevation was possible. There is a lack of studies on TES implemented in off-grid PV applications. It is expected that the use of the control methods reported for grid-connected PV with TES can be adapted to off-grid PV systems. The aim of this study was to develop a methodology to determine excess power for an off-grid PV system with a case study in a rural healthcare facility. The excess power could then be stored in thermal storage, such as hot water, to be utilized at the healthcare facility, thereby increasing the overall performance of the PV system.
2. Materials and Methods
2.1. Description of Health Center PV System
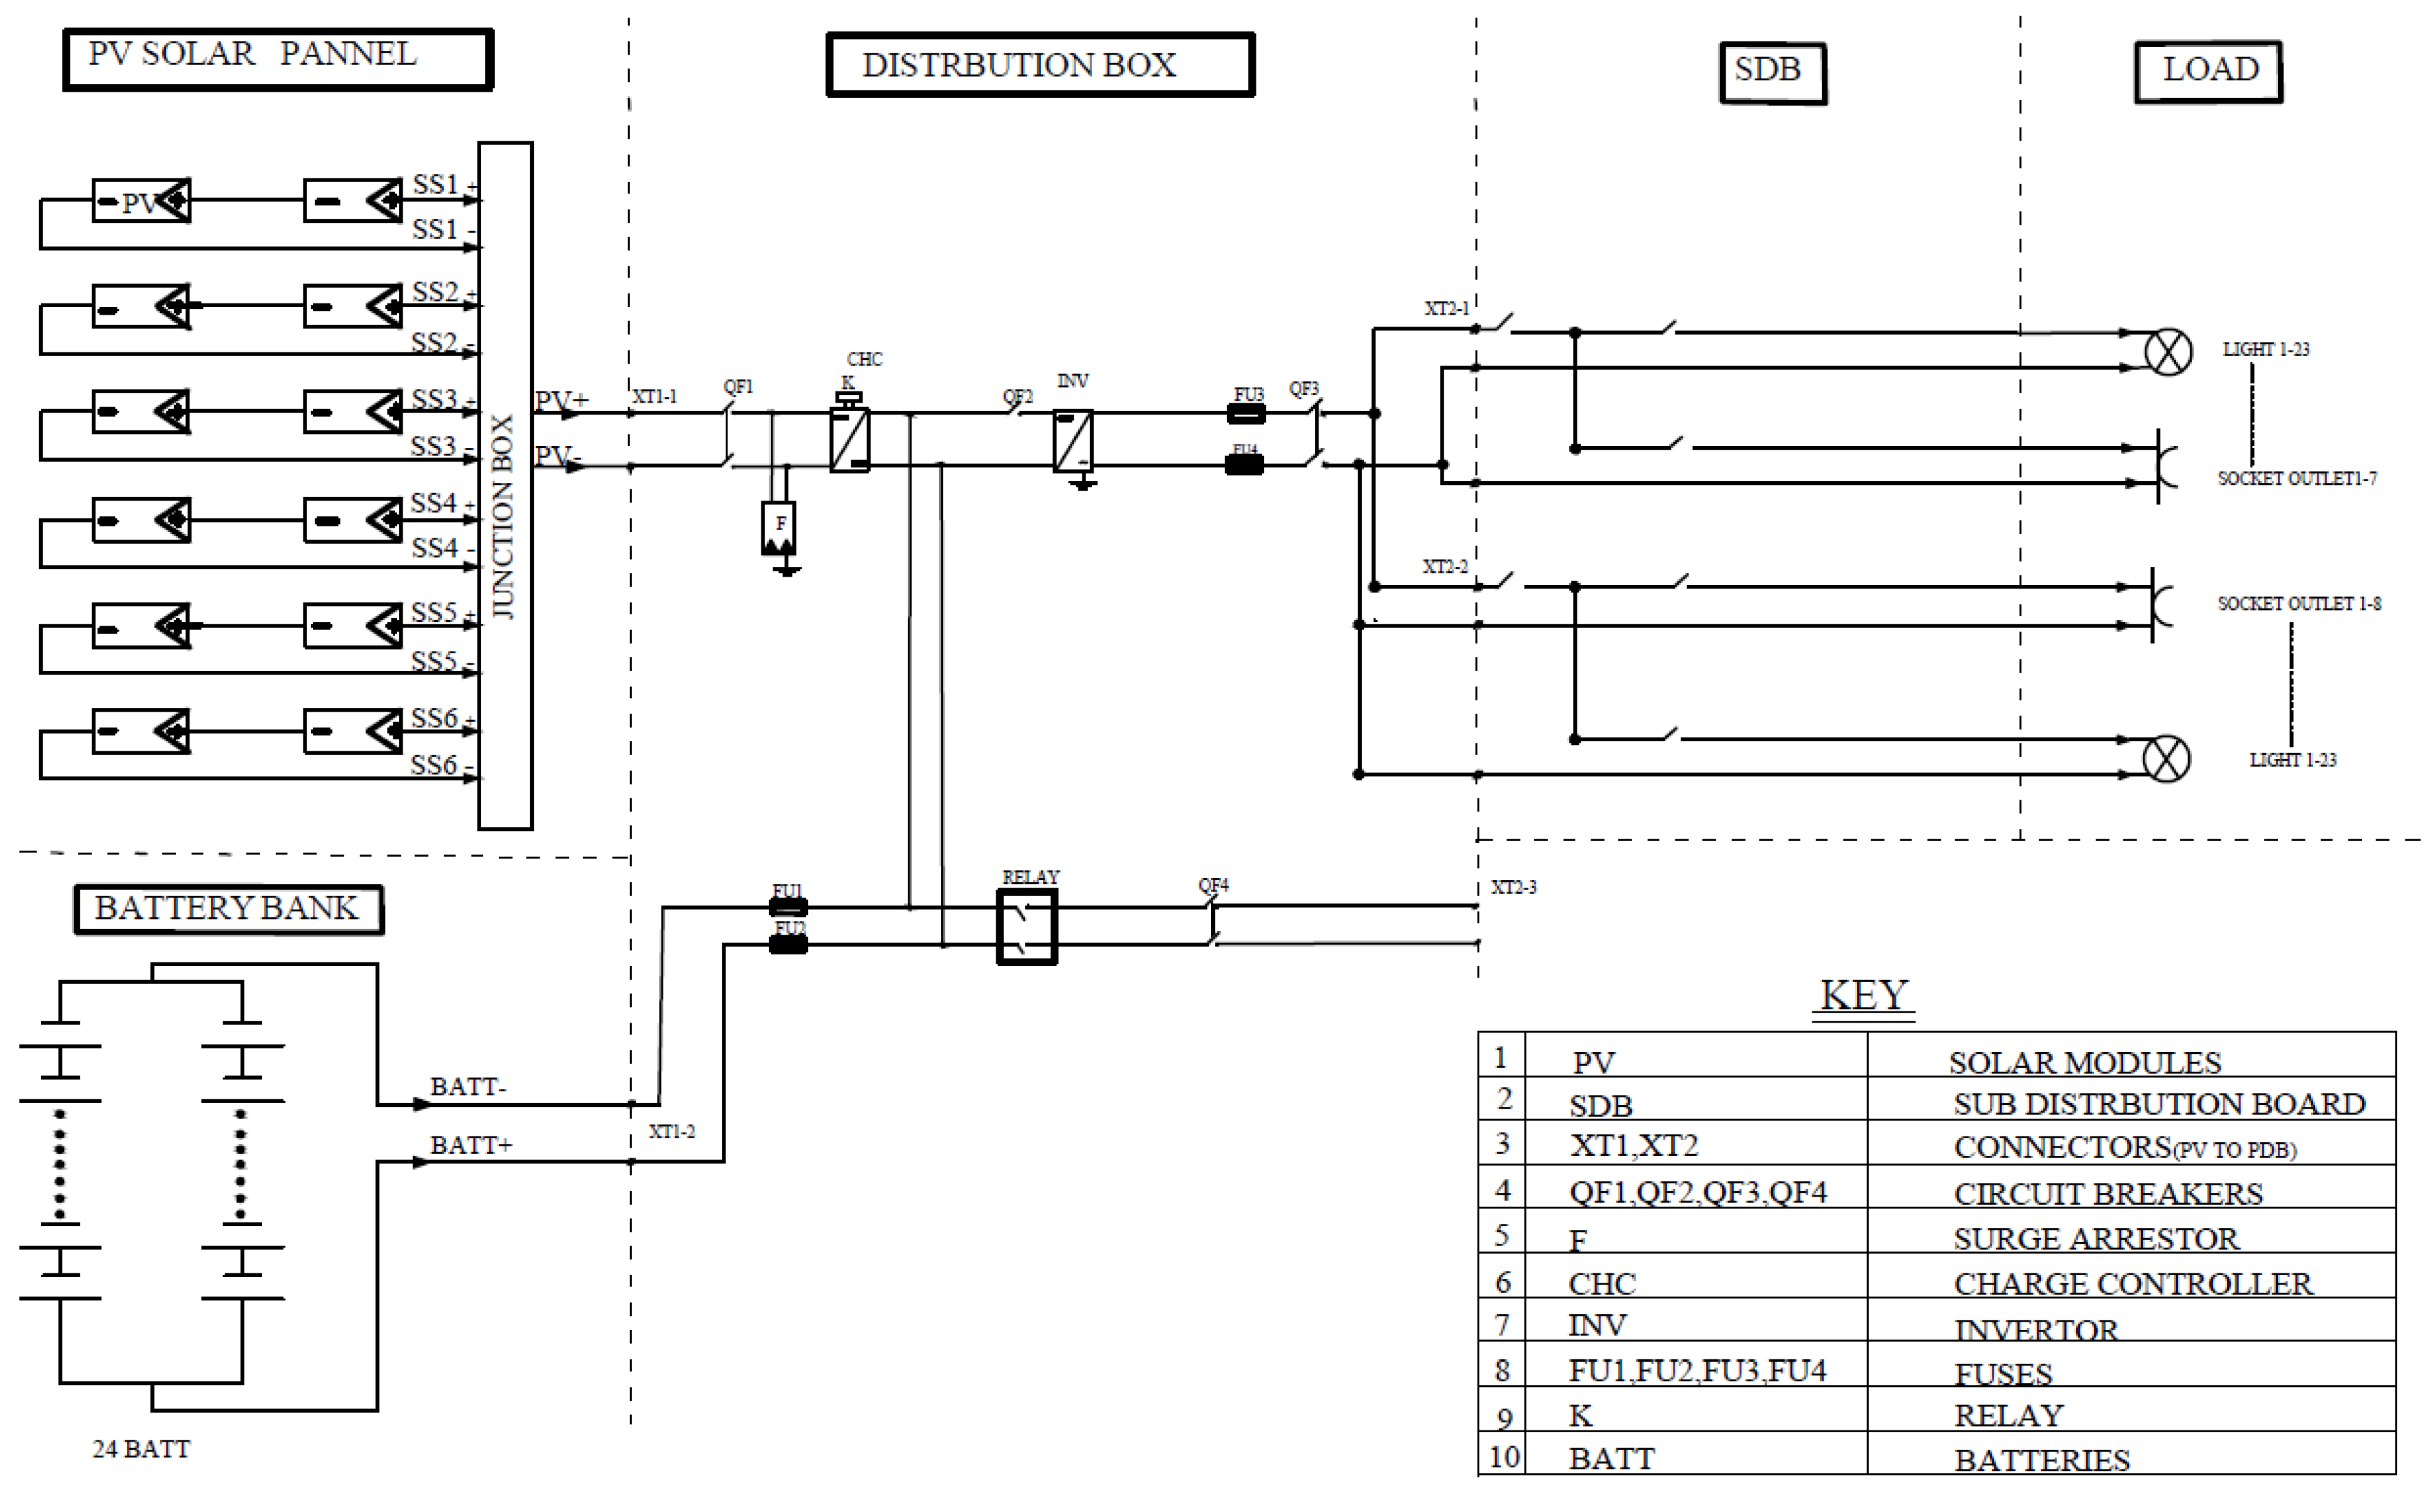
A country-wide project implemented in Ethiopia in 2016/17 installed PV systems in 300 rural health centers and more than 1000 health posts [12]. The client of the project was the Federal Ministry of Health (FMoH), and the contractor was Zhejiang Holley International with its local partner ACME Engineering. The Ethiopian Institute of Technology-Mekelle (EiT-M), Mekelle University, supervised the installation work on behalf of FMoH. The rural health centers and health posts were distributed across all regional states. The system for the health centers comprised 2040 Wp PV and 15,360 Wh battery storage. The system for the health posts comprised a smaller 450 Wp PV and 7200 Wh battery [12]. The PV system for the health centers was considered in this case study. The breakdown of the estimated electricity load in different rooms in the health center is shown in Table 1. The loads are mainly for lighting, refrigeration, and clinical instruments. Based on the estimated load, the system was sized to have 12 modules of a 170 Wp PV array and 24 units of 2 V, 320 Ah battery bank storage. The system components, including the charge controller and inverter, are shown in Table 2. The diagram showing the main electric circuit lines connecting the components is shown in Figure 1.

Table 1.
Estimated load for health centers [12].
Table 2.
Components of the health center PV system [12].
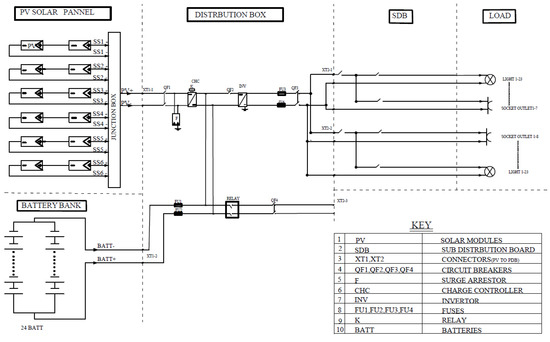
Figure 1.
Circuit diagram of the health center PV system [12].
2.2. Solar Radiation Data
Solar radiation data from Mekelle city were used to represent health center sites in the Tigray region that are located a short distance from the city. Previous reports assessed the solar energy of four sites, of which, one was located at Mekelle University campus [13,14]. Recently collected solar radiation measurement data were also employed [15]. Two sets of solar radiation data were employed in modeling the PV system. The first consisted of the data that provides the typical hourly variation in global solar radiation for each month in a year. These hourly radiation model data represent an average value for a month based on measurement data for the years 2011 to 2015 [13,14]; hence, instantaneous variations are smoothed over an hour. The second dataset measured global solar radiation at ten-minute intervals for one year in 2019 [15], to analyze the effect of short-term variations.
2.3. TRNSYS Model
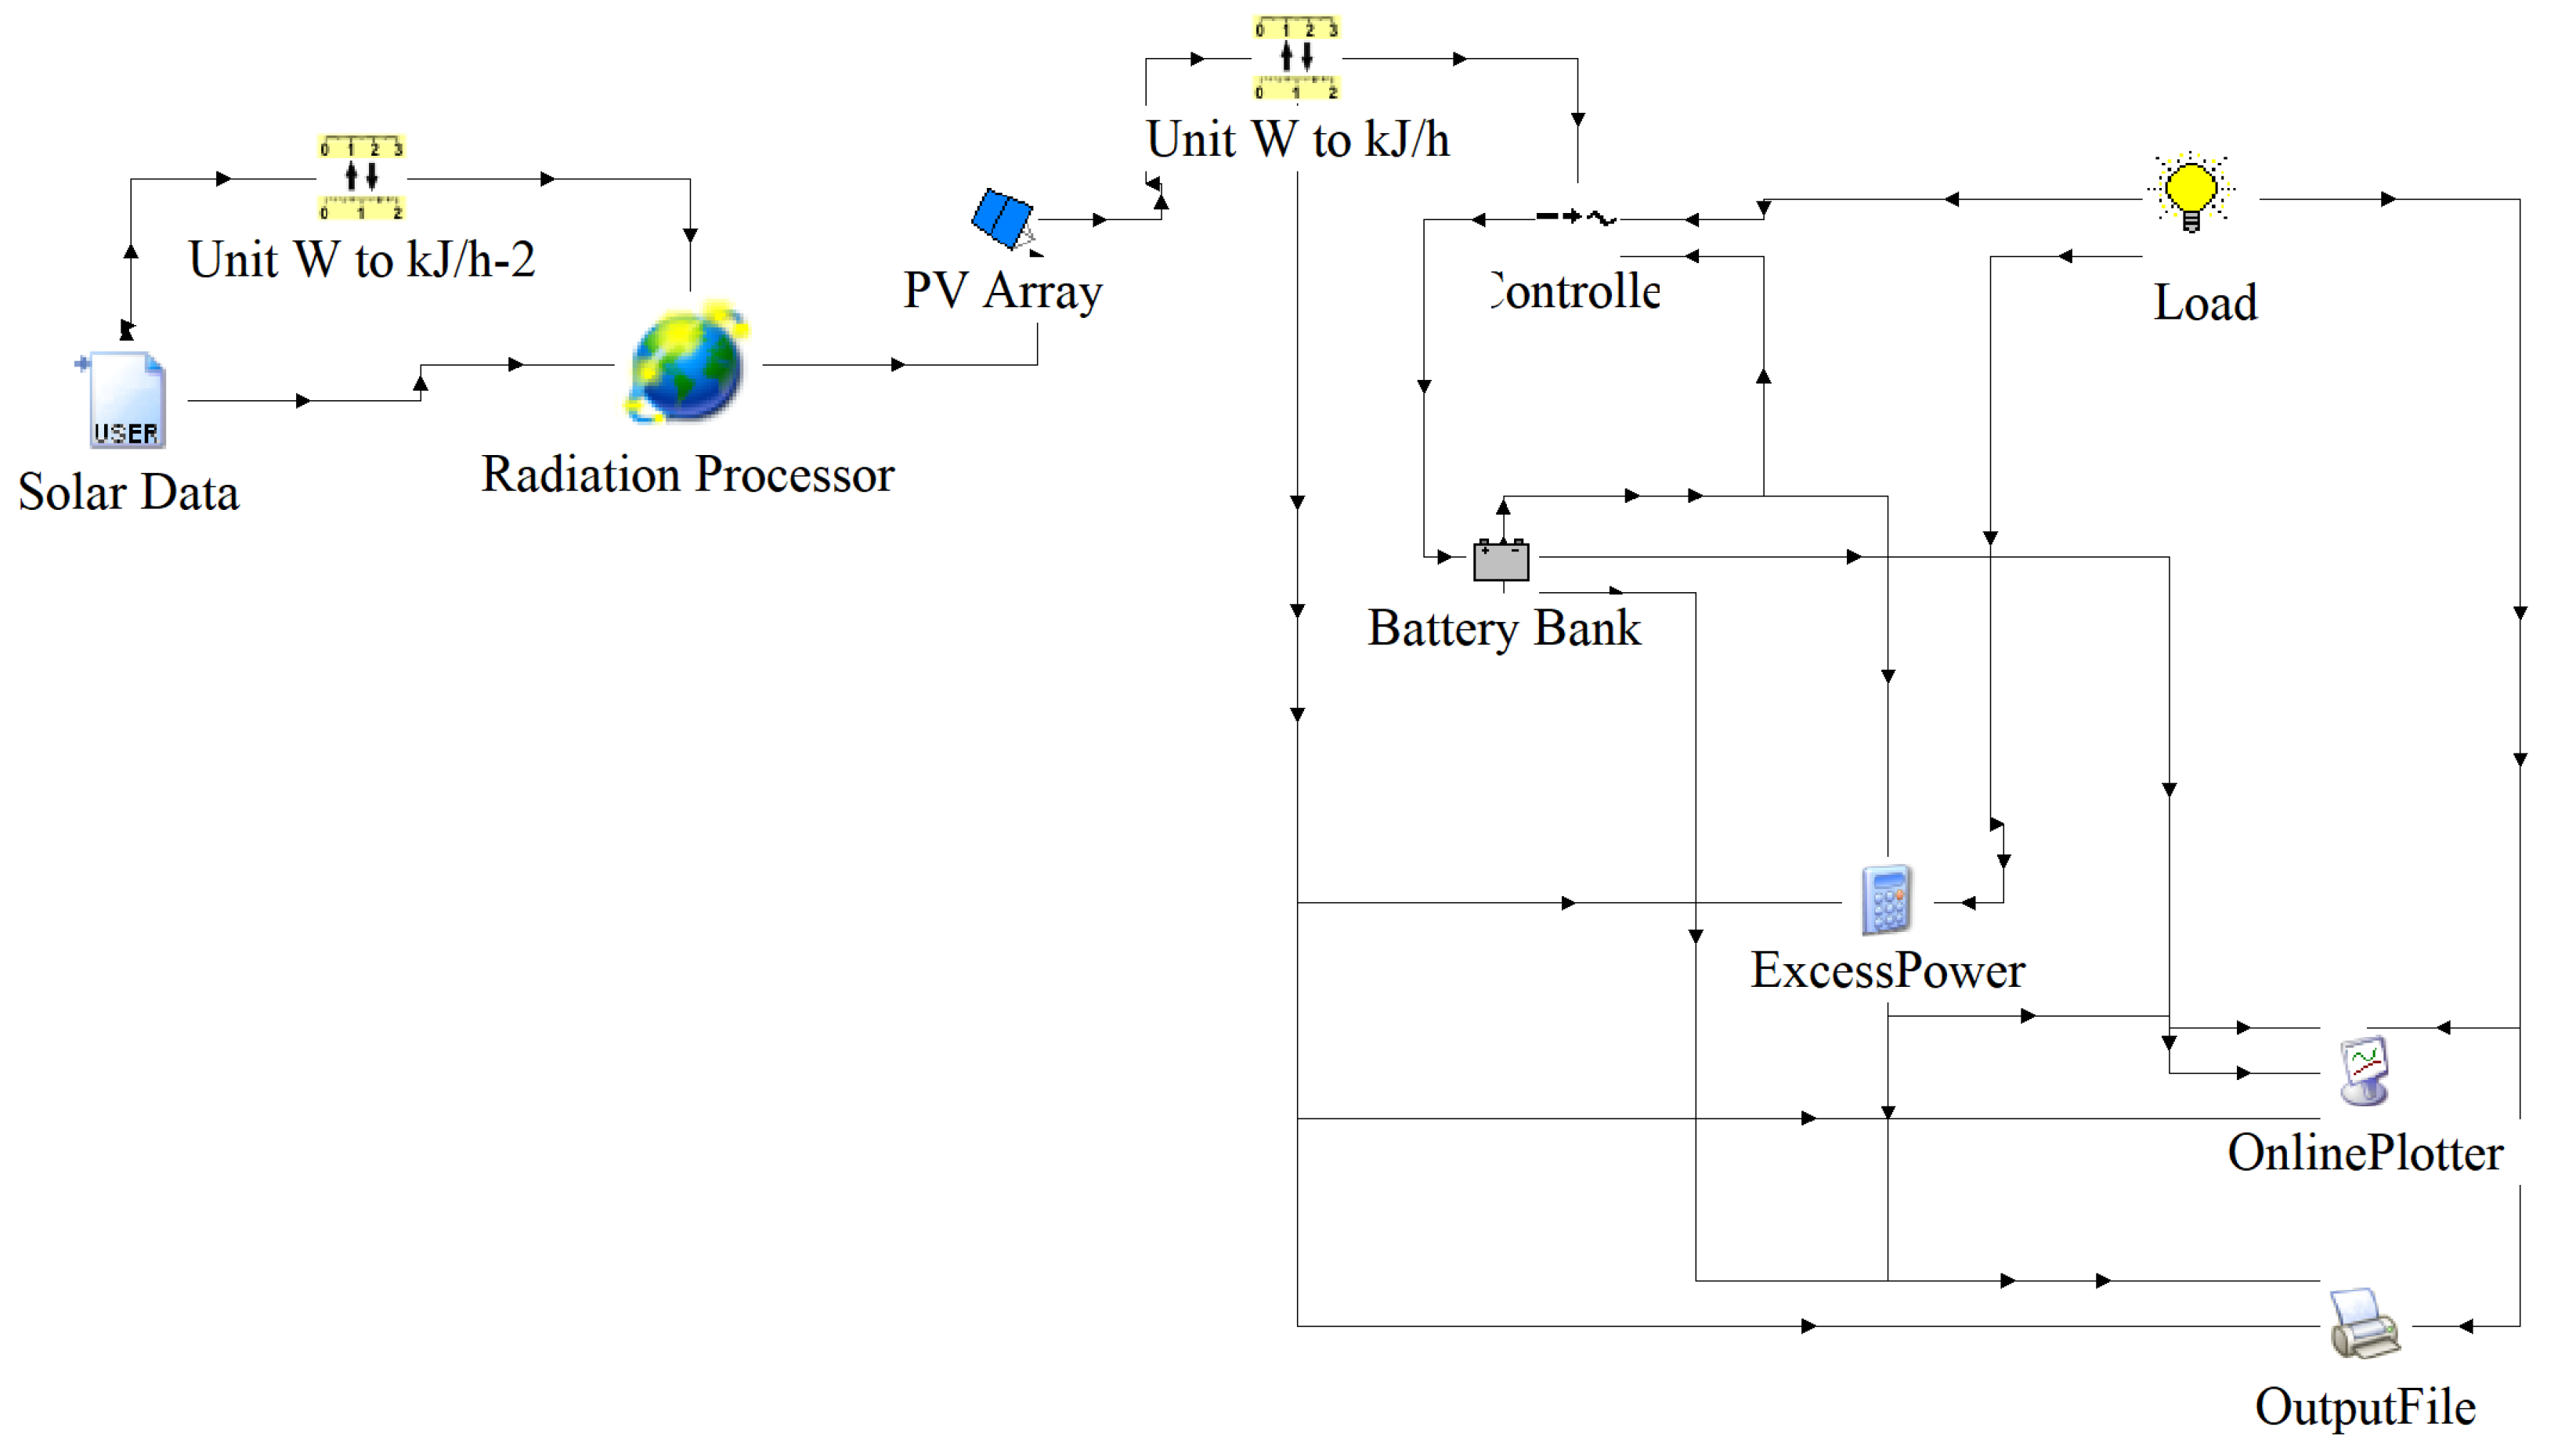
Considering the system diagram of Figure 1, the components were modeled in TRNSYS software [16], as summarized in Table 3 and shown in Figure 2. Global horizontal solar radiation data of Mekelle city, as explained in the previous section, were used in the modeling. A radiation processor calculated the incident radiation on the PV panel, which was tilted at 15° and assuming a surface albedo of 0.2. The PV array comprised crystalline modules having a maximum voltage of 18.4 V and a maximum current of 9.24 A, set up with two in series and six in parallel. A battery bank having 24 units of 2 V and 320 Ah, and a regulator/inverter monitoring the state of charge, were modeled as energy storage.
Table 3.
TRNSYS model description.
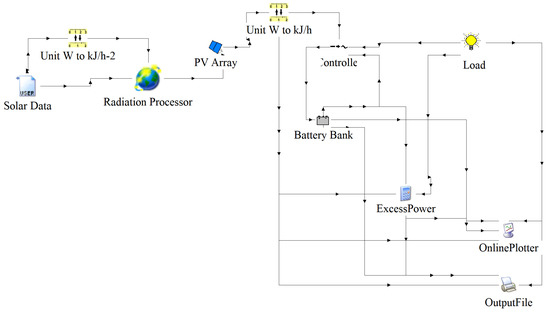
Figure 2.
TRNSYS model of the health center PV system.
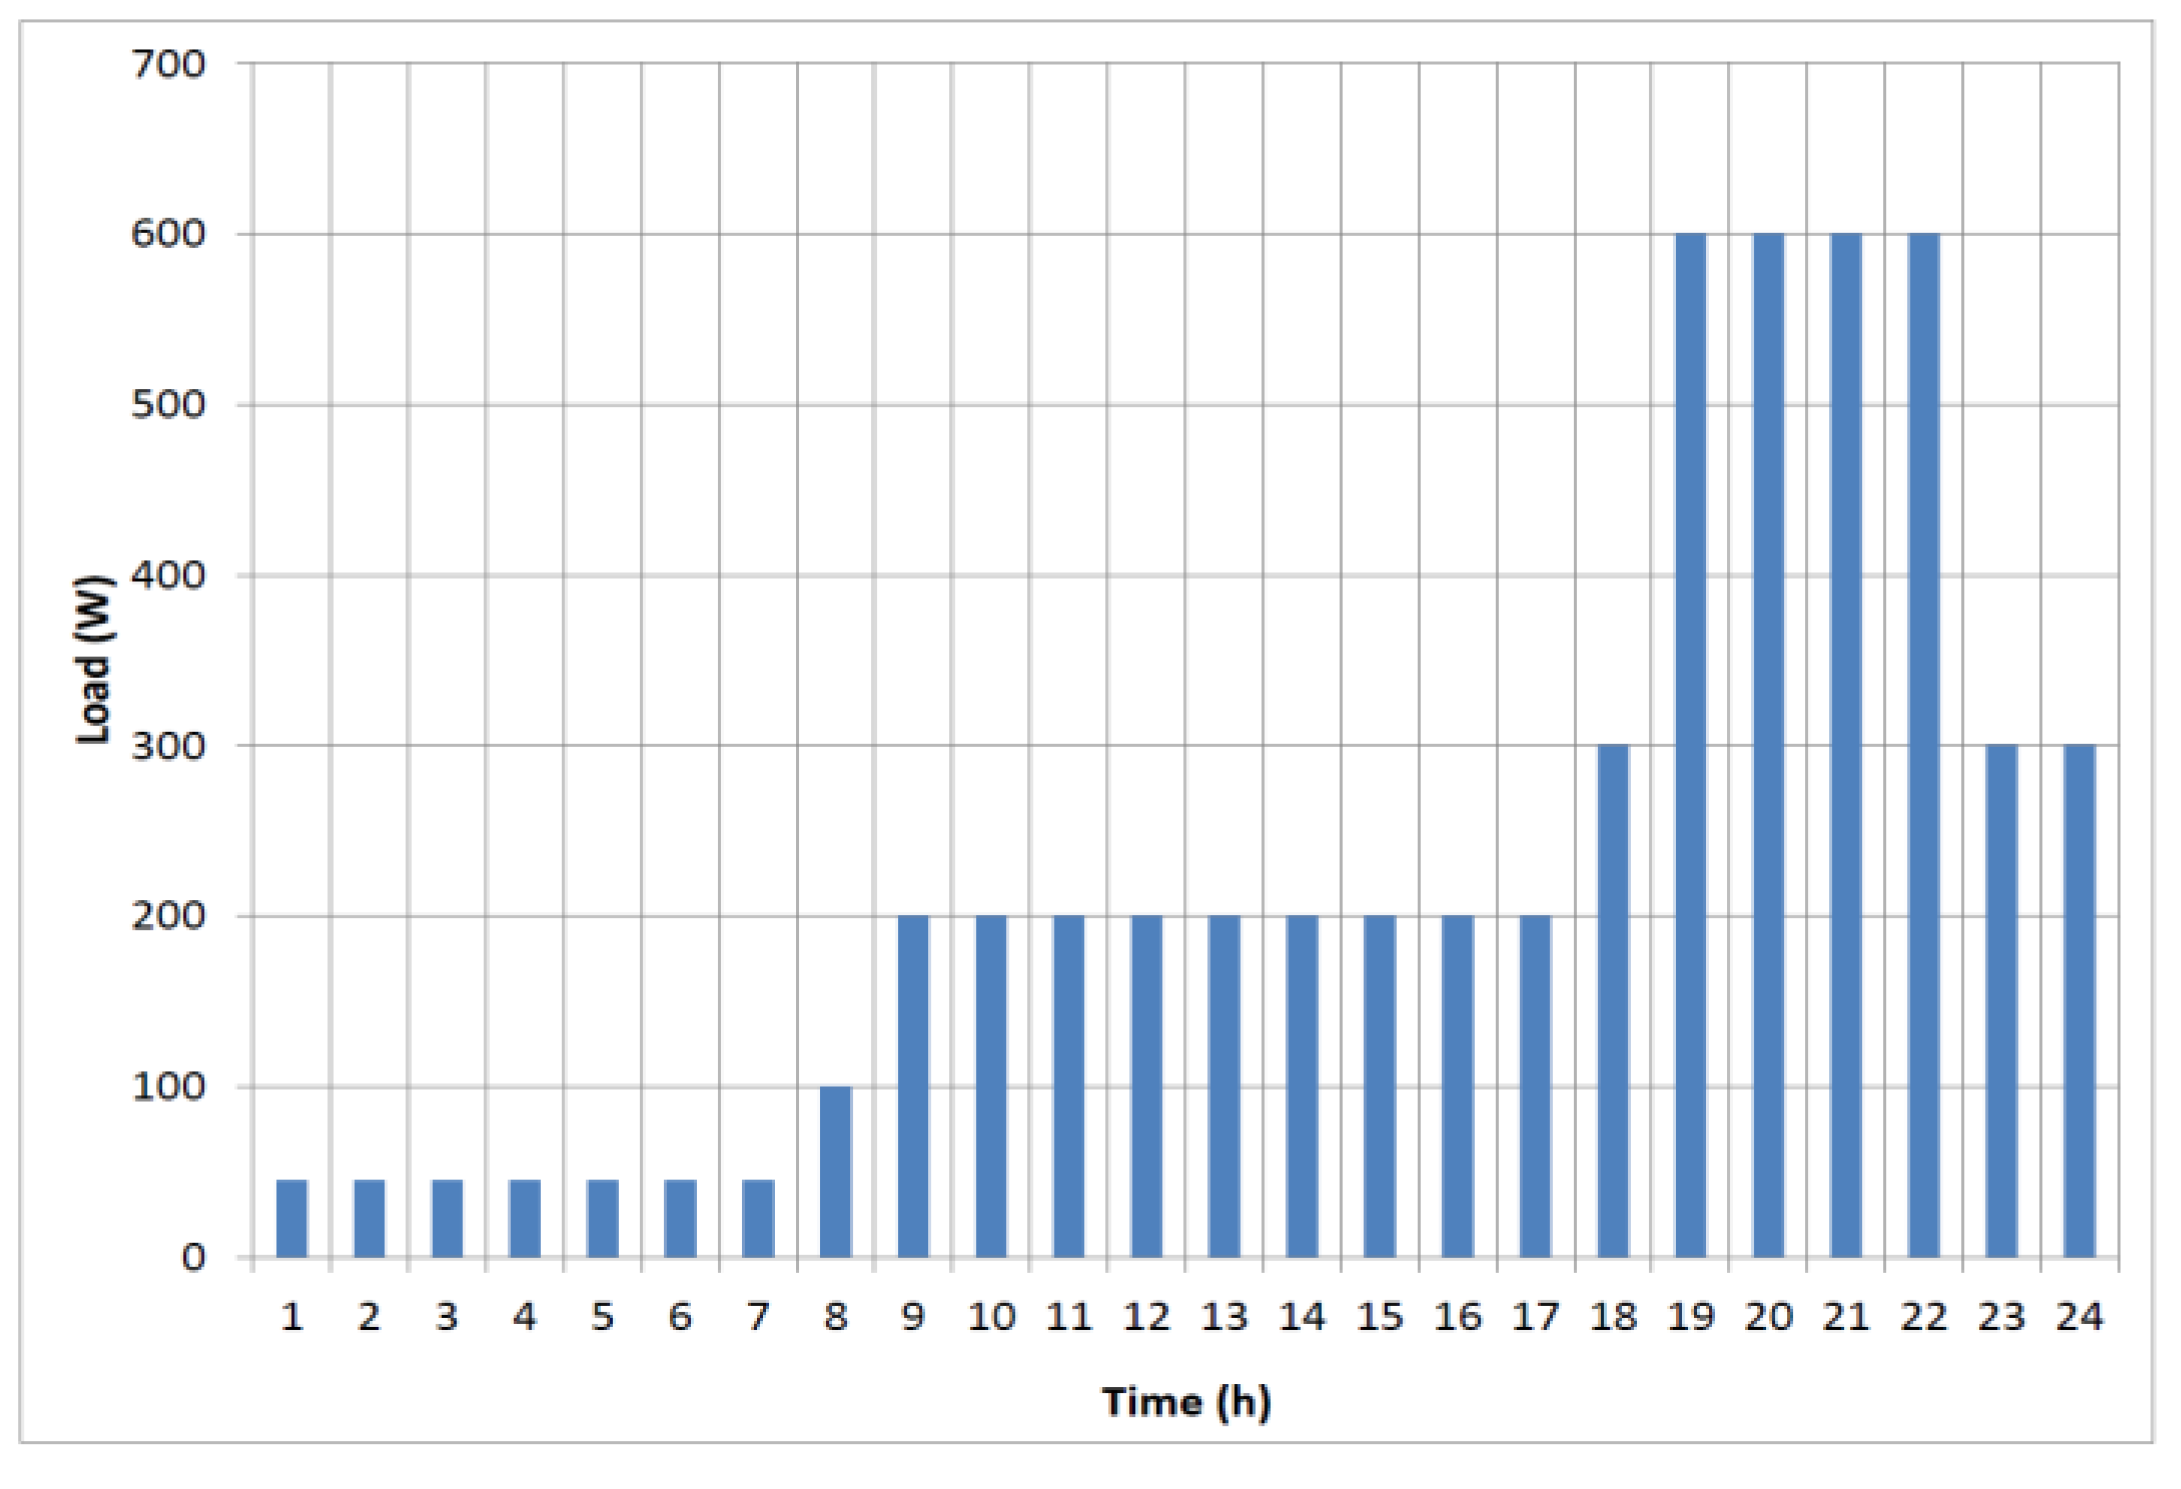
The hourly load was modeled based on the estimates in Table 1 and considering the time at which the electricity load will be needed. It was considered that peak load occurs in the evening, when all the lighting and instruments will be needed at the health center. Conversely, low load was considered to be during the night, and moderate load was assumed during the day. Figure 3 shows the hourly load distribution considered for the analysis. The peak power was 600 W in the evening, day time power was 200 W, and night time power was 45 W. In the transitions between night and morning hours, day and evening hours, and evening and night hours, intermediate load levels were assumed. Accordingly, the total daily energy demand was 5515 Wh. This value is higher than the estimated load during the sizing of the PV system indicated in Table 1. By employing this value in the modeling, conservative analysis results were obtained.
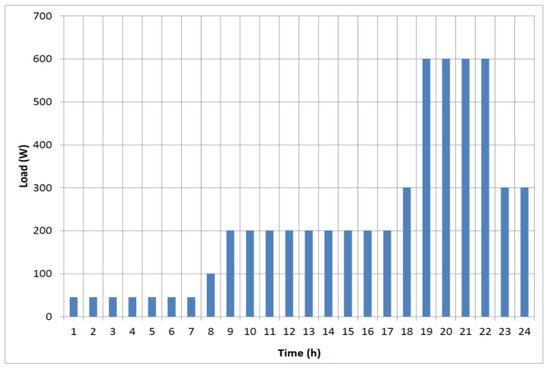
Figure 3.
Hourly electricity load distribution during a day.
2.4. Analysis Scenarios
The TRNSYS model was analyzed under different scenarios to investigate the potential excess power that could be available from the system. The scenarios were based on the battery charging current, the state of charge, and an additional power load during the day time. The analysis was for the full year at an hourly time step. The excess power in each hour was calculated as:
where PExcess is the excess power at the time step; PPV is the power generated by the PV array; PBattery is the battery power, which is positive during charging and negative during discharging; PLoad is the power going to the load; and PLoss is the power loss in the system.
PExcess = PPV − PBattery − PLoad − PLoss
The analysis scenarios were:
- Maximum charging current of 32 A and minimum state of charge 0.5 or 0.4.This scenario considered a maximum charging current of 32 A where the battery reached full charge from its lowest charge in ten hours. The regulator was set to control to a minimum state of charge 0.5 in one case and to 0.4 in another case.
- Maximum charging current of 16 A and minimum state of charge 0.4.This scenario considered a lower charging current and state of charge of 0.4 to determine the influence on the excess power.
- Additional load of 450 W during the day.After running the above two scenarios and observing excess power during the day time, this scenario was set with a 450 W additional load between 12:00 to 16:00. Figure 4 shows the hourly load for this scenario.
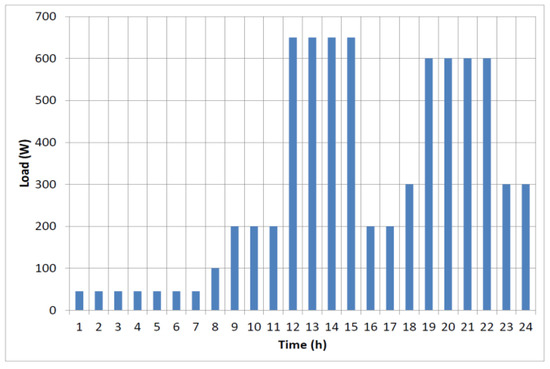 Figure 4. Hourly electricity load distribution with 450 W additional load.
 - Solar data with a ten-minute interval.The above scenarios employed hourly solar data; by comparison, this scenario used solar radiation data at ten-minute intervals. The maximum charging current was 32 A and minimum state of charge was 0.4.
3. Results and Discussion
The analysis results for each scenario were examined in days where the solar radiation at the site was high and low. Generally, solar radiation at the site is high during the dry and mostly clear months from September to May, whereas in rainy months from June to August the solar radiation is low. The analysis results shown below considered days in January and March with high solar radiation and days in July with low solar radiation.
3.1. Scenario 1 Maximum Charging Current 32 A, Minimum Sate of Charge 0.5 or 0.4
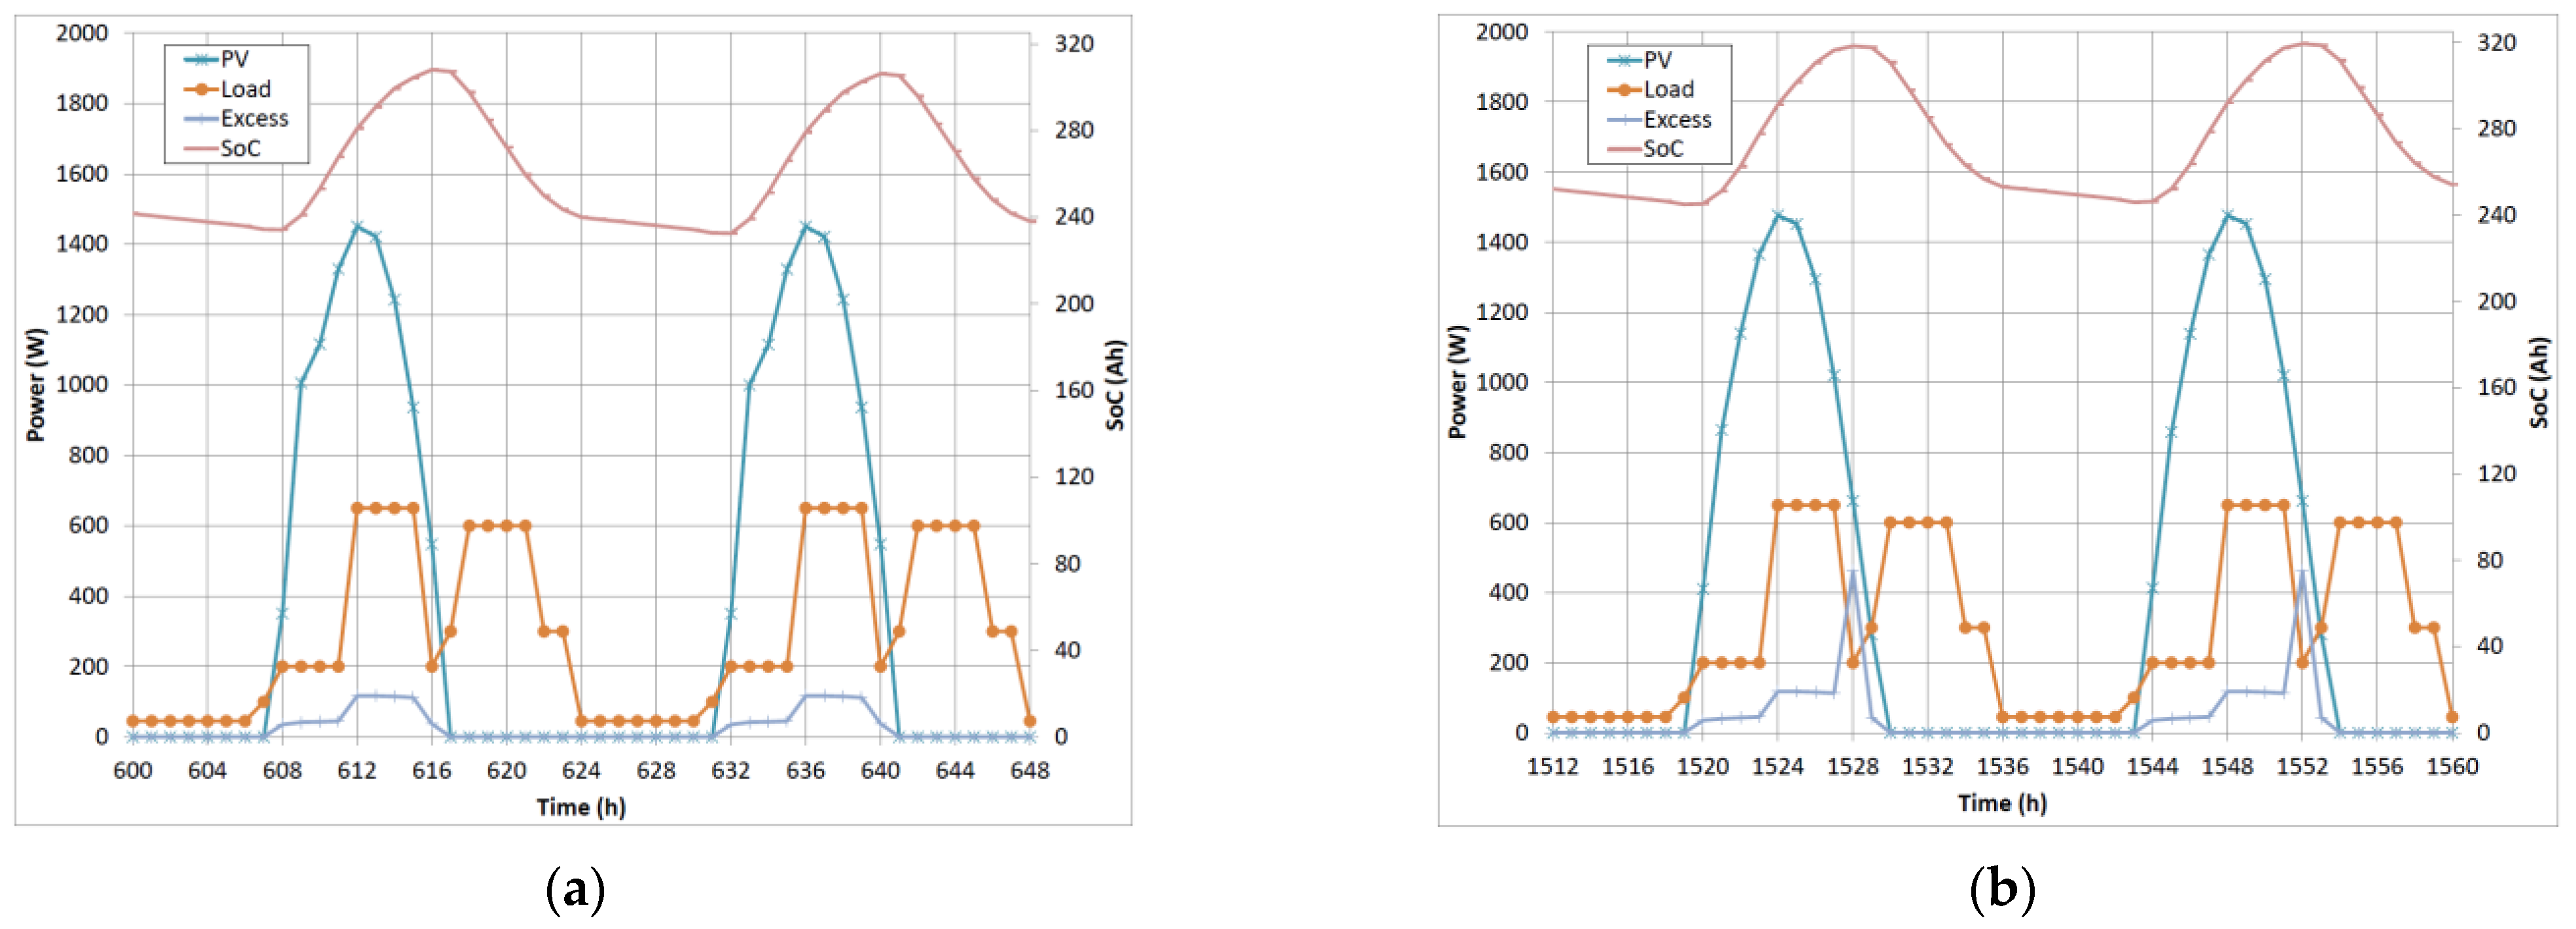
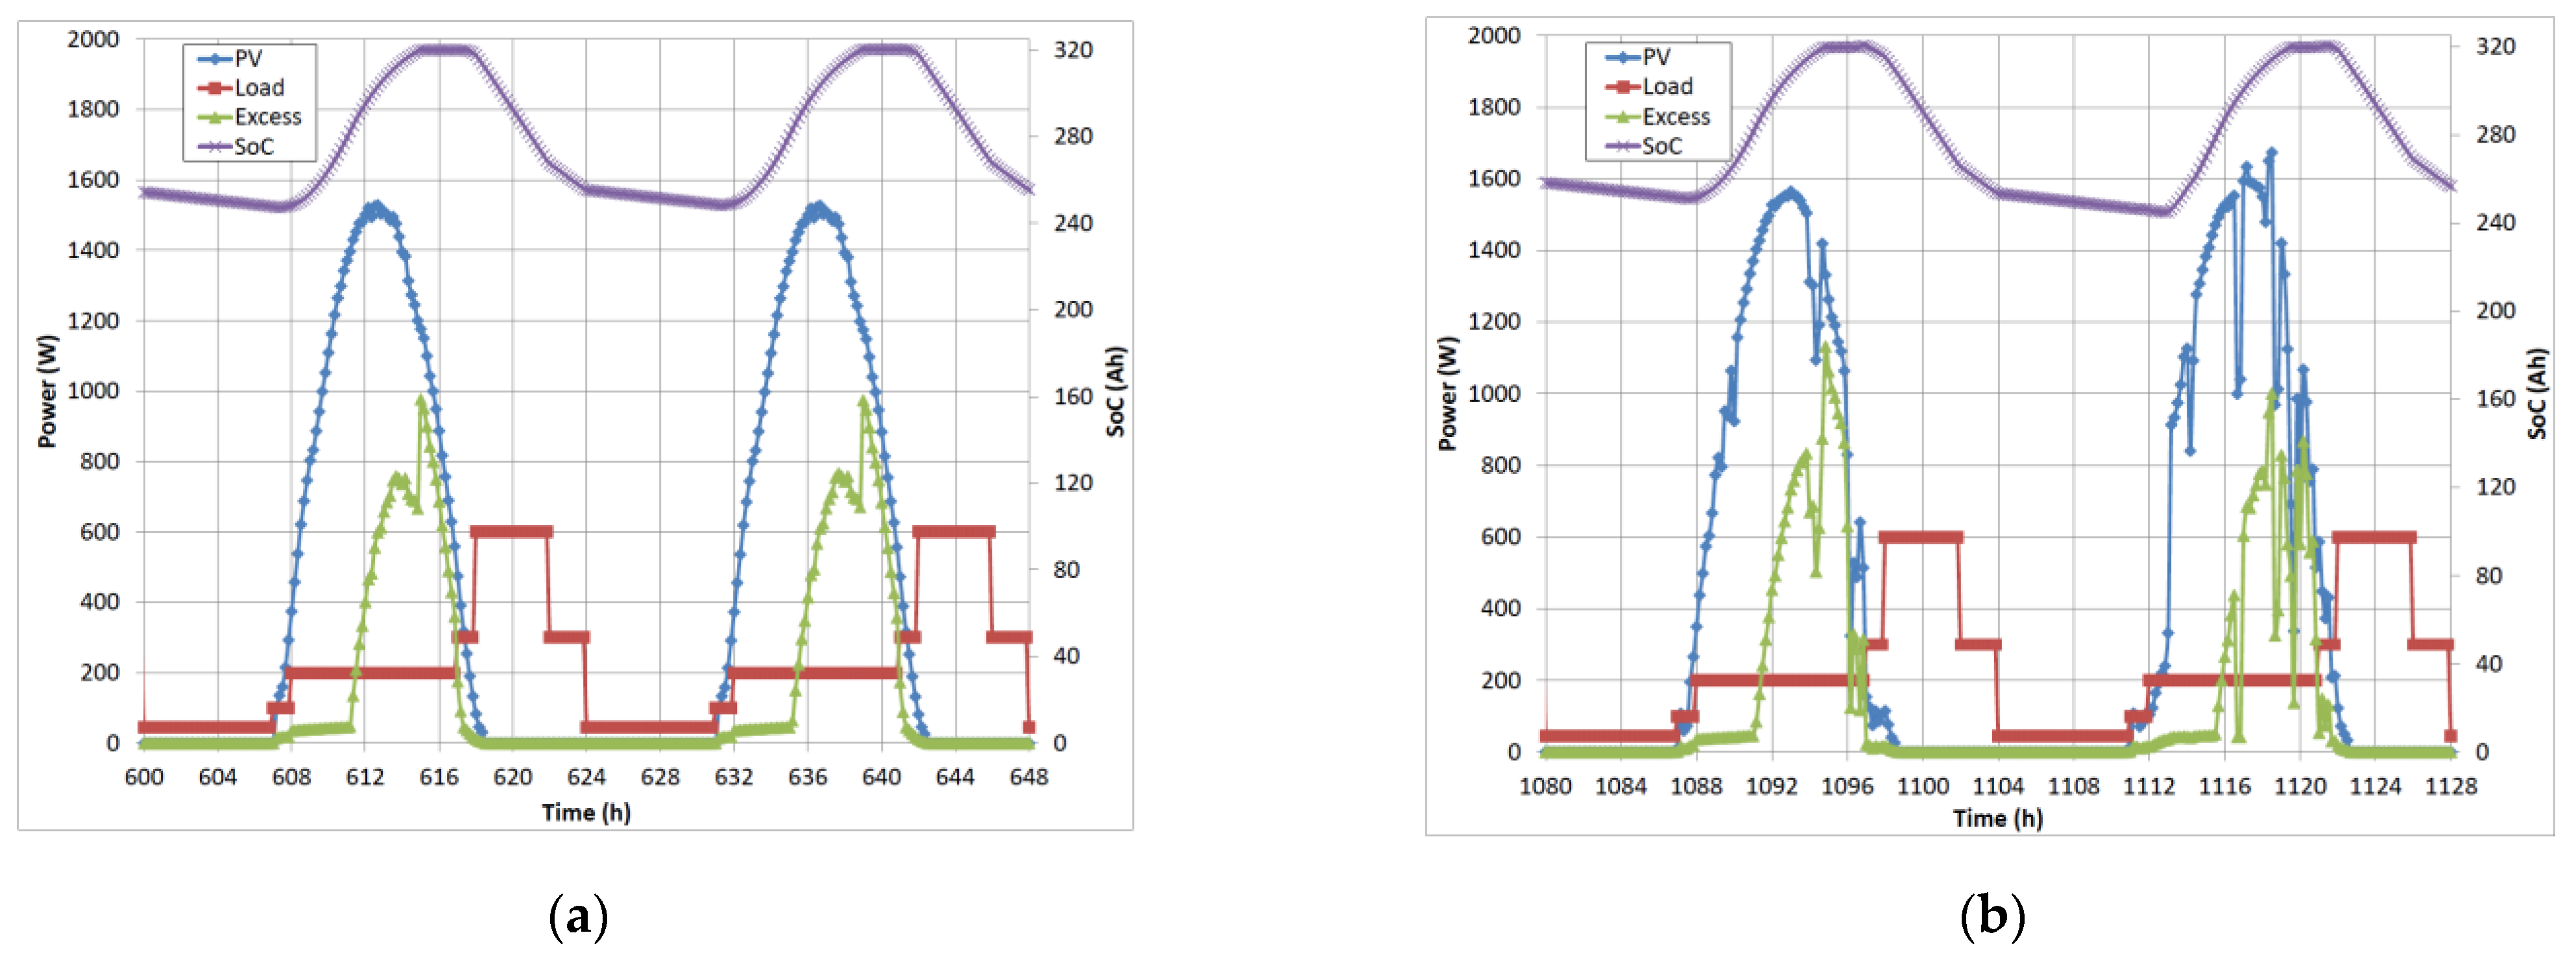
Figure 5a shows a plot for a typical week in January (25–31) with high solar radiation and Figure 5b closely examines two days. Excess power of a maximum from 550 to 750 W can be observed in the afternoon. A slightly higher excess power is observed in March (Figure 5c), of around 800 W in the afternoon. The state of charge (SoC) of the battery varies between 240 to 320 Ah (75–100%).
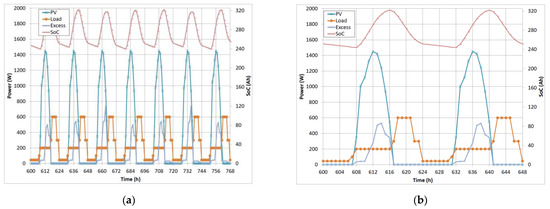
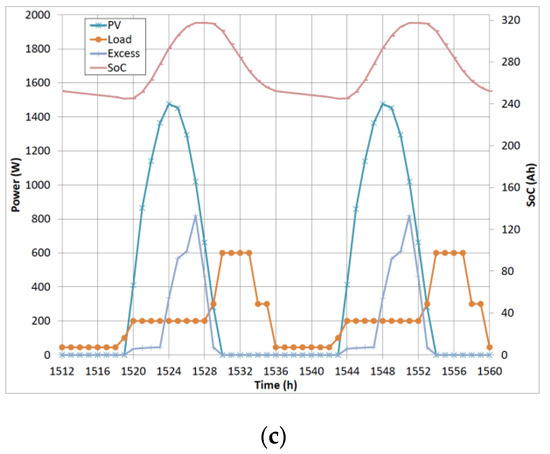
Figure 5.
Typical analysis results in January for: (a) a week and (b) two days; and in March (c).
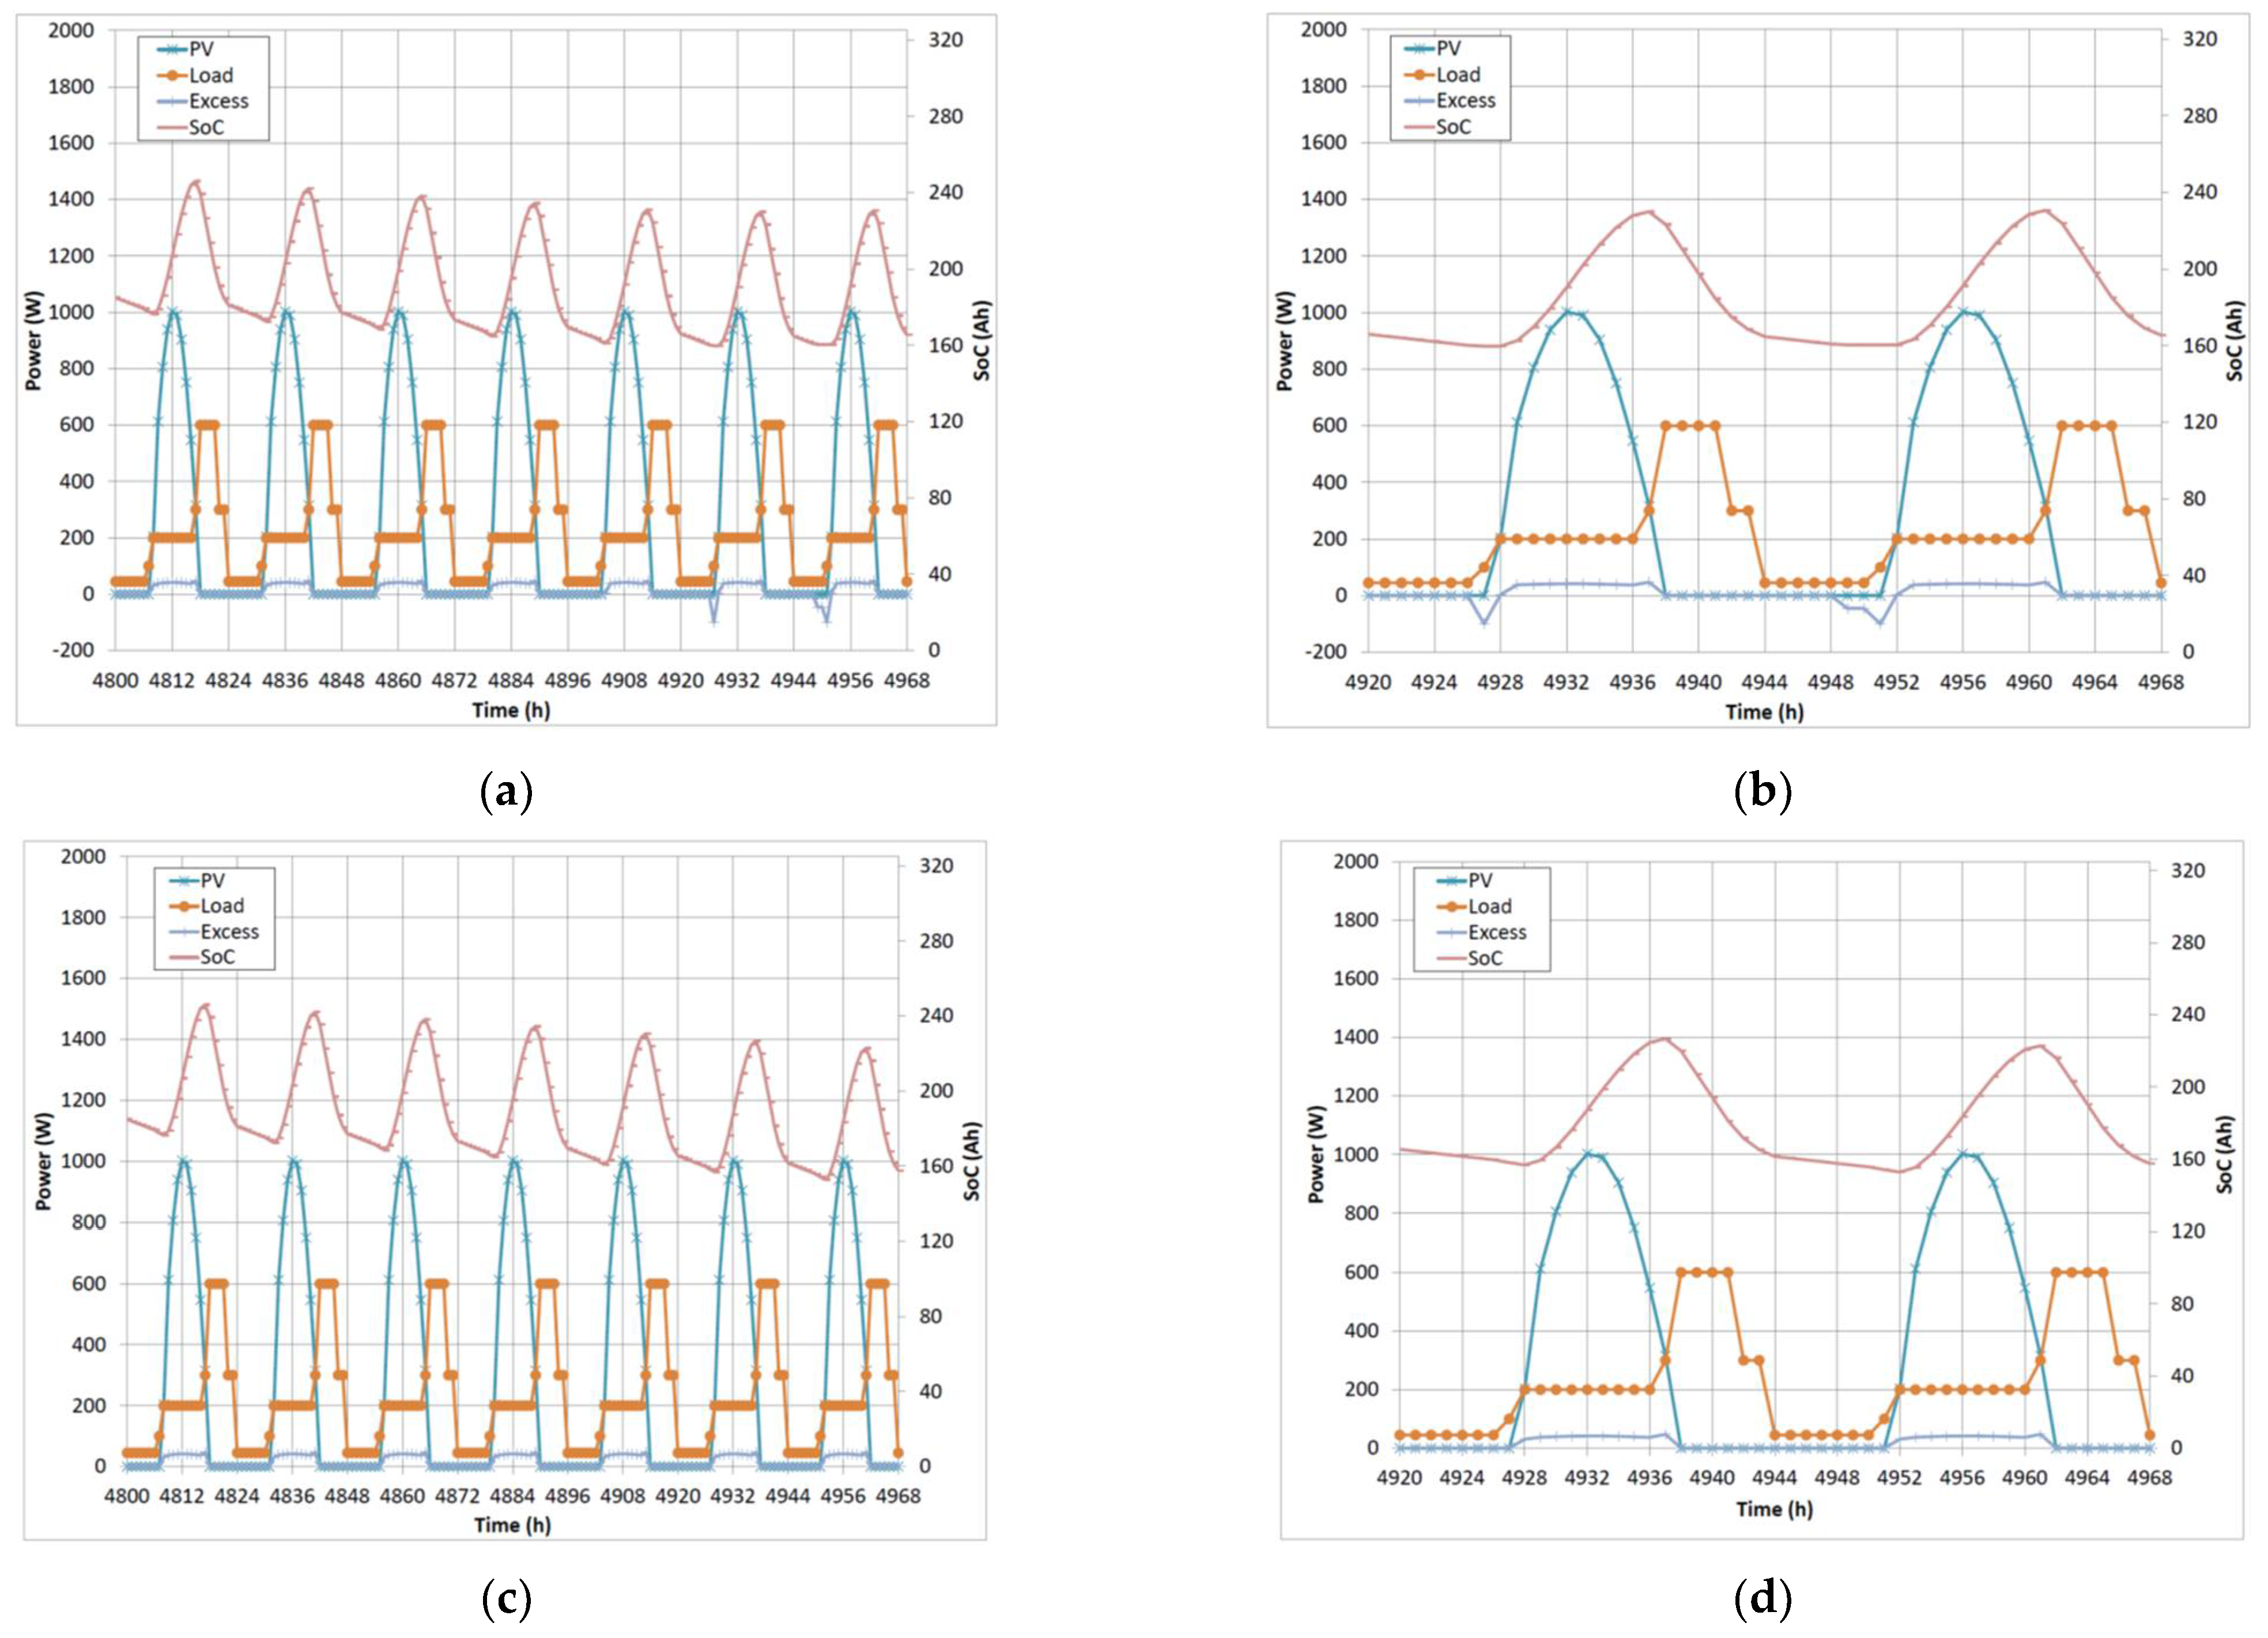
Figure 6 shows a typical week in July (19–25) in the low radiation season, when there was very low excess power during the day. This was expected as the system was sized based on the low solar radiation situation. On days 24–25 July, negative excess power was observed in early mornings (Figure 6a,b), indicating unmet load. With a lower state of charge of the battery, the unmet load situation can be avoided (see Figure 6c,d) with a minimum SoC of 0.4. The SoC of the battery varies between 160 to 225 Ah (40–70%).
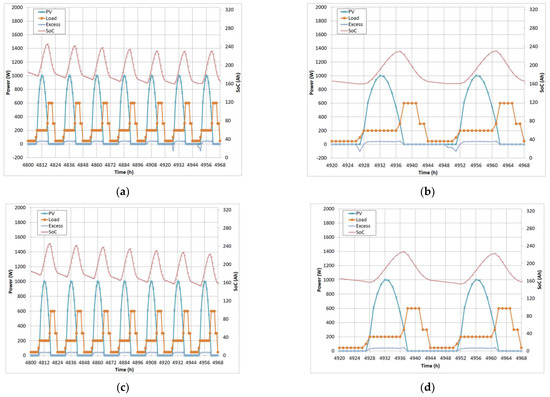
Figure 6.
Typical analysis results in July: (a,b) with SoC 0.5 and (c,d) with SoC 0.4.
A summary of the analysis results for each month is shown in Table 4. The excess peak power and daily average energy for each month are compared with the respective PV generated values. During the dry seasons, on average, 23–30% of the PV-generated daily energy is available as excess.
Table 4.
Summary of analysis results on average daily excess energy per month of the year.
The daily excess energy during the months from September to May, which ranged from 2000 to 3000 Wh, may be stored by heating water. The hot water may be utilized by the health clinic when needed. Two possible demands at the health center are pasteurization (requiring a temperature of 72 °C) and boiled water (close to 100 °C). It would be possible to heat from ambient temperature 35 to 50 L of water for pasteurization, or 20 to 30 L of boiled water, utilizing the daily excess energy.
3.2. Scenario 2 Maximum Charging Current 16 A, Minimum SoC 0.4
Reducing the maximum charging current from 32 to 16 A did not show any significant difference. When the charging current was set very low (less than 10 A), the battery storage was unable to satisfy the load demand.
3.3. Scenario 3 with 450 W Additional Load
Based on the results of scenario 1, which indicated excess power during the days of the dry season, ab additional load of 450 W for 4 h from 12:00 until 16:00 (equivalent energy of 1800 Wh) was included in the model. The additional load of 450 W was absorbed with no significant influence on the battery storage, as indicated in Figure 7a for 25–26 January. The SoC was between 240 and 300 Ah (75–100%), which is similar to the result found for scenario 1, without the additional load. The result was similar for the days 4–5 March, and when the SoC range was from 250 to 320 Ah (78–100%).
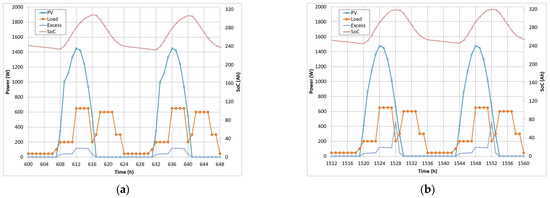
Figure 7.
Results of analysis of the case with a 450 W additional load: (a) 24–25 July and (b) 5–6 March.
3.4. Scenario 4 Solar Radiation Data at Ten-Minute Intervals
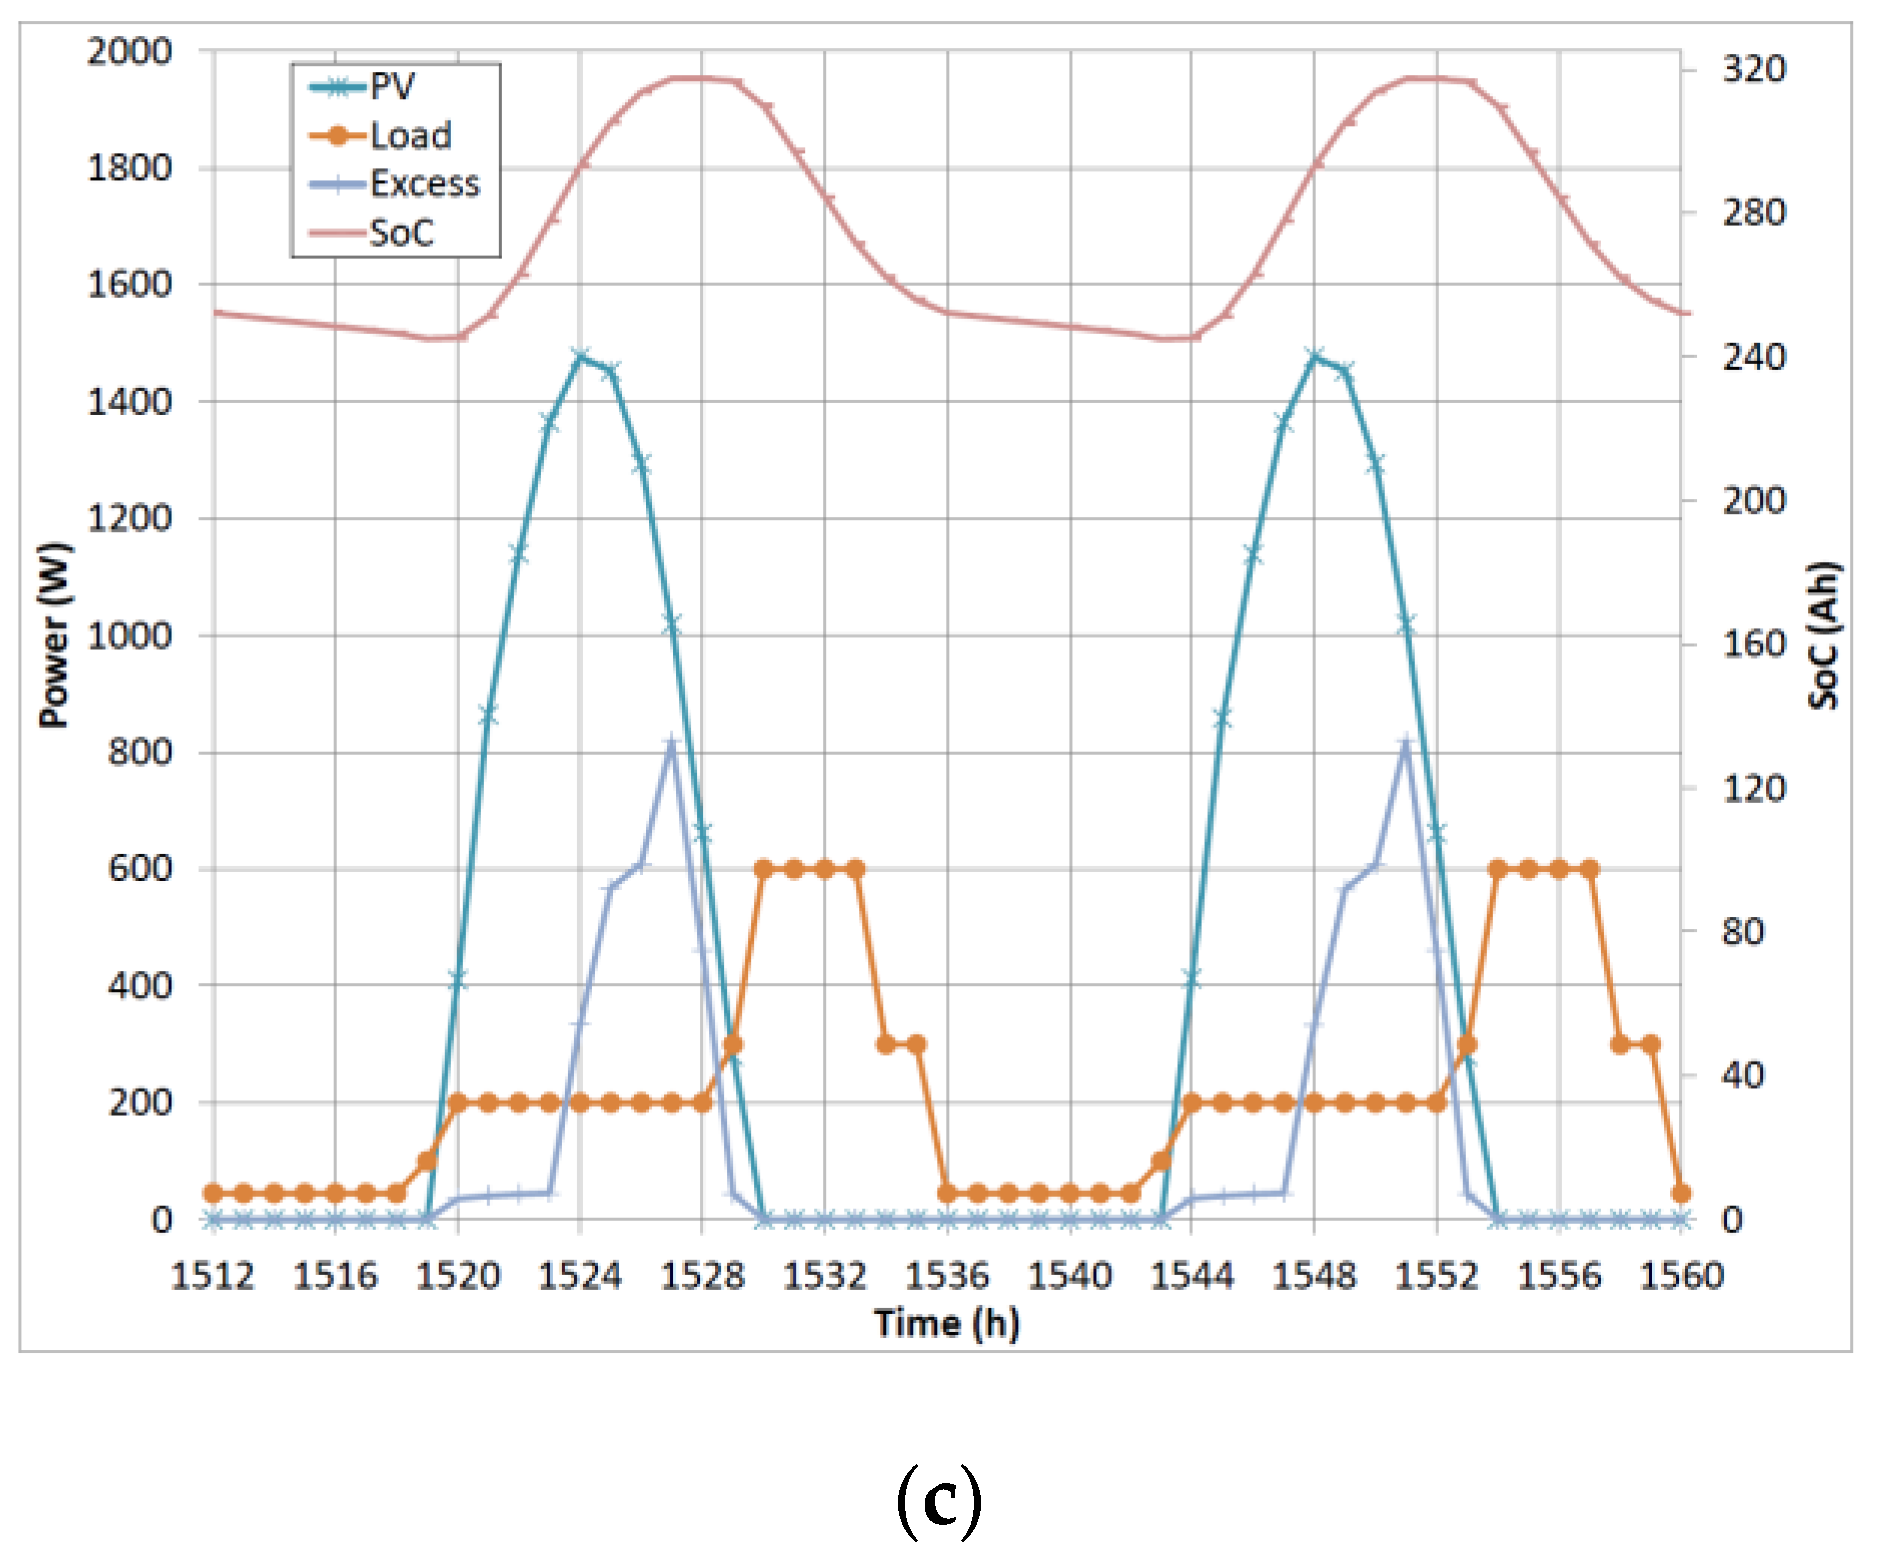
This scenario was similar to scenario 1, except that the solar radiation used was measured at ten-minute intervals at Mekelle in 2019. There were a few days showing cloud cover, which influenced the solar radiation during the dry season in the months from September to May. The instantaneous variation during most of the days in the dry season had no significant influence. Overall, the results extracted for excess power, as presented in Table 4, were not affected during the months of the dry season. Figure 8 shows plots for the days 24–25 January and 14–15 February 2019, where no influence can be seen. The battery state of charge varied between 240 and 320 Ah (75–100%), with full charge clearly observed in the hours of 15:00–17:00. During this period, the excess power is at its peak value.
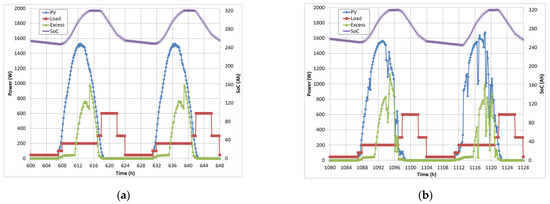
Figure 8.
Results of analysis with ten-minute solar data: (a) 24–25 January and (b) 14–15 February 2019.
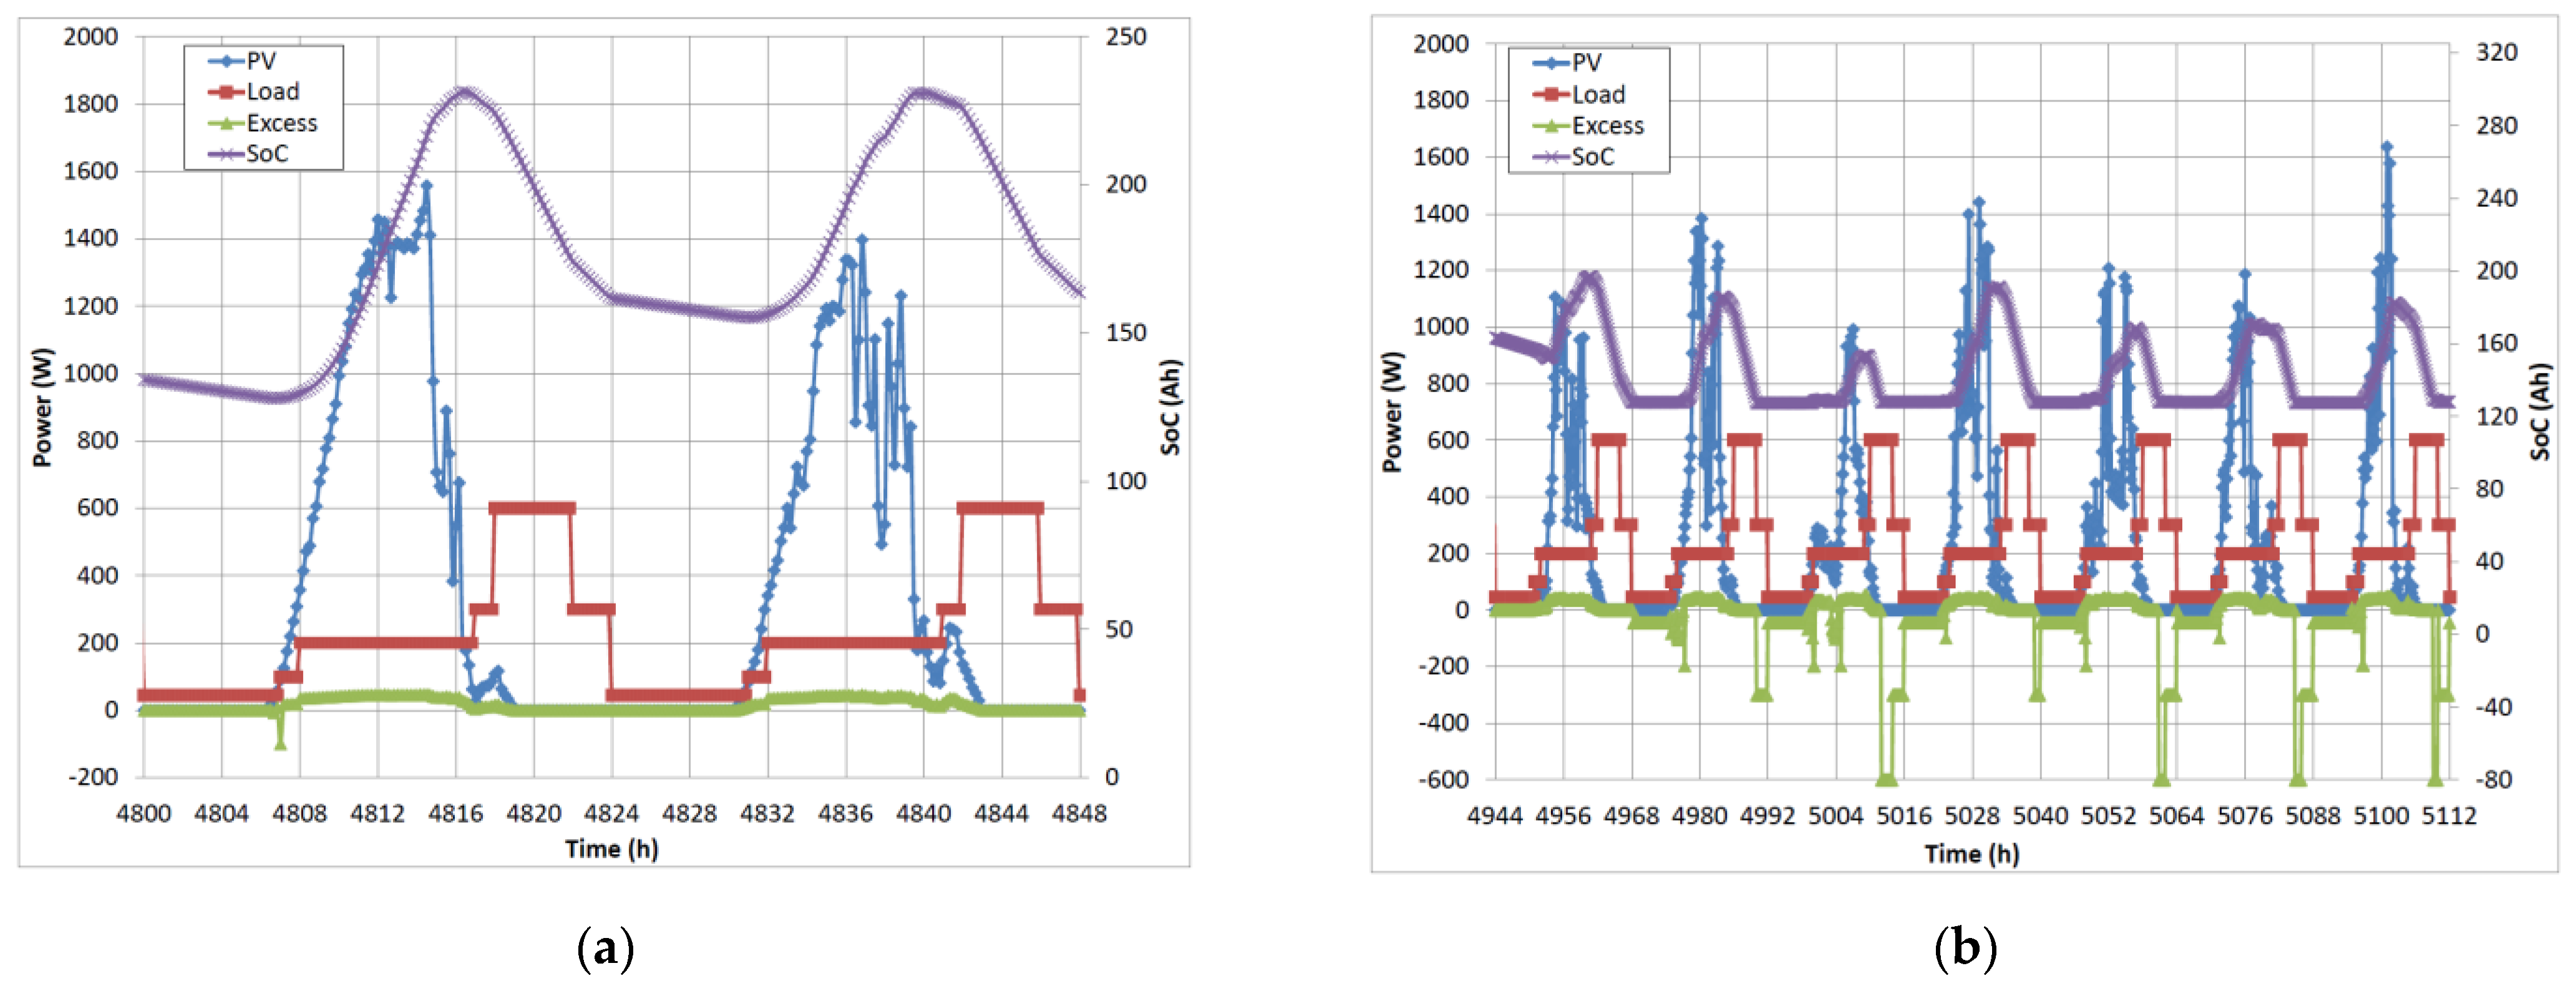
During the rainy season, the PV generation showed significant variation due to the changes in cloudiness, as shown in Figure 9. In some of the days, for example 19–20 July 2019, the battery storage system was barely capable of tolerating the variation. During some very cloudy days, the system was not capable of sustaining the energy required by the load. Figure 9 shows a week at the end of 25–31 July 2019 with significant cloud cover, where negative excess energy can clearly be seen, indicating the loads were not met. This implies that, during such conditions, only a portion of the priority loads may be met.
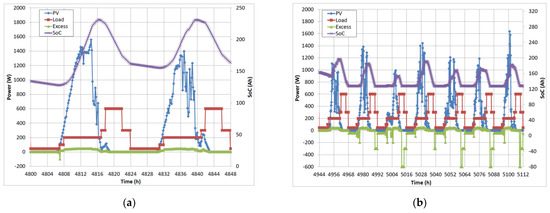
Figure 9.
Results of analysis with ten-minute solar data: (a) days 19–20 July 2019 and (b) week 25–31 July 2019.
4. Conclusions
The PV system analysis showed that, during the days of the dry season, excess power was available that could be stored in the form of thermal energy, such as hot water for use in the health center. This is true during the months from September until May. The available excess peak power ranged from 737 to 841 W, and daily average energy ranged from 2070 to 2959 Wh. During the rainy season from June to August, the system cannot provide any additional power. In fact, in some weeks when heavy clouds occur, the system may not be capable of meeting the load demands.
Author Contributions
Formal analysis, M.B.K.; Funding acquisition, J.L.; Investigation, M.B.K. and J.L.; Methodology, M.B.K.; Writing—original draft, M.B.K.; Writing—review & editing, M.B.K. and J.L. All authors have read and agreed to the published version of the manuscript.
Funding
This research was funded by VLIR-UOS, Global Minds Gent University, Short Research Stay.
Institutional Review Board Statement
Not applicable.
Informed Consent Statement
Not applicable.
Conflicts of Interest
The authors declare no conflict of interest.
References
- WHO. Access to Modern Energy Services for Health Facilities in Resource-Constrained Settings, A review of Status, Significance, Challenges and Measurement; WHO: Geneva, Switzerland, 2014. [Google Scholar]
- SEforALL. Available online: https://www.seforall.org/news/seforall-supports-energy-compact-aimed-at-powering-25000-healthcare-facilities-with-clean (accessed on 1 March 2022).
- IRENA. International Conference on Renewable Energy Solutions for Healthcare Facilities, Singapore. November 2018. Available online: https://iorec.irena.org/Home/Healthcare (accessed on 1 March 2022).
- Al-Akori, A. PV Systems for Rural Health Facilities in Developing Areas; Report IEA-PVPS T9-15; International Energy Agency: Paris, France, 2014. [Google Scholar]
- Tarragona, J.; Fernandez, C.; Alvaro, G. Model predictive control applied to a heating system with PV panel and thermal energy storage. Energy 2020, 197, 117229. [Google Scholar] [CrossRef]
- Tarragona, J.; Pisello, A.L.; Fernandez, C.; Cabeza, L.F.; Paya, J.; Javier, M.-A.; Alvaro, G. Analysis of thermal energy storage tanks and PV panels combinations in different buildings controlled through model predictive control. Energy 2022, 239, 122201. [Google Scholar] [CrossRef]
- Thygessen, R.; Bjorn, K. Simulation and analysis of a solar assisted heat pump system with two different storage types for high levels of PV electricity self-consumption. Solar Energy 2020, 103, 19–27. [Google Scholar] [CrossRef]
- Clift, D.H.; Suehrcke, H. Control optimization of PV powered electric storage and heat pump water heaters. Solar Energy 2021, 226, 489–500. [Google Scholar] [CrossRef]
- Yildiz, B.; Bilbao, J.I.; Roberts, M.; Heslop, S.; Dore, J.; Bruce, A.; MacGill, I.; Egan, R.J.; Sproul, A.B. Analysis of electricity consumption and thermal storage of domestic electric water heating systems to utilize excess PV generation. Energy 2021, 235, 121325. [Google Scholar] [CrossRef]
- Gerber, S.; Rix, A.J.; Booysen, M.J. Combining grid-tied PV and intelligent water heater control to reduce the energy costs at schools in South Africa. Energy Sustain. Dev. 2019, 50, 117–125. [Google Scholar] [CrossRef] [Green Version]
- Bhayoa, B.A.; Al-Kayiema, H.H.; Gilania, S.I. Assessment of standalone solar PV-Battery system for electricity generation and utilization of excess power for water pumping. Solar Energy 2019, 194, 766–776. [Google Scholar] [CrossRef]
- Mekelle University, EiT-M. Supply, Installation and Commissioning of Solar Photovoltaic Systems for Rural Health Centers and Health Posts in Ethiopia; Project Report; Mekelle University, EiT-M: Mekelle, Ethiopia, 2017. [Google Scholar]
- Bayray, M.; Gebreyohannes, Y.; Gebrehiwot, H.; Teklemichael, S.; Mustefa, A.; Haileslassie, A.; Gebray, P.; Kebedom, A.; Filli, F. Temporal and Spatial Solar Resource Variation by Analysis of Measured Irradiance in Geba Catchment, North Ethiopia. Sustain. Energy Technol. Assess. 2021, 44, 101110. [Google Scholar] [CrossRef]
- Mulu, B.; Yacob, G.; Hailay, G.; Solomon, T.; Anwar, M.; Asfafaw, H.; Petros, G.; Ashenafi, K.; Fana, F. Measured Solar Irradiance Data for Resource Assessment at Four Sites in Geba Catchment, Tigray, North Ethiopia. Data Brief 2022, 40, 107836. [Google Scholar]
- Mesele, H.; Mulu, B.; Asfafaw, H.; Nydal, O.J. Direct and Diffuse Solar Radiation Measurement at Mekelle, Years 2018–2019, 2020. Unpublished Data Report.
- TRNSYS Software, University of Wisconsin. Available online: https://sel.me.wisc.edu/trnsys/index.html (accessed on 1 March 2022).
- TRNSYS, Version 17 Manual, Volume 4 Mathematical Reference; Solar Energy Laboratory, University of Wisconsin: Madison, WI, USA, 2009.


Publisher’s Note: MDPI stays neutral with regard to jurisdictional claims in published maps and institutional affiliations. |
© 2022 by the authors. Licensee MDPI, Basel, Switzerland. This article is an open access article distributed under the terms and conditions of the Creative Commons Attribution (CC BY) license (https://creativecommons.org/licenses/by/4.0/).