Article

Solid Digestate—Mathematical Modeling of Combustion Process

by
Krzysztof Dziedzic
1,*,
Bogusława Łapczyńska-Kordon
2,*,
Michał Jurczyk
3,
Marek Wróbel
2,
Marcin Jewiarz
2,
Krzysztof Mudryk
2 and
Tadeusz Pająk
3
1
R&D Department, Dziedzic Transport, 34-300 Żywiec, Poland
2
Department of Mechanical Engineering and Agrophysics, University of Agriculture in Krakow, 21 Adama Mickiewicza Al., 31-120 Kraków, Poland
3
Department of Power Engineering and Environmental Protection, AGH University of Science and Technology, 30 Adama Mickiewicza Al., 30-059 Krakow, Poland
*
Authors to whom correspondence should be addressed.
Energies 2022, 15(12), 4402; https://doi.org/10.3390/en15124402
Submission received: 11 May 2022 / Revised: 3 June 2022 / Accepted: 14 June 2022 / Published: 16 June 2022

Abstract

:
The combustion of waste biomass is becoming a key challenge for the energy sector, especially in times of growing energy demand and increasing environmental awareness of society. Processing such fuels is usually demanding. Mathematical modeling makes it possible to adapt the course of the process. The best option is to use appropriate fuel mixtures. The aim of this work was to develop a simple model that would allow the pre-selection of the mixture of two types of digestate. Residues from methane fermentation of maize and apple pomace were used in the study. The paper presents both a mathematical model and laboratory tests. The practical part was to check the validity of the model estimates. The model works on the basic data from physicochemical analysis. Laboratory tests included combustion of the samples of different mixtures. We used image analysis of thermograms to determine changes during combustion, which allowed us to determine when and where the main combustion occurs. Results show that a simple mathematical model is able to estimate the course of the combustion of a fuel particle.

1. Introduction

Combustion is a fundamental process that has stimulated vast development over the centuries. Because of its availability, biomass was the natural fuel, and it was not until the large-scale introduction of fossil fuels that the use of solid biomass for energy purposes declined [1]. The ongoing energy transformation, which is the result of increased environmental awareness, is bringing this type of fuel back into common use. Increased demand for electricity and heat is causing the scientific community around the world to search for new forms of locally available “green energy” [2,3,4]. Importantly, because of the increasing demand for food, these sources should not be competitive with food production as in the case of liquid biofuels, for instance. The most beneficial approach would be to process waste from agricultural and food production so that it can be further used [5,6,7,8,9,10].

1.1. Digestate Form Methane Fermentation

Digestate is the product of anaerobic fermentation of biomass. Depending on the type of substrate used, the resulting digestate makes up 85–95% of the input to the biogas plant.
During the fermentation process, the organic matter content in the substrates decreases, odor-forming compounds are broken down, the particle size of the substrate is reduced, the digestate is hygienised and its dewatering capacity is improved, while at the same time losses of fertiliser components are low [11,12].
The above transformations and their degree depend mainly on the proportion of organic matter in the substrate and on the conditions under which the fermentation process is carried out and its duration. Most often, only 30 to 60% of the organic matter of the substrate is decomposed, of which 80% is converted into biogas [13].
The post-process residue is made up of the biomass of the microorganisms that carried out the fermentation process, organic compounds that were not processed during the process and minerals (ash). The digestate contains N, P, K in a form directly available to plants and organic matter which is subject to mineralisation. In this respect, the digestate is a valuable nutrient supplying material for plants and improving soil productivity. Nitrogen compounds present in the digestate are mainly the ammonium form (N-NH4), which is easily assimilated by plants. The proportions of the main nutrients are as follows: total nitrogen—3.4–4.0; N-NH4—2.4–2.9; P—0.8–1.2; K—2.7–3.1 (values are given in g-l-1). The data refer to the digestate made from slurry with the addition of other biomass [14]. Due to the high level of hydration of the digestate, its further use is preceded by a process of dewatering, aerobic stabilisation and packaging.
In Poland, the number of modern biogas plants is increasing; in the Register of Agricultural Biogas Producers, as of 31 December 2021, there are 128 of them and the mass of substrate used in 2021 for biogas production was over 4,500,000 t [15]. The main feedstocks used in Poland are: digestate, slurry, fruit and vegetable residues and maize silage [16].
The digestate produced in a 1 MW biogas plant is about 30,000 t per year. Its local management is difficult and its transport profitable to a maximum of several t per year [17]. Furthermore, according to the European Nitrate Directive [18], the annual nitrogen limit per hectare of plantation is max. 170 kg.
Therefore, other economically viable ways of utilizing the digestate are being sought. One of them is its granulation, which reduces the costs of transportation and storage and increases the durability of the product. These may be fertilizer granules [19,20,21,22] or fuel pellets [23]. A digestate pellet with moisture content of 10% has a calorific value of 15 MJ/kg [24]. These values meet the quality standards for pellets and non-wood briquettes, EN ISO 17225-6 [25] and EN ISO 17225-7 [26], which require a minimum net calorific value of 14.5 MJ/kg.

1.2. Modeling of Combustion

Although the combustion process has been known to humanity since its beginnings, it still poses new challenges. Taking care of the environment, people try to use the energy potential of fuel to the fullest extent possible while limiting the negative impact of this process. Initially, scientific work focused on practical measures, where the impact of a given technological change was analysed in real systems. This process is costly and time-consuming, but often led to the formulation of mathematical equations describing the given phenomena. Empirical equations, which over the years have become more developed and accurate, have made it possible to calculate the influence of selected parameters on the combustion process. The key variables in these calculations are those related to the physico-chemical properties of the fuel [27]. This is because fuel analysis is usually quite simple to carry out, hence the large number of variants necessary to carry out a reliable statistical analysis. The variability of physico-chemical parameters in the case of biomass is normal and depends on many factors, with soil and weather conditions appearing to be key [28]. This is particularly noticeable in the case of fast-growing plants. Similar relationships can be identified for waste products from agricultural and food production. Therefore, it is crucial to determine the fuel parameters that will allow the combustion process to run optimally. In order to optimize the process, it is often necessary to use mixtures of different fuels, which in turn translates into the need for an appropriate choice of composition. To determine the impact of changes in fuel parameters, it is best to use simple 1D–2D models that allow a quick verification of the applied changes. On this basis, it is possible to eliminate potentially unfavorable variants of parameters, leaving only the most promising ones for further verification (e.g., using more complex models) [29,30].
The aim of the work presented in this publication was to assess the predictive capabilities of a simple mathematical model. The assumption for its development was the possibility of assessing the influence of changes in the proportion of fuel components used during the combustion process. The presented results are the next stage of research, the final element of which will be a complex model allowing for a much more accurate representation of the processes taking place during the combustion of unconventional materials such as digestate [31].

2. Materials and Methods

The research material consisted of four types of waste obtained as a result of methane fermentation of a mixture of apple pomace J and corn silage K with different percentages of individual components (Table 1). The digestate was obtained from a laboratory installation for methane fermentation of biomass, located at the Faculty of Production and Power Engineering, University of Agriculture in Krakow (Table 1).
Detailed analyses of both components and mixtures were part of the research presented in the previous paper [32] and are shown in Table 2. Presented data refer only to parameters which are used in the modeling process. More details about the procedure and other parameters measured can found in this article [32].
The samples in the form of pellets (Figure 1) were prepared using the EDZ-20 testing machine (Werkstoffprüfmaschinen Leipzig, East Germany) with a special attachment for agglomeration of biological materials, consisting of a steel cylinder with an internal diameter of 25 mm and a piston with a diameter of 24.5 mm. The cylinder was filled with a 5 g biomass sample to make a single pellet 25 mm in diameter and 20 mm long. Each sample was compacted at a pressure of 60 MPa for 30 s.
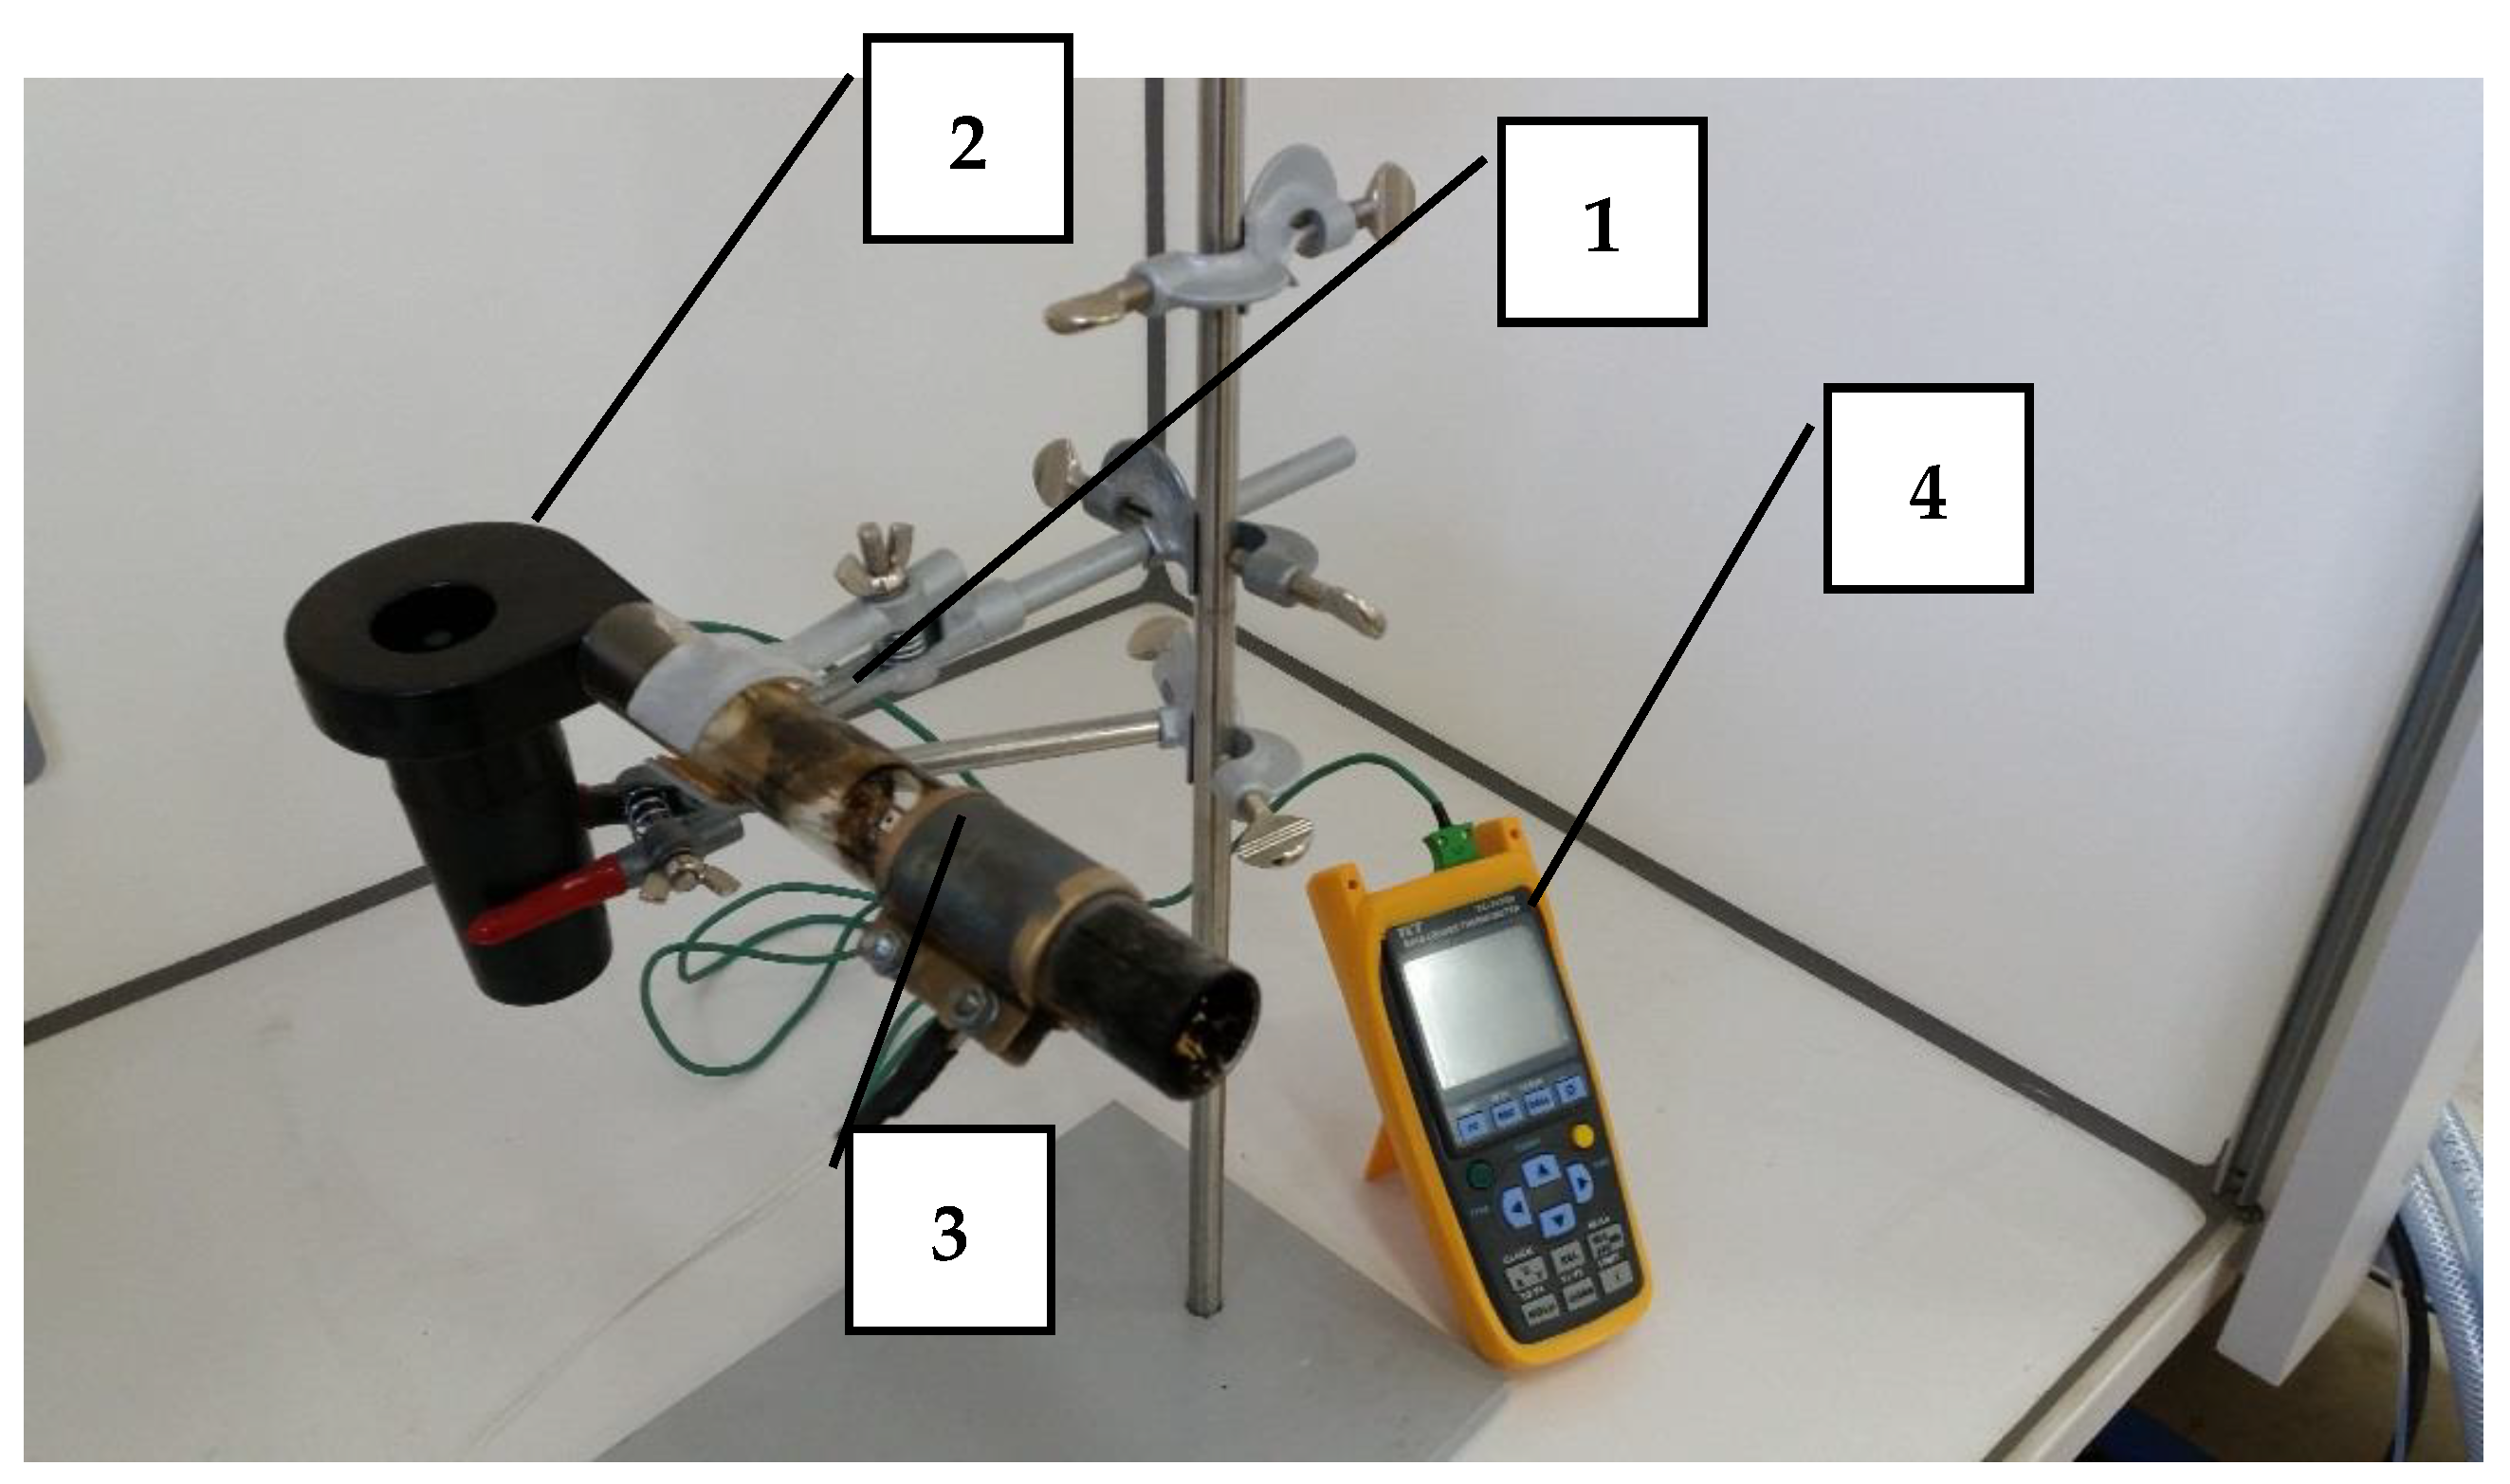
A study of changes in temperature and dimensions of biomass particles during the flameless combustion process in the drying, degassing and char combustion phase was also performed. For this purpose, a measuring stand was designed and constructed (Figure 2).
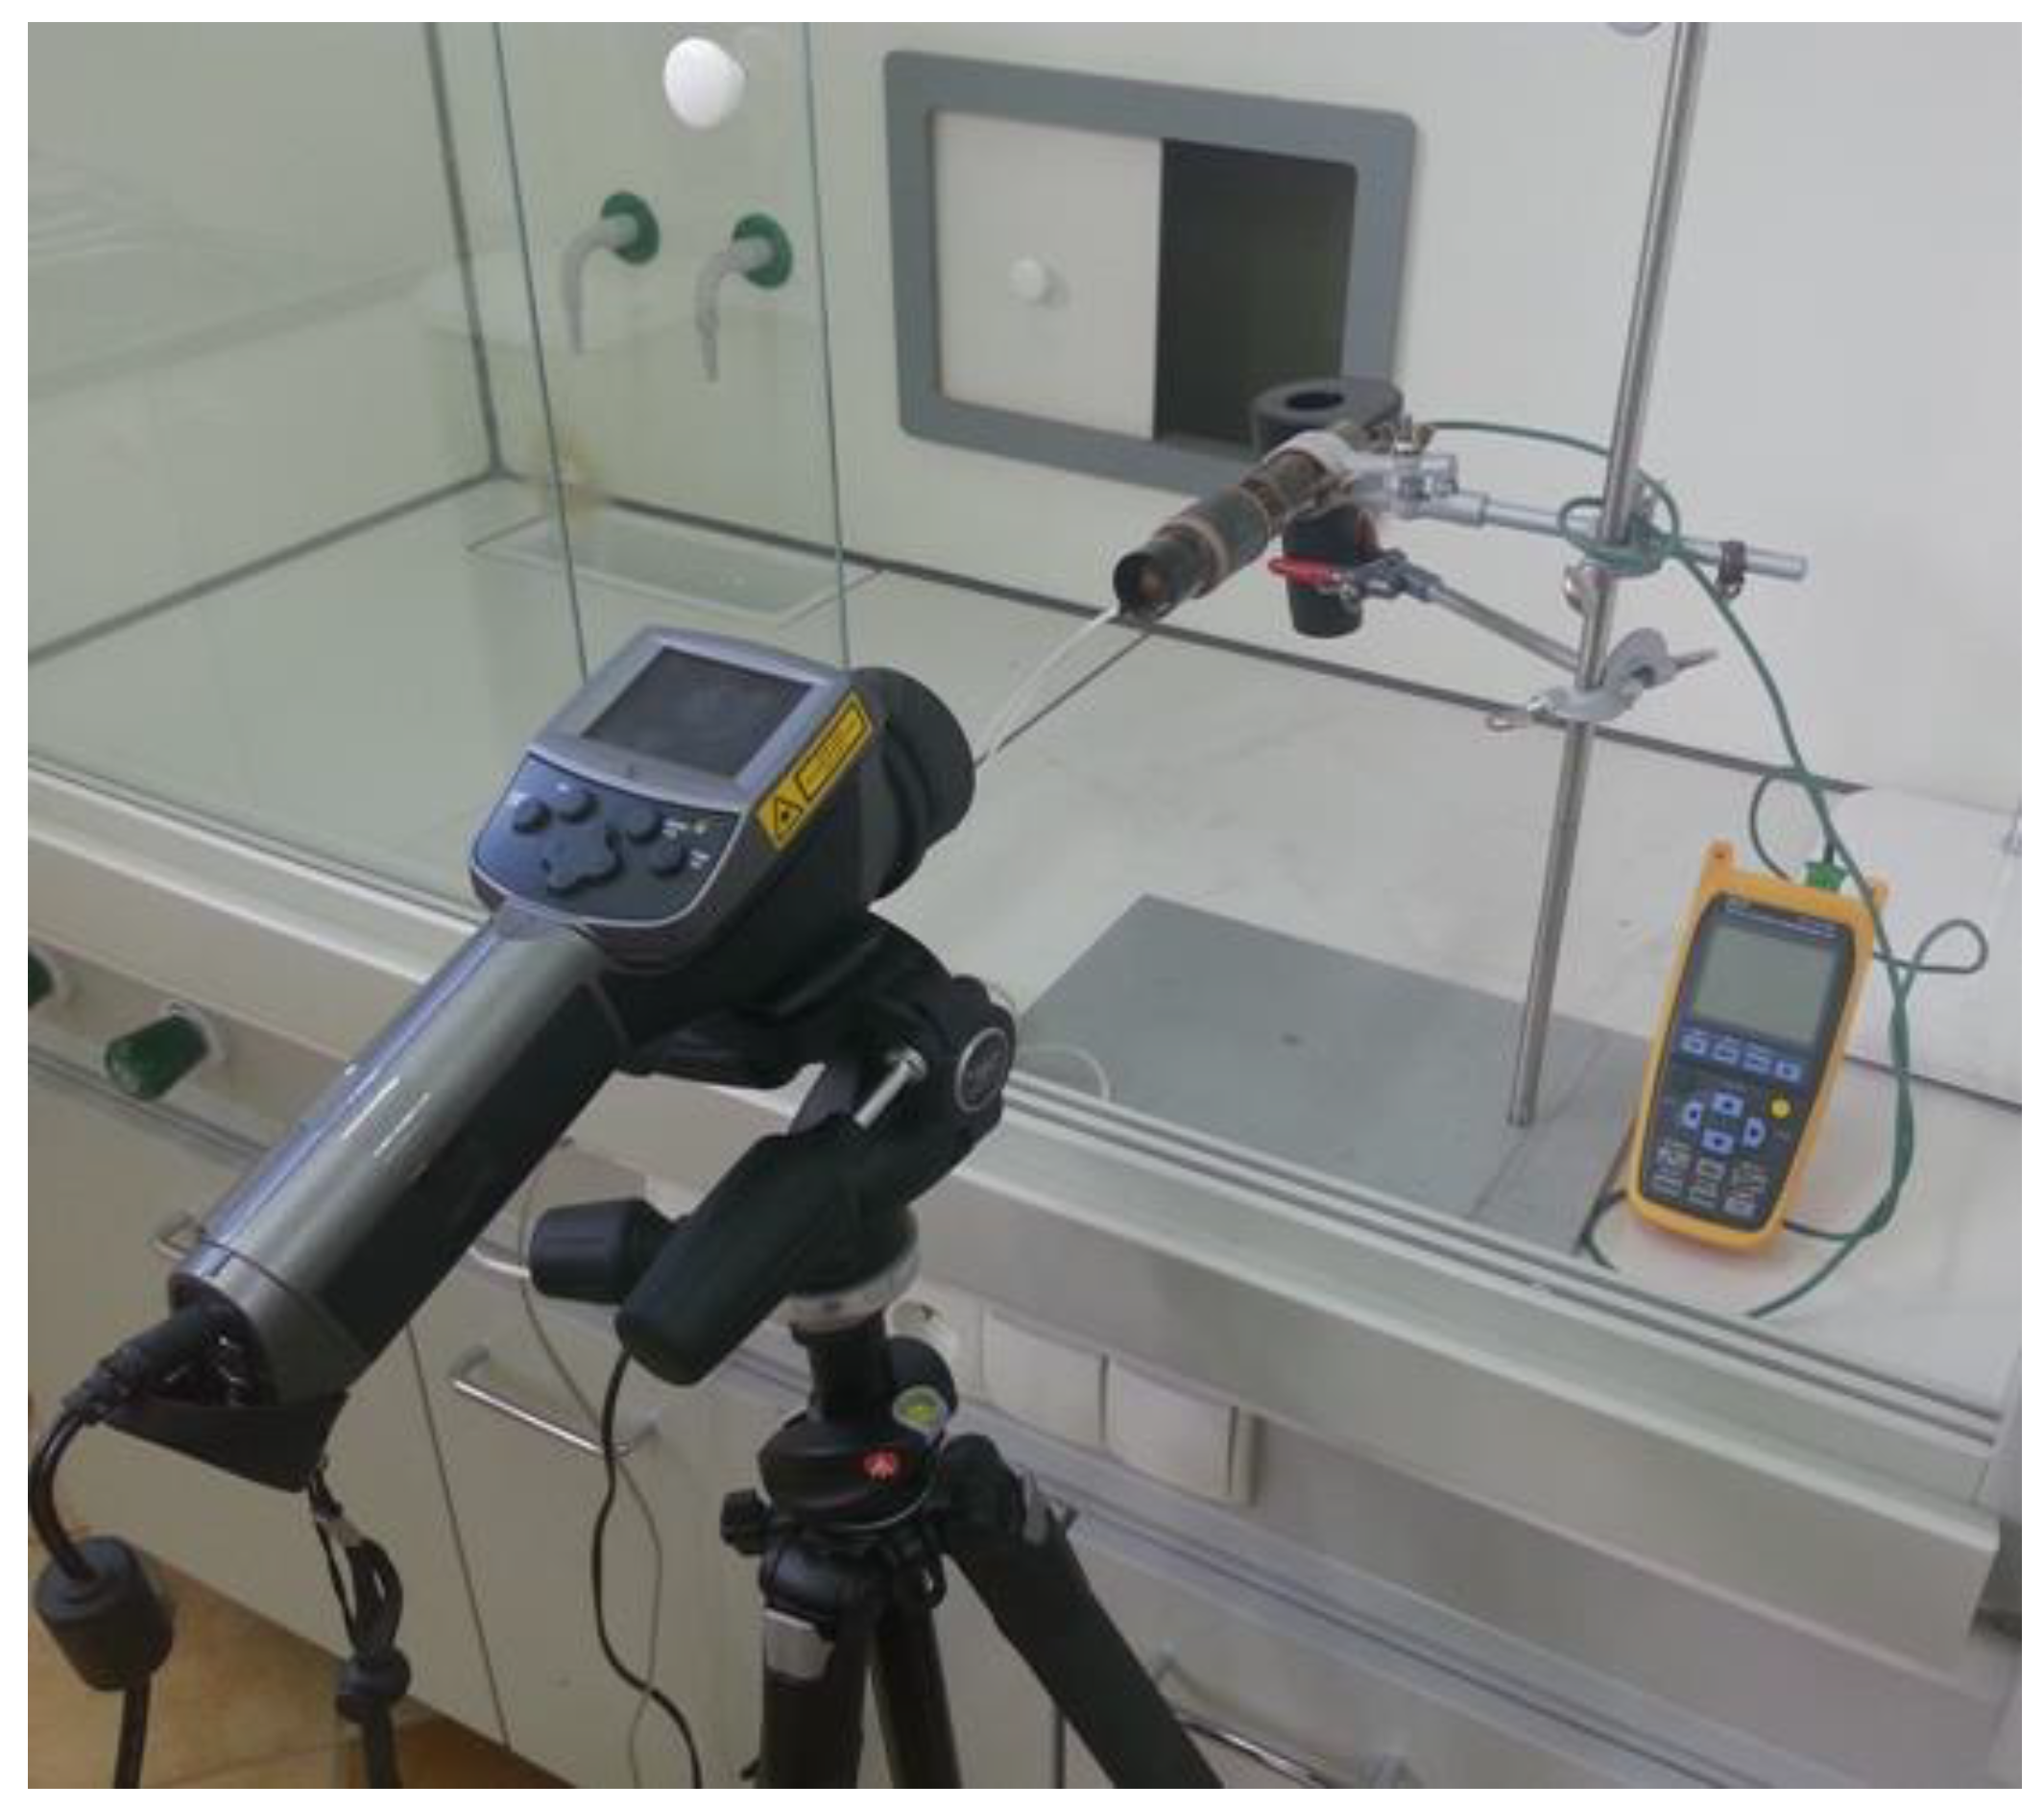
The main element of the station is a combustion chamber made of GE 214 quartz glass (1 in Figure 2) with high thermal resistance (up to 1200 °C). The air flow in the combustion chamber is forced by the use of a jet fan (2 in Figure 2), voltage controlled in the range of 0–5 m/s. The fuel is ignited at this stand by means of a designed and manufactured 160 W Tantalum heater (3 in Figure 2). The heating system being designed in this way allows it to achieve a maximum temperature of 600 °C in a constant temperature zone 50 mm long. The use of a band ignition system ensures that the sample is evenly heated and ignited on its entire external surface. Temperature at the contact surface of the heater and glass pipe was monitored and logged with use of temperature measurement system, with K-type thermocouple. The whole stand was placed on a stable laboratory stand in a fume cupboard. An integral element of the station is the thermal imaging camera (FLIR ThermaCAM E300, InfraTec GmbH, Dresden Germany) (Figure 3), which enables the registration of thermograms during the combustion process. The camera used in the analyses has a measuring range of −120–1300 °C and a measurement accuracy of 0.1 °C.
The pellet was placed axially in the combustion chamber at the height of the heating element so that the external surface of the burned sample was heated evenly. After the heater was started, the sample was gradually heated until the ignition point was reached. Ignition point was determined according to the method presented in another paper [33], with some simplifications. In general, to automate the process, we assumed that when the temperature of the material exceeded 10 K, the heater was turned off and the sample combustion process became autothermic. During the combustion process, thermograms were recorded from the very beginning, which made it possible to track changes related to the formation of char, and then its flameless combustion (smoldering). Measurements were made in five replications.

3. Results

3.1. Thermal Imaging Analysis of the Combustion Process

TG and DTG methods do not allow one to observe the migration of the combustion front (intense oxidation) of the biomass into the material and changes in its temperature during the process; therefore, analyses of the sliding of the glow front (flameless combustion) during the process were carried out by recording the image. Figure 4 presents thermograms from the combustion of 50K50J biomass in successive moments of time. The areas of minimum and maximum temperatures at a given time are marked. Due to the combustion conditions, the sample is closed, the process of incomplete combustion takes place here, which is caused by the inability to deliver an appropriate stream of oxidant to the fuel. In Figure 4a, a characteristic ring with a higher temperature than the material in the center of the sample can be observed, the external part of the material is heated, dried and ignited. Figure 4b–g show the progressive process of drying the material (reduction of the surface of fresh biomass) and the formation of volatile products of the combustion process (fuel degassing). The thermograms in Figure 4h–l show the ashing of the solid product of this process (char) formed in the degassing process, as well as its afterburning and formation of ash.
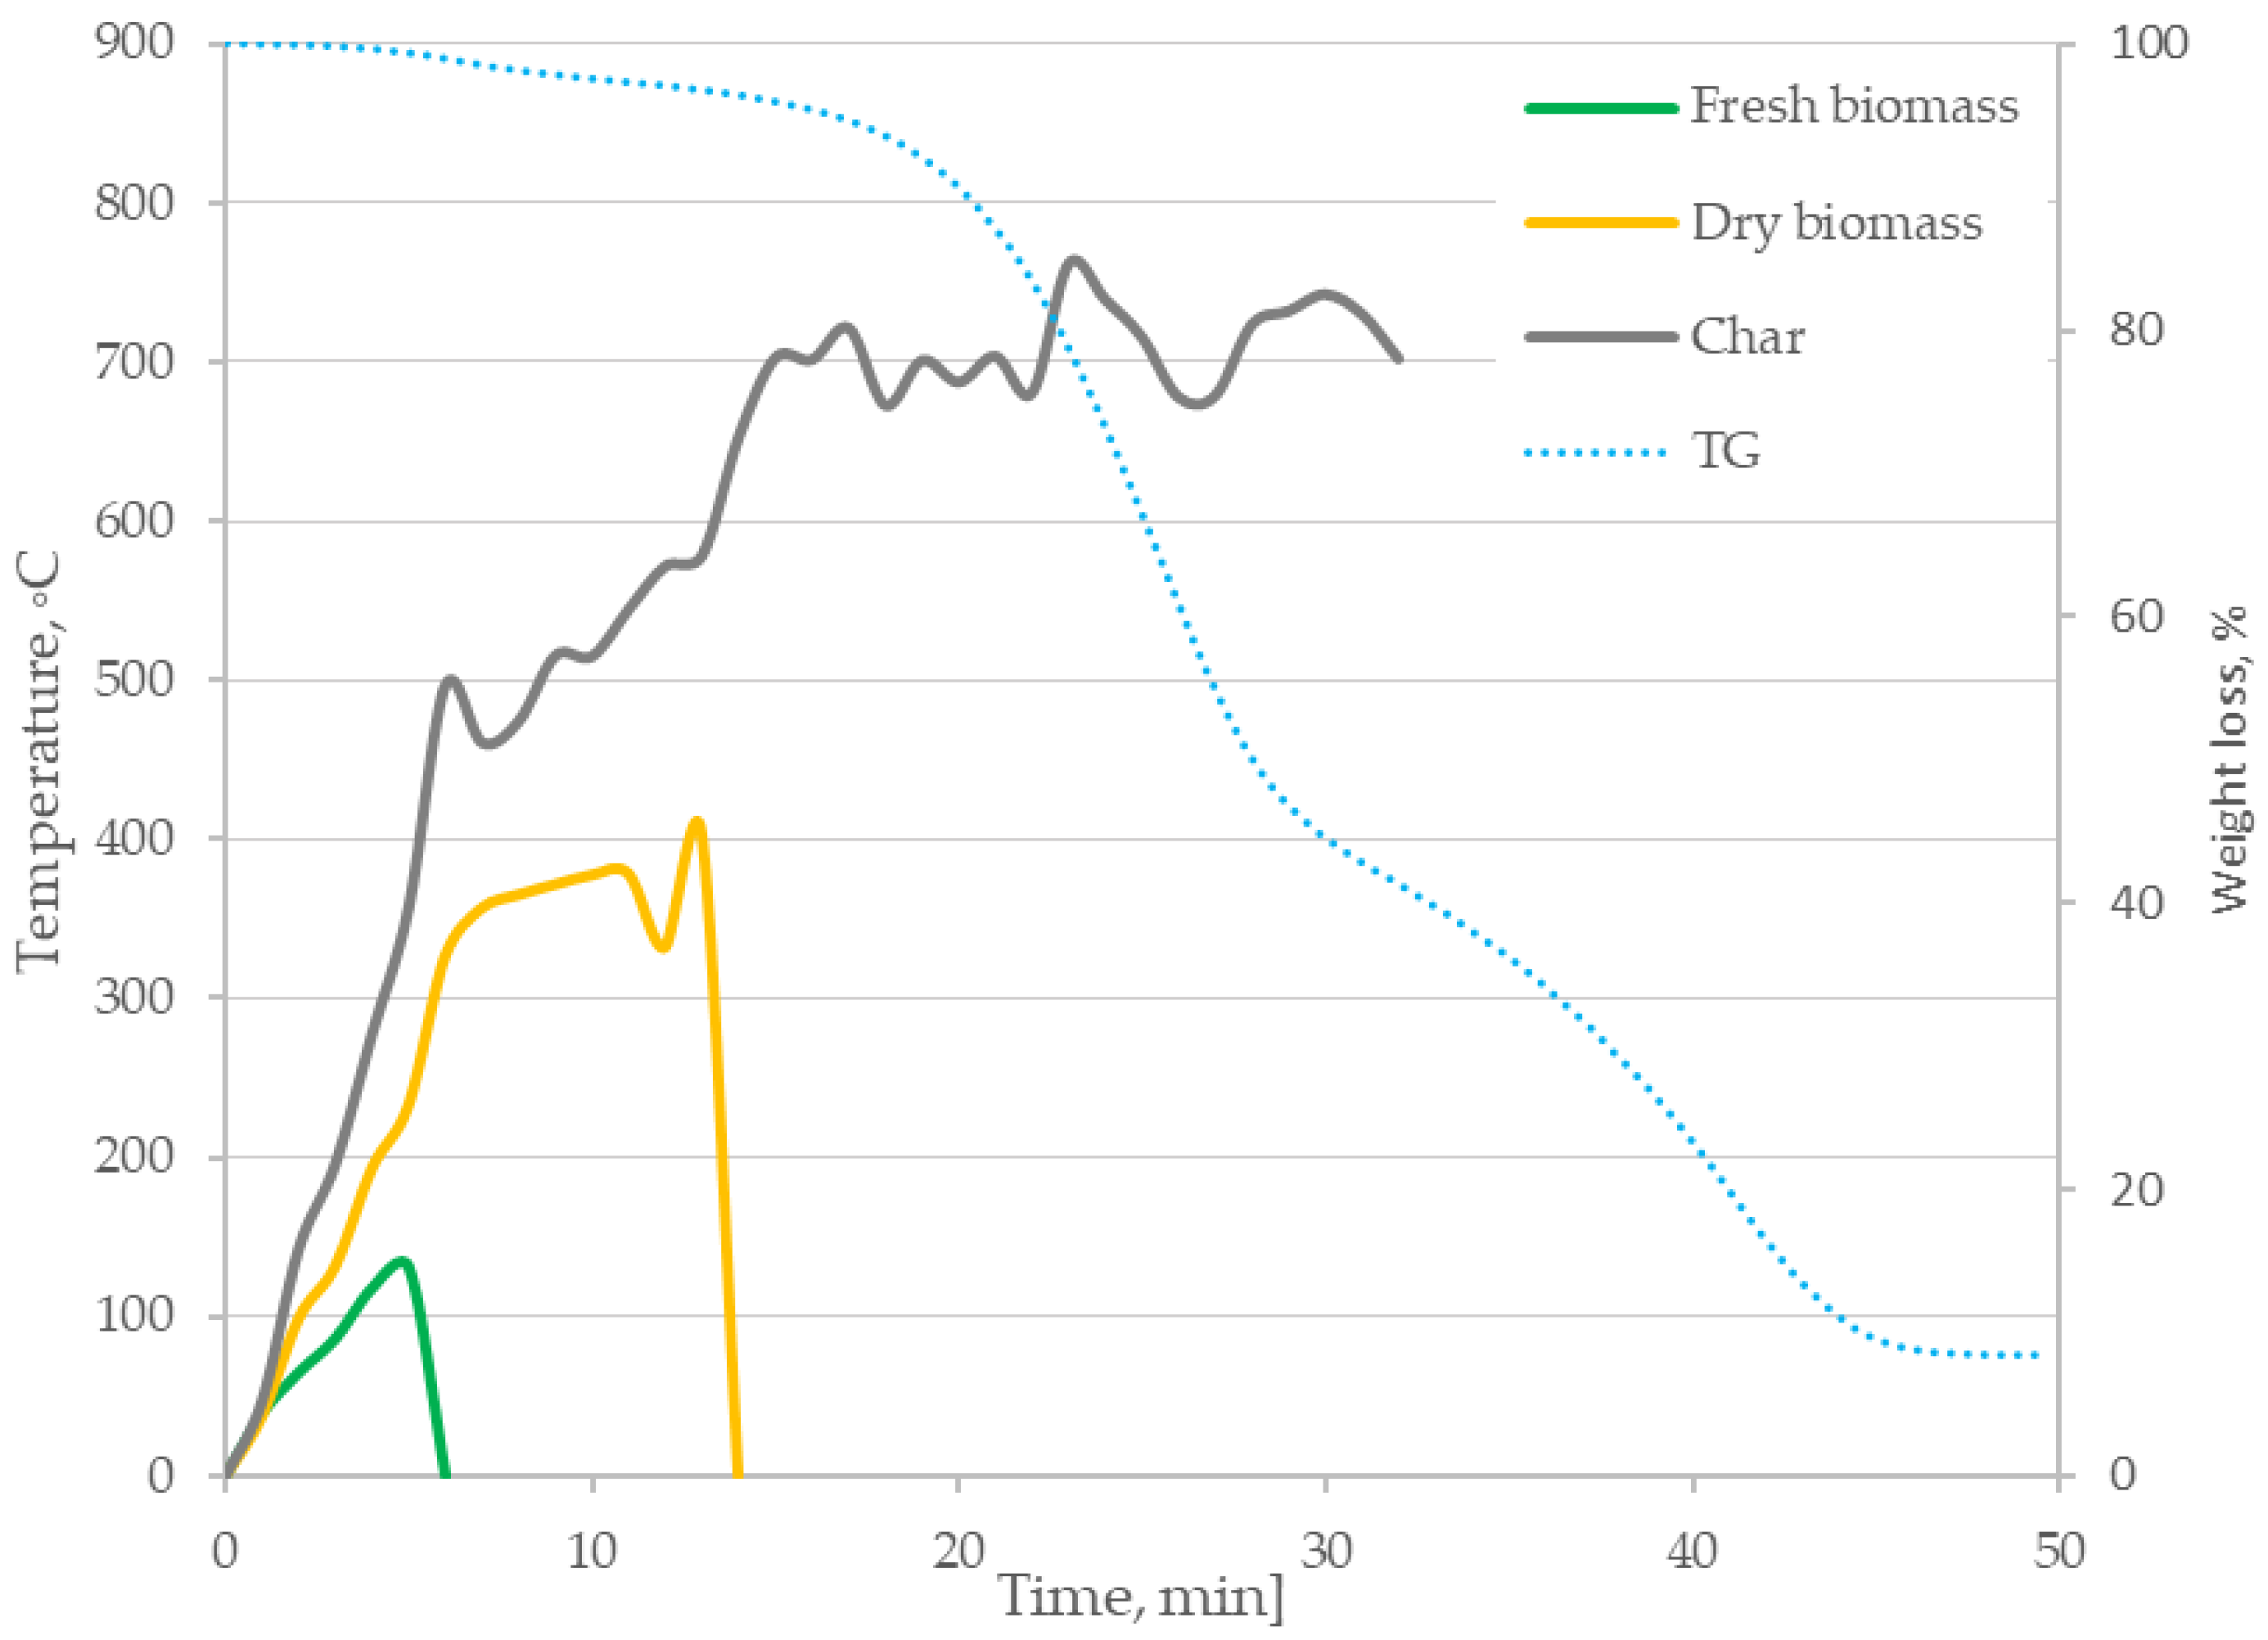
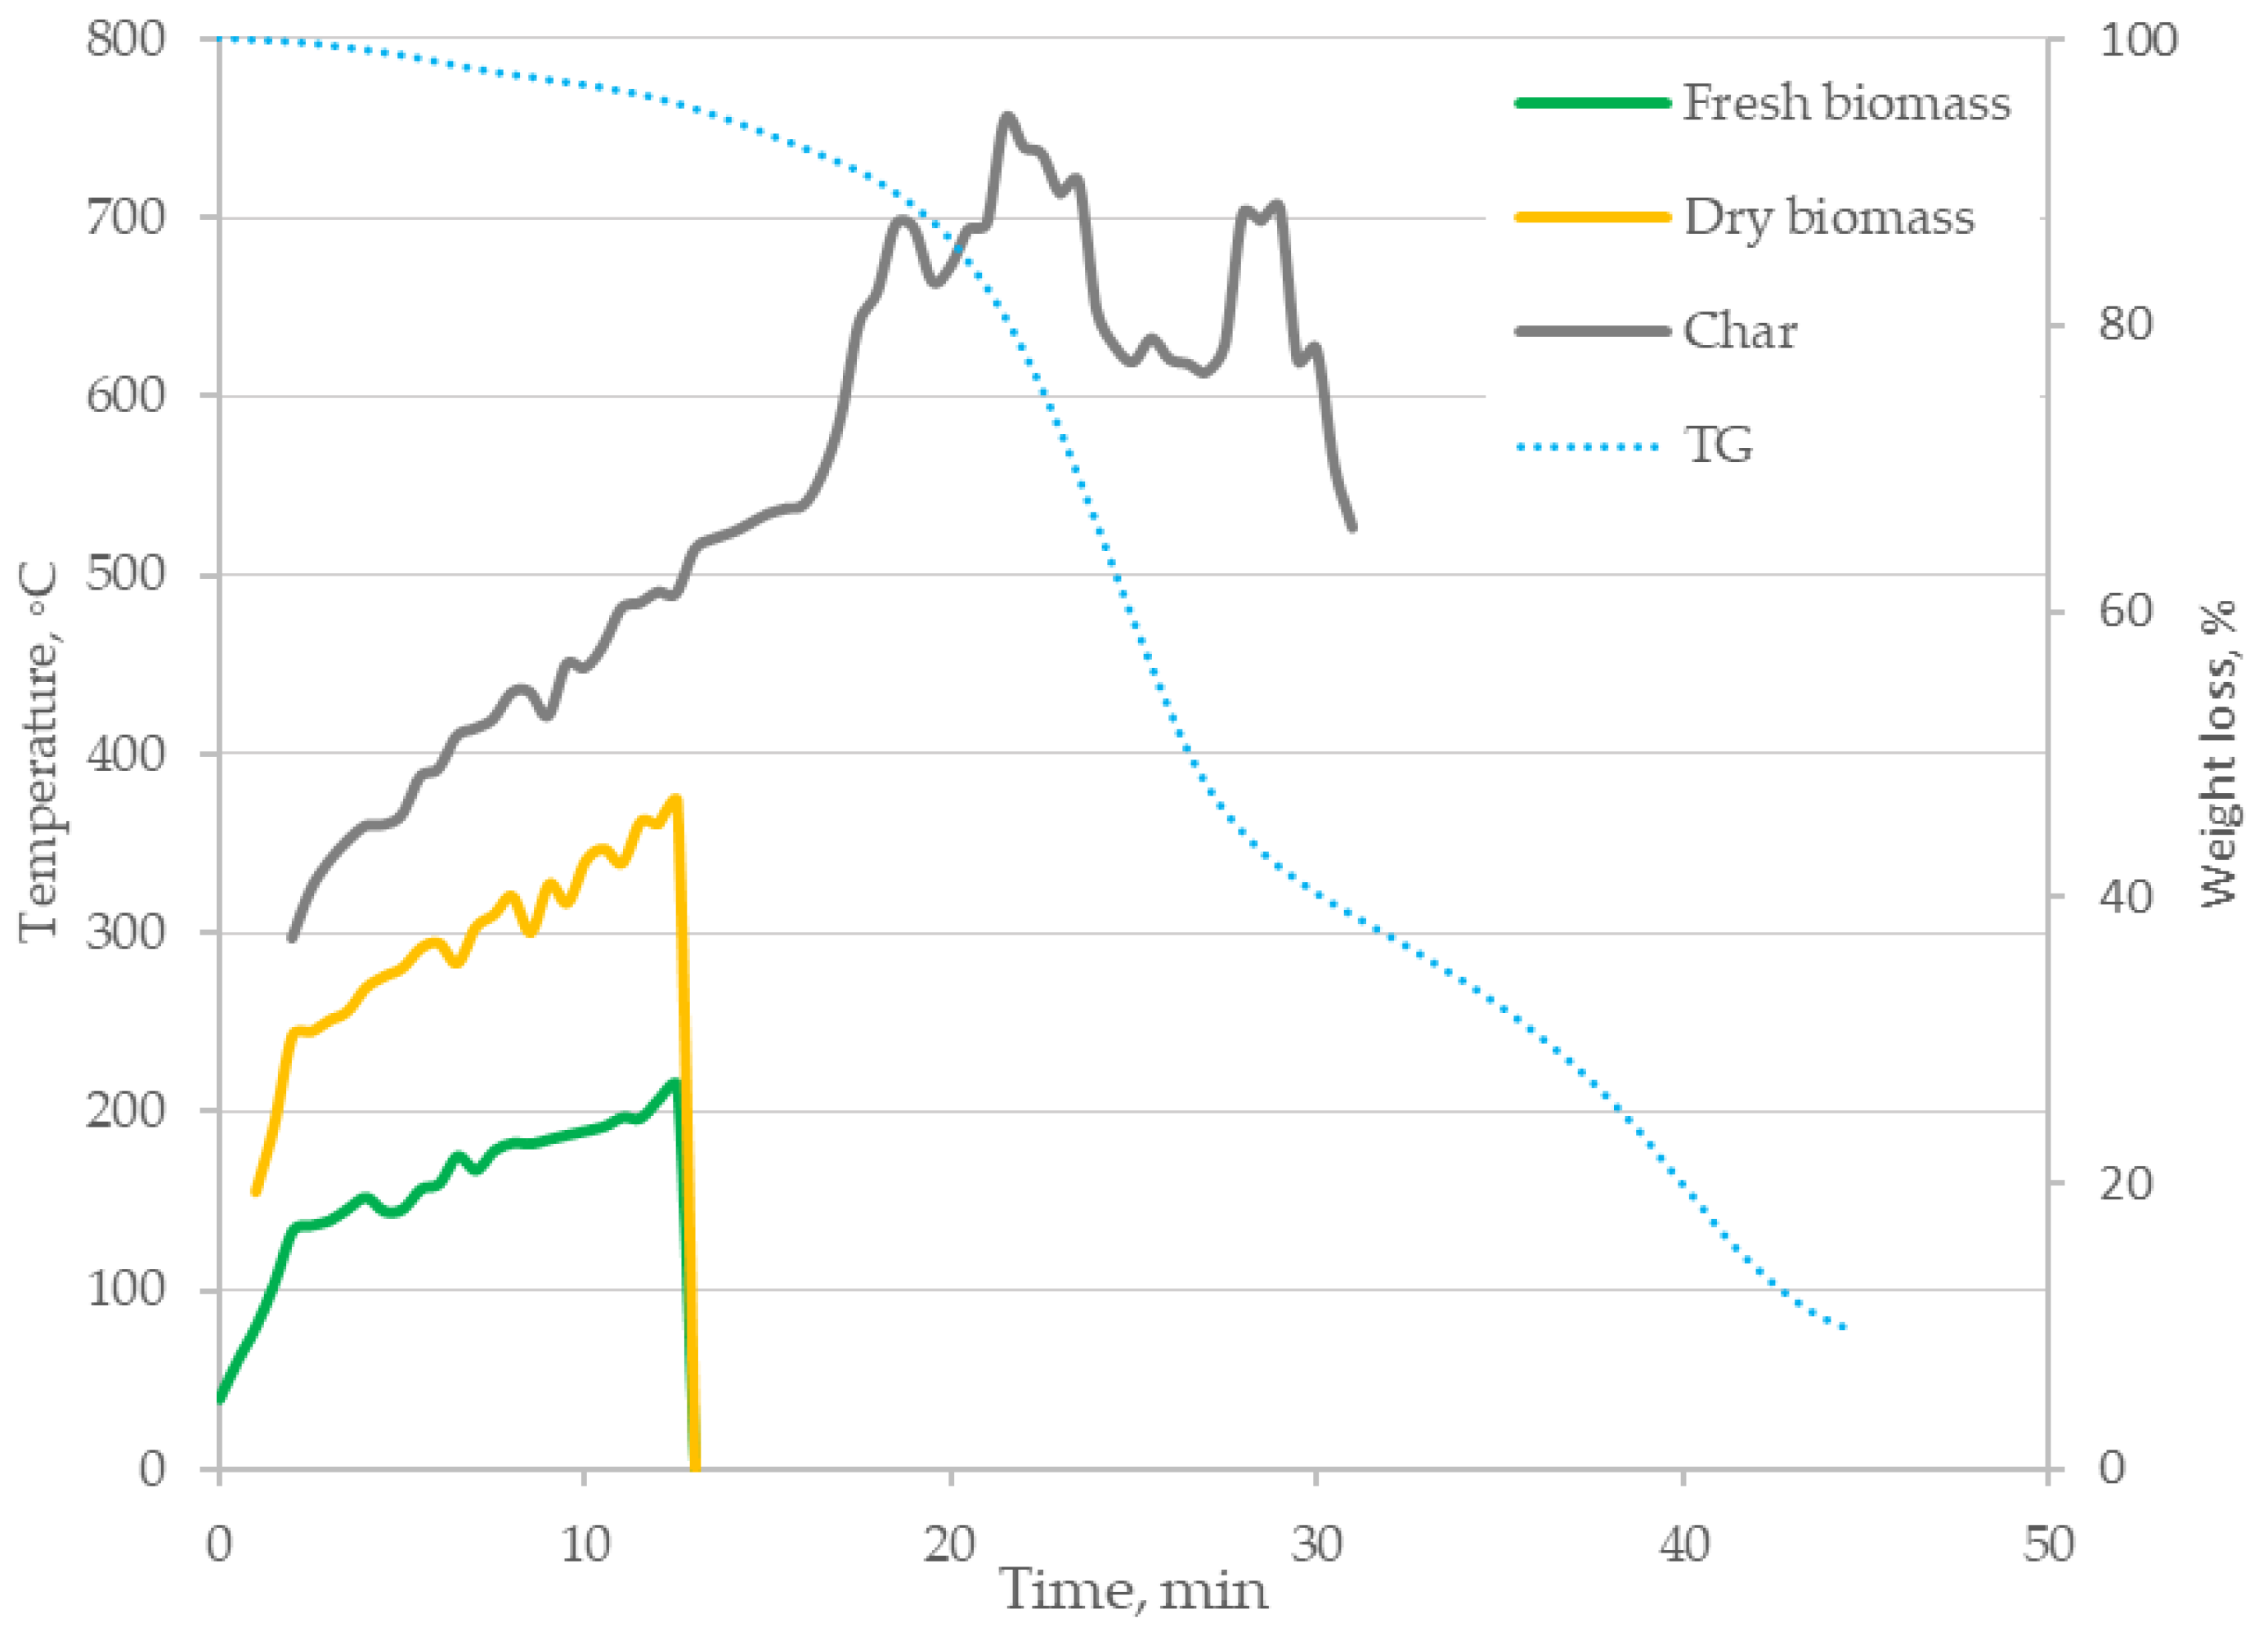
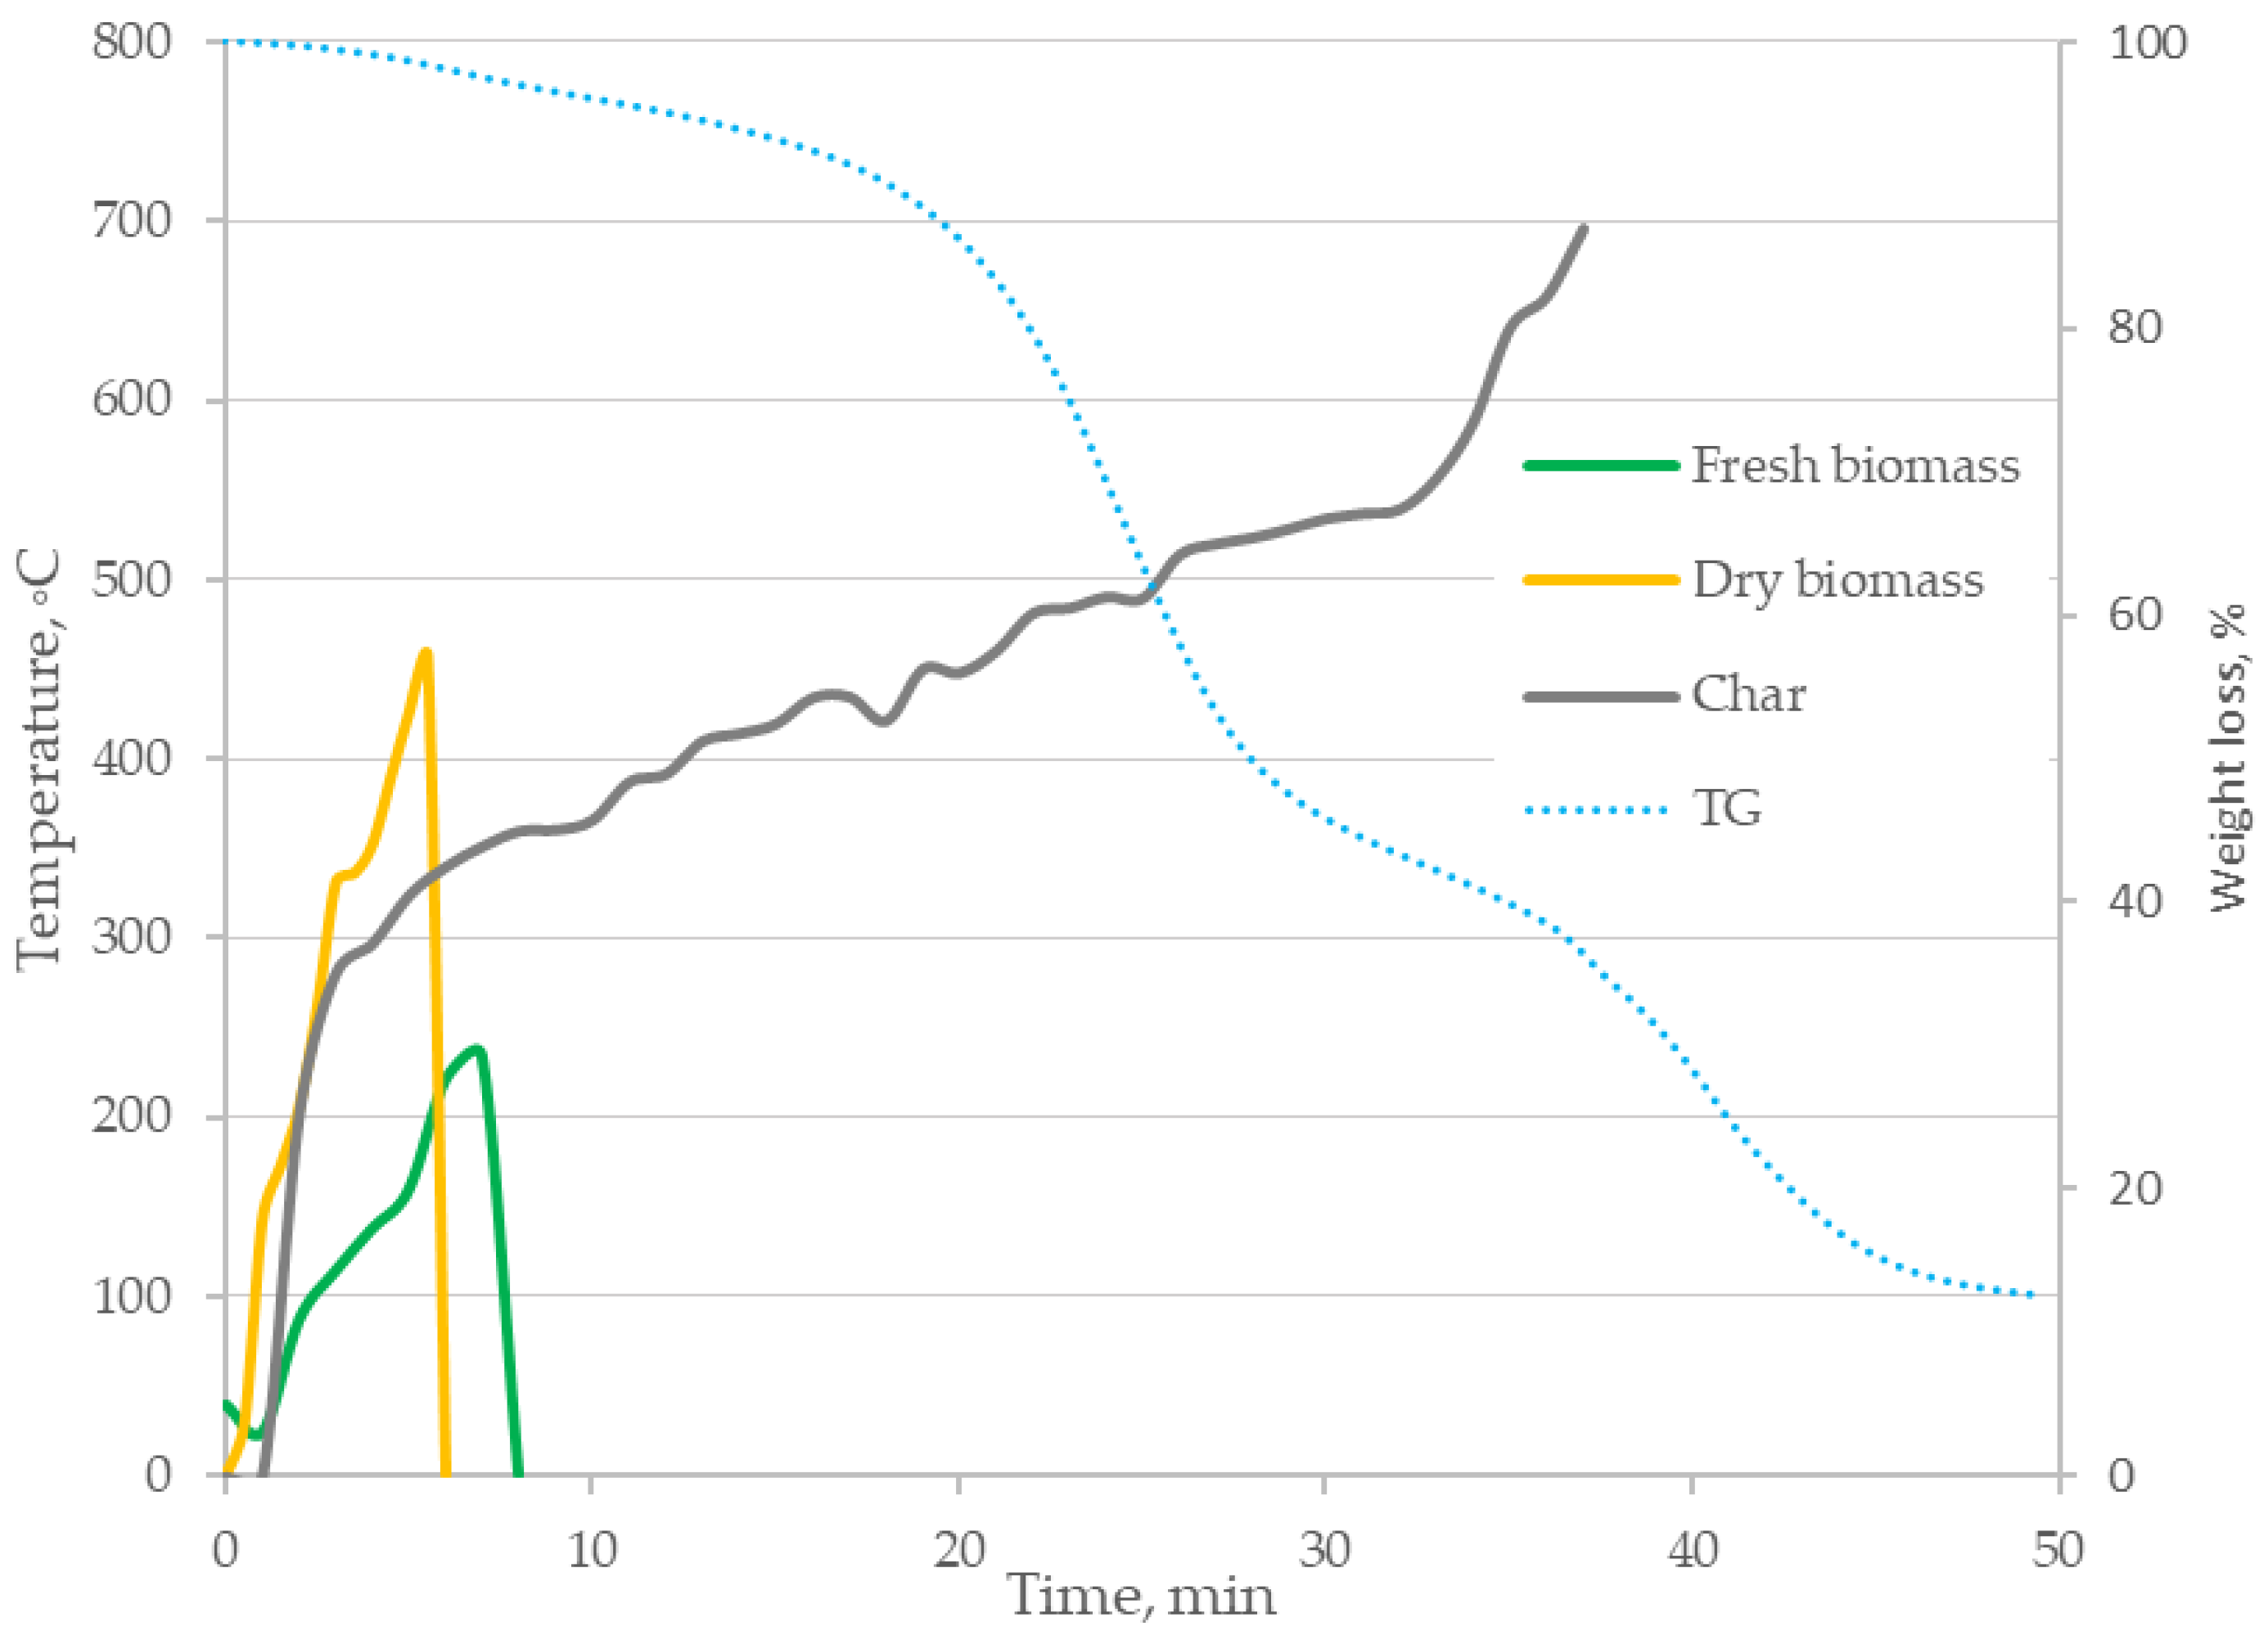
Recorded thermograms were subjected to digital image analysis. On the basis of the image analysis, the surface and thickness of the layers of successive forms of biomass were determined in the cross-section of the sample, resulting from physical and chemical changes occurring during combustion. The obtained data allowed for the preparation of graphs of changes in the surface area (Figure 5, Figure 6, Figure 7 and Figure 8) and temperature (Figure 9, Figure 10, Figure 11 and Figure 12) of fresh biomass, dry biomass and char as a function of time for each of the analysed biomass mixtures.
The analyses of the obtained curves (Figure 5, Figure 6, Figure 7 and Figure 8) confirmed that, regardless of the composition of the tested biomass, the combustion process takes place in the following stages: drying, degassing and combustion of the char and afterburning of gaseous products. In the next time steps, the surface area, and thus the share of fresh biomass, is reduced in favor of the dry fraction (drying process), and at a later stage the share of the char (biomass degassing). Similarly, in the case of the analysis of the temperature distribution (Figure 9, Figure 10, Figure 11 and Figure 12), we can see that in the range of 300–400 °C, the dry fraction of biomass disappears completely in favor of the resulting char, which is burnt at about 700 °C. The time of formation of individual phases is comparable for each tested mixture. The estimated characteristic temperatures during the physicochemical transformations of the tested samples are similar to those determined on the basis of DTG tests reported in a previous article [32].

3.2. Mathematical Model of Biomass Particles Combustion

Incineration of digestate is a complex process of physico-chemical changes during the conversion of energy contained in biomass, taking place in several phases: drying, degassing and burning of the char. The process is initiated as a result of the supplied energy in the form of heat, which increases the temperature of the biomass. Heat transport inside the biomass particle takes place mainly by conduction (Figure 13). In the initial phase of the process, that is, drying, water is removed from the material by diffusion from the inside of the material and is evaporated. A further increase in temperature causes thermal decomposition of the biomass—the formation of char and volatile matter transported to the surface of the sample. These products undergo combustion (oxidation) at a later stage. Exothermic combustion reactions generate additional internal heat sources.
The combustion process of the formed particle from the digestate was described with a mathematical model similar to the models describing the combustion of a single particle of wood and other types of biomass of plant origin [34]. These models were developed on the basis of the laws of conservation of energy and mass, and the thermodynamics of chemical processes.
In order to formulate the model, the following assumptions were made:
  • The biomass particle is a continuous medium in the shape of a limited cylinder, with isotropic properties;
  • The model describes the process of heat and mass exchange in two phases of the combustion process: drying to 100 °C and degassing and combustion of char (degassing and gasification of biomass);
  • Physical properties for successively arising phases: density, specific heat and thermal conductivity coefficient are constant;
  • The combustion kinetic constant is a function of the activation energy and temperature;
  • The model does not take into account a separate burning stage of the char.
The law of conservation of mass shows that the change in the amount of digestate during combustion is described by the following equation:
{ m p τ = m w τ m s s τ = m c h r τ + m v τ + m a τ f o r   T s p 100   ° C f o r   T s p > 100   ° C
The changes in the mass of water transported from the particle in the first combustion phase are described by the relationship
m w τ = m ss u τ  
The changes in water content in the drying phase are described by the mass diffusion partial differential equation—one-dimensional, in a cylindrical system, resulting from Fick’s second law:
u τ = D ef ( 2 u r 2 + 1 r u r )  
The second phase of the combustion process of dry matter of biomass—degassing (pyrolysis) and combustion of char—is described by a general equation resulting from the law of conservation of mass: changes in biomass dry matter are the sum of changes in substances resulting from chemical reactions of the following phases: char, volatile matter and ash:
m ss τ = m chr τ + m v τ + m a τ
The reaction rate of dry substance mass changes during pyrolysis and char combustion, taking place under non-isothermal conditions—linear temperature increase, was presented using the second-order reaction model (shrinking core), in the form of the following equation:
m ss τ = k ( T ) f ( a )
α = m ss 0 m ss τ m ss 0 m ssk  
The function f(α) of the rate of changes in the degree of biomass conversion is determined by the relationship
f ( α ) = 3 ( 1 α ) 2 3
The value of the chemical reaction kinetics constant was expressed by the Arrhenius law, according to the following equation:
k ( T ) = Aexp ( E RT )    
On the basis of the law of conservation of energy in the solid phase of the biomass particles being burned, the temperature changes in time and inside the area were determined. Internal energy changes in the elemental volume of the material, it is caused by heat conduction, generation of internal heat fluxes as a result of the phase change related to water evaporation and the occurring chemical reactions, as well as radiation during the combustion phase of the char. As a result of transforming the balance equation, the temperature changes during combustion were determined as follows:
V i ( ρ ss c ss + m ss u i ρ w c w + ρ chr c chr + ρ a c a ) T τ = λ i A i ( 2 T r 2 + 1 r T r ) m ss u τ H p + m ˙ chr Δ H chr + m v Δ H v + α A r ( T T ot )
After transforming Equation (9) it is possible to determine the temperature distribution in time and inside the sample in the individual combustion phases from the following dependencies:
T τ = λ i A V i ( ρ s s c s s + m s s u i ρ w c w ) i ( 2 T r 2 + 1   T r   r ) m ss u τ H p V i ( ρ s s c s s + m s s u i ρ w c w ) for   T     100   ° C T τ = λ i A V i ( ρ s s c s s + ρ c h r c c h r + ρ a c a ) i ( 2 T r 2 + 1   T r   r ) m chr Δ H c h r + m v Δ H v + α A r ( T T 0 t ) V i ( ρ s s c s s + ρ c h r c c h r + ρ a c a ) for   T   >   100   ° C
The presented Equations (3)–(10) form the structure of the model. In order to solve the equations, the following conditions were adopted:
-
Initial:
  • 1st combustion phase τ = 0 s: mp = mp0, u = u0, T = T0 = Tot;
  • 2nd phase of combustion τ = end of drying: u = uks, T = Tks = 100 °C, mp = mss, mchr = 0, mv = 0, ma = 0;
-
Boundary conditions:
  • For mass exchange during drying, the boundary condition of the first type of Dirichlet:
    u = u ks | r = D 2
    D ef T τ | r = 0 = 0
  • For heat transfer during the entire combustion process, the Fourier boundary condition of the type:
    • 1st combustion phase drying:
      λ p T τ | r = D 2 = q ˙  
      λ p T τ | r = 0 = 0  
    • 2nd phase of combustion—degassing and combustion of char:
      λ ef T τ | r = D 2 = q ˙  
      λ p T τ | r = 0 = 0  
To carry out simulation calculations, using the proposed model, the calculation method of solving the difference equations KM3R was used in an Excel spreadsheet. The KM3R method is based on a simple explicit difference scheme or elementary balance for solving partial differential equations with appropriate boundary conditions [35]. The presented mathematical model in the form of a system of differential equations was replaced with balance equations (mass and heat balance) of selected discrete elements. The cylindrical particle of biomass was divided into m discrete elements in the form of endless rings (∆φ = 360°, ∆z = ∞): internal and one edge (Figure 13). After appropriate transformation of the obtained system of differential equations, the sought quantity inside this element, in the middle of the segment ∆r, is determined. In the case of the presented one-dimensional model, inside discrete balance elements, the mass and temperature will be calculated at successive time points and coordinates along the radius of the cylinder (Figure 13). The cylinder has been divided into elementary volumes—concentric cylinders with a thickness of dr, and the cylindrical coordinate system is given in the geometrical centre of the cylinder (Figure 14)
The general form of the mass balance in a discrete ring element is represented by the following equation:
m pOi + 1 m pOi Δ τ = m wOi + 1 m wOi Δ τ + m charOi + 1 m charOi Δ τ + m vOi + 1 m vOi Δ τ + m aOi + 1 m aOi Δ τ
After taking into account assumption and detailed dependencies (2) and (5), the above equation will take the form
m pOi + 1 m pOi Δ τ = m ss ( u Oi + 1 u Oi ) Δ τ + A i e E i ( MR ) T oi 3 ( 1 m ssO m pOi m ssO m pOk ) 2 3
after conversion:
m pOi + 1 = m ss ( u Oi + 1 u Oi ) + A i e E i ( MR ) T oi 3 ( 1 m ssO m pOi m ssO m pOk ) 2 3 Δ τ + m pOi
The mass of a dry substance in an elemental volume is
m ss = π ρ ss l ( r 0 j + 1 2 r 0 j 2 )
Changes in the water content in the elemental volume result from the diffusion of mass through the volume of the elemental volume. The balance of water content in the elemental volume is presented in the relationship (21).
D ef Δ r ln r 0 ji r 0 ji Δ r ( u P ij u Oij ) + D ef Δ r ln r 0 ji + Δ r r 0 ji ( u Lij u Oij ) = u i + 1 u i Δ τ
After transformation, the differences in water content in the elemental volume are determined by the relationship
[ D ef Δ r ln r 0 ji r 0 ji Δ r ( u P ij u Oij ) + D ef Δ r ln r 0 ji + Δ r r 0 ji ( u Lij u Oij ) ] Δ τ + u i = u i + 1  
The energy balance equation in any discrete inner ring (r0 − ∆r/2, r0 + ∆r2/, ∆z = l, ∆φ = 360°) in the model has the following form [34]:
Q ˙ P O + Q ˙ L O + Q ˙ v = π r Oj ( i c ps ρ s ) T Oi + 1 T O i Δ τ  
2 π λ s l ln r 0 ji r 0 ji Δ r ( T Pij + 1 T Oij ) + 2 π λ s l ln r 0 ji + Δ r r 0 ji ( T Lij + 1 T Oij ) + ( s q ˙ vs ) 2 π r 0 ji Δ rl = 2 π r 0 ji Δ rl ( s c ps ρ s ) T Oi + 1 T O i Δ t
where:
  • Q ˙ PO, Q ˙ LO—heat flux supplied to the sample at point O, from the left
  • and the right element, W.
Q ˙ P O = Q ˙ L O = N
  • N—power, W.
  • r0—the length of the ray in the center of the discrete element O, m.
  • i q ˙ v i —sum of internal sources, Jm−3.
Subscripts:
  • L—point in the left discrete element.
  • P—point in the right discrete element.
  • O—point in the main central discrete element.
  • i—time step number.
  • j—spatial step number.
  • s—substance type: “char”, dry substance “s”, volatile matter “v”, ash “a”.
After transformation, Equation (24) takes the form
T Oi + 1 T O i = λ s l Δ τ r 0 ji Δ rl ( c ps ρ s ) ln r 0 ji r 0 ji Δ r ( T Pij T Oij ) + λ s l Δ τ r 0 ji Δ rl ( c ps ρ s ) ln r 0 ji + Δ r r 0 ji ( T Lij T Oij ) + i q ˙ vs r 0 Δ rl Δ τ r 0 ji Δ rl ( c ps ρ s )  
Based on the above dependencies, transient cylindrical formulas with Neumann boundary conditions: from the right P–N edge and the left L–N edge with internal sources resulting from phase transformations and exothermic reactions, the formula for calculating the temperature distribution in time and space was derived:
T O i + 1 = λ s l Δ t r 0 ji Δ rl ( i c ps ρ s ) ln r 0 ji r 0 ji Δ r ( T P T O i ) + λ s l Δ t r 0 ji Δ rl ( i c ps ρ s ) ln r 0 ji + Δ r r 0 ji ( T L T O i ) + q ˙ s r 0 ji Δ rl Δ t r 0 ji Δ rl ( c ps ρ s ) + N r 0 ji Δ rl ( c ps ρ s ) + T O i
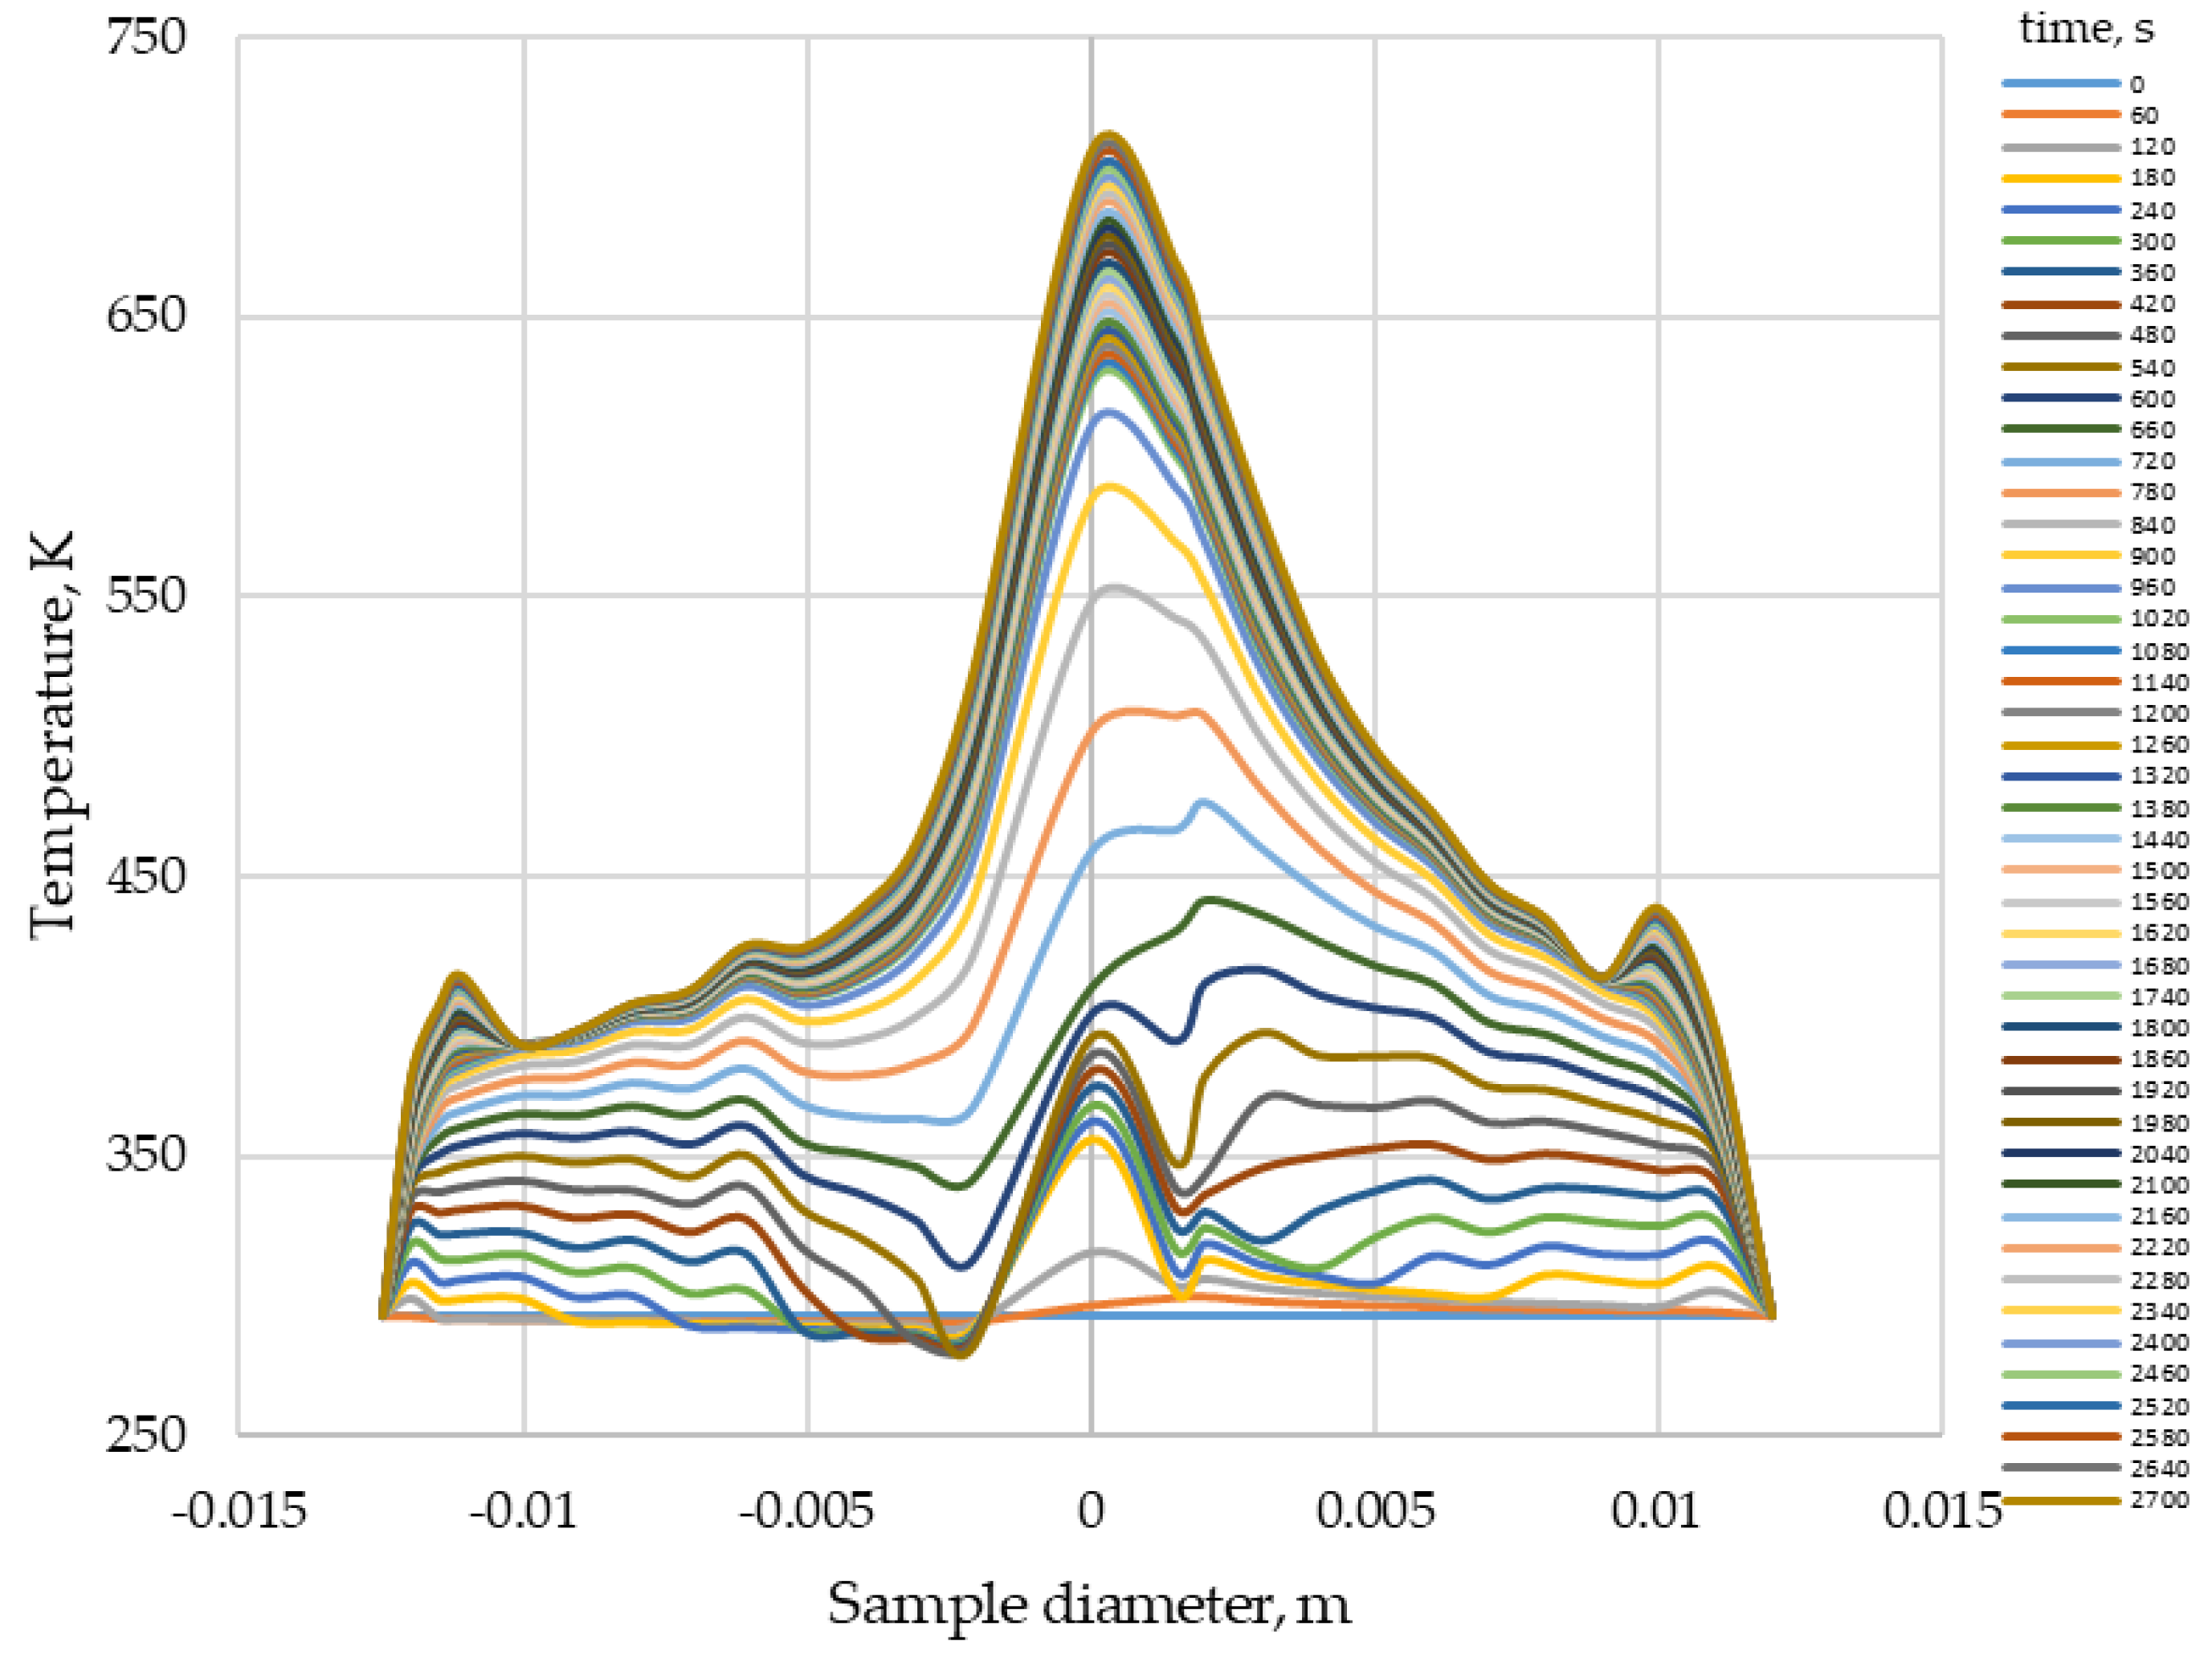
The simulation calculations were performed according to the algorithm presented in Figure 15. Data for simulation calculations are presented in Table 3. The calculations were made for a sample of the waste obtained after methane fermentation of the mixture, consisting of 50% from apple pomace and 50% from corn silage. The obtained results of simulation calculations were used for logical verification and empirical validation of the model.
The calculation results are presented in the diagrams: temperature distribution (Figure 16) and mass (Figure 17) along the radius and during the process. Simulations were made for the sample with an initial weight of 0.005 kg and a process duration of 2700 s. The obtained results from the simulation calculations are logical and in line with the expected course of changes in the examined parameters, resulting from the laws of science on the basis of which the model was formulated. A steady stream of heat is supplied to the sample, which is then conducted inside it. As the temperature increases, the water evaporates, which goes into the degassing process and burning the char. Figure 16, which illustrates the temperature distribution, shows in the initial period, faster temperature increase in the outer elementary rings. Later in the process, the peak with the maximum value approaches the axis of the cylinder. At the same time, the mass of the sample decreases as a result of the evaporation of water, further degassing and ashing of the char. In the course of these changes, one can observe the narrowing of the distribution of the analysed parameters to a smaller and smaller diameter which, under the conditions of the combustion process, decreases as the sample shrinks as a result of physical and chemical changes. There is no symmetrical distribution about the cylinder axis, which follows from the method of numerical calculations used, which approximates the solution, but also from the assumptions made for the model. The stages of degassing and burning of the char were combined, the processes taking place in the gas phase were not taken into account; therefore, the sensitivity of the model to mass changes is lower.
The model was also validated by comparing the calculation results from the model with test results. The comparison only concerned changes with respect to time. The results of experimental studies presented in previous chapters were used for validation.
Figure 18 shows the course of the sample temperature changes along the sample axis measured with a thermovision camera with the sample axis calculated on the basis of the model. They show a good agreement of the temperature values over a period of 1700 s. Local relative errors between the values obtained from the model and the measured values ranged from 1 to 15%, and subsequently rose sharply to almost 30%. This increase in error was due to the fact that the sample disintegrated as it was incinerated and the temperature measurement with the thermal imaging camera was inconclusive in relation to the solid substance. In addition, the research method used and the assumptions for the model are not perfect. During the tests, the sample, as it was incinerated, fell to the bottom of the sample, and the model assumed a stiff cylindrical shape throughout the entire process. However, it can be concluded that the correctness of the temperature distribution model has been confirmed. The correlation between the measured and calculated values was R = 0.82, the coefficient R2 = 0.96.
The validation of the model relating to the changes in the sample mass calculated from the model was made on the basis of measurements performed on a laboratory stand equipped with a tube furnace. As the measurements used to validate the model describing the changes in temperature and mass of the samples of the tested biomass were made on two different stands, due to the difficulties associated with the simultaneous measurement of these quantities in the furnace where the samples were burned, the correctness of the mass changes calculated on the basis of simulated mass changes was checked based on the substance conversion degree. The degree of conversion was calculated for the results obtained from the tests and simulation calculations according to Figure 19.
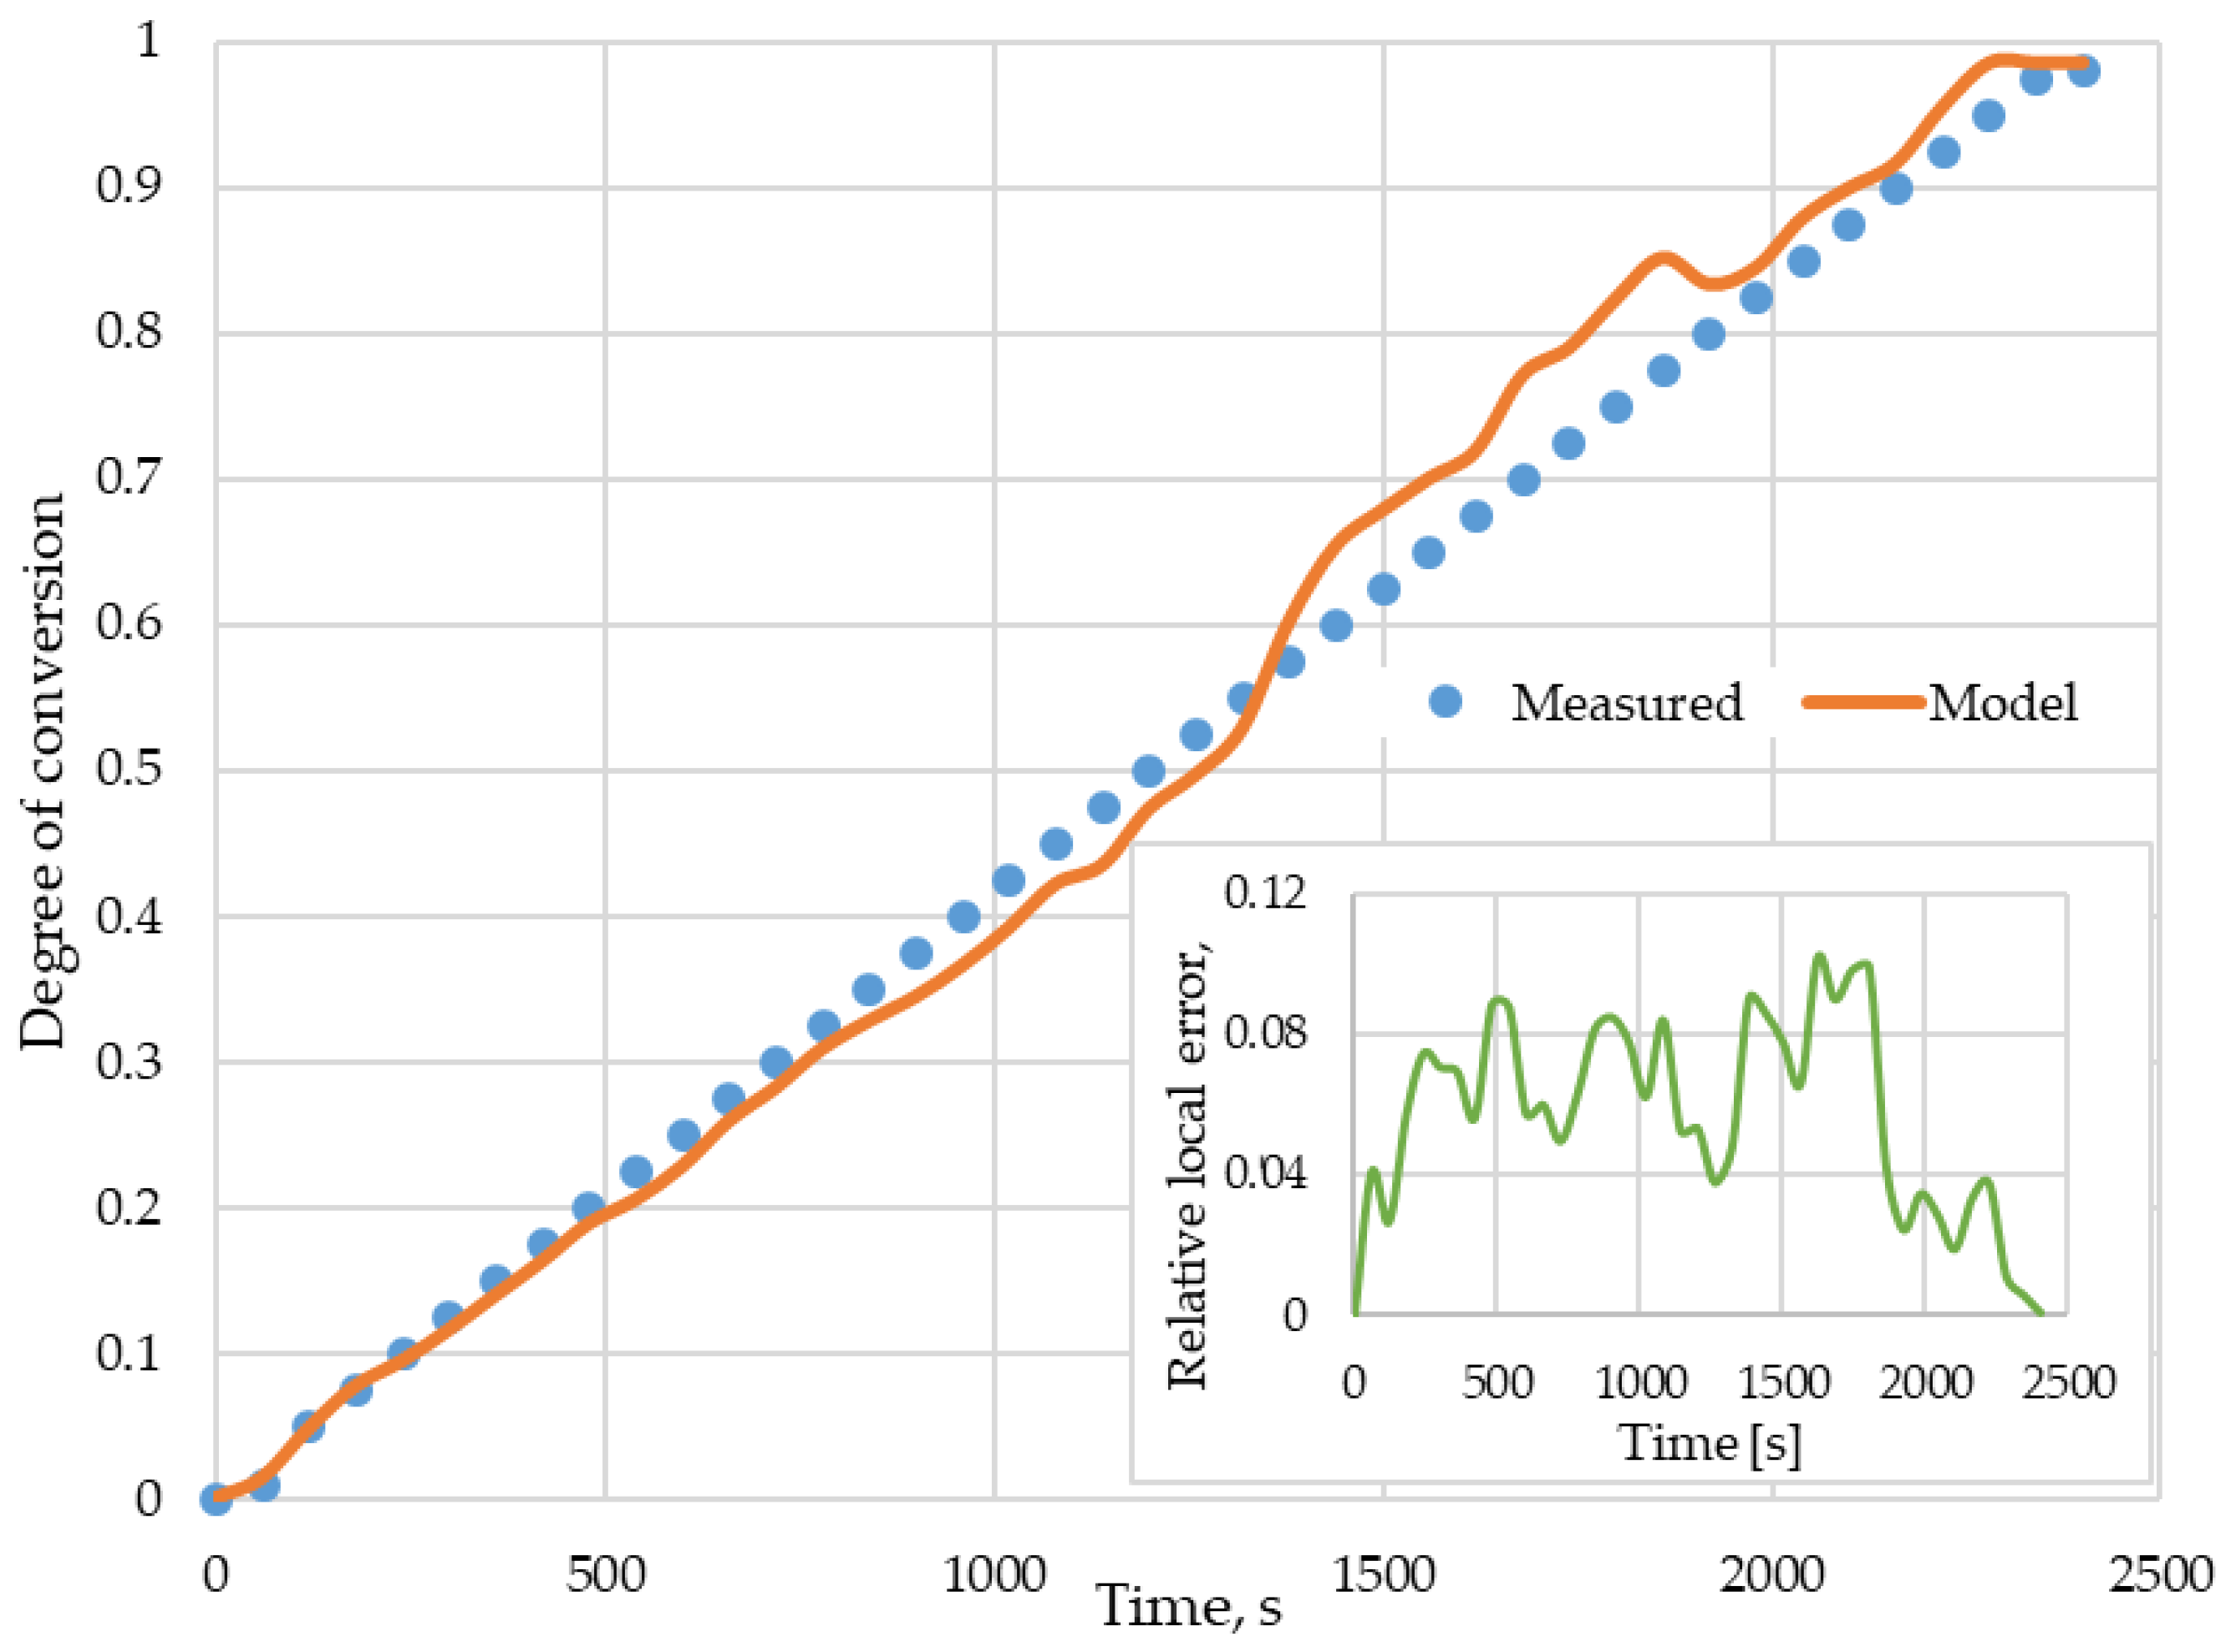
Figure 20 shows the changes in the degree of biomass conversion over time, obtained from measurements and simulation calculations. Relative local error between the model values and the results obtained from the experiments ranged from 0 to 10%. These amplitude fluctuations result from the simplification of the model, the assumption of a rigid boundary between drying and degassing—during the combustion process, the degassing process is superimposed on drying, and the combustion of the char is partially covered with degassing, hence the high likelihood of such changes in the error value. The correlation coefficient between the values of the degree of conversion obtained from the measurements and the values calculated from the model was 0.96, and the coefficient of explanatory variance R2 = 0.99 (Figure 21), which can be considered a confirmation of the correctness of the model.
The developed simplified model requires improvement, but can already be used to determine the temperature distribution and mass changes during the combustion of individual biomass particles, but also to simulate the combustion process in an energy conversion device (in boilers or furnaces).

4. Conclusions

The conducted research made it possible to formulate a model of particle combustion kinetics in two stages in the solid phase: the first, drying the particles; the second, degassing and combustion of the char. The structure of the model was derived from the laws of heat transfer and mass, as well as process thermodynamics and described by differential equations together with appropriate boundary conditions (condition of the first type—for the mass diffusion equation; condition of the second type—the equation describing the temperature distribution in the particle). To solve the model, the method of elementary volumes was used and simulation calculations were made in Excel using the KM3R method. The model has been logically verified taking into account the course of temperature and mass changes in relation to the laws of science and validation by means of particle combustion experiments performed at laboratory stands.
The results obtained from the conducted research allowed us to formulate the following conclusions:
  • The physicochemical properties of the tested mixtures changed with the change of composition—an increase in the proportion of maize silage in the analysed mixtures resulted in an increase in ash content and a simultaneous decrease in calorific value and heat of combustion, while in the case of an increase in the share of apple pomace, an increase in volatile matter was observed;
  • Regardless of the composition of the analysed mixtures, their elemental composition was similar to each other;
  • The formulated research hypothesis has been verified correctly—based on thermogravimetric tests, differential scanning calorimetry and the proposed method of thermogram analysis, it was found that the digestate combustion process takes place in the following stages: drying, degassing and gasification as well as char combustion. This was confirmed by temperature measurements inside the sample during the process and mass loss rate tests, enabling identification of phase changes during the process;
  • The heating rate of the samples influences the course of the TG curves, shifting the speed maxima towards higher temperatures;
  • The compared mixtures differ significantly in terms of the combustion kinetics (p < 0.05);
  • The mathematical model of digestate combustion, derived from the laws of heat and mass transfer and thermodynamics of chemical processes, has been logically correctly verified and verified by validation with test results;
  • The assumption, which simplifies the model, that the combustion process consists of two stages, drying and degassing as well as char combustion, has been confirmed by the validation.
As this paper is part of more complex research, in the next stage, a more complex model will be proposed. This model should be capable of determining, in a more accurate manner, the changes occurring during combustion of a particle (pellet or briquette) of fuel. Parameters such as list of materials or boundary conditions are under evaluation.

Author Contributions

Conceptualization, K.D., M.J. (Michał Jurczyk), T.P. and B.Ł.-K.; methodology, K.D., M.J. (Michał Jurczyk), B.Ł.-K. and M.J. (Marcin Jewiarz); investigation, T.P., K.M., M.W. and M.J. (Marcin Jewiarz); formal analysis B.Ł.-K. and T.P.; resources, K.D.; data curation, M.W. and K.M.; writing—original draft preparation, K.D., M.J. (Marcin Jewiarz), K.M. and M.W.; writing—review and editing, K.D., M.W. and M.J. (Michał Jurczyk); visualization, T.P.; supervision, M.J. (Michał Jurczyk) and M.J. (Marcin Jewiarz); project administration, K.D.; software B.Ł.-K. and K.M. All authors have read and agreed to the published version of the manuscript.

Funding

This research was supported by the Ministry of Science and Higher Education of the Republic of Poland.

Institutional Review Board Statement

Not applicable.

Informed Consent Statement

Not applicable.

Data Availability Statement

The data presented in this study are available on request from the corresponding author.

Conflicts of Interest

The authors declare no conflict of interest.

References

  1. Mason, P.E.; Darvell, L.I.; Jones, J.M.; Pourkashanian, M.; Williams, A. Single particle flame-combustion studies on solid biomass fuels. Fuel 2015, 151, 21–30. [Google Scholar] [CrossRef]
  2. Fagerström, J.; Steinvall, E.; Boström, D.; Boman, C. Alkali transformation during single pellet combustion of soft wood and wheat straw. Fuel Processing Technol. 2016, 143, 204–212. [Google Scholar] [CrossRef]
  3. Mian, I.; Li, X.; Dacres, O.D.; Wang, J.; Wei, B.; Jian, Y.; Zhong, M.; Liu, J.; Ma, F.; Rahman, N. Combustion kinetics and mechanism of biomass pellet. Energy 2020, 205, 117909. [Google Scholar] [CrossRef]
  4. Fournel, S.; Palacios, J.H.; Morissette, R.; Villeneuve, J.; Godbout, S.; Heitz, M.; Savoie, P. Influence of biomass properties on technical and environmental performance of a multi-fuel boiler during on-farm combustion of energy crops. Appl. Energy 2015, 141, 247–259. [Google Scholar] [CrossRef]
  5. Chen, W.H.; Lin, B.J.; Lin, Y.Y.; Chu, Y.S.; Ubando, A.T.; Show, P.L.; Ong, H.C.; Chang, J.S.; Ho, S.H.; Culaba, A.B.; et al. Progress in biomass torrefaction: Principles, applications and challenges. Prog. Energy Combust. Sci. 2021, 82, 100887. [Google Scholar] [CrossRef]
  6. Hustad, J.E.; Skreiberg, O.; Sonju, O.K. Biomass Combustion Research and Utilization in IEA Countries. Biomass Bioenergy 1995, 9, 235–255. [Google Scholar] [CrossRef]
  7. Fletcher, D.F.; Haynes, B.S.; Christo, F.C.; Joseph, S.D. A CFD based combustion model of an entrained flow biomass gasifier. Appl. Math. Model. 2000, 24, 165–182. [Google Scholar] [CrossRef]
  8. Saidur, R.; Abdelaziz, E.A.; Demirbas, A.; Hossain, M.S.; Mekhilef, S. A review on biomass as a fuel for boilers. Renew Sustain. Energy Rev. 2011, 15, 2262–2289. [Google Scholar] [CrossRef]
  9. Nipattummakul, N.; Ahmed, I.I.; Kerdsuwan, S.; Gupta, A.K. Steam gasification of oil palm trunk waste for clean syngas production. Apply Energy 2012, 92, 778–782. [Google Scholar] [CrossRef]
  10. Kubica, K.; Jewiarz, M.; Kubica, R.; Szlȩk, A. Straw Combustion: Pilot and Laboratory Studies on a Straw-Fired Grate Boiler. Energy Fuels 2016, 30, 4405–4410. [Google Scholar] [CrossRef]
  11. Bavutti, M.; Guidetti, L.; Allesina, G.; Libbra, A.; Muscio, A.; Pedrazzi, S. Thermal stabilization of digesters of biogas plants by means of optimization of the surface radiative properties of the gasometer domes. Energy Procedia 2014, 45, 1344–1353. [Google Scholar] [CrossRef] [Green Version]
  12. Grinzi, G.; Guidetti, L.; Allesina, G.; Libbra, A.; Martini, P.; Muscio, A. Increase of net power generation of biogas plants by reduction of heat loss. In Proceedings of the 20th European Biomass Conference and Exhibition, Milan, Italy, 18–22 June 2012; pp. 1444–1449. [Google Scholar]
  13. Stürmer, B.; Pfundtner, E.; Kirchmeyr, F.; Uschnig, S. Legal requirements for digestate as fertilizer in Austria and the European Union compared to actual technical parameters. J. Environ. Manag. 2020, 253, 109756. [Google Scholar] [CrossRef] [PubMed]
  14. Alburquerque, J.A.; de la Fuente, C.; Ferrer-Costa, A.; Carrasco, L.; Cegarra, J.; Abad, M.; Bernal, M.P. Assessment of the fertiliser potential of digestates from farm and agroindustrial residues. Biomass Bioenergy 2012, 40, 181–189. [Google Scholar] [CrossRef]
  15. Available online: https://bip.kowr.gov.pl/informacje-publiczne/odnawialne-zrodla-energii/biogaz-rolniczy/dane-dotyczace-dzialalnosci-wytworcow-biogazu-rolniczego-w-latach-2011-2021 (accessed on 1 June 2022).
  16. Available online: https://bip.kowr.gov.pl/uploads/pliki/oze/biogaz/BIP%20Dane%20dotycz%C4%85ce%20dzia%C5%82%C4%85no%C5%9Bci%20wytw%C3%B3rc%C3%B3w%20biogazu%20rolniczego%20surowce%202021%20r..pdf (accessed on 1 June 2022).
  17. Herbes, C.; Roth, U.; Wulf, S.; Dahlin, J. Economic assessment of different biogas digestate processing technologies: A scenario-based analysis. J. Clean. Prod. 2020, 255, 120282. [Google Scholar] [CrossRef]
  18. Available online: https://eur-lex.europa.eu/legal-content/PL/TXT/?uri=celex:31991L0676 (accessed on 1 June 2022).
  19. Koszel, M.; Lorencowicz, E. Agricultural Use of Biogas Digestate as a Replacement Fertilizers. Agric. Agric. Sci. Procedia 2015, 7, 119–124. [Google Scholar] [CrossRef] [Green Version]
  20. Nagy, D.; Balogh, P.; Gabnai, Z.; Popp, J.; Oláh, J.; Bai, A. Economic analysis of pellet production in co-digestion biogas plants. Energies 2018, 11, 135. [Google Scholar] [CrossRef] [Green Version]
  21. Szufa, S.; Piersa, P.; Adrian, Ł.; Sielski, J.; Grzesik, M.; Romanowska-Duda, Z.; Piotrowski, K.; Lewandowska, W. Acquisition of torrefied biomass from Jerusalem artichoke grown in a closed circular system using biogas plant waste. Molecules 2020, 25, 3862. [Google Scholar] [CrossRef]
  22. Jewiarz, M.; Wróbel, M.; Fraczek, J.; Mudryk, K.; Dziedzic, K. Digestate, ash and Trichoderm based fertilizer-production line concept design. MATEC Web Conf. 2018, 168, 04004. [Google Scholar] [CrossRef] [Green Version]
  23. Cathcart, A.; Smyth, B.M.; Lyons, G.; Murray, S.T.; Rooney, D.; Johnston, C.R. An economic analysis of anaerobic digestate fuel pellet production: Can digestate fuel pellets add value to existing operations? Clean. Eng. Technol. 2021, 3, 100098. [Google Scholar] [CrossRef]
  24. Roman, M.; Bobasu, E.; Selisteanu, D. Modelling of biomass combustion process. Energy Procedia 2011, 6, 432–440. [Google Scholar] [CrossRef] [Green Version]
  25. ISO 17225-6:2014; Solid Biofuels—Fuel Specifications and Classes—Part 6: Graded Non-Woody Pellets. European Committee for Standardization: Geneva, Switzerland, 2014.
  26. ISO 17225-7:2014; Solid Biofuels—Fuel Specifications and Classes—Part 7: Graded Non-Woody Briquettes. European Committee for Standardization: Geneva, Switzerland, 2015.
  27. Barnetoa, A.G.; Carmonaa, J.A.; Martín Alfonsoa, J.; Serranob, R.S. Simulation of the thermogravimetry analysis of three non-wood pulps. Bioresour. Technol. 2010, 101, 3220–3229. [Google Scholar] [CrossRef] [PubMed]
  28. Mansaray, K.G.; Ghaly, A.E. Determination of reaction kinetics of rice husks in air using thermogravimetric analysis. Energy Sources 1999, 21, 899–911. [Google Scholar]
  29. Senneca, O. Kinetics of pyrolysis, combustion and gasification of three biomass fuels. Fuel Processing Technol. 2007, 88, 87–97. [Google Scholar] [CrossRef]
  30. Xie, Z.; Ma, X. The thermal behaviour of the co-combustion between paper sludge and rice straw. Bioresour. Technol. 2013, 146, 611–618. [Google Scholar] [CrossRef]
  31. Akor, C.I.; Osman, A.I.; Farrell, C.; McCallum, C.S.; John Doran, W.; Morgan, K.; Harrison, J.; Walsh, P.J.; Sheldrake, G.N. Thermokinetic study of residual solid digestate from anaerobic digestion. Chem. Eng. J. 2021, 406, 127039. [Google Scholar] [CrossRef]
  32. Dziedzic, K.; Łapczyńska-Kordon, B.; Jurczyk, M.; Arczewska, M.; Wróbel, M.; Jewiarz, M.; Mudryk, K.; Pająk, T. Solid Digestate—Physicochemical and Thermal Study. Energies 2021, 14, 7224. [Google Scholar] [CrossRef]
  33. Mudryk, K.; Jewiarz, M.; Wróbel, M.; Niemiec, M.; Dyjakon, A. Evaluation of urban tree leaf biomass-potential, physico-mechanical and chemical parameters of raw material and solid biofuel. Energies 2021, 14, 818. [Google Scholar] [CrossRef]
  34. Porteiro, J. Mathematical modelling of the combustion of a single wood particle. Fuel Processing Technol. 2006, 87, 169–175. [Google Scholar] [CrossRef]
  35. Nagórski, Z. Modelowanie Przepływu Ciepła Metodą KM3R: MBE + Excel = KM3R; Oficyna Wydawnicza Politechniki Warszawskiej: Warszawa, Poland, 2014. [Google Scholar]
  36. Szargut, J. Termodynamika Techniczna; Wydawnictwo Politechniki Śląskiej: Gliwice, Poland, 2011. [Google Scholar]
  37. Li, H.; Lindmark, J.; Nordlander, E.; Thorin, E.; Dahlquist, E.; Zhao, L. Using the solid digestate from a wet anaerobic digestion process as an energy resource. Energy Technol. 2013, 1, 94–101. [Google Scholar] [CrossRef]
  38. Souza Costa, F.; Sandberg, D. Mathematical model of a smoldering log. Combust. Flame 2004, 139, 227–238. [Google Scholar] [CrossRef]
  39. Janse, A.M.C.; Westerhout, R.W.J.; Prins, W. Modelling of flash pyrolysis of a single wood particle. Chem. Eng. Processing Process Intensif. 2000, 39, 239–252. [Google Scholar] [CrossRef]
Figure 1. Material before and after the agglomeration process.
Energies 15 04402 g001
Figure 2. Stand for burning biomass particles.
Energies 15 04402 g002
Figure 3. Thermal imaging camera FLIR ThermaCAM E300.
Energies 15 04402 g003
Figure 4. Thermograms of 50K50J sample combustion, (a) ignition of external part of the material, (bg) progressive process of drying the material and fuel degassing, (hj) char ashing, (kl) ash formation.
Energies 15 04402 g004aEnergies 15 04402 g004b
Figure 5. Change in the surface area of fresh biomass, dry biomass and char—sample 10K90J.
Energies 15 04402 g005
Figure 6. Change in the surface area of fresh biomass, dry biomass and char—sample 25K75J.
Energies 15 04402 g006
Figure 7. Change in the surface area of fresh biomass, dry biomass and char—sample 50K50J.
Energies 15 04402 g007
Figure 8. Change in the surface area of fresh biomass, dry biomass and char—sample 75K25J.
Energies 15 04402 g008
Figure 9. Change in the temperature of fresh biomass, dry biomass and char—sample 10K90J.
Energies 15 04402 g009
Figure 10. Change in the temperature of fresh biomass, dry biomass and char—sample 25K75J.
Energies 15 04402 g010
Figure 11. Change in the temperature of fresh biomass, dry biomass and char—sample 50K50J.
Energies 15 04402 g011
Figure 12. Change in the temperature of fresh biomass, dry biomass and char—sample 75K25J.
Energies 15 04402 g012
Figure 13. Scheme of the sample and heat fluxes.
Energies 15 04402 g013
Figure 14. Balance diagram of the model.
Energies 15 04402 g014
Figure 15. Algorithm diagram of the simulation model.
Energies 15 04402 g015
Figure 16. The result of simulation calculations of the temperature distribution along the sample diameter over time.
Energies 15 04402 g016
Figure 17. Calculations results of the time distribution along the sample diameter.
Energies 15 04402 g017
Figure 18. Comparison of the temperature distribution measured with the temperature calculated from the model.
Energies 15 04402 g018
Figure 19. Correlation of measured and calculated temperature.
Energies 15 04402 g019
Figure 20. Comparison of the degree of conversion measured with the degree of conversion calculated.
Energies 15 04402 g020
Figure 21. Correlation of the degree of conversion measured and calculated.
Energies 15 04402 g021
Table 1. Feedstock composition of digestate used as test fuel (% in a received state).
Sample CodeCorn Silage (%)Apple Pomace (%)
10K90J1090
25K75J2575
50K50J5050
75K25J7525
Table 2. Physical properties of tested mixtures of post-fermentation biomass [32].
ParameterUnitDigestate Type
10K90J25K75J50K50J75K25J
Mad%12.1012.2011.9011.90
Ad%8.208.4010.1011.60
Vd%83.1089.8079.7078.80
HHVJ g−119,60018,55018,31016,420
LHVJ g−118,41017,14017,11015,340
SDg cm−30.880.880.82 0.89
ADg cm−31.53 1.551.56 1.53
P%42.5043.2047.1041.80
Mad—moisture content; Ad—ash content; Vd—volatile content; HHV—higher heating value; LHV—lower heating value; SD—specific density; AD—absolute density; P—porosity.
Table 3. Data for simulation calculations.
ParameterUnitValueSource
Water vaporization heatJ·kg−12,500,000[36]
Heat of combustion of the dry digestateJ·kg−118,310,000own research
Heat of char combustion J·kg−132,800[37]
Specific heat of biomassJ·kg−1 K−11269own research
Specific heat of charJ·kg−1 K−13854own research
Specific heat of ashJ·kg−1 K−14012own research
Heat of volatile components release J·kg−1−418,000[37]
Sample lengthm0.025own research
Density—biomasskg·m−3880own research
Density—charkg·m−3294own research
Density—ashkg·m−3602own research
Time steps60-
Spatial stepm0.001-
Initial sample weight—Neumann boundary conditionkg0.005own research
Heat flux—Neumann boundary conditionW160own research
Sample diameterm0.025own research
Evaporation temperatureK373[36]
Universal gas constantJ·kmol−1 K−18315[36]
Sample moisturekg·kg−10.122own research
Mass diffusion coefficientm2·s−10.000001own research
Thermal conductivity—biomassW·m−1·K−10.58[38]
Thermal conductivity—charW·m−1·K−10.20[39]
Thermal conductivity—ashW·m−1·K−10.10[38]
Volatile matter contentkg0.7301own research
Ash contentkg0.0721own research
Publisher’s Note: MDPI stays neutral with regard to jurisdictional claims in published maps and institutional affiliations.