Article

Experimental Study of a Hybrid Solar Collector Using TiO2/Water Nanofluids

by
Muniyandy Elangovan
1,*,
Baskaran Srimanickam
1,
Robert Čep
2,*,
Amirtharajan Saranya
3 and
Manickam Ramachandran
4
1
Department of Mechanical Engineering, Vel Tech Rangarajan Dr. Sagunthala R&D Institute of Science and Technology, Chennai 600062, India
2
Department of Machining, Assembly and Engineering Metrology, Faculty of Mechanical Engineering, VSB-Technical University of Ostrava, 708 00 Ostrava, Czech Republic
3
Department of Physics, Vel Tech Rangarajan Dr. Sagunthala R&D Institute of Science and Technology, Chennai 600062, India
4
Data Analytics Lab, REST Labs, Kaveripattinam, Krishnagiri 635112, India
*
Authors to whom correspondence should be addressed.
Energies 2022, 15(12), 4425; https://doi.org/10.3390/en15124425
Submission received: 21 May 2022 / Revised: 15 June 2022 / Accepted: 16 June 2022 / Published: 17 June 2022

Abstract

:
A case study of solar collector outdoor test of the experimental technique conducted at Avadi, Chennai. To lower the temperature of solar PV panels, water, and water-based nanofluids were utilized concurrently. Higher cell temperatures restrict the effectiveness of solar PV systems since only a minor amount of power from the sun is gathered as electricity from the energy conversion, and the remaining energy is squandered as heat. The study aimed to develop and build a hybrid collector while also analyzing its electrical and thermal energy performance. The effort was invested in improving the system’s performance; the PVT collector was tested at volume concentrations of two, such as 0.5 and 1.0 L per minute (LPM). The PV/T collector determined thermal efficiency as highest was 48.38 percent and 54.03 percent, respectively, at 0.5 LPM and 1.0 LPM of volume flow rates. The PV/T collector’s highest electrical efficiency was 18.32 percent and 19.35 percent, respectively, for 0.5 LPM and 1.0 LPM of volume flow rates. The results demonstrate that nanofluid has more excellent thermal conductivity than a base fluid with a little change in the fluid viscosity and density.

1. Introduction

The increase in global energy requirements every year, and the gradual depletion of traditional fuels necessitates technological advancements based on alternative energy sources [1]. Solar collectors for industries and households are frequently used to heat water with solar energy. Out of two collectors, one is called a Solar flat plate collector and the other is called an evacuated tube collector. To increase productivity, two different power conversion systems, known as hybrid power or photovoltaic thermal systems, can be coupled together [2,3]. Solar renewable energy is a popular renewable source because it is free, feasible, durable, has a low maintenance cost, is environmentally friendly, and has a wide range of applications. However, it has drawbacks, such as increasing the solar panel’s temperature by 10 degrees Celsius, resulting in a 0.5 percent decrease in electrical efficiency for silicon cells because cooling of the solar panel may be required for improved efficiency.
Cooling liquids such as air or water are used in the solar panel system to reduce the temperature [4,5,6,7,8,9]. There are two ways that the performance of a solar panel can be increased. First is solar panel cooling, and another is a medium for storing waste heat. Air and water are commonly used to cool solar panels as a traditional cooling method. Nonetheless, it has its own set of virtues and merits. As a result of the foregoing encounters, many researchers worldwide have been using nanomaterials as a superior cooling fluid to improve thermal and electrical performance. As a result, overall performance can be improved. The following are some examples of successful studies conducted around the world. Choi and Estman [10] pioneered nanofluids as a cooler in PVT systems, which sparked considerable interest due to their superior thermophysical properties examined to the standard fluids. The solid-liquid synthesized nanoparticles in a company with diameters typically ranging from 1–100 nm drifting in water [11].
Many experiments demonstrated that water nanofluid has a significantly larger heat transfer coefficient occurs than basic fluids [12,13,14]. The enrichment of heat transfer was done by nanofluids in hybrid collectors, with a few negative impacts, such as increased pressure drop in the system [15], a limited period of its stability, and a higher cost of nanoparticles. Sardarabadi et al. [16] experimented with water as a base fluid with PVT systems and at various concentrations of SiO2 nanofluid. It was concluded that overall performance attained 3.6 to 7.9 percent for 1 to 3 wt. percent. Ghadiri et al. [17] examined water and ferrofluid with varying compositions using an indoor PVT system. The overall efficiency was 45 percent when compared to a hybrid system. Sardarabadi et al. [18] used deionized water to dissolve three types of nanoparticles (AL2O3, TiO2, and ZnO).
Al-shamani et al. [19] experimented with various nanofluids at different flow rates. According to the results, sic had the highest electrical performance of about 13.52 percent and the overall maximum efficiency of 78.24 percent. Soltani et al. [20] demonstrated an investigational study in a hybrid system using water nanofluid. It was discovered that full enactment and power generation increased by 3.13 percent and 52.4 percent, respectively. The authors also revealed that SiO2 improved total performance and power generation by 3.29 percent and 43.36 percent, respectively. Al-Waeli et al. [21] used collectors to investigate three types of nanofluids.
Al-Waeli et al. [22] demonstrated the influence of Silicon chloride/water nanofluid on hybrid systems, which improved electrical energy efficiency to 23.9 percent and heat power efficiency to 99.23 percent. It also discovered that it had a superior overall performance of approximately 88.9 percent when compared to a PV system. Mohammad Sardarabadi et al. [23] examined the silica nanofluid’s efficiency in a PVT system experimentally. It concluded with a 7.9 percent improvement in overall performance and a 24.3 percent improvement in exergy. For long-term stability, Ag/water nanofluid was processed by electrical explosion of wire [24,25]. The system was evaluated using a thermodynamic study, specifically energy and exergy efficiency. This experiment was carried out using various flow patterns and concentrations.
Muhammad Azam investigated a mathematical model of a chemically reactive Maxwell nanofluid for axisymmetric flow using the Cattaneo-Christov heat flux model and a revised nanofluid model. [26]. The impact of Arrhenius activation energy and melting events on chemically reactive Falkner-Skan flow of cross nanofluid across a moving wedge with viscous dissipation and nonlinear radiation impacts are studied using a theoretical numerical communication [27]. The primary goal of this paper is to investigate the effects of melting phenomena and nonlinear chemical reactions on transient bioconvection flow of a sutterby nanoliquid with gyrotactic microorganisms and heat source/sink [28]. Muhammad Azam [29] studied the unsteady bio-convection flow of nanofluid under the impact of microorganisms and nonlinear radiation using mathematical modeling and simulation.
The research goal is to demonstrate manganese chloride as a coolant to improve the PVT collector performance. The manganese chloride nanofluid has been experimentally explored for the first time to cool and improve the performance of a single glazing surface PVT system. The developed PVT collector and PV module were tested outdoors at the Chennai meteorological station using 0.5 wt. percent concentrations of nanofluids and pure water as coolants at 0.5 and 1.0 L per minute. The energetic study of a hybrid collector with nanofluid coolants was carried out, and comparisons to PV modules and water-cooled PVT systems were. It was also discovered that the findings of this inquiry were equivalent to those published in peer-reviewed journals.

2. Experimental Study Procedure

The findings are from tests conducted in Avadi, near Chennai (The Capital of Tamil Nadu, Southern India). Chennai city is located on the thermal equator and the coast, which prevents seasonal temperature variations from becoming considerable. The average relative humidity is 69%, the average ambient temperature ranges from 24.8 °C to 33.1 °C, and the average number of sunshine hours is 7.8. The suggested approach was built, produced, and tested to determine the efficiency of nano-PCM and nanofluid PVT systems, then compared to liquid PVT systems and freestanding PV modules. In addition, water as a cooler with varied flow rates was tested in the PVT system, while nano-PCM and nanofluid with varying concentrations and flow rates were tested in the hybrid collector. The finished system is a self-contained PV module that usually works—an experimental setup at the specific location in Figure 1. As per the Indian subcontinent is located in the northern hemisphere of the earth where a 13-degree inclination is measured. In this study, there is no variation in inclination.
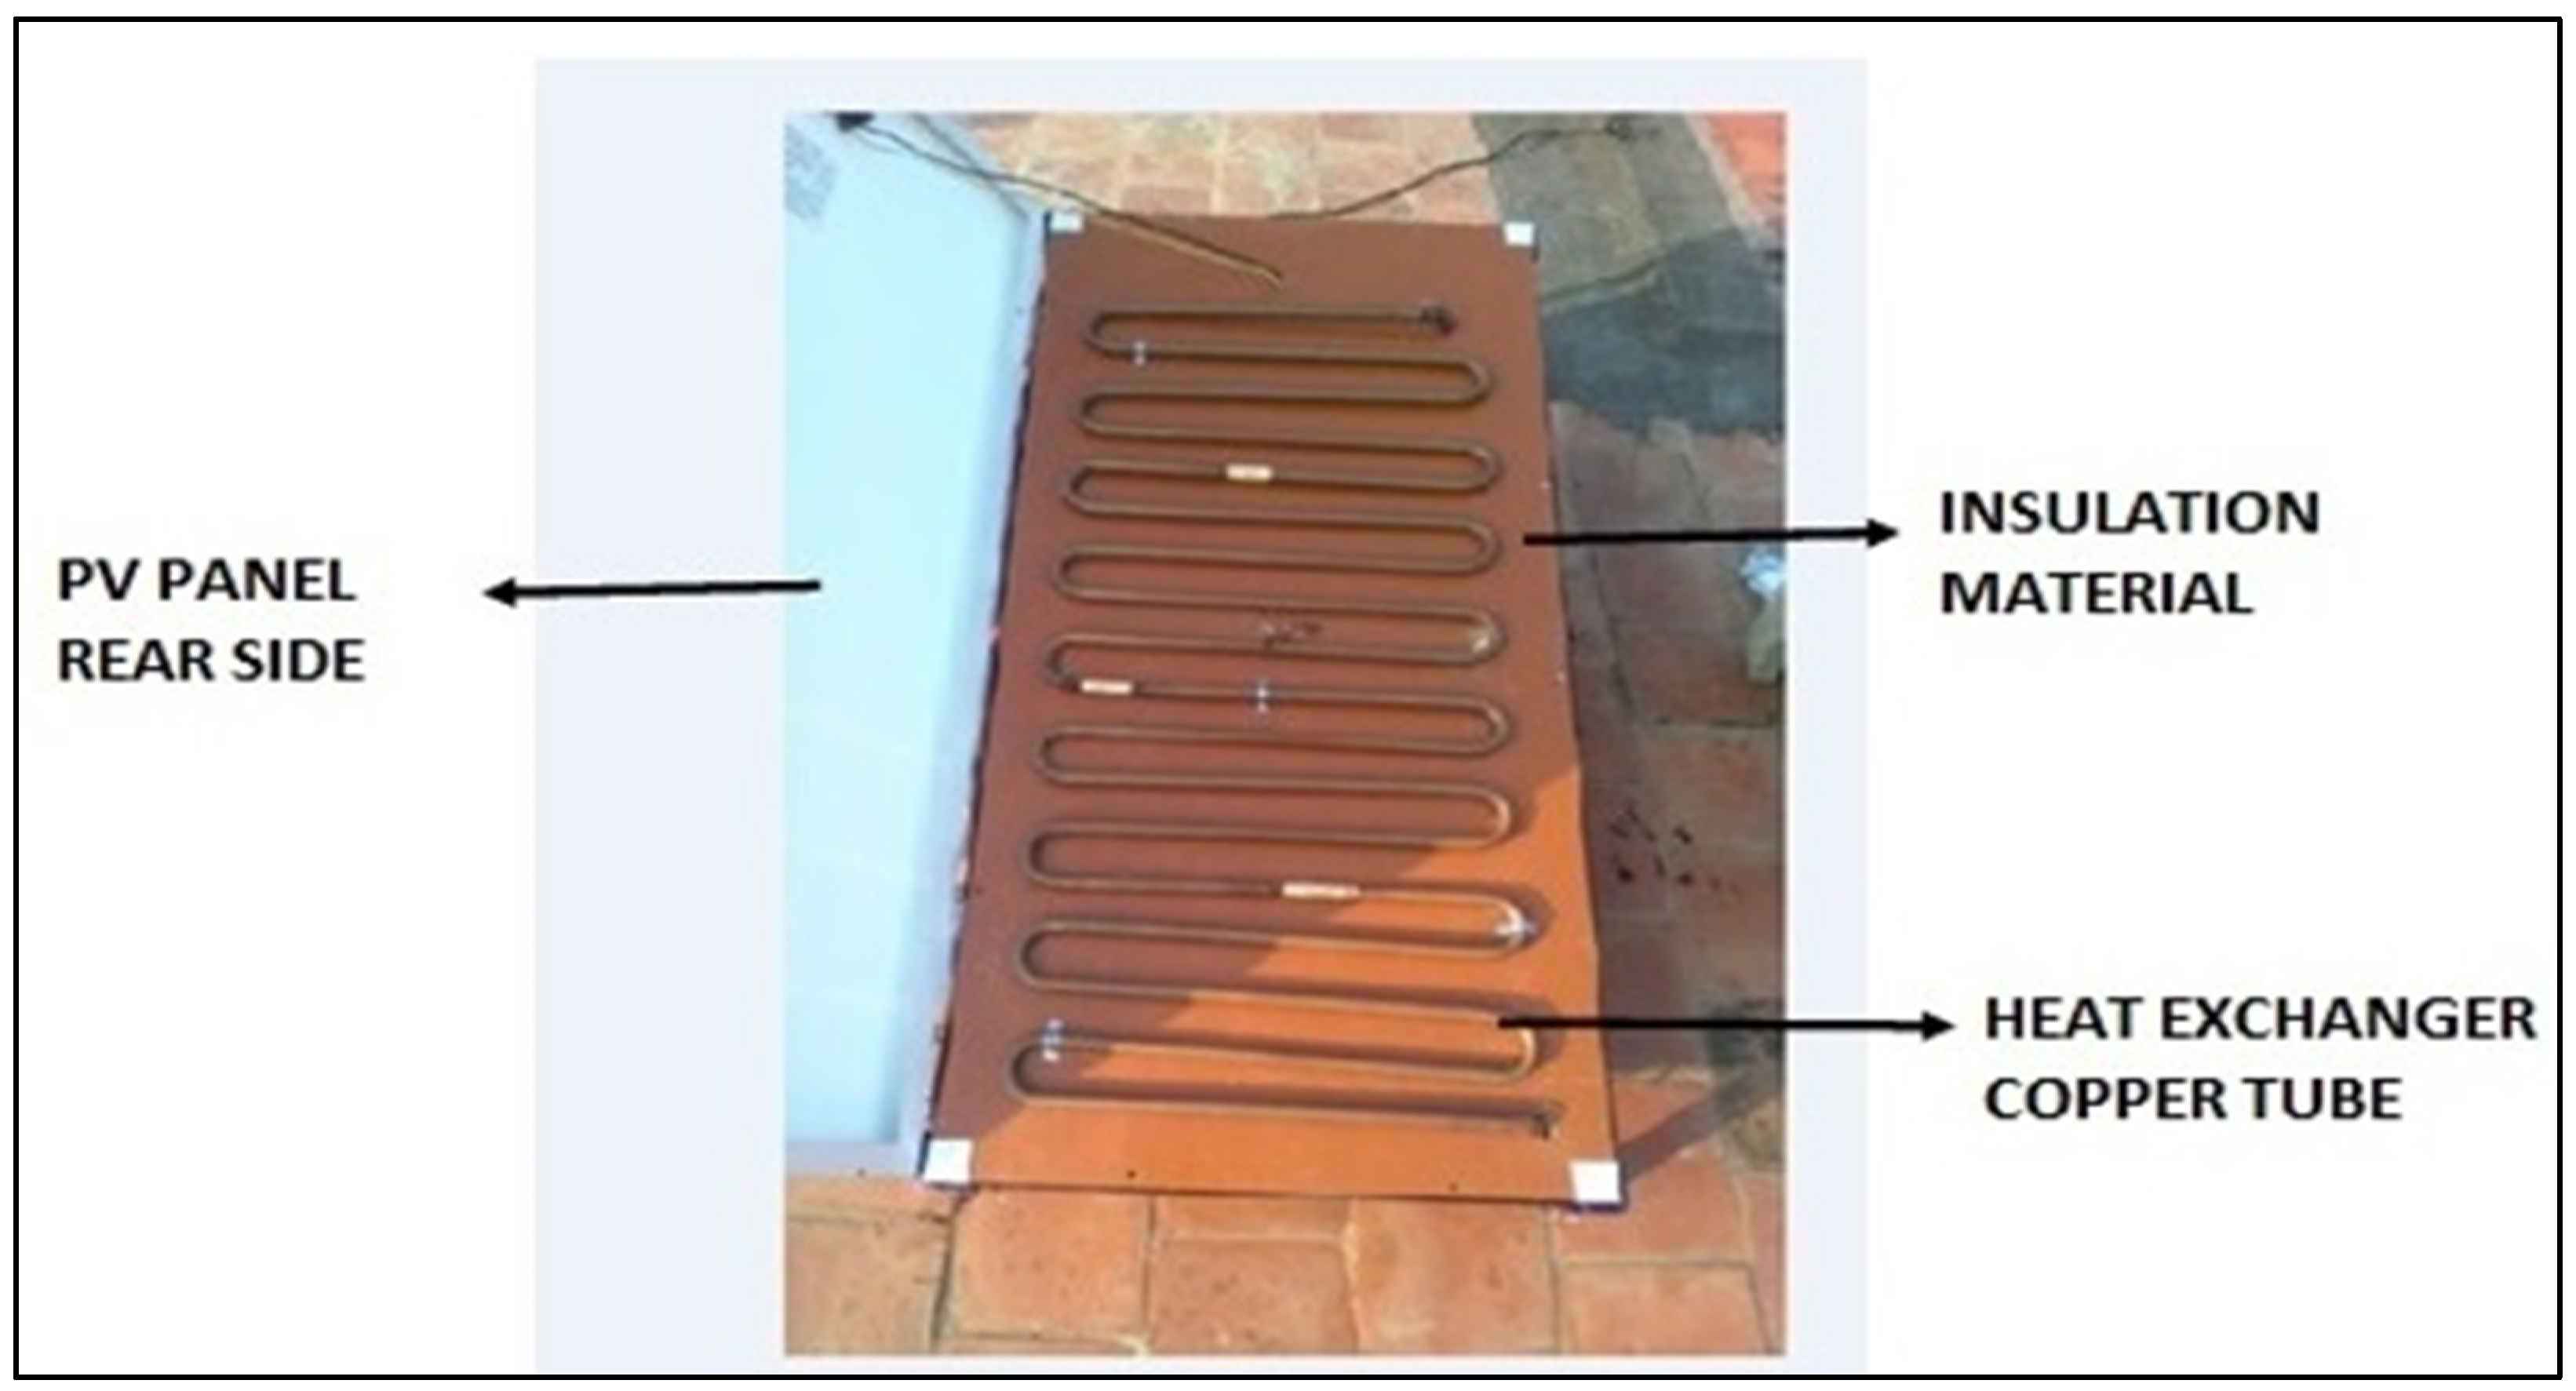
A multi-silicon glass panel with 1640 mm × 992 mm × 35 mm was purchased to construct a Photovoltaic Thermal Collector. Because of the platform’s insulating effect, a 0.4 mm copper sheet was used for heat absorption on the back of the solar panel. Furthermore, the external and internal diameters of the copper tube are 1.0 cm and 0.8 cm, respectively, and are placed to observe heat behind the solar panel. Table 1 shows the performance of the solar panel under normal test conditions. The photovoltaic thermal system was oriented 13 degrees south. Every day, between 8 a.m. and 5 p.m., readings for all weather conditions and output power were obtained for fifteen minutes. A copper tube connected to a solar panel is shown in Figure 2. This copper tube is used because of high heat conduction from the solar panel to the water which is passing through the pipe. When placing the copper pipe, it must be taken care that the entire length is in contact with the solar panel, and a special arrangement using a clamp was used to make sure that the pipe is always in contact with the solar panel.
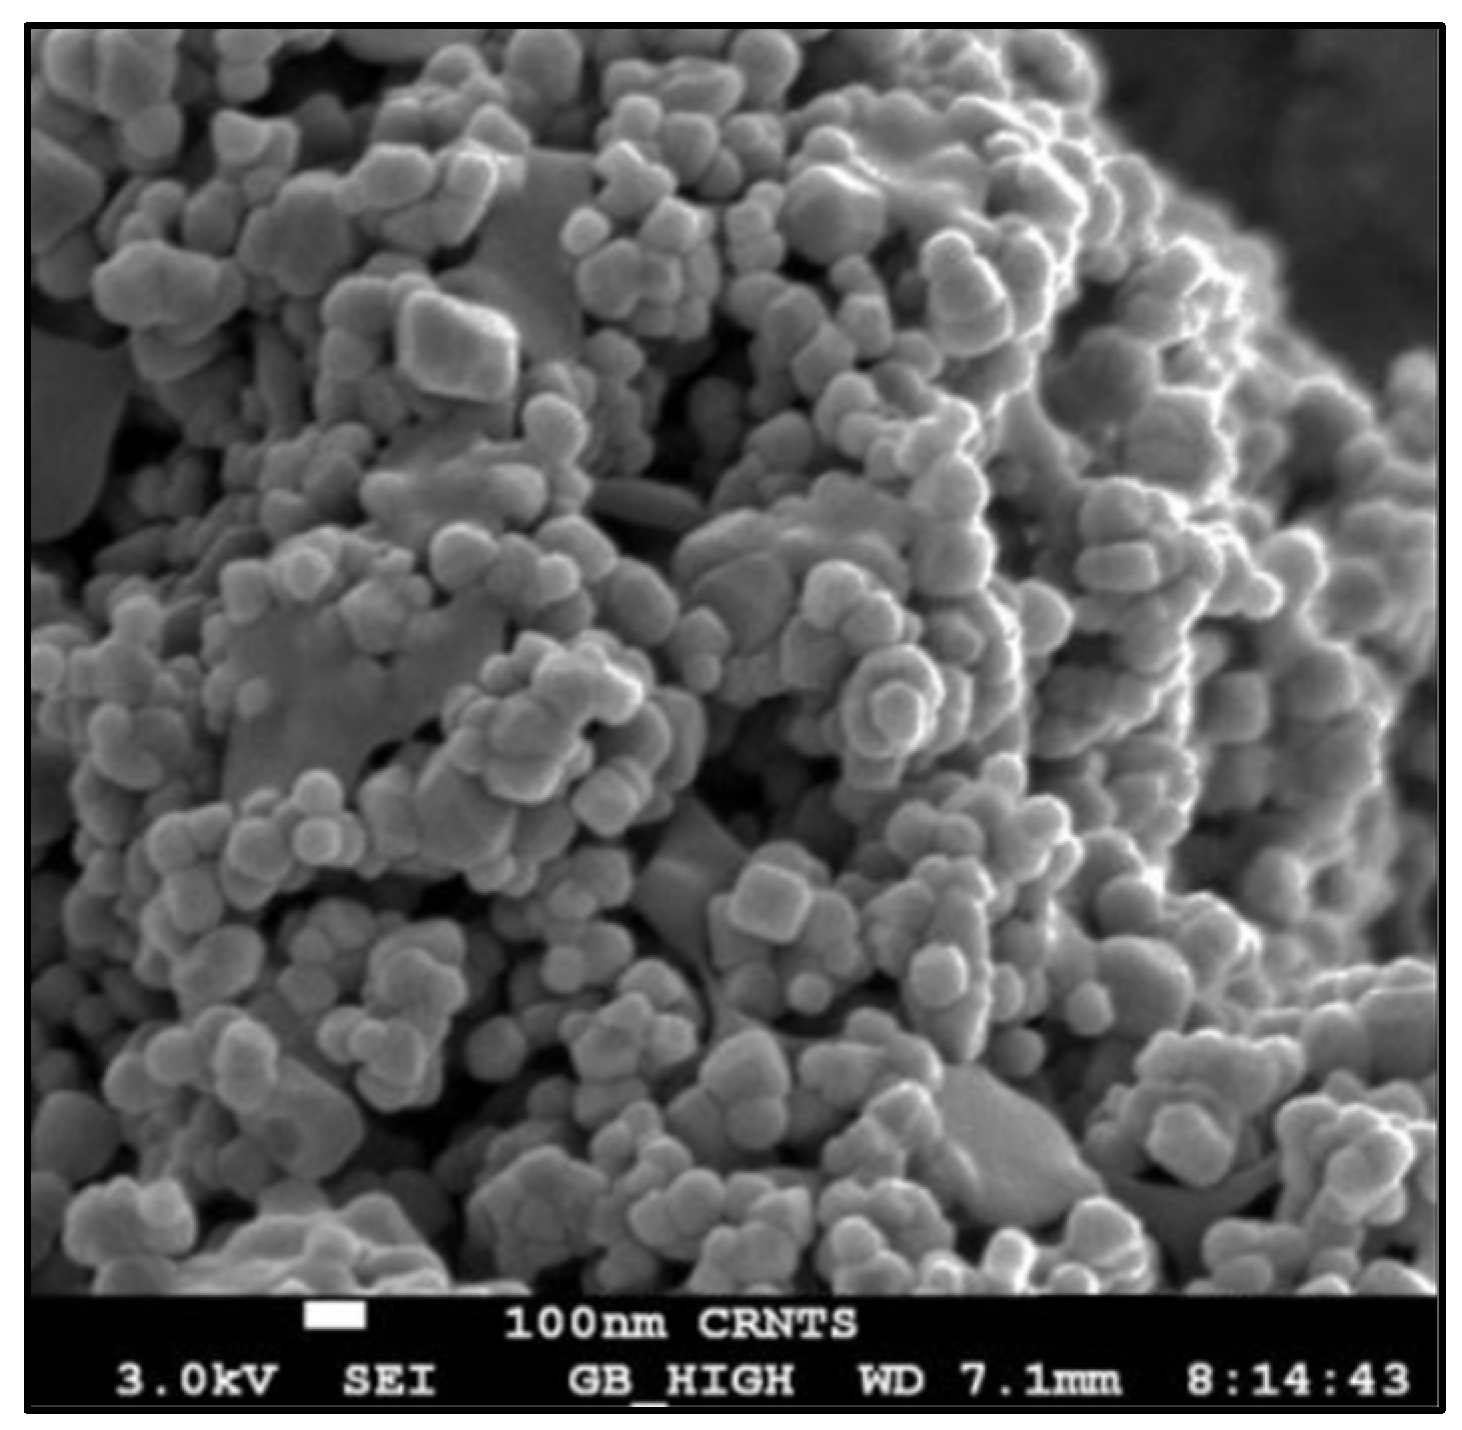
To increase heat transmission and reduce material costs, the nanofluid was used in the solar panel system. The single-phase method explains the heat conductivity and properties of nanofluid TiO2. The basic assumption of this technique is thermal equilibrium is maintained for nanoparticles and base fluid, causing the suspension to behave like a regular fluid. The fluid characteristics are then presumed to have been altered as a result of the introduction of nanoparticles. The essential part of the single-phase method under these assumptions is determining the effective thermo-physical characteristics of the nanofluids. Therefore, the selection of competent drivers with reasonable costs that may be sold together is an essential consideration. Figure 3 shows the image of SEM of TiO2 nanoparticles.

3. Analytical Methodology

Electrical and thermal energy analyses were carried out in this methodology, which are detailed below [30,31,32,33,34]. The governing differential equation for the behavior of the systems are based on:
  • Steady-state operation.
  • The inlet mass flow rate into the solar thermal storage tank is constant.
  • The radiation heat transfer is negligible.
  • The dust deposition on the solar panel is meager.

3.1. Performance of Electrical Energy

The ratio of electrical energy is electrical power, and the panel energy observation and equation are given below.
η e l e c = P m a x Q ˙ s
P m p m p m a x
Q ˙ s = A c o l I G

3.2. Performance of Thermal Energy

The efficiency of thermal energy is employed to characterize the performance of a PV/T system.
η t h e r = Q ˙ u Q ˙ s
Q ˙ u = m ˙ C p Δ T = m ˙ C p ( T o T i )
m ˙ = ρ A c o l V
These equations are based on the solar radiation falling on the particular area of the solar panel being well defined in the solar radiation observations. These observations are known as Q ˙ s . The mass flow rate of coolant, heat carrying capacity of the coolant difference of inlet, and the output of the coolant are combined, producing what is known as heat energy generation Q ˙ u .

3.3. Uncertainty Analysis

The individual calibration distortion parameters for the PVT collector are shown in Table 2. Uncertainties analysis is required to confirm the accuracy of each experimental setup. Data extraction mistakes, example calibration problems, data processing errors, and unique instrument ambiguities are all examples of errors. The majority of the inaccuracies in this study were produced by the overestimation of each variable, such as temperature, solar irradiation, stress, and fluid velocity. The most significant uncertainty in predicting solar collector efficiency is about 3.6 percent (Table 3).

4. Results and Discussion

According to the findings, the temperature gradient panels grew throughout the day as sun irradiation increased. The pattern of air temperature and solar radiation is similar; however, the PV surface temp/radiation factor for PV panels is substantially more significant than for cooled panels. Furthermore, the temperature differential between the cooling PV panel and the baseline panel dropped; for example, at midday, the difference was 12.6 °C, but at the end of the day, it was only 7.2 °C due to Nanofluid obstructing the cooling function. This study also includes several other parametric tests detailed below.
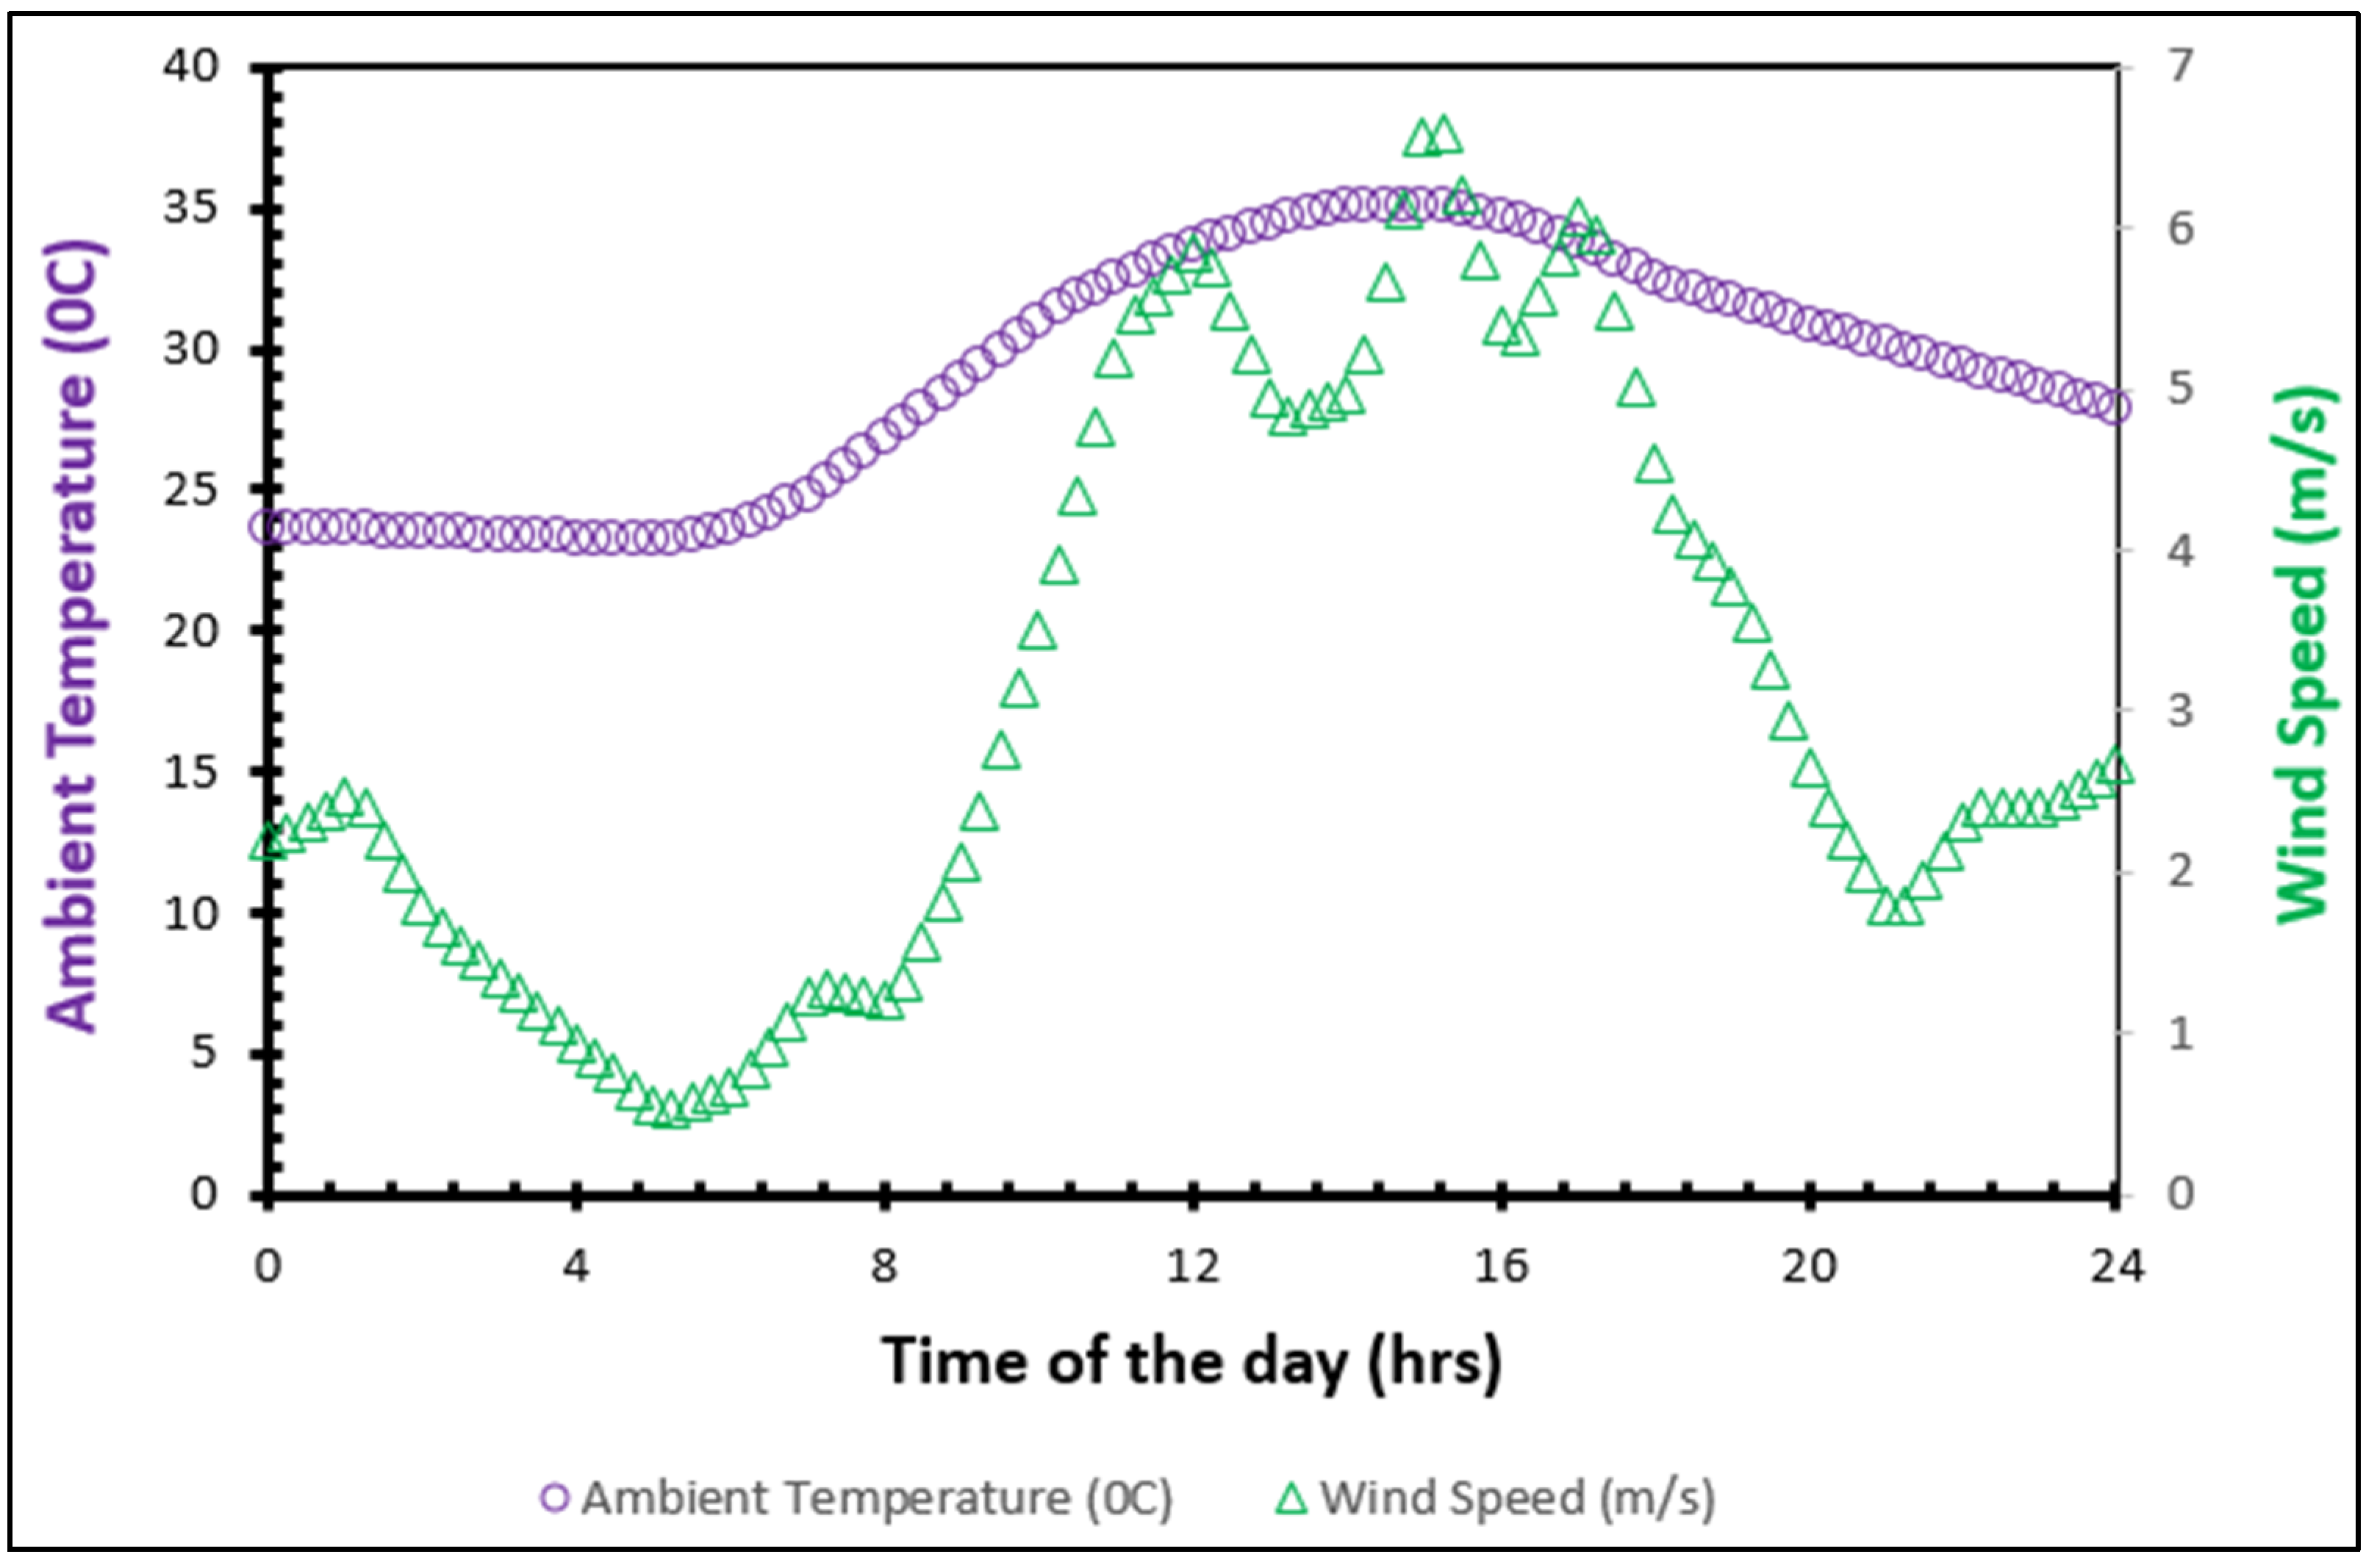
In Figure 4, the solar radiation intensity for chosen days was given for comparison as an example of a similar metrological state. Every 15 s, the data is collected and used for further analysis. The environmental data, solar intensity, and weather conditions from the initial days were gathered, which are shown in Figure 4. From this graph, the diurnal average incoming solar radiation dispersion over the experiment period is a whistle shape. It was observed during the test that the smallest values were 307.18 W/m2, recorded on morning 7, and 219 W/m2 on evening 5. The daily average air temperature rises from 29.36 to 34.23 degrees Celsius from 9 a.m. to 5:00 p.m.
The incident solar radiation on chosen days is depicted in Figure 5 at a certain point in the experimental research in a sample of identical metrological situations. Solar radiation is an essential factor in boosting the performance of both fluids. The solar radiation and ambient temperature at the exact area displayed similar patterns throughout the day.
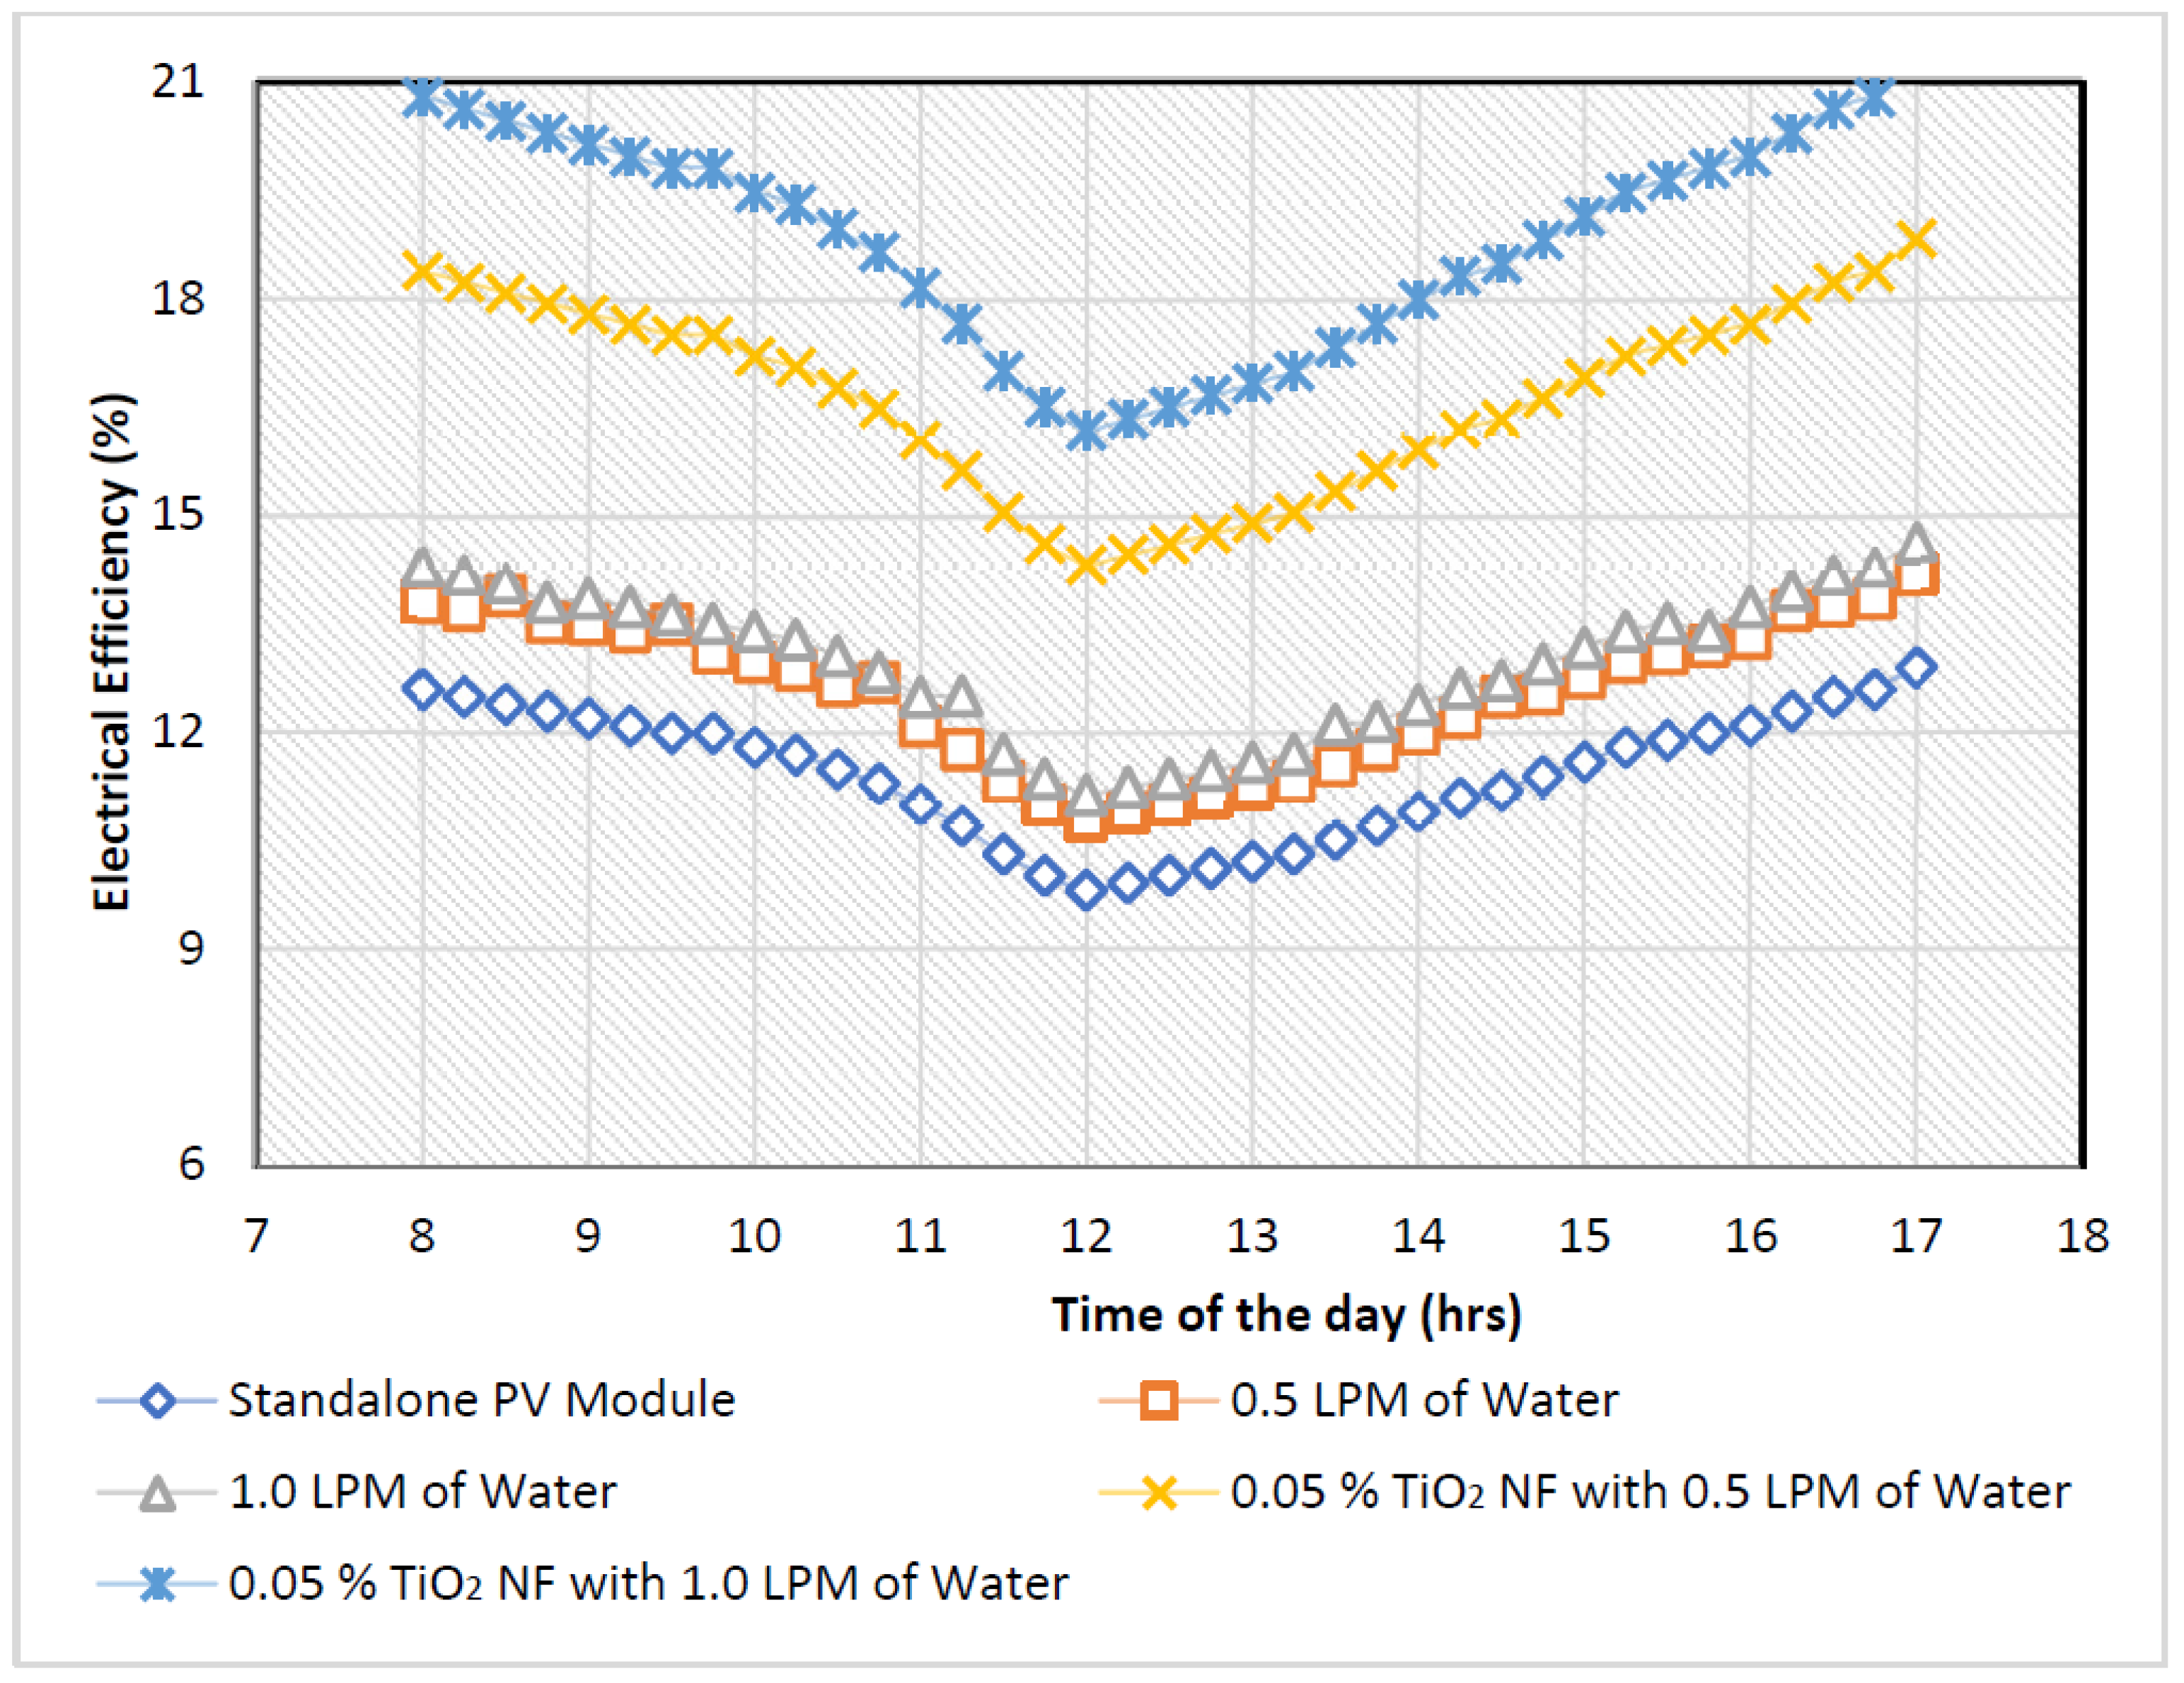
The TiO2 nanofluid utilized had an ideal volume level of 0.05 percent. Figure 6 demonstrates trends in electrical efficiencies, such as freestanding PV, two types of water flow rates, and TiO2 nanofluid volume concentration. The system efficiency was increased by 67.25 percent on average during the trial day when the optimal concentration of the chosen Nanofluid was used compared to the non-cooled module. The fluctuation in solar cell efficiency with respect to time and air mass flow rate is demonstrated in Figure 7. The graph demonstrates that the increased mass flow rate in the PVT collector results in lower cell temperature and greater cell efficiency.
As illustrated in Figure 7, cooling devices lowered the average temperatures of PV and PVT modules, whether employing filtered water or introducing nanofluid into the liquid. The temperature of the PV and PVT panels increased as the solar radiation levels increased during the day. Even though the maximum surface temperature of the modules has followed the same trajectory as the solar radiation, the temperature of PV is significantly greater for PV panels than for cooling panels. The PV panel and the regular panel difference in temperature decrease during the day. The temperature difference at midday was 16 °C, and at the end of the day was 15 °C, because the heat stored in the Nanofluid began to have a reverse impact. The average temperature of the trial day, a freestanding PV module, and the highest nanofluid concentration with a high-volume flow rate were 51.3 °C and 38.8 °C, respectively.
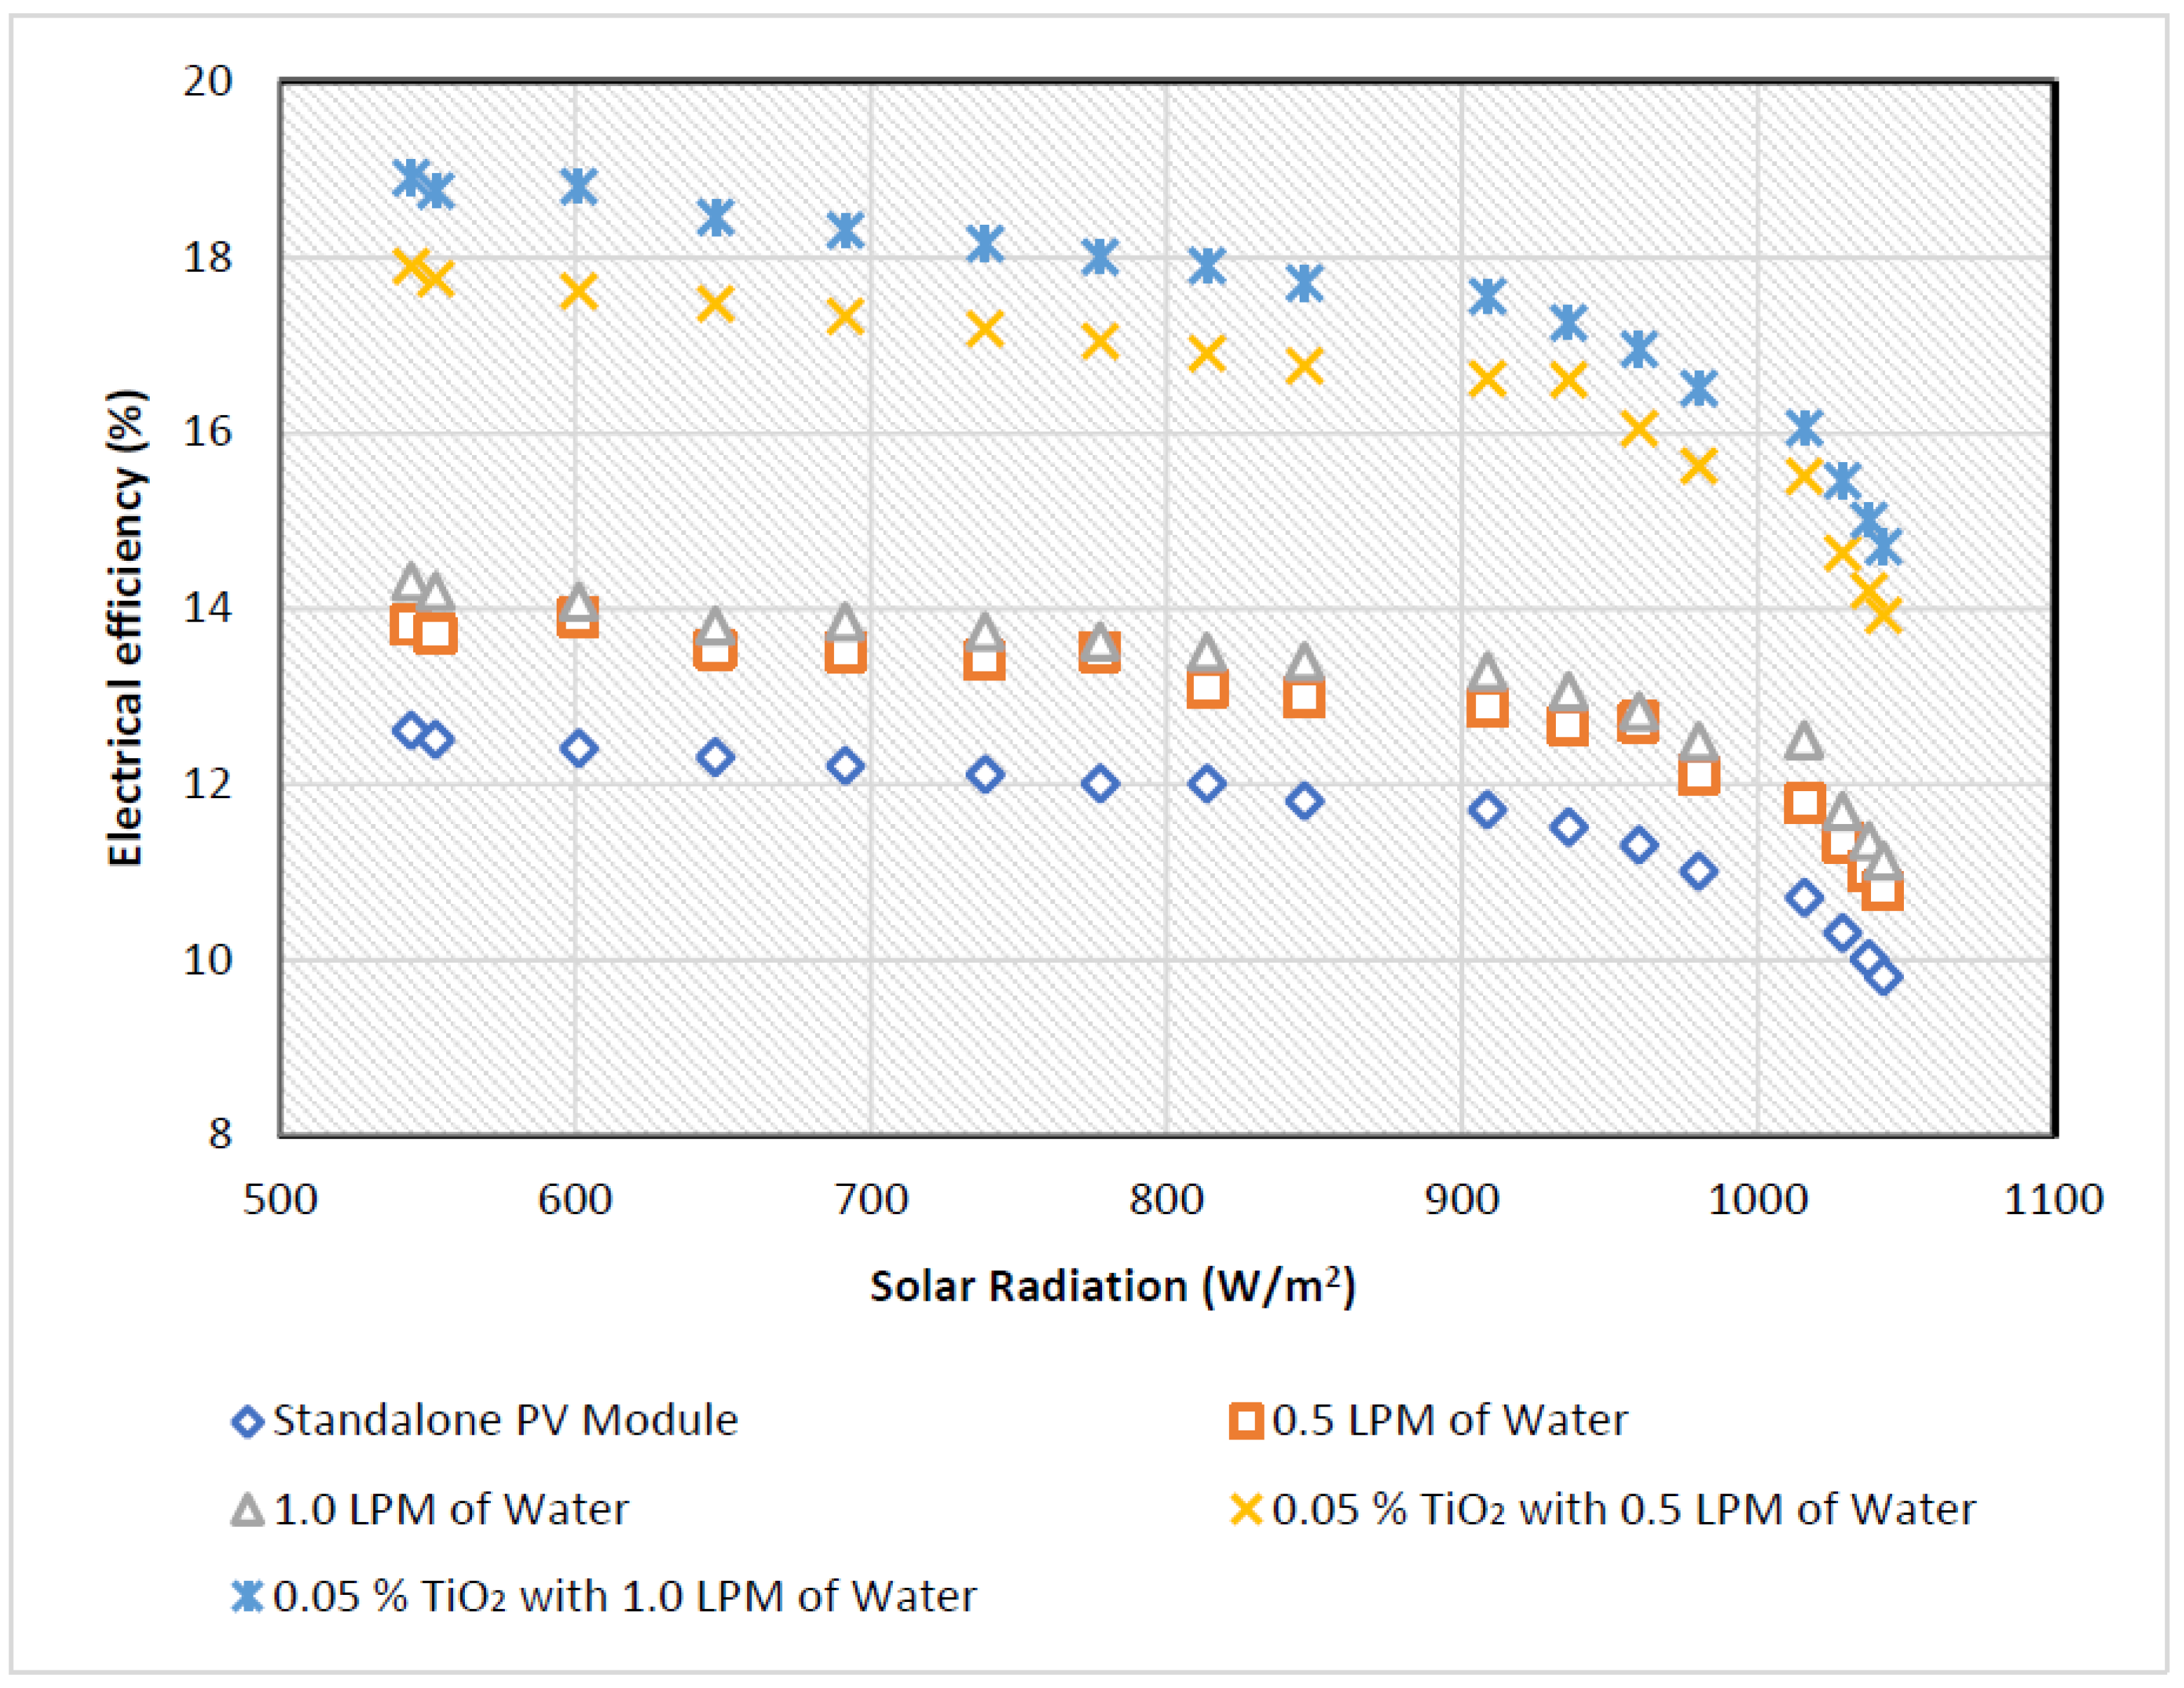
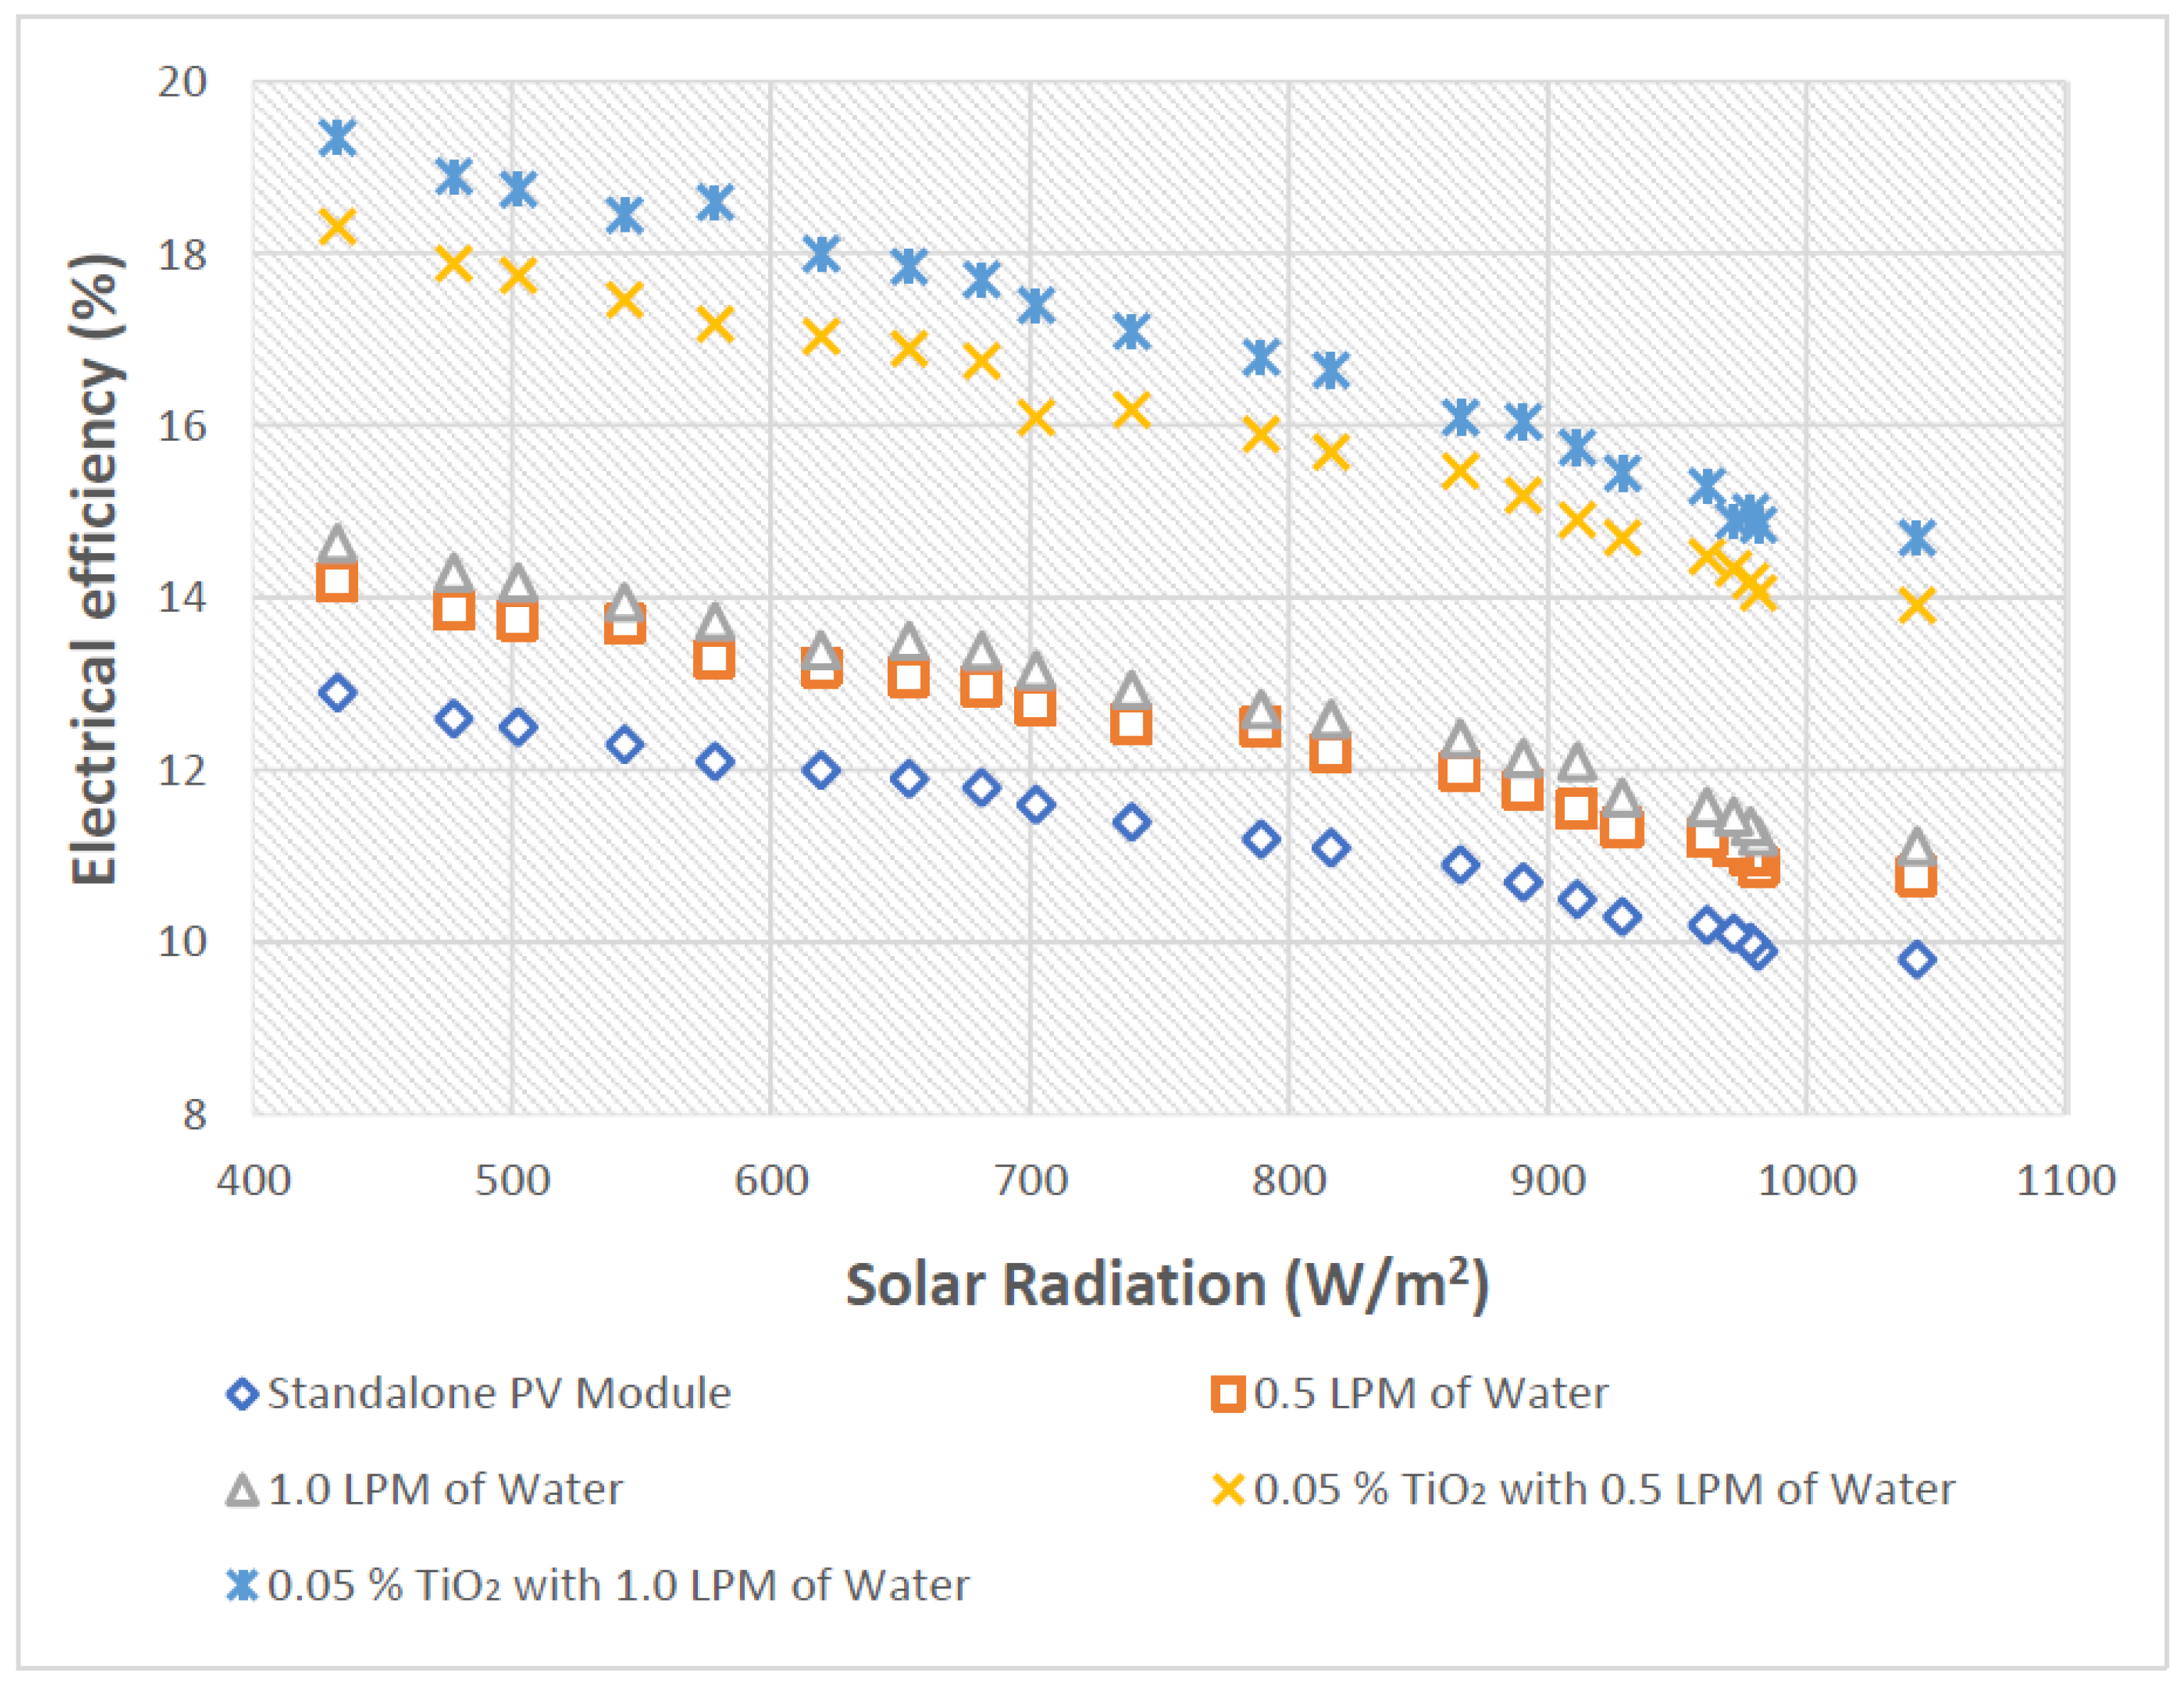
Figure 8 and Figure 9 depict various working fluids and their electrical efficiency and sun radiation in the morning and afternoon. According to the diagram, when solar radiation increases, electrical performance decreases, which is especially important during the frontline and after midday. Excessive sunshine has a significant negative effect on the electrical solar panels’ performance. Solar radiation is an excellent parameter for influencing the electrical properties of water and water-nanofluid mixtures.
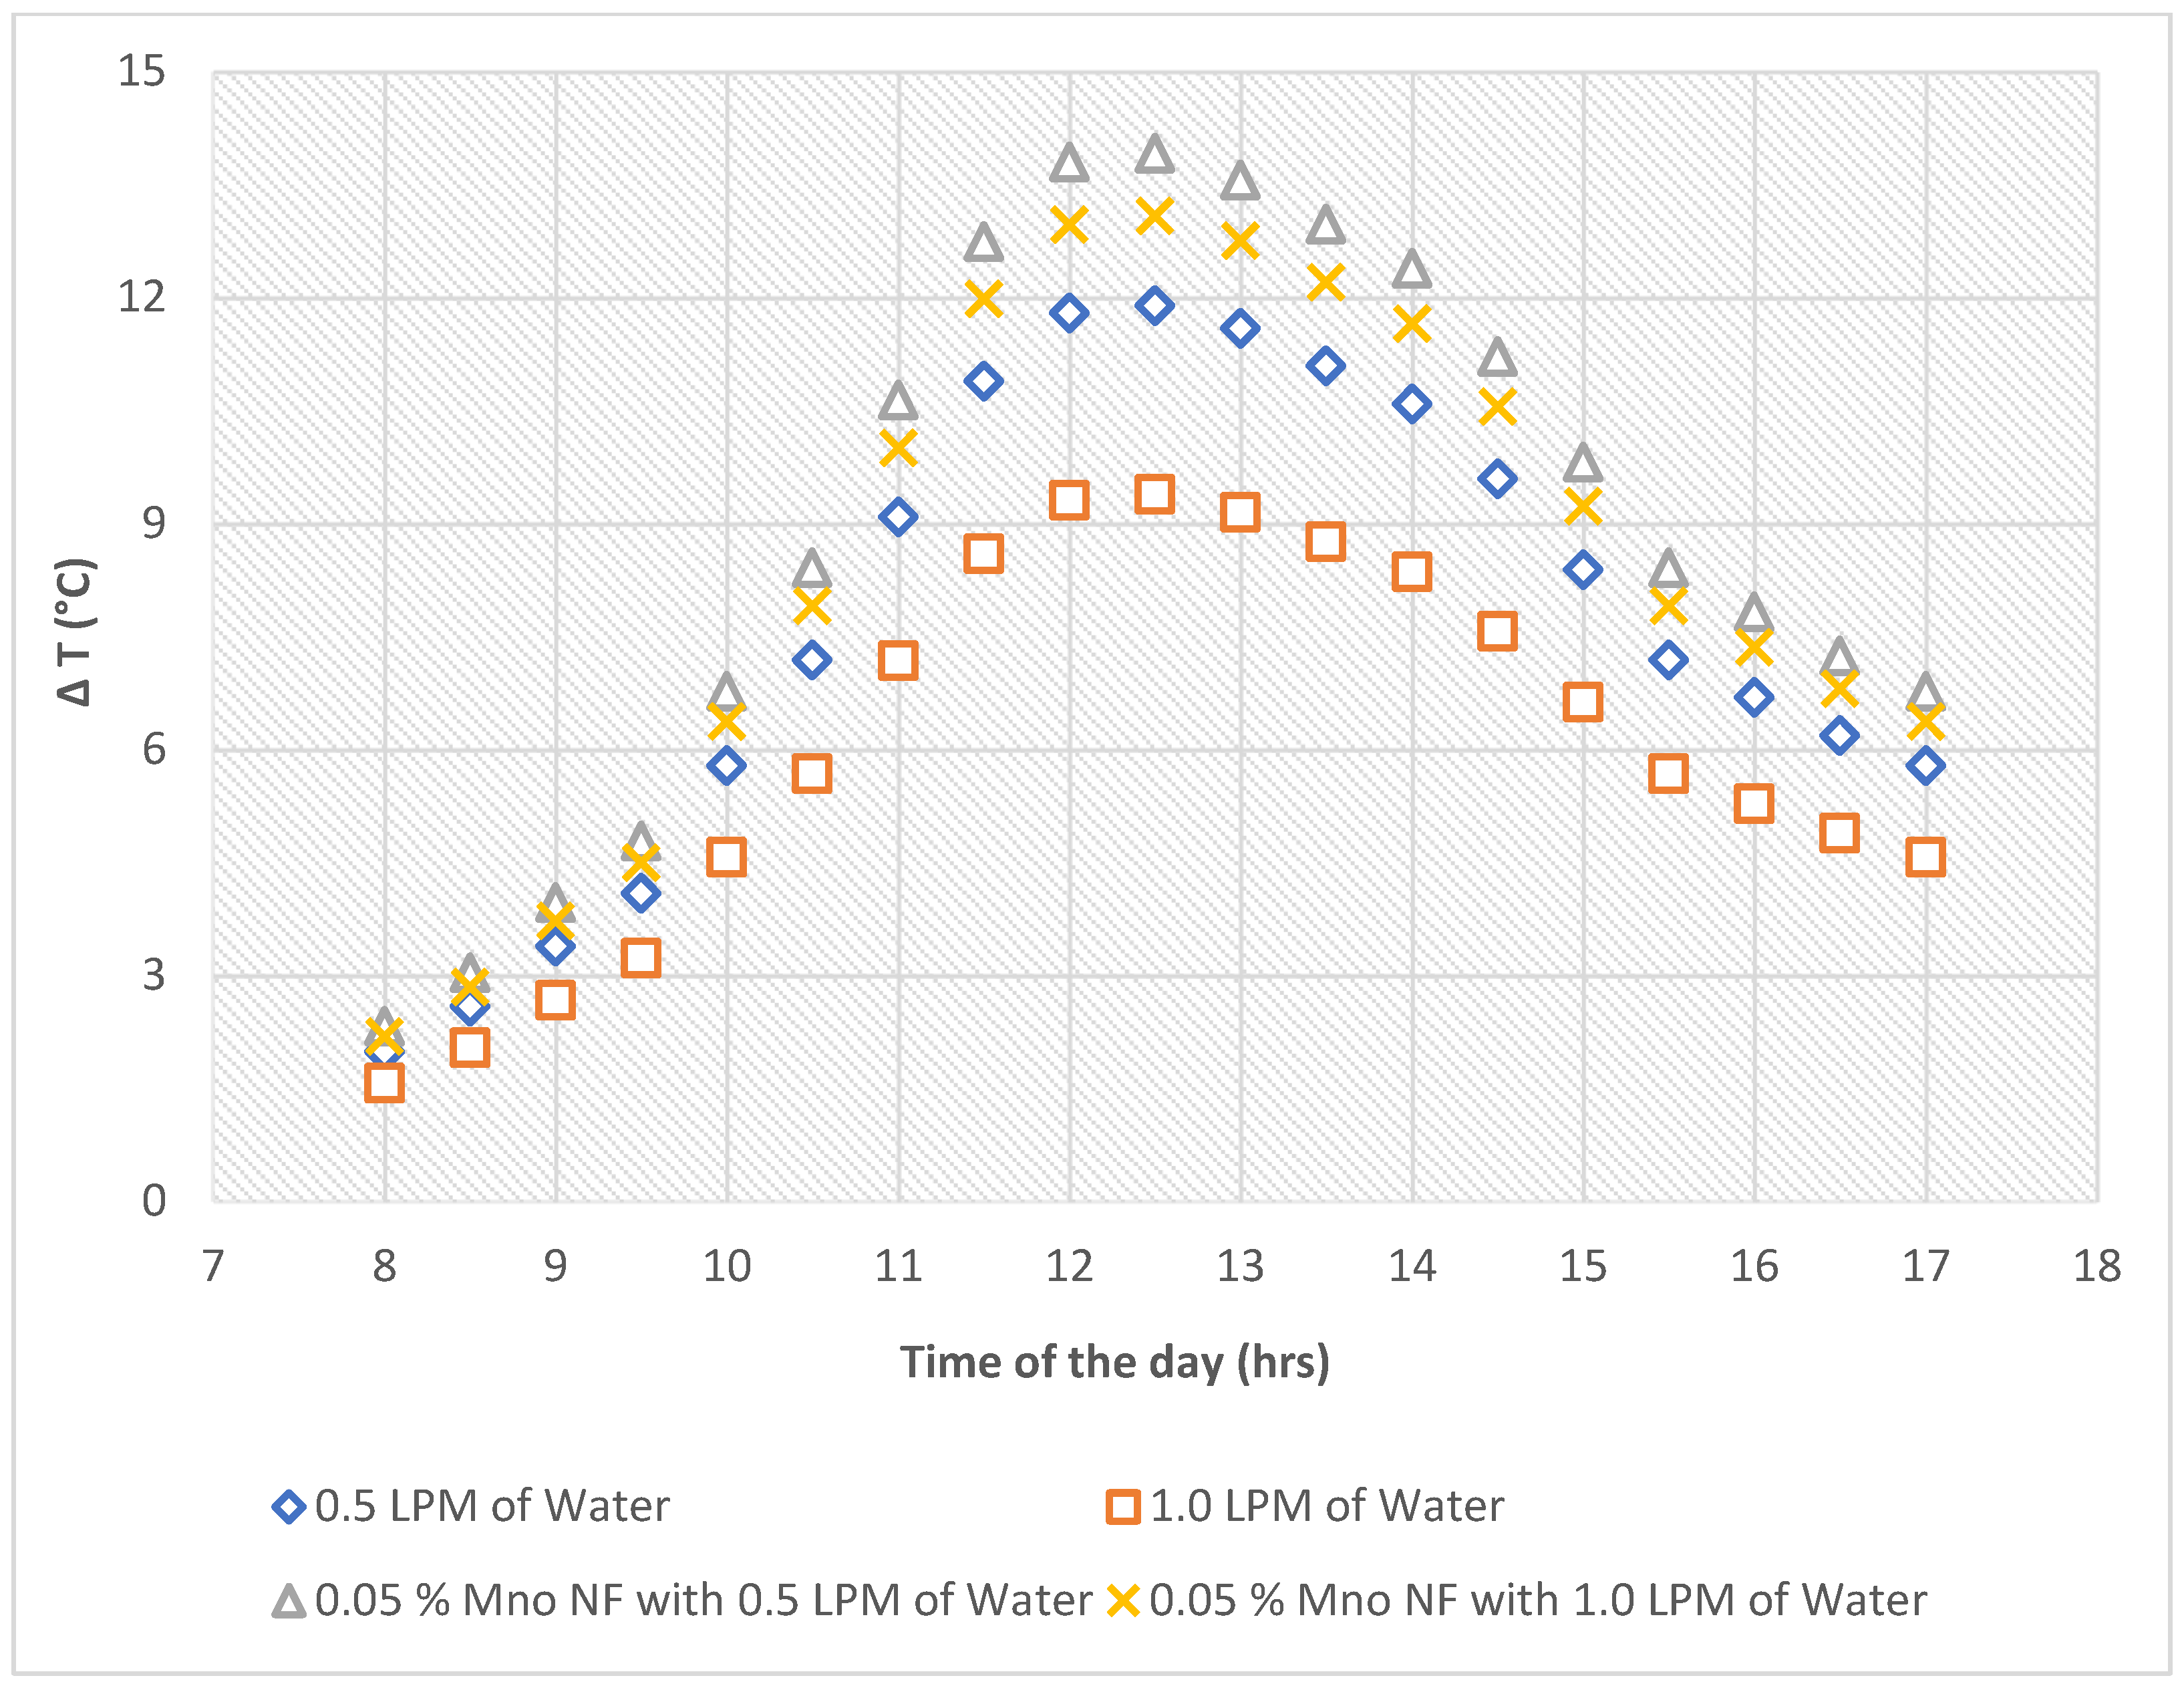
Figure 10 depicts the fluctuation of input and output fluid temperatures with varying volume flow rates and concentrations. The inlet air temperature linearly followed the ambient air temperature. The variation in ΔT was caused by the different concentration and volume flow rates of the nanofluids. In general, lower rates of water and nanofluid mixed with water resulted in the most significant temperature changes, whereas higher volume flow rates resulted in the smallest. According to the following graphic, an 11.8 °C difference was achieved at a water flow rate of 0.5 LPM at noon. As a result, a 13.3 °C difference was obtained at 0 LPM on the testing day’s midday. Furthermore, around midday on the trial day, a difference of 12.5 °C was achieved with water mixed with a nanofluid of 0.5 LPM.
After that, at midday on the trial day, a difference of 9.3 TiO2 manganese oxide. The PVT collector was tested at two different volume concentrations, 0.5 and 1.0 Liters per minute (LPM). The highest thermal efficiency of the system was determined to be 48.38 percent and 54.03 percent, respectively, at the volumes of 0.5 LPM and 1.0 LPM. The highest electrical efficiency of the PV/T collector was determined to be 18.32 percent and 19.35 percent, respectively, for 0.5 LPM and 1.0 LPM of volume flow rates. The results demonstrate that nanofluid has more excellent thermal conductivity than a base fluid with a little increase in viscosity and fluid density. It was achieved in water mixed with nano 1.0 LPM.
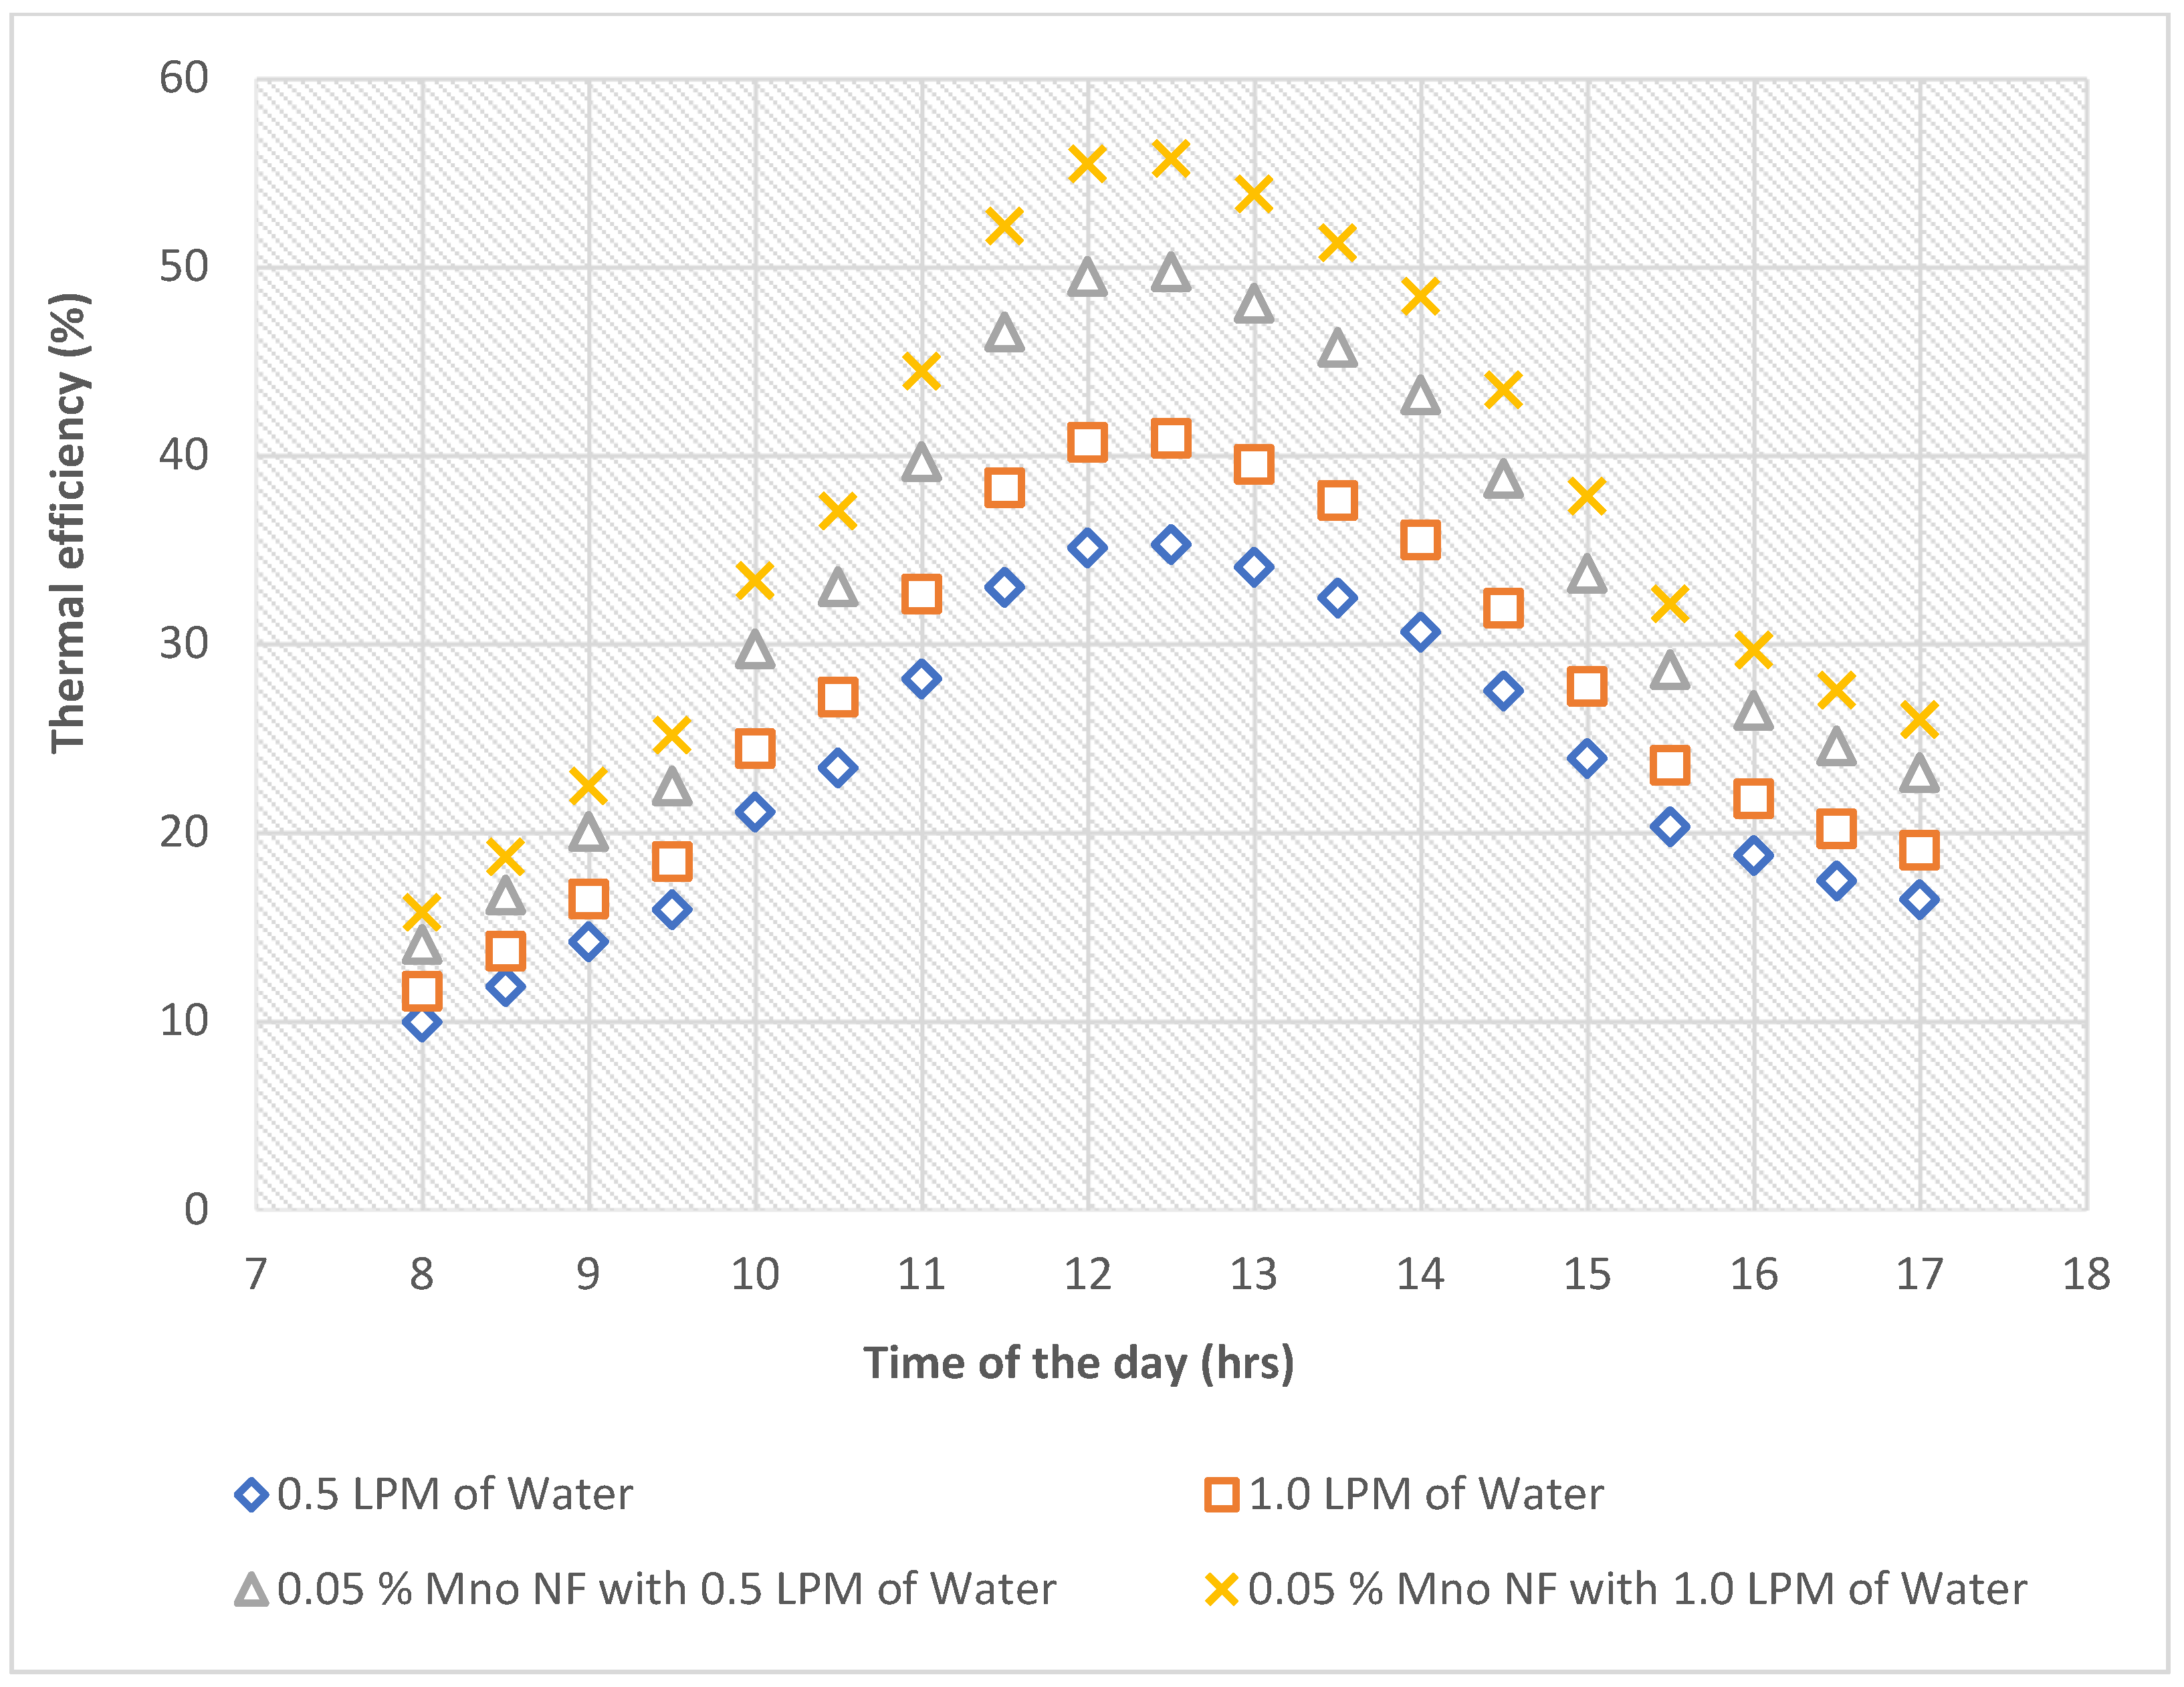
Figure 11 depicts a PVT module thermal efficiency with various working fluids. Equations (4)–(6) are used to assess multiple equations to get the hybrid collector thermal efficiency. It is estimated using quantifiable criteria such as the temperature differential between the exit and intake air, air mass flow rate, air-specific heat, solar panel area, and solar radiation. When the flow rate changes from 0.5 LPM to 1.0 LPM, the thermal performance improved. Maximum heat efficiency rose from 35.31 percent, 40.96 percent, 49.79 percent, and 55.80 percent with regard to flow rate (0.5 and 1.0 LPM) and water mixed with nanofluid (0.5 and 1.0 LPM), respectively. Table 3 displays the percentage improvement in thermal efficiency. Analytical values of Qs and Qu are confirmed that the trend matches experimental data values. As per the present study, it is compared with previous literature and found significantly better.

5. Conclusions

As per the above findings, the experimental study provides the following conclusions: the stand-alone PV and highest values of nanofluid with a high-volume flow rate were found at 64.3 °C and 47.3 °C. The efficiency was increased by 62.35 percent on average during the experiment, utilizing the optimal concentration of the specified nanofluid. Electrical efficiency was maximized at a solitary PV module, 0.5 LPM, 1.0 LPM, 0.05 percent TiO2 with 0.5 LPM, and 0.05 percent TiO2 with 1.0 LPM. Similarly, thermal efficiency was maximized with 0.5 LPM of water, 1.0 LPM, 0.05 percent TiO2 with 0.5 LPM, and 0.05 percent TiO2 with 1.0 LPM, respectively.

Author Contributions

Conceptualization, M.E. and R.Č.; Data curation, B.S., A.S. and M.R.; Formal analysis, M.E., B.S., A.S. and M.R.; Investigation, M.E., B.S., A.S. and M.R.; Methodology, M.E., B.S. and R.Č.; Supervision, R.Č.; Writing—original draft, M.E., B.S., R.Č. and M.R.; Writing—review & editing, R.Č. All authors have read and agreed to the published version of the manuscript.

Funding

This research received no external funding.

Institutional Review Board Statement

Not applicable.

Informed Consent Statement

Not applicable.

Data Availability Statement

The data presented in this study are available through email upon request to the corresponding author.

Conflicts of Interest

The authors declare no conflict of interest.

References

  1. Mehrali, M.; Latibari, S.T.; Rosen, M.A.; Akhiani, A.R.; Naghavi, M.S.; Sadeghinezhad, E.; Metselaar, H.S.C.; Nejad, M.M.; Mehrali, M. From rice husk to high-performance shape stabilized phase change materials for thermal energy storage. RSC Adv. 2016, 6, 45595–45604. [Google Scholar] [CrossRef] [Green Version]
  2. Dursun, B. Determination of the optimum hybrid renewable power generating systems for the Kavakli campus of Kirklareli University, Turkey. Renew. Sustain. Energy Rev. 2012, 16, 6183–6190. [Google Scholar] [CrossRef]
  3. Jun, Z.; Junfeng, L.; Jie, W.; Ngan, H.W. A multi-agent solution to energy management in a hybrid renewable energy generation system. Renew. Energy 2011, 36, 1352–1363. [Google Scholar] [CrossRef]
  4. Bahaidarah, H.M.; Baloch, A.A.; Gandhidasan, P. Uniform cooling of photovoltaic panels: A review. Renew. Sustain. Energy Rev. 2016, 57, 1520–1544. [Google Scholar] [CrossRef]
  5. Chandel, S.S.; Agarwal, T. Review of cooling techniques using phase change materials for enhancing efficiency of photovoltaic power systems. Renew. Sustain. Energy Rev. 2017, 73, 1342–1351. [Google Scholar] [CrossRef]
  6. Chauhan, A.; Tyagi, V.V.; Anand, S. Futuristic approach for thermal management in solar PV/thermal systems with possible applications. Energy Convers. Manag. 2018, 163, 314–354. [Google Scholar] [CrossRef]
  7. Nadda, R.; Kumar, A.; Maithani, R. Efficiency improvement of solar photovoltaic/solar air collectors by using impingement jets: A review. Renew. Sustain. Energy Rev. 2018, 93, 331–353. [Google Scholar] [CrossRef]
  8. Shukla, A.; Kant, K.; Sharma, A.; Biwole, P.H. Cooling methodologies of photovoltaic module for enhancing electrical efficiency: A review. Sol. Energy Mater. Sol. Cells 2017, 160, 275–286. [Google Scholar] [CrossRef]
  9. Hasanuzzaman, M.; Malek, A.B.M.A.; Islam, M.M.; Pandey, A.K.; Rahim, N.A. Global advancement of cooling technologies for PV systems: A review. Sol. Energy 2016, 137, 25–45. [Google Scholar] [CrossRef]
  10. Chol, S.; Estman, J. Enhancing thermal conductivity of fluids with nanoparticles. ASME-Publications-Fed 1995, 231, 99–106. [Google Scholar]
  11. Sridhara, V.; Satapathy, L.N. Al2O3-based nanofluids: A review. Nanoscale Res. Lett. 2011, 6, 456. [Google Scholar] [CrossRef] [PubMed] [Green Version]
  12. Hemmat, M.E.; Karimipour, A.; Yan, W.-M.; Akbari, M.; Safaei, M.R.; Dahari, M. Experimental study on thermal conductivity of ethylene glycol based nanofluids containing Al2O3 nanoparticles. Int. J. Heat Mass Transf. 2015, 88, 728–734. [Google Scholar] [CrossRef]
  13. Ebrahimnia-Bajestan, E.; Moghadam, M.C.; Niazmand, H.; Daungthongsuk, W.; Wongwises, S. Experimental and numerical investigation of nanofluids heat transfer characteristics for application in solar heat exchangers. Int. J. Heat Mass Transf. 2016, 92, 1041–1052. [Google Scholar] [CrossRef]
  14. Minea, A.A. Hybrid nanofluids based on Al2O3, TiO2 and SiO2: Numerical evaluation of different approaches. Int. J. Heat Mass Transf. 2017, 104, 852–860. [Google Scholar] [CrossRef]
  15. Wu, X.; Wu, H.; Cheng, P. Pressure drop and heat transfer of Al2O3-H2O nanofluids through silicon microchannels. J. Micromech. Microeng. 2009, 19, 105020. [Google Scholar] [CrossRef]
  16. Sardarabadi, M.; Passandideh-Fard, M.; Heris, S.Z. Experimental investigation of the effects of silica/water nanofluid on PV/T (photovoltaic thermal units). Energy 2014, 66, 264–272. [Google Scholar] [CrossRef]
  17. Ghadiri, M.; Sardarabadi, M.; Passandideh-Fard, M.; Moghadam, A.J. Experimental investigation of a PVT system performance using nano ferrofluids. Energy Convers. Manag. 2015, 103, 468–476. [Google Scholar] [CrossRef]
  18. Sardarabadi, M.; Passandideh-Fard, M. Experimental and numerical study of metaloxides/ water nanofluids as coolant in photovoltaic thermal systems (PVT). Sol. Energy Mater. Sol. Cells 2016, 157, 533–542. [Google Scholar] [CrossRef]
  19. Al-Shamani, A.N.; Sopian, K.; Mat, S.; Hasan, H.A.; Abed, A.M.; Ruslan, M.H. Experimental studies of rectangular tube absorber photovoltaic thermal collector with various types of nanofluids under the tropical climate conditions. Energy Convers. Manag. 2016, 124, 528–542. [Google Scholar] [CrossRef]
  20. Soltani, S.; Kasaeian, A.; Sarrafha, H.; Wen, D. An experimental investigation of a hybrid photovoltaic/thermoelectric system with nanofluid application. Sol. Energy 2017, 155, 1033–1043. [Google Scholar] [CrossRef]
  21. Al-Waeli, A.H.; Chaichan, M.T.; Kazem, H.A.; Sopian, K. Comparative study to use nano-(Al2O3, CuO, and SiC) with water to enhance photovoltaic thermal PV/T collectors. Energy Convers. Manag. 2017, 148, 963–973. [Google Scholar] [CrossRef]
  22. Al-Waeli, A.H.; Sopian, K.; Chaichan, M.T.; Kazem, H.A.; Hasan, H.A.; Al-Shamani, A.N. An experimental investigation of SiC nanofluid as a base-fluid for a photovoltaic thermal PV/T system. Energy Convers. Manag. 2017, 142, 547–558. [Google Scholar] [CrossRef]
  23. Aberoumand, S.; Jafarimoghaddam, A. Mixed convection heat transfer of nanofluids inside curved tubes: An experimental study. Appl. Therm. Eng. 2016, 108, 967–979. [Google Scholar] [CrossRef]
  24. Aberoumand, S.; Jafarimoghaddam, A. Experimental study on synthesis, stability, thermal conductivity and viscosity of Cu–engine oil nanofluid. J. Taiwan Inst. Chem. Eng. 2017, 71, 315–322. [Google Scholar] [CrossRef]
  25. Srimanickam, B.; Saranya, A. Thermal Performance of Single Glazing Flat Plate Photovoltaic Thermal Hybrid System with Various Air Channels. J. Test. Eval. 2019, 49, 2119–2150. [Google Scholar] [CrossRef]
  26. Azam, M. Effects of Cattaneo-Christov heat flux and nonlinear thermal radiation on MHD Maxwell nanofluid with Arrhenius activation energy. Case Stud. Therm. Eng. 2022, 34, 102048. [Google Scholar] [CrossRef]
  27. Azam, M.; Abbas, Z. Recent progress in Arrhenius activation energy for radiative heat transport of cross nanofluid over a melting wedge. Propuls. Power Res. 2021, 10, 383–395. [Google Scholar] [CrossRef]
  28. Azam, M.; Mabood, F.; Khan, M. Bioconvection and activation energy dynamisms on radiative sutterby melting nanomaterial with gyrotactic microorganism. Case Stud. Therm. Eng. 2022, 30, 101749. [Google Scholar] [CrossRef]
  29. Azam, M. Bioconvection and nonlinear thermal extrusion in development ofchemically reactive Sutterby nano-material due to gyrotactic microorganisms. Int. Commun. Heat Mass Transf. 2022, 130, 105820. [Google Scholar] [CrossRef]
  30. Srimanickam, B.; Vijayalakshmi, M.M.; Natarajan, E. Energy and exergy efficiency of flat plate PVT collector with forced convection. J. Test. Eval. 2017, 46, 783–797. [Google Scholar] [CrossRef]
  31. Aberoumand, S.; Ghamari, S.; Shabani, B. Energy and exergy analysis of a photovoltaic thermal (PV/T) system using nanofluids: An experimental study. Sol. Energy 2018, 165, 167–177. [Google Scholar] [CrossRef]
  32. Wolf, M. Performance analysis of combined heating and photovoltaic power systems for residences. Energy Convers. Manag. 1976, 16, 79–90. [Google Scholar] [CrossRef]
  33. Salem, M.R.; Elsayed, M.M.; Abd-Elaziz, A.A.; Elshazly, K.M. Performance enhancement of the photovoltaic cells using Al2O3/PCM mixture and/or water cooling-techniques. Renew. Energy 2019, 138, 876–890. [Google Scholar] [CrossRef]
  34. Yunus, A.; Cengel, M.; Boles, A. Thermodynamics, An Engineering Approach, 6th ed.; Tata Mc Graw-Hill: New Delhi, India, 2009. [Google Scholar]
Figure 1. Experimental setup at the specific location.
Energies 15 04425 g001
Figure 2. Photographic view of the copper tube along with the solar panel.
Energies 15 04425 g002
Figure 3. Photographic view of the copper tube along with the solar panel.
Energies 15 04425 g003
Figure 4. Average experimental day of the weather information at a specific location.
Energies 15 04425 g004
Figure 5. Three experimental test days of solar radiation in W/m2.
Energies 15 04425 g005
Figure 6. Efficiency of PV and PVT modules with working fluids.
Energies 15 04425 g006
Figure 7. PV and PVT module temperature with different working fluids.
Energies 15 04425 g007
Figure 8. Various working fluids and their electrical efficiency and solar radiation during the forenoon of the day.
Energies 15 04425 g008
Figure 9. Various working fluids and their electrical efficiency and solar radiation during the afternoon of the day.
Energies 15 04425 g009
Figure 10. The difference in outlet and inlet temperature of the working fluids.
Energies 15 04425 g010
Figure 11. Thermal efficiency performances for various working fluids.
Energies 15 04425 g011
Table 1. Details of the solar panel.
ParameterValueUnit
Pmax260Watts
Amps in Pmax8.42Amps
Volts in Pmax30.9Volts
Current in Maximum Load8.89Amps
Voltage in Maximum Load37.7Volts
Weight18.2Kilogram
Table 2. Individual calibration distortion parameters for the PVT collector.
SensorDistortionType
Ambient air temperature±0.2 °CK-thermocouple
Heat pipe temperature±0.2 °CK-thermocouple
Rotameter±2.3%UKL
Solar power meter±4 W/m2TM-206
Inlet & outlet temperature±0.2 °CK-thermocouple
Data logger±3.4%Agilent 34980A
Table 3. Percentage increase of thermal efficiency %.
Sl. NoWorking FluidThermal Efficiency (%)
AverageAt Extreme Solar Radiation
10.5 LPM25.76%35.31%
21.0 LPM29.88%40.96%
30.05% TiO2 with 0.5 LPM36.32%49.79%
40.05% TiO2 with 1.0 LPM40.70%55.80%
Publisher’s Note: MDPI stays neutral with regard to jurisdictional claims in published maps and institutional affiliations.