Article

Analysis of the Heat Transfer Coefficient, Thermal Effusivity and Mathematical Modelling of Drying Kinetics of a Partitioned Single Pass Low-Cost Solar Drying of Cocoyam Chips with Economic Assessments

1
Department of Agricultural and Bio-Resources Engineering, Michael Okpara University of Agriculture, Umuahia P.M.B. 7267, Abia State, Nigeria
2
Department of Mechanical Engineering, Michael Okpara University of Agriculture, Umuahia P.M.B. 7267, Abia State, Nigeria
3
Department of Agricultural Engineering, Akwa Ibom State University, Uyo P.M.B. 1167, Akwa Ibom, Nigeria
4
Department of Agricultural and Bioresources Engineering, University of Nigeria, Nsukka 410001, Enugu State, Nigeria
5
Department of Mechanical Engineering, University of New Brunswick, 15 Dineen Drive, Fredericton, NB E3B 5A3, Canada
6
Department of Forestry and Agriculture, CFA—CFPPA of Mirecourt, 22 Rue du Docteur Grosjean, 88500 Mirecourt, France
7
Department of Mechanical Engineering, National Institute of Technology Silchar, Silchar 788010, Assam, India
*
Author to whom correspondence should be addressed.
Energies 2022, 15(12), 4457; https://doi.org/10.3390/en15124457
Submission received: 16 May 2022 / Revised: 9 June 2022 / Accepted: 16 June 2022 / Published: 18 June 2022
(This article belongs to the Section A4: Bio-Energy)

Abstract

:
This study examines the heat and mass transfer coefficient, thermal effusivity, and other thermal properties of solar-dried cocoyam chips, as well as the drying kinetics. The research also assessed the economics of the solar dryer. For these reasons, a solar dryer with a partitioned collector was developed that creates a double airflow travel distance to delay the airflow inside the collector. The partitioning of the collector delays the airflow and helps to create more turbulence for the airflow with increased energy. The solar dryer was locally developed at the Michael Okpara University of Agriculture and tested during the humid crop harvesting period of September for the worst-case scenario. The obtained drying curves and kinetics for cocoyam drying are subjected to the vagaries of weather conditions. The drying rate showed declining sinusoidal characteristics and took about 25 h to attain equilibrium. Analysis of the airflow velocity showed gravitation between laminar and turbulent flow, ranging from 171.69 to 5152.77. Specific heat capacity, thermal conductivity, and effusivity declined with moisture content while the thermal diffusivity increased. However, the values of thermal effusivity ranged from 12.2 to 47.94 W·s1/2·m−2·K−1, which is within the range of values for insulators. The heat and mass transfer coefficient varied as a function of the airflow velocity. Fitting the drying curve into semi-empirical models showed that the two-term model was the best-fitted model for the experimental data from drying cocoyam. Using the solar dryer in Nigeria can save $188.63–$1886.13 in running costs with a payback period of 0.059–0.59 years (21.54–215.35 days) at a rate of 10–100% of usage.

1. Introduction

The preservation of food is an important component of food safety and security as it aids to add value to the product and maintain stability in the nutritional contents of the product. The Food and Agriculture Organization (FAO) estimated that about 811 million people globally lack food or are underfed in 2021 [1]. The need to improve the quality of agricultural products has always been a major challenge experienced in agricultural processing across different parts of the world [2]. This challenge can be addressed through technological development in processing equipment. This is important to prevent post-harvest losses of agricultural produce owing to primitive methods of post-harvest handling and storage. The drying of agricultural products happens to be the first unit operation in the preservation and storage of most agricultural products to enhance their shelf-life [3]. Drying removes the moisture from the product to a stable level where microbes that cause deterioration might not thrive. Globally, energy consumption for drying purposes is very high, contributing to about 15% of the global energy consumption in developed countries [4]. Energy sourced from fossil fuel dominates this proportion and contributes to the massive generation of greenhouse gases. This is dangerous as they harm the environment and destroy the ozone layer [5]. This mode of drying can be substituted with solar drying, which is environmentally friendly. Solar energy is universally acceptable and widely in use as it is a source of renewable energy and offers large capacity variability and potential [6]. Thus, solar drying utilizes energy from the sun in the form of heat and light. However, sun-drying, which is the earliest method of drying farm produce, still dominates the mode of drying agricultural products in developing countries. The process runs at the risk of spoilage due to adverse climatic conditions, e.g., rain, wind, mist, and dust, loss of produce to birds, insects, and rodents, dependency on good weather conditions, and slow drying rate with the danger of mould growth, thereby causing deterioration and decomposition of the produce [7]. The process also requires a large land area, significant time, and it is labour intensive. This puts solar dryers at an advantage over sun drying because they can overcome the challenges listed above if properly designed. Solar dryers are specialized dryers that capture the solar radiation with an enclosed collector and control the drying process in the drying chamber at a temperature greater than the ambient temperature and at a lower relative humidity [8]. Solar dryers have shown the capacity to meet the drying requirements of crops, animal products etc., within a shorter time frame and with lower energy utilization. In addition, they take up less space and are regarded as one of the healthiest methods for preserving the quality of dry products. Thus, the nutritional quality of the dried products is preserved [9].
Several designs of the solar dryer are in existence in the literature [10,11,12,13,14,15], but the consensus is that the performance of each dryer is environment-specific and depends on the meteorological data of that area. However, the presentation of new designs with new ideas encourages the modification of the previous design, which can be adopted in any environment. Variation of fluid path distance is currently of interest as this can help to increase the fluid duration in the collector to gain higher temperatures [16,17]. Another challenge faced in advancing the adoption of the solar dryer by manufacturers in Africa or most developing nations is convincing the farmers of the cost-effectiveness of using the solar dryer in comparison with other existing artificial dryers. Although many solar dryers are available, cost indicators that can help in decision making are lacking [18]. Often, the performances are presented but the cost index that gives the user an idea of when to recoup his investments is lacking. The idea behind this research, therefore, is to double the airflow travel distance using a lower collector length. The goal is to delay the airflow inside the collector to allow for more time for heat exchange between the collector and the air to increase the temperature and allow the air to shade more moisture before entering the drying chamber. Partitioning the collector helps to create more turbulence for the air with increased energy. The reason for this is that the operating environment for the solar dryer is highly humid, which means greater moisture in the inlet air. Shading some of this moisture will increase the moisture carrying capacity of the inlet air to the drying chamber. This is because, in such an environment, a small rise in the ambient temperature will support the quick drying of products.
The thermo-physical properties of agricultural products are required in the design, fabrication, and optimization of their processing equipment [19]. The drying kinetics and thermal properties, such as the specific heat, thermal conductivity, thermal diffusivity, effective moisture diffusivity, heat and mass transfer coefficients, etc., are needed to understand the mechanism of heat and mass transfer and to quantitatively determine the energy exchange between media. These properties are influenced by the mode of drying, initial moisture content, type of crop, environmental conditions, initial treatment given, etc. [20]. Therefore, a generalized determination of these parameters for all agricultural products is not possible but must instead be product-specific. Again, of interest in solar dryer design is the problem of rewetting the product during the off-sunshine period. This occurs when the product has lost its heat and absorbs moisture instead of giving off moisture. The rate at which the heat from a product is lost to the surrounding air is the thermal effusivity or delay factor (conductive capacity or inertia) [21]. The higher the value of conductive capacity (thermal effusivity), the quicker the surface temperatures will easily equilibrate thermodynamically with the product ambient temperature. Therefore, thermal effusivity has been explained as the rate at which the thermal energy of the product radiates from the product [21]. Thermal effusivity is inversely correlated to thermal impedance. Often, in the thermal analysis of agricultural products in solar drying, this very important property has been overlooked by most researchers. Currently, reference literature on thermal effusivity is not available [22]. However, the understanding of this property might aid solar dryer designers in managing the issue of rewetting that aids microbial growth on the dried products.
Cocoyam corm is rich in vitamins and minerals and is a common food for the elderly and invalids [23]. Nevertheless, it is a highly perishable corm that requires further processing to increase the shelf-life. It is mostly processed into chips for export or dried and converted into flour [24]. Although a large number of people engage in the production and processing of this product, basic process parameters that can aid in the industrial or medium scale processing of this product are lacking. With the recent interest in advocacy for environmentally friendly energy applications in drying, the future of drying this product will include the use of solar dryers. Therefore, it is necessary to study the thermal properties and drying kinetics of this product in solar drying, especially its thermal effusivity, which is not available for any corm in the literature. Additionally, evaluating a new solar dryer design as presented will expand the available literature and increase the design choice available to be implemented in a different environment. Thus, the specific objectives of this study were (1) to investigate the performance of a portioned single pass collector solar dryer for drying cocoyam with the air driven by a wind-powered suction fan, (2) to study the effect of using the dryer on the thermal properties and heat and mass transfer co-efficient of cocoyam slices, (3) to study the drying kinetics and mathematical modelling of the cocoyam, and (4) to present the economic feasibility of using the solar dryer.

2. Material and Methods

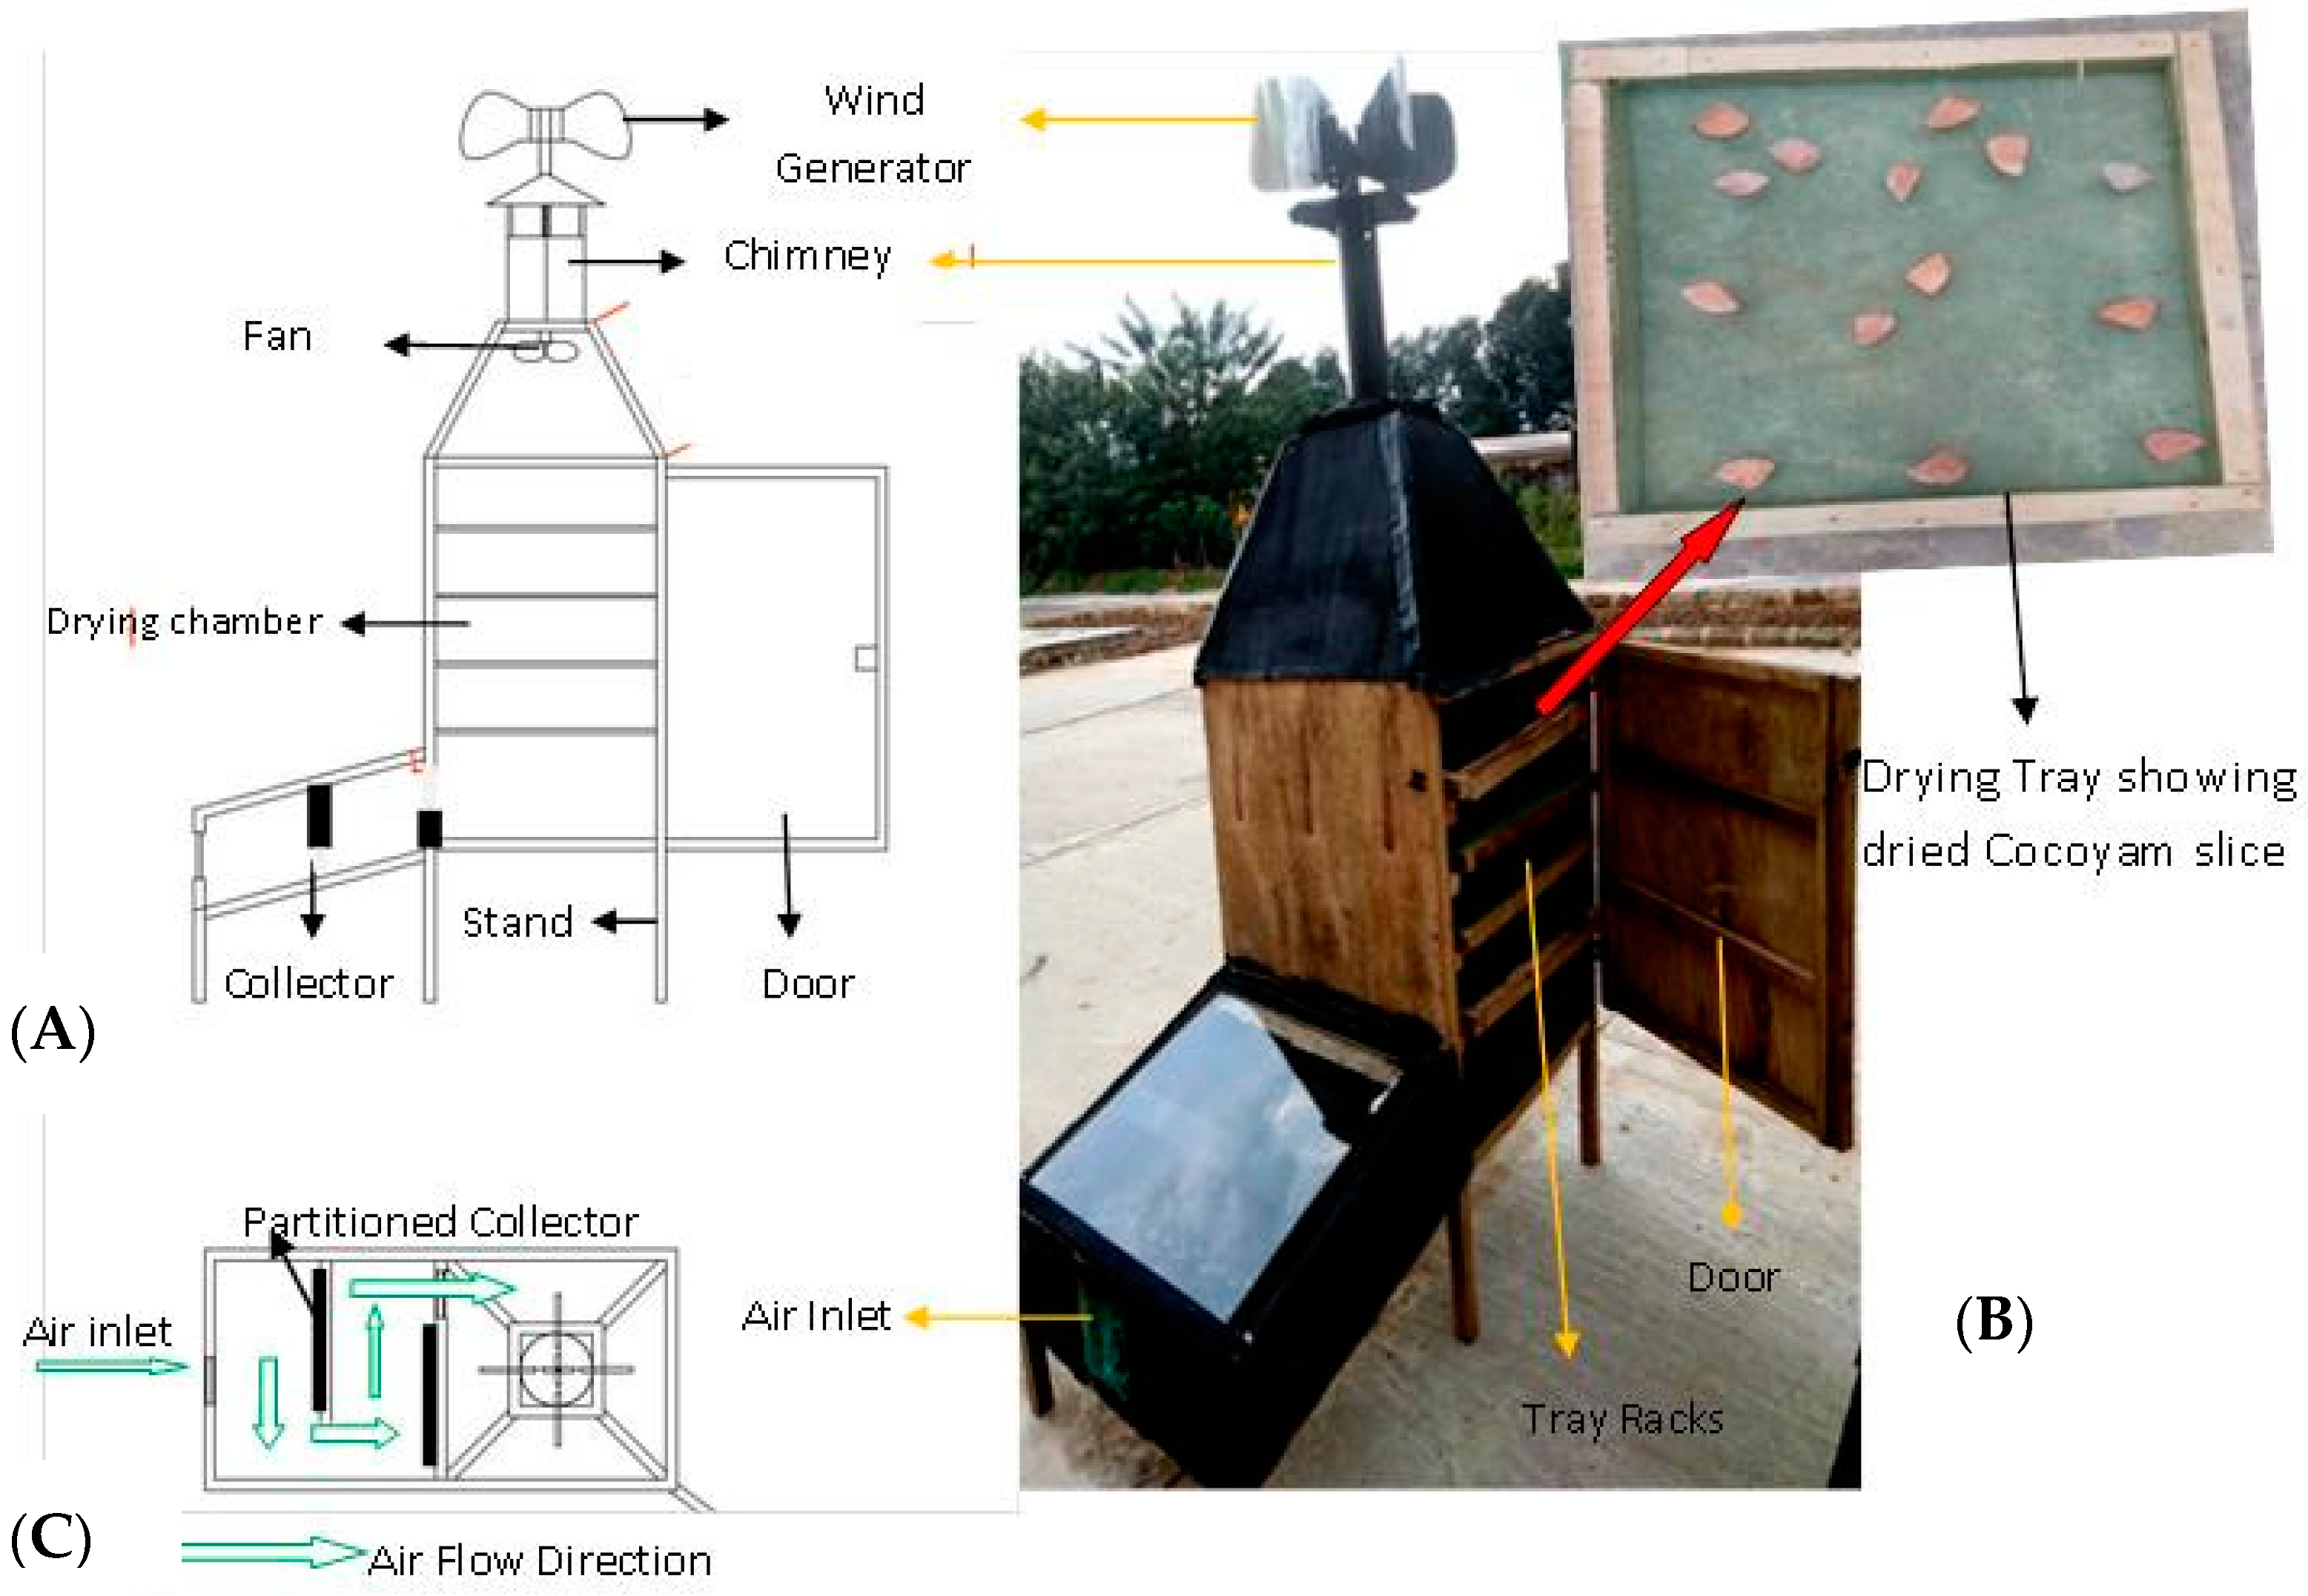
2.1. Description of Solar Dryer Used

The single partitioned, single-pass, active, low-cost solar dryers were fabricated at the Michael Okpara University of Agriculture, Umudike. All the material employed in the fabrication was locally sourced and the cost of fabrication is presented in Table 1 while the cost of materials is presented in Table 2. The dryers consist of a solar air collector section, drying chamber, and chimney. The solar collector (0.6 × 0.6 × 0.59 m) and drying chamber (0.6 × 0.6 × 1 m) are of simple cabinet type, as shown in Figure 1. Both the collector and the drying chamber were supported on a four leg-standing at a height of 0.36 m above the ground. The solar collector was partially partitioned horizontally in the middle, leaving an opening equal to that of the air inlet towards the end wall for air passage into the second chamber before entering the drying chamber, as shown in Figure 1. The two chambers of the collector were loaded with black painted granite stones (0.04 m minimum length at the longest side) with horizontal sharp edges. The granite stones were carefully laid in short ridges inside the collector chambers such that the sharp long edges faced vertically upwards and together create fin-like edges at the top. The solar collector was fitted to the drying chamber at an angle of 15°. The chimney was constructed with a galvanized cylindrical metal pipe of 0.12 m diameter and height of 0.30 m which was fixed centrally on the top of the drying chamber. The wind generator shaft made of hollow pipe was fitted through the middle of the chimney with the help of two frictionless bearings. The down tip of the shaft was attached to the suction fan fitted at the top end of the drying chamber. The fan is controlled by the wind generator with the help of the wind. With this, the design is completely renewable with no grid-based electricity associated with the design. Four removable trays with nets and a skeleton made from 2 × 2-inch wood were placed on the tray racks fitted by the sides of the drying chamber at a vertical gap of 0.15 m from each other to hold the dried products. The collector was glazed with a transparent glass sheet of 4 mm thickness, fixed at the top of the solar collector. The two chambers of the solar collector and the drying chamber were covered with a black painted aluminum sheet to absorb and retain heat inside the solar dryer.

Novelty of Design

The dryer consists of two major design futures, which include (1) the horizontal partial partitioning of the collector, (2) laying the granite stones to form fin-like long ridges at the top, and (3) the incorporation of a wind-powered suction fan. The partitioning and the pattern of laying the granites force the inlet air to traverse a longer distance and surface area within the collector before exiting into the drying chamber. Partitioning helps to create more turbulence for the air with increased energy. Through these designs, the inlet air coming in at high relative humidity will shade some of its moisture to increase its moisture carrying capacity before it enters the drying chamber. Additionally, the integration of wind-powered fans to circulate the drying air, instead of a grid electricity-powered fan, reduces the running cost of the dryer to almost zero. With this design, interest in the dryer will increase, especially in those agricultural crop-producing areas where the electricity penetration density is almost zero.

2.2. Drying Procedure and Instrumentation

Tubers of cocoyam were purchased from a local farm in Abia State, southeastern Nigeria. These cocoyam tubers were thoroughly washed to ensure the removal of sand and other foreign dirt. The cocoyam tubers were later peeled and sliced manually to a thickness of 5 mm each and uniform quadrant shape. Approximately 125 g of the slices were placed on each of the four drying trays inside the drying chamber, as shown in Figure 1. The experiment was carried out at Umudike, southeastern Nigeria (Latitude 050°29′ N and longitude 070°33′ E). Typical metrological data for this location are presented in Table 3 below.
The positions of the trays were constantly interchanged during the drying periods to ensure uniformity in drying. The performance parameter was monitored hourly. This includes the ambient temperature and relative humidity, solar radiation intensity, wind speed, the weight of cocoyam, collector and drying chamber temperature and relative humidity. Measurements inside the collector and drying chamber were performed at three points and the average was used for analysis. The test was carried out from 9:00 a.m. to 5:00 p.m. daily until constant weight was attained. The specifications and sensitivities of the instruments used are shown in Table 4. Data analyses were carried out using Excel.

2.3. Experimental Uncertainties

The primary data measured were solar radiations, relative humidity, temperatures, air velocities, and weight loss. The data were used to determine the experimental uncertainties for the secondary data, including moisture contents, moisture ratio, and drying rate, using Equation (1) [25].
U R = [ ( R x 1 ) w 1 2 + ( R x 2 ) w 1 2 + + ( R x 2 ) w n 2 ] 1 / 2
where w1, w2, and wn are the uncertainties in the independent variables x1, x2, and xn. For moisture content, moisture ratio, and drying rate, the determined uncertainties were ±0.015, ±0.031, and ±0.021.

2.4. Performance Evaluation

The hourly moisture content of the dried cocoyam was determined as follows [26].
m t = w t w d w i
where wt is the hourly weight of the cocoyam, wi is the initial weight of the cocoyam (kg), and wd is the dry weight of the cocoyam (kg).
The hourly solar drying, which is the hourly mass of moisture evaporated from the cocoyam, was determined with Equation (3) [27].
D R = w i w d t
where w i = mass of sample before drying (kg), w d = mass of sample after drying (kg), t = drying period (h).
The solar collector efficiency is given as
C = Q u I c   ×   Ʈ   ×   A C     × 100
where A C is the collector area (m2), I C is the insolation on collector surface (W/m2), Ʈ is the transmittance, and Qu is the rate of energy utilized (W) for the solar dryer, given as
Q u = A c F R [ I c Ʈ U O ( T c T a ) ]
where FR is the heat recovery factor, T is the temperature (°C), Ʈ is transmittance, and Uo is the overall heat loss coefficient.
The solar drying efficiency is given as [28].
d = M w L v Q u × 100
where M w is the weight of water evaporated from the cocoyam (kg), L v is the latent heat of evaporation of water (kJ/kg), and t is the drying period (h).

2.5. Mathematical Modelling of the Drying Curve

The dimensionless moisture ratios were obtained with Equation (7).
M R   = M t     M e M i   M e
where Mt is the moisture content of the cocoyam at time t and Me is the equilibrium moisture content, which is obtained with three consecutive moisture content measurements [29].
Curve fitting was conducted using seven semi-theoretical and empirical models available in the literature and shown in Table 5 [2]. The root mean square error and coefficient of determination presented in Equations (8)–(10) were used to assess the goodness (model verification) of fittings and the best model selected. Model fitting and analysis were performed with Curve Expert graphing and analysis software.
R 2 = 1 i = 1 N ( M R p r e , i M R e x p , i ) 2 i = 1 N ( M R ¯ p r e M R e x p , i ) 2
χ 2 = i = 1 N ( M R p r e , i M R e x p , i ) 2 N n
R M S E = [ 1 N i = 1 N ( M R p r e , i M R e x p , i ) 2 ] 1 2

2.6. Thermal Analysis

2.6.1. Effective Moisture Diffusivity

The solar drying effective moisture diffusivity (De) of the cocoyam was determined by plotting −ln (MR) against time [23]. The effective diffusivity was deduced from the slope K using Equation (11).
K = π 2 D e L 2

2.6.2. Heat and Mass Transfer Coefficient

The hourly variation of the heat and mass transfer coefficient for the drying of cocoyam using the dryer was deduced with the Equation (12) [19].
h c h m ρ a α a = L e
The Lewis number is written as follows:
L e = φ D m
where φ is the thermal diffusivity given as follows
φ = k ρ a C p
The diffusivity coefficient (Dm) is calculated from an Arrhenius equation as follows
D e = D m e x p ( E a R T )
The effective moisture diffusivity (De) was calculated from the experiment while the activation energy (3.704 kJ/mol) was taken from [23] for cocoyam (taro). T is the temperature of the drying air assumed as the temperature of the drying chamber; R is the gas constant (8.31446 J/mol⋅K).
The coefficient of mass transfer, hm (m/s), was deduced from the empirical relationship [30].
h m = ( D m d ) ( 2.0 + 0.522 R e 0.5 S C 0.33 )
S C = η ρ d
R e = ρ d μ η
where d is the particle diameter (m), ρ is the density of the fluid (kg/m3); η is the dynamic viscosity of fluid (kg/ms), and μ is the fluid velocity (m/s), which varied due to variation of the wind.

2.6.3. Variation in Thermal Properties of Cocoyam

The hourly specific heat capacity (Cp) and the thermal conductivity (k) variation of the cocoyam slices were determined using the equation presented by [23] for a solar drying of food products with thermal storage as a function of hourly moisture changes as follows
C P = 1256.26 ( X X 0 + 0.818 )
k = 0.05 + 0.06 X X o
The thermal effusivity was determined as a function of thermal conductivity and specific heat capacity [21].
ϱ = k ρ a C p

2.7. Cost Analysis of the Solar Dryers

2.7.1. Cost Saving

The cost-saving potential of the dryer is calculated by comparing the energy consumed with that of grid-based electricity. The daily total energy utilization (Ec) by the dryers is calculated in terms of the rate of the energy consumed and the total time the dryer is in operation [31] given in the equation.
E c = Q u   .   t
where Qu is the energy utilized (kW), t is time for drying per day
t = m D c t T
where t T is the total time (h/batch) the dryer is in operation daily, m is the mass of product dried per day, and Dc is the dryer capacity (kg/day).
Considering that the dryer is used for a minimum of 20 working days in a month [31] for the 12 month period in a year, the total yearly energy consumption for drying is given in Equation (20)
E y e a r = E c   .   w   .   12
where w (20 days) is the number of days the dryer is in operation per month. Therefore, the amount of saving in a year based on percentage utilization when compared with the electricity price per KWh of electric energy is given by
A M y r = P u   .   E y e a r   .   E p
where Pu is the percentage utilization, which ranges from 0.1 to 1.0, and Ep is the current price of a kWh of energy per country. Using Nigeria as a case study, the current electric energy cost per kWh as of May 2022 is taken as 0.057$ per unit of household energy consumption [32].

2.7.2. Payback Period

The payback period (PBP), which is the amount of time to recover the initial investment, is calculated according to [33] as follows
PBP = C c C s S 1
where Cc is the initial capital cost of the dryer, presented in Table 2, S1 is the average annual savings of the dryer, and Cs is the salvage value taken as 10% of the initial cost for the dryer [34].

2.8. CO2 Emission Reduction Analysis

The CO2 mitigation potential of the solar dryer was analysed by comparing the energy utilization of the solar dryer with an equivalent dryer that uses diesel to power the drying process. Ndukwu et al. [14] gave the energy in kWh utilized by a diesel-powered solar dryer as:
U E d = v d k d η d
where vd is the volume of diesel (L), kd is the heating value of diesel (kWh/L), and ηd is the diesel efficiency (%). To determine the volume of diesel that will be burnt to produce the equivalent amount of energy produced by the solar dryer to dry the cocoyam, Equation (27) is equated with Equation (5) as follows
Q u = v d k d η d
Therefore, the volume of diesel utilized is deduced as follows
v d = Q u k d η d
The mass of CO2 produced by a litre of diesel is given by Ndukwu et al. [14] as follows
m C O 2 = v d k f
The values of kf, kd, and ηd were presented by Ndukwu et al. [14] as 2.63 kg/L, 10.08 kWh/L, and 30%, respectively.

3. Results and Discussion

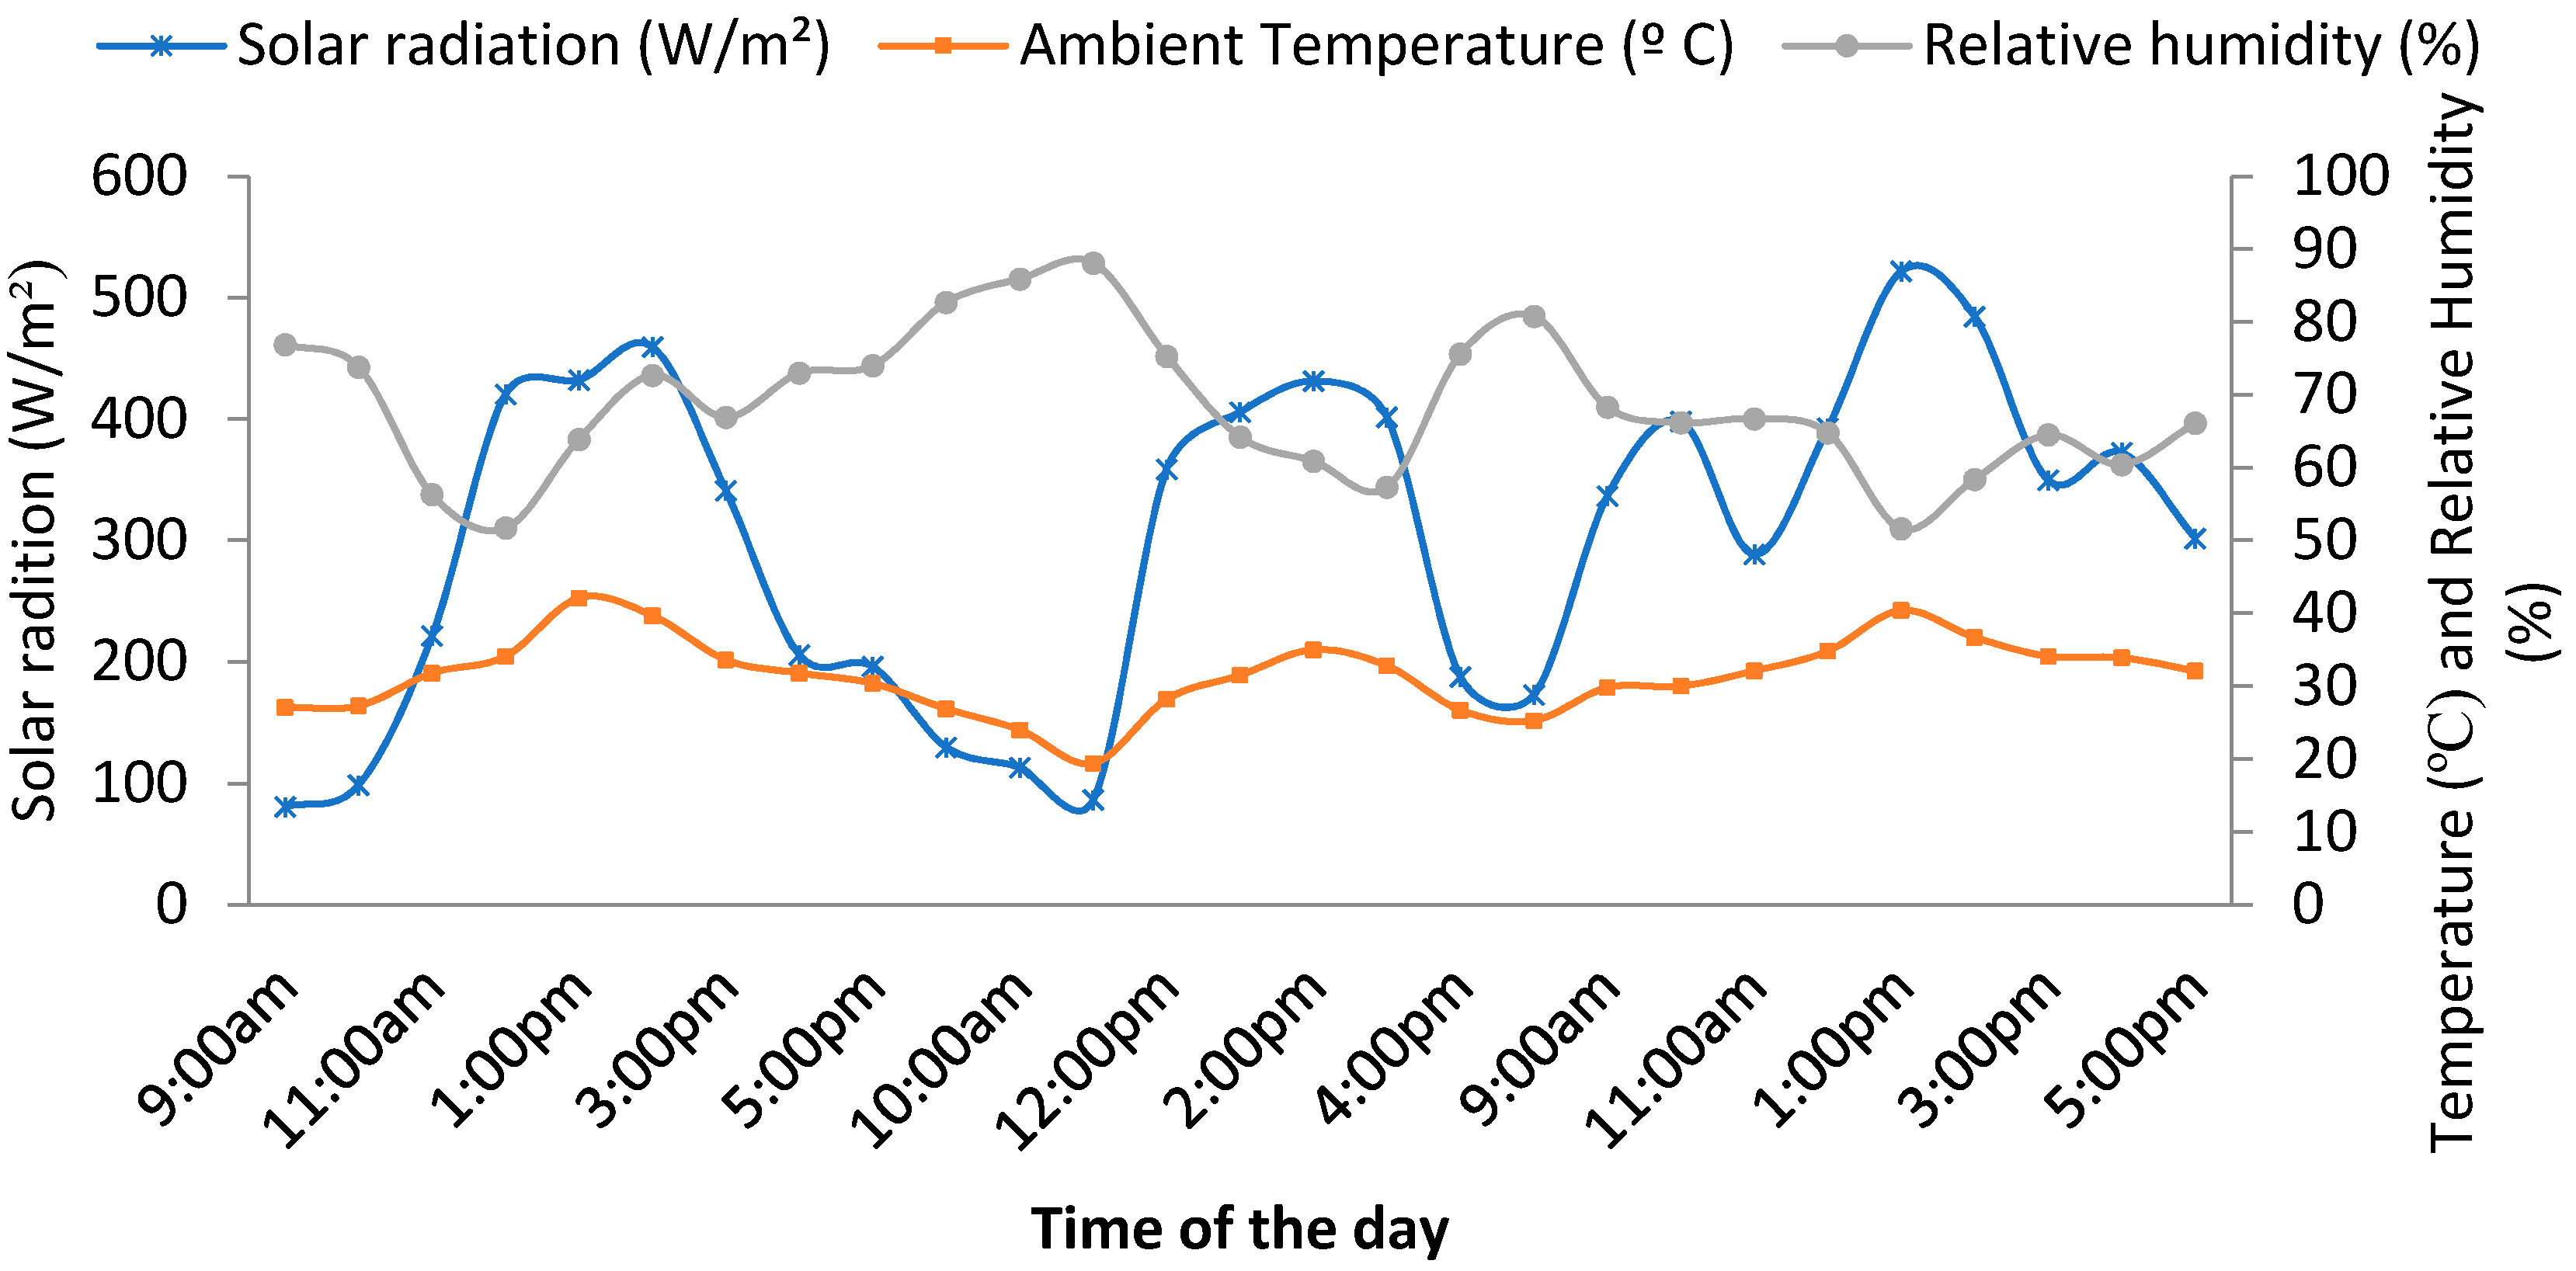
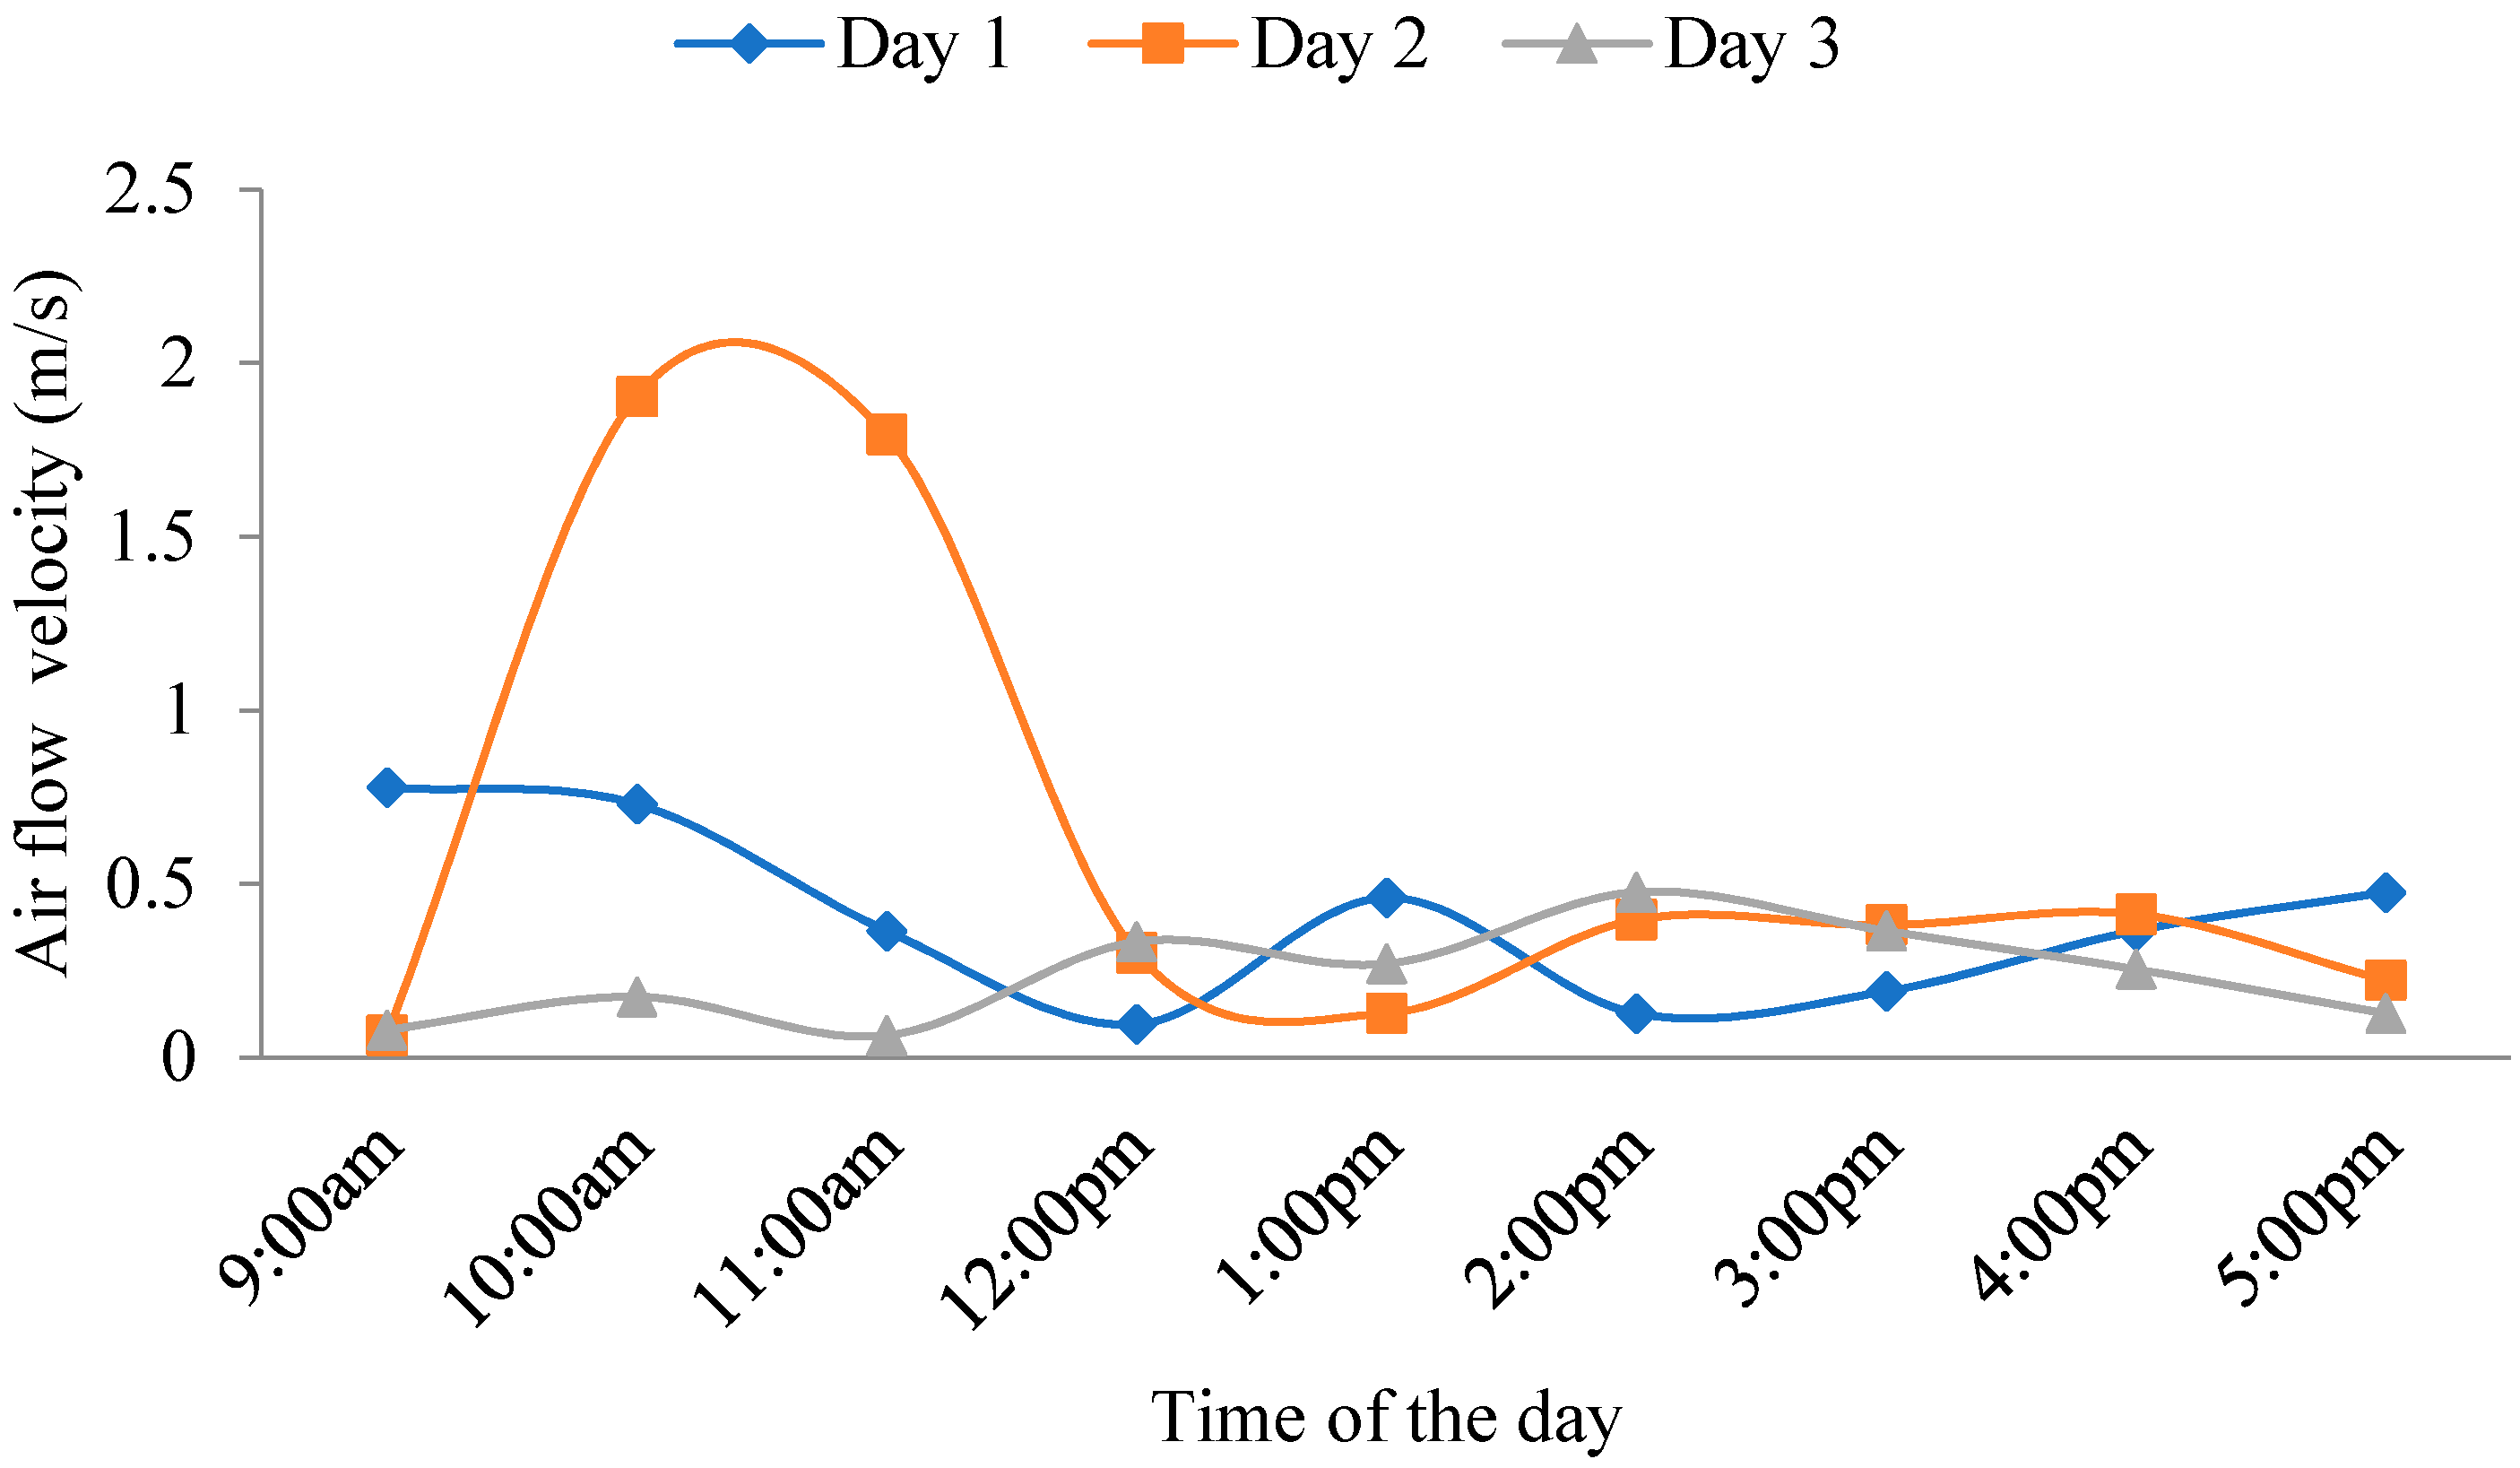
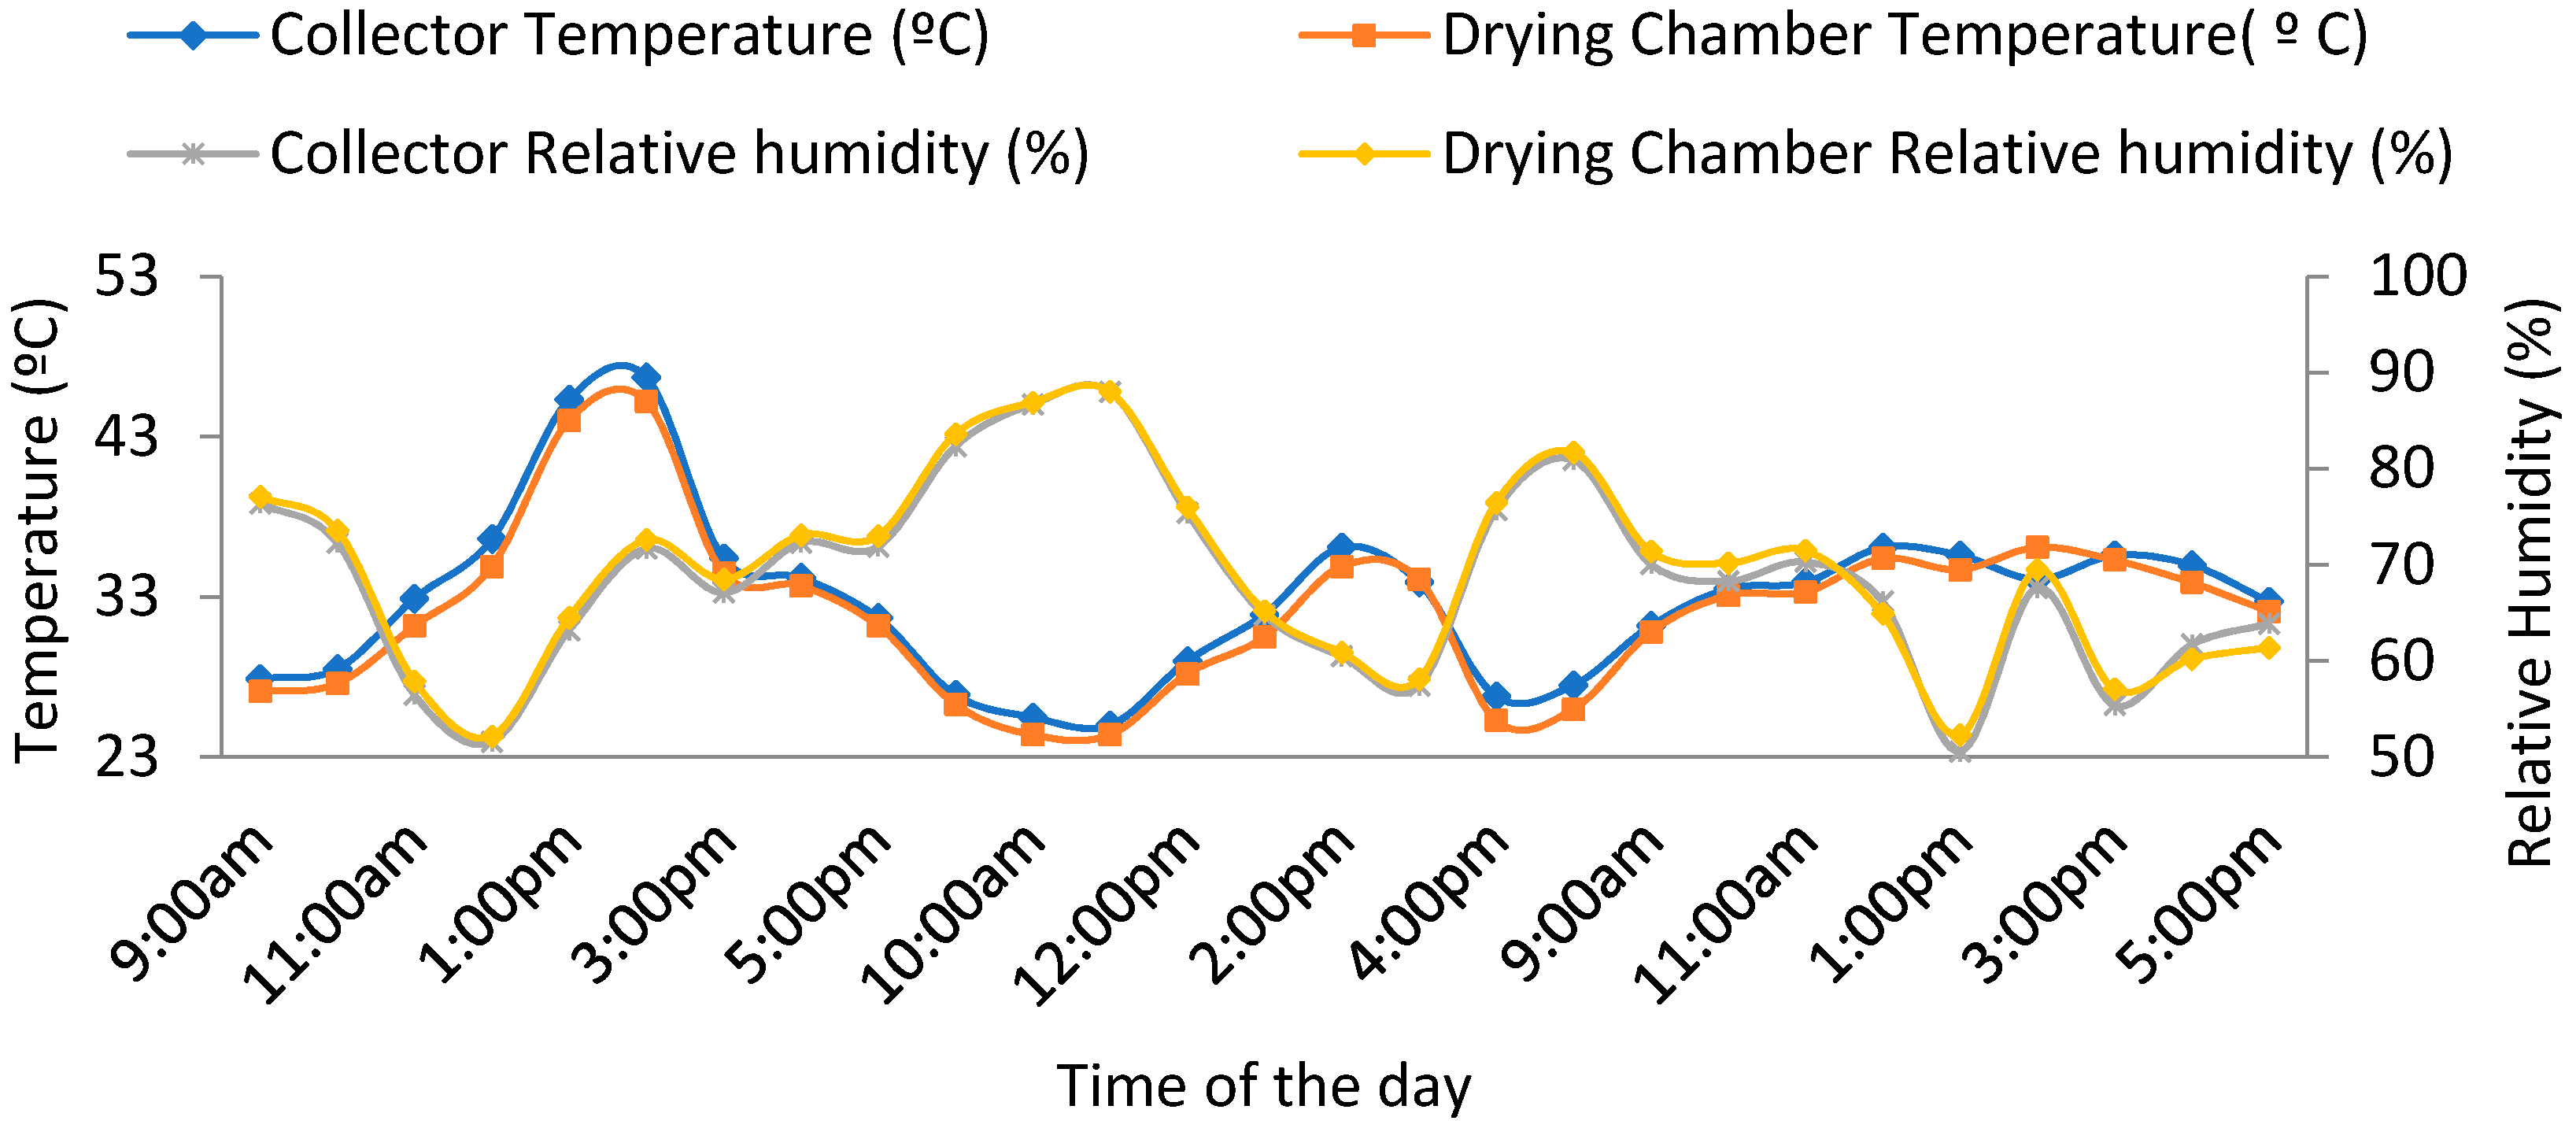
3.1. Dryer Performance

The solar dryer was tested under the worst-case environmental conditions of the rainy season (2–4 September 2021). Though this time is the peak of the harvesting season for tuber crops in this area, it is characterized by high humidity and low solar radiation, as presented in Figure 2. Open sun drying is so difficult during this time and a little temperature gain above the ambient means a lot to farmers in drying their crops. The goal of evaluating the solar dryer during this period is to have the minimum performance of the solar dryer which will improve during the dry season or harmattan period with lower humidity and higher solar radiation. During the test period, the maximum solar radiation was 521.7 W/m2 with an average value of 303.6 W/m2. The average value of solar radiation obtained is lower than the 368.38 W/m2/day reported by Ndukwu et al. [18] for this area. Higher solar radiation occurred from 11.00 a.m. to 3.00 p.m. local time while 9.00 a.m. to 11.00 a.m. had lower solar radiation. Low solar radiation can be used as a warm-up period as no meaningful drying can be achieved during this period [35]. Figure 2 shows that higher solar radiation is synonymous with higher temperature and lower relative humidity. However, the temperature of the area ranged from 19.4 to 42.1 °C and the relative humidity ranged from 51.6 to 88.1%. During these drying periods, the average collector and drying chamber temperatures were 33.41 and 32.53, while the relative humidity was 66.92% and 67.5% respectively. The highest temperature difference between the ambient and the collector was 7 °C, while it was 5.5 °C for the drying chamber. However, the minimum relative humidity for the collector and the drying chamber was 50.6% and 52.3%, respectively.
The determined variation of the air velocity for the solar dryer for the three-day drying periods is shown in Figure 3. The air velocity varied between 0.063 and 1.9 m/s with an average value of 0.42 m/s for the three days. It was observed that the airflow velocity affected the relative humidity of the collector and the drying chamber. Comparing Figure 3 and Figure 4 shows that the relative humidity of the collector and drying chamber decreased as the airflow velocity decreased, and also increased with the airflow velocity. The reason for this might be that, at high airflow velocity, greater airflow volume with higher moisture will be available per time compared to lower airflow velocity. However, due to the partitioning, this air is delayed a little bit to receive more heat, which leads to an increase in temperature observed at a high relative humidity on the first day between 12.00 p.m. and 2.00 p.m. local time. This period can be regarded as a warm up period for the solar dryer as it was not observed again.
AA summary of the average operational performance of the solar dryer is presented in Table 6, illustrating that the dryer took about 25 h to dry the cocoyam slice from the moisture content of 82.9% w.b to 10.32% at an average energy consumption of 3.97 MJ. This drying time is far lower than the 30 h recorded for the open sun drying of potato chips from 60.7% to 8.4% in the month of December at the same location [14]. This showed good performance considering the period during which the experiment took place. The December period in this location is characterized by lower humidity, which favours open sun drying, unlike the September period when this experiment was conducted. This implies that if this experiment was performed in the month of December in the same location, a drying time shorter than 25 h will be obtained. Table 6 also shows the average collector efficiency to be 13.47% with a drying efficiency of 7.57%.

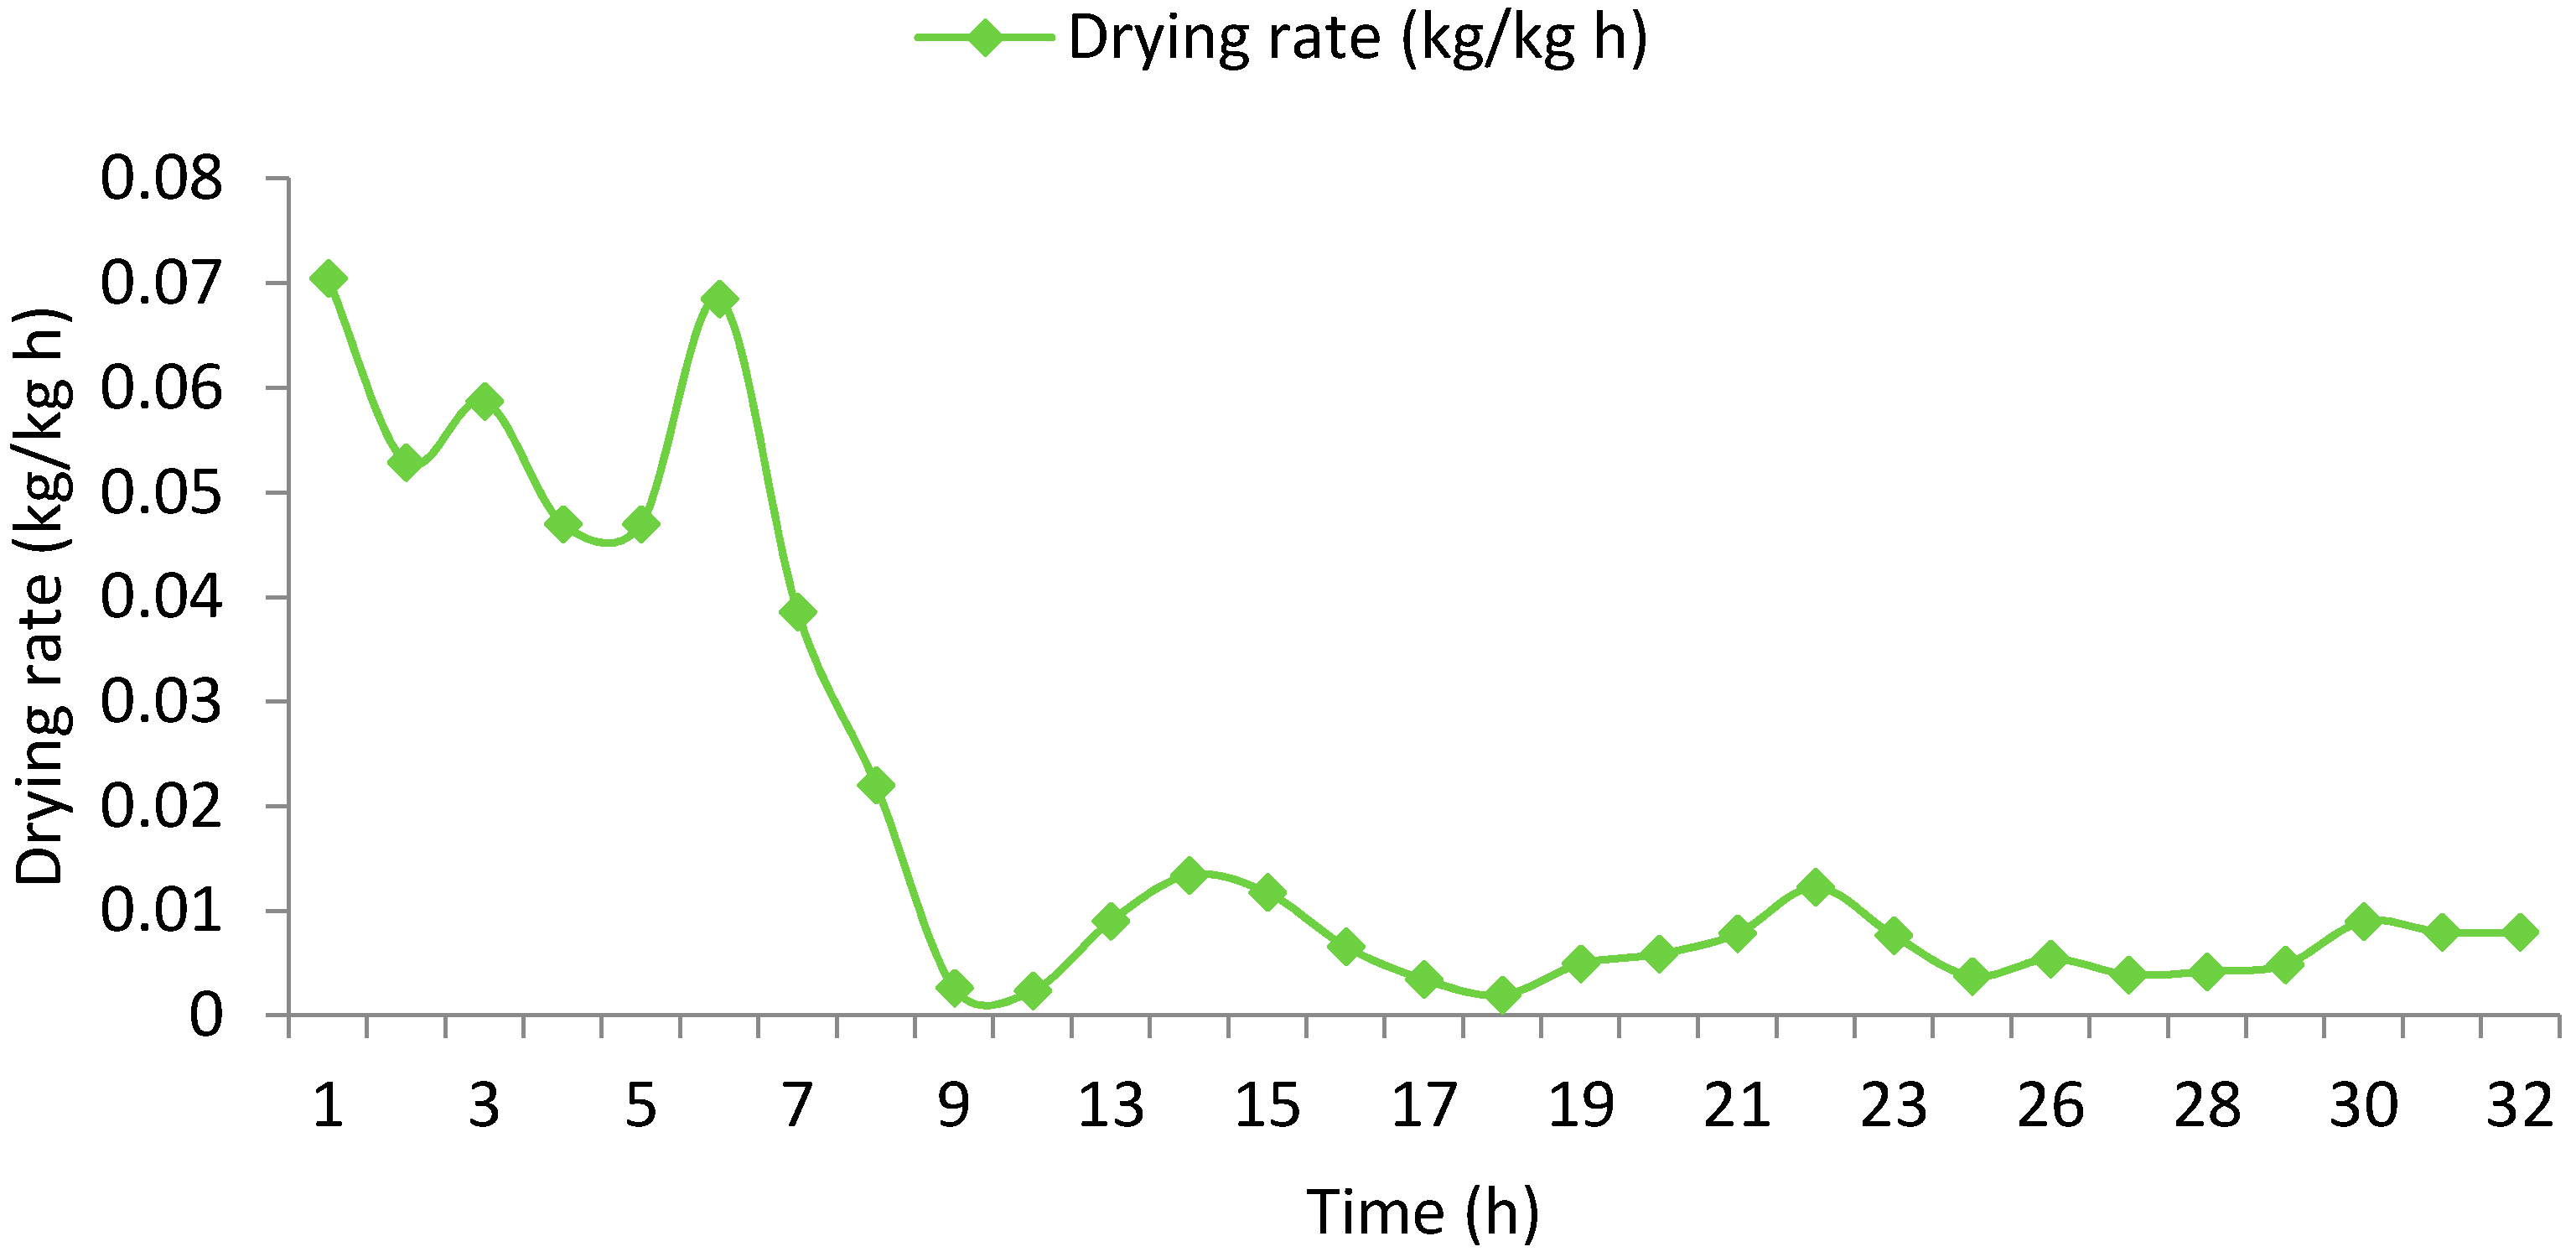
3.2. Drying Kinetics and Mathematical Modelling

The evolution of moisture ratio and the drying rate of the cocoyam chips are shown in Figure 5 and Figure 6. Although, the moisture ratio decreased continuously and followed the falling curve behaviour, the drying rate showed sinusoidal characteristics, which depict the non-isothermal characteristics of solar dryers [36]. The reason for this is that the temperature and humidity evolution which drives the drying process is subjected to the vagaries of weather conditions that are not static. The downward nature of the sinusoidal curve of the drying rate still showed that the diffusion mechanism dominates the moisture transfer mechanism. This is similar to the results obtained by Hawa et al. [29] for untreated Cabaya fruits. The drying rate was highest at the first 6 h of drying but decreased afterwards. This is because the rate of mass transfer is higher due to greater moisture availability, but as the drying progresses, more energy is required to break the moisture bond due to the increased internal mass resistance of the material [37]. The moisture ratios were obtained by converting the moisture content into dimensionless form. To predict the moisture behaviour, the moisture ratio was fitted into seven semi-theoretical and empirical models to select the best-fitted model to predict it, and the results are presented in Table 7. Table 6 also shows the values of the model constants, R2, χ2, and RMSE values for each model. The goodness of fit between the experimental and predicted moisture ratio was verified by a higher R2 value and lower chi-square and RMSE [38]. However, as shown in Table 6, for all the models used, R2, χ2, and RMSE values ranged from 0.95421 to 0.9666, 0.001165 to 0.00191, and 0.02923 to 0.03891, respectively, with the two-term model having the best fit. The plot of the predicted moisture ratio with the two-term model and the experimental moisture ratio is shown in Figure 5.

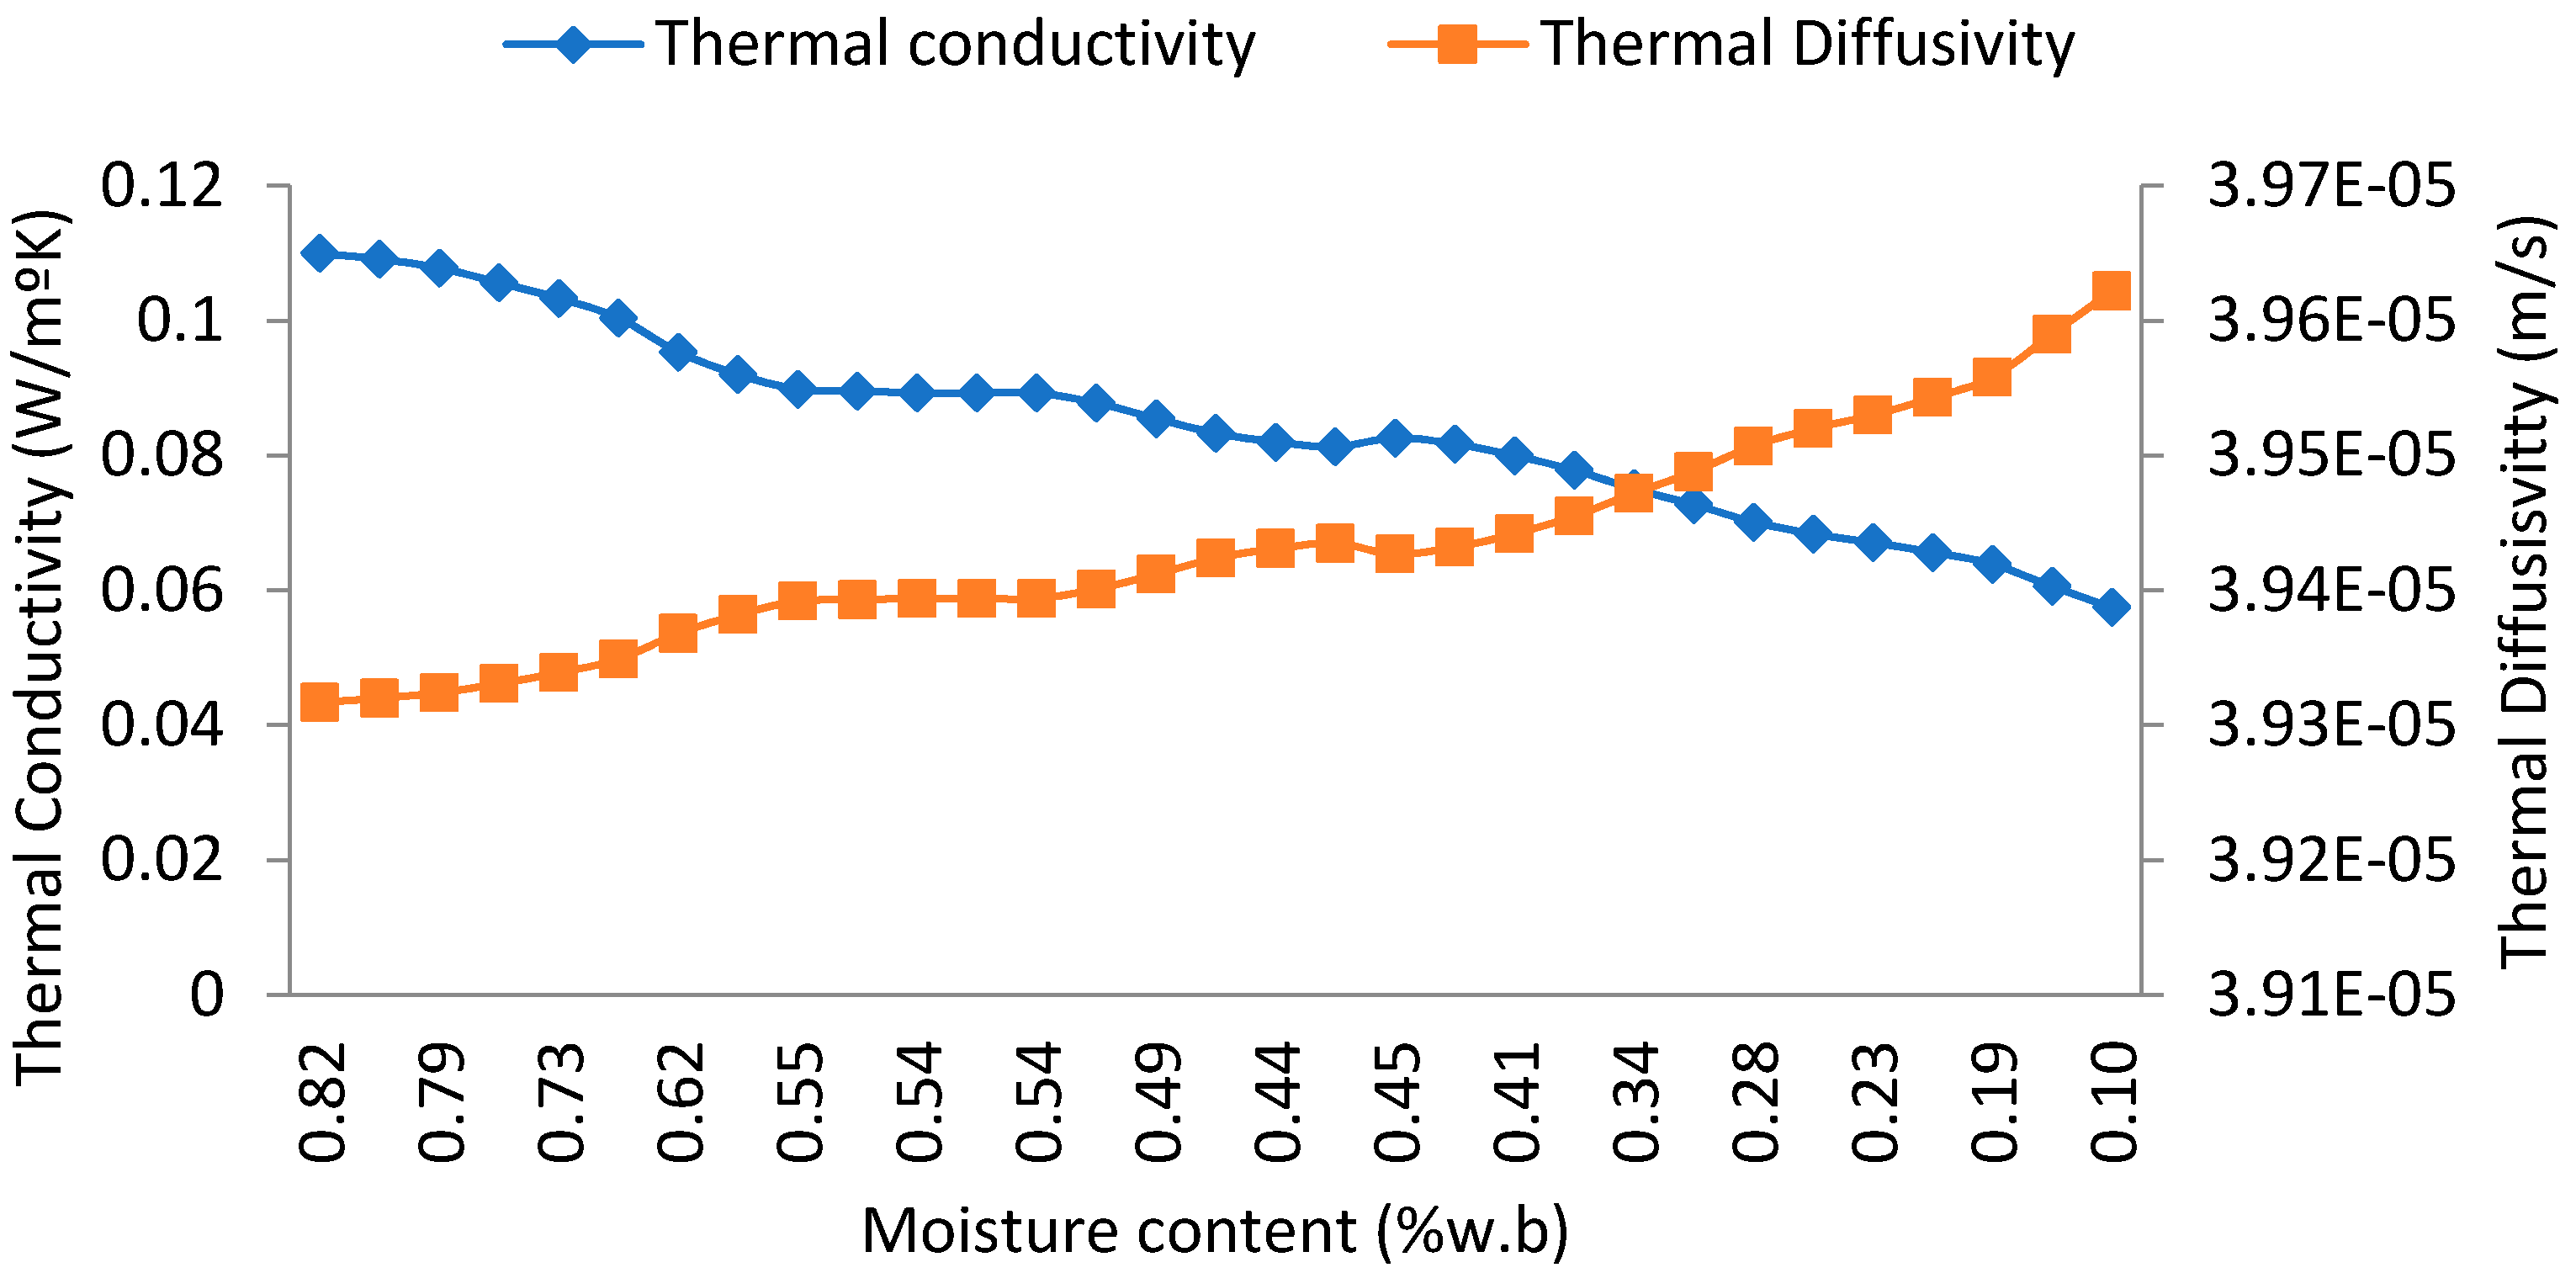
3.3. Evolution of the Thermal Properties

Figure 7 and Figure 8 show the relationships between the specific heat capacity (Cp), thermal conductivity (K), thermal diffusivity ( φ ), and thermal effusivity ( ϱ ) with moisture loss. The specific heat capacity and thermal conductivity were determined as a function of the moisture content. In contrast, the thermal diffusivity and effusivity were deduced as a function of the thermal conductivity and specific heat capacity. Loss of moisture resulted in the decline of the specific heat capacity, thermal conductivity, and thermal effusivity, while the thermal diffusivity increased, as shown in Figure 7 and Figure 8 below.
Specific heat capacity, thermal effusivity, and thermal conductivity are thermal properties linked with heat distribution or storage within the product drying structure. Therefore, they are a function of the available product moisture and the food composition of the product. A decrease in moisture increases the volatility of food constituents, loss of moisture, and creation of voids by breaking the intercellular links distributing heat (tortuosity factor). Consequently, these properties are decreased [39]. The values of thermal effusivity of cocoyam ranged from 12.2 to 47.94 W S1/2 m−2 K−1. This range of values is higher than that given for agricultural soil (1.38–4.01 W S1/2 m−2 K−1) and static air (5.0 W S1/2 m−2 K−1) [40]. In contrast, the values are less than that of water (1600W S1/2 m−2 K−1), green leaves (675 W S1/2 m−2 K−1 to 750 W S1/2 m−2 K−1), and polymers (400–1500 W S1/2 m−2 K−1) but lie within the range given for insulators (10–400 W S1/2 m−2 K−1). The thermal diffusivity value showed the effectiveness of heat energy transport within the cocoyam chips during drying. The value of thermal diffusivity is a function of thermal conductivity and specific heat capacity. The behaviour of the thermal diffusivity curve is an indication of the degree of the magnitude of variation of specific heat and thermal conductivity, although Jayalakshmy and Philip [21] have shown that this value can be inconsistent. The average values of the thermal conductivity, thermal effusivity, specific heat capacity, thermal diffusivity, and effective moisture diffusivity are presented in Table 8. These values are given as 0.090049 W/m.K, 35.30598 S1/2 m−2 K, 1866.154 J/kg K, 3.9396 × 10⁻⁵ m/s, and 3.21462 × 10⁻¹⁰ m/s, respectively. The obtained value of the effective moisture diffusivity for the cocoyam is within the range obtained in the literature for agricultural products [41].
All the thermal properties determined were presented as a function of the moisture ratio, as shown in Table 9, with a coefficient of determination for non-linear fittings ranging from 0.98 to 0.99, while the standard error ranged from 8.3 × 10 −9 to 4.01 × 10 −4. The obtained result showed a good fit for the equations.

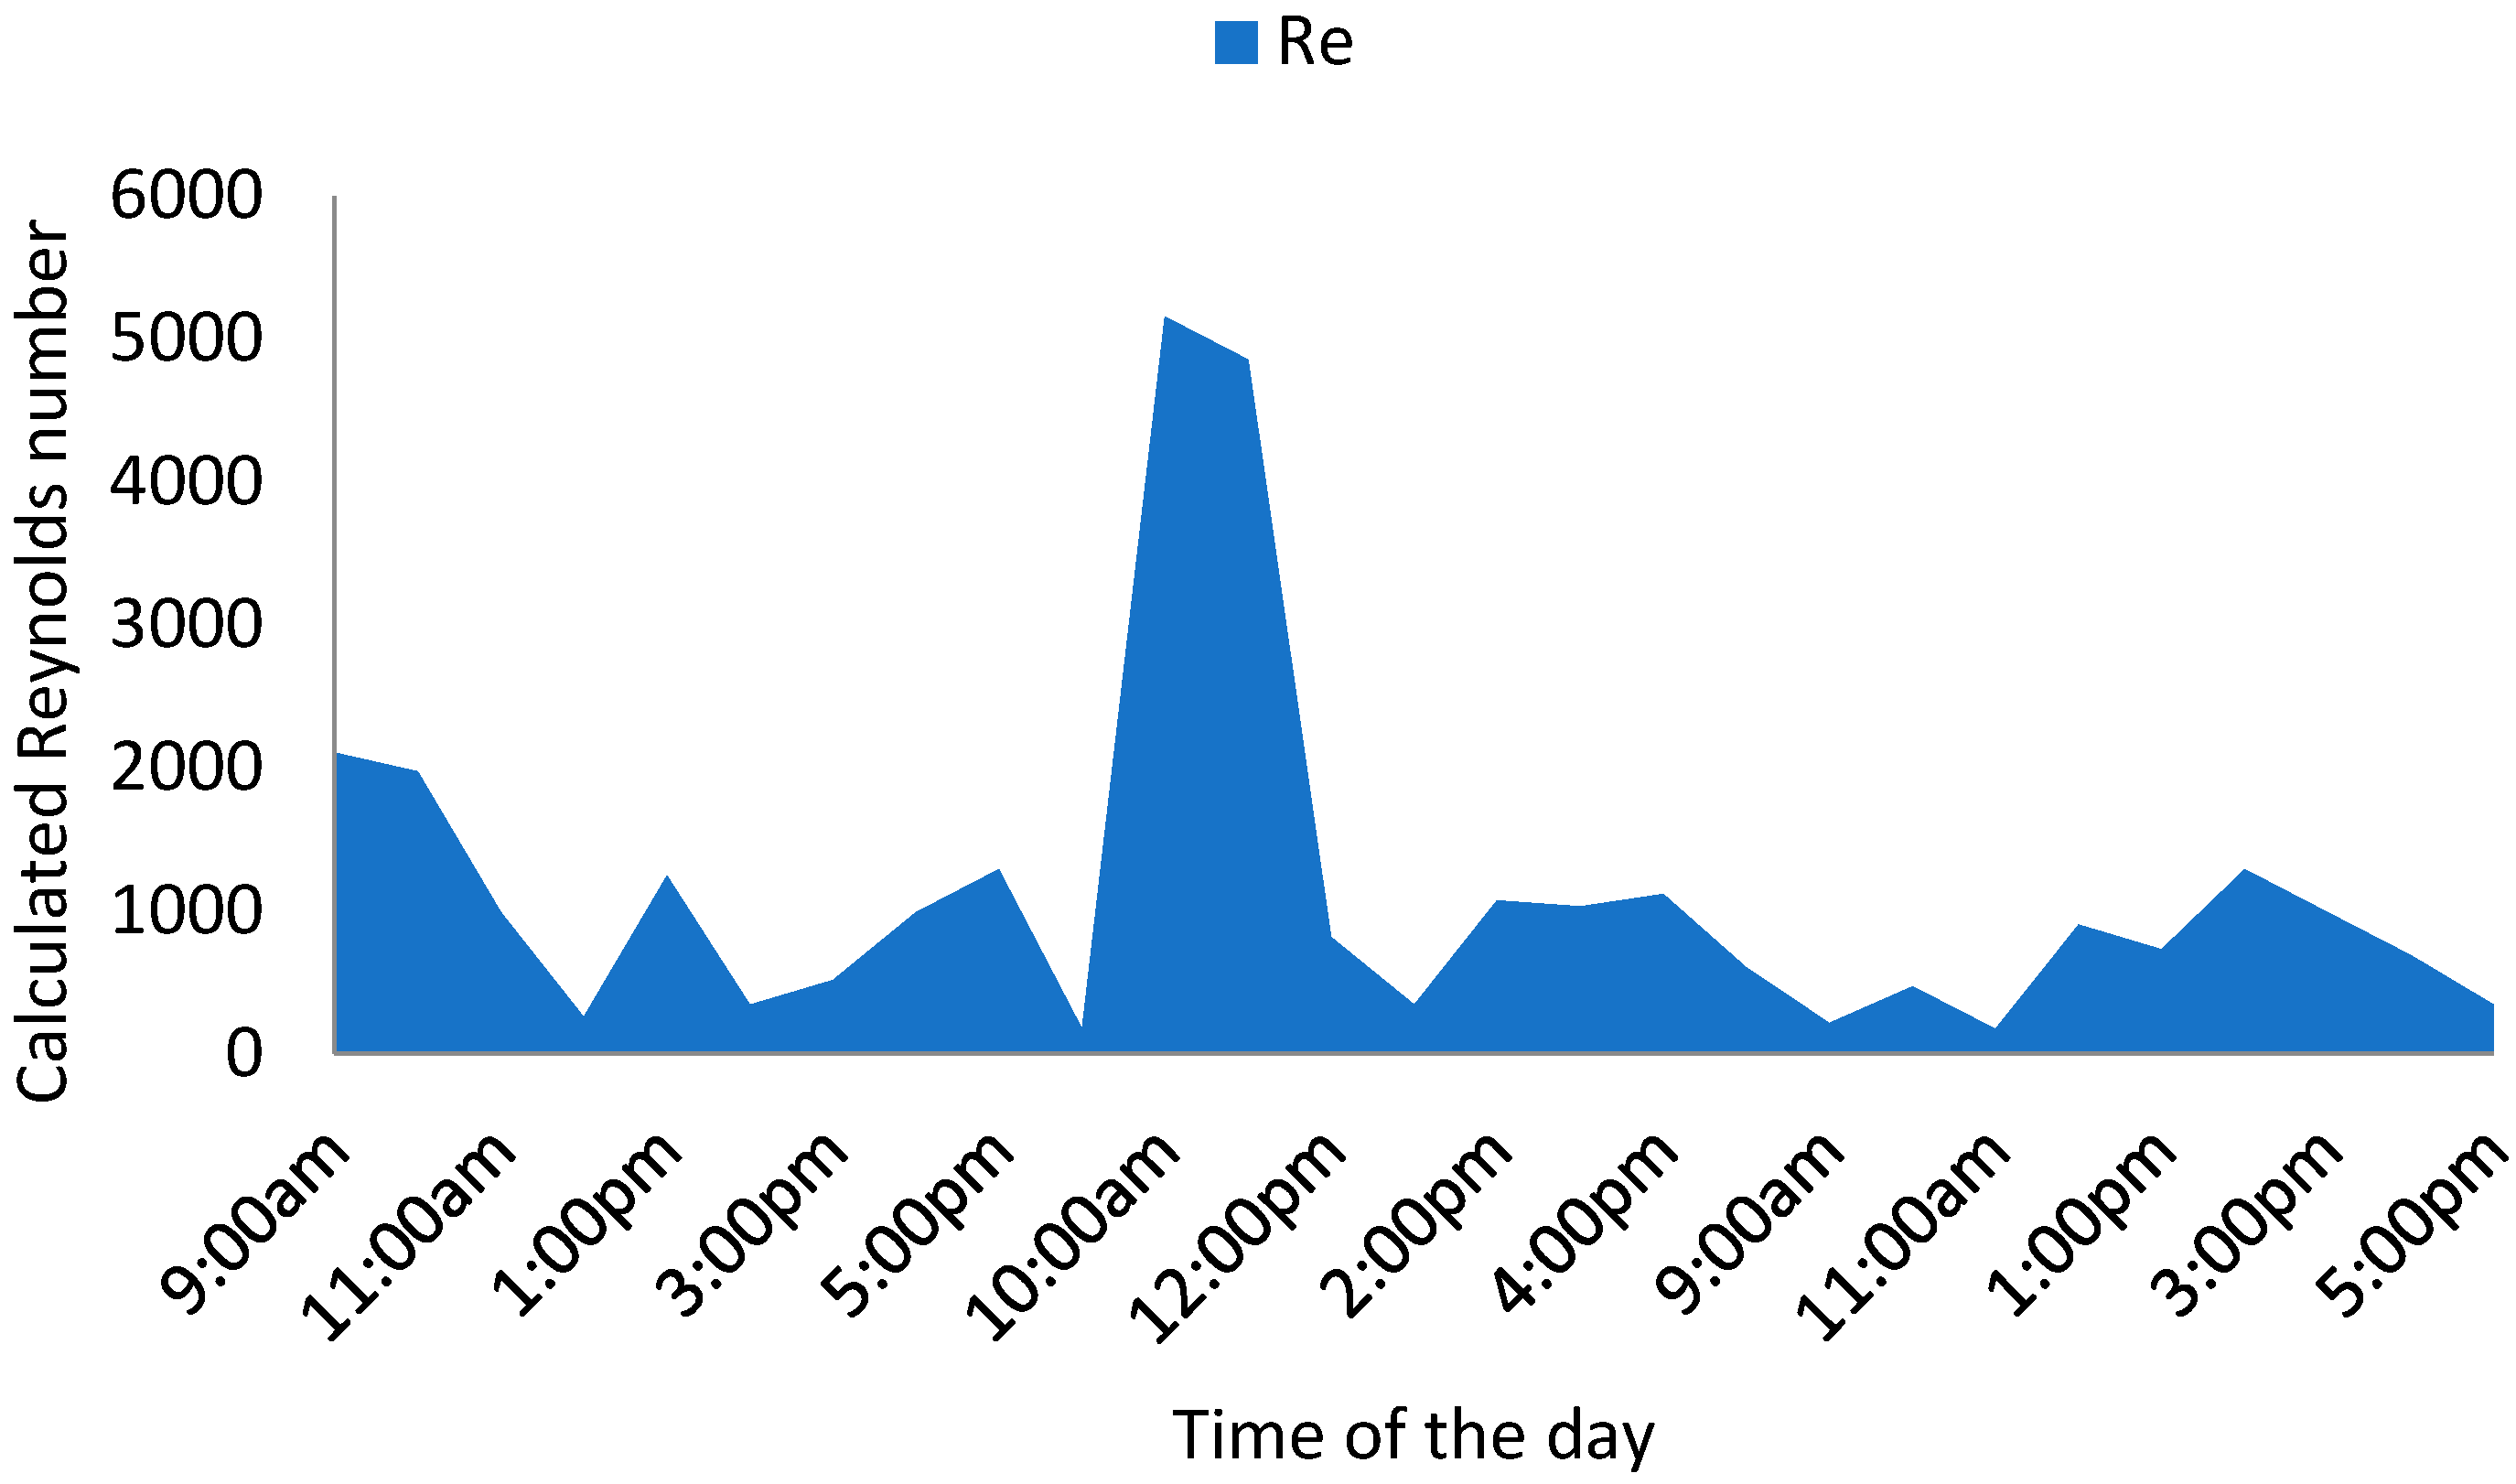
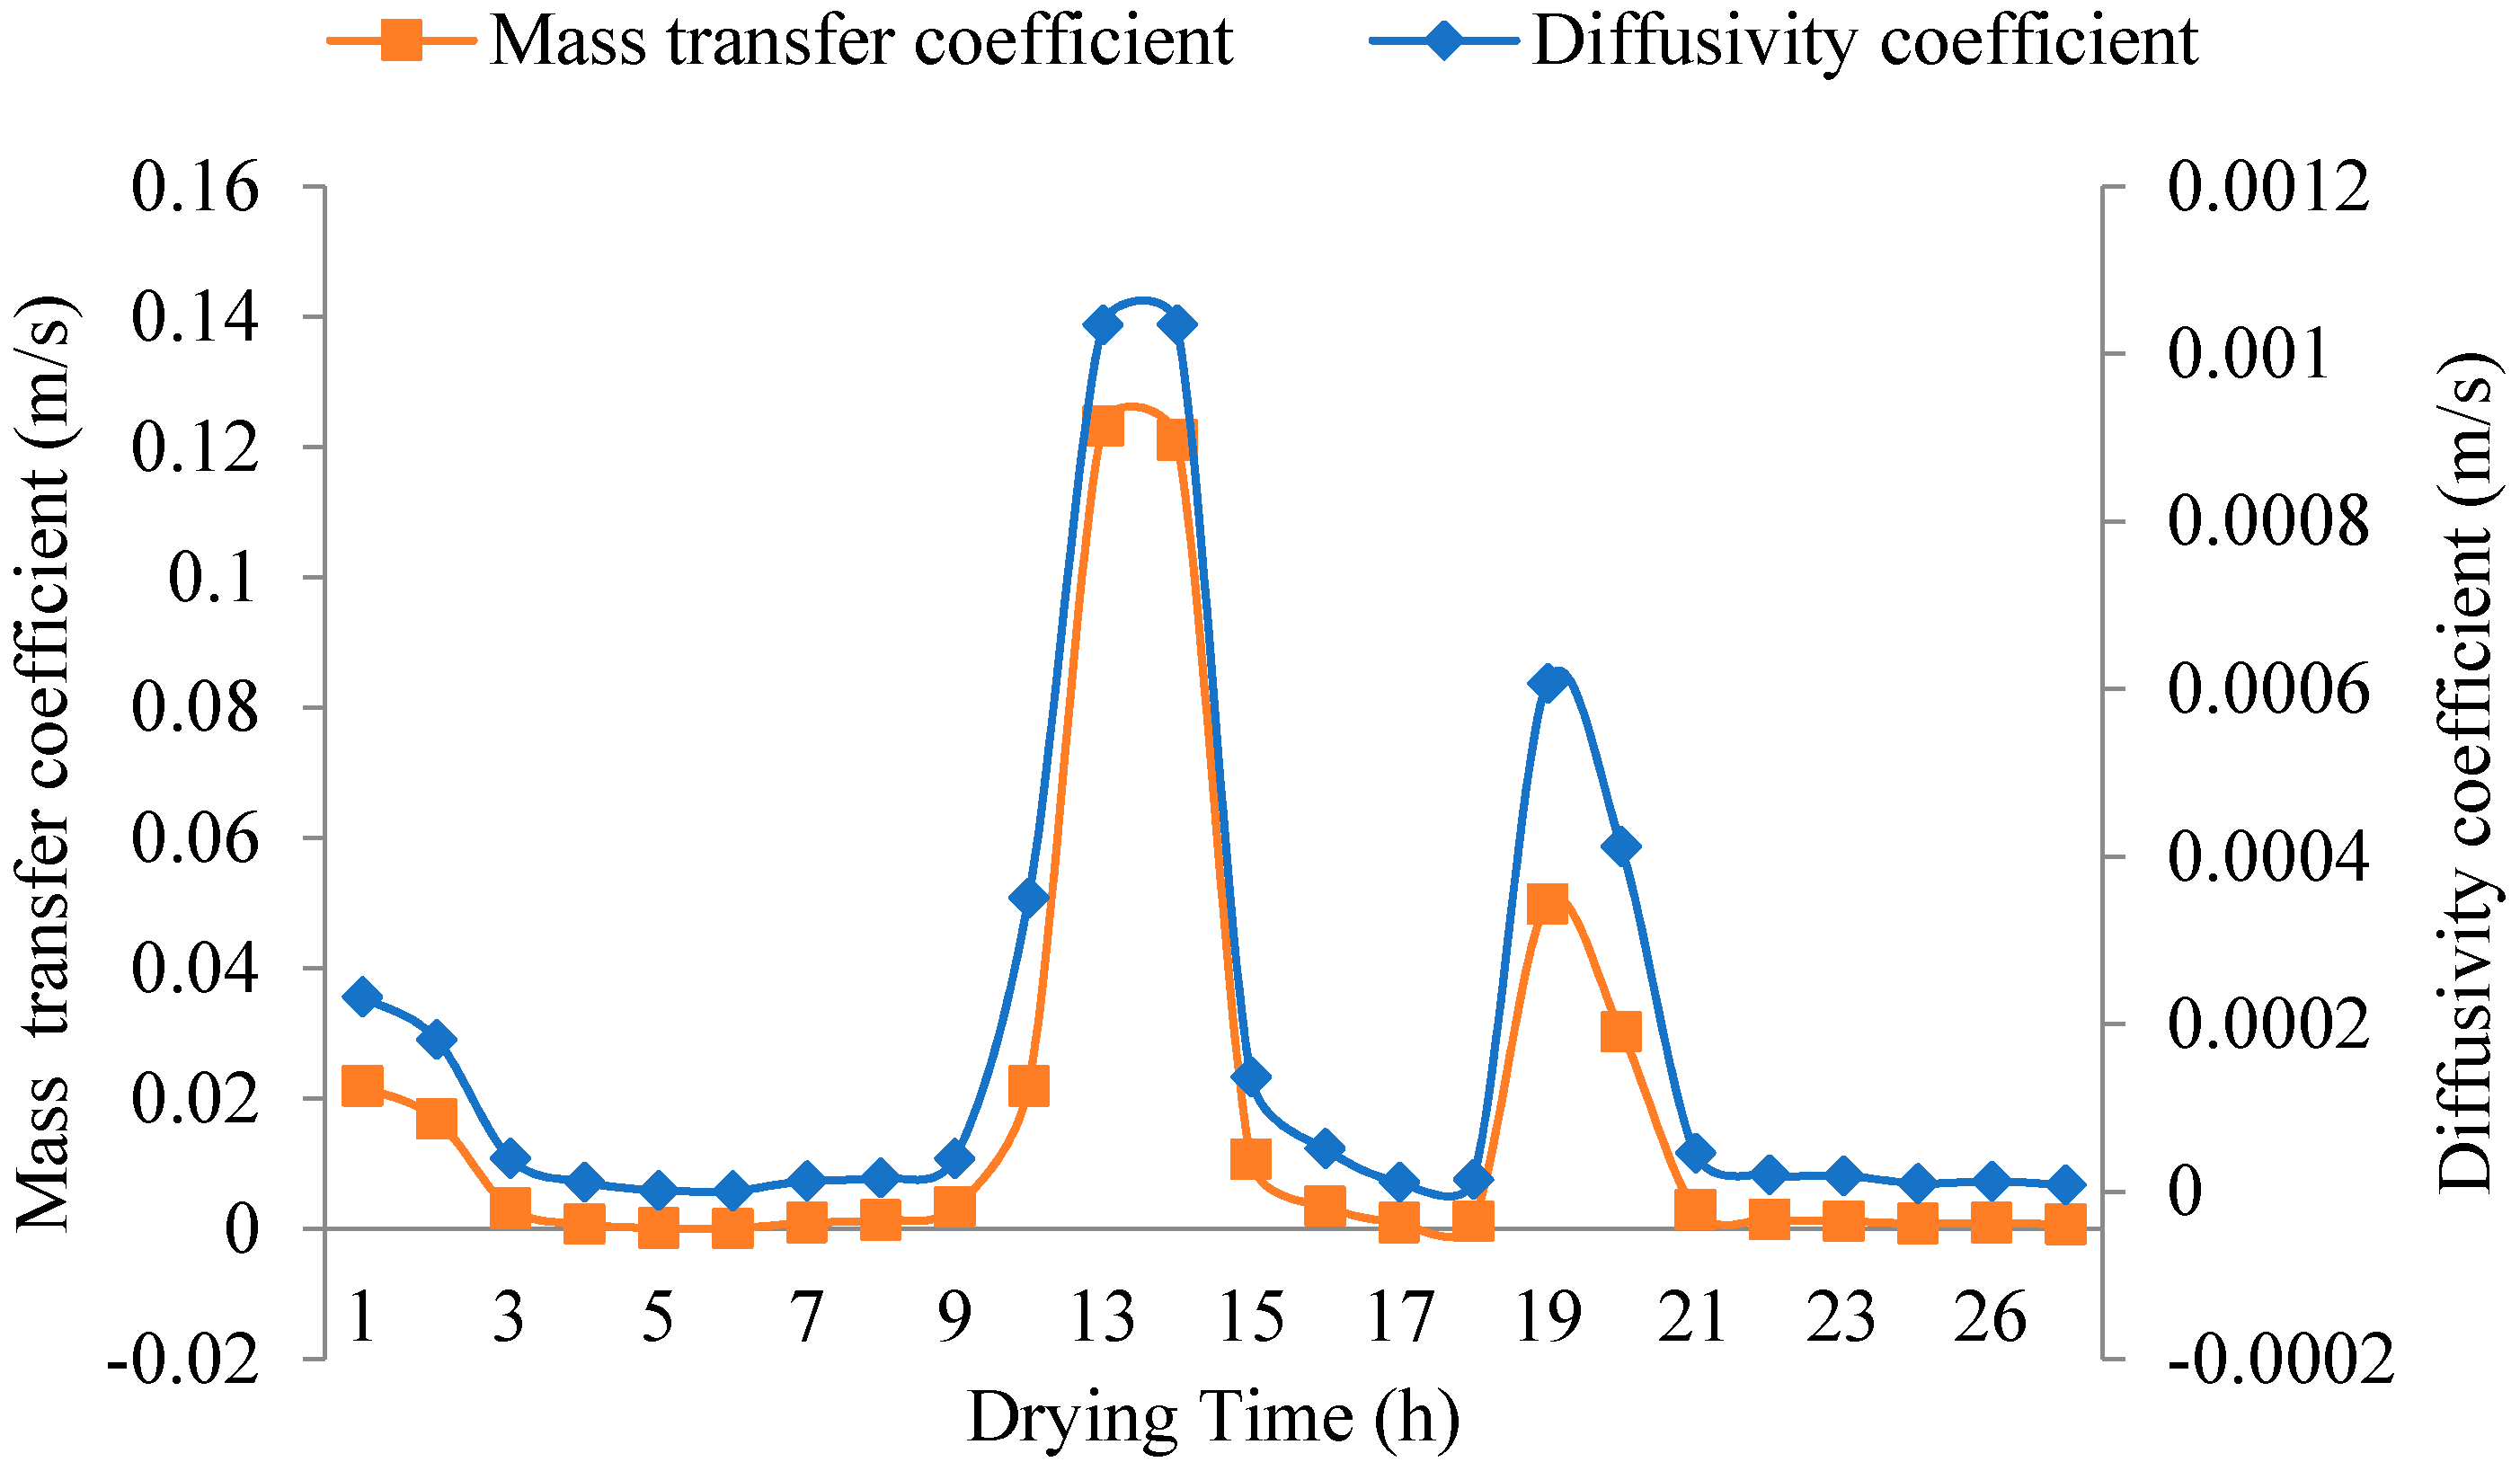
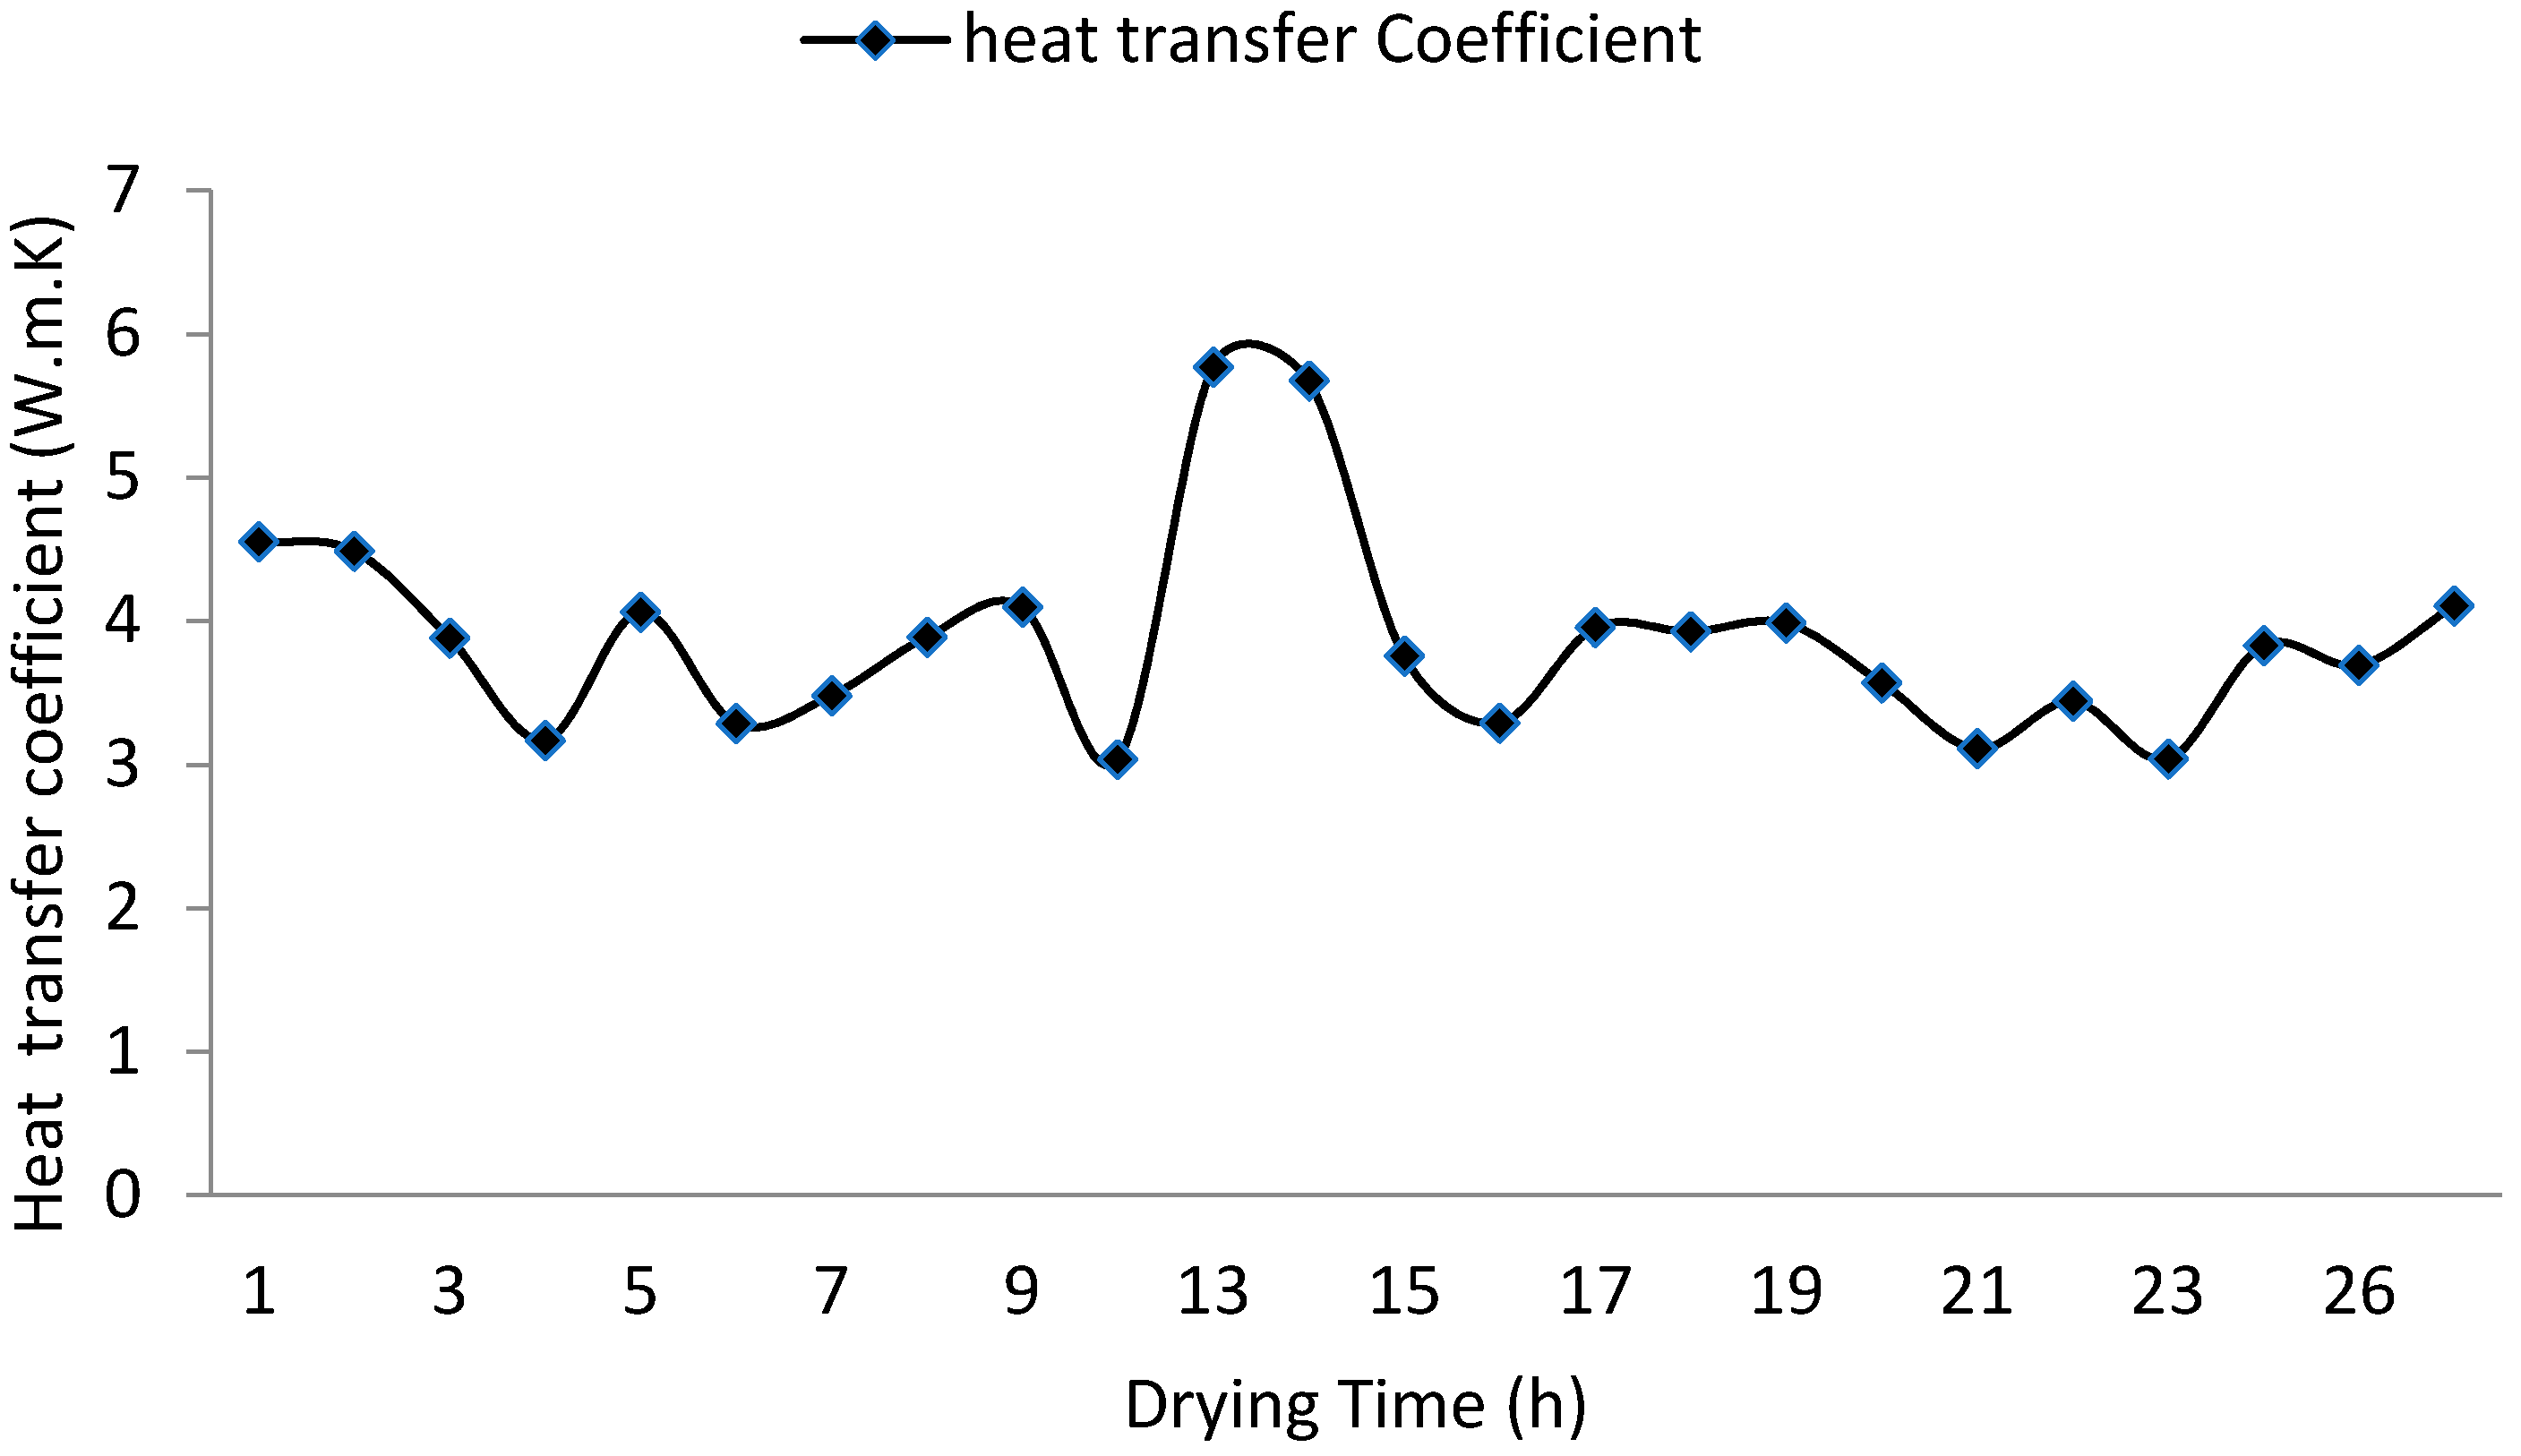
3.4. Variation in Heat and Mass Transfer Coefficient

The plot of the Reynolds number in Figure 9 shows that it varies from 171.7 to 5152.669, which indicates that the airflow condition gravitates between laminar and turbulent flow due to the effect of partitioning and the wind air generator. This is a result of inconsistency in wind speed as they vary due to the vagaries of weather changes. A lower Reynolds number indicates the dominance of vicious force at that moment while a higher Reynolds number is an indication of inertia force domination due to the increased speed of the flow. The non-linear relationship between the Reynolds number and the airflow velocity is presented in Equation (23). The values of the Reynolds number affect the mass and diffusivity transfer coefficient and are linearly related. For this research, the variation of the heat transfer, mass transfer, and diffusivity coefficient was computed with the Schmidt and Reynolds numbers. Additionally, the mass transfer coefficient and the Lewis number were used to compute the heat transfer coefficient for the drying of the cocoyam. Therefore, the results also mimicked the sinusoidal characteristics of the plot of the Reynolds number as shown in Figure 10 and Figure 11. However their values varied from 7.1 × 10⁻⁵ to 1.2 × 10⁻¹ m/s for mass transfer coefficient, 1.05 × 10⁻⁶ to 1.035 × 10⁻³ m/s for diffusivity coefficient, and 3.056 to 5.771 W/m °C for heat transfer coefficients with average values of 1.757 × 10⁻² m/s, 1.79 × 10⁻⁴ m/s, and 3.85 W/m °C, respectively.
R e = ( 1 + λ ( v ) Γ ) ( 1 λ )
where , λ , and Γ are regression coefficients, given as 0.00859, −0.1, and −0.00000297, respectively, and v is the air velocity (m/s).

3.5. Economic Assessment

Solar drying has the advantage of cost-saving over most other dryers. The cost analysis is based on the prevailing economic conditions and monetary policy of Nigeria. For ease of the analysis, it was assumed that the solar dryers operate for 20 days monthly excluding the official weekends (Saturday, Sunday, and half a day on Fridays). However, it is also assumed that the rate of usage might vary depending on the availability of sunshine hours, which vary between 3.5 and 9 h in Nigeria [42,43]. Therefore, the percentage usage graduated from 10% to 100%. The initial cost of fabricating the dryer is presented in Table 2 with a total cost of $122.714. Considering the energy consumption presented in Table 5 and the unit cost of electricity in Nigeria, the amount of saving per rate of usage is presented in Figure 12. The computed values increased from $188.63 to $1886.13. This amount of savings is huge for a poor country like Nigeria where a lot of people are still living below the poverty line. The amount saved was used to compute the payback periods based on the percentage usage. The payback period ranged from 0.059 to 0.59 years (21.54–215.35 days). This is far lower than the payback period for tunnel dryers calculated as 13 years [44]. Therefore, assuming a life span of 10 years, the dryer will run almost cost-free throughout its entire life.

3.6. Environmental Impact Analysis

The ecological benefit of using such a dryer is the mitigation of atmospheric CO2, unlike fossil-based dryers where the energy sources release CO2 into the atmosphere. A comparative analysis was performed using this solar dryer and a diesel-powered dryer in terms of an equal amount of energy utilization to dry the same amount of cocoyam. The determined CO2 reduction per year was 317.11 tonnes per year, as presented in Table 5. This is high and represents an indicator of the ecological benefits of using the solar dryer.

4. Conclusions

The performance evaluation and thermo-physical data of cocoyam chips were evaluated with a partitioned single pass solar dryer powered by the wind. Drying of the cocoyam chips took 25 h with a collector efficiency of 13.47% to attain equilibrium moisture content under a highly humid condition and average solar radiation intensity. The specific heat, thermal conductivity, thermal diffusivity, diffusivity coefficient, heat and mass transfer coefficient, and thermal effusivity were empirically determined. The specific heat capacity, thermal conductivity, and thermal effusivity declined with moisture content. In contrast, the thermal diffusivity increased. The diffusivity coefficient and heat and mass transfer coefficient varied with the airflow rate. Determination of the Reynolds number indicates that the airflow through the collector gravitates between laminar and turbulent flow due to the impact of the wind generator. The two-term model was the best-fitted model for the drying kinetics of cocoyam under variable external climatic conditions of the study area. Using the solar dryer in Nigeria can save $188.63–$1886.13 in running costs with a payback period of 0.059–0.59 years (21.54–215.35 days) at a rate of 10–100% of usage. The results obtained will be useful in the process optimization of the solar drying of cocoyam. Future simulation of the drying process considering the fluid behaviour is recommended for future study.

Author Contributions

Conceptualization, M.C.N.; methodology, M.C.N.; validation, M.C.N., M.I., I.E., U.A. and P.E.; investigation, M.C.N. and F.A.; resources, M.C.N., M.I., I.E., U.A., P.E., L.B., M.S.-T. and A.G.; writing—original draft preparation, M.C.N., L.B., F.A. and A.G.; writing—review and editing, M.C.N., L.B., F.A. and A.G.; visualization, L.B. and M.S.-T. All authors have read and agreed to the published version of the manuscript.

Funding

This research received no external funding.

Institutional Review Board Statement

Not applicable.

Informed Consent Statement

Not applicable.

Data Availability Statement

There is no data availability.

Acknowledgments

The authors acknowledge the contribution of Chinemerem Ezewusi and Chibueze Ndukwe in data collection for this research.

Conflicts of Interest

The authors declare no conflict of interest and declare that the corresponding author signs every author’s agreement regarding this article on behalf of all the authors.

References

  1. UNICEF. In Brief to the State of Food Security and Nutrition in the World 2021; FAO: Rome, Italy, 2021. [Google Scholar] [CrossRef]
  2. Ndukwu, M.C.; Diemuodeke, E.O.; Abam, F.I.; Abada, U.C.; Eke-emezie, N.; Simo-Tagne, M. Development and modelling of heat and mass transfer analysis of a low-cost solar dryer integrated with biomass heater: Application for West African Region. Sci. Afr. 2020, 10, e00615. [Google Scholar] [CrossRef]
  3. Gupta, A.; Das, B.; Biswas, A.; Mondol, J.D. An environmental and economic evaluation of solar photovoltaic thermal dryer. Int. J. Environ. Sci. Technol. 2021, 1–20. [Google Scholar] [CrossRef]
  4. Catorze, C.; Tavares, A.P.; Cardão, P.; Castro, A.; Silva, M.E.; Ferreira, D.W.; Lopes, S.; Brás, I. Study of a solar energy drying system—Energy savings and effect in dried food quality. Energy Rep. 2022, 8, 392–398. [Google Scholar] [CrossRef]
  5. Simo-Tagne, M.; Ndukwu, M.C.; Zoulalian, A.; Bennamoun, L.; Kifani-Sahban, F.; Rogaume, Y. Numerical analysis and validation of a natural convection mix-mode solar dryer for drying red chilli under variable conditions. Renew. Energy 2020, 151, 659–673. [Google Scholar] [CrossRef]
  6. Wang, W.; Li, M.; Hassanien, R.H.E.; Wang, Y.; Yang, L. Thermal performance of indirect forced convection solar dryer and kinetics analysis of mango. Appl. Therm. Eng. 2018, 134, 310–321. [Google Scholar] [CrossRef]
  7. Simo-Tagne, M.; Tamkam Etala, H.D.; Tagne Tagne, A.; Ndukwu, M.C.; El Marouani, M. Energy, environmental and economic analyses of an indirect cocoa bean solar dryer: A comparison between natural and forced convections. Renew. Energy 2022, 187, 1154–1172. [Google Scholar] [CrossRef]
  8. Fudholi, A.; Othman, M.Y.; Ruslan, M.H.; Yahya, M.; Zaharim, A.; Sopian, K. Design and testing of solar dryer for drying kinetics of seaweed in Malaysia. In Proceedings of the 4th World Scientific and Engineering Academy and Society( WSEAS) International Conference on Energy and Development-Environment-Biomedicine, Corfu Island, Greece, 14–16 July 2011; pp. 119–124. [Google Scholar]
  9. Nnamchi, O.A.; Ndukwu, M.C.; Nnamchi, S.N. Modelling and simulation of multi-coupled heat and mass transfer processes: A case study of solar biomass dryer. Therm. Sci. Eng. Prog. 2021, 25, 101007. [Google Scholar] [CrossRef]
  10. Goud, M.; Reddy, M.V.V.; Chandramohan, V.P.; Suresh, S. A novel indirect solar dryer with inlet fans powered by solar PV panels: Drying kinetics of Capsicum Annum and Abelmoschus esculentus with dryer performance. Sol. Energy 2019, 194, 871–885. [Google Scholar] [CrossRef]
  11. Gupta, A.; Das, B.; Biswas, A. Performance analysis of stand-alone solar photovoltaic thermal dryer for drying of green chili in hot-humid weather conditions of North-East India. J. Food Process Eng. 2021, 44, e13701. [Google Scholar] [CrossRef]
  12. Lingayat, A.; Chandramohan, V.P.; Raju, V.R.K.; Kumar, A. Development of indirect type solar dryer and experiments for estimation of drying parameters of apple and watermelon: Indirect type solar dryer for drying apple and watermelon. Therm. Sci. Eng. Prog. 2020, 16, 100477. [Google Scholar] [CrossRef]
  13. Gupta, A.; Biswas, A.; Das, B.; Reddy, B.V. Development and testing of novel photovoltaic-thermal collector-based solar dryer for green tea drying application. Sol. Energy 2022, 231, 1072–1091. [Google Scholar] [CrossRef]
  14. Ndukwu, M.C.; Onyenwigwe, D.; Abam, F.I.; Eke, A.B.; Dirioha, C. Development of a low-cost wind-powered active solar dryer integrated with glycerol as thermal storage. Renew. Energy 2020, 154, 553–568. [Google Scholar] [CrossRef]
  15. Ndukwu, M.C.; Bennamoun, L.; Abam, F.I. Experience of Solar Drying in Africa: Presentation of Designs, Operations, and Models. Food Eng. Rev. 2018, 10, 211–244. [Google Scholar] [CrossRef]
  16. Youcef-Ali, S. Study and optimization of the thermal performances of the offset rectangular plate fin absorber plates, with various glazing. Renew. Energy 2005, 30, 271–280. [Google Scholar] [CrossRef]
  17. Yassien, H.N.S.; Alomar, O.R.; Salih, M.M.M. Performance analysis of triple-pass solar air heater system: Effects of adding a net of tubes below absorber surface. Sol. Energy 2020, 207, 813–824. [Google Scholar] [CrossRef]
  18. Ndukwu, M.C.; Simo-Tagne, M.; Bennamoun, L. Solar drying research of medicinal and aromatic plants: An African experience with assessment of the economic and environmental impact. Afr. J. Sci. Technol. Innov. Dev. 2021, 13, 247–260. [Google Scholar] [CrossRef]
  19. Ndukwu, M.C.; Bennamoun, L. Potential of integrating Na2SO4 10H2O pellets in solar drying system. Dry. Technol. 2018, 36, 1017–1030. [Google Scholar] [CrossRef]
  20. Dai, H.; Dai, H.; Zhu, H.; Zhang, B.; He, S.; Wang, Z. Combustion characteristics of a low calorific gas burner with ceramic foam enclosed by alumina pellets. Heat Mass Transf. 2022, 58, 221–231. [Google Scholar] [CrossRef]
  21. Jayalakshmy, M.S.; Philip, J. Thermophysical properties of plant leaves and their influence on the environment temperature. Int. J. Thermophys. 2010, 31, 2295–2304. [Google Scholar] [CrossRef]
  22. Blaine, R.L. In search of thermal effusivity reference materials. J. Therm. Anal. Calorim. 2018, 132, 1419–1422. [Google Scholar] [CrossRef]
  23. Ndukwu, M.C.; Dirioha, C.; Abam, F.I.; Ihediwa, V.E. Heat and mass transfer parameters in the drying of cocoyam slice. Case Stud. Therm. Eng. 2017, 9, 62–71. [Google Scholar] [CrossRef]
  24. Tunde-Akintunde, T.Y.; Ogunlakin, G.O. Influence of drying conditions on the effective moisture diffusivity and energy requirements during the drying of pretreated and untreated pumpkin. Energy Convers. Manag. 2011, 52, 1107–1113. [Google Scholar] [CrossRef]
  25. Argo, B.D.; Ubaidillah, U. Thin-layer drying of cassava chips in multipurpose convective tray dryer: Energy and exergy analyses. J. Mech. Sci. Technol. 2020, 34, 435–442. [Google Scholar] [CrossRef]
  26. Gupta, A.; Das, B.; Mondol, J.D. Experimental and theoretical performance analysis of a hybrid photovoltaic-thermal (PVT) solar air dryer for green chillies. Int. J. Ambient. Energy 2020, 43, 2423–2431. [Google Scholar] [CrossRef]
  27. Dhanushkodi, S.; Wilson, V.H.; Sudhakar, K. Thermal Performance evaluation of Indirect forced cabinet solar dryer for cashew drying. Am. J. Agric. Environ. Sci. 2014, 14, 1248–1254. [Google Scholar]
  28. Gupta, A.; Das, B.; Biswas, A.; Mondol, J.D. Sustainability and 4E analysis of novel solar photovoltaic-thermal solar dryer under forced and natural convection drying. Renew. Energy 2022, 188, 1008–1021. [Google Scholar] [CrossRef]
  29. Hawa, L.C.; Ubaidillah, U.; Mardiyani, S.A.; Laily, A.N.; Yosika, N.I.W.; Afifah, F.N. Drying kinetics of cabya (Piper retrofractum Vahl) fruit as affected by hot water blanching under indirect forced convection solar dryer. Sol. Energy 2021, 214, 588–598. [Google Scholar] [CrossRef]
  30. Darvishi, H.; Khoshtaghaza, M.H.; Minaei, S. Fluidized bed drying characteristics of soybeans. J. Agric. Sci. Technol. 2014, 16, 1017–1031. [Google Scholar]
  31. Herez, A.; Khaled, M.; Murr, R.; Haddad, A.; Elhage, H.; Ramadan, M. Using Geothermal Energy for cooling—Parametric study. Energy Procedia 2017, 119, 783–791. [Google Scholar] [CrossRef]
  32. GPP. Nigeria Electricity Prices. Global Petrol Prices. 2021, pp. 1–5. Available online: www.globalpetrolprices.com/Nigeria/electricity_prices/ (accessed on 15 May 2022).
  33. Kirian, D.R. Principles of Economics and Management for Manufacturing Engineering; Elsevier Inc.: Amsterdam, The Netherlands, 2022. [Google Scholar] [CrossRef]
  34. Ndukwu, M.C.; Manuwa, S.I. A techno-economic assessment for viability of some waste as cooling pads in evaporative cooling system. Int. J. Agric. Biol. Eng. 2015, 8, 151–158. [Google Scholar] [CrossRef]
  35. Bennamoun, L.; Belhamri, A. Design and simulation of a solar dryer for agriculture products. J. Food Eng. 2003, 59, 259–266. [Google Scholar] [CrossRef]
  36. Ndukwu, M.C.; Bennamoun, L.; Abam, F.I.; Eke, A.B.; Ukoha, D. Energy and exergy analysis of a solar dryer integrated with sodium sulfate decahydrate and sodium chloride as thermal storage medium. Renew. Energy 2017, 113, 1182–1192. [Google Scholar] [CrossRef]
  37. Sagar, V.R.; Suresh Kumar, P. Recent advances in drying and dehydration of fruits and vegetables: A review. J. Food Sci. Technol. 2010, 47, 15–26. [Google Scholar] [CrossRef] [PubMed] [Green Version]
  38. Doymaz, I. Evaluation of some thin-layer drying models of persimmon slices (Diospyros kaki L.). Energy Convers. Manag. 2012, 56, 199–205. [Google Scholar] [CrossRef]
  39. Raigar, R.K.; Mishra, H.N. Effects of Temperature on Thermo-Physical Properties of Roasted Peanut Paste (Arachis hypogaea L.) Blended with Soybean Oil. J. Food Qual. 2016, 39, 323–330. [Google Scholar] [CrossRef] [Green Version]
  40. Oladunjoye, M.; Sanuade, O. Thermal Diffusivity, Thermal Effusivity and Specific Heat of Soils in Olorunsogo Powerplant, Southwestern Nigeria. Int. J. Res. Rev. Appl. Sci. 2012, 13, 502–521. [Google Scholar]
  41. Dimitrios, A.T.; Vouros, A.P.; Bardakas, A.V.; Filios, A.E.; Margaris, D.P. Case studies on the effect of the air drying conditions on the convective drying of quinces. Case Stud. Therm. Eng. 2014, 3, 79–85. [Google Scholar]
  42. Oyedepo, S.O. Towards achieving energy for sustainable development in Nigeria. Renew. Sustain. Energy Rev. 2014, 34, 255–272. [Google Scholar] [CrossRef] [Green Version]
  43. Oseni, M.O. Improving households’ access to electricity and energy consumption pattern in Nigeria: Renewable energy alternative. Renew. Sustain. Energy Rev. 2012, 16, 3967–3974. [Google Scholar] [CrossRef]
  44. Chavan, A.; Thorat, B. Techno-economic comparison of selected solar dryers: A case study. Dry. Technol. 2021, 1–11. [Google Scholar] [CrossRef]
Figure 1. (A) Schematics of the partitioned single passage solar dryer indicating the wind generator (B) The picture of the solar dryer (C) Air flow direction.
Energies 15 04457 g001
Figure 2. Variation in the environmental condition of the solar dryer.
Energies 15 04457 g002
Figure 3. Variation in dryer air velocity.
Energies 15 04457 g003
Figure 4. Temperature and Relative humidity of the solar dryer.
Energies 15 04457 g004
Figure 5. Experimental and predicted drying curve of the cocoyam chips.
Energies 15 04457 g005
Figure 6. The drying rate of the Cocoyam slice.
Energies 15 04457 g006
Figure 7. Variation in specific heat and thermal effusivity of the cocoyam.
Energies 15 04457 g007
Figure 8. Variation in thermal conductivity and thermal diffusivity of the cocoyam.
Energies 15 04457 g008
Figure 9. Determined Reynolds number during the drying process.
Energies 15 04457 g009
Figure 10. Variation in mass transfer and diffusion coefficient.
Energies 15 04457 g010
Figure 11. Variation in heat transfer coefficient.
Energies 15 04457 g011
Figure 12. Amount of money saved per year and payback period for different usage rates.
Energies 15 04457 g012
Table 1. Material specification.
UnitsSpecificationsSource
Solar collectorHard wood (2 × 2 inch), tilted 15 °N, 0.6 m × 0.6 m × 0. 59 mCustom design
AbsorberBlack painted aluminum sheet, 0.6 × 0.6 m × 0.001 mCustom design
GlazingTransparent glass, 0.57 m × 0.6 m, 0.004 mPerspex
Drying ChamberPlywood (lined with black painted aluminum inside), 0.6 × 0.6 × 1 m, 45° tapering at 0.3 m height at 0.7 m from the baseCustom design
Drying traysHardwood (2 × 2 inches) skeleton, plastic wire mesh, 0.57 m × 0.57 m, 4 trays at 0.15 m gapCustom design
ChimneyHollow galvanized steel, pipe; ϕ 0.12 m and 0.3 m highCustom design
Wind generator and fanϕ 0.05 m hollow pipe, 0.15 m−0.10 m, 3 curved aluminum arms, 0.156 m axial fan blade, frictionless bearingsCustom design
Table 2. Costs of materials for the solar dryers.
S/NMaterialsSpecificationQuantityCost (Energies 15 04457 i001)
1Planks2 inches × 2 inches8 pieces2700
2Glass4mm thick (57 cm × 60 cm)1sheets2250
3Screw2 inches1 pack900
4Board4 feet × 8 feet28000
5Nail3inches and 1 inch1.5 pounds weight1200
6Door hingeMedium size2 pieces400
7PaintBlack oil paint4 litters4500
8Painting brushBig size1 piece350
9Aluminum sheet3.5 inches × 8 inches, black1 sheet4000
10Top bond gumMedium size1 can1000
11BatonFlat size2 pieces300
12NetGreen colour1.5 yards1050
13Suction fan bladeSteel type1 piece350
14Steel pipeCylindrical, 4 mm thick1 piece, 35 cm long800
15Bearing6mm diameter ring2 pieces500
Variable Cost
16Labour18,000
17Transportation3000
18Miscellaneous2000
19Total Cost50,950 ($122.714 as of 3 May 2022)
Table 3. A typical Umudike Monthly Meteorological data in 2012 (Lat.05°29′, Long.07°33′, Alt.122 m) [5].
MonthsRainfall (mm)Temperature (°C)Evaporation
(mm)
Relative Humidity (%)Sunshine (h)
amountdaymaxmin-------------------
Jan0.0032230.2272456.4
Feb88.2735220.4673506.3
Mar57.0335230.5077533.9
April142.01733240.8276596.1
May233.71632244.7084705.0
Jun213.01431239.2587773.2
July362.024302310.5586753.4
Aug161.81930246.1088782.2
Sept349.02530248.8059752.9
Oct244.61631244.8086782.9
Nov58.5633250.3197704.1
Dec0.0032210.2075494.9
Table 4. Specifications and sensitivities of measuring instruments.
InstrumentsSpecificationsSensitivity
TemperatureThermocouple (TM-902C, −50 °C to 750 °C), type K thermocouple-China)±0.1 °C
Solar RadiationPynarometer (Lutron SPM-1116SD) ± 0.1   W / m 2
Air VelocityAnemometer (CR2032, 3 Volts Lithium Cell)±0.1 m/s
Relative HumidityHumidity/Baro/Tempt Data recorder (Lutron MHB-382-Taiwan)±0.1
MassElectronic Weighing Scale (KERRO SF-400-China)1000 g × 1 g; 353 oz × 0.1 oz
Table 5. Drying kinetic models.
Model NameModelReference
Lewis M R = exp ( k t ) [29]
Henderson and Pabis’s   MR = ae kt [29]
Logarithmic model   MR = ae kt + c [29]
Wang and Singh MR   = 1 + at + bt 2 [29]
Two term M R = a exp ( k o t ) + bexp ( k 1 t ) [29]
Vermer et al. M R = a exp ( k t ) + ( 1 a ) exp ( gt ) [29]
Two Term Exponential M R = a exp ( k t ) + ( 1 a ) exp ( kat ) [29]
Table 6. Summary of the drying performance of the two developed solar dryers.
ParametersUniteValues
Average solar collector temperature (°C)34.1
Average solar drying chamber temperature(°C)33.1
Average relative humidity of the solar collector(%)66.9
Average relative humidity of the drying chamber(%)67.4
Average solar radiation(W/m2)303.27
Average ambient temperature(°C)31.10
Average flow rate(kg/s)0.12
Initial moisture content on a wet basis (%)82.9
Final moisture content on a wet basis (%)10.32
Final mass(g)138
Average drying rate(kg/kg h)0.018686
Energy consumed(MJ)3.970 (1.103 kWh)
Solar collector efficiency(%)13.47
Overall solar drying efficiency(%)7.59
Drying time(h)25
CO2 mitigated per yeartons317.11
Table 7. Model constants and statistical parameters for solar drying the cocoa yam slice.
ModelConstantsR2RMSEχ2
Lewisk = 0.031570.95690.03470.001165
Two Terma = 0.16656
ko = 0.22505
b = 0.8701
k1 = 0.02673
0.96660.029230.00145
Two term exponentiala = 0.17564
k = 0.14164
0.966480.031790.00145
Henderson and Pabisa = 0.98466
k = 0.03351
0.958370.037720.00171
Logarithmica = 11.11849
k = 0.00376
c= −10.0901
0.961720.07450.00191
Wang and Singha = −0.036
b = 0.000556
0.958210.037840.00172
Modified pagek = 0.03202
n = 0.88042
0.964270.033410.00152
Vermer et al.a =1150.18
k = 0.03668
g = 0.03668
0.954210.038910.00185
Table 8. Average values of thermal properties.
Thermal PropertyAverage ValueStandard Deviation
Specific heat capacity (J/kg K)1866.154249.4573
Thermal conductivity (W/m K)0.0900490.011914
Thermal diffusivity (m/s)3.93965 × 10−55.62695 × 10−8
Effective moisture diffusivity (m/s)3.21462 × 10−10-
Thermal effusivity (S1/2 m−2 K−1)35.305987.690472
Heat transfer coefficient (W/m K)3.850.67931
Mass transfer coefficient (m/s)0.017570.034469
Diffusivity coefficient(m2/s)0.0001790.000306
Table 9. Regression Equations for Thermal properties.
EquationsRegression CoefficientsR2Standard Error
C p = Υ + ω r M / M o + ϑ M M o Υ = 10260.990.0004041
ω = 1.2696
r = 1256
ϑ   = 0.9334
K = ( ϵ + χ M M o + ω ( M M o ) 2 ) 1 ϵ = 17.884 0.990.0000608731
χ = −12.883
ω = 4.0961
ϱ = φ α + τ ( M M o ) γ α + ( M M o ) γ φ = 7.9336 0.990.000003156964
α = 6.2569 × 10 5
τ = 6.0135 × 10 6
γ = 0.1
φ = ϖ + β l n ( M M o ) ϖ = 0.000039327 0.980.00000000830198
β = 0.000001563
Publisher’s Note: MDPI stays neutral with regard to jurisdictional claims in published maps and institutional affiliations.

