Abstract
The spark ignition (SI)-controlled auto-ignition (CAI) hybrid combustion is characterized by early flame propagation combustion and subsequent auto-ignition combustion. The application of combined SI–CAI hybrid combustion can be used to effectively extend the operating range of CAI combustion and achieve smooth transitions between SI and CAI combustion modes. However, SI–CAI hybrid combustion can produce significant cycle-to-cycle variations (CCV). In order to better understand the sources of CCV and minimize its occurrence, the large eddy simulation (LES) and Reynolds-averaged Navier–Stokes (RANS) approaches were employed in this study to model and understand the cyclic phenomenon of SI–CAI hybrid combustion. Both the multi-cycle LES and RANS simulations were analyzed against the experimental measurements in a single cylinder engine at 1500 rpm and a 5.43 bar average indicated the mean effective pressure (IMEP). The detailed analysis of the in-cylinder pressure traces, IMEP, in-cylinder peak pressure (PP), peak pressure rise rate (PPRR) and the crank angles with fuel mass burned fraction at 10%, 50%, 90% and mode transition was performed. The results indicate that overall, the adopted LES simulations could effectively predict the cyclic variations in the hybrid combustion observed in the experiments, while the RANS simulations failed to reproduce the cyclic characteristics at the chosen engine operating conditions. Based on the LES results, the correlation and visualization studies indicate that the cyclic variations in the local velocity around the spark plug lead to the variations in the early flame propagation, which in turn produce temperature fluctuations among the cycles and result in greater variations in the subsequent auto-ignition combustion events.
1. Introduction
The spark ignition (SI) can be introduced to a gasoline engine that operates with compression ignition combustion operation, which is referred to as controlled auto-ignition (CAI), homogeneous charge compression ignition (HCCI) or gasoline compression ignition (GCI), to assist the control of auto-ignition [1,2]. This SI–CAI hybrid combustion, or spark assisted compression ignition (SACI), has higher thermal efficiency and lower NOx emissions compared to conventional SI combustion. Compared to CAI combustion, the SI-CAI hybrid combustion has a lower heat release rate and broader load range. In addition, this combustion concept enables smooth transitions between SI and CAI mode [3,4,5]. Therefore, in recent years, significant work has been carried out on SI–CAI hybrid combustion. Zhou et al. [6] applied Miller cycle strategies to adjust the ratio of fuel consumed by early spark ignition flame propagation and subsequent auto-ignition combustion. They found that the Miller cycle is an effective approach to optimize the SACI combustion process while maintaining high efficiency. In addition, they also found that the split injection strategy can be used to moderate engine knocking and optimize the SACI combustion process. In order to optimize engine performances at cold idle conditions, Zhao et al. [7] numerically investigated the influence of the spark plug orientation and spark ignition timing on the SACI combustion process during cold idle operation and found that the mixture formation and the velocity field in the spark plug gap regions can be very different with different spark plug orientations, therefore affecting the combustion process. Ortiz-Soto et al. [8] presented a reduced-order, physics-based model to capture the advanced multi-mode combustion processes including SI, HCCI and SACI. The developed model can well predict the heat release characteristics related to flame propagation and auto-ignition in SACI. Robertson and Prucka [9] developed a control-oriented data-driven model based on the artificial neural network (ANN) and found this model can accurately capture the nonlinear nature of flame propagation of SACI combustion with less computational expense. In particular, Mazda has applied SI–CAI hybrid combustion in the name of spark controlled compression ignition (SPCCI) in the Skyactiv-X engine, as the world’s first mass produced gasoline compression ignition engine [10,11].
However, the SI–CAI hybrid combustion process includes two distinct combustion modes and has complex interactions between early flame propagation and subsequent auto-ignition combustion. Significant cycle-to-cycle variations in the hybrid combustion were observed in gasoline engines with compression ignition combustion [12,13,14,15,16,17]. Recently, Hunicz [18] found that the application of spark assistance eliminated late combustion cycles and improved the overall cycle-by-cycle stability compared to the pure CAI combustion. However, it was also noted that the spark assistance did not change the observed long-period oscillation patterns in engine indicated mean effective pressure (IMEP). Hunicz et al. [19] further investigated the stability of the SACI under nearly stoichiometric and heavy EGR conditions and discovered a stabilizing effect of spark advance on the kinetic phase and a destabilization effect by variations in the spark-induced flame. They found that the flame propagation fractions between 3% and 4% support minimum variations in SACI combustion. Triantopoulos et al. [20] experimentally investigated cyclic variability in stoichiometric SACI combustion. They found the variability in combustion phasing was driven by the variability in autoignition timing, while high variability in CA50 led to unstable engine work output, due to late combustion process with very poor or no end-gas autoignition. They found that the variability in combustion phasing was mainly driven by flame propagation combustion and particularly the initial flame development, and less affected by the autoignition process.
The above works showed that large CCV can be present in SI–CAI hybrid combustion, thanks to several potential causes, including thermal oscillations [21], nonlinear exhaust gas recirculation (EGR) feedback [16,17], recycled thermal and chemical energy [15] and the fluctuations of EGR level, average in-cylinder temperature, temperature distributions and intake pressure [14]. Computational fluid dynamics (CFD) simulations have been applied to understand the SI–CAI hybrid combustion process and the causes of its CCV. Joelsson et al. [22] applied large eddy simulations (LES) to investigate the SACI combustion. They found that the first stage flame propagation is mainly affected by turbulence, whereas the second stage HCCI combustion is governed by the initial temperature. Two-dimensional direct numerical simulations (DNS) were performed by Yoo et al. [23]. They found that the SACI combustion process is significantly enhanced by high flow turbulence. Previous work by the authors [24,25,26,27] studied the influence of in-cylinder temperature stratification, in-cylinder flow motions and fuel distributions on the SI–CAI hybrid combustion process. The results reveal that the hybrid combustion is significantly influenced by local turbulence kinetic energy [24], velocity magnitude [24,28], average temperature [24,27], temperature inhomogeneity [24] and fuel/air equivalence ratio [25] in the vicinity of the spark plug.
Although the above studies have identified many causes that could lead to the CCV of the hybrid combustion process by the observations of the experimental results and chemical kinetic modeling studies, there is no consensus on the dominant factors leading to the high CCV of SI–CAI hybrid combustion. The single-cycle CFD simulations used in such studies were able to identify some key factors that would affect the steady state hybrid combustion, but not the cyclic variation involved. In order to identify the origins of CCV of the hybrid combustion, a preliminary modelling study using large eddy simulations (LES) was performed for 15 cycles and it was found the LES could reflect the cyclic variations in SI–CAI hybrid combustion with limited simulation cycles [28]. In this study, the multi-cycle RANS (12 cycles) and LES (32 cycles) simulations were performed to model the SI-CAI hybrid combustion with large CCV. The detailed analysis and comparisons were carried out by the LES and RANS simulations on the in-cylinder pressure traces, IMEP, peak pressure (PP), peak pressure rise rate (PPRR) and the crank angles with fuel mass fraction burned at 10%, 50%, 90% and mode transition (CA10, CA50, CA90 and CAT). Based on the LES results, the correlation study was performed to unveil the key factors leading to the strong cyclic combustion characteristics of the SI–CAI hybrid combustion process. To the authors’ knowledge, it is the first time that such a study has been carried out to investigate the CCV of SI–CAI hybrid combustion with combined multi-cycle RANS and LES engine simulations.
2. Methodology
2.1. Engine Experiments
The experiment data were obtained on a single cylinder gasoline engine with dual independent variable valve lifts and timing devices on the intake and exhaust camshafts [21,28]. The engine specification is given in Table 1. In order to achieve SI–CAI hybrid combustion with an acceptable peak pressure rise rate, both external and internal EGR were applied in this study. The negative valve overlapping (NVO) was used to enable internal EGR. A piezo electric transducer (Kistler 6125A) via a charge amplifier (Kistler 5018) was used to measure the in-cylinder pressure. An engine operating point at 1500 rpm and 5.43 bar IMEP (in average of 100 cycles) was adopted to study the cycle-to-cycle variations in SI–CAI hybrid combustion, as this operating point is within the transitioning zone between pure CAI and SI modes with a relatively high coefficient of variation (COV) of IMEP at 11.81%. The valve parameters, including the intake/exhaust valve opening timings (IVO/EVO), closing timings (IVC/EVC) and lifts (IL/EL), and other operating conditions are listed in Table 2. The residual gas fraction (RGF) after the intake valve closing (IVC) was calculated to be 25%. The crank angles used in this paper refer to the top dead center (TDC) of the combustion stroke.

Table 1.
Engine specifications.
Table 2.
Engine operating conditions.
2.2. RANS Modelling
The simulations were performed in commercial STAR-CD software. In RANS simulations, the flow and turbulence were modeled with RNG k-ε model [29]. The turbulent mixing effects and chemical kinetics in the SI-CAI hybrid combustion were predicted with a set of premixed flame propagation and auto-ignition models. The three-zones extended coherent flame model (ECFM3Z) [30] was used as the framework of the combustion model as it considers both premixed and diffusion flame propagation as well as auto-ignition combustion.
As detailed in [30], there are three zones (a pure fuel zone, a pure air and residual gas zone and a mixed zone) in ECFM3Z. The mixed zone, where the combustion happens, is determined by the turbulent and molecular mixing between gases in the other two zones. The flame surface density equation is adopted in order to describe the flame propagation process and predict its reaction rate. In order to describe the reaction intensity of flame propagation combustion, average flame surface density is used in this study and defined as the local area of flame surface per unit of volume (m−1). The auto-ignition of the mixture is predicted with tabulated chemistry approach [31]. The tabulated database of the auto-ignition delay time was constructed by performing chemical kinetic calculations under different thermodynamic and dilution conditions (pressure: 1–60 bar, temperature: 480–1520 K, equivalence ratio: 0.2–3 and residual gas fraction: 0–90%) with a reduced gasoline surrogate mechanism [32]. The coupled CFD simulations with tabulated database can significantly reduce the central processing unit (CPU) time requirement compared with the CFD simulations coupled with the chemical kinetic mechanism. By using the tabulated chemistry approach, the auto-ignition tendency is defined to describe the close degree of mixture from auto-ignition in each cell, and it ranges from 0 (no tendency to auto-ignition) to 1 (occurrence of auto-ignition). The reaction rate of the auto-ignition combustion can then be determined by the combustion characteristic time once auto-ignition occurs.
The calculation of average flame surface density and the auto-ignition tendency determine the reaction regime in each cell. When the average flame surface density is greater than 0 in a cell, the available fuel/air mixture will be consumed by the flame propagation combustion by following the flame surface density equation. By contrast, when the auto-ignition tendency in a cell achieves 1, the available fuel/air mixture will be consumed by auto-ignition combustion by following the tabulated chemistry approach. The reaction rates of the flame propagation and auto-ignition also determine the species concentrations during the combustion. The application of these models enables the prediction of the SI–CAI hybrid combustion. The details of the RANS modelling of SI–CAI hybrid combustion can be found in a previous work [28].
In this work, the spark ignition model was upgraded with the consideration of the development of spark kernel [33]. The time delay between the spark and the appearance of the flame surface is modelled by using an indicator function I that starts from 0 and eventually reaches 1.
where is the ratio between the current gas density and the air density at 1 bar and 300 K. is given by = δl/Ul, where δl is laminar flame thickness and Ul is laminar flame speed. A1igni, A2igni are the tuning parameters with default values of 1.0 and 3.0, respectively. A spherical flame surface with radius Rk is formed once I reaches 1.
where Tb is the burnt gas temperature and Tu unburnt gas temperature. Factker and Rklimit are the tuning parameters. Then, the flame surface Σinit is distributed in the computational domain with a Gaussian distribution with a mean at Xμ = Rk and a standard deviation of Xσ = 1 × 10⁻⁴ + u’(t − tspark). The distribution is also constrained by the following equation:
where V is the total volume.
2.3. LES Modelling
The sub-grid k model [33,34] was used to model the flows and turbulence in the LES simulations. The model has been successfully applied in LES modelling of flow [35], spray [36] and combustion [37] in combustion engines. As recommended by Speziale [34], a transport equation is solved for the sub-grid scale (SGS) kinetic energy to derive an appropriate turbulence velocity scale, which is as follows:
where the model constants C1 and C2 are derived from turbulence theory and are set equal to 1 and 0.05, respectively. is sub-grid scale stress, the rate of strain tensor, kSGS the SGS turbulent kinetic energy. Δ is the grid filter size and is defined as Vcell1/3.
The LES version of the three-zones extended coherent flame model (ECFM3Z) [37,38] was applied for the LES modelling of SI–CAI hybrid combustion, with the same modelling concept adopted for the RANS simulations of the SI–CAI hybrid, combustion as detailed in previous section. In the LES version of the ECFM-3Z model, a new equation for modelling the SGS flame surface density Σ (Σ = σ) is considered as the following [38]:
where σc is a constant with a typical value of 1, D is the molecular diffusivity, vsgs is the SGS viscosity, is the turbulent Prandtl number, is the propagation speed relative to the mean flow field of the iso-c surface, u is the Favre filtered velocity vector, n is normal to the iso-surface of the filtered progress variable , Sl is the theoretical laminar flame speed, is the laminar flame thickness; Γ is the ITNFS (net flame stretch) function [39]. β and are model constants equal to 4/3 and 0.5, respectively. Σlam is the laminar part of flame surface density.
As mentioned earlier, the equations for the filtered species, tracers and unmixed species remain unchanged with respect to their RANS counterparts, except that the turbulence timescale k/ε is now the SGS turbulence timescale and not the integral (RANS) value.
In addition, a standard LES spark ignition model [33,38] was applied. The first step is to calculate the flame kernel radius via the same standard ignition model used in RANS formulations. This is usually of mm order of magnitude and can be used in LES as a first approximation. The second step is the calculation of a suitable profile for the burnt gases. The ignition profile is given by
where c0 is a constant. F is a model parameter that can be used to shape the ignition profile. Higher values of will result in stronger ignition. Δ is the average combustion filter length.
The distribution of the flame surface density is calculated as
Therefore, the following condition is satisfied.
When any point in the domain reaches , the control is transferred to the transport equation and normal flame propagation begins. The St is the total flame area wrinkled by the turbulence [38,40].
2.4. Simulation Conditions
Table 3 shows initial and boundary conditions in the simulations. The inconsistency of the wall temperature was considered, and the temperatures of the cylinder liner and the piston were assessed with the cylinder head temperature and coolant temperature [19]. The intake mixture at the inlet boundary was set as the homogeneous fuel/air mixture at stoichiometric equivalence ratio and the exhaust gas to ensure the same external EGR rate with experiments. The CFD simulations start from 400 °CA after TDC (just before the intake valve opening (IVO) timing) and continue for the 32 consecutive cycles for LES simulations and 12 cycles for RANS simulations. In order to exclude the impact of the initial conditions, the first two cycles of LES and RANS simulations were excluded for analysis. Therefore, only 30 cycles LES and 10 cycles RANS simulations were analyzed in detail.
Table 3.
Simulation conditions.
2.5. Engine Mesh and Numerical Methods
The engine moving mesh, as shown in Figure 1, was generated by ES-ICE software. There are around 870,000 grids with average grid size of 0.96 mm at the bottom dead center and 550,000 grids with average grid size of 0.79 mm at TDC, respectively. The mesh around the spark plug was refined with a grid size of 0.6 mm on average to accurately predict spark kernel formation and early flame propagation process.
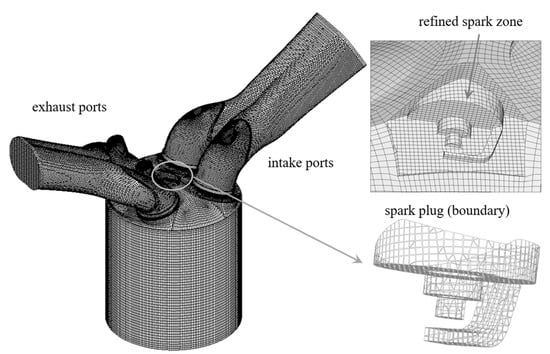
Figure 1.
Engine mesh.
The pressure-implicit with splitting of operators (PISO) algorithm was adopted to solve the equations. The monotone advection and reconstruction scheme (MARS) was used to discretize equations of momentum, turbulence kinetic energy and turbulence dissipation. The temperature and density equations were discretized with upwind differencing scheme (UD) and central differencing scheme (CD), respectively. The angular time-step in the simulations was fixed at 0.1 °CA for RANS simulations and 0.05 °CA for LES simulations.
The turbulence resolution parameter (M) proposed by Pope [41] was evaluated at different crank angles to assess the applicability of the LES results. M is defined as the ratio of the sub-grid scale (SGS) kinetic energy to the total kinetic energy. M of 0 denotes a direct numerical simulation (DNS) simulation where all the turbulence scales are resolved, while the M of 1 denotes a RANS simulation where no turbulence scales are resolved and all are modelled. It is recommended that M should be less than 0.2 for an adaptive LES simulation [41]. In this study, M is significantly lower than 0.2 in the LES simulations [28]. The spark plug region shows a relatively higher turbulence resolution parameter M, in particular at the near wall region of the ground electrode with M at 0.14, due to complex geometric features. The majority of the region around the spark plug gap has a turbulence resolution parameter well below 0.08.
3. Results and Discussions
3.1. Validations of RANS and LES Results with Experimental Measurements
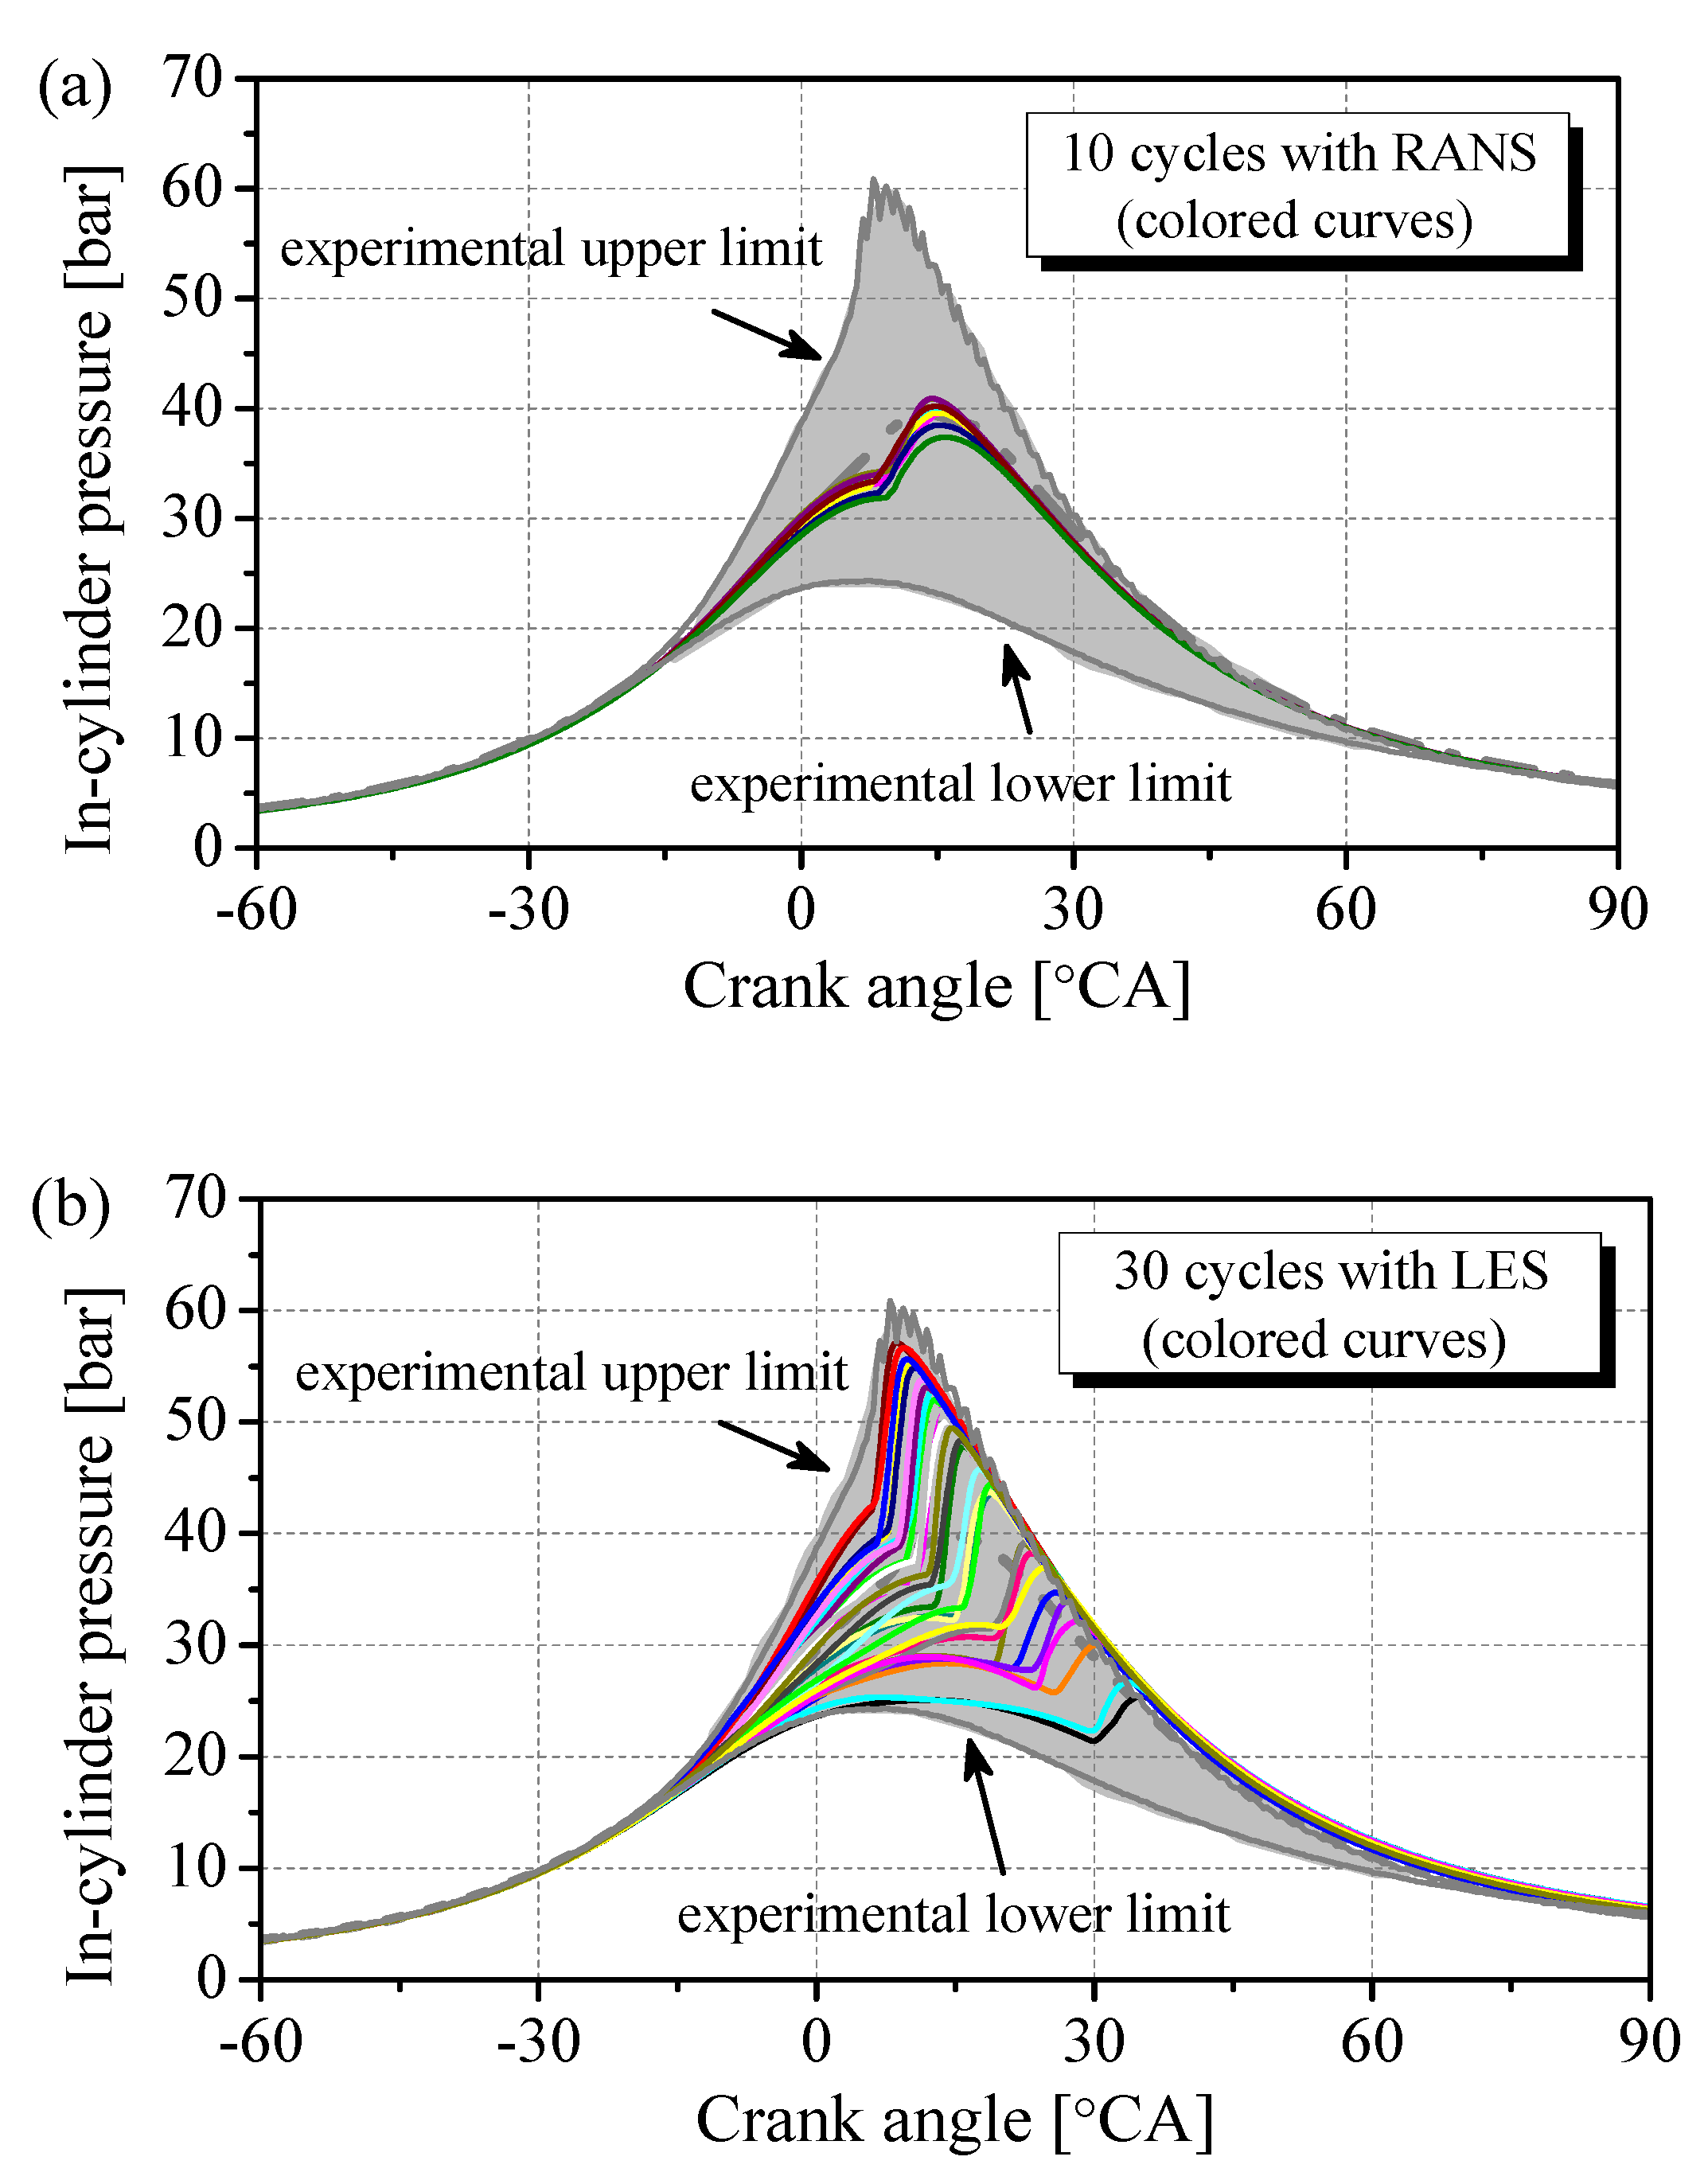
Figure 2 shows the in-cylinder pressure profiles from the experiments, RANS and LES simulations. The grey envelop highlights the large variations in the experimental results (100 cycles). The dark grey dash curve shows the averaged pressure of the experimental results. As shown in Figure 2a, the RANS simulation results show little variations in the pressure traces and could not predict the strong CCV of the in-cylinder pressures represented by the large grey envelop. In comparison, the LES results in Figure 2b can reproduce the strong cycle-to-cycle variations in the in-cylinder pressure trace very well, although there are some differences in the predicted and experimental lower limit (almost misfire).
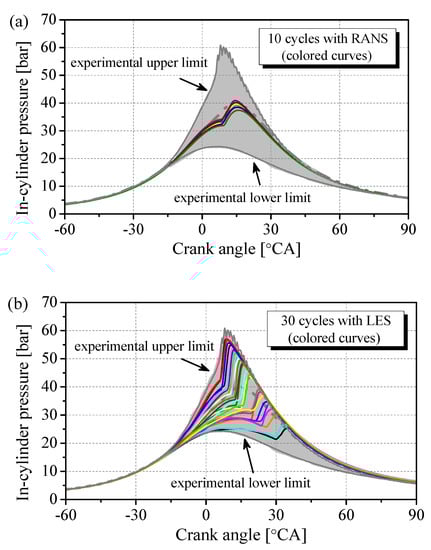
Figure 2.
In-cylinder pressure traces from (a) 10 cycles RANS simulations and (b) 30 cycles LES simulations against experimental measurements (grey envelop).
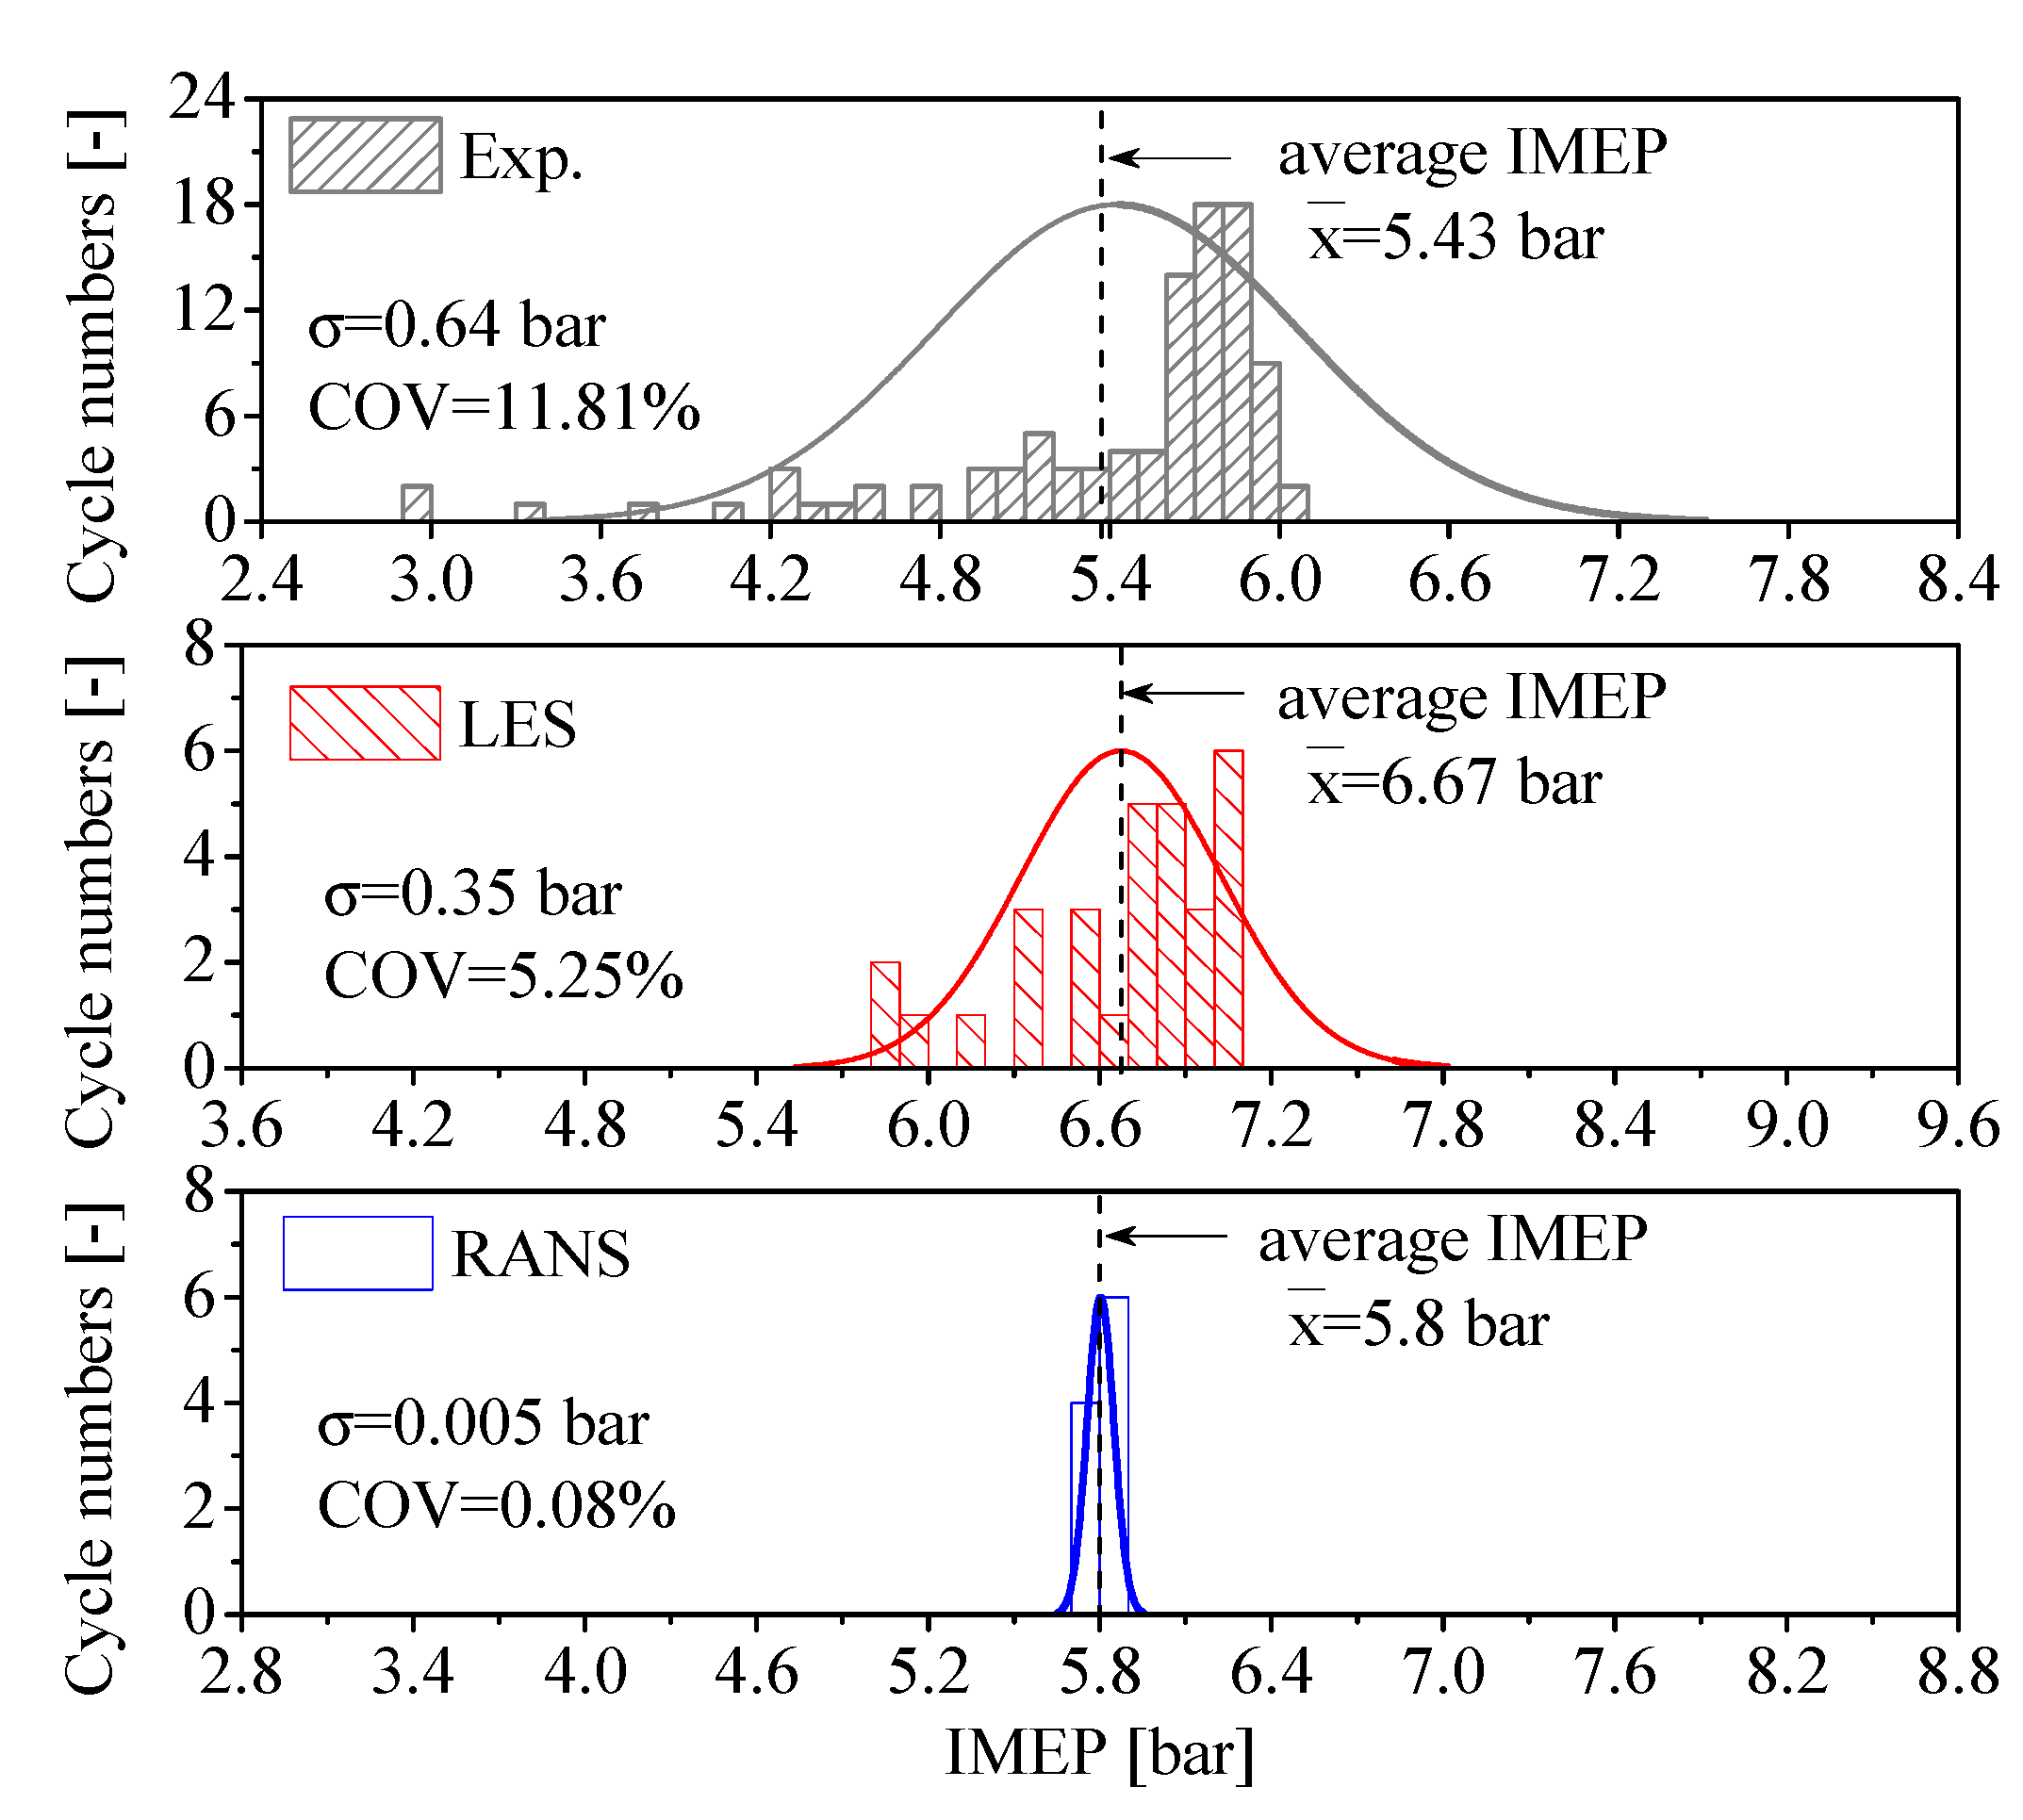
In order to quantitatively compare the experimental and simulation results, Figure 3 shows the IMEP histograms of the consecutive cycles from experiments (100 cycles), LES simulations (30 cycles) and RANS simulations (10 cycles). The corresponding average value x, standard deviation σ and COV of IMEP are also included in Figure 3. Overall, the distribution pattern of the IMEP among the cycles is similar between the experiments and LES simulations and shows strong CCV of IMEP. Both experiments and LES simulations have more cycles with higher IMEP values at the right part of the distribution. However, it is noted that the current LES modelling could not predict the weak cycles with significantly lower IMPE values spreading over a wider region in the left part of the distribution. Overall, the predicted average IMEP of 6.67 bar by LES is higher than the measured average IMEP of 5.43 bar. In addition, the COV in IMEP is also under-predicted at 5.25% by LES simulations, compared to the measured value of 11.81%. In comparison, the average IMEP is well predicted by the RANS simulations at 5.8 bar, compared to the experimental result at 5.43 bar. However, the RANS simulations produced negligible COV in IMEP at 0.08%, and failed to reproduce the cyclic variations, as observed in the experiments and LES.
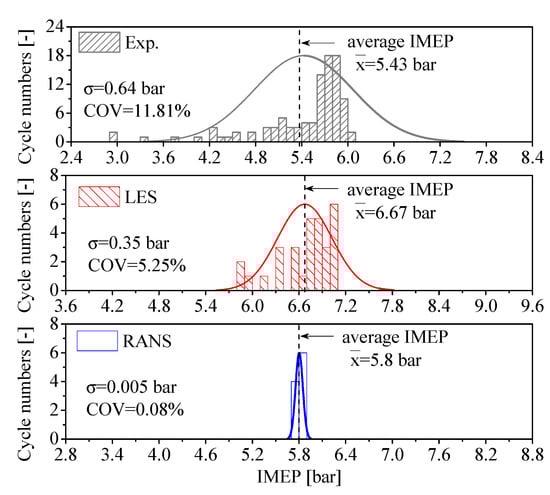
Figure 3.
Comparison of the IMEP histograms of the consecutive cycles from experiments, LES and RANS simulations.
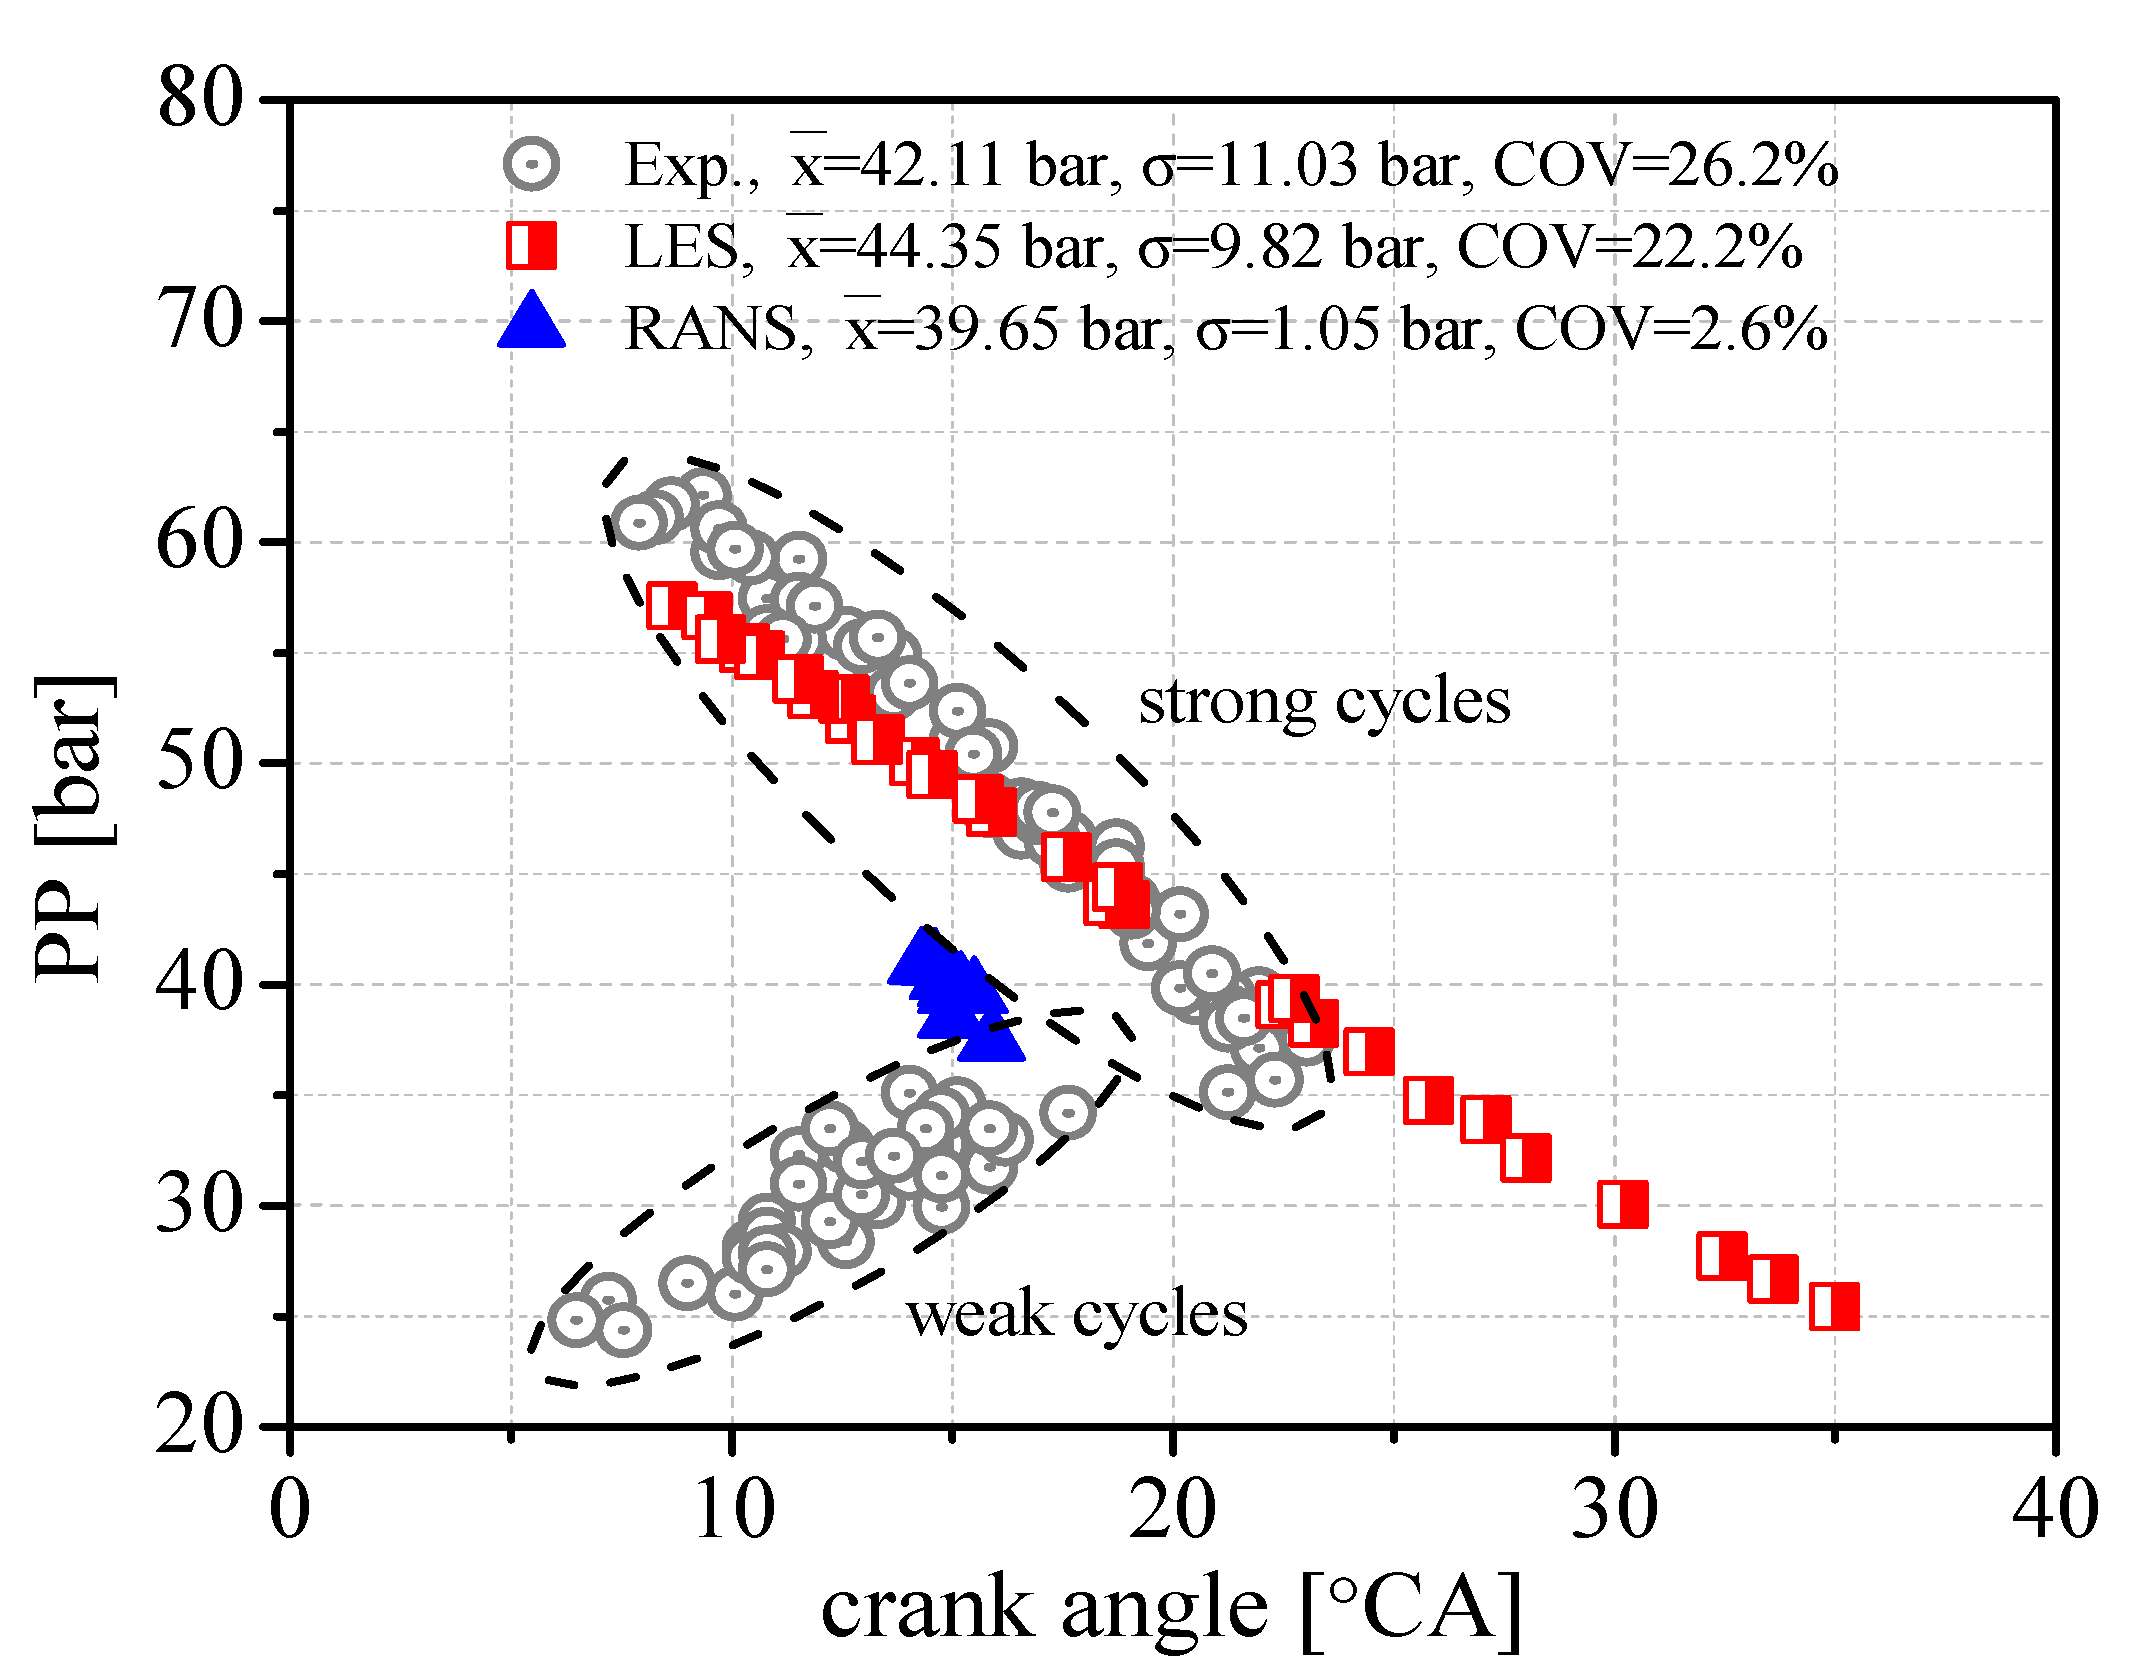
In order to further evaluate the performance of the LES and RANS simulations, Figure 4 and Figure 5 compare the in-cylinder peak pressure (PP) and the peak pressure rise rate (PPRR) with the corresponding crank angles, respectively. Similarly, the average value x, standard deviation σ and COV are also included in these figures. Figure 4 reveals the nonlinear relationship between PP and the corresponding crank angle of the experimental results and the presence of two distinct combustion types, i.e., weak combustion at the bottom-left and strong combustion at the upper-right. According to the heat release analysis of the experimental data [42], the weak combustion cycles are dominated by the slow flame propagation with less/no subsequent auto-ignition combustion, leading to increased PP, as well as more complete combustion with the crank angle. In comparison, the strong combustion cycles are dominated by auto-ignition heat release, and the peak pressure is produced by the auto-ignition combustion. Therefore, the peak pressure is reduced with the auto-ignition event moving towards to the expansion stroke. This phenomenon was also observed in typical spark ignition engines [43]. Although the LES simulations show promising agreement of the average PP (44.35 bar) and the corresponding COV (22.2%) with experimental observations (42.11 bar and 26.2%, respectively), the detailed comparison of the scatter distribution with the experiments indicates the great challenge of modelling the nonlinear phenomenon of cyclic hybrid combustion. As shown in the figure, the LES simulations could predict PP and the corresponding crank angle very well for the strong cycles. However, the weak combustion cycles were not captured with the current LES models. The reasons could be the overestimation of the flame propagation speed and auto-ignition combustion speed at extreme conditions near the experimental lower limit, as shown in Figure 2.
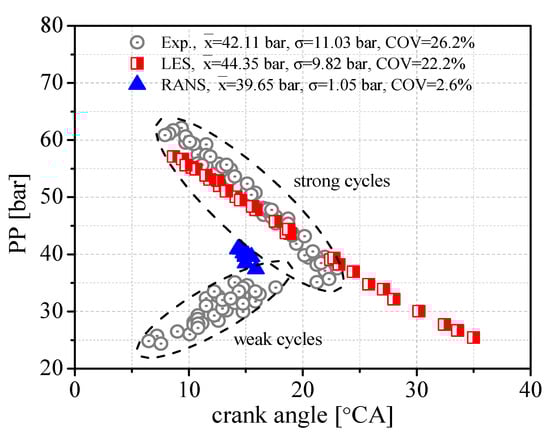
Figure 4.
The scatter plot of the in-cylinder peak pressure (PP) and the corresponding crank angles.

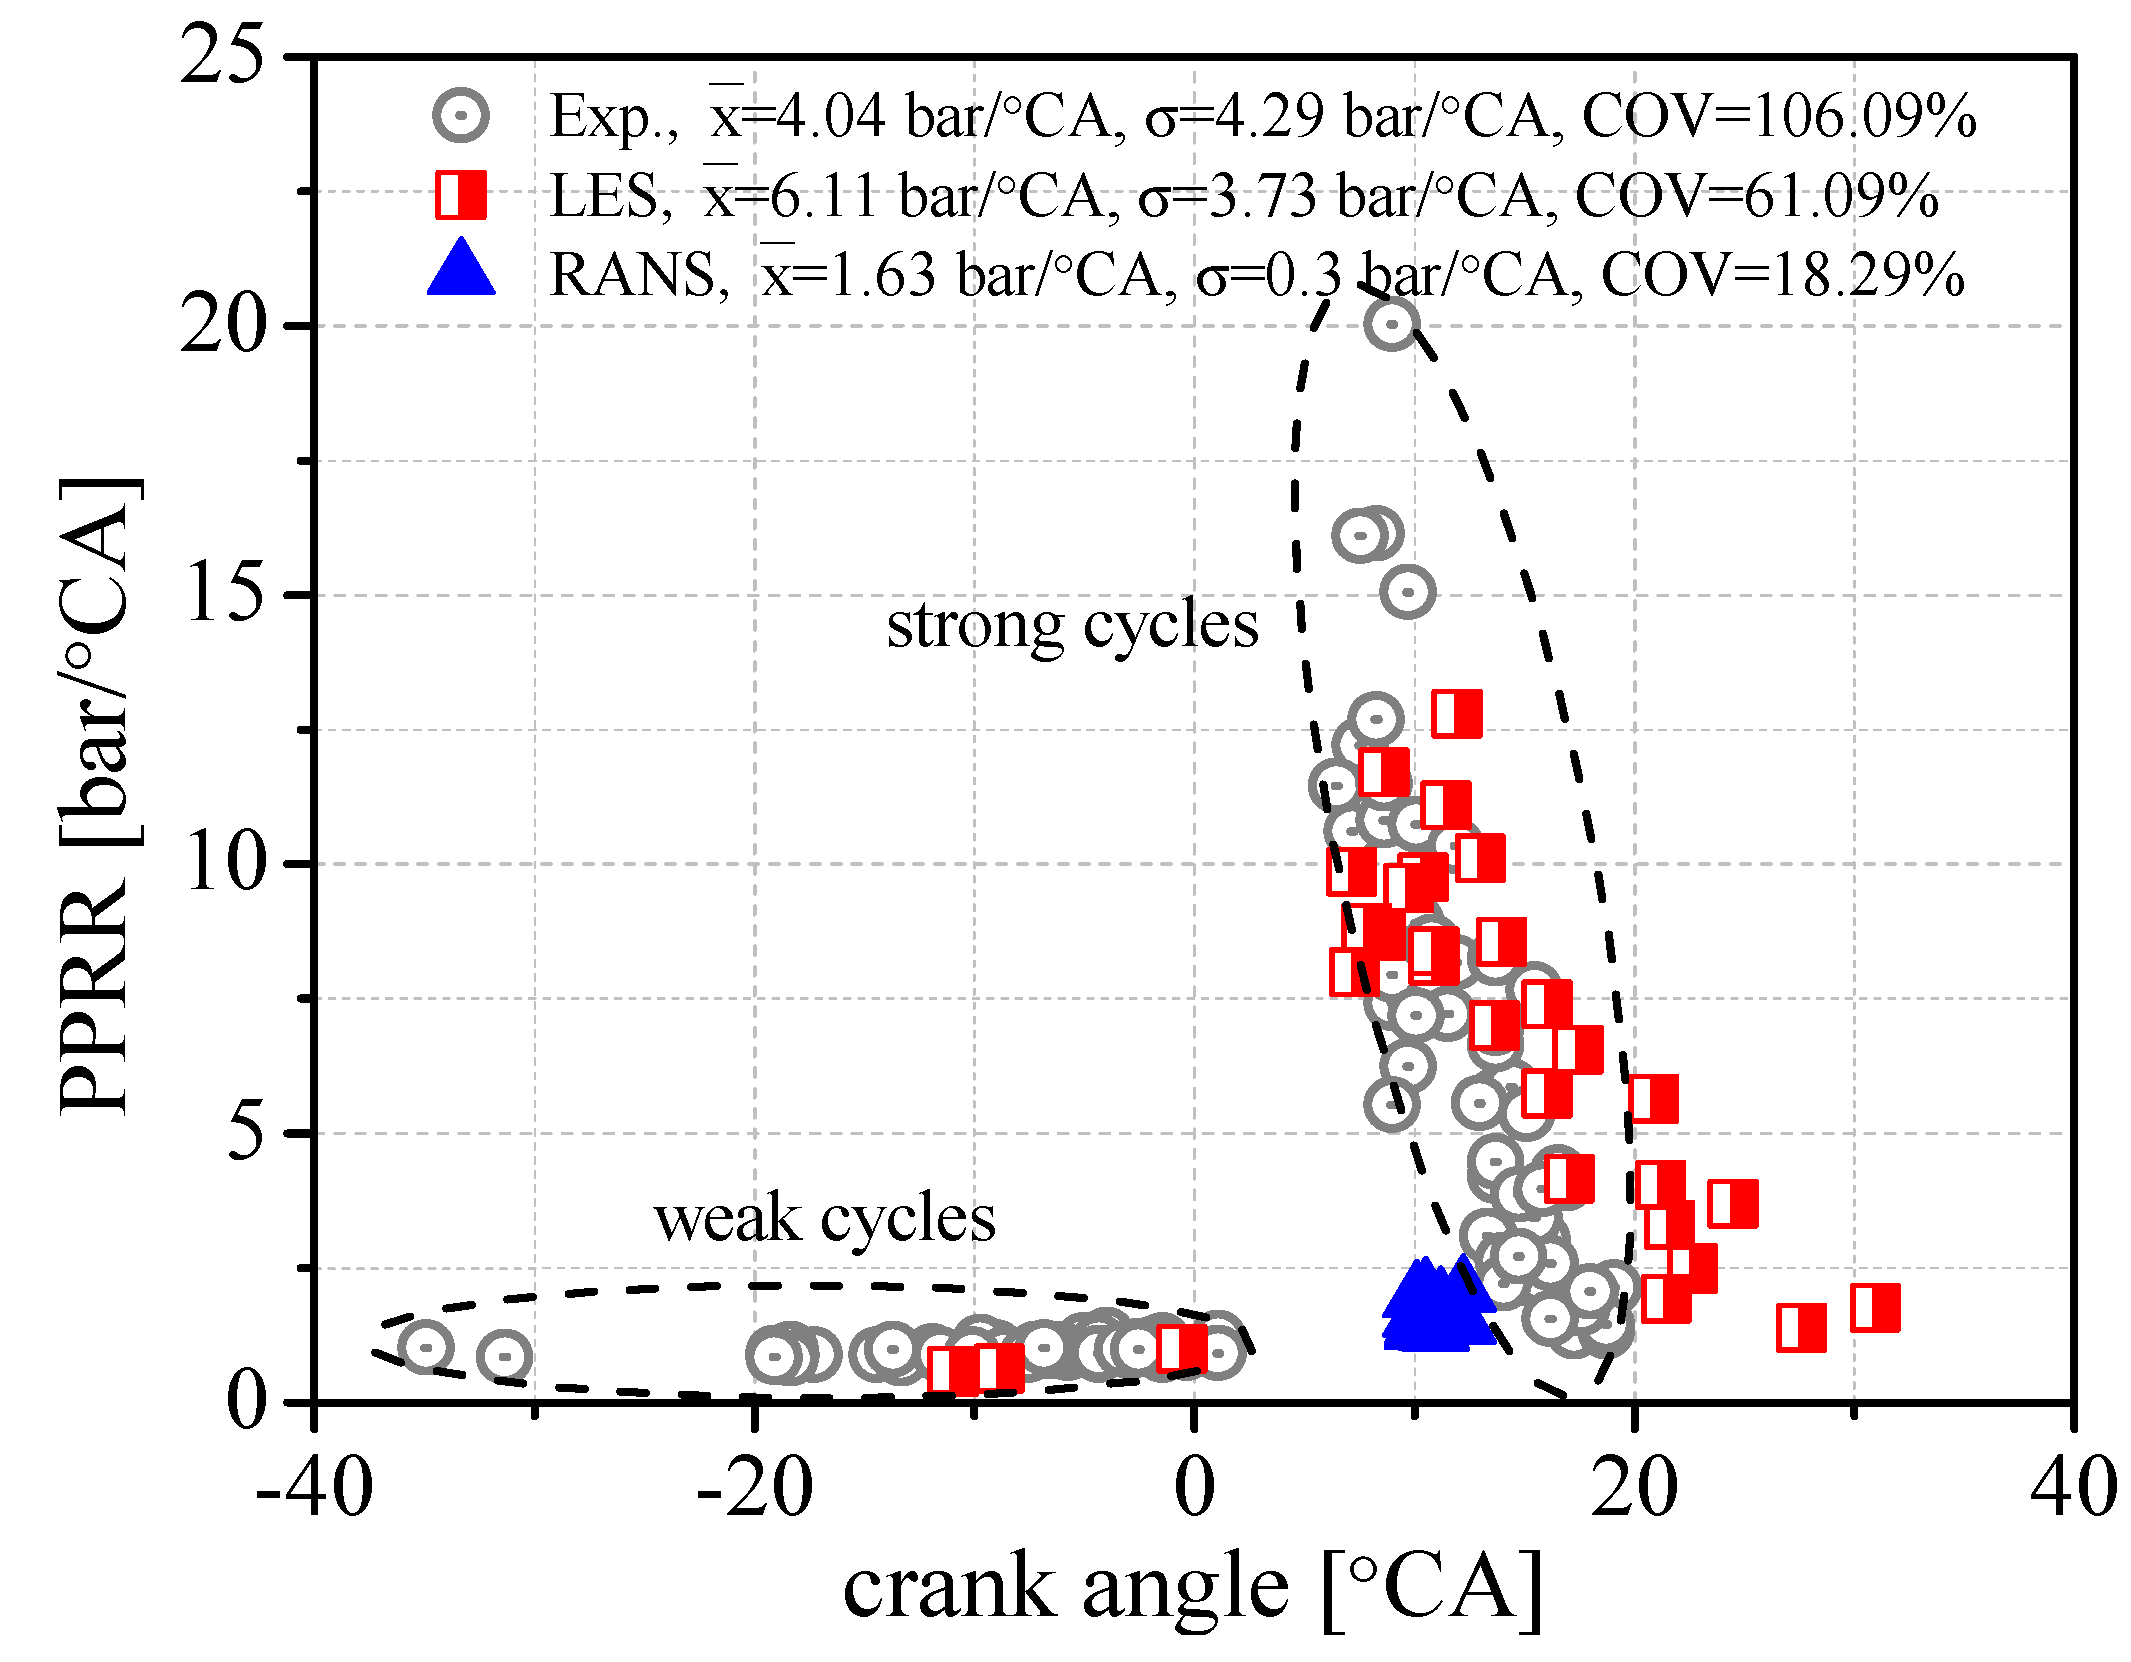
Figure 5.
The scatter plot of the in-cylinder peak pressure rise rate (PPRR) and the corresponding crank angles.
The two distinct combustion types can also be observed in Figure 5. The weak combustion cycles with peak pressure rise rate (PPRR) below 2 bar/°CA are located before TDC, while the strong cycles with PPRR ranging between 1 and 20 bar/°CA are located after TDC. Although there are noticeable differences between the predicted and measured average PPRR and COV, the LES simulations were able to predict the two distinct combustion types. However, the LES produced fewer number of weak cycles and the corresponding crank angles closer to TDC than the experimental observations. In addition, the LES predicted more retarded crank angles of PPRR for some strong cycles, indicating very the late auto-ignition processes for those cycles in LES.
As shown in Figure 4 and Figure 5, the RANS simulations could not capture the two distinct combustion types of the SI–CAI hybrid combustion. The predicted average PP (39.65 bar) is close to the experimental value (42.11 bar), but the predicted PPRR (1.63 bar) is significantly lower than the experimental result (4.04 bar/°CA). The predicted COVs of PP and PPRR by RANS are far lower than the experimental observations.
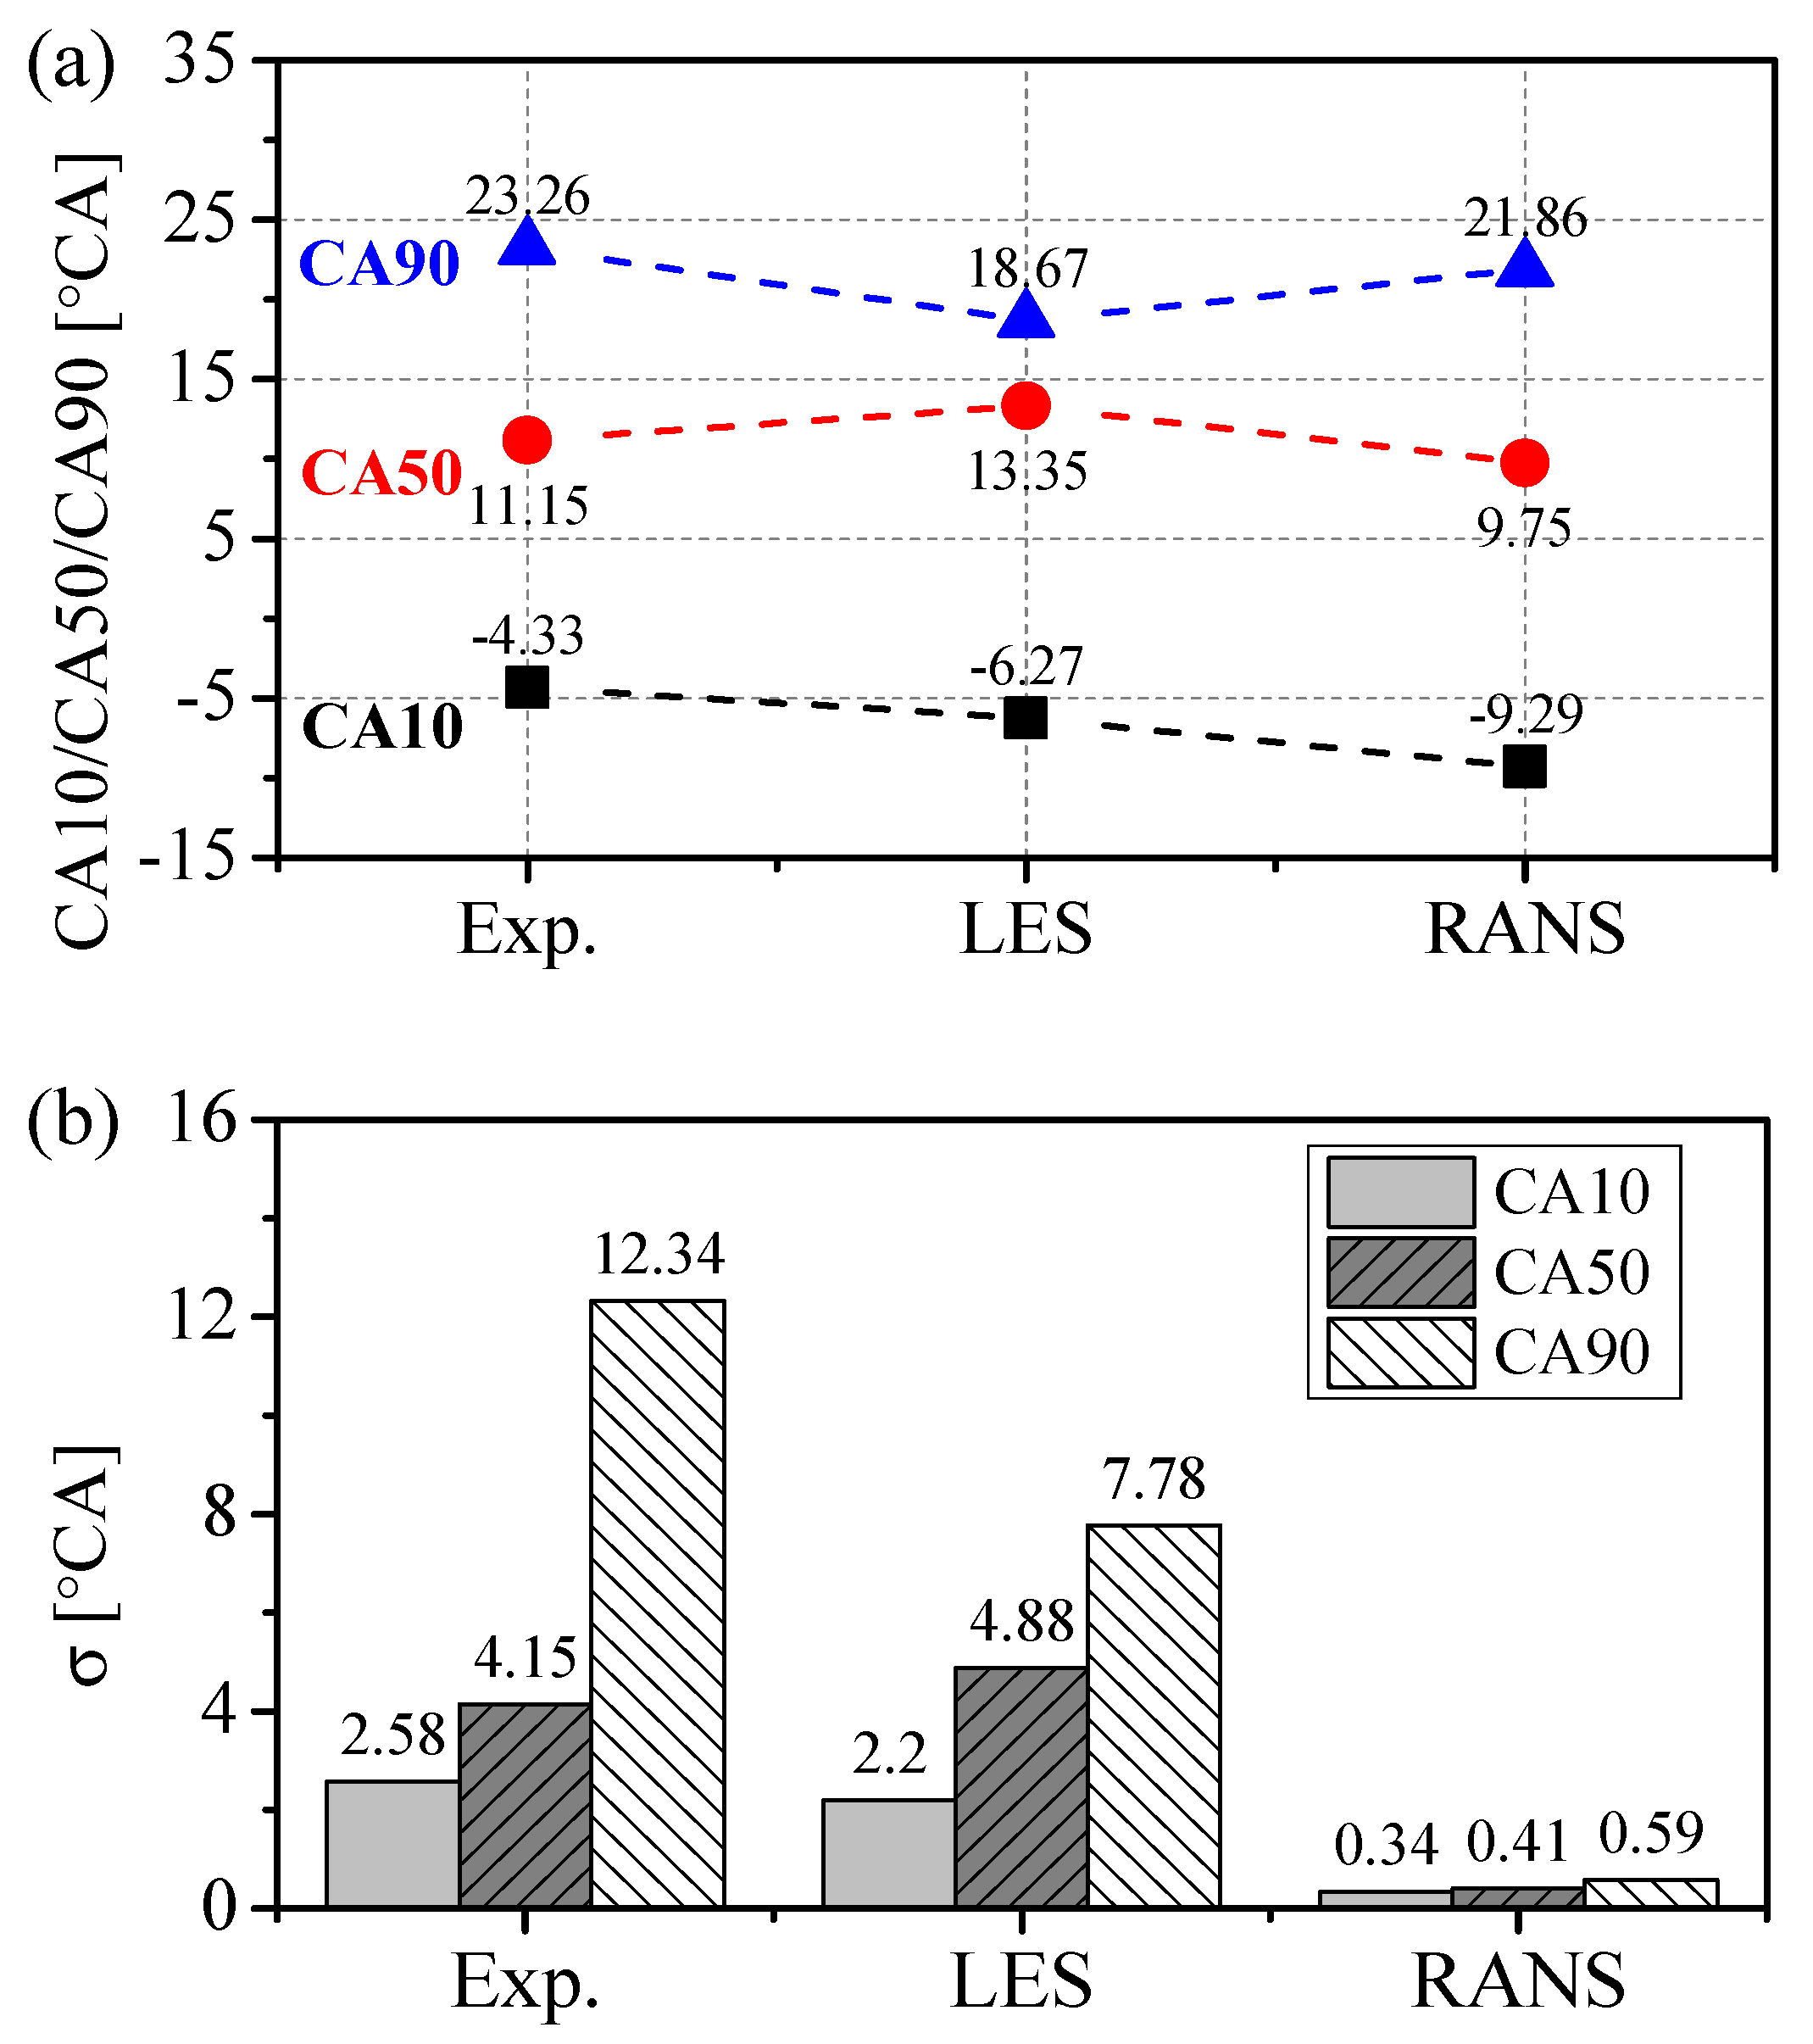
Figure 6a shows the average crank angles with the mass fraction of fuel burned at 10%, 50% and 90% (CA10, CA50 and CA90). The predicted CA50 by LES is slightly later than the experimental value and the predicted CA10 and CA90 are earlier than the experimental values, indicating slower early flame propagation but faster subsequent auto-ignition dominated combustion process by the LES. The predicted faster auto-ignition process in the expansion stroke also contributed to higher average IMEP in the LES simulations compared to the experimental results, as shown in Figure 3. The predicted CA50 and CA90 of RANS simulations are close to the experimental values, although the CA10 is earlier than the experimental result. It can be observed in Figure 6b that the measured cyclic variation is gradually enlarged as the combustion process proceeds and the standard deviation (σ) is increased from 2.58 °CA for CA10 to 12.34 °CA for CA90. This trend was fairly well reproduced by the current LES results, with the predicted σ increasing from 2.2 °CA for CA10 to 7.78 °CA for CA90. The slightly lower predicted σ in CA10 and CA90 indicate that both the spark ignition/initial flame development and late auto-ignition combustion models in the current LES need to be improved to capture their sensitivities to changes in thermofluidic properties in the cylinder. Compared to the LES, the RANS simulations could not reproduce the enlarged cyclic changes during the hybrid combustion process.
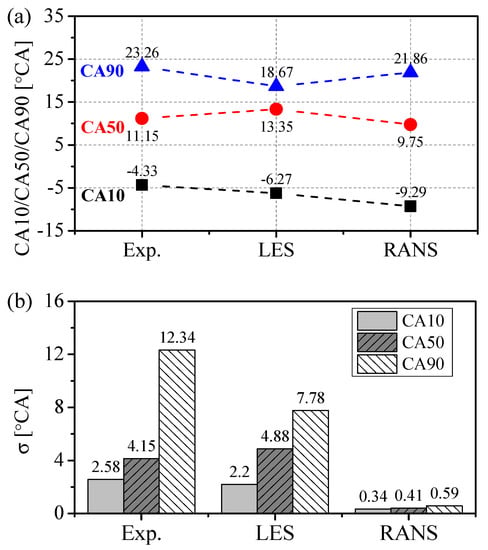
Figure 6.
The comparison of (a) CA10, CA50 and CA90 and (b) corresponding standard deviations (σ).
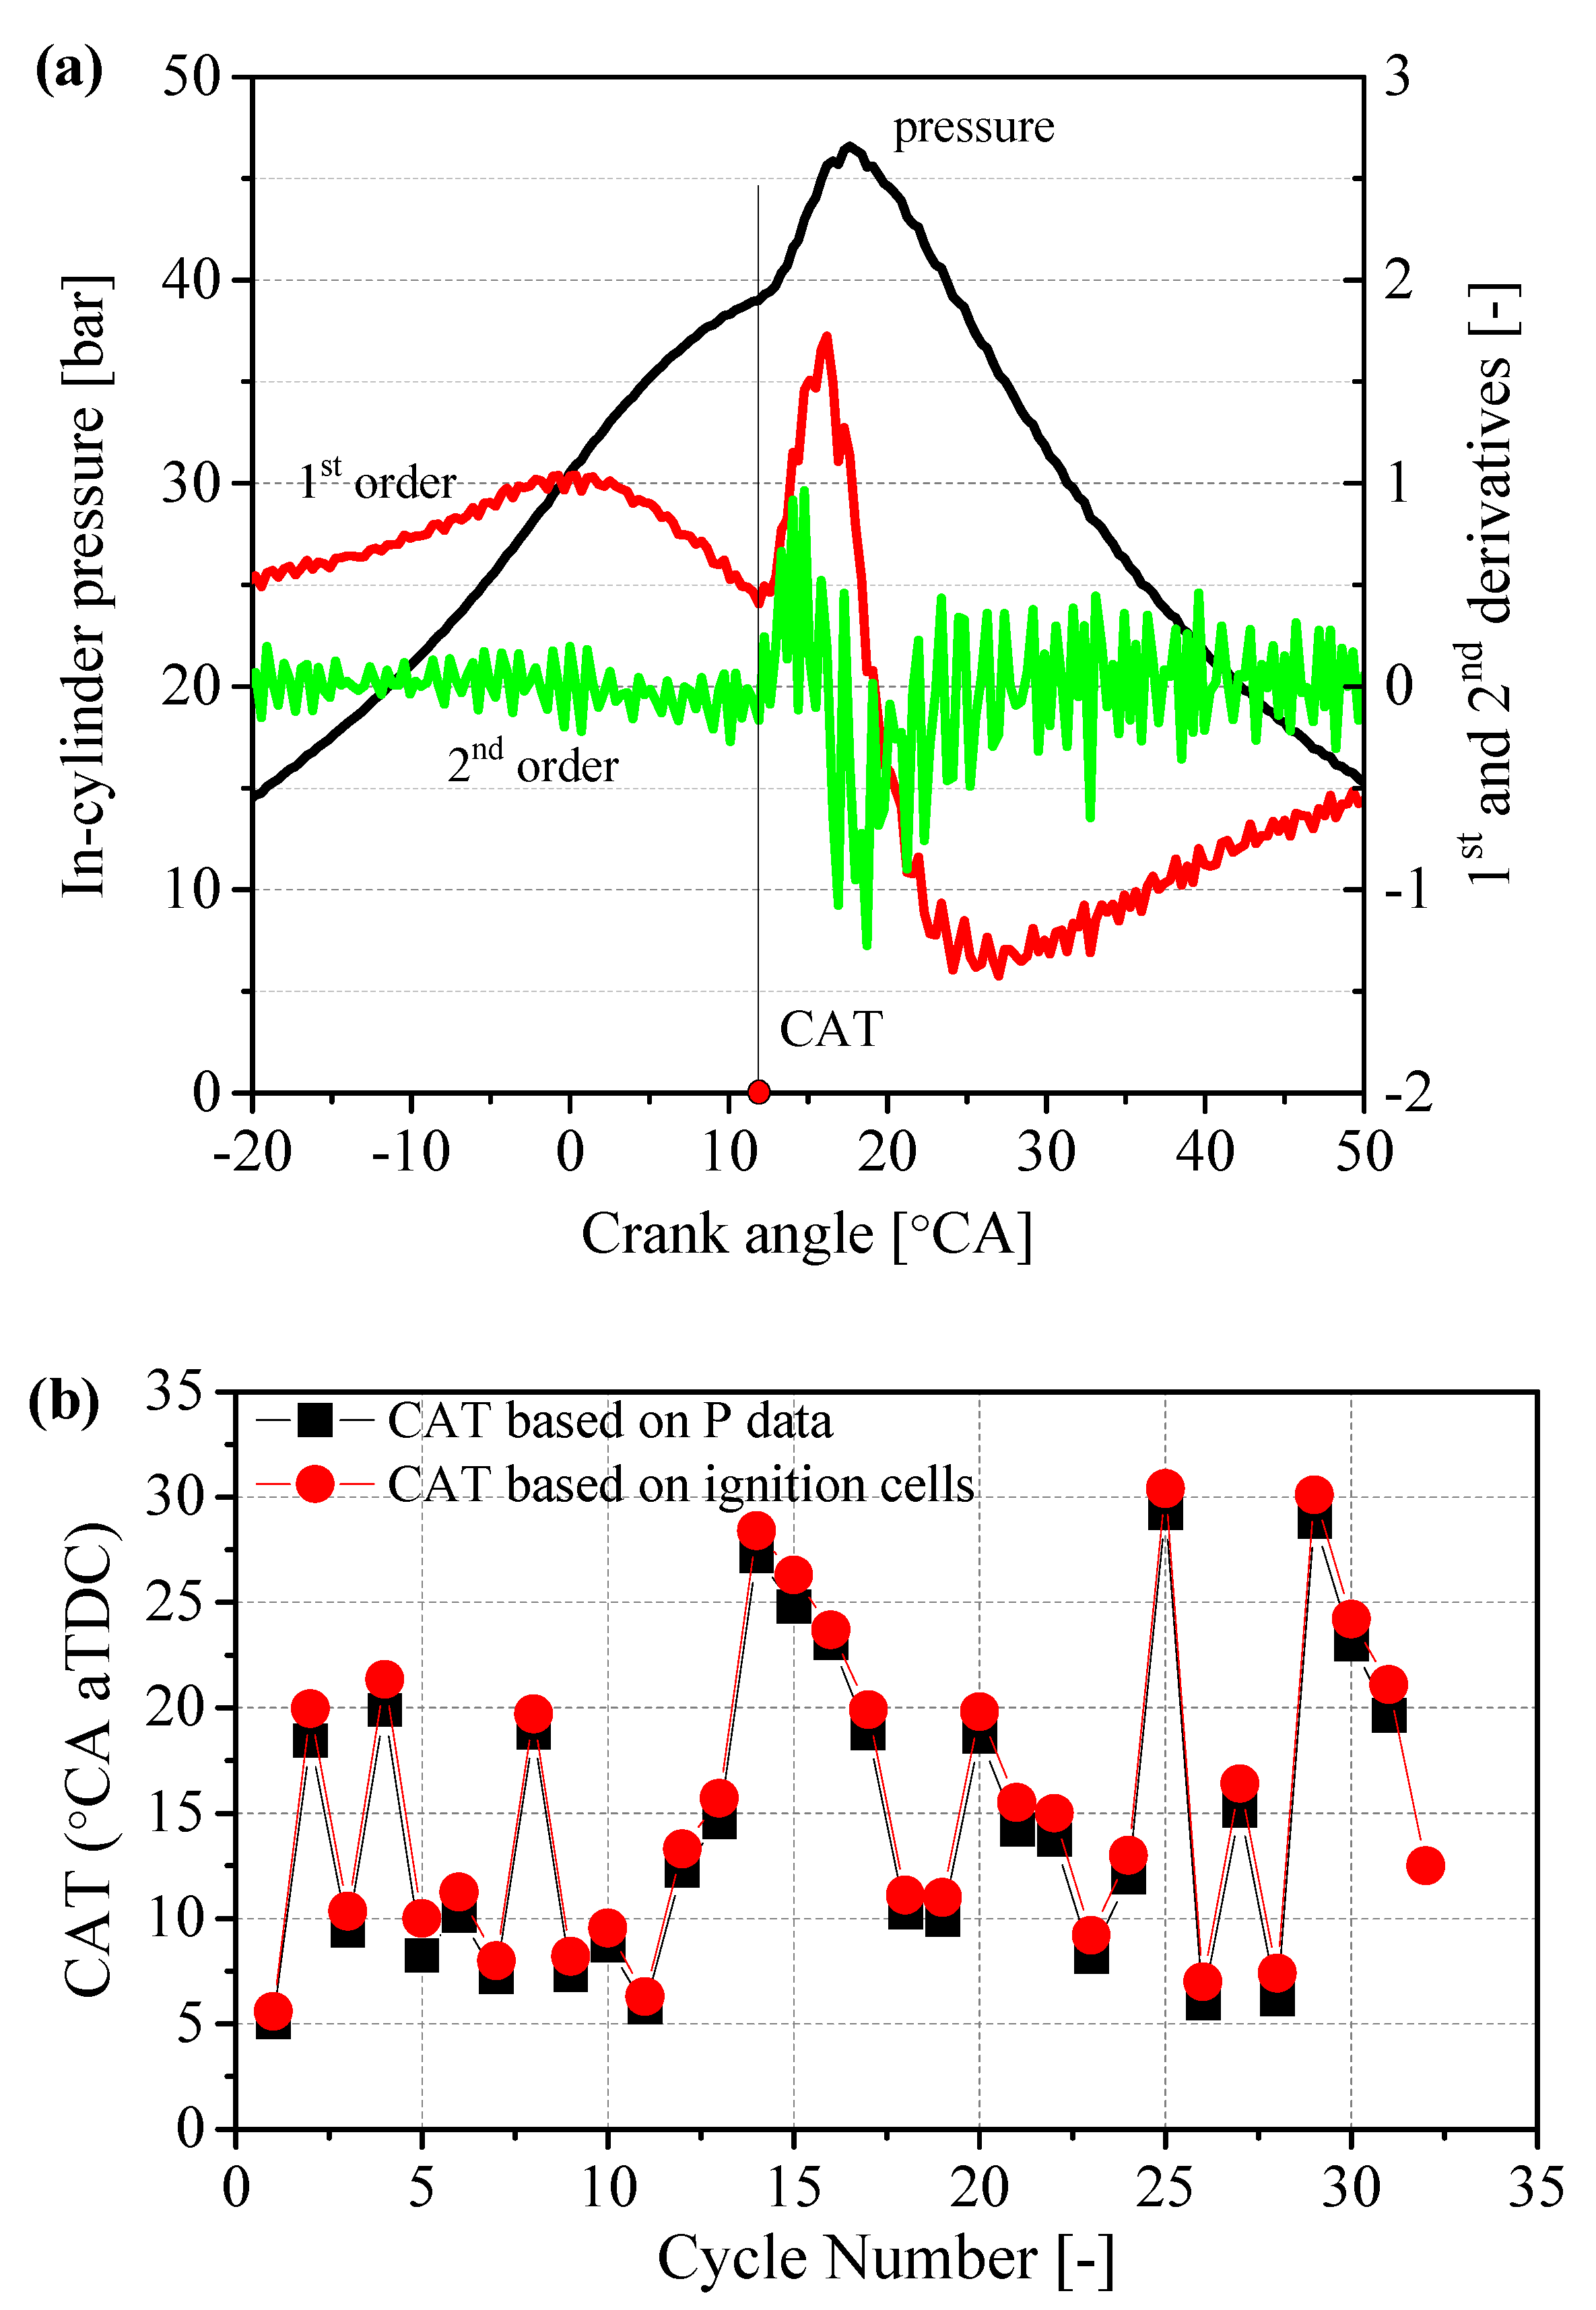
In order to evaluate the variation in the transition of combustion mode from spark ignition to controlled auto-ignition mode, the crank angle of the transition (CATpressure) was calculated based on the pressure trace. As shown in Figure 7a, the CATpressure is defined as the transition point where the local first order derivative of the pressure trace is at the minimum, while the second order derivative just exceeds 0.1. For the non-transitioning cycles in which no transition point is detected, the CAT is simply denoted as 30 °CA. This was chosen for the purpose of plotting and no CAT was detected after 30 °CA.
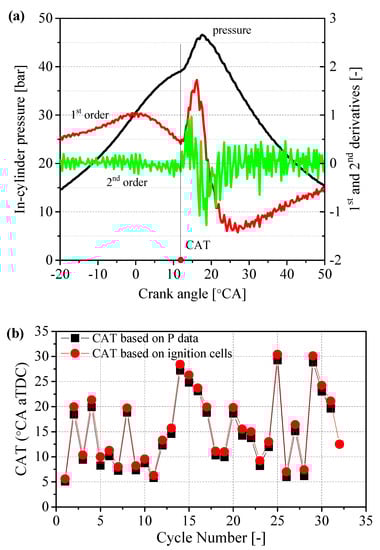
Figure 7.
(a) The definition of the CAT based on the pressure data. (b) Comparison of CAT based on pressure data and auto-ignition cells in LES simulations.
In order to validate the applicability of the calculation of the transition point based on cylinder pressure trace, the LES simulation results were analyzed and the crank angle with 1% cells auto-ignited is defined as the transition crank angle (CATignition) based on the ignition cells. The results are compared with the CATpressure, as shown in Figure 7b. The results indicate that the cylinder pressure-based approach shows almost the same results of CAT as the autoignition cells-based approach. Therefore, the pressure-based approach was applied to analyze the CAT in both experiments and simulations for consistency.
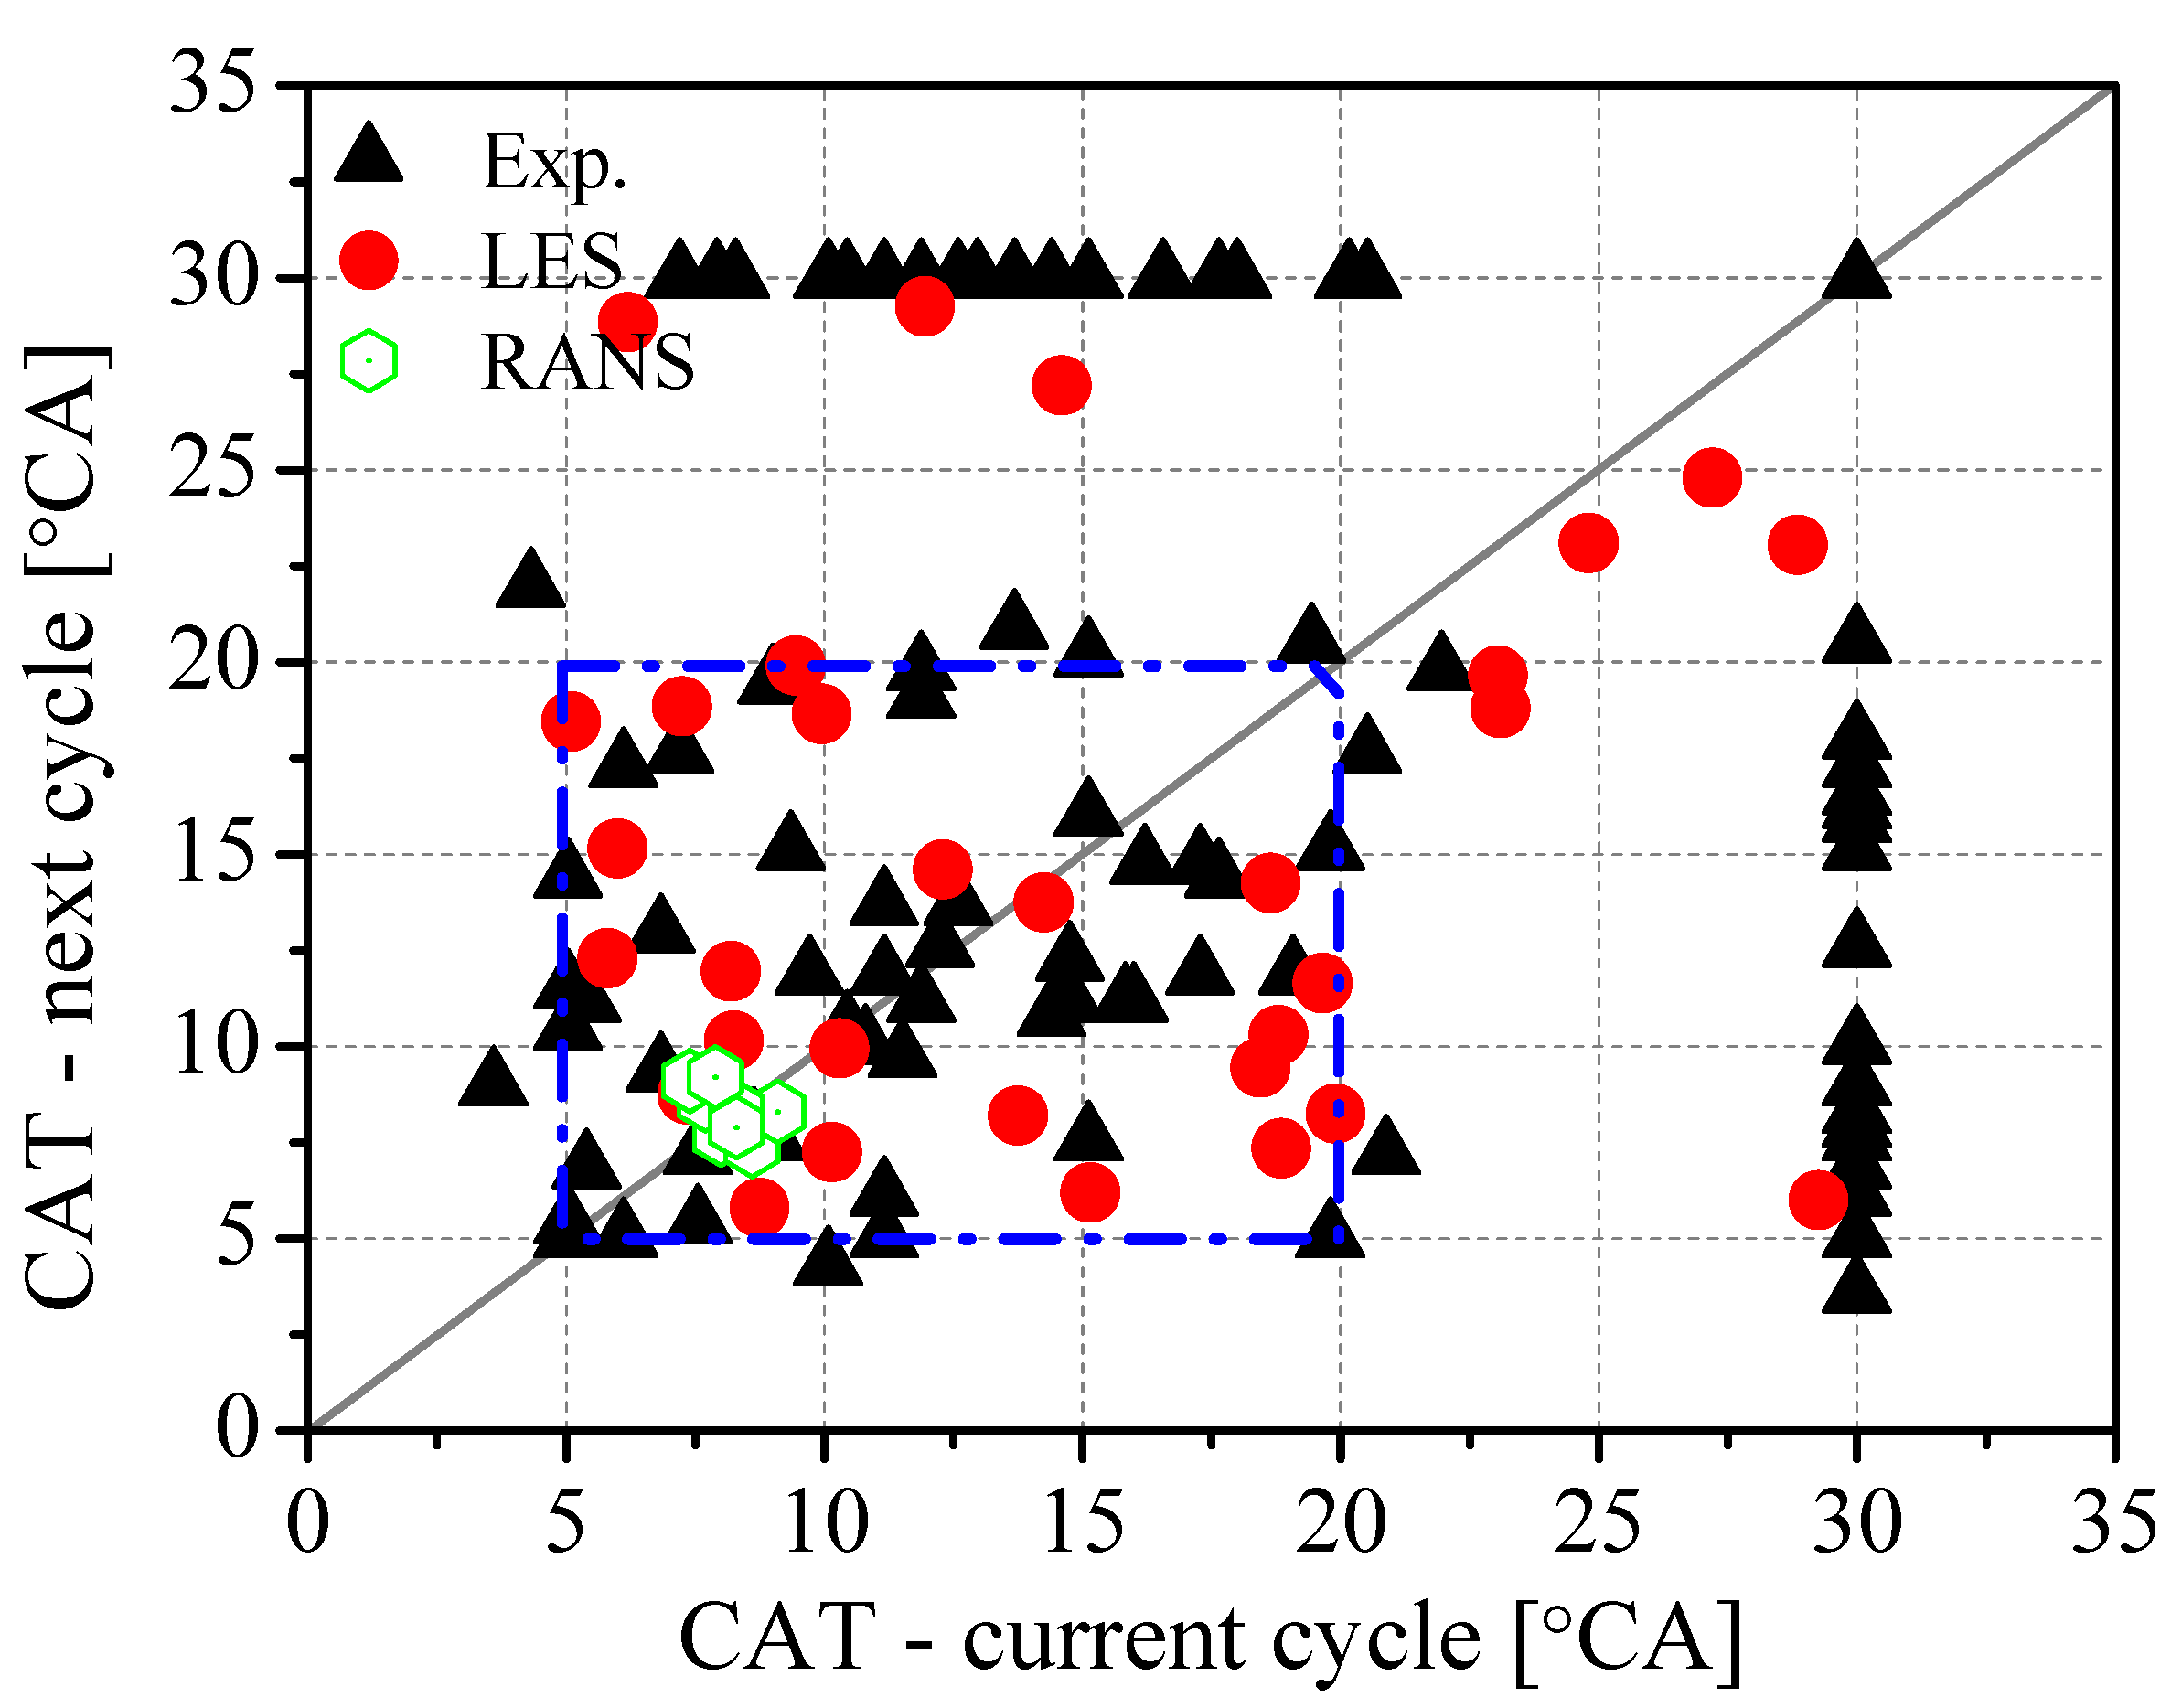
Figure 8 shows the distribution of CATs of the current cycle and next cycle in the experiments, LES and RANS simulations. The CATs in LES cover a wide range from 5 °CA to 30 °CA, showing a very good match with the experimental results. However, it is noted that the CATs are mainly distributed in the range of 5 to 20 °CA (in the blue dashed box), and the remaining CATs are 30 °CA, indicating no combustion mode transition captured in those non-transitioning cycles. In the range of 5 to 20 °CA, the CATs overlap each other between the LES and experimental results, indicating excellent capture of the combustion mode transitioning. However, it is clear that LES predicts more late CATs (between 20 to 30 °CA), while no non-transitioning cycles (CAT = 30 °CA) compared to experiments. This further illustrates that the auto-ignition prediction at extremely diluted conditions needs to be improved in the future.
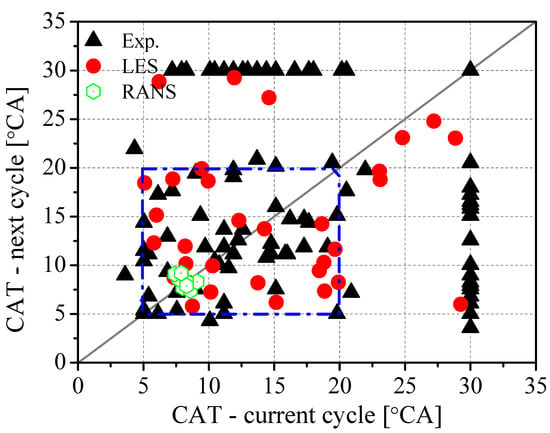
Figure 8.
Distribution of CATs for the current cycle and next cycle in experiments, LES and RANS simulations.
3.2. Analysis of the Cyclic Phenomenon of Hybrid Combustion
The above critical validation study shows that the adopted LES simulations could capture the basic combustion characteristics of the SI–CAI hybrid combustion observed in the experiments. More specifically, two distinct combustion types (strong/weak cycles), the variation in combustion mode transitioning, and the enlarged cyclic phenomenon throughout the combustion process can be well captured in the current LES modeling. Thus, the LES simulation results will be further explored in this section to investigate and understand the observed cyclic phenomenon of the SI–CAI hybrid combustion.
In order to analyze the cyclic variation in the initial flame development, a spherical zone with 20 mm diameter around the spark plug gap is defined as the spark zone to capture the initial conditions. The calculation of the COVs of local velocity magnitude (VM), temperature, residual gas fraction (RGF) and pressure was performed for the whole combustion chamber, as well as the spark zone. It is found that the local temperature, RGF and pressure showed little variations (COVs < 0.8%) but the VM shows significant variations with COV of 8.66% in the whole chamber and 22.75% in the spark zone.
Furthermore, a correlation study was performed for the in-cylinder velocity magnitude, temperature and RGF before spark ignition timing against CA10, CA50 and CA90 to identify the most influential factors affecting the CCVs of the hybrid combustion process. Strong correlations are found between the VM in spark zone at −50 °CA (just before the spark ignition timing) and CA10, CA50 and CA90, as shown in Figure 9. In particular, CA10 is strongly dependent on the local VM in the spark zone and the Pearson correlation coefficient (r) was around 0.8. It is also noted that the slops of the fitting curves gradually increase from CA10 to CA90, indicating the enhanced impact of local VM in the spark zone on the combustion process. It should be noted that the correlation of the average VM in the whole cylinder is relatively weak, with r below 0.7. All the other parameters (temperature and RGF) before spark ignition timing show very weak correlation (Pearson correlation coefficient r below 0.3) with combustion parameters.
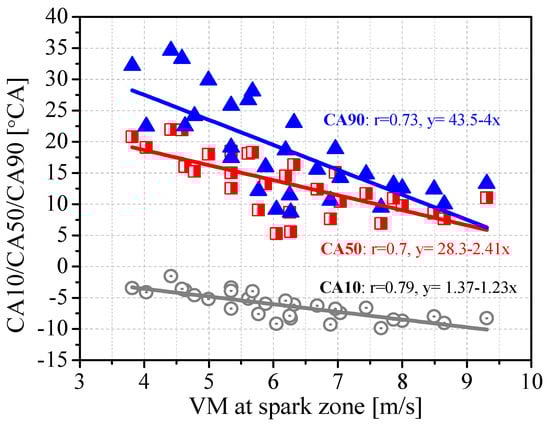
Figure 9.
The correlations between the VM in spark zone at −50 °CA and CA10, CA50 and CA90.
Although the average in-cylinder temperature at 670 °CA has very weak correlations with CA10, CA50 and CA90, Figure 10 shows strong correlations of the average temperature at TDC (T TDC) with CA50, CA90 and CAT with a Pearson coefficient over 0.94, which indicates the dominated impact of the induced thermal condition by the early flame propagation on the auto-ignition combustion at a later stage of hybrid combustion. It should be noted that CA10 is earlier than TDC; therefore, the correlation of T TDC with CA10 is not shown here.
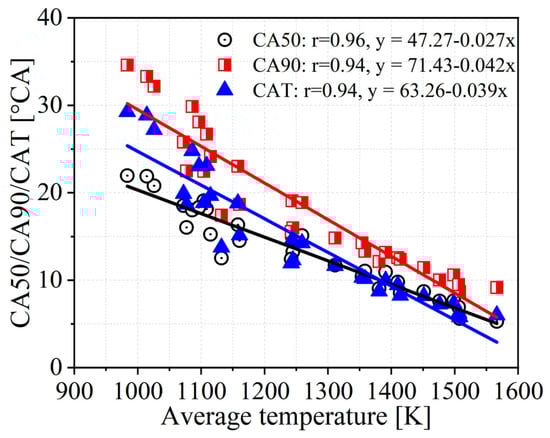
Figure 10.
The correlation of the average temperature in combustion chamber at TDC with CA50, CA90 and CAT.
The correlation study reveals that the early phase flame propagation (CA10) of the hybrid combustion is controlled by the VM around the spark plug. The flame propagation induces thermal conditions, then dominates the subsequent combustion process (CA50 and CA90) as well as mode transitioning (CAT), as the auto-ignition process is more sensitive to temperature.
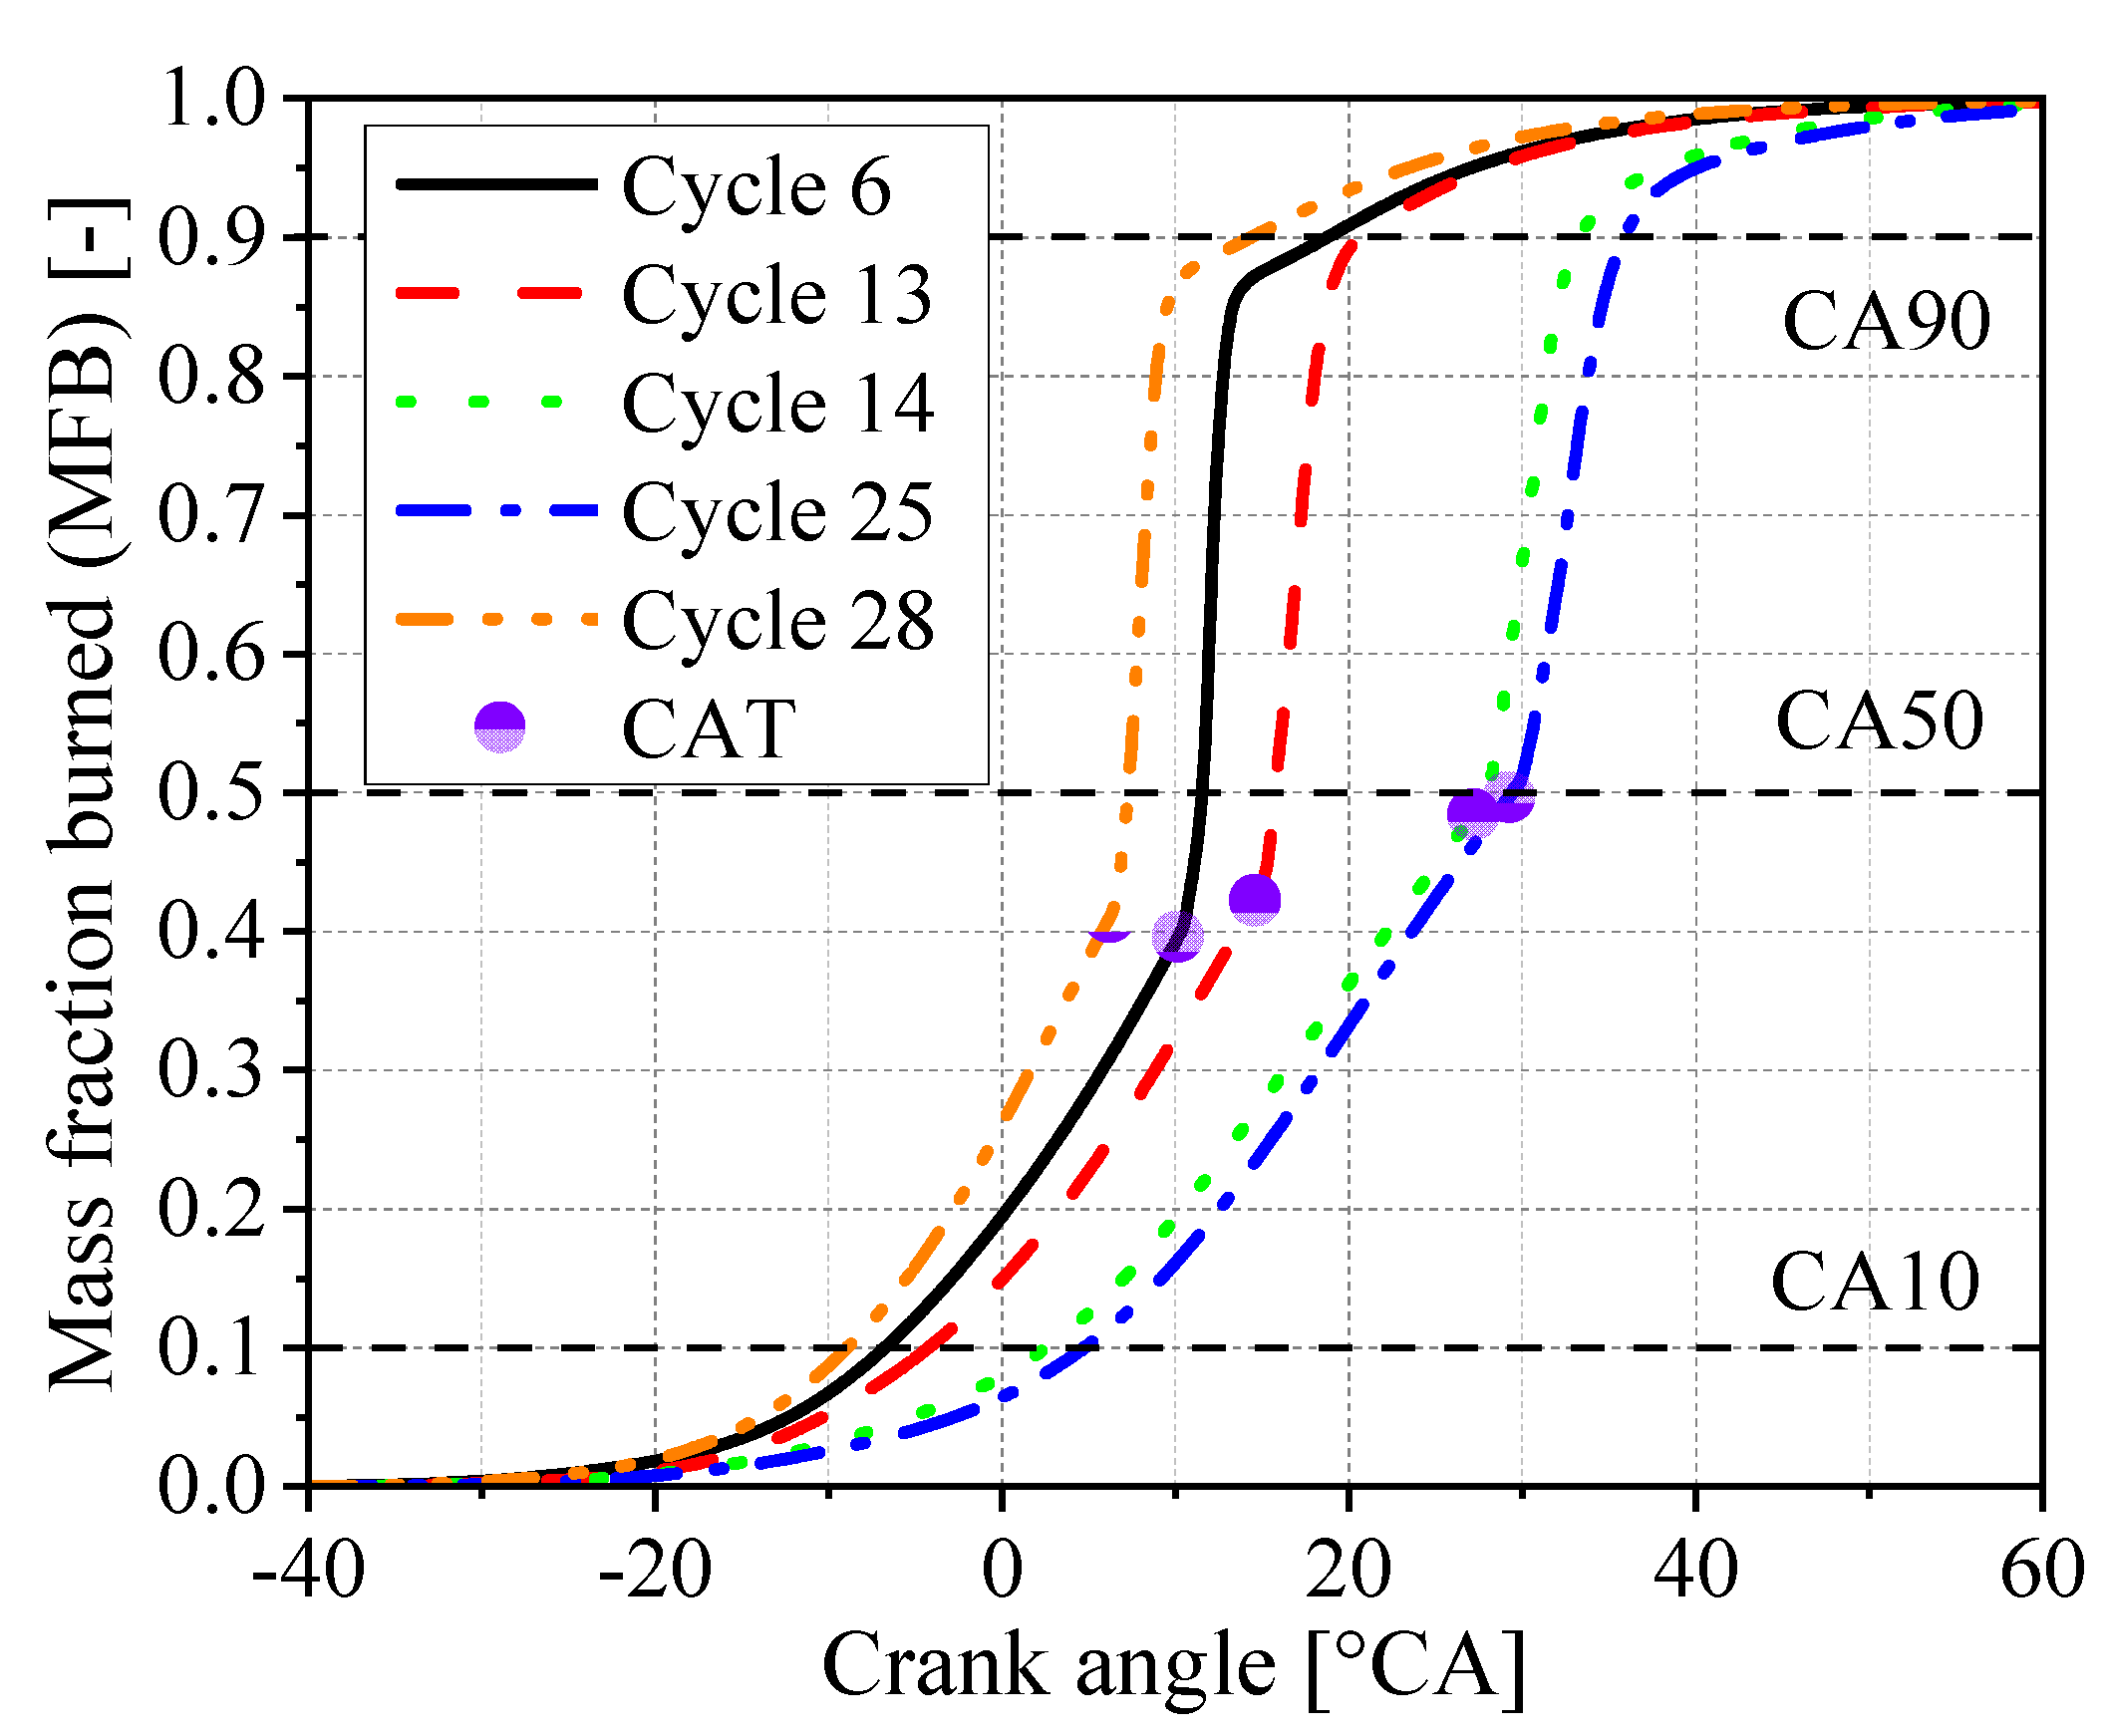
In order to understand the combustion process that is influenced by in-cylinder flow motion and temperature, five typical combustion cycles with both strong and weak combustion processes were selected for further analysis. The corresponding mass fraction burned (MFB) traces are shown in the Figure 11. As shown in the figure, the combustion process is faster for Cycles 28, 6 and then 13. Cycles 14 and 25 are the slowest with much later combustion phasing (CA10 to CA90), as well as CAT.
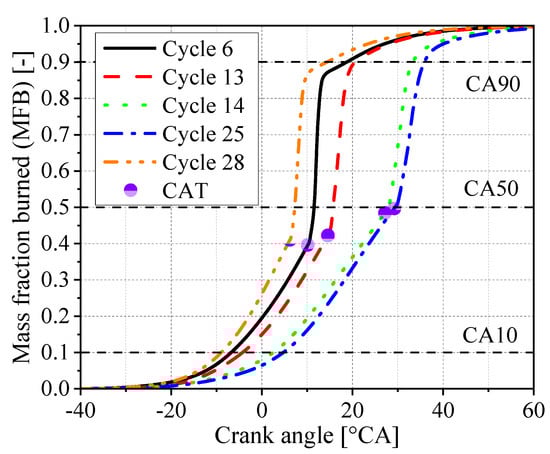
Figure 11.
The mass fraction burned profiles for Cycle 6, Cycle 13, Cycle 14, Cycle 25 and Cycle 28.
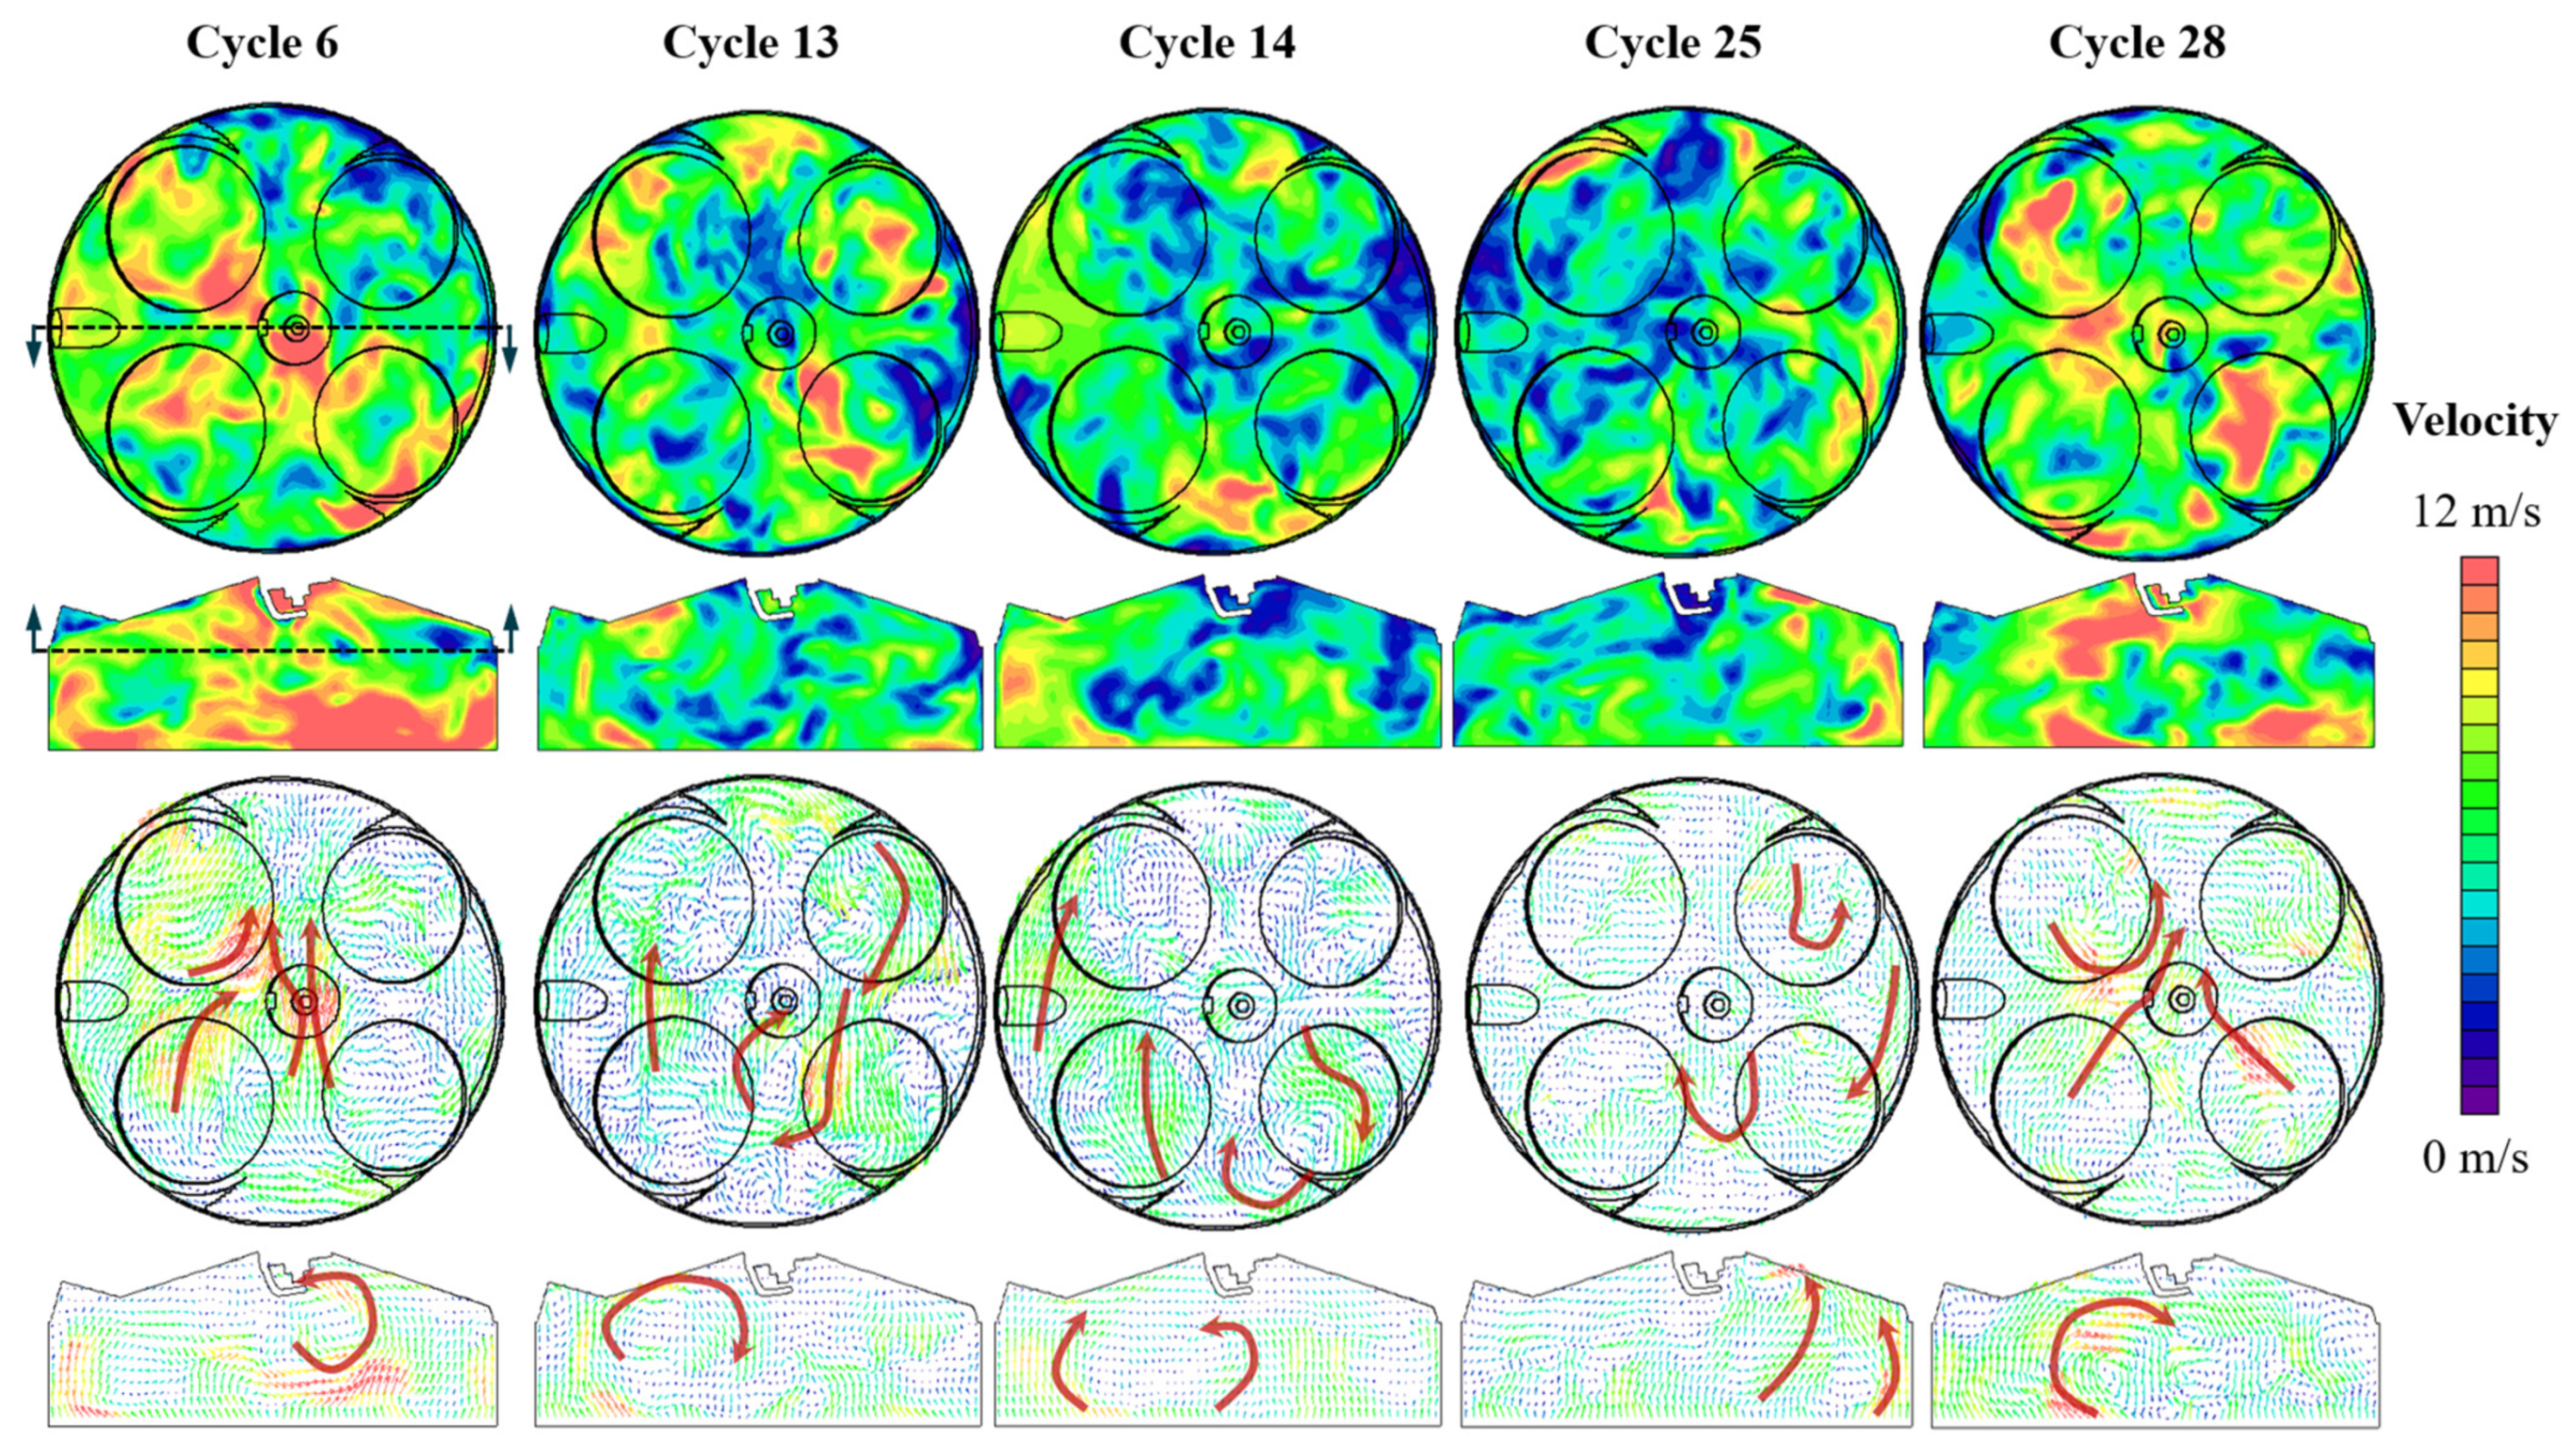
The distributions of flow magnitudes and vectors at 670 °CA (just before spark ignition timing) are shown in Figure 12. The sections used for the distribution plots are also marked in the figure. It is visible that the flow velocity magnitude in the area around the spark plug is lower (in blue color) for Cycles 14 and 25. The flow velocity vectors captured in-cylinder flow motions and they are very different at the spark plug region among the cycles, which implies the potential impact on the flame kernel formation and initial development of the flame propagation process. In Cycle 12, there is a strong flow across the spark plug region towards the upper part of the horizontal plots. An anti-clockwise tumble towards the spark plug gap is also observed in the vertical plot. Similarly, strong flow motions are observed across the spark plug region towards the upper part of the cylinder in the horizontal plot of Cycle 28, while a clockwise tumble motion towards the spark plug gap is formed in the vertical plot. In comparison, a relatively weaker flow motion pointing to the spark plug is observed in Cycle 13, while the clockwise tumble in the vertical plot is slightly away from the spark plug gap. However, there is no coordinated flow motions across the spark plug region in Cycles 14 and 15.
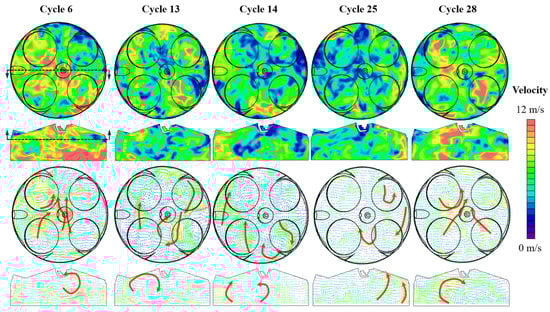
Figure 12.
Distributions of flow velocity magnitude and vectors at 670 °CA.
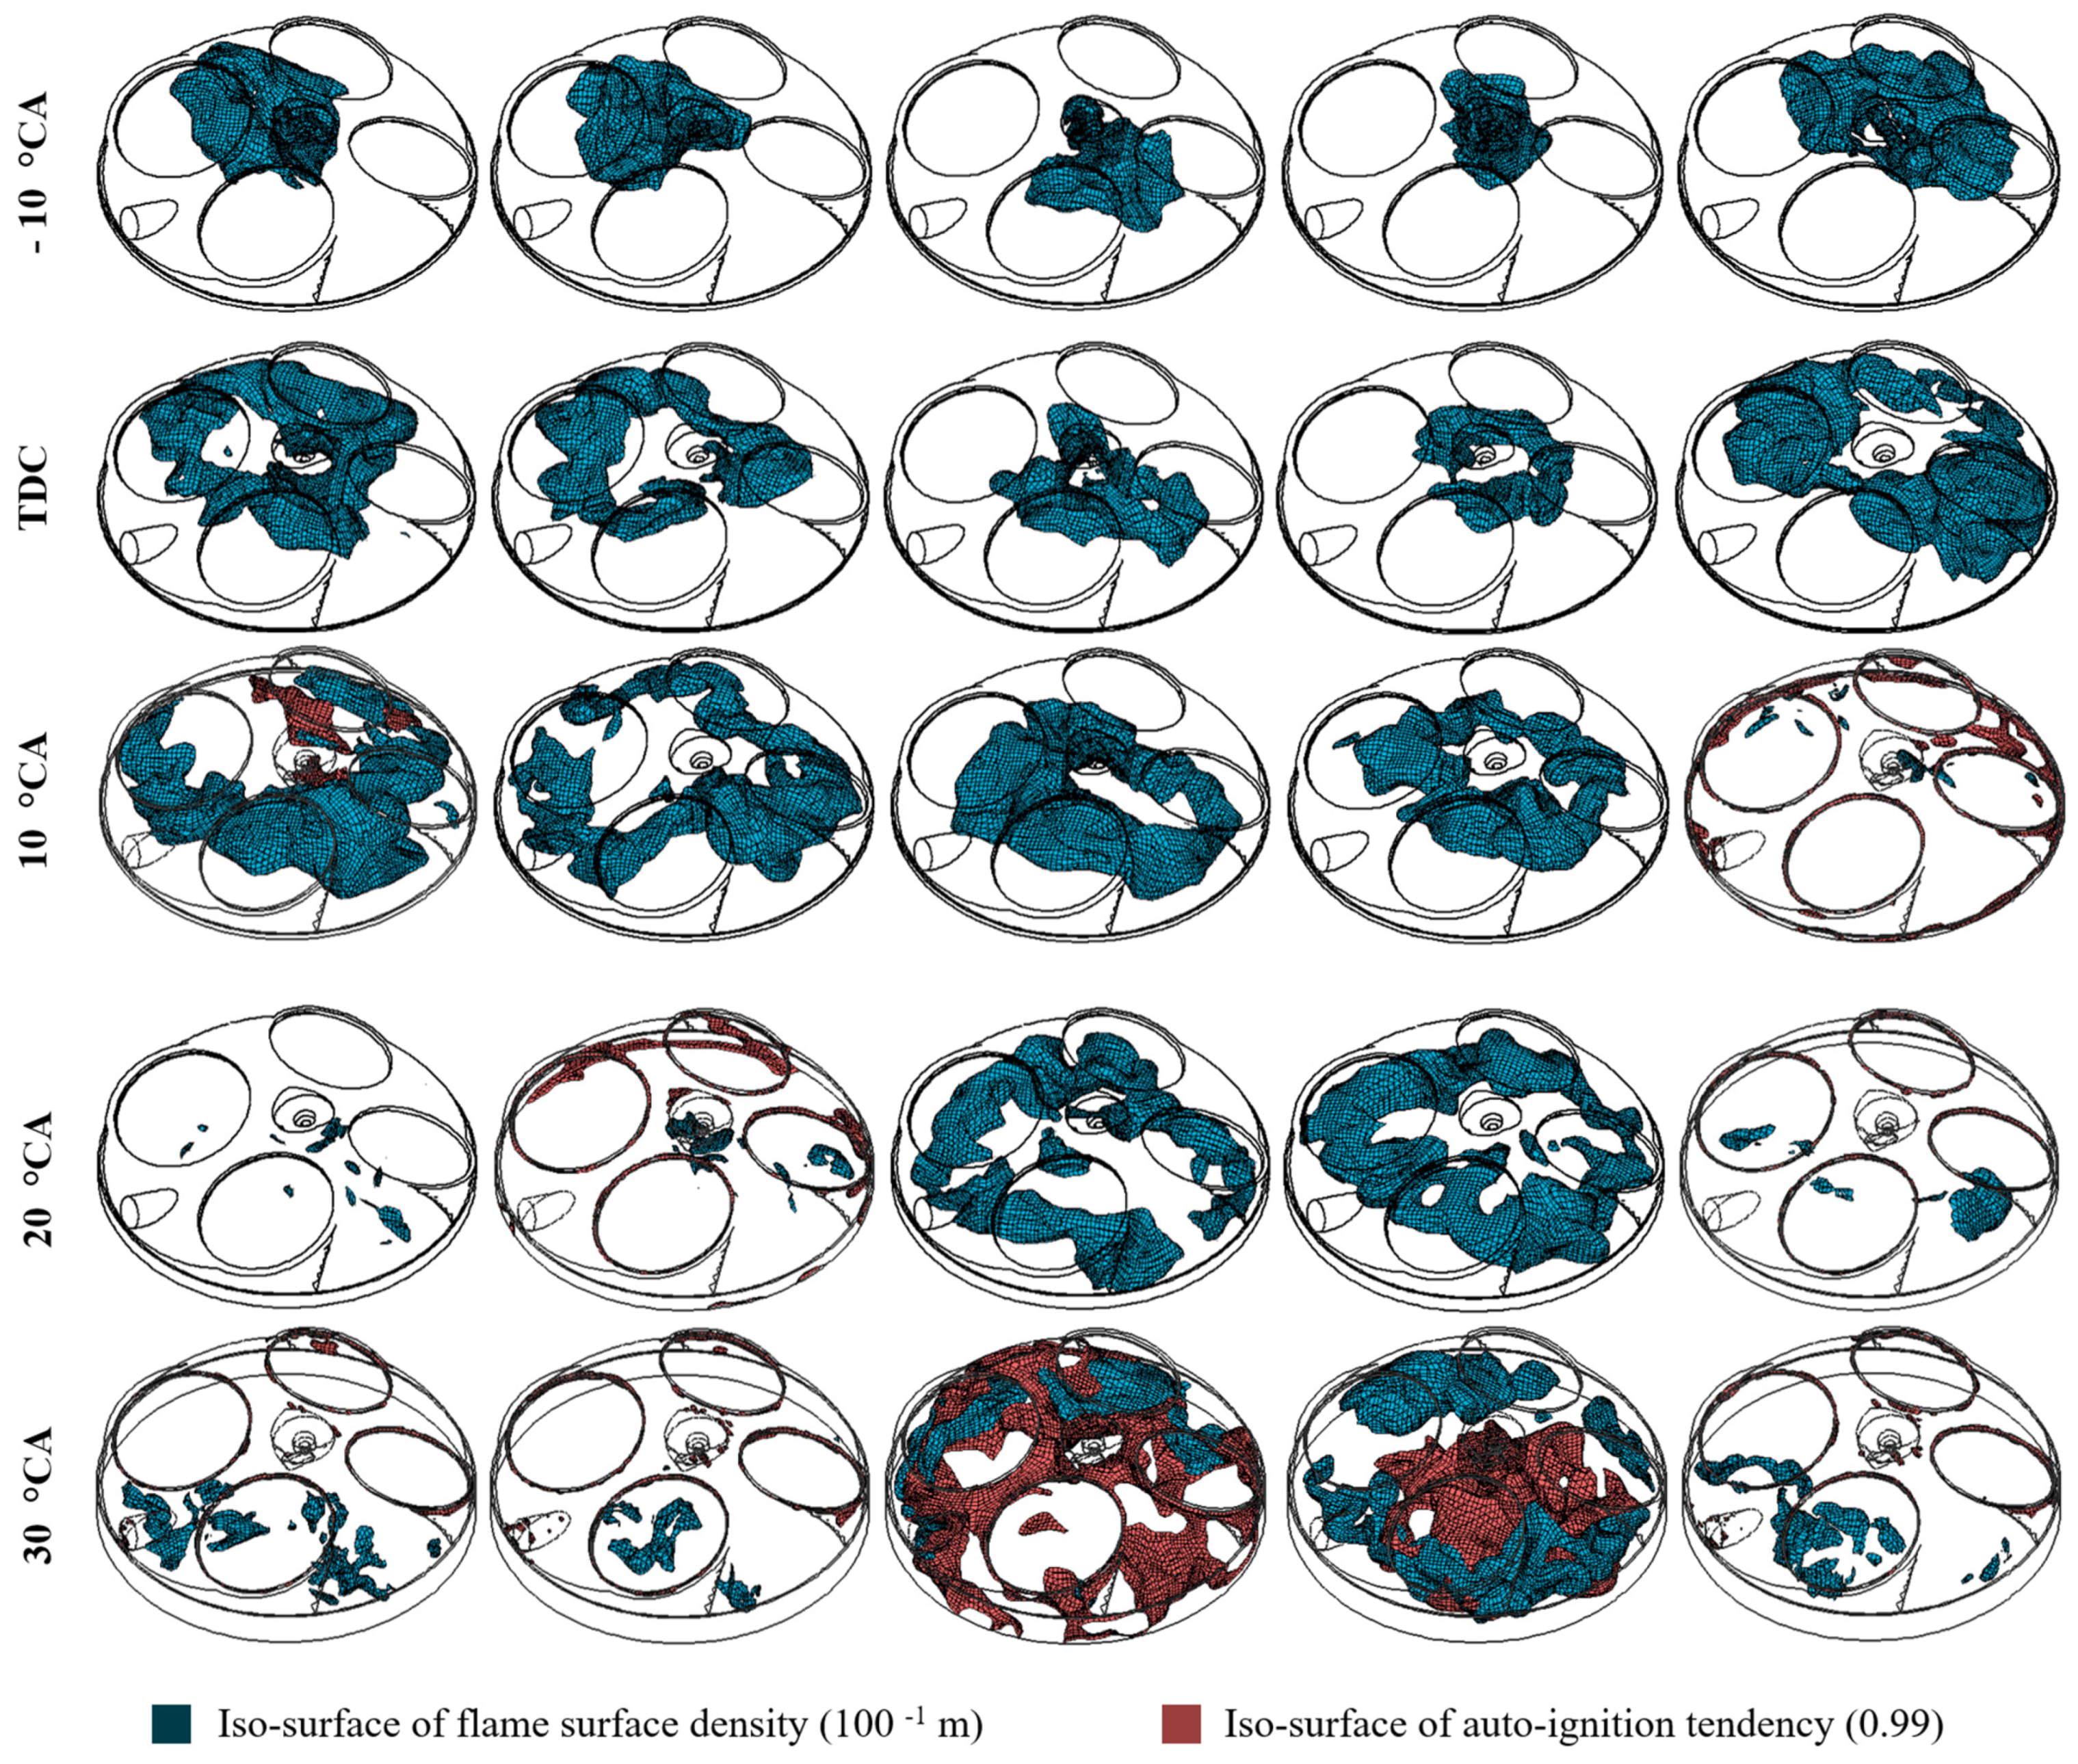
As a result of the in-cylinder flow motions, the combustion process varies significantly, as captured in Figure 13, which shows the iso-surface of the flame front and auto-ignition sites at different crank angles. The iso-surface of the flame surface density (100 m−1) is plotted in dark blue to capture the flame front, while the iso-surface of the auto-ignition tendency (0.98) is plotted in brown to indicate the potential auto-ignition sites in the next time step. In this way, the interactions of flame propagation on the auto-ignition at specific crank angles can be analyzed. It should be noted that these auto-ignition sites are not necessary the first auto-ignition sites in a specific cycle.
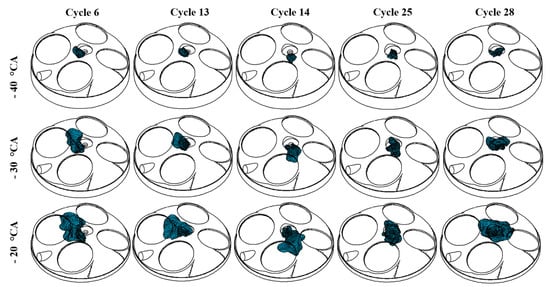
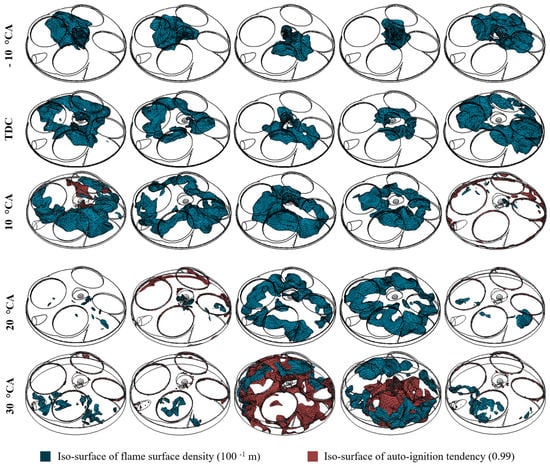
Figure 13.
Iso-surface of the flame front and auto-ignition sites.
The combined information in Figure 12 and Figure 13 provide valuable information on the interactions of in-cylinder flow motions and combustion processes. The results indicate that the initial flame front is directly affected by the flow motions. For example, in Cycle 6, the early flame kernel and subsequent flame front are driven by the flow motions towards the upper part of the cylinder in the horizontal plot (as shown in Figure 12). At TDC, the flame front already spreads to the cylinder wall of the upper part of the cylinder, while the flame front is in the middle of the lower part of the combustion chamber, as shown in Figure 13. The further development of the flame propagation process triggers the auto-ignitions (in brown color) at the rim of the flame front in the upper part at 10 °CA.
A similar flame development process can be observed in Cycle 13, where the initial flame kernel at −40 to −30 °CA is blown to the upper part of the chamber and the majority of the flame front is kept in the upper part until 10 °CA, when the flame propagates into the lower part of the chamber. However, it is evident that the flame propagation process in Cycle 13 is slower compared to Cycle 6. This is caused by the relatively weaker flow motion in the central region for Cycle 13 compared to Cycle 6, as shown in Figure 12. In Cycles 14 and 25, the flow velocity is low in the central region around the spark plug and no clear flow motion is formed across the spark plug region. As a result, the flame kernel formation and flame development are weaker compared to Cycle 6 and Cycle 13. It is visible that Cycles 14 and 25 produce a smaller flame area, in particular from TDC, compared to Cycles 6 and 13. In addition, the flame fronts in Cycles 14 and 25 are positioned in the center of the chamber around the spark plug, due to less impact by the bulk flow motion across the spark plug. It is also obvious that the flame front of Cycle 25 (e.g., at TDC and 10 °CA) has less winkles and is close to a spherical shape due to less disturbance from the flow fields. However, this leads to the slowest combustion process among the five cycles, as shown in Figure 11. The strong flow motion in Cycle 28 crosses the spark plug region and moves towards the upper right corner, as shown in Figure 12. As a result, the flame front is driven towards the upper right corner from the very beginning of flame kernel formation. It is particularly obvious at −10 °CA when the flame front is biased towards to the upper right corner of the chamber.
Figure 13 also shows important information on the mode transitioning from flame propagation mode to auto-ignition. Interactions of the flame and auto-ignition sites are well captured in Cycle 6, Cycle 14 and Cycle 25, as the selected crank angles for plotting are very close to the CAT. More specifically, it can be observed that the auto-ignition sites are located very close to the flame front in Cycle 6. In Cycle 14, the auto-ignition sites at 30 °CA are very close to the cylinder walls (in particular, the cylinder head and cylinder liner), while the flame fronts are much more weakened. In comparison, the auto-ignition sites at 30 °CA in Cycle 25 are closer to the piston top, while the flame front spread more to the cylinder wall, indicating a slower combustion speed and later transitioning to the auto-ignition mode, as shown in Figure 11.
It should be noted that in Cycles 13 and 28, the CAT is away from the selected crank angles for plotting. Therefore, the flame is much more weakened, while the auto-ignition combustion also approaches the end and only the mixtures close to the wall are left to be auto-ignited at 20 °CA for Cycle 13 and 10 °CA for Cycle 28.
The auto-ignition process is affected by local thermal conditions. Figure 14 shows the temperature distributions at −50 °CA and TDC, and the same horizontal section as Figure 12 is used for the plotting. Overall, the temperature distribution at −50 °CA shows very limited differences among the cases, as the temperature range of the plots is 520 K to 580 K. In addition, it was found that a higher temperature in the center does not necessarily produce a fast flame propagation. For example, Cycle 14 has a relatively higher temperature in the center compared to Cycle 6, while its flame propagation is slower than Cycle 6, as shown in Figure 11 and Figure 13. This also indicates that the early flame propagation stage is less affected by the cylinder thermal condition. Instead, it is more influenced by the in-cylinder flow motions, as analyzed above.
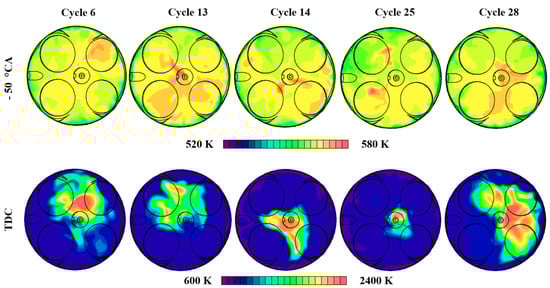
Figure 14.
Temperature distributions at −50 °CA and TDC.
However, the development of the early flame propagation stage inevitably influences the in-cylinder thermal conditions. As shown in the plots of temperature distributions at TDC, the area of the high temperature region of the two slow cycles (Cycles 14 and 25) is smaller compared to the faster cycles. As the result, the temperature of the unburnt mixture in the outer region of the slow cycles is also lower. For example, the temperature of the near-wall region of Cycles 14 and 25 is around 600 K (in purple), while the near-wall temperature is higher for Cycles 6, 13 and 28. The cylinder temperature distributions, in turn, affect the formation of auto-ignition sites. Therefore, Cycles 14 and 25 have relatively later auto-ignition timing, as indicated in both Figure 11 and Figure 13. In addition, more mixture is burned at CAT in order to trigger the auto-ignition, due to the delayed combustion event towards the expansion stroke.
4. Conclusions
In this study, LES and RANS simulations were employed to model the cyclic phenomenon of SI–CAI hybrid combustion. A detailed analysis was carried out on the in-cylinder pressure traces, IMEP, in-cylinder peak pressure (PP), peak pressure rise rate (PPRR), the crank angles with fuel mass fraction burned at 10%, 50%, 90% and mode transition to evaluate the capability of LES and RANS simulations to reproduce the cyclic variations in hybrid combustion. LES simulations were then further used to investigate and understand the observed cyclic phenomenon of SI–CAI hybrid combustion. The main conclusions can be summarized as follows.
- (1)
- The adopted LES simulation is capable of predicting the cyclic variations in hybrid combustion observed in the experiments, with strong CCVs of IMEP and very similar histogram distribution patterns. However, RANS simulations fail to reproduce the cyclic characteristics of the hybrid combustion at the chosen engine operating conditions.
- (2)
- The analysis shows the nonlinear relationship of PP/PPRR against the corresponding crank angles in the experimental results and the presence of two distinct combustion types (strong/weak cycles). The measured cyclic variation is gradually enlarged as the combustion process proceeds from CA10 to CA90.
- (3)
- The LES simulations are able to produce an excellent agreement between the predicted average PP (44.35 bar) and the COV (22.2%) and experimental observations (42.11 bar and 26.2%, respectively). The LES simulations are also able to predict the two distinct combustion types and CCVs in the PPRR-crank angle plot, and the enlarged cyclic variations from CA10 to CA90.
- (4)
- The CAT pressure, defined as the transition point where the local first order derivative of the pressure trace is at the minimum, while the second order derivative just exceeds 0.1, shows very similar results of the crank angle with 1% cells auto-ignited (CAT ignition) in LES based on autoignition cells. The distribution of CATs of the current cycle and next cycle in LES shows a very good agreement with experimental results, indicating excellent capture of the combustion mode transitioning with the LES.
- (5)
- However, the detailed comparison between the LES and experimental data also highlights the challenges of modelling the nonlinear phenomenon of SI–CAI hybrid combustion. For example, the weak cycles are not well captured with the existing LES modelling, which produce late CAT, higher average IMEP and lower COV compared to the experiments. The reasons could be the overestimation of the flame propagation speed and auto-ignition combustion speed at extreme conditions near the experimental lower limit.
- (6)
- The correlation study reveals that the local velocity magnitude (VM) around the spark plug before spark ignition timing has a large effect on the early flame propagation and CA10, while the induced thermal conditions by early flame propagation dominates the subsequent auto-ignition combustion in the late stage, as evidenced by the strong correlation between the temperatures at TDC and CA50, CA90 and CAT.
- (7)
- Visualization of the in-cylinder flow motions, flame front and auto-ignition sites in selected cycles confirms the importance of flow fields around the spark plug for determining flame kernel formation and flame development. Strong and coordinated flow fields that cross the spark plug region are found to promote the flame propagation process. Auto-ignition sites are located very close to the flame front and are dominated by the local thermal conditions.
- (8)
- The correlations and visualizations indicate that the cyclic variations in the local velocity around the spark plug lead to the variations in the early flame propagation, which in turn produces temperature fluctuations among the cycles and resulted in greater variations in the subsequent auto-ignition combustion events.
Author Contributions
Formal analysis, X.W.; Investigation, X.W.; Resources, H.Z.; Supervision, H.Z.; Writing—original draft, X.W.; Writing—review & editing, H.Z. All authors have read and agreed to the published version of the manuscript.
Funding
This work was supported by a UKRI Future Leaders Fellowship (MR/T042915/1).
Institutional Review Board Statement
Not applicable.
Informed Consent Statement
Not applicable.
Data Availability Statement
The data of this paper can be accessed from the Brunel University London data archive, figshare at https://doi.org/10.17633/rd.brunel.20076098 (accessed on 15 June 2022).
Conflicts of Interest
The authors declare no conflict of interest.
Nomenclature
| CCV | Cycle-to-cycle variations |
| SI | Spark ignition |
| CAI | Controlled auto-ignition |
| RANS | Reynolds-averaged Navier–Stokes |
| LES | Large eddy simulation |
| IMEP | Indicated mean effective pressure |
| PP | Peak pressure |
| PPRR | Peak pressure rise rate |
| SACI | Spark assisted compression ignition |
| CFD | Computational fluid dynamics |
| CA10 | Crank angle with fuel mass fraction burned at 10% |
| CA50 | Crank angle with fuel mass fraction burned at 50% |
| CA90 | Crank angle with fuel mass fraction burned at 90% |
| CAT | Crank angle with fuel mass fraction burned at mode transition |
| EGR | Exhaust gas recirculation |
| NVO | Negative valve overlapping |
| COV | Coefficient of variation |
| RGF | Residual gas fraction |
| TDC | Top dead center |
| T TDC | Average temperature at TDC |
| VM | Velocity magnitude |
References
- Robertson, D.; Prucka, R. A Review of Spark-Assisted Compression Ignition (SACI) Research in the Context of Realizing Production Control Strategies. In Proceedings of the 14th International Conference on Engines & Vehicles, Napoli, Italy, 15–19 September 2019. SAE Technical Paper 2019-24-0027. [Google Scholar]
- Wang, Z.; Wang, J.-X.; Shuai, S.-J.; Ma, Q.-J. Effects of Spark Ignition and Stratified Charge on Gasoline HCCI Combustion with Direct Injection. In Proceedings of the SAE 2005 World Congress & Exhibition, Detroit, MI, USA, 11–14 April 2005. SAE Technical Paper 2005-01-0137. [Google Scholar]
- Milovanovic, N.; Blundell, D.; Gedge, S.; Turner, J. SI-HCCI-SI Mode Transition at Different Engine Operating Conditions. In Proceedings of the SAE 2005 World Congress & Exhibition, Detroit, MI, USA, 11–14 April 2005. SAE Technical Paper 2005-01-0156. [Google Scholar]
- Santoso, H.; Matthews, J.; Cheng, W.K. Managing SI/HCCI Dual-Mode Engine Operation. In Proceedings of the SAE 2005 World Congress & Exhibition, Detroit, MI, USA, 11–14 April 2005. SAE Technical Paper 2005-01-0162. [Google Scholar]
- Manofsky, L.; Vavra, J.; Assanis, D.N.; Babajimopoulos, A. Bridging the Gap between HCCI and SI: Spark—Assisted Compression Ignition. In Proceedings of the SAE 2011 World Congress & Exhibition, Detroit, MI, USA, 12–14 April 2011. Technical Paper 2011-01-1179. [Google Scholar]
- Zhou, L.; Song, Y.; Hua, J.; Liu, F.; Wei, H. Effects of miller cycle strategies on combustion characteristics and knock resistance in a spark assisted compression ignition (SACI) engine. Energy 2020, 206, 118119. [Google Scholar] [CrossRef]
- Zhao, L.; Zhang, Y.; Pei, Y.; Zhang, A.; Traver, M.; Ameen, M. Numerical Evaluation of Spark Assisted Cold Idle Operation in a Heavy-Duty Gasoline Compression Ignition Engine. In Proceedings of the SAE WCX Digital Summit, Detroit, MI, USA, 5–7 April 2021. SAE Technical Paper 2021-01-0410. [Google Scholar]
- Ortiz-Soto, E.A.; Lavoie, G.A.; Wooldridge, M.S.; Assanis, D.N. Thermodynamic efficiency assessment of gasoline spark ignition and compression ignition operating strategies using a new multi-mode combustion model for engine system simulations. Int. J. Engine Res. 2019, 20, 304–326. [Google Scholar] [CrossRef]
- Robertson, D.; Prucka, R. Evaluation of control-oriented flame propagation models for production control of a spark-assisted compression ignition engine. Proc. Inst. Mech. Eng. Part D J. Automob. Eng. 2021, 236, 334–342. [Google Scholar] [CrossRef]
- Adcock, I. Mazda’s Skyactiv-X beats the big guys to market with a promising new production engine that marries Otto and Diesel attributes. Automot. Eng. Int. 2017, 24–26. [Google Scholar]
- Mazda Skyactiv-X Technology. Available online: https://www.mazda.com/en/innovation/technology/skyactiv (accessed on 24 February 2022).
- Sen, A.; Litak, G.; Edwards, K.; Finney, C.; Daw, C.; Wagner, R. Characteristics of cyclic heat release variability in the transition from spark ignition to HCCI in a gasoline engine. Appl. Energy 2012, 88, 1649–1655. [Google Scholar] [CrossRef]
- Temel, V.K.; Sterniak, J. Characterization of SACI Combustion for Use in Model Based Controls. In Proceedings of the SAE 2014 World Congress & Exhibition, Detroit, MI, USA, 8–10 April 2014. SAE Technical Paper 2014-01-1289. [Google Scholar]
- Havstad, M.A.; Aceves, S.; McNenly, M.J.; Piggott, W.T.; Edwards, K.D.; Wagner, R.; Daw, C.S.; Finney, C.E.A. Detailed Chemical Kinetic Modeling of Iso-octane SI-HCCI Transition. In Proceedings of the Society of Automotive Engineers 2010 World Conference, Detroit, MI, USA, 13–15 April 2010. SAE Technical Paper 2010-01-1087. [Google Scholar]
- Larimore, J.; Hellström, E.; Sterniak, J.; Jiang, L.; Stefanopoulou, A.G. Experiments and Analysis of High Cyclic Variability at the Operational Limits of Spark-Assisted HCCI Combustion. In American Control Conference (ACC) 2012; IEEE: Piscataway, NJ, USA, 2012; pp. 2072–2077. [Google Scholar]
- Wagner, R.; Edwards, K.D.; Daw, C.S.; Green, J.B.; Bunting, B.G. On the Nature of Cyclic Dispersion in Spark Assisted HCCI Combustion. In Proceedings of the 2006 SAE World Congress, Detroit, MI, USA, 3–6 April 2006. SAE Technical Paper 2006-01-0418. [Google Scholar]
- Daw, C.S.; Wagner, R.M.; Edwards, K.D.; Green, J.B. Understanding the transition between conventional spark-ignited combustion and HCCI in a gasoline engine. Proc. Combust. Inst. 2007, 31, 2887–2894. [Google Scholar]
- Hunicz, J. Cycle-by-cycle variations in autonomous and spark assisted homogeneous charge compression ignition combustion of stoichiometric air–fuel mixture. Int. J. Spray Combust. Dyn. 2018, 10, 231–243. [Google Scholar] [CrossRef]
- Hunicz, J.; Mikulski, M.; Koszałka, G.; Ignaciuk, P. Detailed analysis of combustion stability in a spark-assisted compression ignition engine under nearly stoichiometric and heavy EGR conditions. Appl. Energy 2020, 280, 115955. [Google Scholar] [CrossRef]
- Triantopoulos, V.; Bohac, S.V.; Sterniak, J.; Lavoie, G.; Boehman, A.L.; Assanis, D.N.; Martz, J.B. Cycle-to-cycle variability in spark-assisted compression ignition engines near optimal mean combustion phasing. Int. J. Engine Res. 2021, 14680874211053061. [Google Scholar] [CrossRef]
- Chen, T.; Xie, H.; Li, L.; Yu, W.; Li, Z.; Zhao, H. Continuous Load Adjustment Strategy of a Gasoline HCCI-SI Engine Fully Controlled by Exhaust Gas. In Proceedings of the SAE 2011 World Congress & Exhibition, Detroit, MI, USA, 12–14 April 2011. SAE Technical Paper 2011-01-1408. [Google Scholar]
- Joelsson, T.; Yu, R.; Bai, X.S. Large eddy simulation of turbulent combustion in a spark-assisted homogenous charge compression ignition engine. Combust. Sci. Technol. 2012, 184, 1051–1065. [Google Scholar] [CrossRef] [Green Version]
- Yoo, C.S.; Luo, Z.; Lu, T.; Kim, H.-J.; Chen, J.H. A DNS study of ignition characteristics of a lean iso-octane/air mixture under HCCI and SACI conditions. Proc. Combust. Inst. 2013, 34, 2985–2993. [Google Scholar] [CrossRef]
- Wang, X.; Xie, H.; Zhao, H. Computational study of the influence of in-cylinder flow on spark ignition–controlled auto-ignition hybrid combustion in a gasoline engine. Int. J. Engine Res. 2015, 16, 795–809. [Google Scholar] [CrossRef]
- Wang, X.; Zhao, H.; Xie, H. Effect of dilution strategies and direct injection ratios on Stratified Flame Ignition (SFI) hybrid combustion in a PFI/DI gasoline engine. Appl. Energy 2016, 165, 801–814. [Google Scholar] [CrossRef]
- Wang, X.; Xie, H.; Li, L.; Xie, L.; Chen, T.; Zhao, H. Effect of the thermal stratification on SI-CAI hybrid combustion in a gasoline engine. Appl. Therm. Eng. 2013, 61, 451–460. [Google Scholar] [CrossRef]
- Wang, X.; Xie, H.; Xie, L.; Zhang, L.; Li, L.; Chen, T.; Zhao, H. Numerical simulation and validation of SI-CAI hybrid combustion in a CAI/HCCI gasoline engine. Combust. Theory Model. 2013, 17, 142–166. [Google Scholar] [CrossRef]
- Wang, X.; Zhao, H. Multi-cycle large eddy simulation (LES) of the cycle-to-cycle variation (CCV) of spark ignition (SI) - controlled auto-ignition (CAI) hybrid combustion in a gasoline engine. In Proceedings of the International Powertrains, Fuels & Lubricants Meeting, Beijing, China, 16–19 October 2017. SAE Technical Paper 2017-01-2261. [Google Scholar]
- Han, Z.; Reitz, R.D. Turbulence Modeling of Internal Combustion Engines Using RNG κ-ε Models. Combust. Sci. Technol. 1995, 106, 267–295. [Google Scholar] [CrossRef]
- Colin, O.; Benkenida, A. The 3-zones extended coherent flame model (ECFM3Z) for computing premixed/diffusion combustion. Oil Gas Sci. Technol. 2004, 59, 593–609. [Google Scholar] [CrossRef]
- CRUZ, A.P.D. Three-dimensional modeling of self-ignition in HCCI and conventional diesel engines. Combust. Sci. Technol. 2004, 176, 867–887. [Google Scholar] [CrossRef]
- Mehl, M.; Chen, J.Y.; Pitz, W.J.; Sarathy, S.M.; Westbrook, C.K. An approach for formulating surrogates for gasoline with application towards a reduced surrogate mechanism for CFD engine modeling. Energy Fuels 2011, 25, 5215–5223. [Google Scholar] [CrossRef]
- CD-Adapco. STAR Methodology; STAR-CD VERSION 4.22; CD-Adapco: Melville, NY, USA, 2014. [Google Scholar]
- Speziale, C.G. Analytical methods for the development of Reynolds-stress closures in turbulence. Annu. Rev. Fluid Mech. 1991, 23, 107–157. [Google Scholar] [CrossRef]
- Li, W.; Li, Y.; Wang, T.; Jia, M.; Che, Z.; Liu, D. Investigation of the effect of the in-cylinder tumble motion on cycle-to-cycle variations in a direct injection spark ignition (DISI) engine using large eddy simulation (LES). Flow Turbul. Combust. 2016, 98, 1–31. [Google Scholar] [CrossRef]
- Kaario, O.T.; Vuorinen, V.; Kahila, H.; Im, H.G.; Larmi, M. The effect of fuel on high velocity evaporating fuel sprays: Large-Eddy simulation of Spray A with various fuels. Int. J. Engine Res. 2020, 21, 26–42. [Google Scholar] [CrossRef] [Green Version]
- Koch, J.; Schürch, C.; Wright, Y.M.; Boulouchos, K. Reactive computational fluid dynamics modelling methane–hydrogen admixtures in internal combustion engines part II: Large eddy simulation. Int. J. Engine Res. 2020, 22, 146808742091034. [Google Scholar] [CrossRef]
- Vermorel, O.; Richard, S.; Colin, O.; Angelberger, C.; Benkenida, A.; Veynante, D. Towards the understanding of cyclic variability in a spark ignited engine using multi-cycle LES. Combust. Flame 2009, 156, 1525–1541. [Google Scholar] [CrossRef]
- Colin, O.; Ducros, F.; Veynante, D.; Poinsot, T. A thickened flame model for large eddy simulations of turbulent premixed combustion. Phys. Fluids 2000, 12, 1843–1863. [Google Scholar] [CrossRef]
- Richard, S.; Colin, O.; Vermorel, O.; Benkenida, A.; Angelberger, C.; Veynante, D. Towards large eddy simulation of combustion in spark ignition engines. Proc. Combust. Inst. 2007, 31, 3059–3066. [Google Scholar] [CrossRef]
- Pope, S.B. Ten questions concerning the large-eddy simulation of turbulent flows. New J. Phys. 2004, 6, 35. [Google Scholar] [CrossRef] [Green Version]
- Chen, T.; Zhao, H.; Xie, H.; He, B. Analysis of cyclic variations during mode switching between spark ignition and controlled auto-ignition combustion operations. Int. J. Engine Res. 2015, 16, 356–365. [Google Scholar] [CrossRef]
- Duan, X.; Liu, J.; Yuan, Z.; Guo, G.; Liu, Q.; Tang, Q.; Deng, B.; Guan, J. Experimental investigation of the effects of injection strategies on cycle-to-cycle variations of a DISI engine fueled with ethanol and gasoline blend. Energy 2018, 165, 455–470. [Google Scholar] [CrossRef]


Publisher’s Note: MDPI stays neutral with regard to jurisdictional claims in published maps and institutional affiliations. |
© 2022 by the authors. Licensee MDPI, Basel, Switzerland. This article is an open access article distributed under the terms and conditions of the Creative Commons Attribution (CC BY) license (https://creativecommons.org/licenses/by/4.0/).