Article

Simulative Study to Reduce DC-Link Capacitor of Drive Train for Electric Vehicles

by
Osama Majeed Butt
1,2,
Tallal Majeed Butt
3,
Muhammad Husnain Ashfaq
2,
Muhammad Talha
2,
Siti Rohani Sheikh Raihan
2 and
Muhammad Majid Hussain
4,*
1
Institute of Electrical, Electronics and Computer Engineering, University of the Punjab, Lahore 54590, Pakistan
2
UM Power Energy Dedicated Advanced Centre (UMPEDAC), University of Malaya, Kuala Lumpur 59100, Malaysia
3
My-PV GmbH, Teichstrasse 43, A-4523 Neuzeug, Austria
4
Department of Electrical and Electronic Engineering, University of South Wales, Pontypirdd CF37 1DL, UK
*
Author to whom correspondence should be addressed.
Energies 2022, 15(12), 4499; https://doi.org/10.3390/en15124499
Submission received: 13 April 2022 / Revised: 11 June 2022 / Accepted: 17 June 2022 / Published: 20 June 2022

Abstract

:
E-mobility is an emerging means of transportation, mainly due to the environmental impact of petroleum-based fuel vehicles and oil prices’ peak. However, electric vehicles face several challenges by the nature of technology. Consequently, electric vehicles have a limited travel range and are extremely heavy. In this research, an investigation is carried out on different measures to reduce the DC-link capacitor size in the drive train of an electric vehicle. The investigation is based on software simulations. The DC-link capacitor must be dimensioned with regards to relevant points of operation, which are defined by the rotation speed and torque of the motor as well as the available DC-link voltage. This also includes the field-oriented control (FOC). In order to optimally operate a three-phase inverter in the electric drive train, a suitable type and sizing of the capacitor was studied based on mathematical equations and simulations. Two measures were examined in this study: firstly, an auxiliary passive notch filter introduced in the electric drive train circuit is explored. Based on this measure, an advanced modulation scheme exploiting the control of individual currents within segmented windings of the PMSM is investigated in detail. It was seen that saw-tooth carrier modulation used in the parallel three-phase inverter is found to reduce DC-link capacitor size in the electric drive train circuit by 70%.

1. Introduction

Reduction of carbon emission is always a challenge for researchers. According to the union of concerned scientists’, between 1988 and 2016, more carbon dioxide emissions were produced globally than between the dawn of the industrial revolution and the year 1988 [1]. This marks a worrying trend in the CO2-emissions with regards to climate protection. In the late 20th century, a realization on the global scale was achieved, and initial environment-friendly policies were set up. For this reason, the United Nations Framework Convention on Climate Change (UNFCCC) and the European Environmental Agency (EEA) were established to provide necessary guidelines for emission-free growth and development [2].
Under the pro-environment policies by European Union (EU-28) the carbon emissions of industrial, energy production units, agriculture, commercial, and residential sectors have been showing a downward trend since 1990 [3]. However, the transport sector has had an upward carbon emission trend, which is alarming for the environment. A significant chunk of carbon emission is produced by the transportation sector, and to achieve the 95% reduction in emissions by 2050, considerable aim was taken after the 2015 Paris climate conference. According to the statistics collected by the EEA, road transportation generates the most carbon emission among other modes of transport. Among road transportation, light vehicles are a leading contributor to carbon emissions. This sector obtains most of its energy from the combustion of petroleum-based fuels and is currently responsible for over half of global oil demand (IEA, 2012). Furthermore, this energy use is projected to increase with the growth of vehicles in both developed and developing countries. As a result, greenhouse gas emissions from transportation, mostly in the form of CO2, will likely increase. This implies that the current transportation system is unsustainable, and tackling this sector can lead to a significant reduction in emissions [4].
Several types of research and development projects have been initiated to develop sustainable transport, resulting in several innovations. One of the critical innovations in the transport sector is the introduction of electric vehicles. Although the concept of an electric vehicle was already introduced in the early 1900s, they were reintroduced recently due to concerns over greenhouse gas emissions from transportation and the associated climate change. Secondly, the volatility of oil prices is causing nations to focus on alternative sources of energy. Finally, concerns over energy independence have resulted in policies supportive of electric vehicles.
This support has reflected an increase in funding to support the growth of technology [5]. Since 2011, several car manufacturers have launched different variants of pure electric vehicles in the consumer market, for example, the Tesla Model S and Nissan Leaf. Consequently, E-mobility has seen growth, and the market share of electric vehicles is increasing in comparison to the combustion engine vehicle, as depicted in Figure 1.
An electric power train of an electric vehicle usually consists of an electric motor, an inverter, a DC-link, and a battery [7]. The electric motor installed in a battery electric vehicle (BEV) is usually either a synchronous or an asynchronous three-phase motor. The electric motor has the task to transform the electric energy provided by the inverter into mechanical energy to generate a torque that propels the vehicle [8]. The electric drive train of EVs consists of the components shown in Figure 2. However, the focus of this study is towards the sizing of the DC-link capacitor. To transmit the energy from the battery to the electric motor, an inverter is needed. An inverter generates a three-phase AC-voltage from the DC-link voltage provided by the battery. A two-level three-phase inverter consists of three half-bridges and is therefore made up of six individually controlled power switches. The structure of an electric drive train containing a three-phase inverter and a permanent magnet synchronous motor (PMSM) is depicted in Figure 2.
Between the traction battery and the inverter, a DC-link capacitor is needed to take over the ripple currents from the battery and to provide a stable DC-link-voltage with a small voltage ripple. The battery voltage varies between 560 and 850 V depending on the state of charge. This leads to a variable DC-link voltage, which needs to be considered for the PWM generation. A DC-link capacitor is an essential component within an AC-DC or a DC-AC converter. They contribute largely to the weight, size, performance, and price of an inverter. The demand to reduce the size of bulky components is increasing as technology is further developing [9]. In this scenario, if an underrated capacitor is used, it would not be able to handle a surge or a spike. Similarly, if the capacitor is oversized, it will occupy more space, exhibit a higher weight, generate higher losses, and shorten the lifetime of the motor. Therefore, the rating of the DC-link capacitor must be determined considering a number of parameters. Sizing of the DC-link capacitor is investigated in this study in order to reduce the size of the capacitor, which eventually reduces the weight of the whole power train.
Sometimes, an additional DC-DC converter can be used to connect the battery to the DC-link [10]. A DC-DC converter would provide galvanic isolation between the battery and the DC-link capacitor while improving the utilization of the drive train by providing a constant voltage level in the DC-link. In contrast, if the DC-link is directly connected to the battery, the DC-link voltage scales, with regards to the state of charge of the battery as well as excluding the DC-DC converter, saves additional space and weight in the power electronics module [11].
In electric vehicle (EV) applications, DC-link capacitors help offset the effects of inductance in inverters, motor controllers, and battery systems. They also serve as filters that protect EV subsystems from voltage spikes, surges, and electromagnetic interference (EMI). For EV’s drive systems, sizing and selection of DC-link capacitors involve tradeoffs among system performance, including lifetime, reliability, cost, and power density. This study comprises of two different simulation techniques to minimize the DC-link capacitor. Firstly, a notch filter was added and simulated, while for the second technique, change in modulation was carried out by triangular carrier and saw-tooth carrier. Contrarily, the passive notch filter influences the I c , R M S effectively in the nominal operation region, but the percentage of reduction is low in correspondence to the carrier modulation technique, especially the saw-tooth carrier. Filter components require additional space and increase transmission losses.
The rest of the paper is organized as follows: Section 2 examines simulation modelling strategy for optimal sizing capacitor and related work in depth, while Section 3 present the results and analysis and discussion. Finally, Section 4 presents the conclusions and future implications.

2. Simulative Modelling Strategy

The primary purpose of the DC-link capacitor is to provide a stable DC voltage [12]. A DC-link capacitor acts as a filter that decouples the AC and DC sides of the circuit, filtering out momentary voltage spikes, surges, and EMI. The circuit in Figure 3 shows that the DC-link capacitor is a vital component of the electric drive train. The input is taken from the battery VDC (DC voltages) and through the parallel capacitor, which is then inverted by an active B6-switching scheme and supplied to the motor.
The simulation model is built up in MATLAB Simulink and PLECS as shown in Figure 4. The electric components, such as the battery, the inverter, the DC-link capacitor, and the PMSM, are simulated in PLECS, while the control loop and the modulation are simulated in MATLAB Simulink. This approach provides a high degree of flexibility when different modulation schemes need to be evaluated. These schemes are shown as Scheme 1 and Scheme 2 in Figure 4.
From the literature study [13], it was found that the current entering a DC-link capacitor influences the size. A mathematical relation is used in which different parameters are included. The input current I i n is the sum of the inverter current I i n v and DC-link capacitor current I c a p , as shown in Figure 3. The root mean square (RMS) current of the DC-link capacitor I C , R M S can be calculated with Equation (1) [14]. It can be observed that the modulation index m , the power factor cos φ , and the inverter output current I i n v , R M S affect the RMS current I R M S in the DC-link capacitor. In particular, the RMS current is not dependent on the switching frequency. Increasing the switching frequency, therefore, cannot contribute to the reduction of the RMS current through the capacitor.
I C , R M S = I i n v , R M S [ 2 m { 3 4 π + ( 3 π 9 M 16 ) cos φ 2 } ]
The capacitance is designed to limit the voltage ripple in the DC-link and to reduce the ripple current in the battery. For this study, the ripple voltage must be reduced to a peak-to-peak value of 16 V, and the battery current ripple must not exceed 10% of the current drawn from the battery in the nominal point of operation. In the literature, different approaches exist to determine the size of the DC-link capacitor. For example, according to [15], the following Equation (2) can be used to calculate the minimal capacitance:
C D C l i n k = I c , R M S V R i p p l e 2 π f s w
The ripple current is also a key parameter when selecting a capacitor. In addition to the RMS current, it also contributes to the power dissipation and the temperature increase in the capacitor. Furthermore, the ripple current directly influences the voltage ripple in case of a high ESR of the capacitor.
For a three-phase two-level inverter, eight possible switching states can be defined, which are denoted V0 to V7 and summarized in Table 1. These switching states can be visualized with space vectors that form a hexagon as depicted in Figure 5. The hexagon is divided into six triangular sectors, each formed by two adjacent active vectors and two zero vectors. By controlling the time period of each state, an arbitrary space vector can be generated. The reference voltage during switching is assumed to be constant, as the time period would be shallow. SVPWM concept is derived from the Clarke(αβ) transformation, which will be discussed in the field-oriented control section. The three-phase sinusoidal voltage component of the stationary reference frame v a ,   v b , and v c is converted to the input voltages V α and V β of SVPWM as shown in Equation (3) [16].
[ V α V β ] = v D C 3   [ 2 1 1 0 3 3 ] [ v a v b v c ]
From the input voltages of SVPWM in Equation (3), the amplitude and the phase angle of the reference voltage can be calculated:
θ = tan 1 ( V β V α )
v r e f = V α 2 + V β 2
A six-step switching pattern is used for three-phase legs of the inverter to generate a complete cycle of three-phase voltages.
m = V 1 , r e f ( V D C 2 )
V 1 , S V P W M = V D C 3
The phase legs have two states, namely 0 for OFF or 1 for ON, so there are 23 = 8 switching states for inverter (V0–V7). Out of eight, six are the active states. Each state vector is spaced with a phase shift of 60° and an equal magnitude of 2 3 v D C as seen in the hexagon. The modulation index m is defined as a ratio between the amplitude of reference voltage vector V 1 , r e f and half of the DC-link voltage value [18].
Using the space vector PWM, a modulation index of m = 1.15 or 2 3 can be achieved, which leads to optimal utilization of the DC-link voltage in the inverter. A comparison in Figure 6 is made between two types of peak fundamental voltage; SVPWM enhances the performance with a bigger fundamental amplitude.
When sinusoidal modulation is used, better utilization of the DC-link voltage can be achieved by using the third-harmonic injection. Sinusoidal PWM with third-harmonic injection is identical to the SVPWM. Adding a third harmonic to the sinusoidal voltage waveform reduces its peak to peak value by a factor of 2 3     , while the phase voltages and currents in the motor windings remain unchanged. This allows the fundamental wave component to increase the allowable peak, which can be seen in the example below in Figure 7. This saddle-like shape increases DC bus voltage utilization and decreases the total harmonic distortion (THD) [19].

2.1. Mathematical Modelling

The behavior of a three-phase machine is comprehensively described by the phase voltages, currents, and the flux linkage. The mathematical model of the motor becomes complex, as these time-varying values are continuously changing due to the relative motion. In order to analyze the electric machines, mathematical transformations are often used by fixing variables to a common reference frame. Among those transformations are:
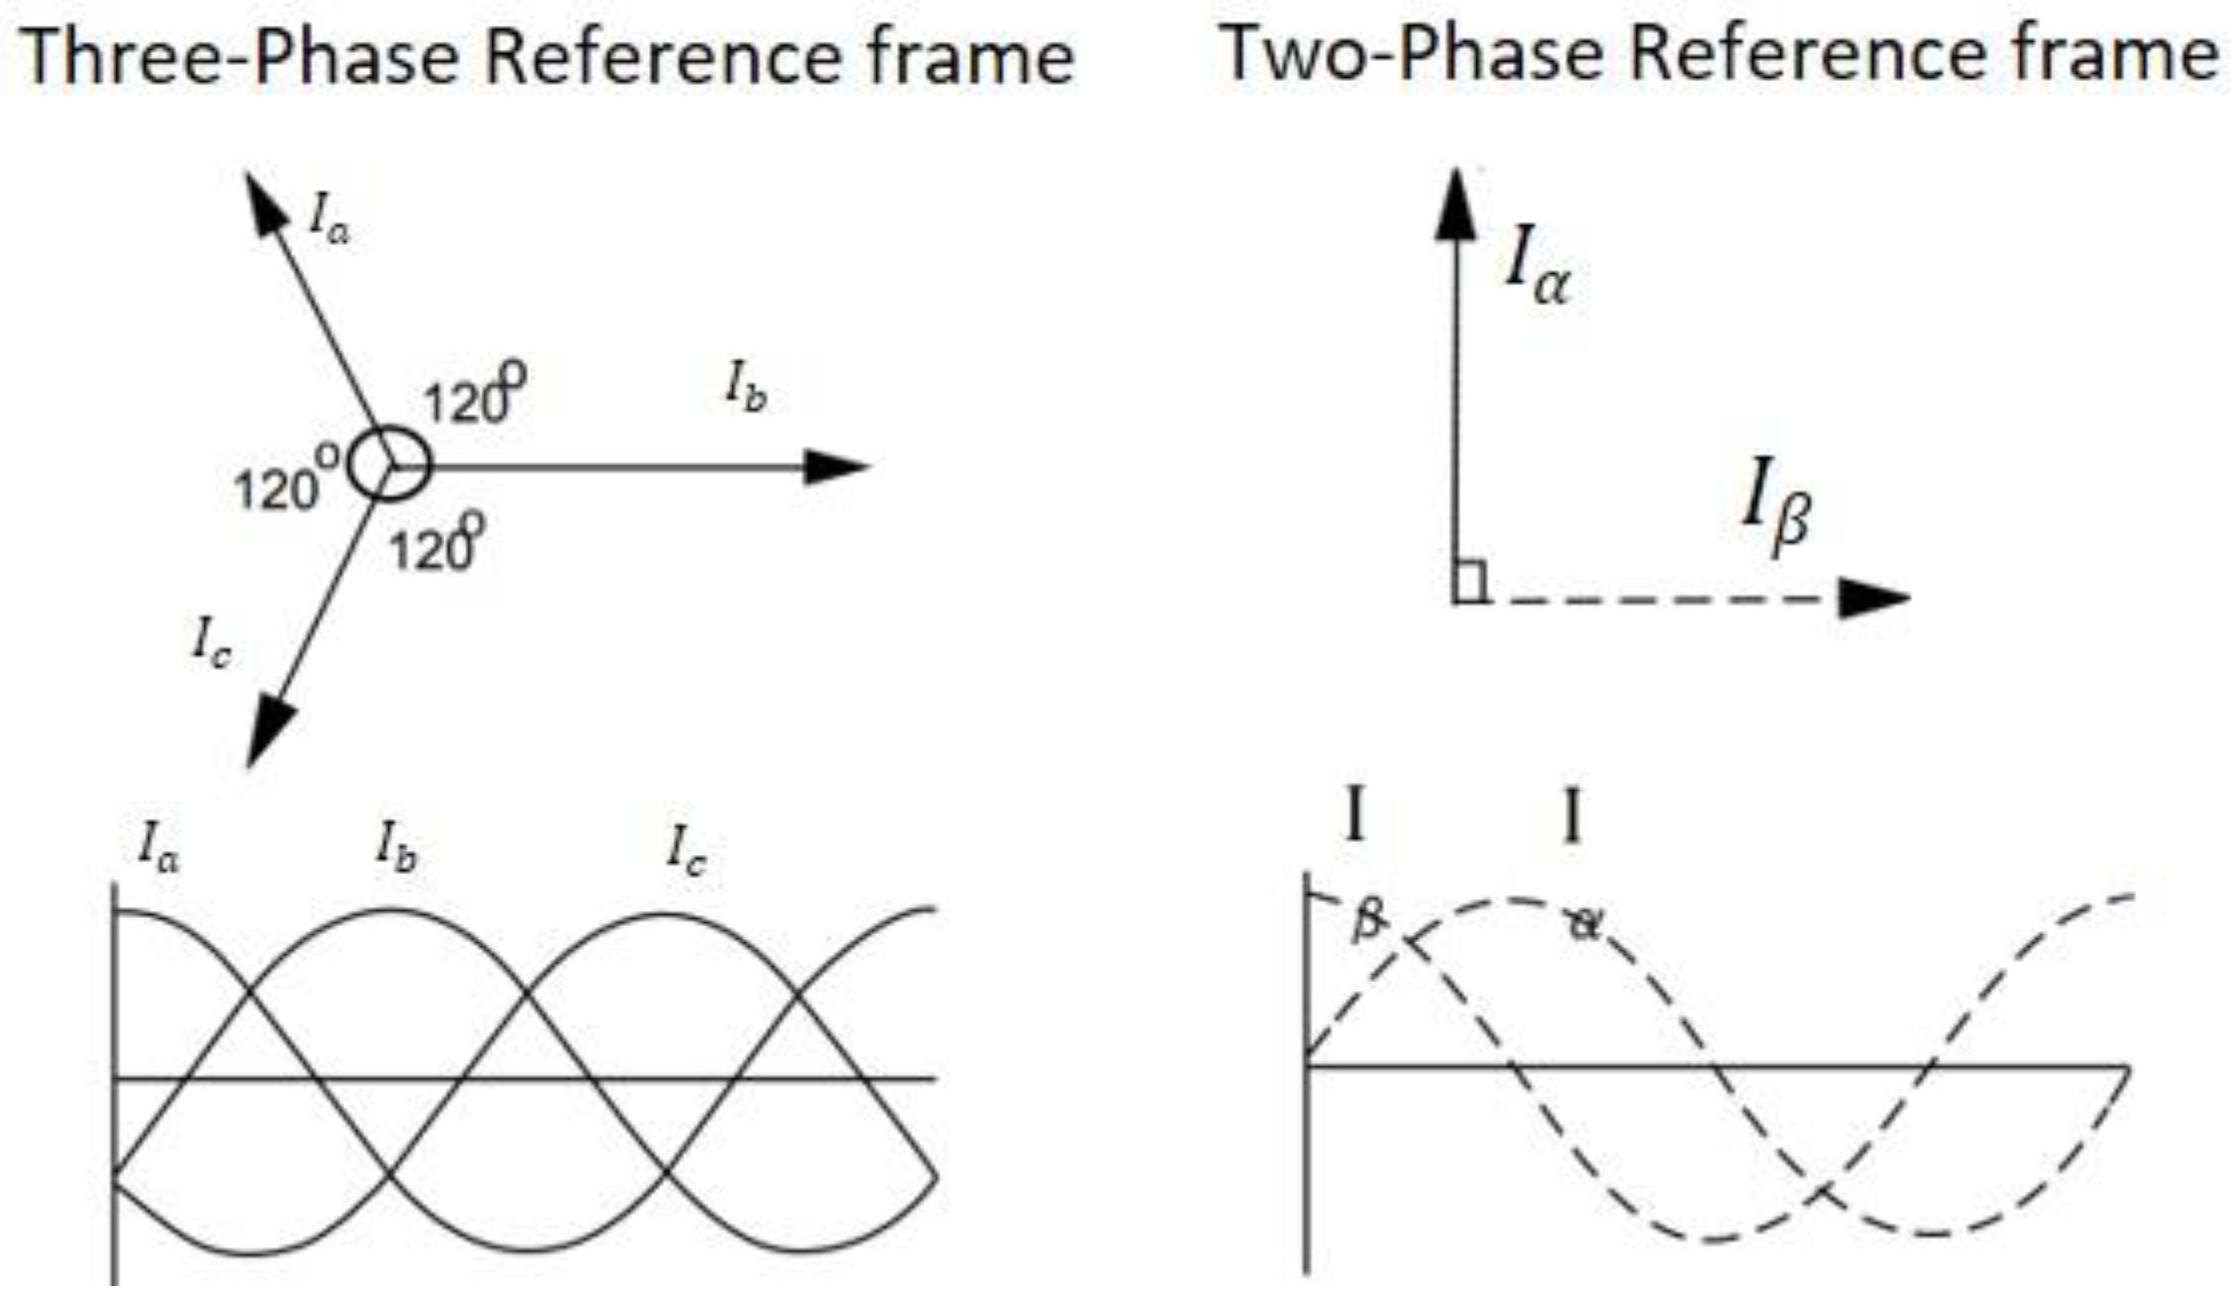
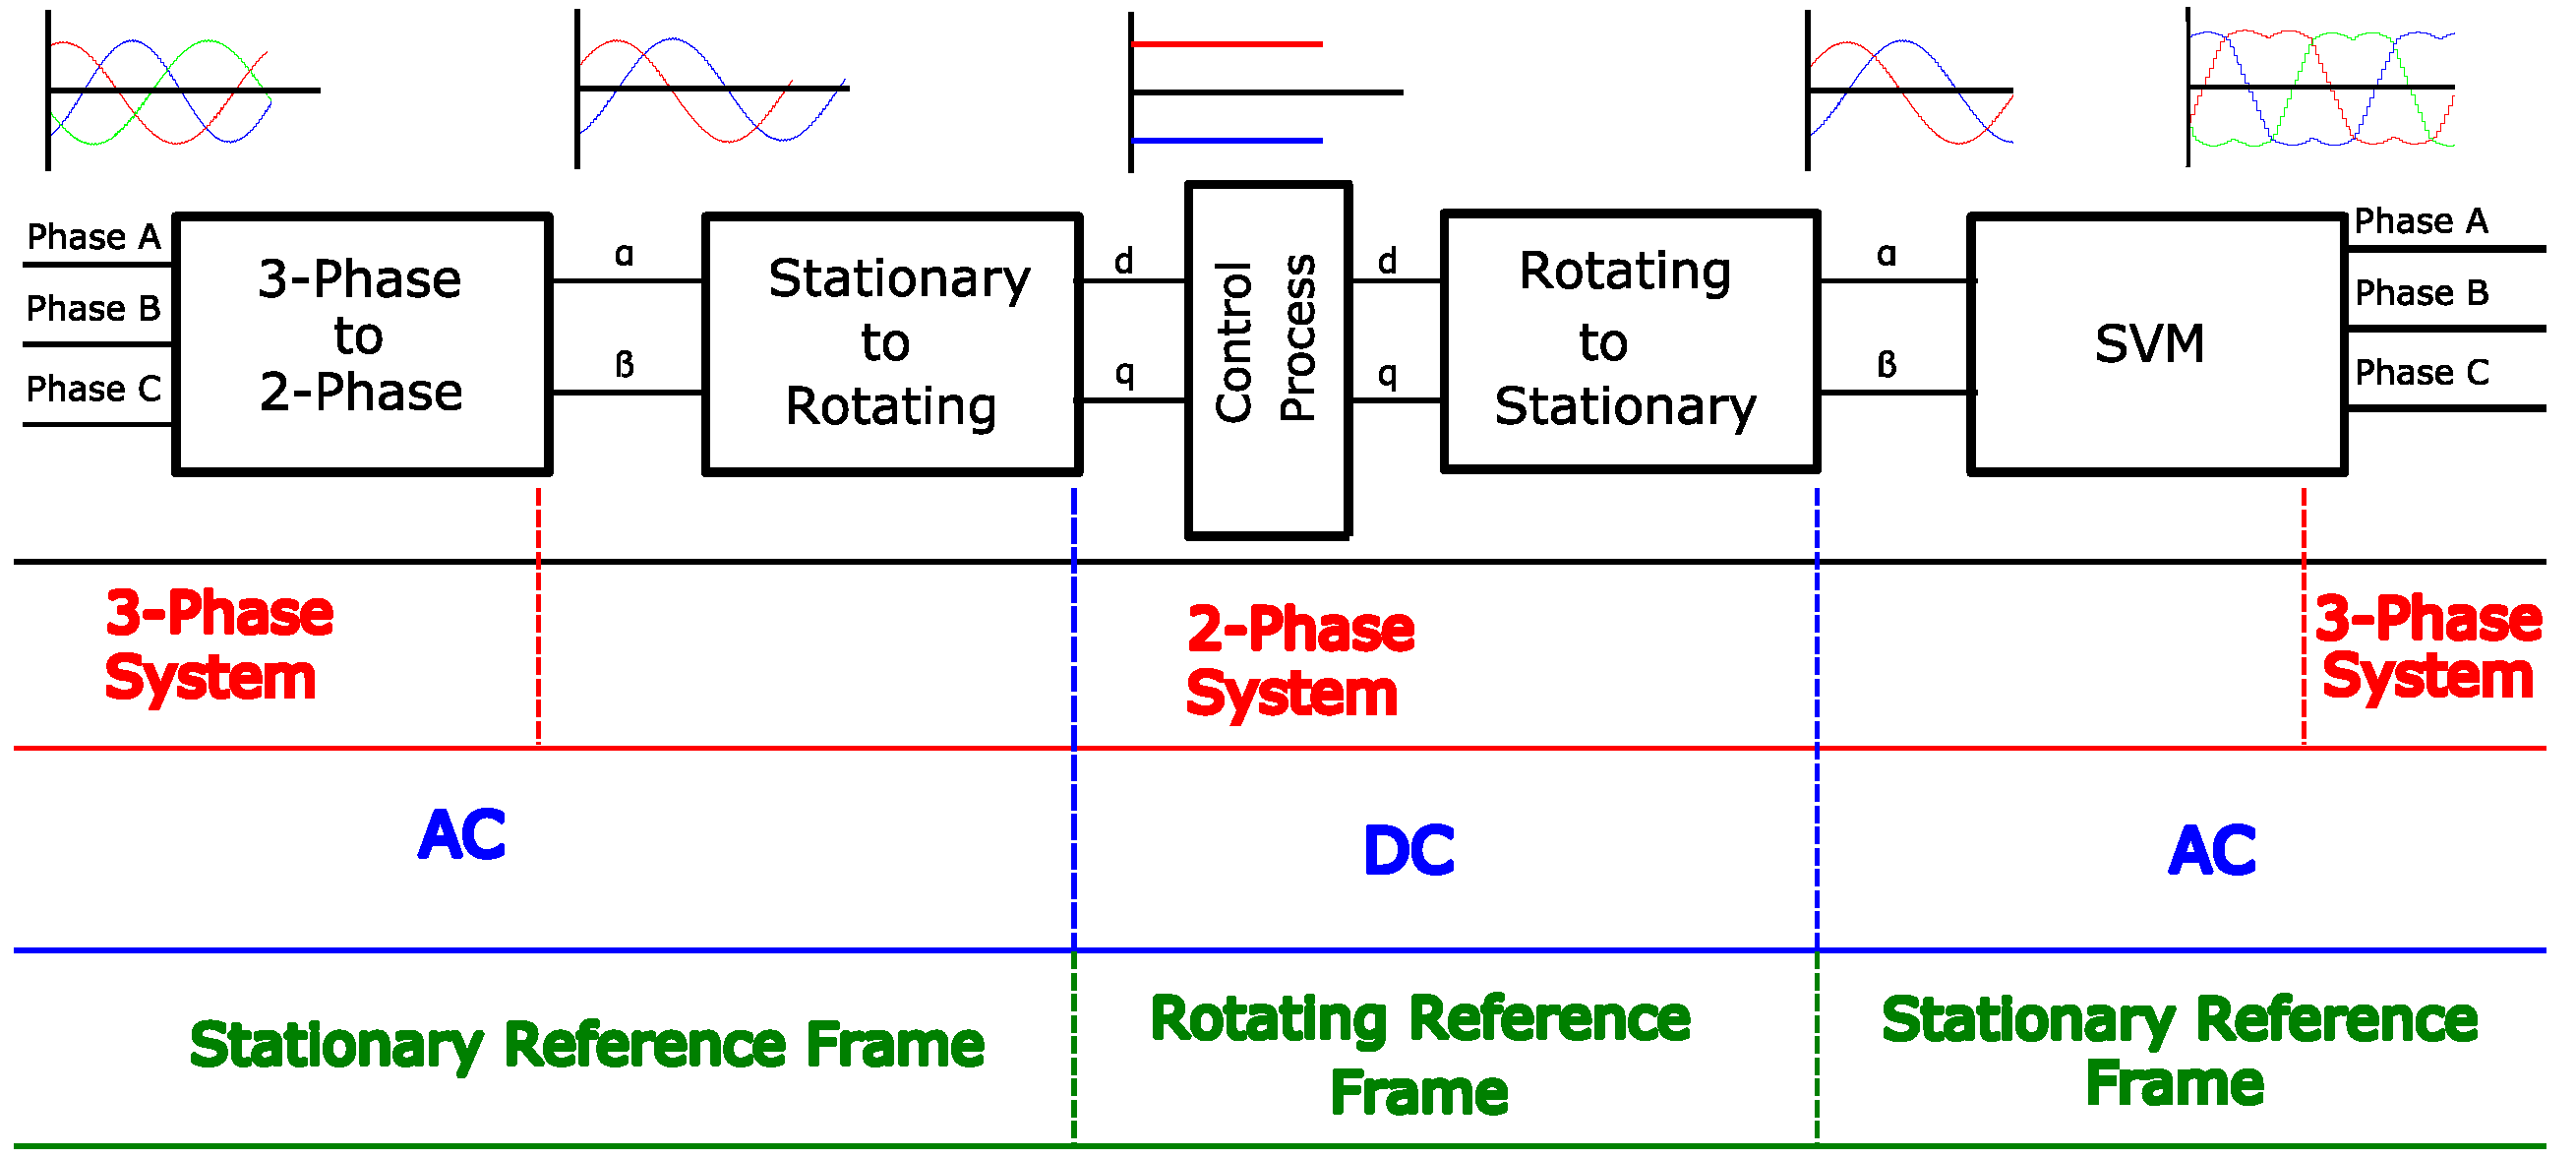
  • Clarke Transformation;
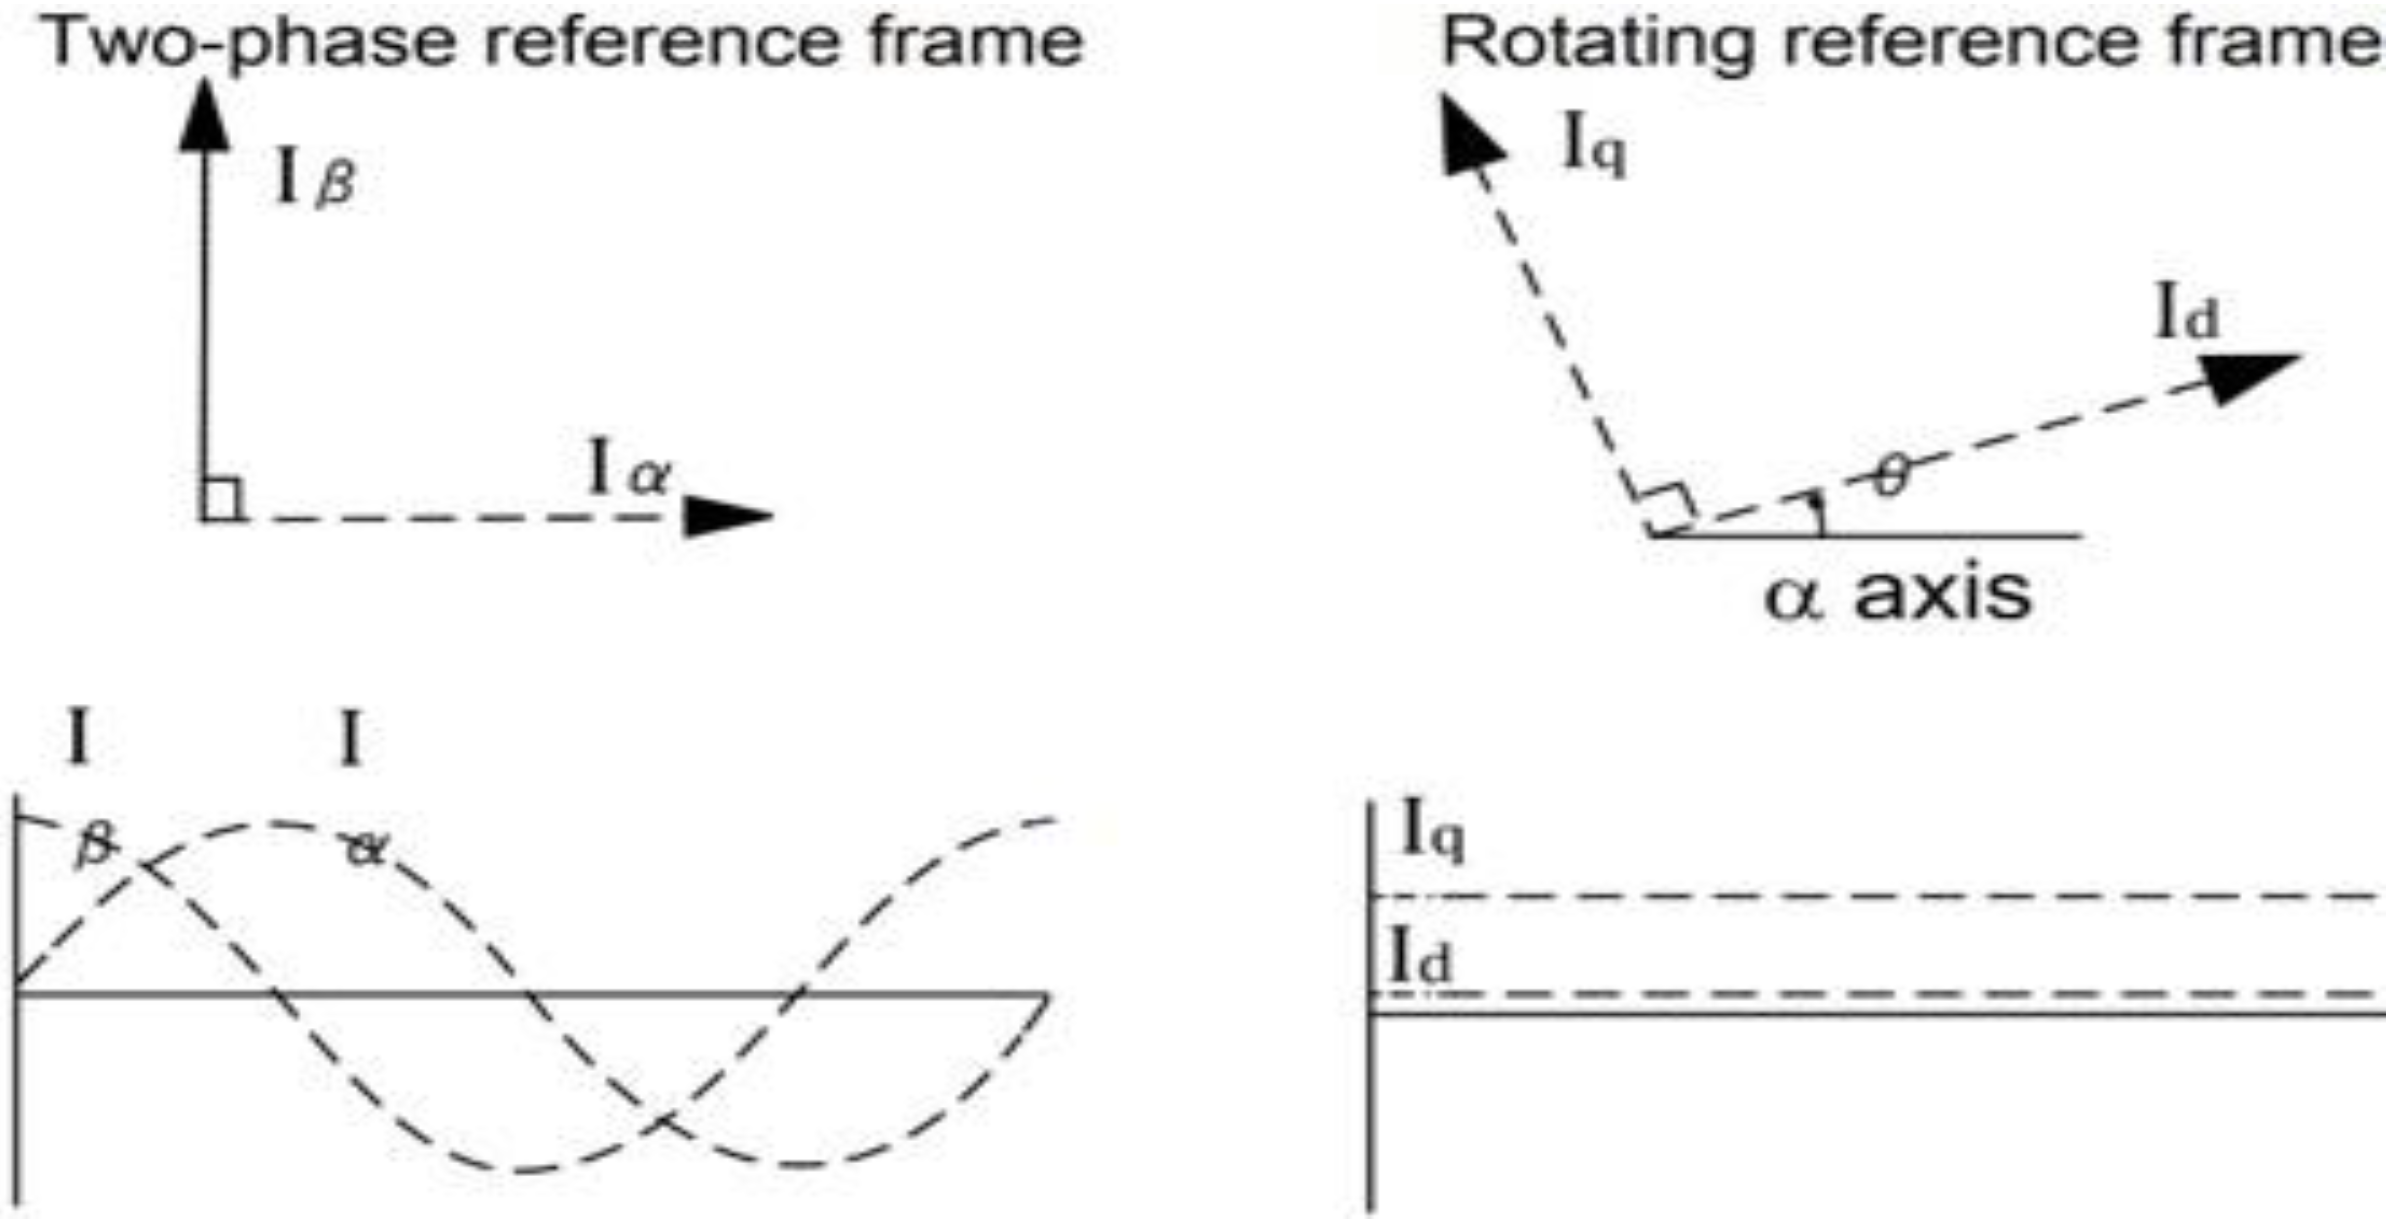
  • Park Transformation.

2.1.1. Clarke Transformation

The Clarke transformation converts the time-domain components of the three-phase system in a a b c -reference frame to the stationary α β 0 -reference frame of the two-dimension coordinate system. The transformation is depicted in Figure 8. In an electric machine, this coordinate system is fixed on the stator. Therefore, it is also known as the stator coordinate system.
[ I α I β ] = 2 3 [ 1 1 2 1 2 0 3 2 3 2 ] [ I a I b I c ]
Here,   I a , I b , and I c are the three-phase quantities, whereas the corresponding I α and I β are in the stationary orthogonal reference frame to which the β -axis leads the α -axis. The counter transformation of the α β -reference system is known as the inverse Clarke transformation.

2.1.2. Park Transformation

In this transformation, the two-axis orthogonal static reference frame quantities are converted into a rotating reference frame as depicted in Figure 9. The DQ-coordinate system rotates around the same coordinate origin. The DQ expression of space vectors in Equation (9) is a rotation transformation from the result of the Clarke transformation. In the orthogonal rotating reference frame, I d is at reference angle θ to the α -axis, and I q is perpendicular to I d along the q-axis. Similarly, the counter system for DQ reference is called inverse park transformation.
[ I d I q ] = [ cos θ sin θ sin θ cos θ ] [ I α I ß ]

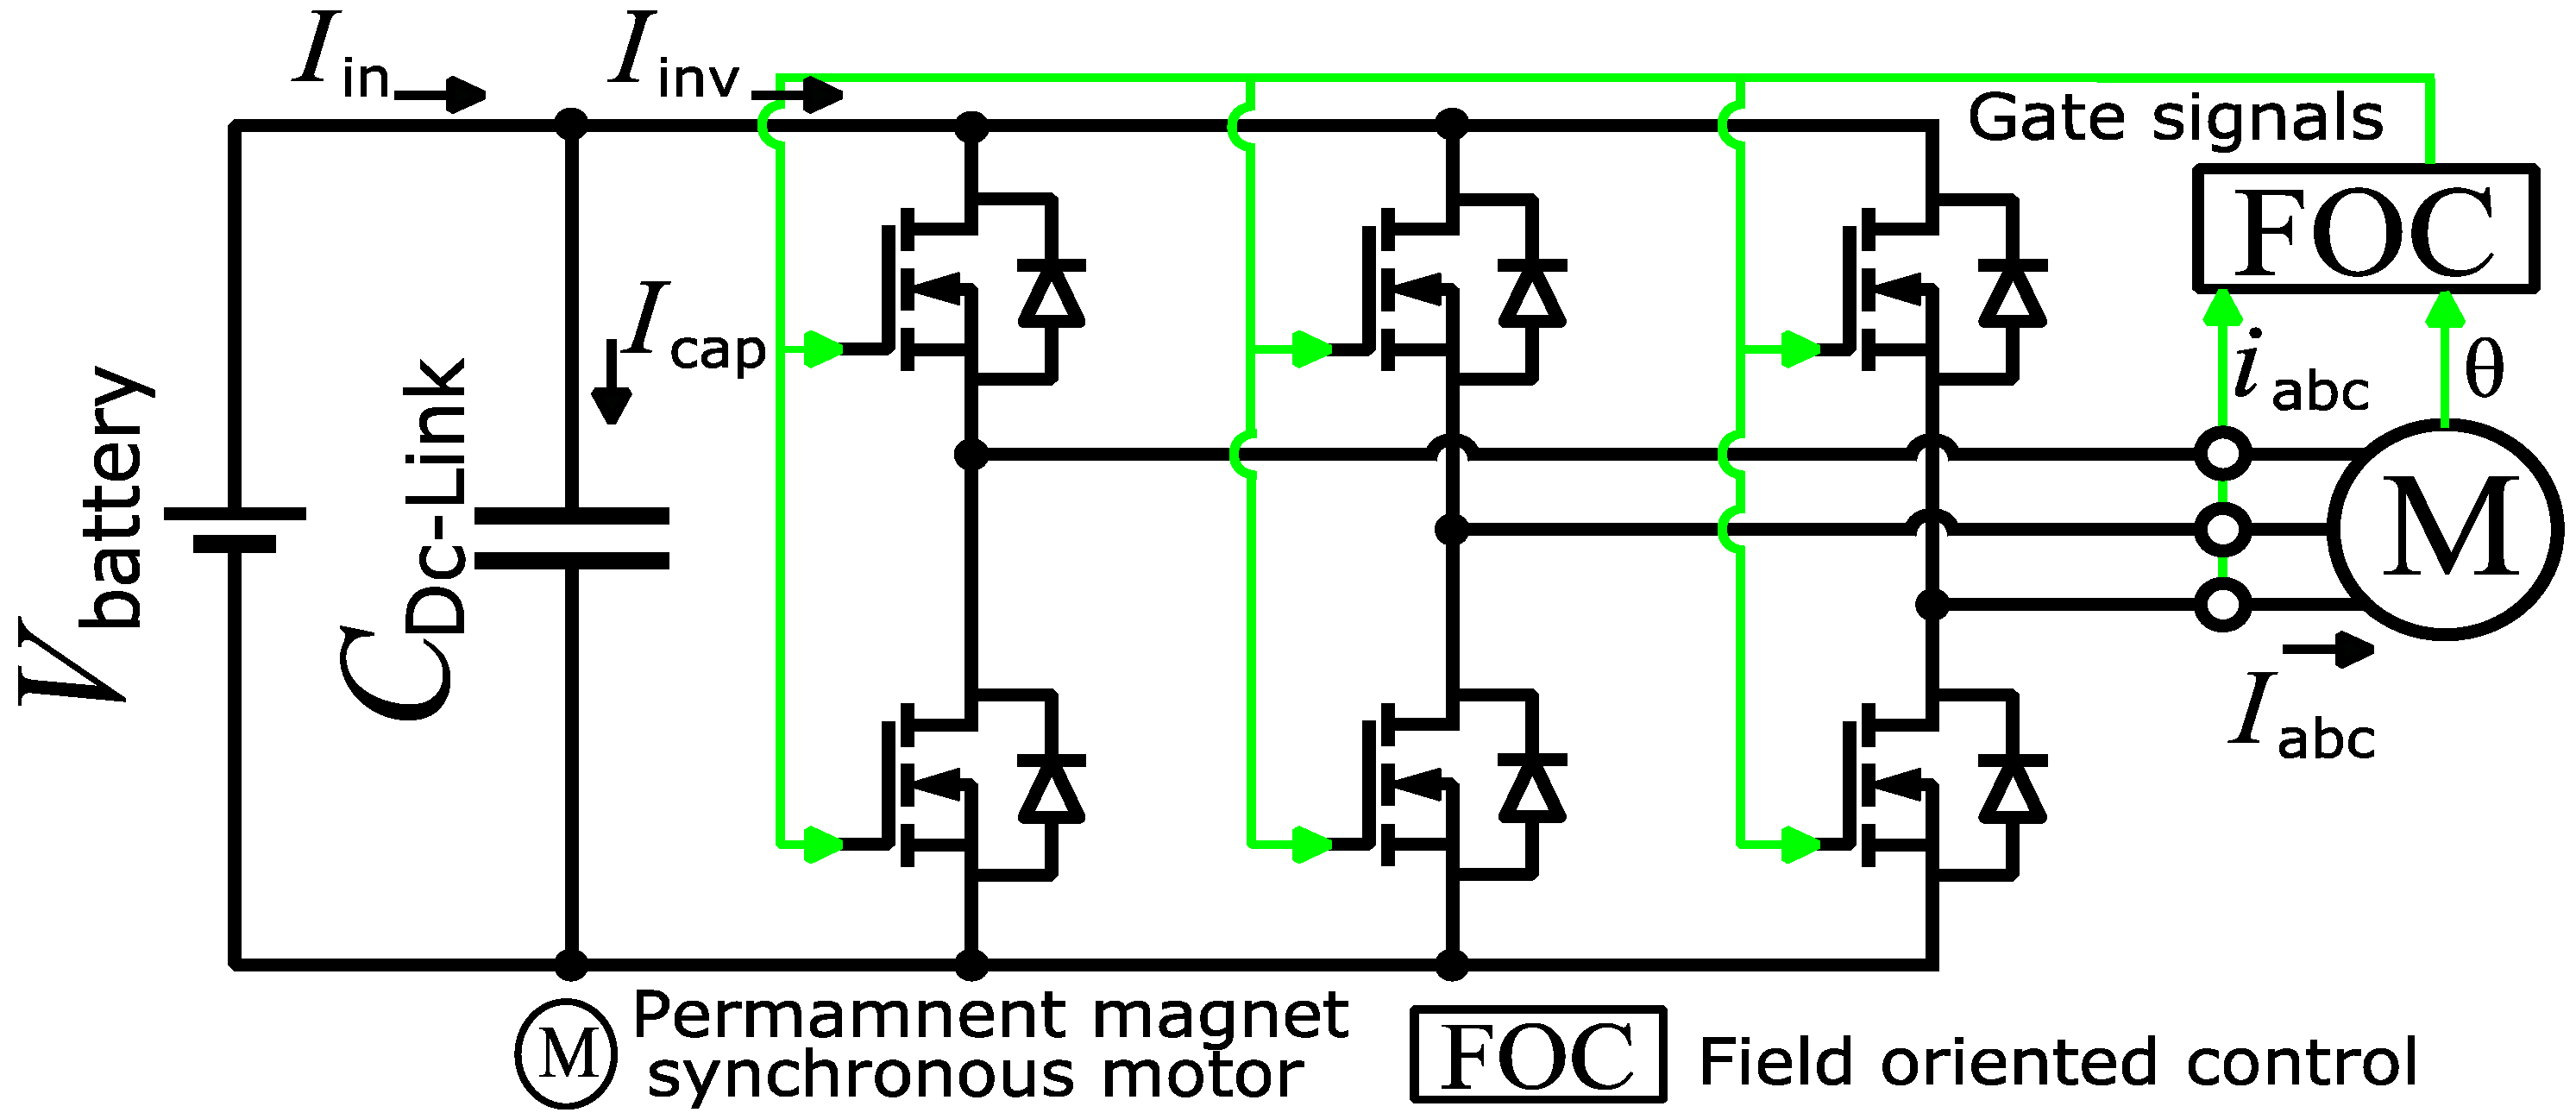
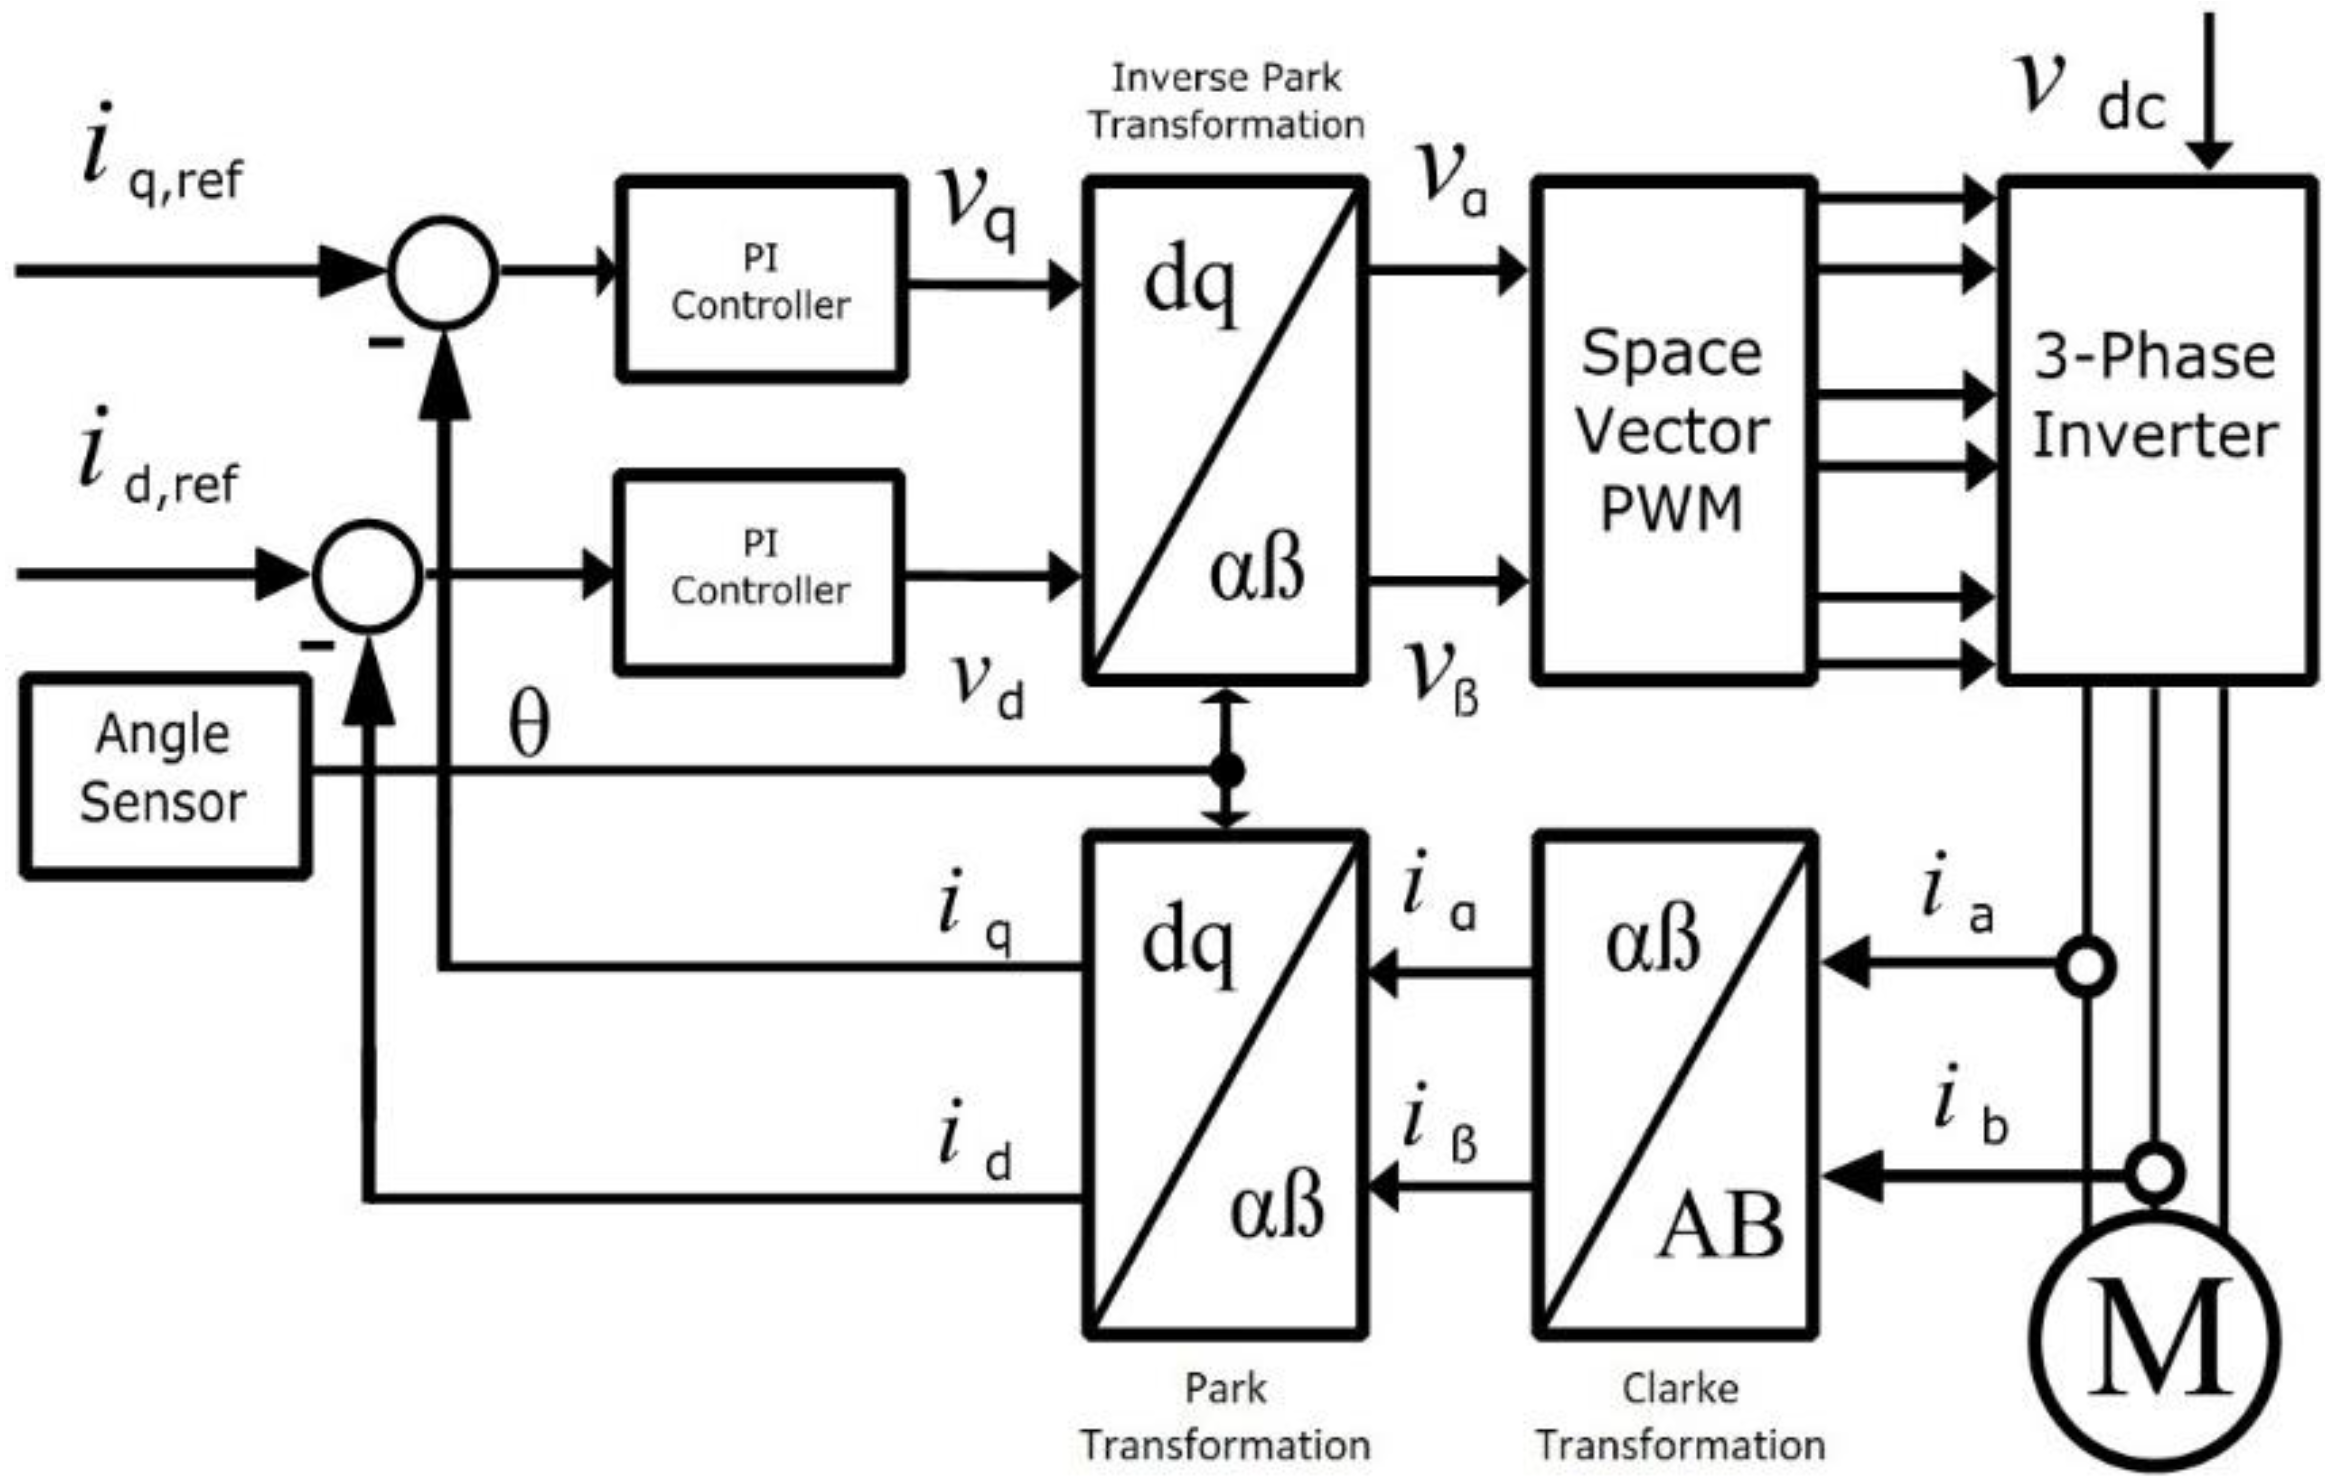
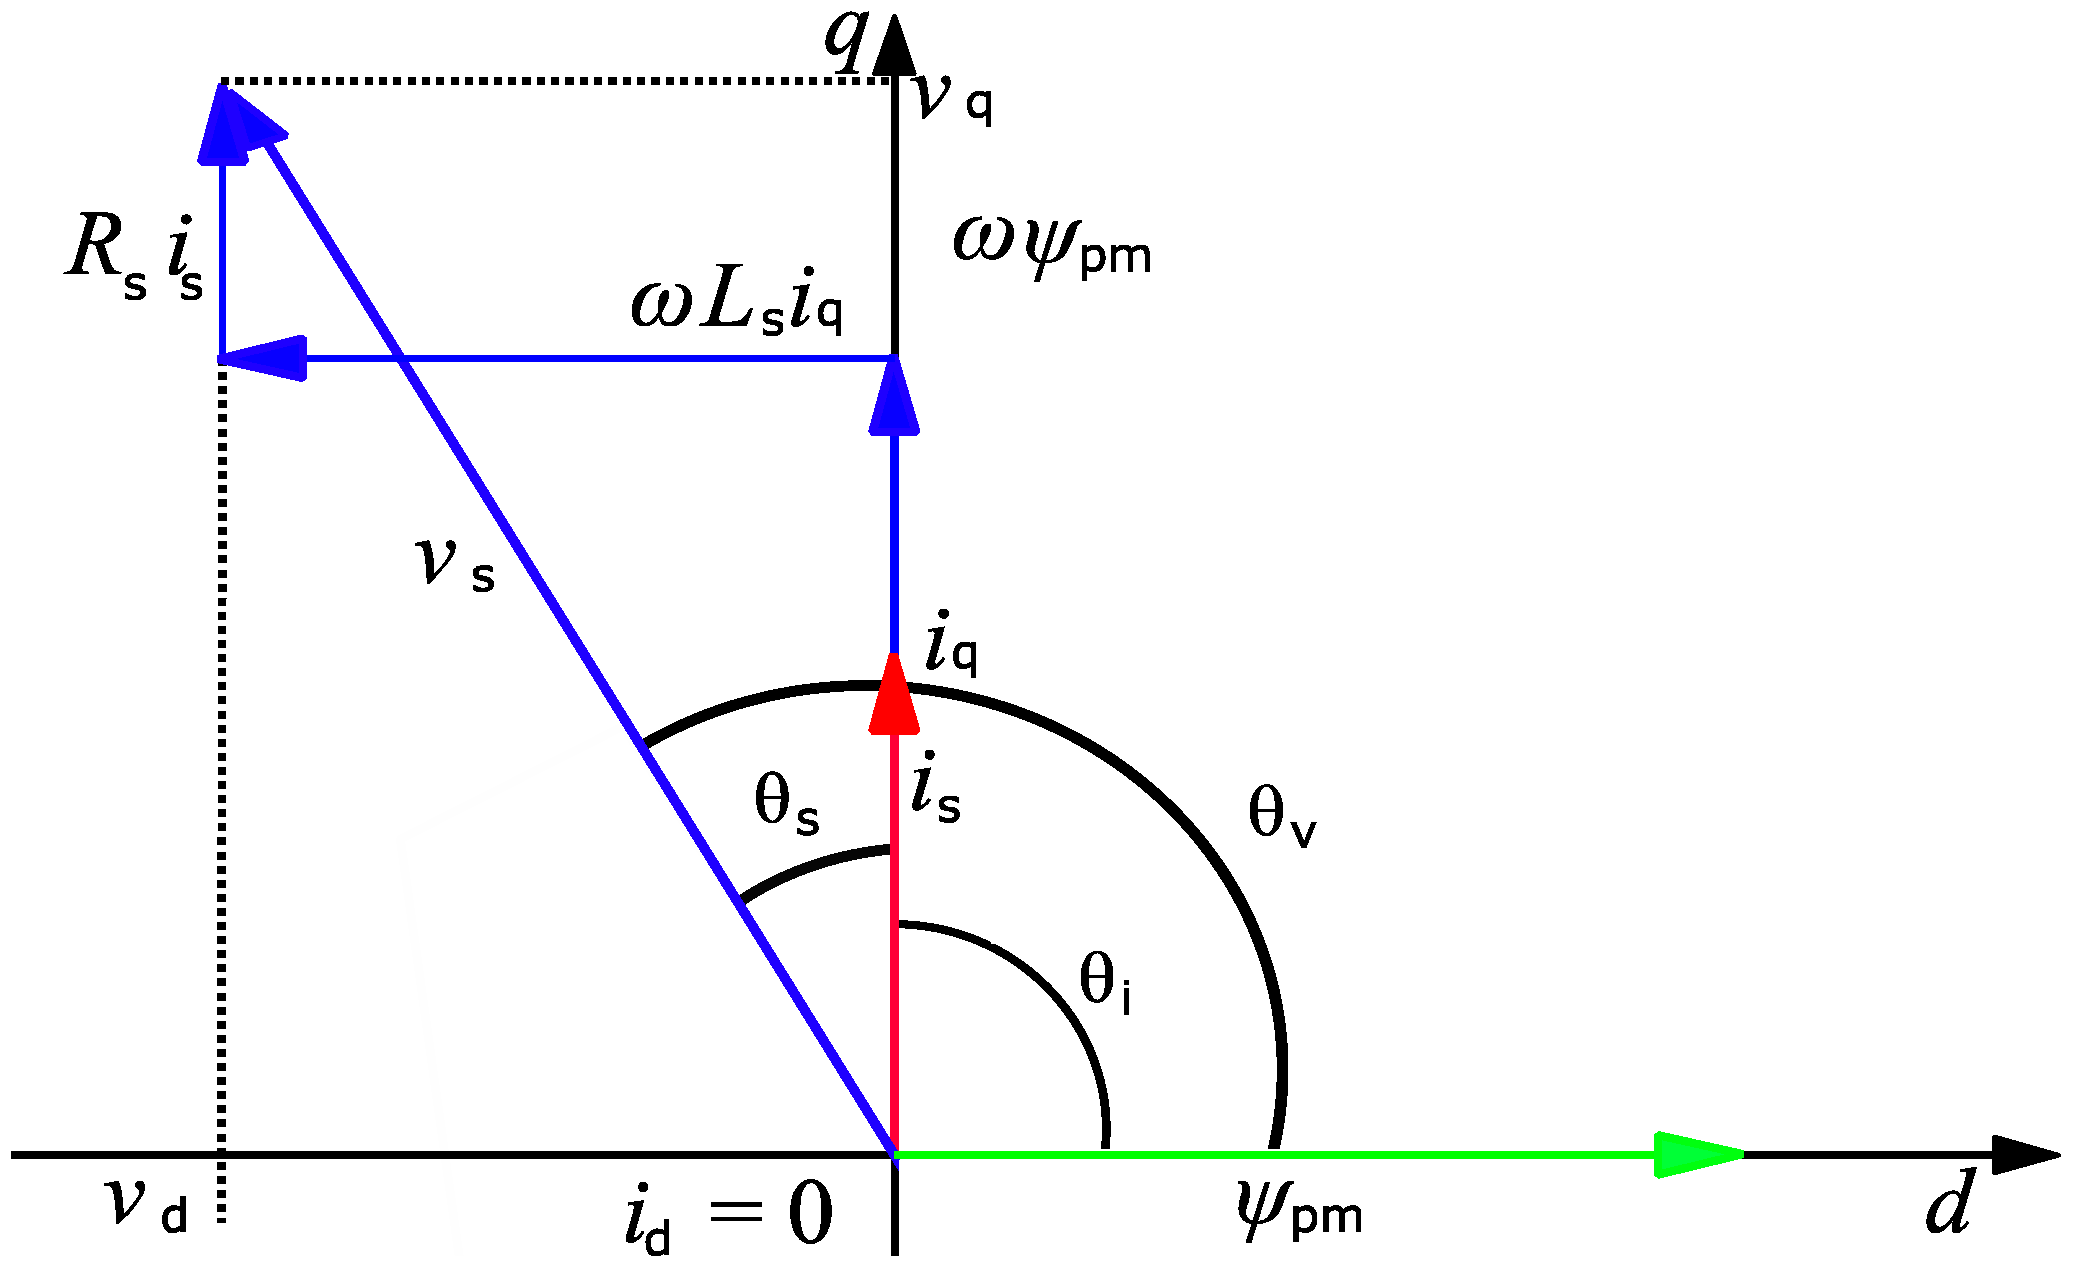
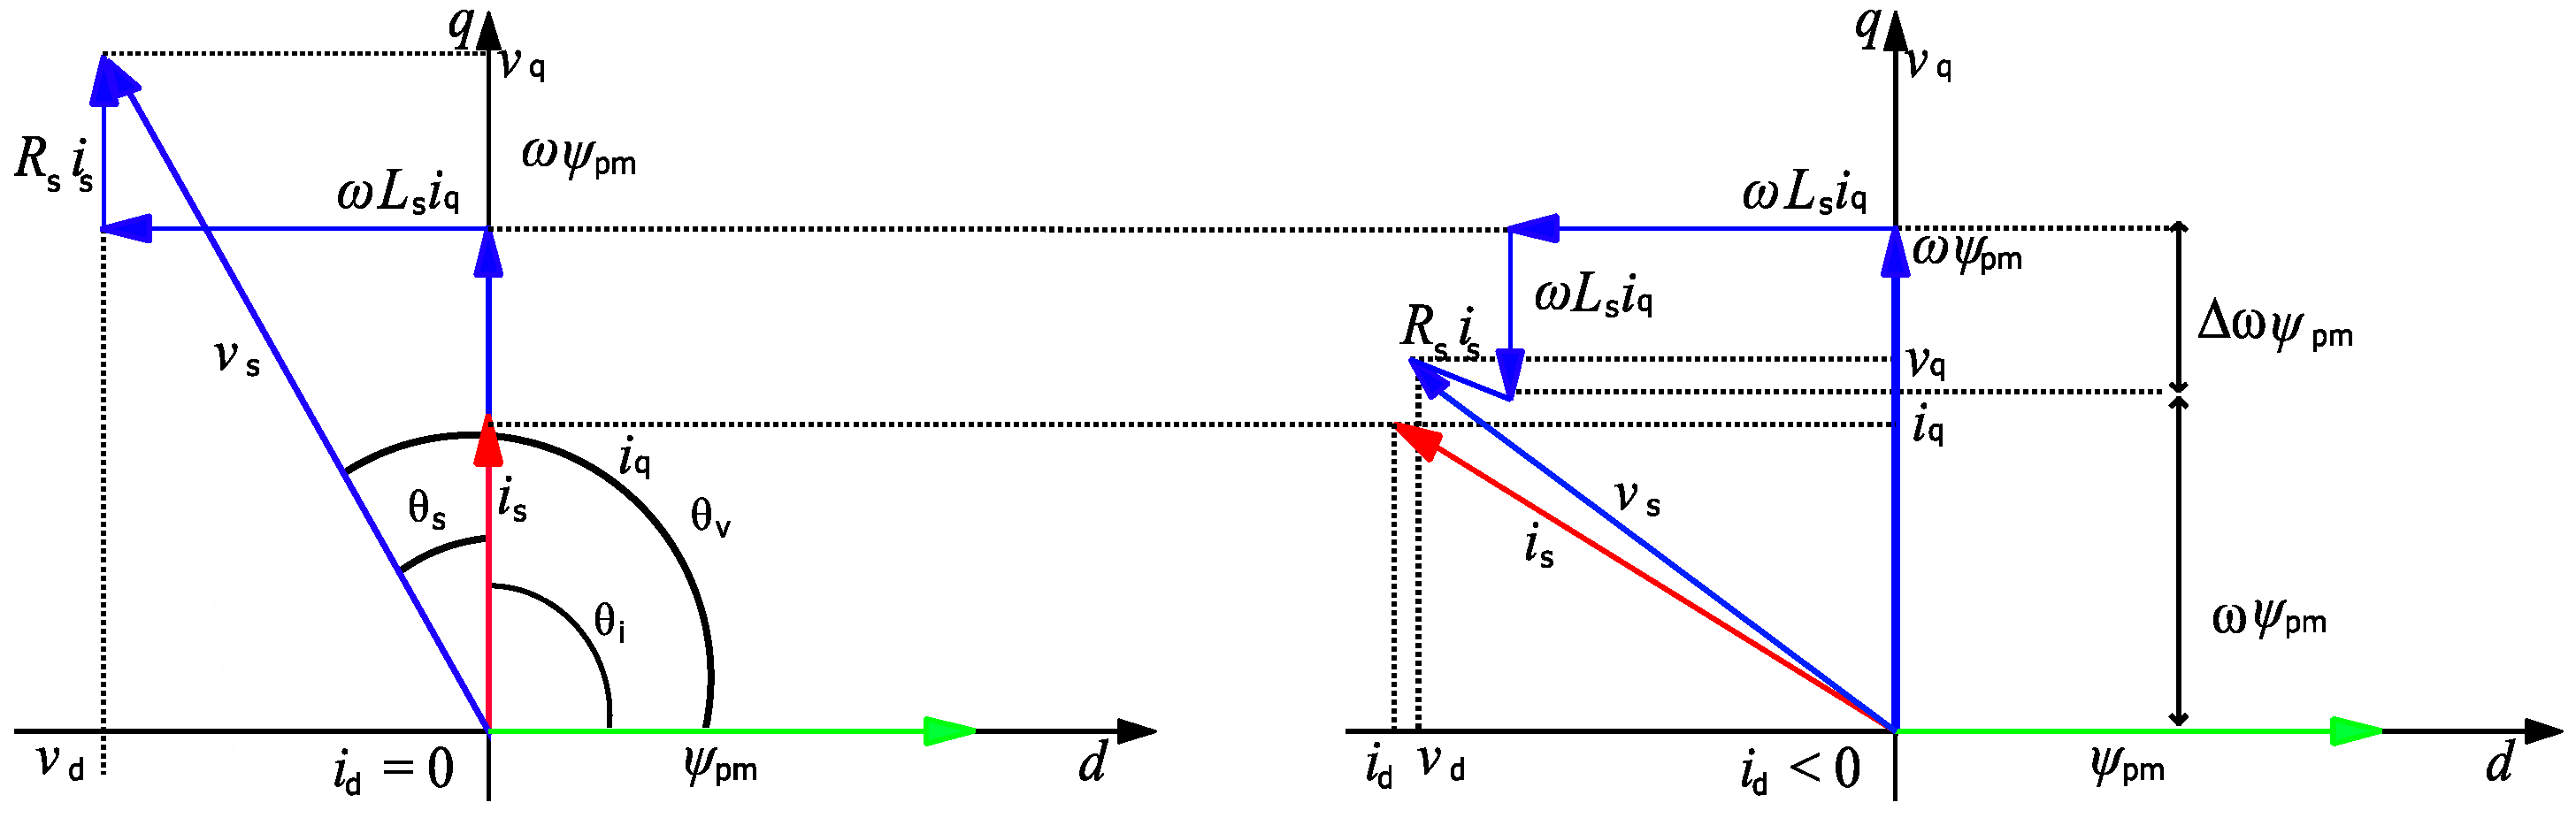
2.2. Field-Orientation Control

This control technique allows the indirect control of the motor torque by controlling the quadrature current i q ; FOC enables independent control of the flux linkage and the generated motor torque. This revolves around various mathematical transformations. These domain transformations can be understood through Figure 10. From Figure 10, it can be observed that three-phase AC values are converted to DC values i d and i q , which makes it easier for the system to control. As a result, this method gives a fast-dynamic response and is highly efficient. Another critical benefit of FOC is that it supports low-current and high-torque start-ups and also provides a wide speed range by introducing the “field-weakening” concept. The operating principle of the FOC is shown in Figure 11. The FOC scheme structure consists of a control loop where the measured quadrature current i q and direct current i d are compared to the reference values. This error gain is fed separately to two PI controllers. The direct current component i d , which controls the flux linkage, is not useful to control the torque during the nominal operational point of motor. The direct current i d is set to zero unless the motor operates in a flux-weakening region.
For this reason, quadrature current i q controls the motor torque. PI controllers provide DQ-reference voltage values, which are fed to space vector modulation controller (SVPWM) and eventually send control signals to the three-phase inverter switches. FOC also takes feedback from sensors installed in PMSM, constantly feeding the rotation and speed of the rotor. The field-weakening concept is used to extend the speed range capability of the motor. The flux-weakening operation is necessary because the motor input voltage and current rating are limited by the available DC-link voltage and current rating of a three-phase inverter. At the rated (base) speed and maximal current, the required input voltage exhibits the maximal value. Beyond the rated speed n r a t e , the back-EMF of PMSM exceeds the maximum input voltage, causing a decrease in the input voltage to the motor. To overcome this limitation, back-EMF is kept less than the applied voltage by introducing a negative component of direct current i d   ( i d < 0 ) [20].

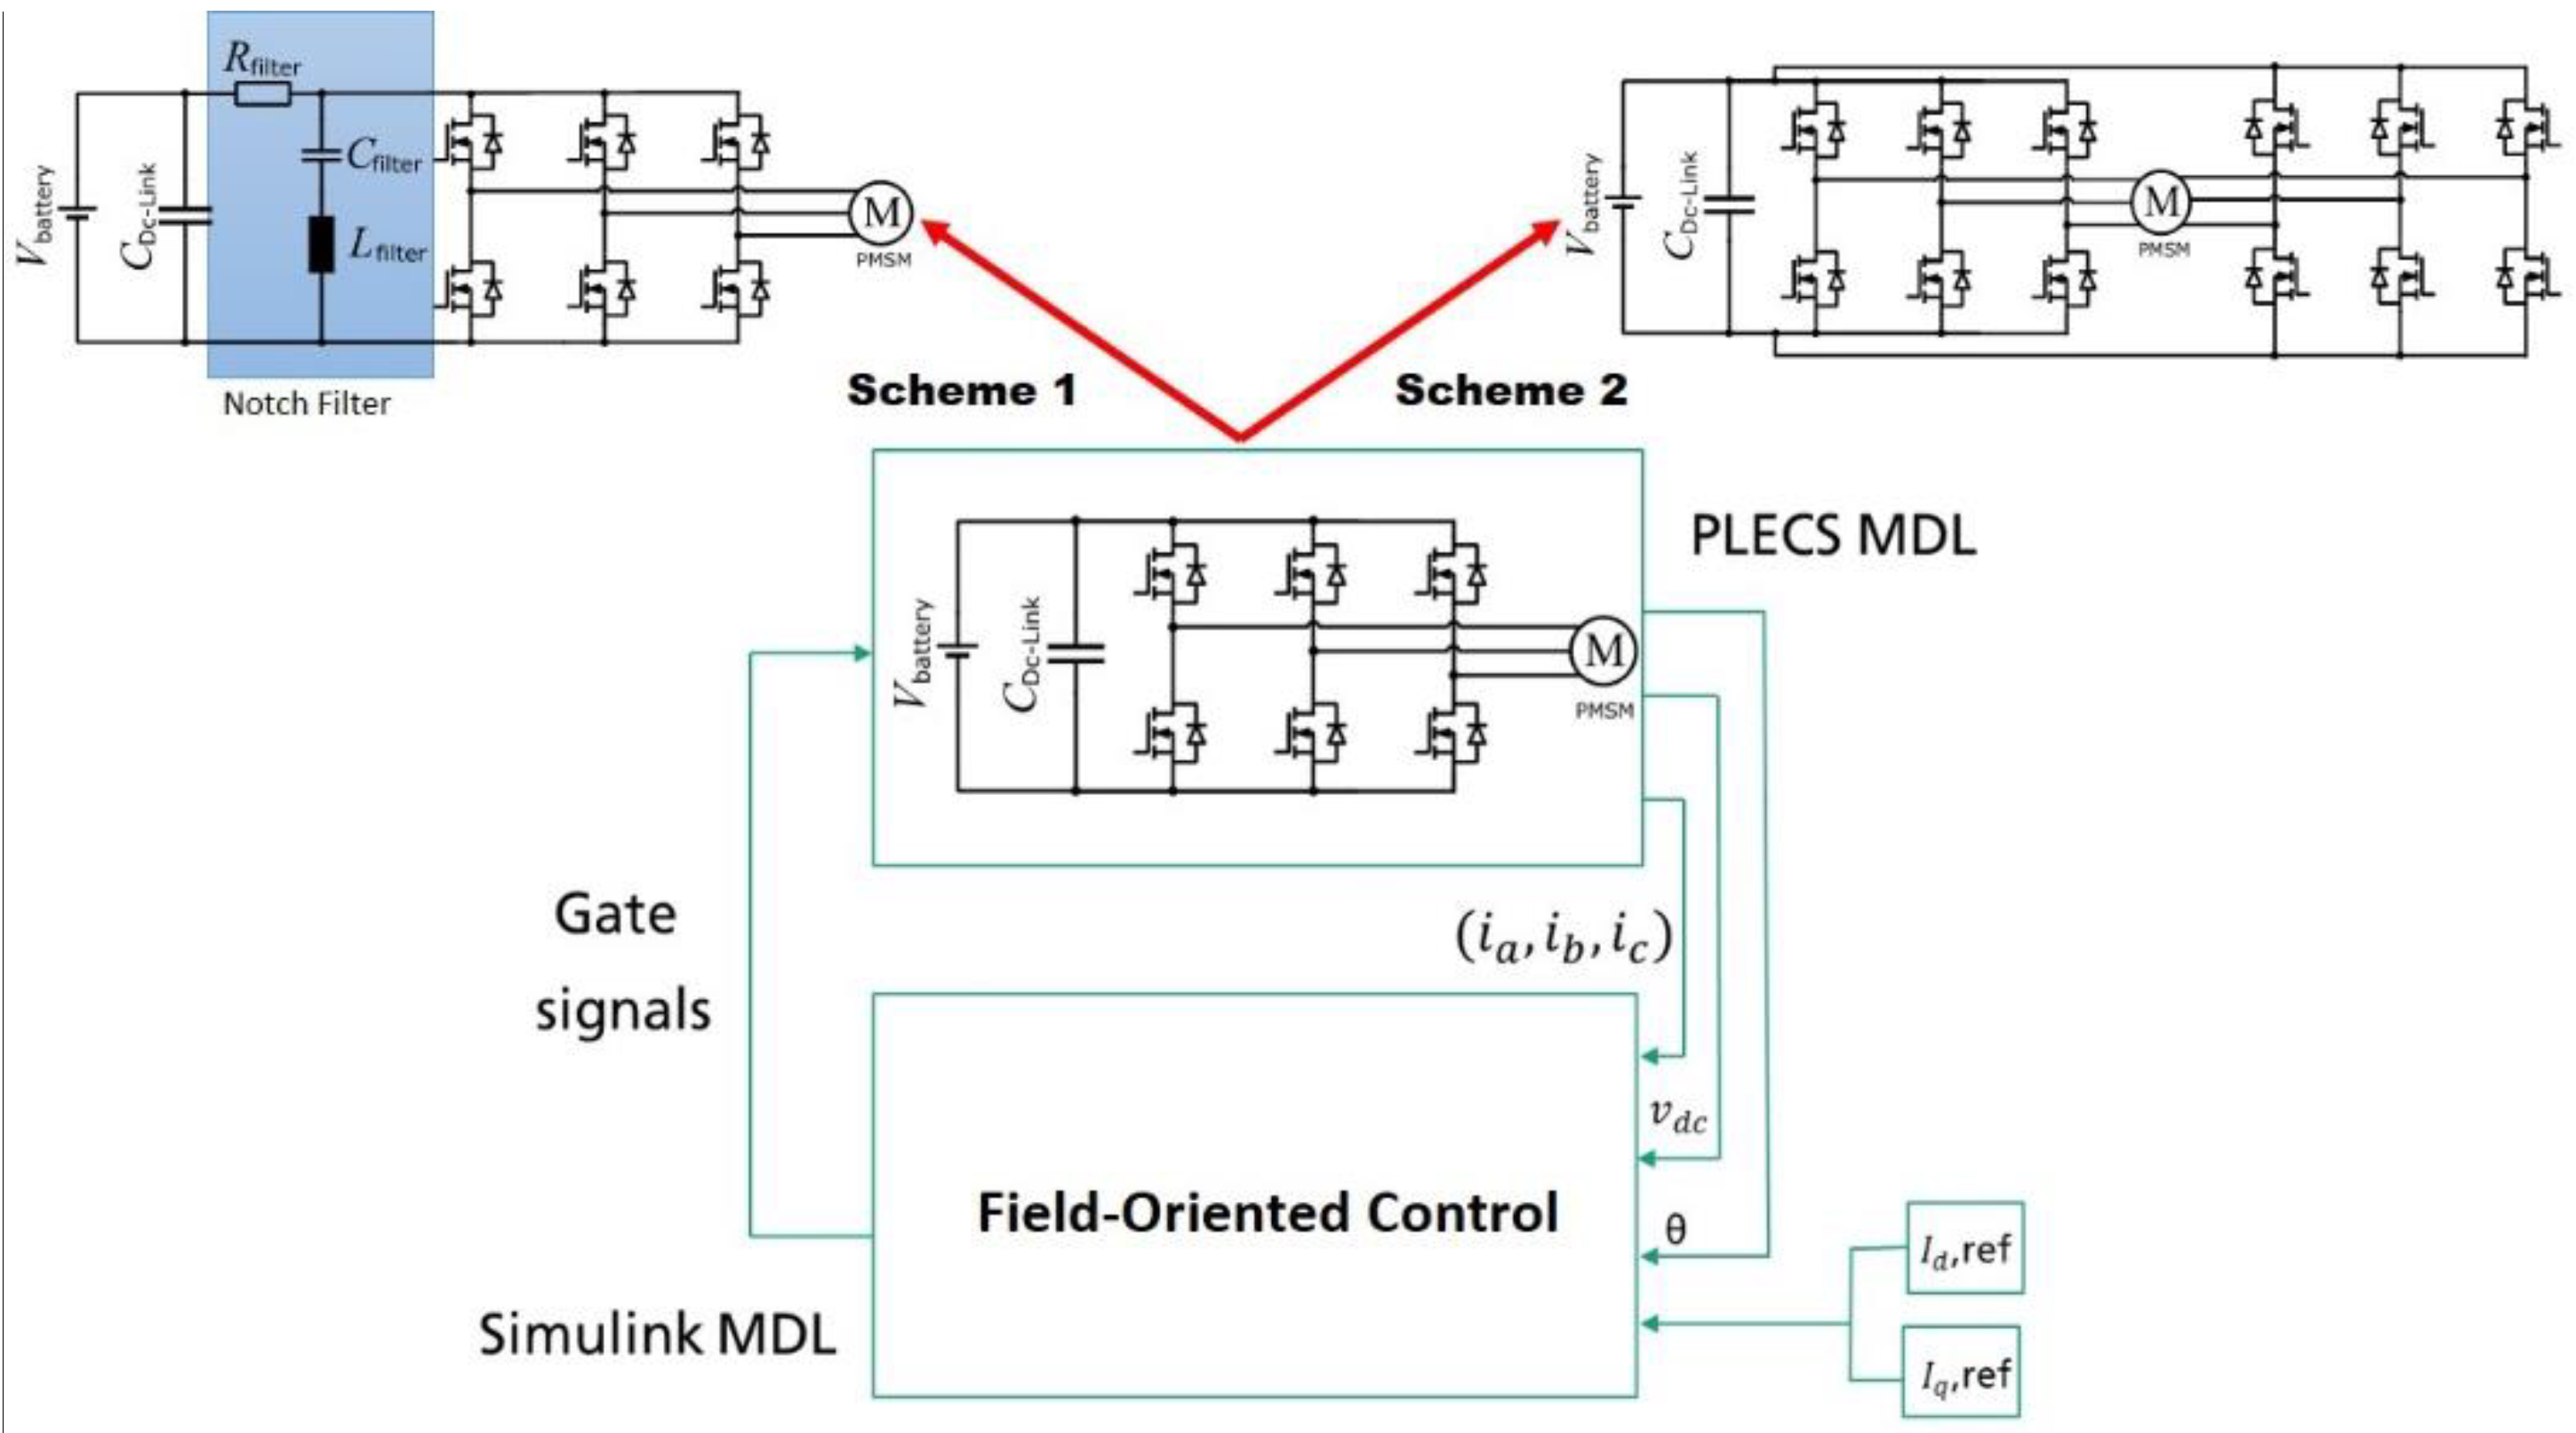
2.3. Simulation Modelling
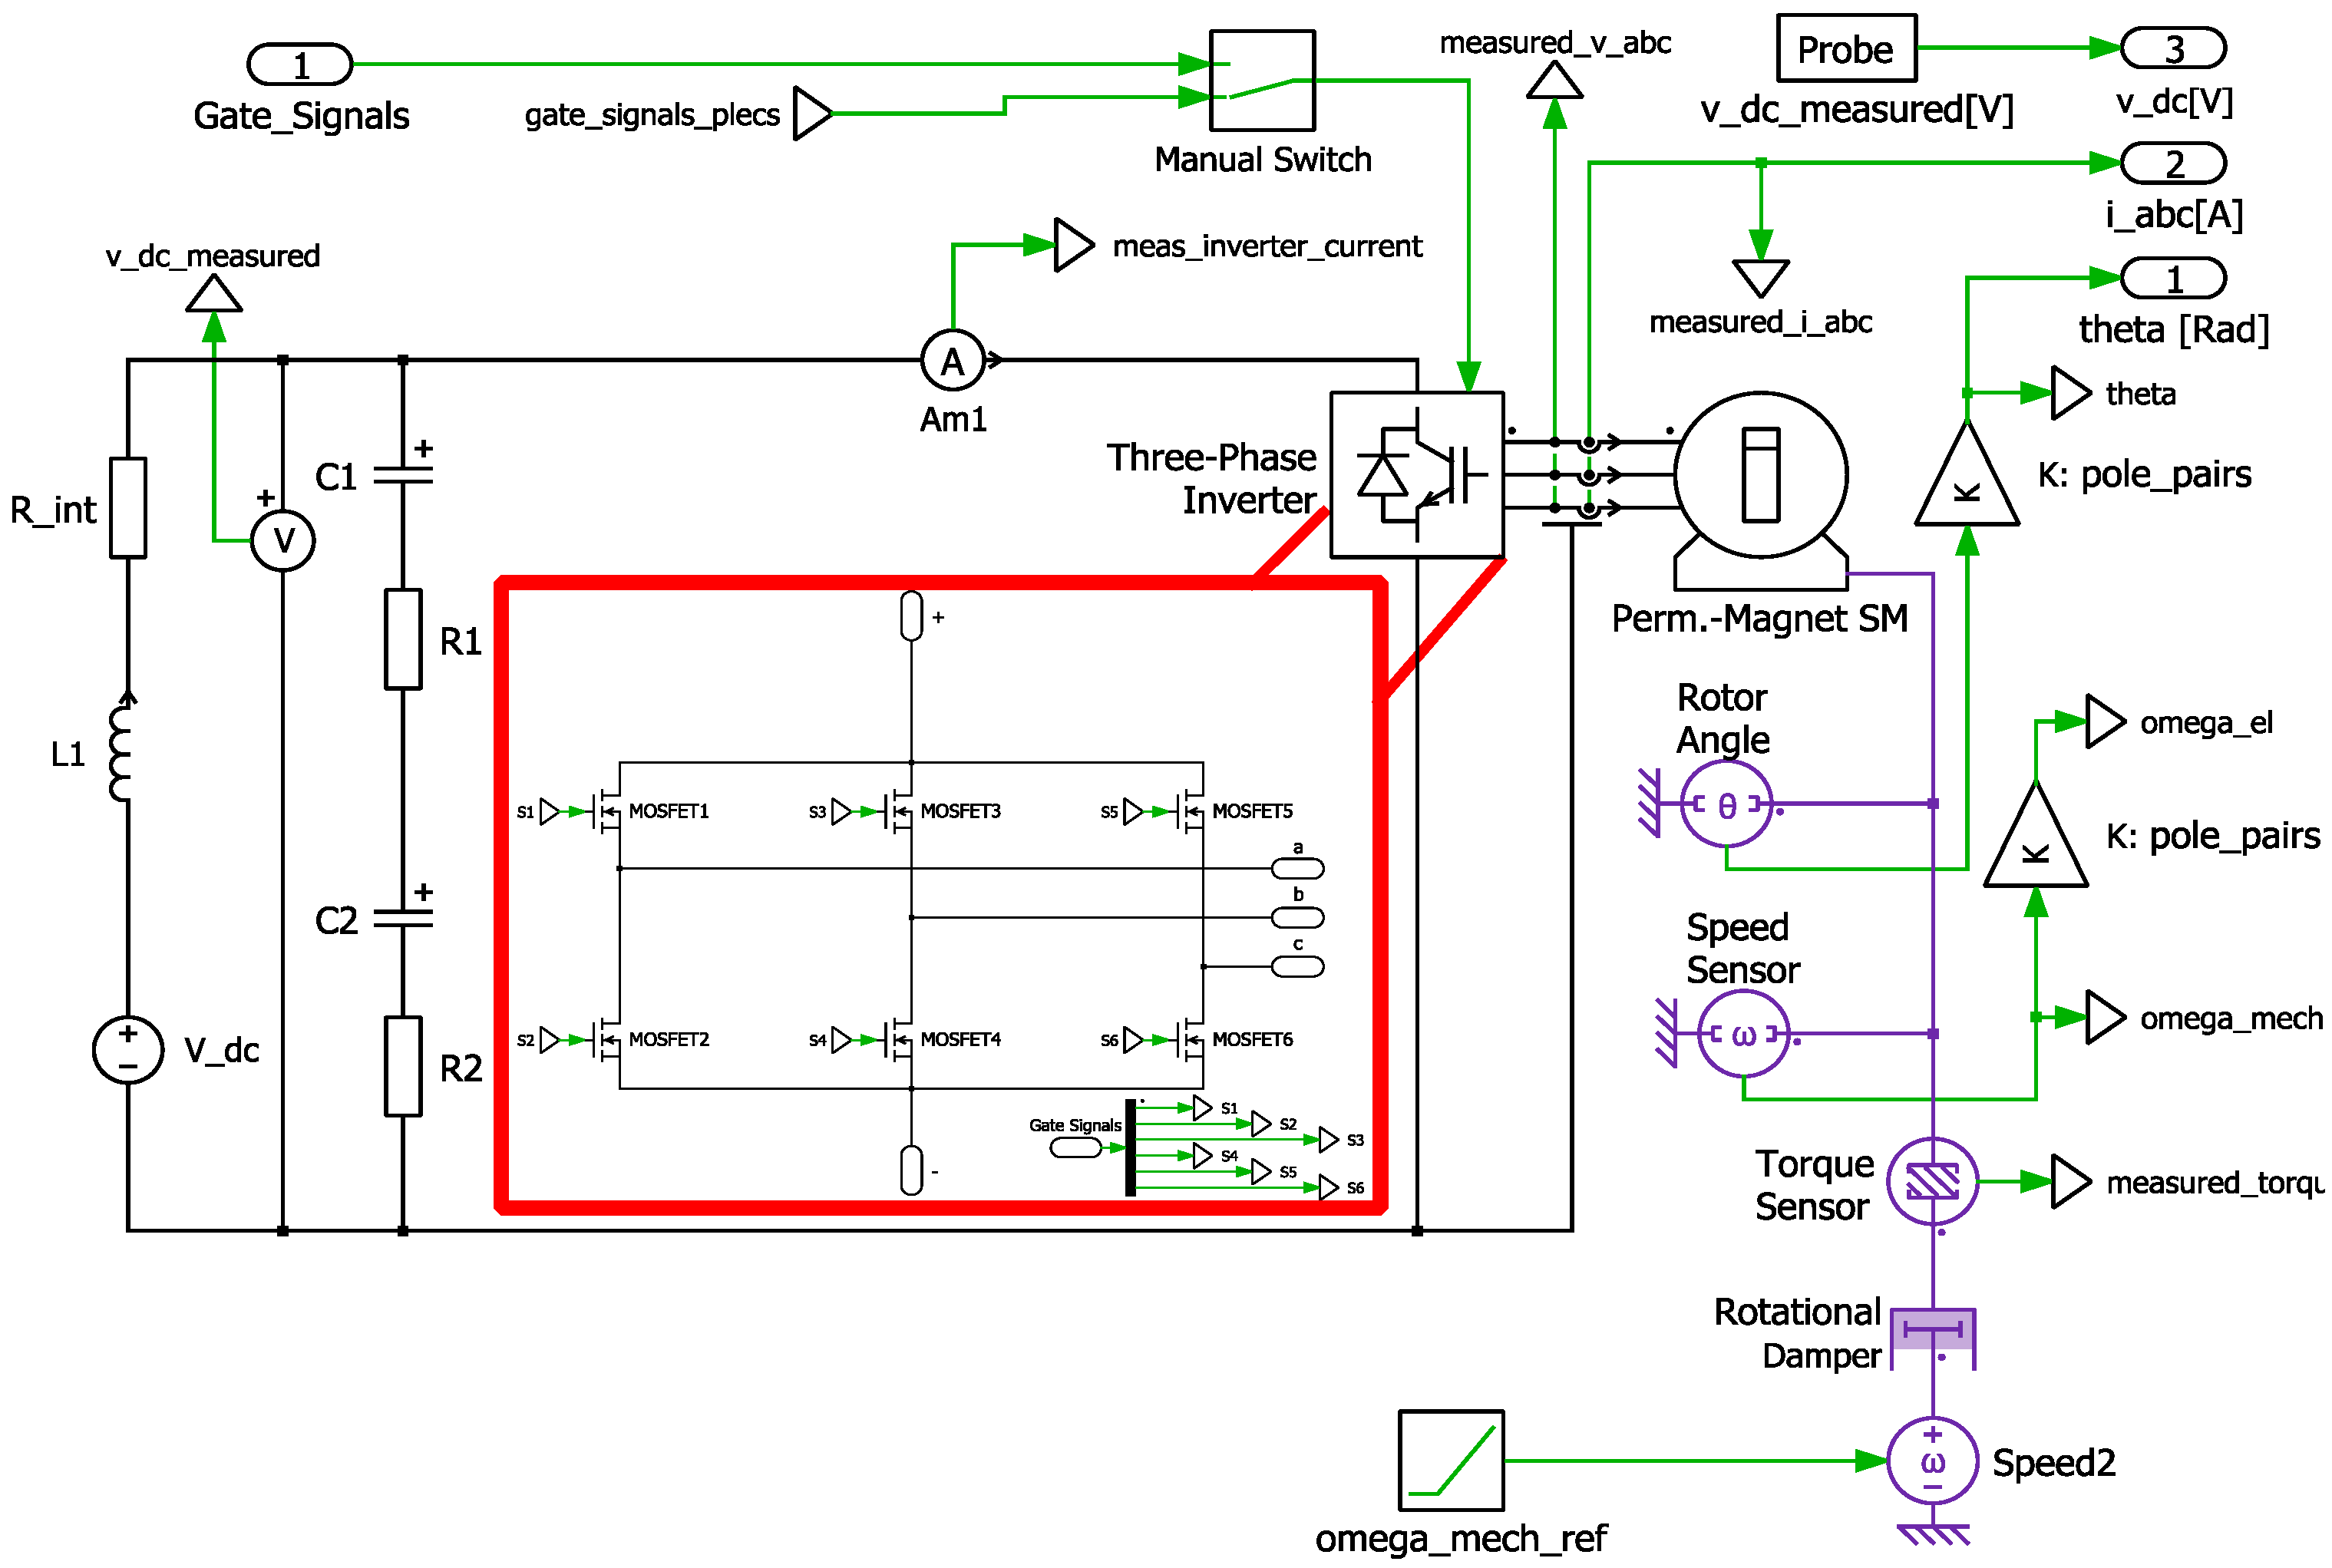
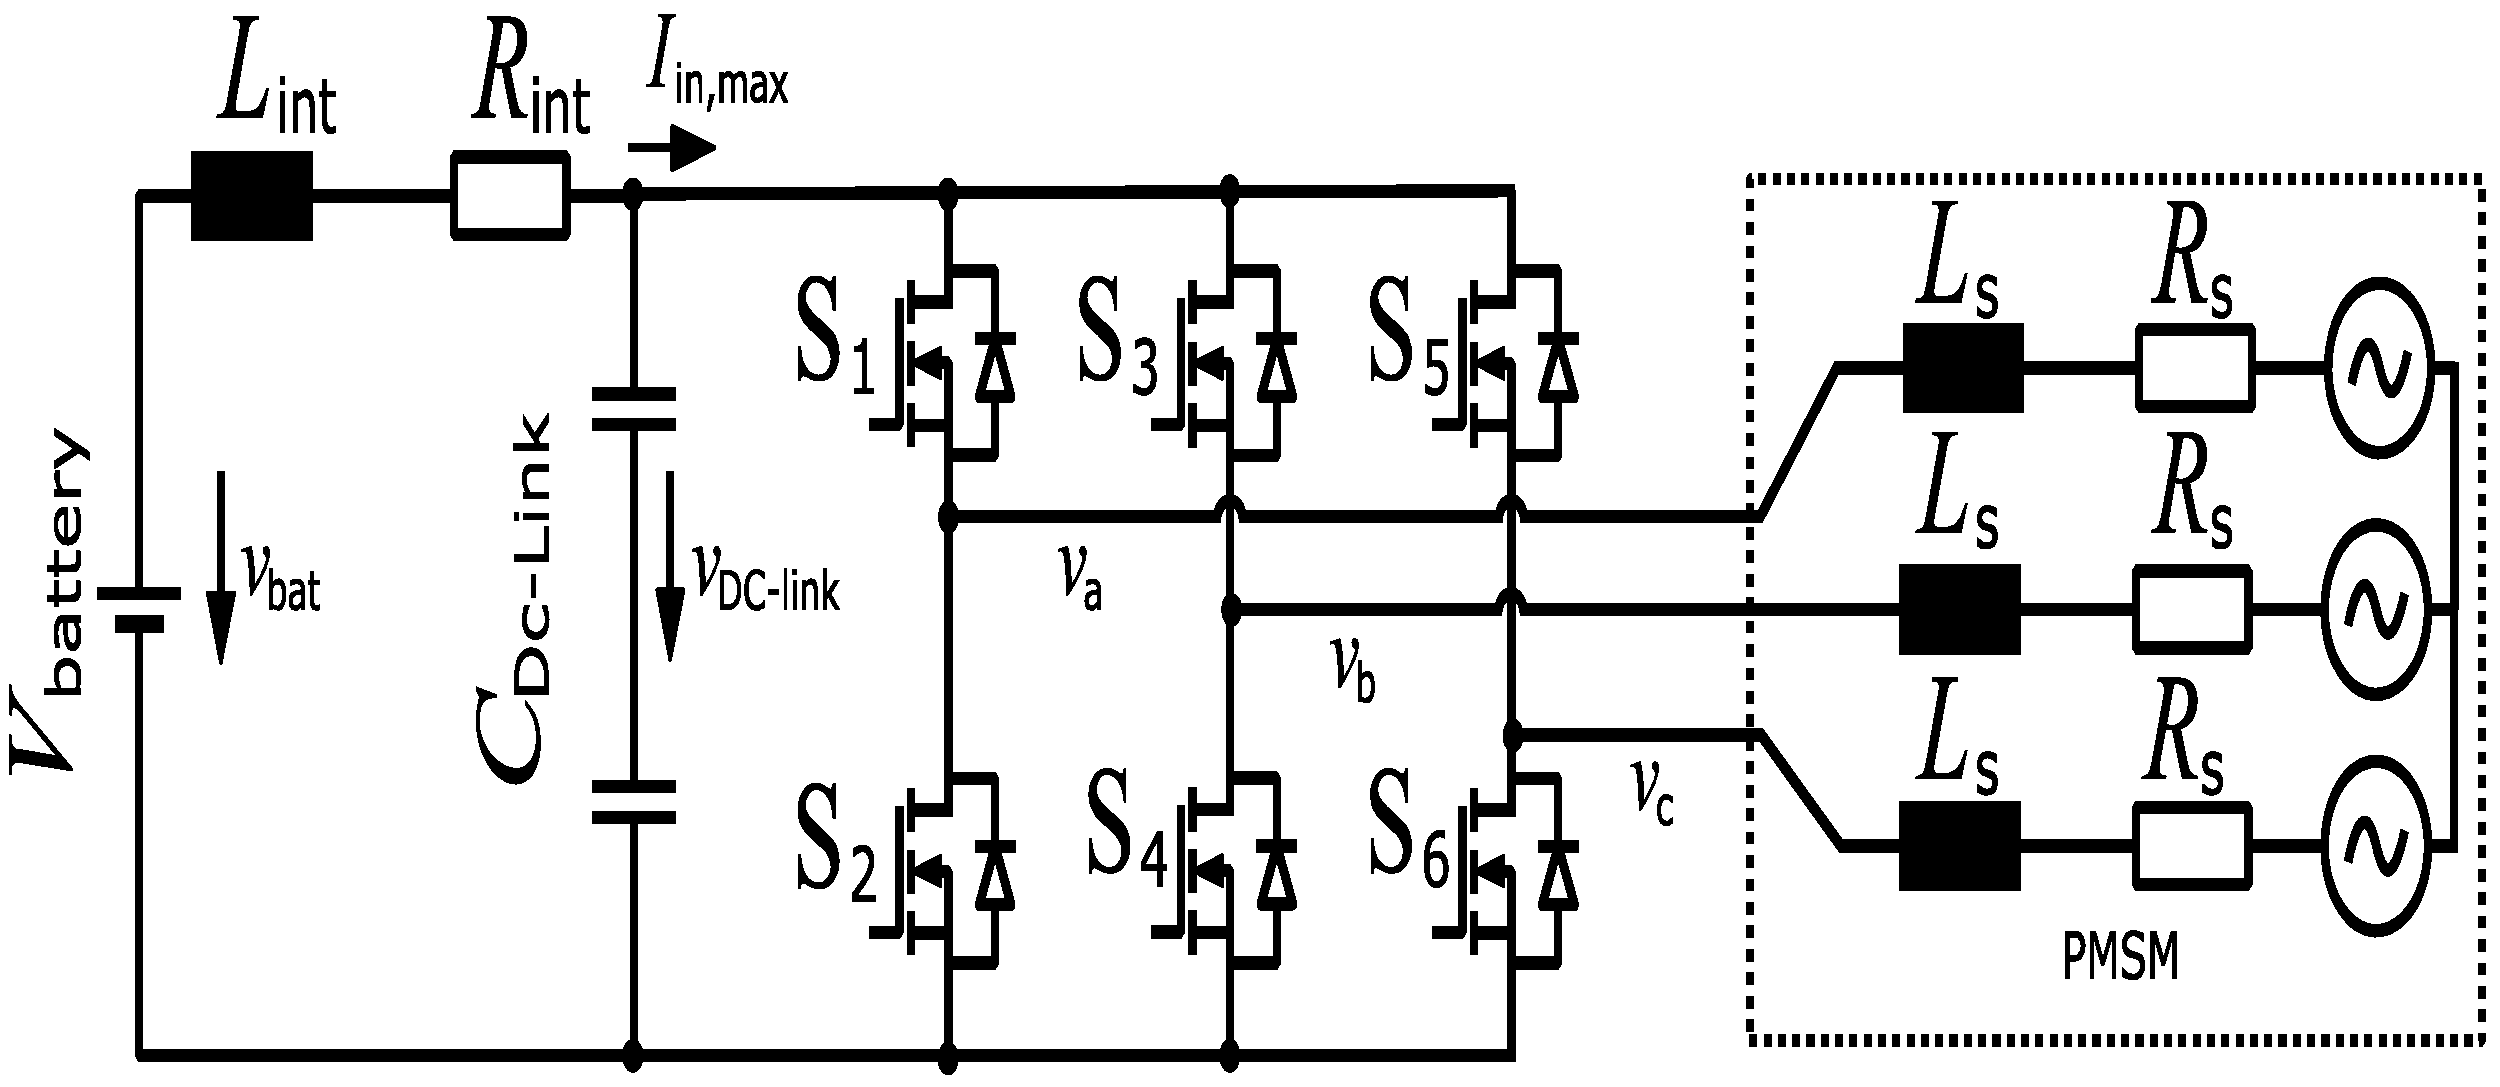
2.3.1. PLECS Model

PLECS software has a wide range of component library containing electrical, mechanical, magnetic, and thermal properties during energy conversion. The main advantage of PLECS is that it offers the electric drive train circuit, as depicted in Figure 12, that is used in the electric vehicle. The battery is simulated by a series connection of an ideal voltage source, an ohmic resistance, and parasitic inductance. The resistance represents the ohmic losses in the battery. Additionally, the parasitic resistance and inductance, together with the DC-link capacitance, build up a low-pass filter to reduce the current ripple in the battery. The DC-link capacitor is modeled by two capacitors connected in series. For both capacitors, the equivalent series resistance (ESR) are considered, while the equivalent series inductances are neglected. This allows simulating the effect of different capacitor types on DC-link voltage and battery current.
To simulate the PMSM, a model from the PLECS library is chosen, modified, and parametrized. The flux linkage, stator resistance, inductance, and the number of pole pairs are parameters that are modified. A three-phase inverter is simulated using three half-bridges, each consisting of two power MOSFETS controlled with inverse gate signals. The PLECS simulation model is depicted in Figure 12. Mechanical components are depicted in violet color. Mechanical sensors measure the speed, torque, and angle of the rotor and feed them to the controller, and inverter switches receive the control signal from the controller.

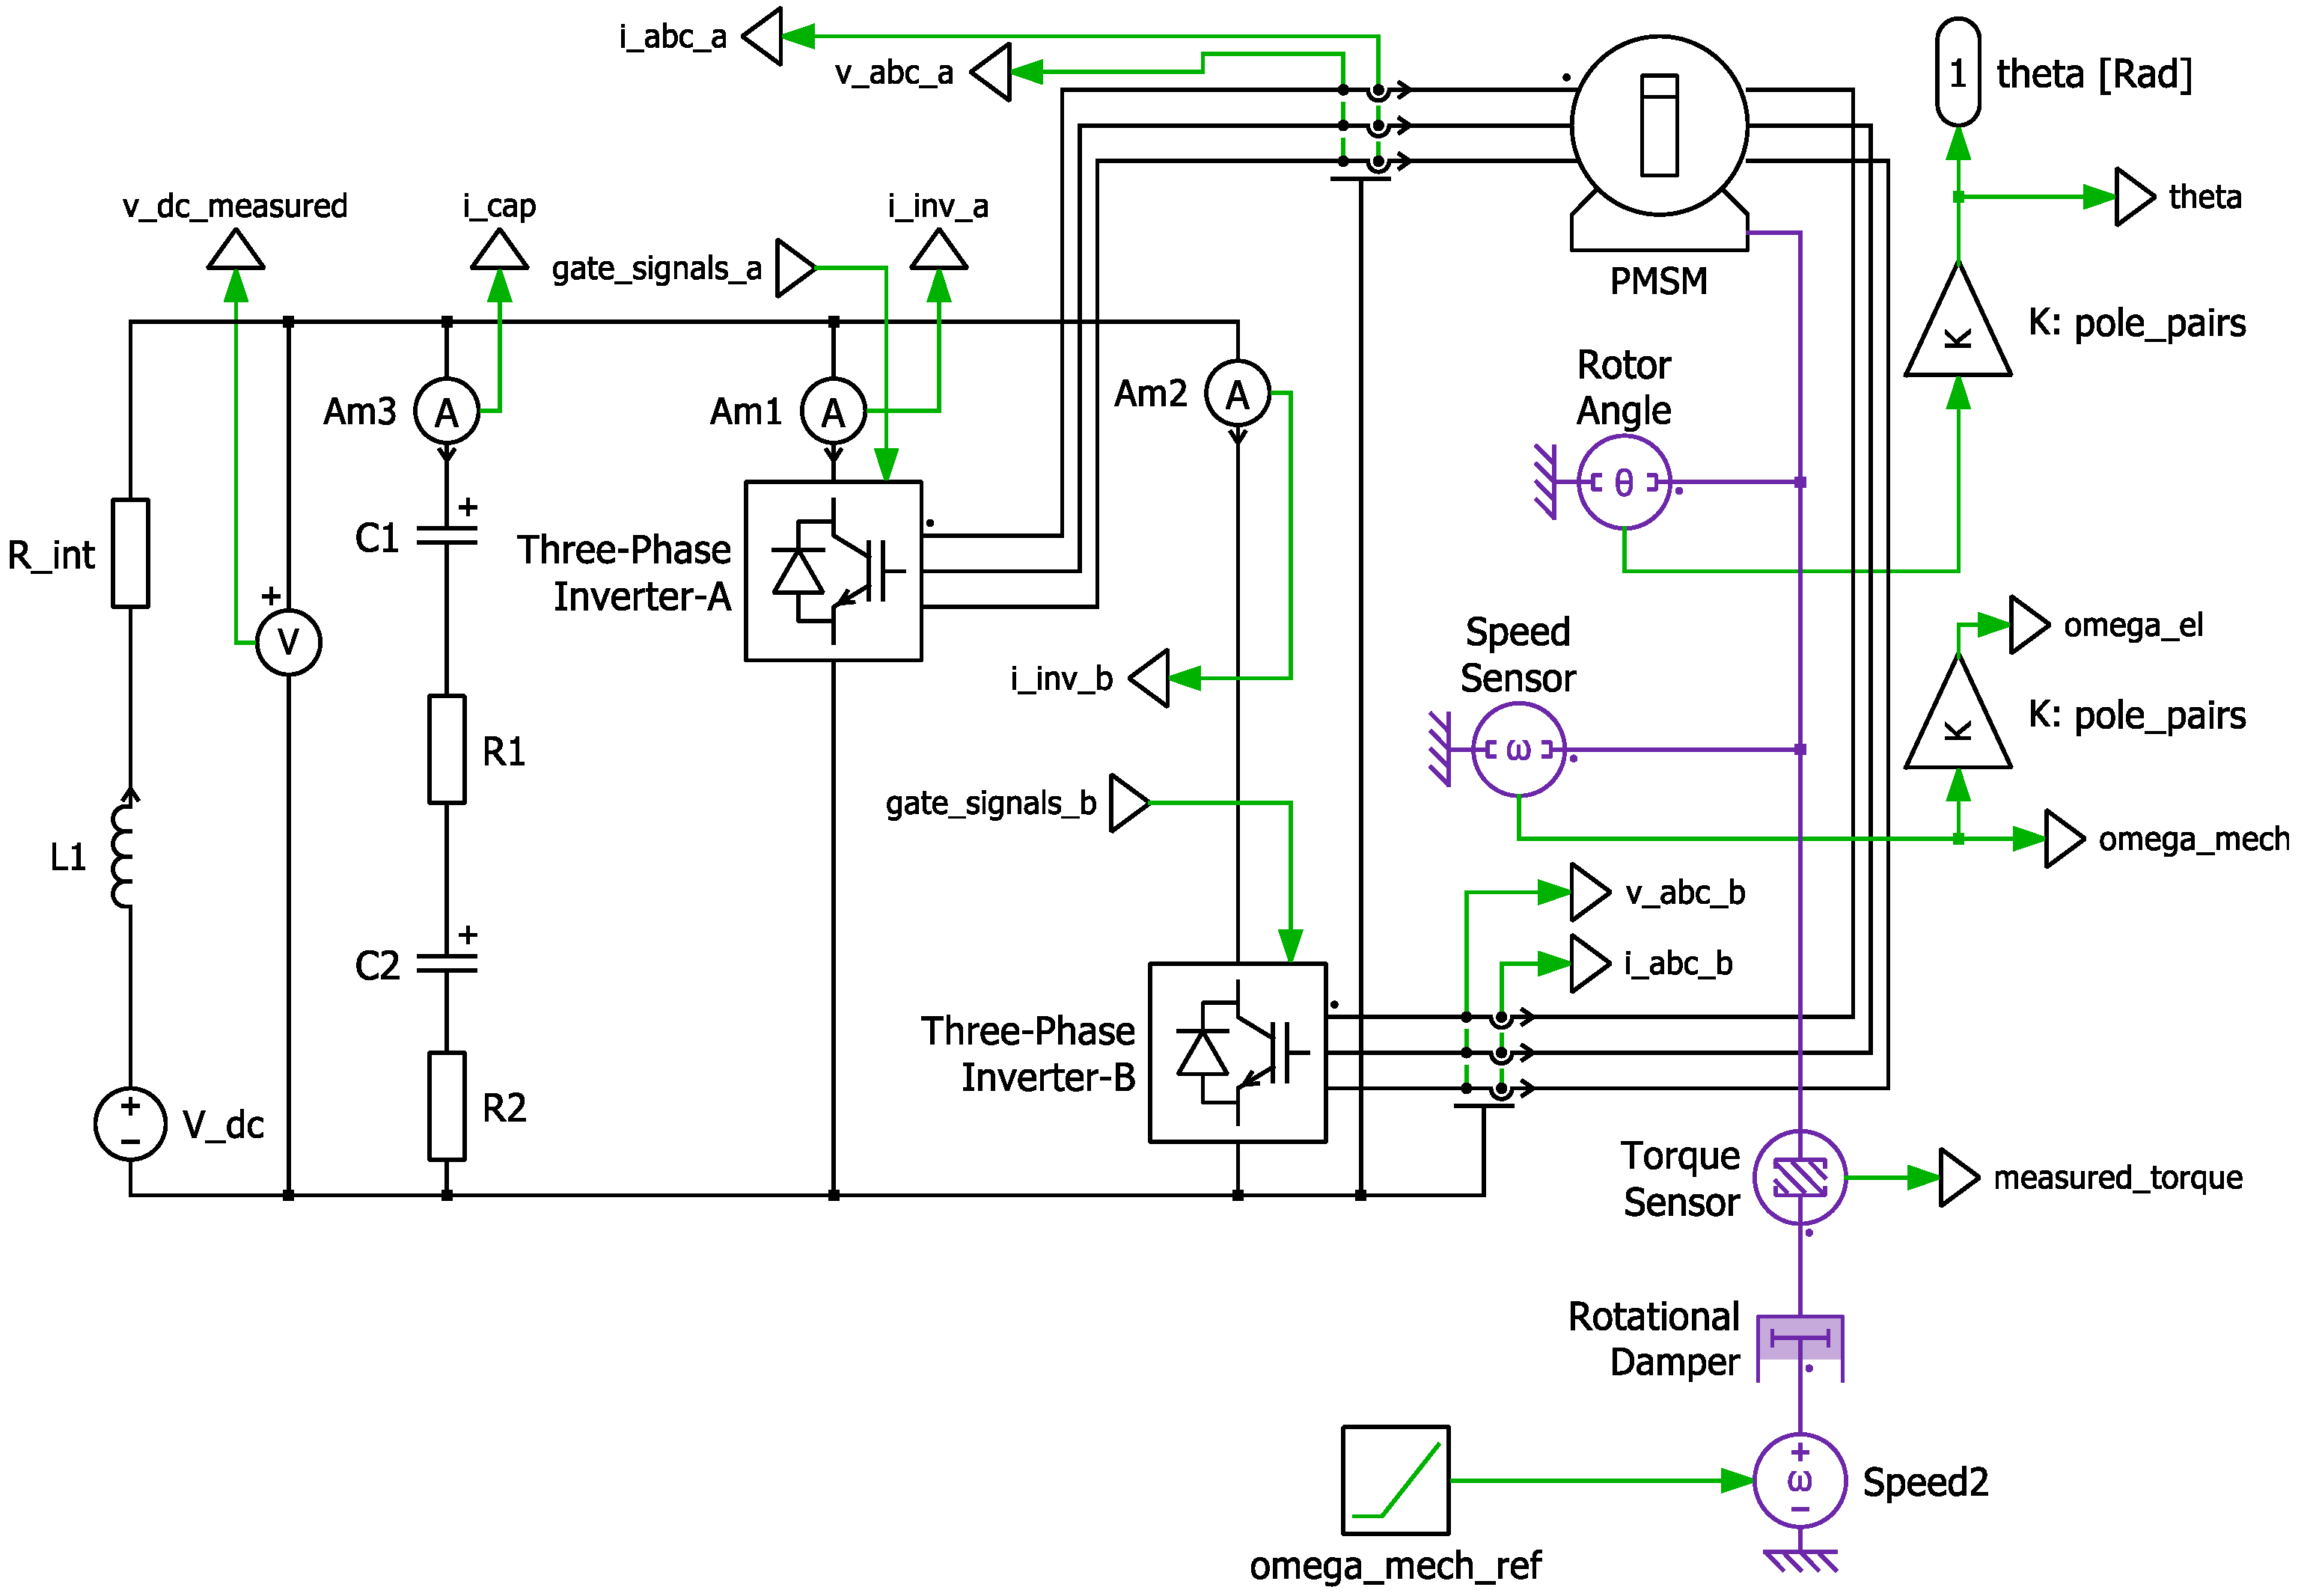
2.3.2. SIMULINK Model

The control system of an electric drive train system is designed in SIMULINKMATLAB. Although the PLECS system has built-in control for the electric drive train, an alteration to the circuit for the desired result is not possible. It was seen that fine-tuning of the current and speed controller is needed in the FOC scheme. Therefore, Simulink is used for a better adaptation of control. In this way, a change in modulation scheme is possible for the different. The model consists of the controller and gate signal generator as shown in Figure 13.
The Simulink model reads measurements from PLECS model, inverter current i a b c , battery voltage v b a t , reference currents i d q , and the rotor angle θ from the angle sensor. These values are fed to the respective blocks. The controller block consists of the FOC scheme and contains PI controllers and a b c / D Q transformation through which voltage signals are sent to the “Generate_Gate_Signals” block. This block performs the space vector PWM and sends switching signals to MOSFET switches in PLECS. The “Generate Gate Signals” block contains further sub-blocks in which carrier modulation of PWM is generated along with the third-harmonic injection. In total, six gate signals are generated with the phase shift. A PLECS block set is used in Simulink, which connects both models. Figure 12 depicts that the control scheme simultaneously takes feedbacks and feed signals to corresponding switches.

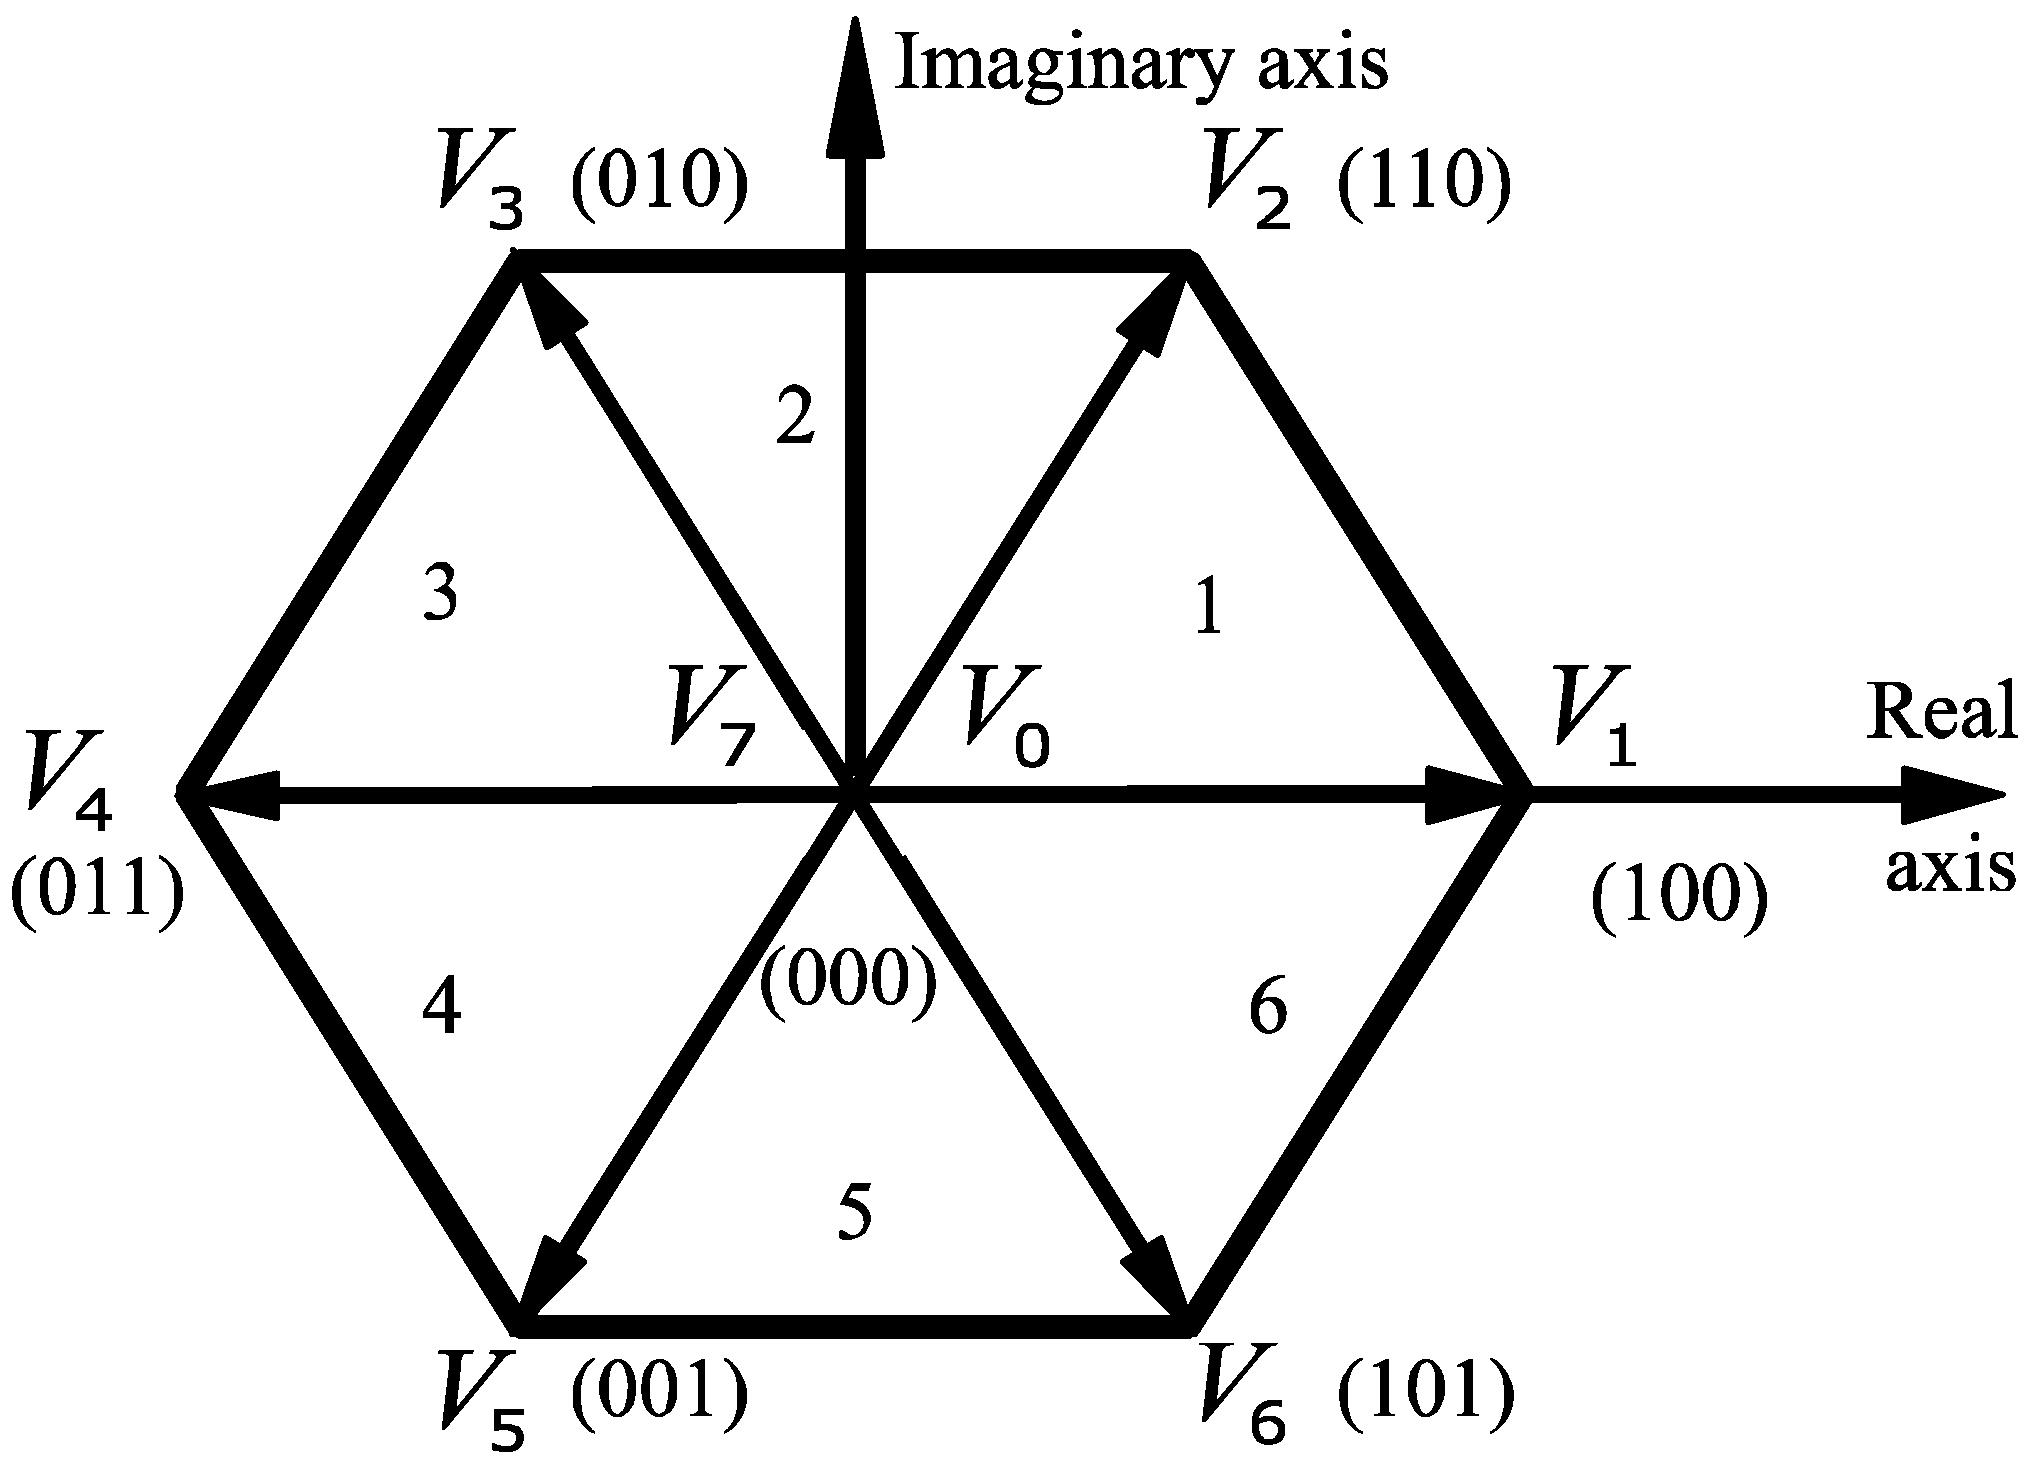
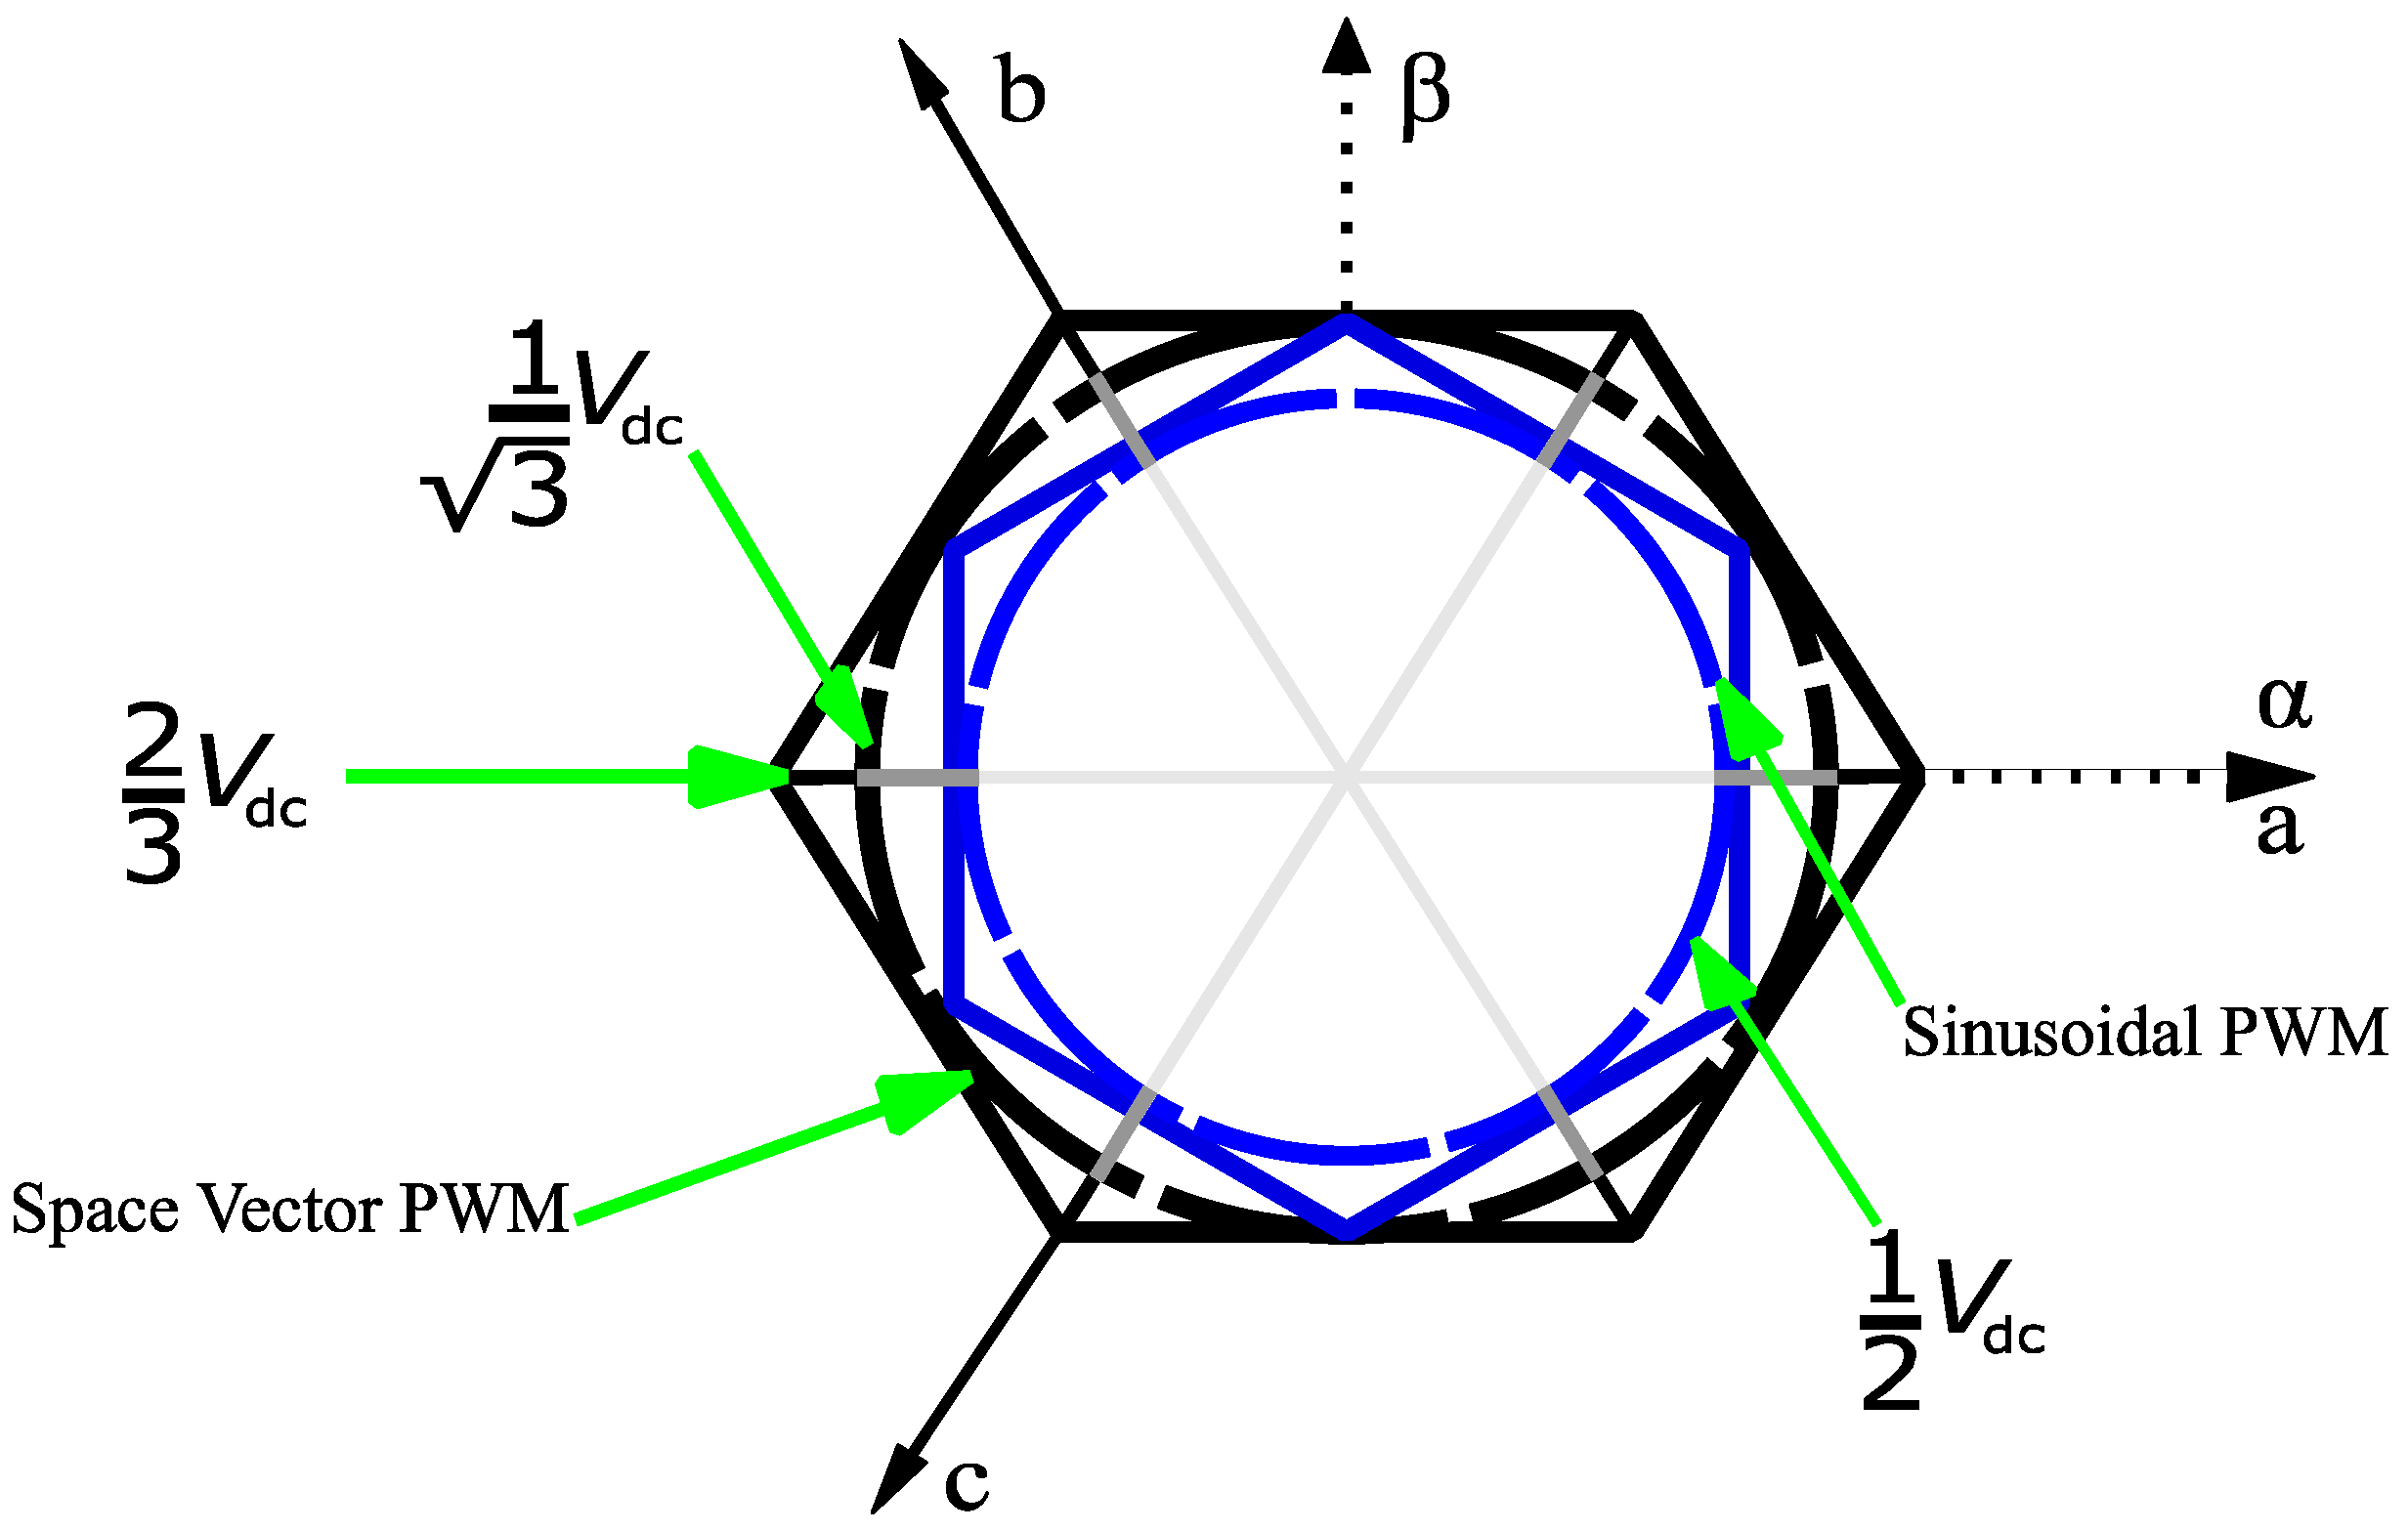
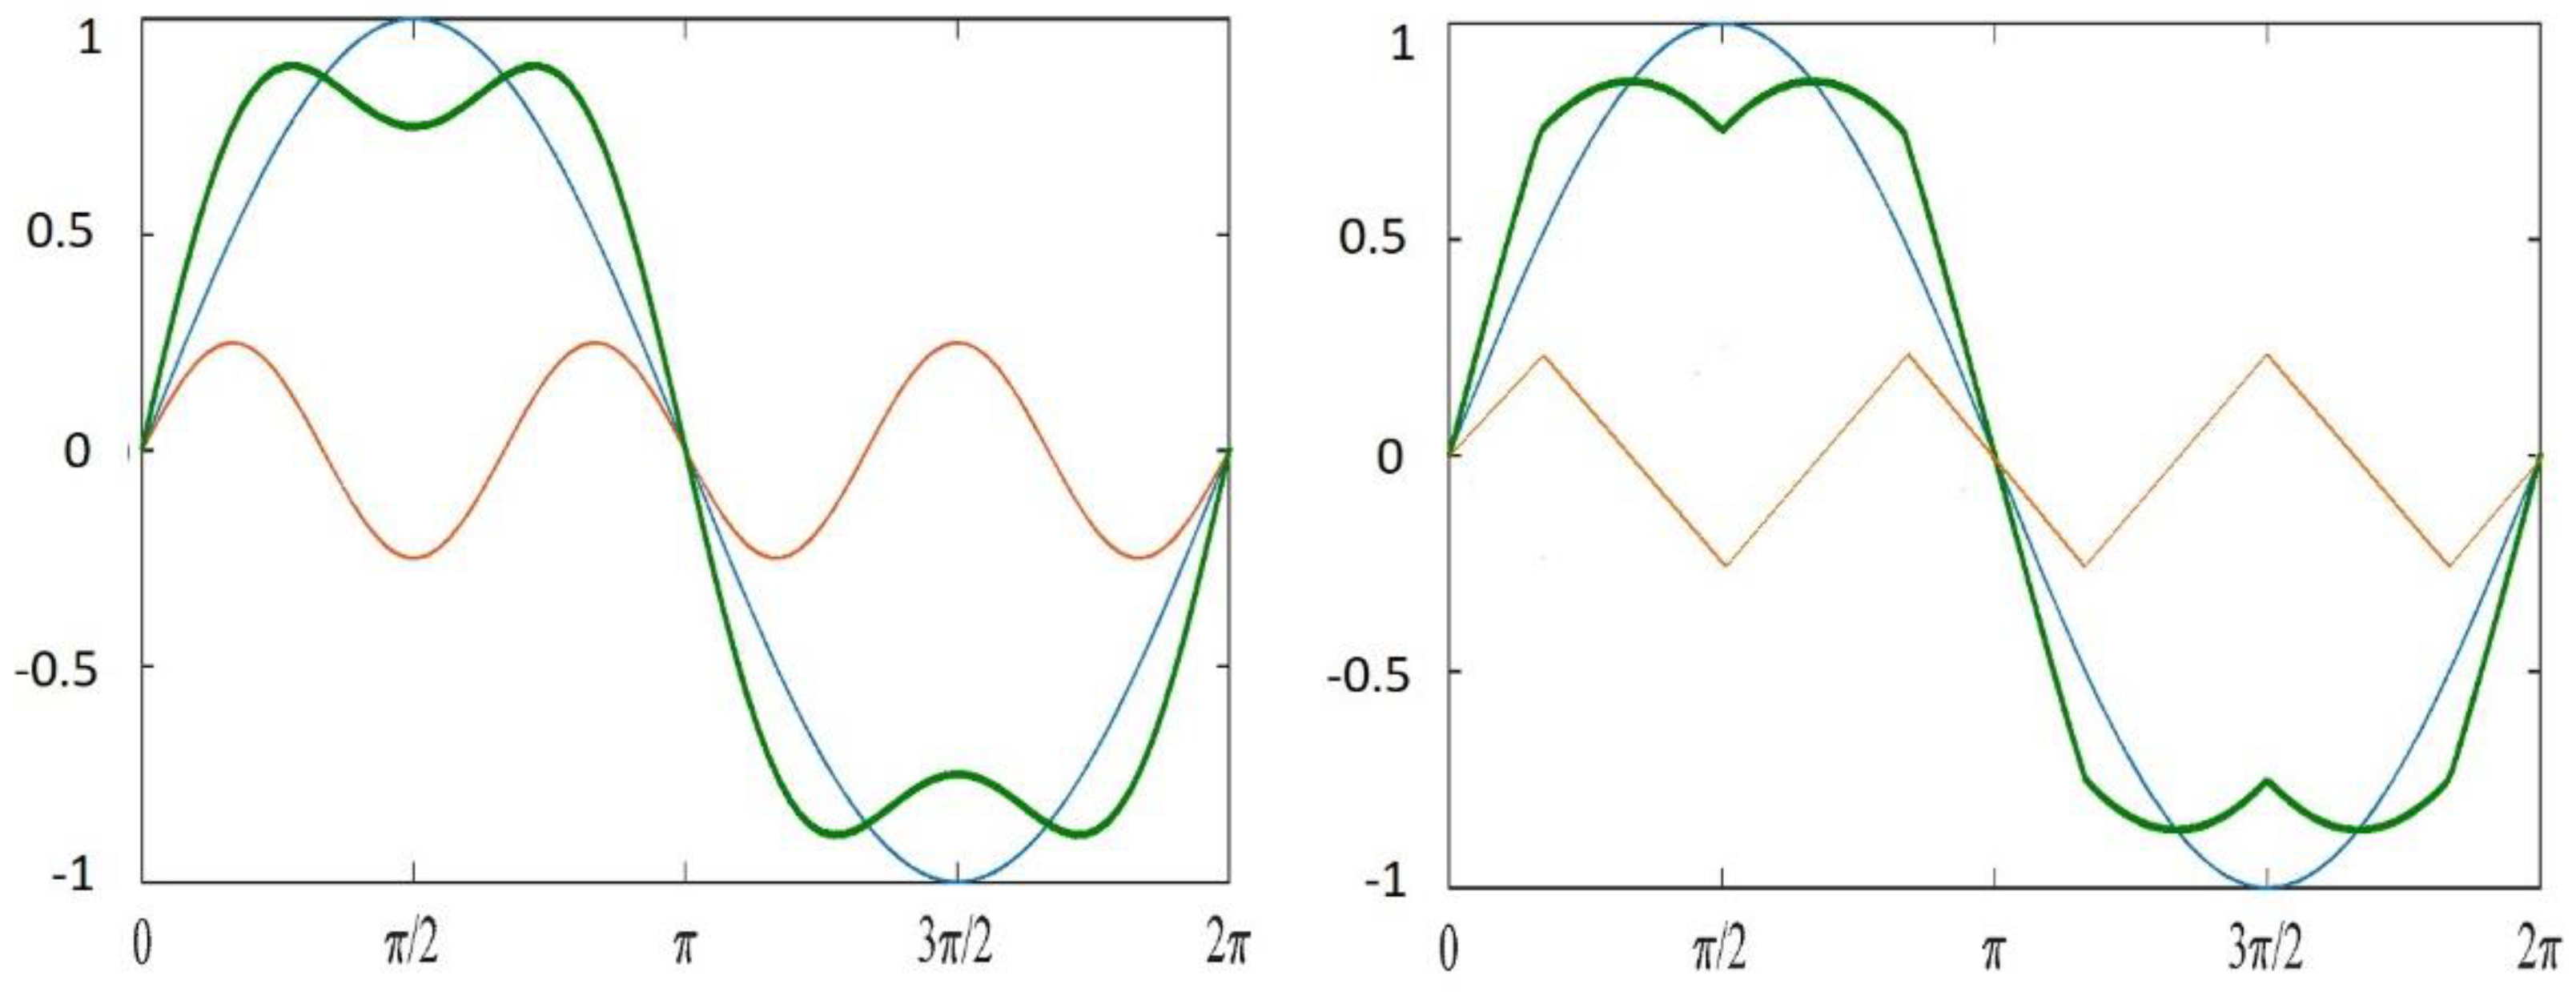
2.3.3. Designing of Modulation Parameters

For a felicitous design of PMSM and three-phase inverter in the PLECS simulation model, specific parameters are chosen as a constraint for the optimal operation of the electric drive train mentioned in Table 2. Nonetheless, other parameters are calculated through a set of derivations.
For this reason, flux linkage ψ P M and stator inductance L s   ( L s = L q = L d ) is calculated, in particular flux linkage ψ P M , which is an important parameter, as it enables the optimal utilization of DC-link voltage by limiting the back-EMF. From Figure 14, it can be seen that battery is used as a voltage source; however, interconnections of various cells and power cables within the battery pack affix internal resistance R i n t and inductance L i n t .
v D C l i n k = v b a t I i n , m a x R i n t
v D C l i n k = P m a x η I i n , m a x
Putting (10) in Equation (11),
I i n , m a x 2 v b a t R i n t I i n , m a x + P m a x η R i n t = 0
Applying the quadratic equation to determine the inverter input current I i n , m a x ,
I i n , m a x = v b a t 2 R i n t 1 2 [ ( v b a t R i n t ) 2 4 P m a x η R i n t ]
Similarly, phase voltage v s is calculated:
v s , m a x = m   v D C l i n k 2
From Figure 15, a relationship between stator and flux linkage is drawn:
R s i q + ω e l ψ P M = v s cos φ
Using the motor torque and power relation and also the PMSM torque,
P = M ω m e c h
M = 3 2 p p i q ψ P M
and
ω m e c h = ω e l p p
P = 3 2 p p i q ψ P M ( ω e l p p )
Putting (19) in Equation (15),
3 R s i q 2 3 v s cos φ i q + 2 P = 0
Applying the quadratic equation to determine the inverter input current i q ,
i q = 3 v s cos φ [ ( 3 v s cos φ ) 2 24 P R s ] 6 R s
Since i q is known, flux linkage ψ P M can be calculated:
ψ P M = 2 P 3 ω e l i q
ω e l = 2 π n r e f p p 60
Similarly, stator inductance L s can also be determined by using the vector diagram.
L s = v s sin ( cos 1 ( P F ) ) i q ω e l
The values calculated through the derivation can be verified in the simulation. The values calculated in Table 3 and graphically depicted in Figure 15 at a maximum rotation speed n b a s e of 6000 rpm when   i d = 0 . Figure 16 provides the graphical verification between theoretical calculation and simultaneous PLECS simulation measurements. Phase current and voltage are depicted in the three-phase current and voltage, respectively. Likewise, the average DC-link voltage is measured, which endorses the analytically calculated parameter.
The peak-to-peak value of the phase voltages is only slightly smaller than the available DC-link voltage. Consequently, it can be stated that the motor flux linkage ψ P M is optimally calculated to utilize the available DC-link voltage efficiently. Additionally, the simulative results in the nominal point of operation confirm the desired power factor of cos φ = 0.9.

2.4. Simulation Modelling

For this study, two different techniques were considering for simulation to reduce DC link capacitor. In the first technique, there is an additional passive notch filter used in parallel to the DC-link capacitor. The idea is to tune the passive filter to cancel out the dominant harmonics of the current in the DC-link capacitor. In the second technique, a modification is performed in the modulation strategy by controlling the currents in the parallel windings of the PMSM individually.

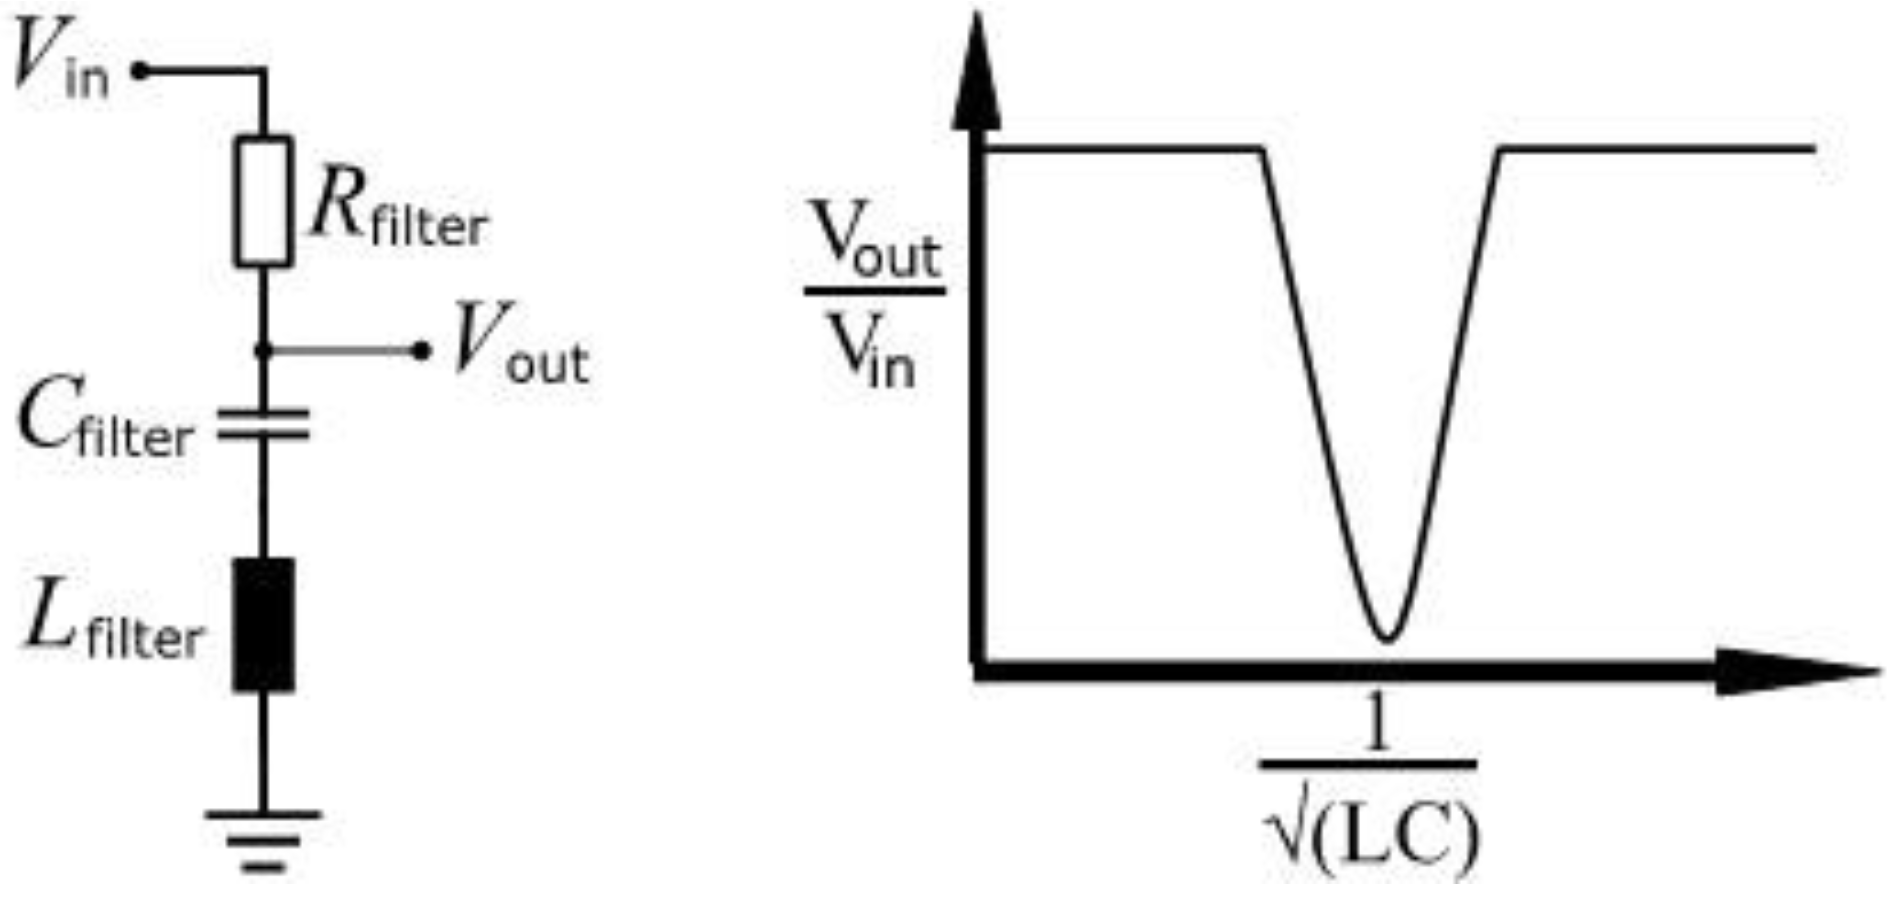
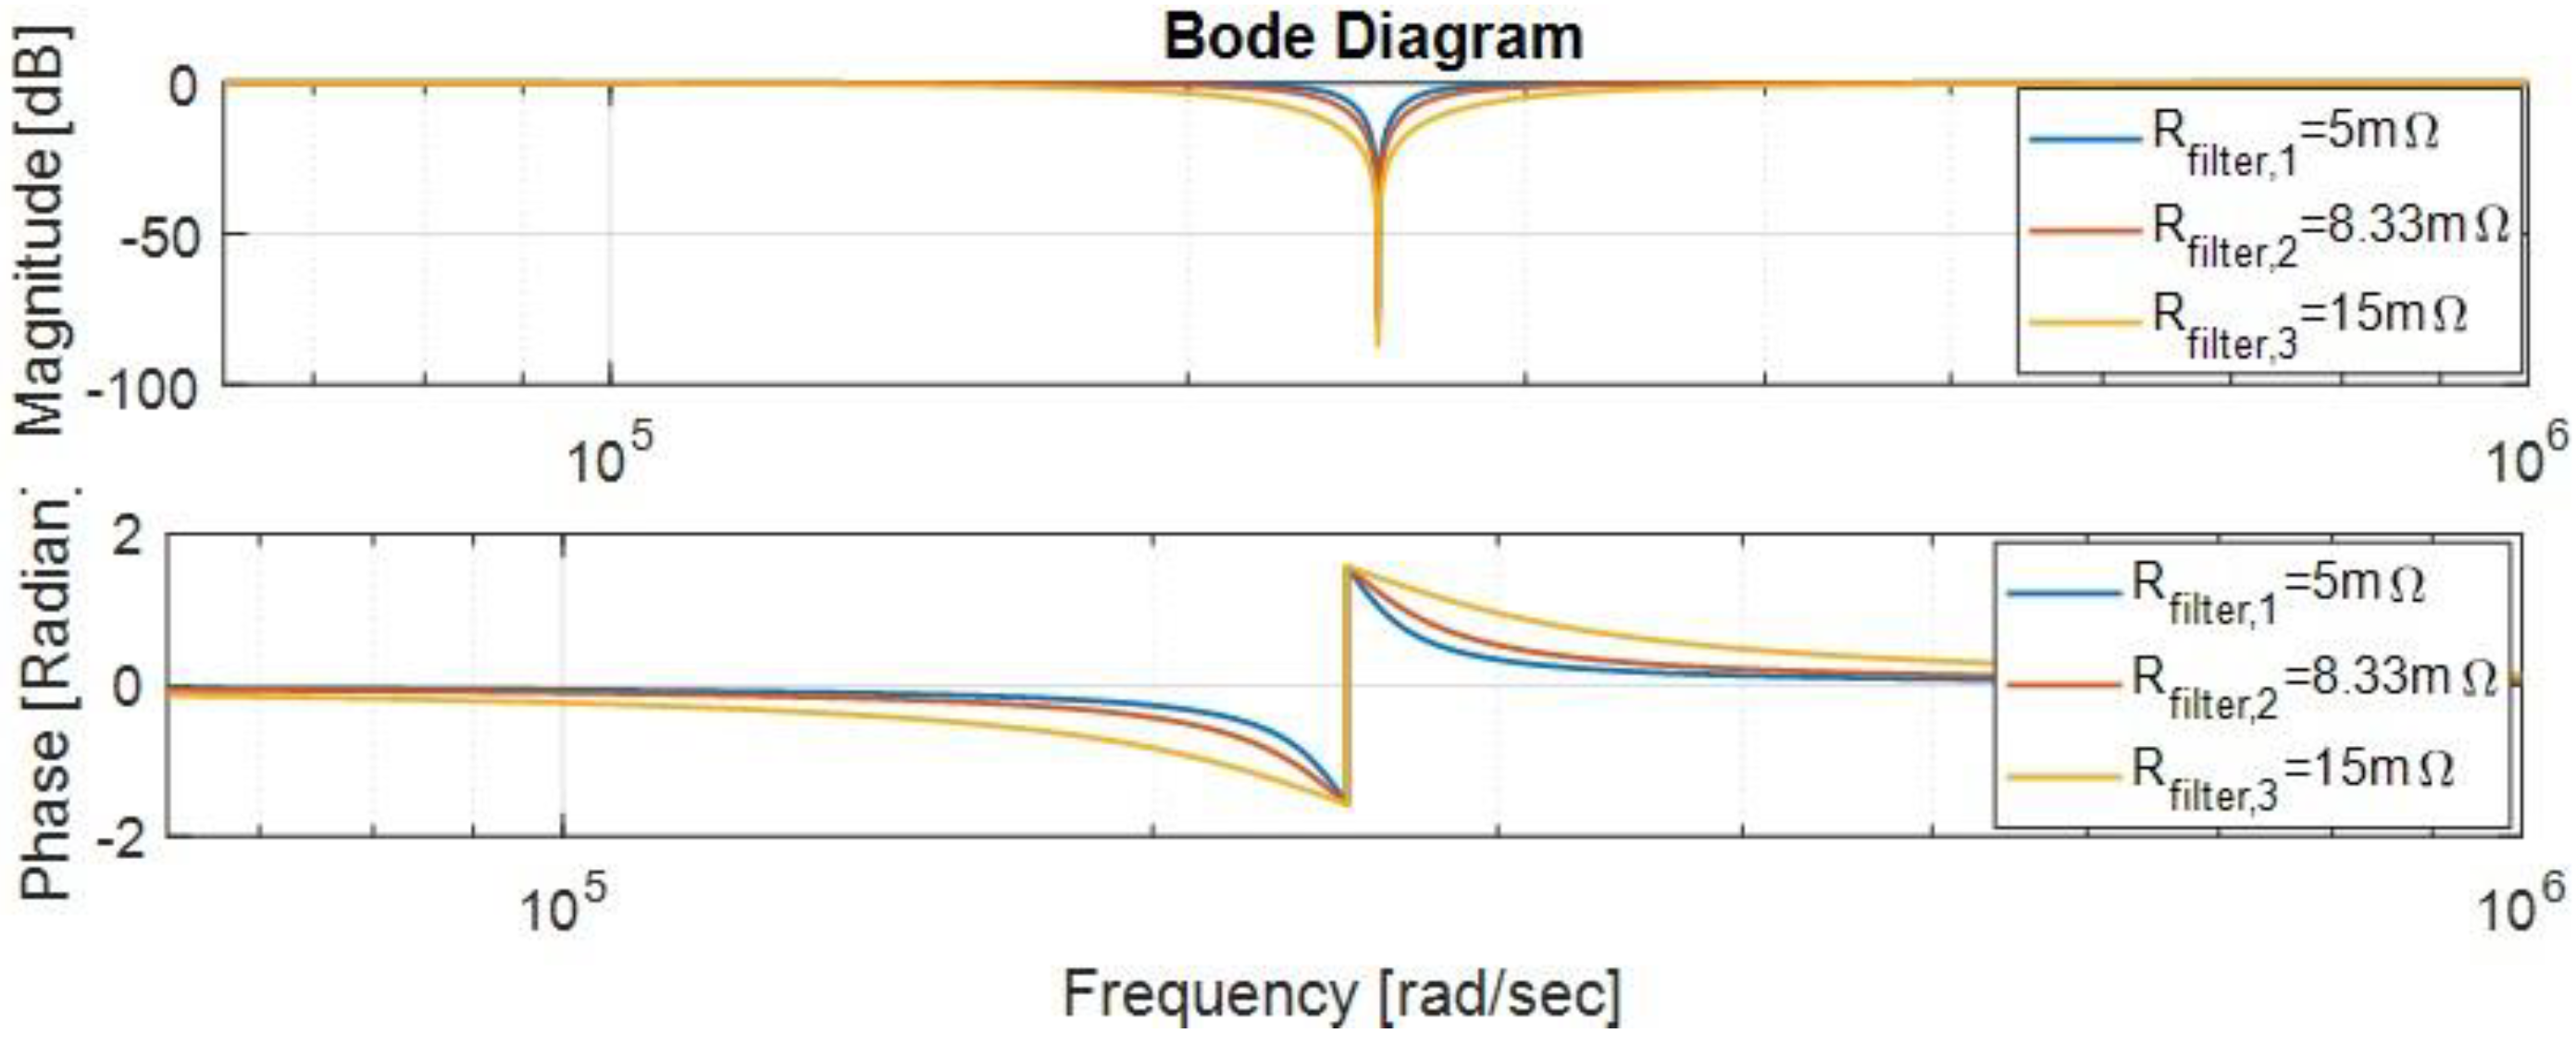
2.4.1. Passive Notch Filter

The passive notch filter is also known as a band-stop filter or a band-elimination filter. The filter allows most of the frequency components unaltered but attenuates components in a specific frequency range. It is formed by the combination of a high-pass and low-pass filter connected in parallel, consisting of two cut-off frequencies, which are determined by the circuit design. This filter consists of a resistor, an inductor, and a capacitor, where output is taken from a filter capacitor and inductor that are connected in series as shown in Figure 17. This RLC circuit acts as an open circuit at very high and very low frequency, attenuating the dominant harmonic, whereas the filter acts as a short circuit for mid frequencies [21].
The cut-off frequency depends upon the passive component values. These component values are calculated by the transfer function of the circuit, as shown in Equation (25):
( s ) = V o u t V i n = s 2 + 1 L C s 2 + R L s + 1 L C
From the transfer function, other parameters such as damping factor ζ and resonance frequency ω n can be determined:
ζ = R L
ω n = 1 L C
These parameters can be depicted on the bode diagram as shown in Figure 18, where it is used as a verification tool to verify whether particular component values are able to filter out the dominate frequency harmonics [22].
With the parameters C F i l t e r = 10 μF, R F i l t e r = 5, 8.33, 15 mΩ, and L F i l t e r = 1.58 μH, a notch and phase shift can be noted at 251 Krad/s or 40 kHz in magnitude and phase graph, respectively. Resistor values are varied in the plot, which implies that increasing resistance increases the bandwidth of the notch but also increases the ohmic losses. The notch appears at the double switching frequency f s w = 20 kHz, enabling the RLC circuit to attenuate the second domain harmonic that can also be seen in the current spectrum, which is later discussed in the results. The filter components are tuned to filter out the second harmonic since it is a dominant harmonic in most points of operation. Adding more passive filters enables the circuit to attenuate the fourth- and sixth-dominant harmonics. However, adding additional passive filters to the circuit increases the losses and reduces the efficiency of the power train.
The simulation structure used for the notch filter is similar to Figure 17. The PLECS model includes an additional passive filter circuit, which is added between the DC-link capacitor and the three-phase inverter, as shown in Figure 19. The gate signals to switches are provided by the Simulink model of FOC as described earlier.
In order to analyze the overall system, the results obtained from simulating the electric drive train circuit must be verified analytically. This approach evaluates the precision of the system and its corresponding parameters. Each point of operation in the I-quadrant operation matrix can be verified through a set of derivations in MATLAB. According to several scientific sources [23], the DC-link capacitor is designed from Equation (2), and RMS capacitor current I c , R M S in Equation (2) is calculated by
I C , R M S = I p h , R M S [ 2 m { 3 4 π + ( 3 π 9 M 16 ) cos φ 2 } ]
Furthermore, the inverter output phase RMS current I p h , R M S , power factor cos φ , and modulation index m are unknown parameters and can be derived from the steady-state equivalent circuit model as depicted in Figure 20. The inverter RMS current I i n v , R M S can be determined by inverter current I p h [24]. Therefore,
I p h = i d 2 + i q 2
I p h , R M S = I p h 2
Using torque equation for quadrature current,
M = 3 2 p p ψ P M i q
i q = 2 M 3 p p ψ P M
Earlier, it was learned that i d is zero in the nominal operation region because the induced back-EMF voltage is smaller than the induced back-EMF voltage in the nominal region ω e l < ω e l , r e f . However, in the flux-weakening region, the induced back-EMF is higher than the induced back EMF at the rated speed. To make sure that the voltage limit is not exceeded, a negative flux component is added, which is produced by the i d , ω e l > ω e l , r e f . The vector diagram depicted on the right of Figure 21. shows the voltages and currents of the motor in the field-weakening region. From this vector diagram, the following equations can be derived. It should be noted that R s 0 is neglected along with L d = L q = L s .
ω e l ψ P M = ω e l L s i d
( ω e l ω e l , r e f ) ψ P M = ω e l L s i d
i d = ( ω e l , r e f ω e l ) ψ P M ω e l , r e f L d
As already mentioned in Equation (18),
ω e l = 2 π p p n 60
Which leads to
i d = ( n r a t e n r e f ) ψ P M n r e f L d
Thus, putting (37) and (32) in Equation (29) enables to calculate I p h . Now, considering the DQ-axis stator voltages v q and v d in the rotating reference frame, for modulation index m ,
v d = R s i d ω e l L s i q
v q = ω e l ( ψ P M + L s i d )
Calculating phase voltage v s from the voltage vectors of the DQ-axis thus produces
v s = v d 2 + v q 2
m = 2 v s v D C l i n k
v D C l i n k can be calculated by using Equation (11). Similarly, from vector diagram Figure 21, the stator power factor angle can be calculated.
θ s = θ v θ i
cos φ = cos ( tan 1 ( v q v d ) tan 1 ( i q i d ) )

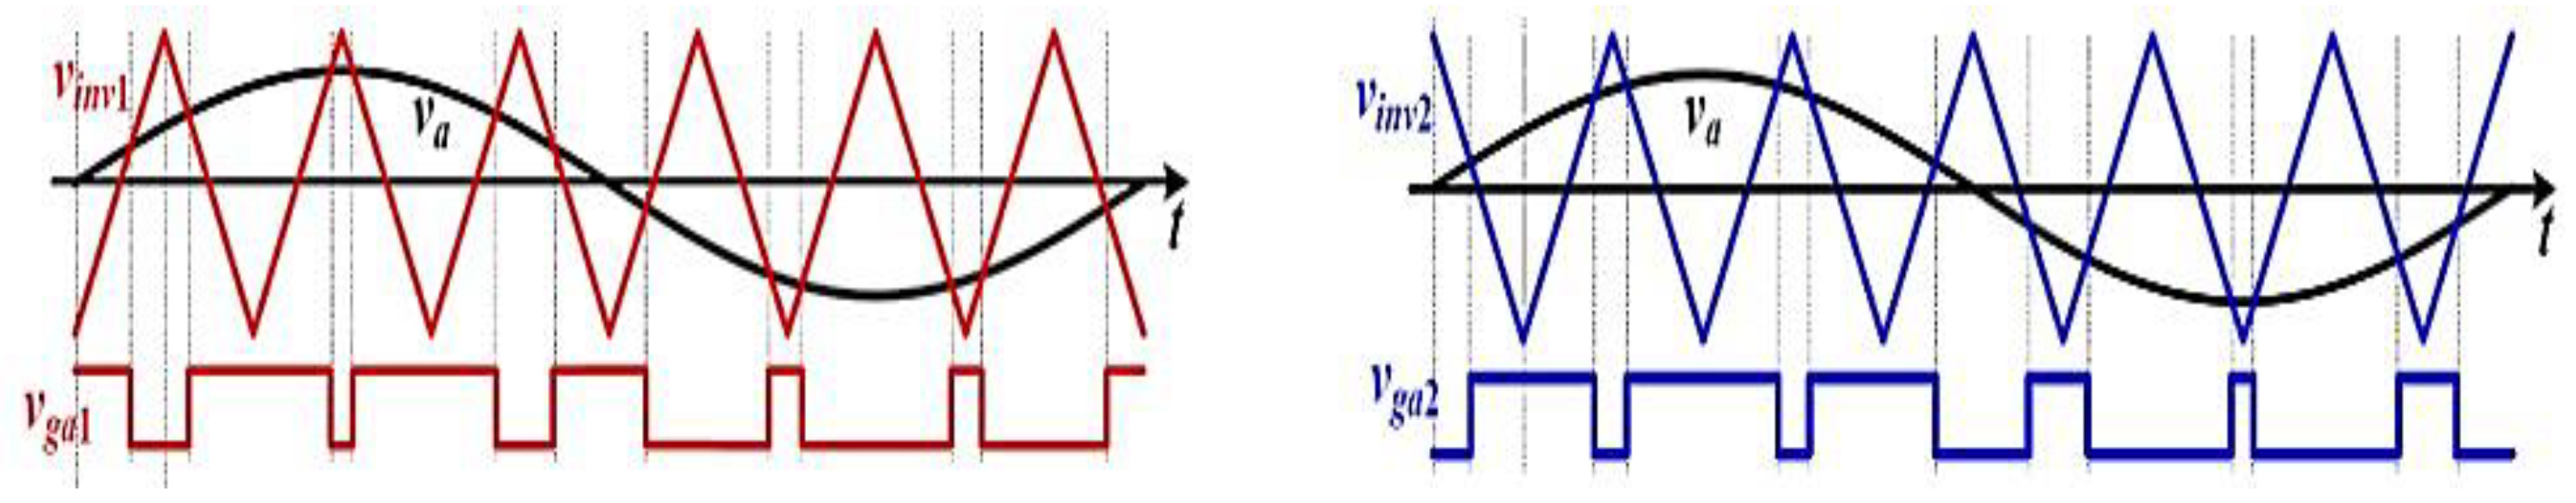
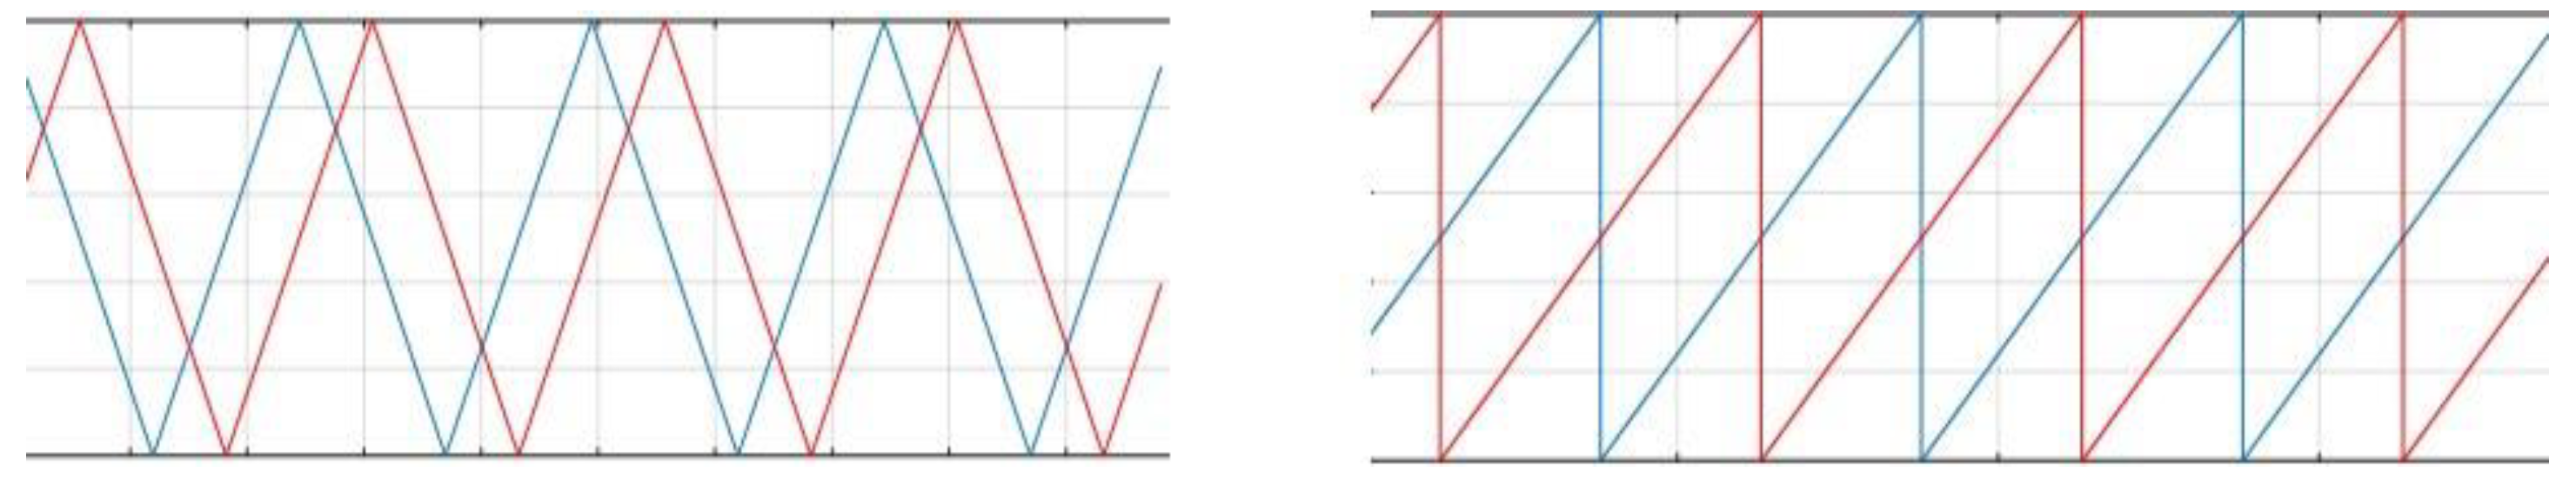
2.4.2. Change in Modulation

In contrast to the technique mentioned previously in which the additional passive filter was used to reduce the voltage ripple over the DC-link, this technique presents a measure that modifies the modulation strategy by controlling the currents in the parallel windings of the PMSM individually. The idea is to separate the windings within the PMSM into two groups of parallel windings and then to connect the parallel winding to the individual half-bridges of the inverter. In the scope of this research, a PMSM exhibiting this attribute is assumed, and the simulative models are adjusted. If windings of a three-phase motor are separated into two parallel units as depicted in Figure 22, a total of six individually controlled half-bridges in the inverter are needed. Utilizing parallel winding of the PMSM enables to control the input current of the inverter more efficiently. The duty cycles of the corresponding switches in the two independent drive units are controlled by interleaved carrier-based space vector PWM.
High ripple currents are smoothed out due to interleaving, and Figure 23 shows the principle of the interleaved PWM. A sinusoidal reference voltage v a is compared to two triangular carriers v a g 1 and v a g 2 that are phase shifted. This allows generating two different PWM signals representing the same reference voltage. By adjusting the phase shift between the carriers, the current at the input of the inverter can be manipulated. Various different modulation techniques were already investigated and presented in the literature [27]. For this study, the most promising modulation techniques are applied to the simulated drive train and investigated in detail. The carrier waveform and the phase shift between the carriers are considered degrees of freedom in the simulative investigation.
A triangular carrier modulation with a 90° phase shift is compared to a saw-tooth carrier modulation with a 180° phase shift. These control signals that are generated during the simulation are depicted in Figure 24, where blue is for the first inverter signal and red for the second inverter, which is phase-shifted.
A three-phase inverter that is operating with high currents and power levels usually has the attribute that several power switches are connected in parallel within one phase leg. This measure is needed since most commercially available power switches are not designed to lead current in the range of several hundred amps. To utilize the modulation with interleaved PWM, these parallel switches have to be separated into two groups. Therefore, the two-carrier modulation does not require any additional power switches. The number of drivers, on the other hand, needs to be increased from 6 to 12. To simplify the analysis, the inverter can be imaginarily separated into two individual three-phase inverters. The inverter input currents i i n v 1 and i i n v 2 are not available in the real application, but they prove to be very helpful for understanding and analyzing the double-carrier modulation. To keep it simple, the adjusted inverter is simulated by two three-phase inverters, which do not affect the operation or the simulation results. The MOSFET switches in the two inverters are separately controlled through the two separate controllers in Simulink MATLAB as depicted in Figure 25.
Both controller blocks are identical to each other except for a phase shift in the second inverter controller, which is provided to the wave-generator element of the “Generate_Gate_Signals2” sub-block, and with the minimum alteration in the control block, interleaving of PWM signals is generated. Battery voltage v d c , reference currents i d q , and the rotor angle θ are fed to both controllers. However, current values i A , a b c and i B , a b c are separately measured from both inverters A and B and output and are fed to the belonging controller. Figure 26 shows the PLECS model of the electric drive train compromising of two parallel three-phase inverters, A and B, which are separately connected to the windings of PMSM.

3. Results, Analysis, and Discussion

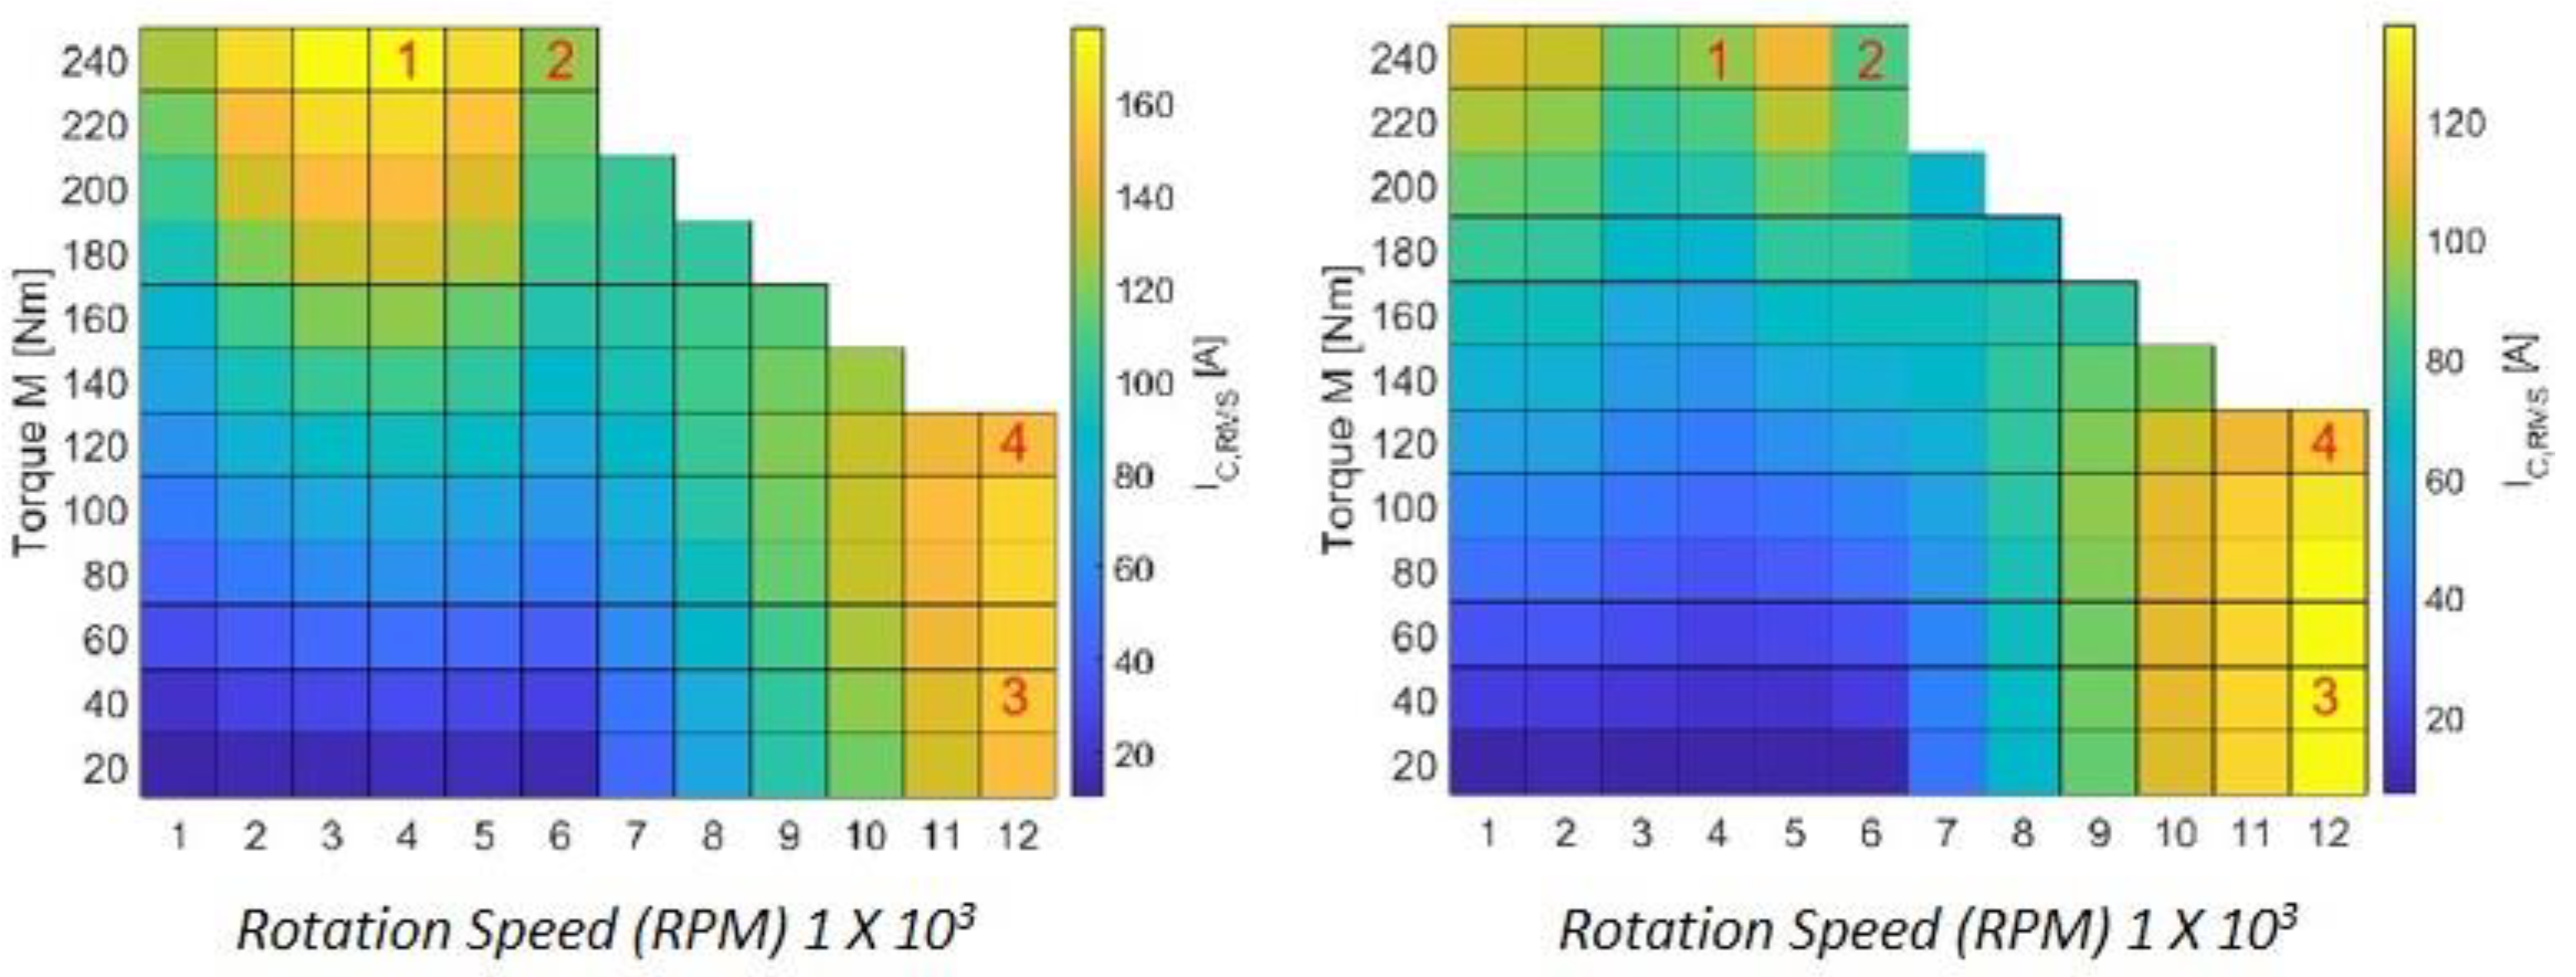
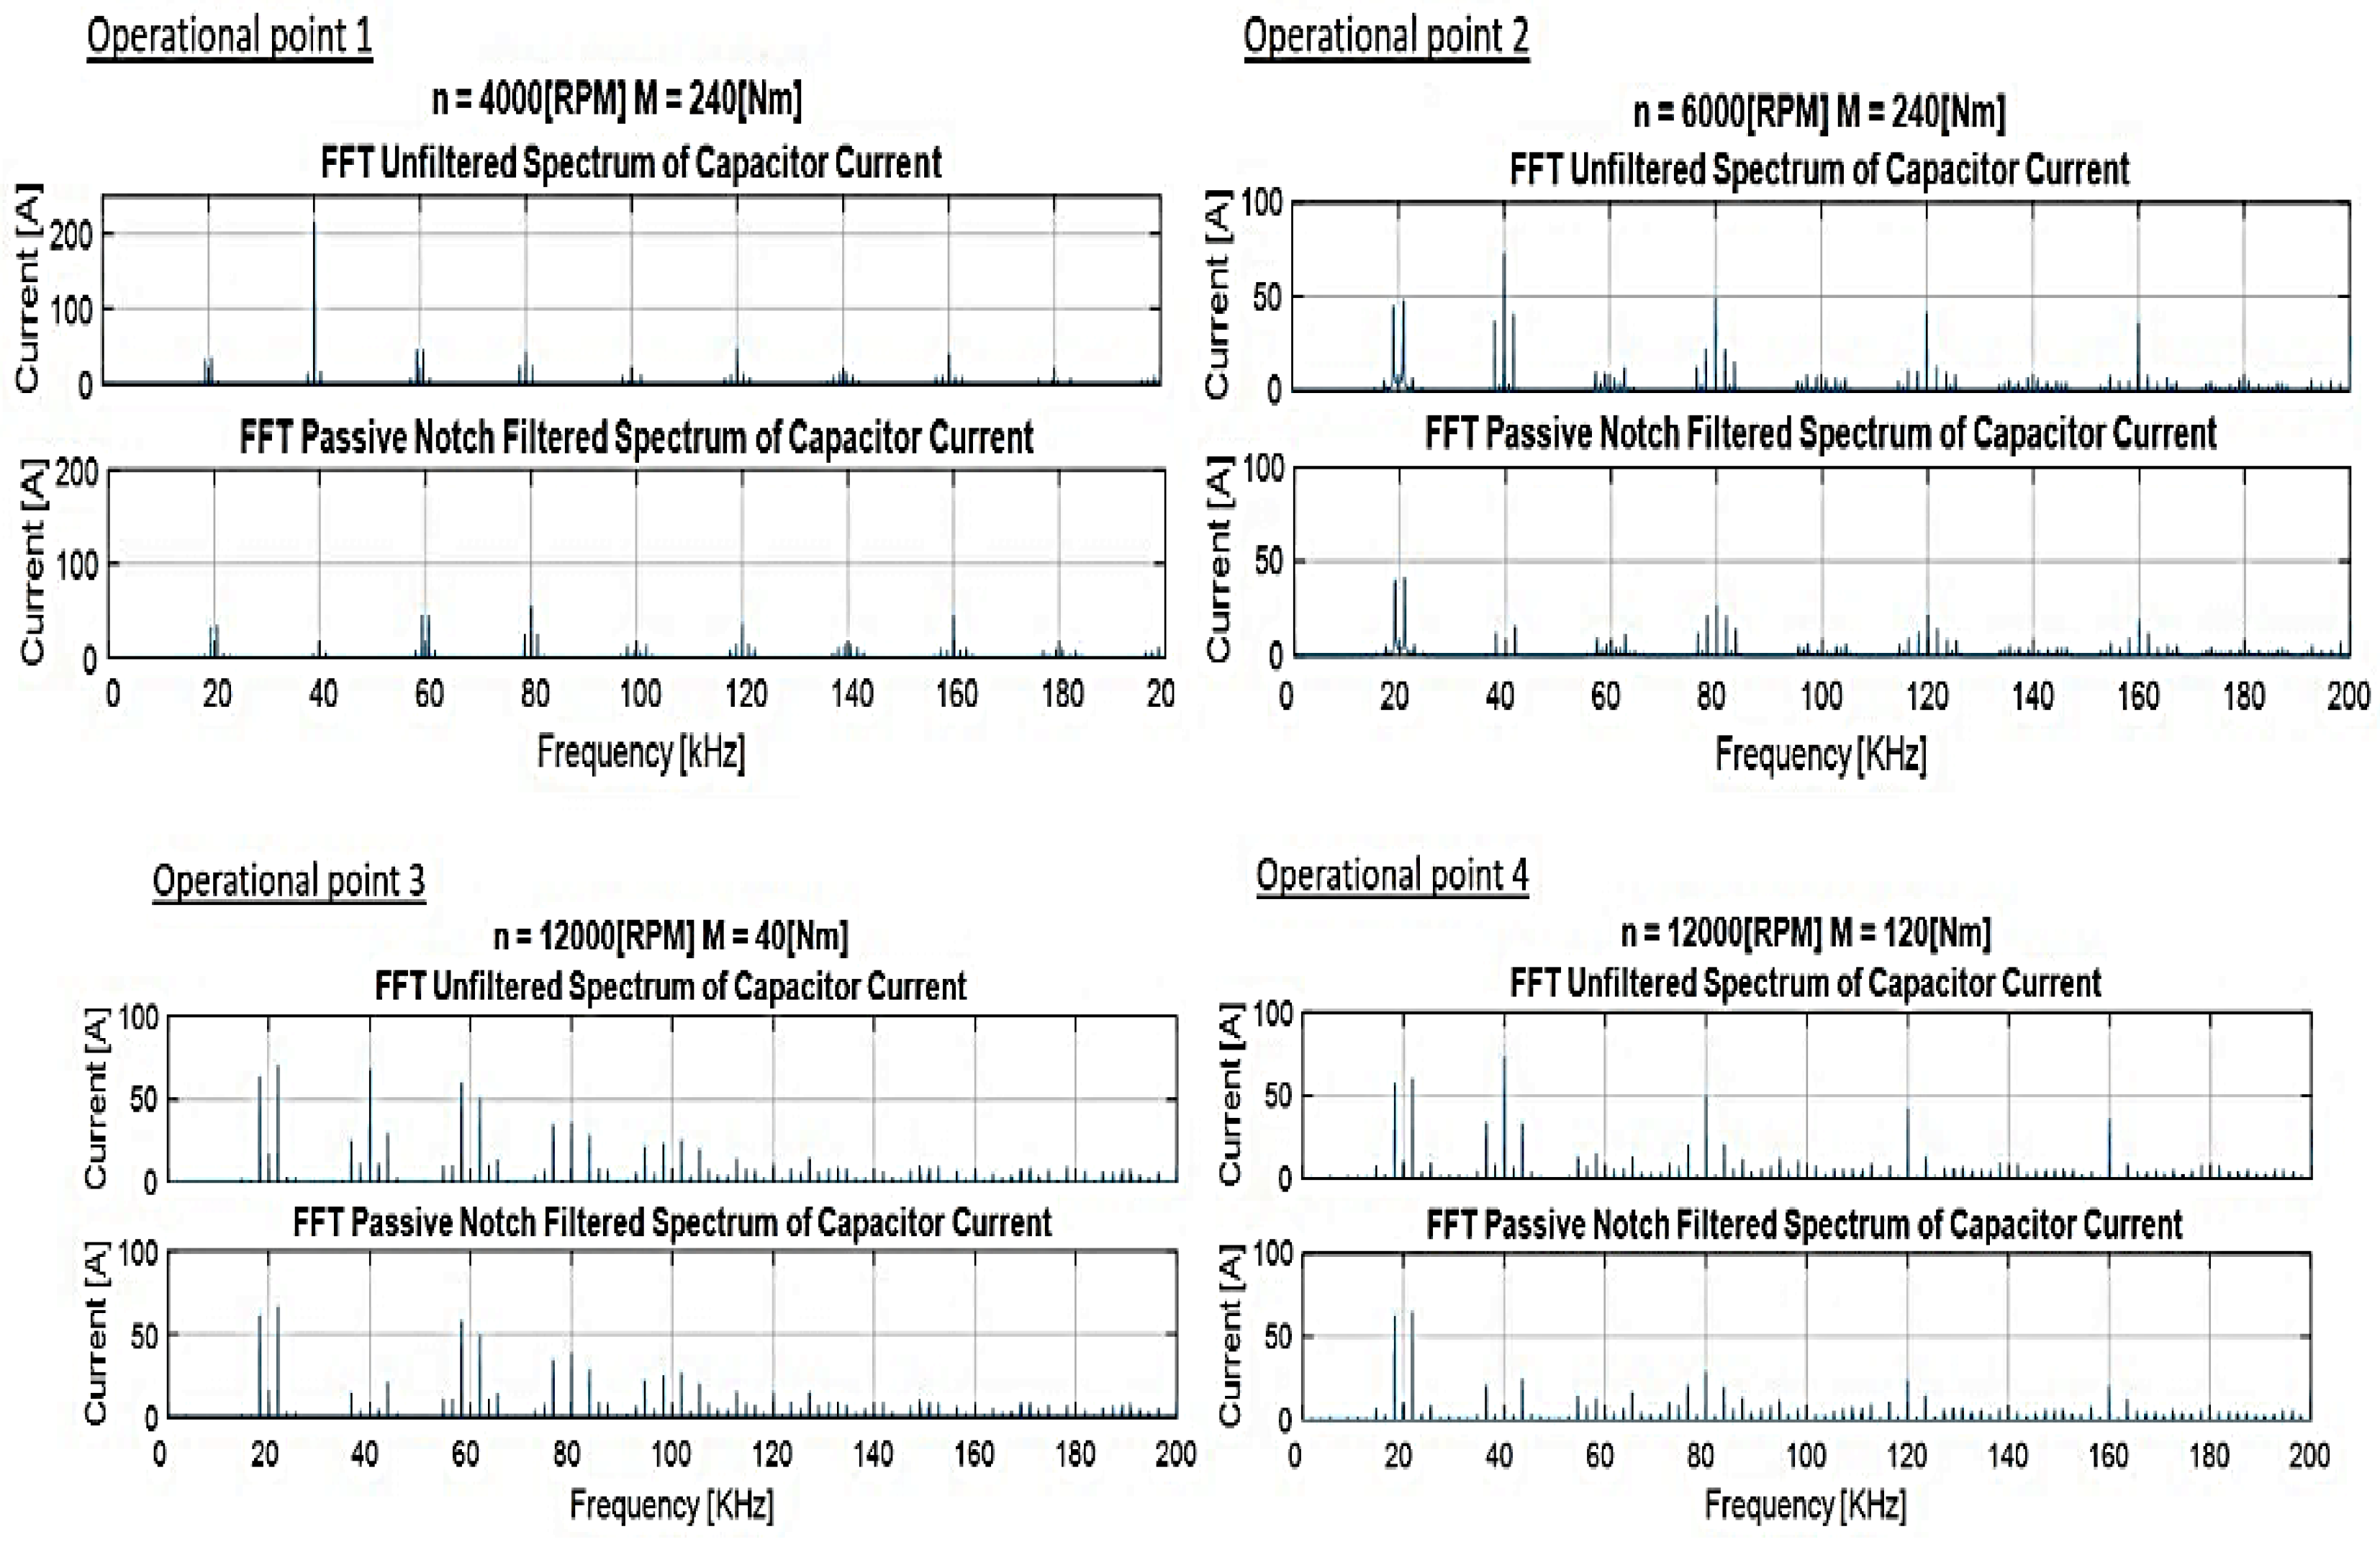
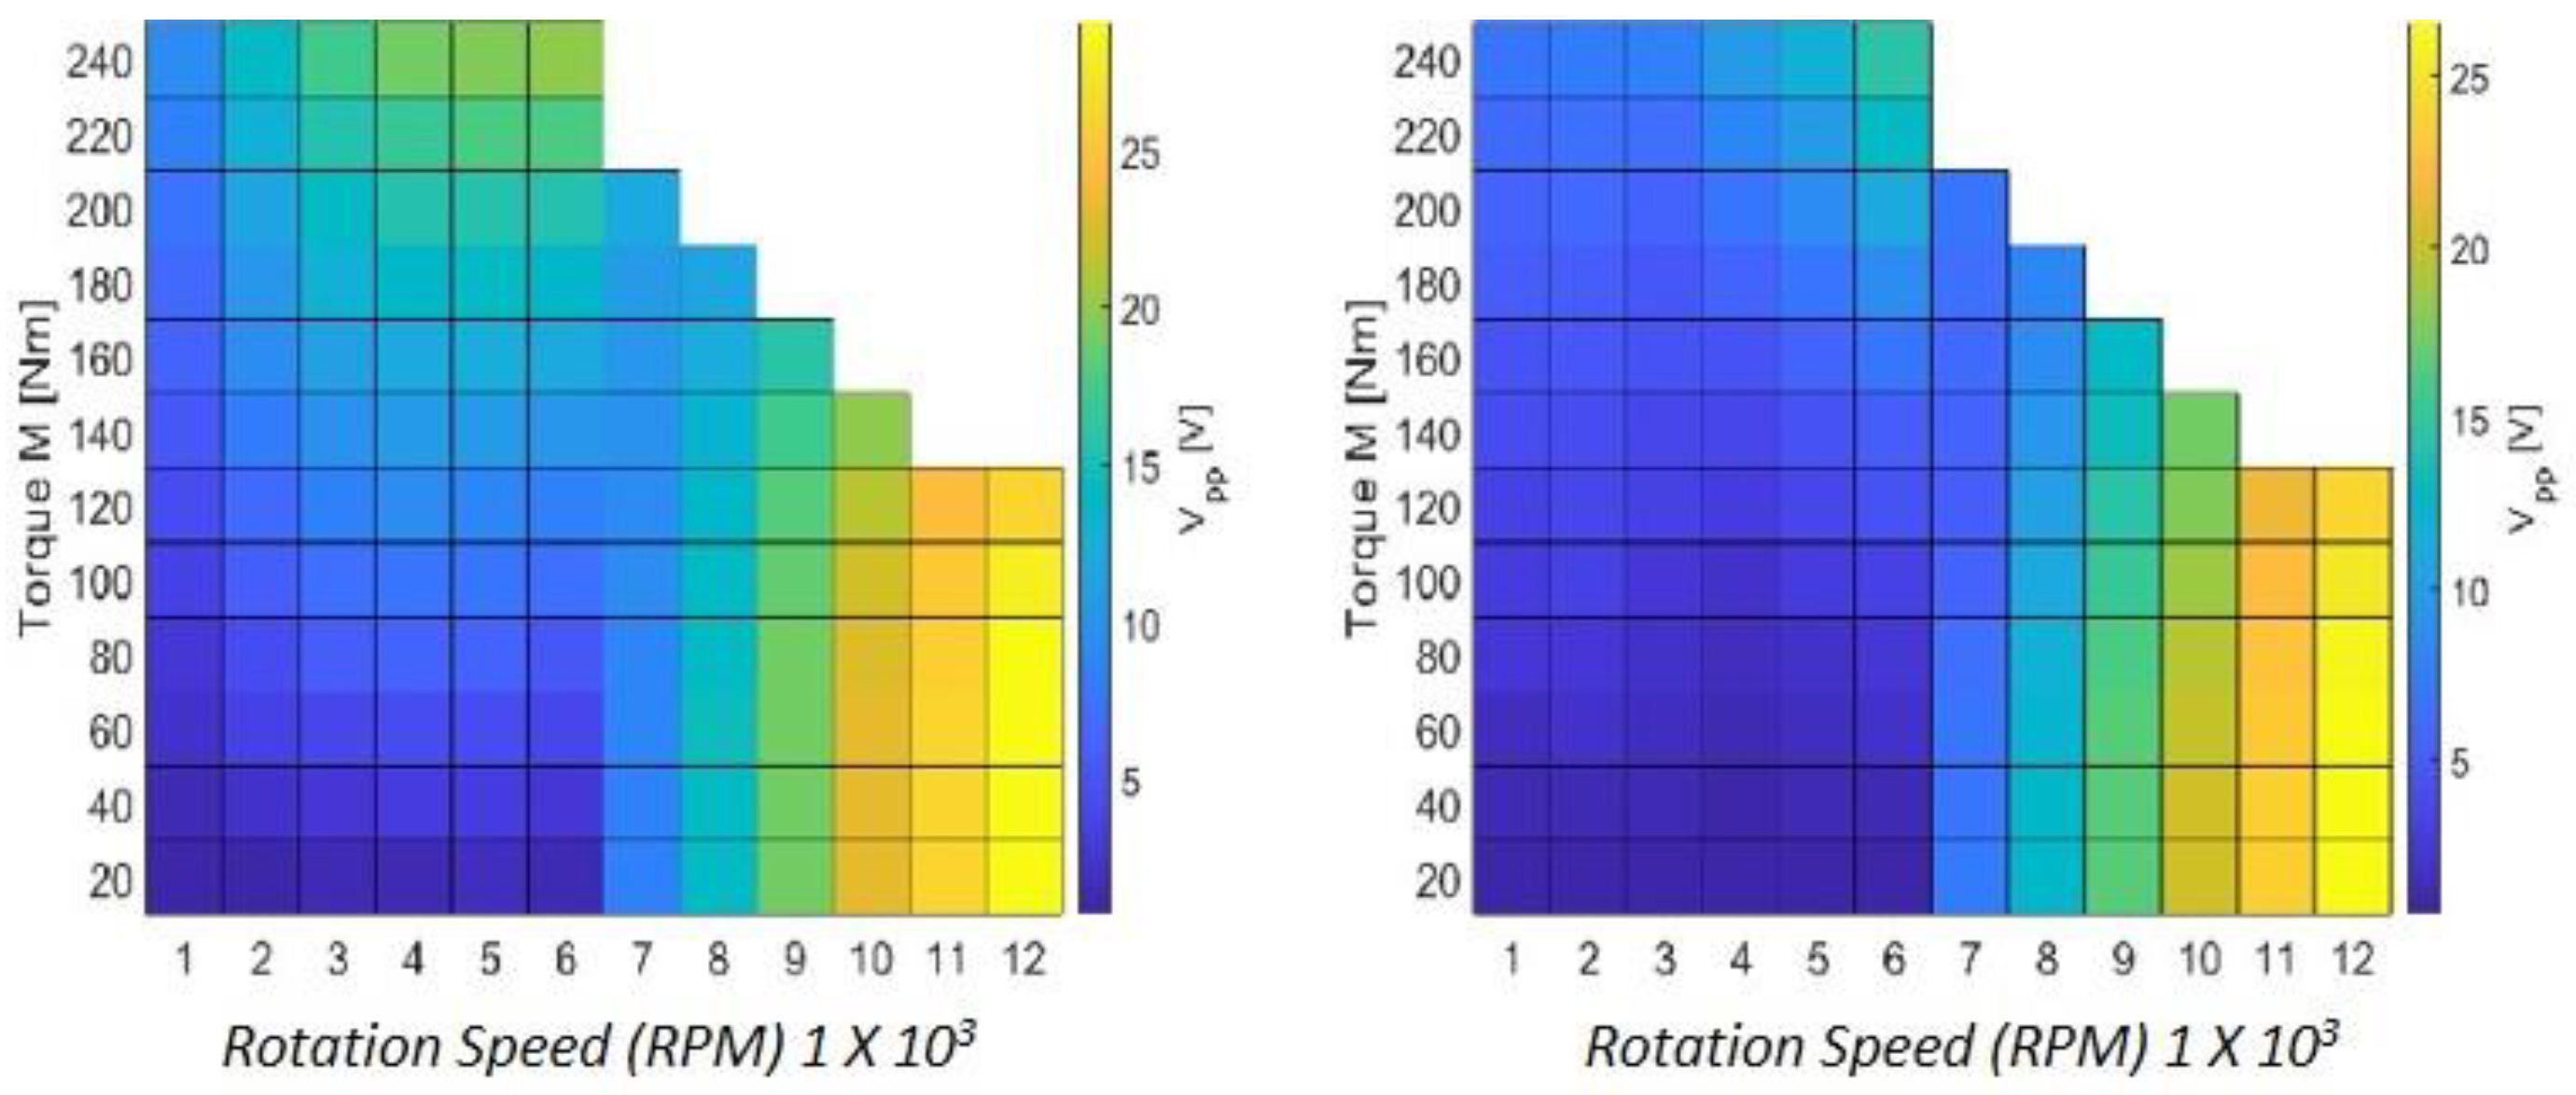
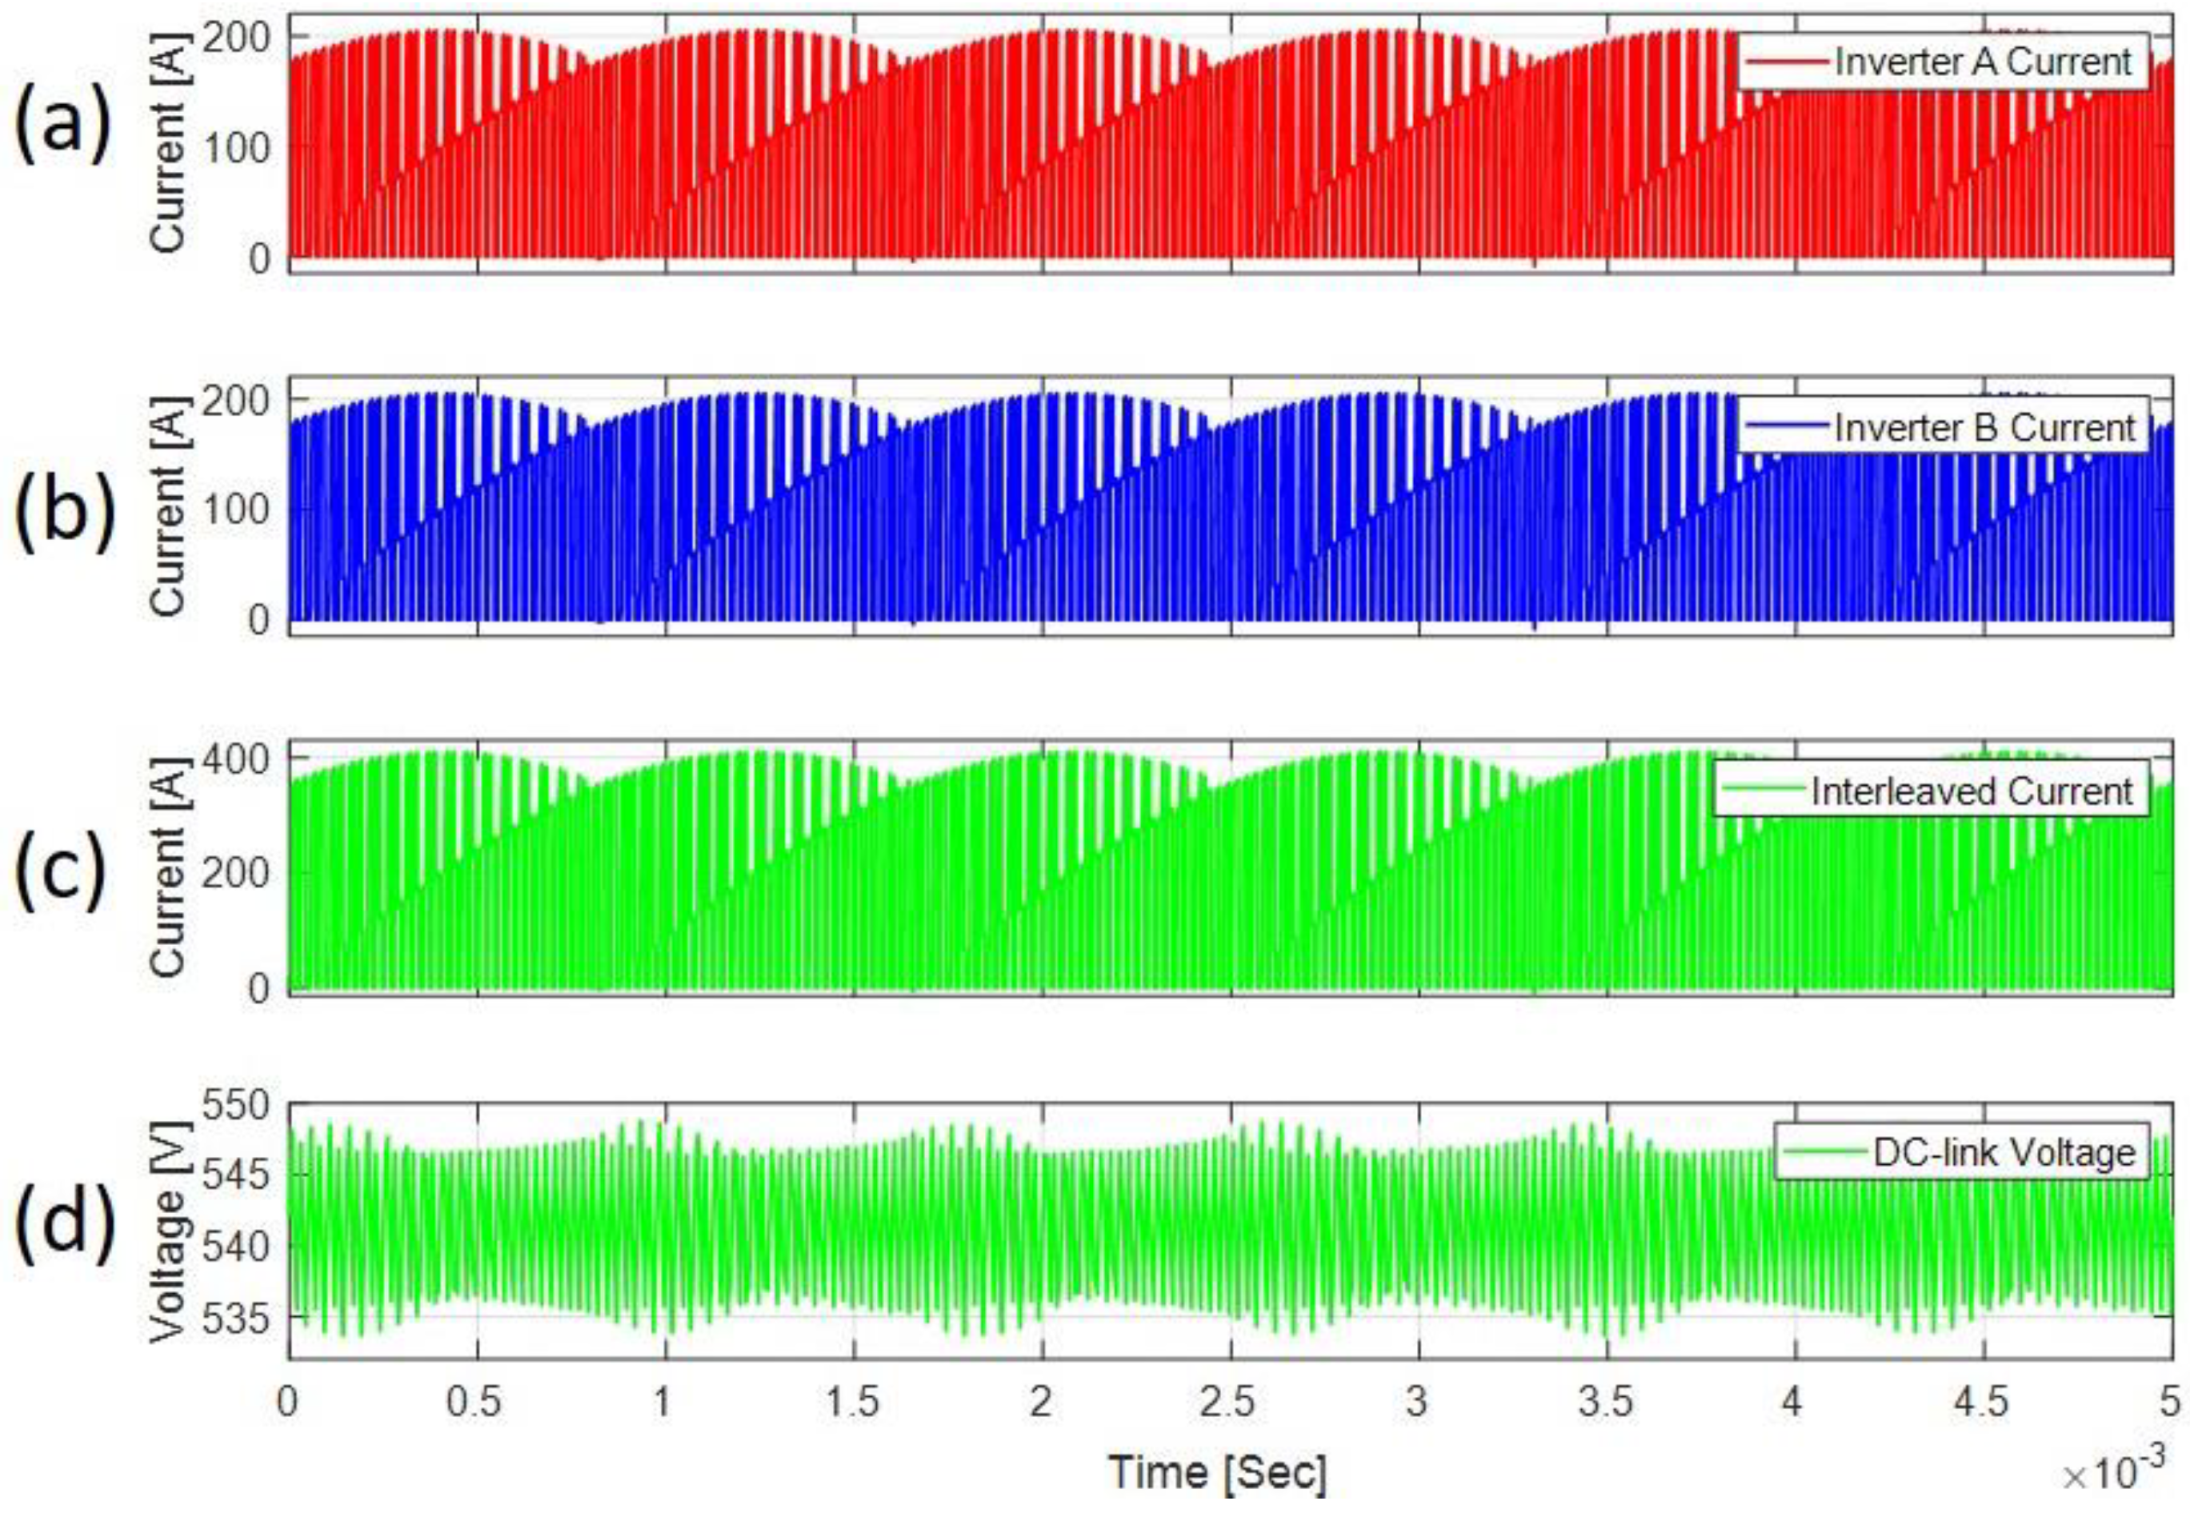
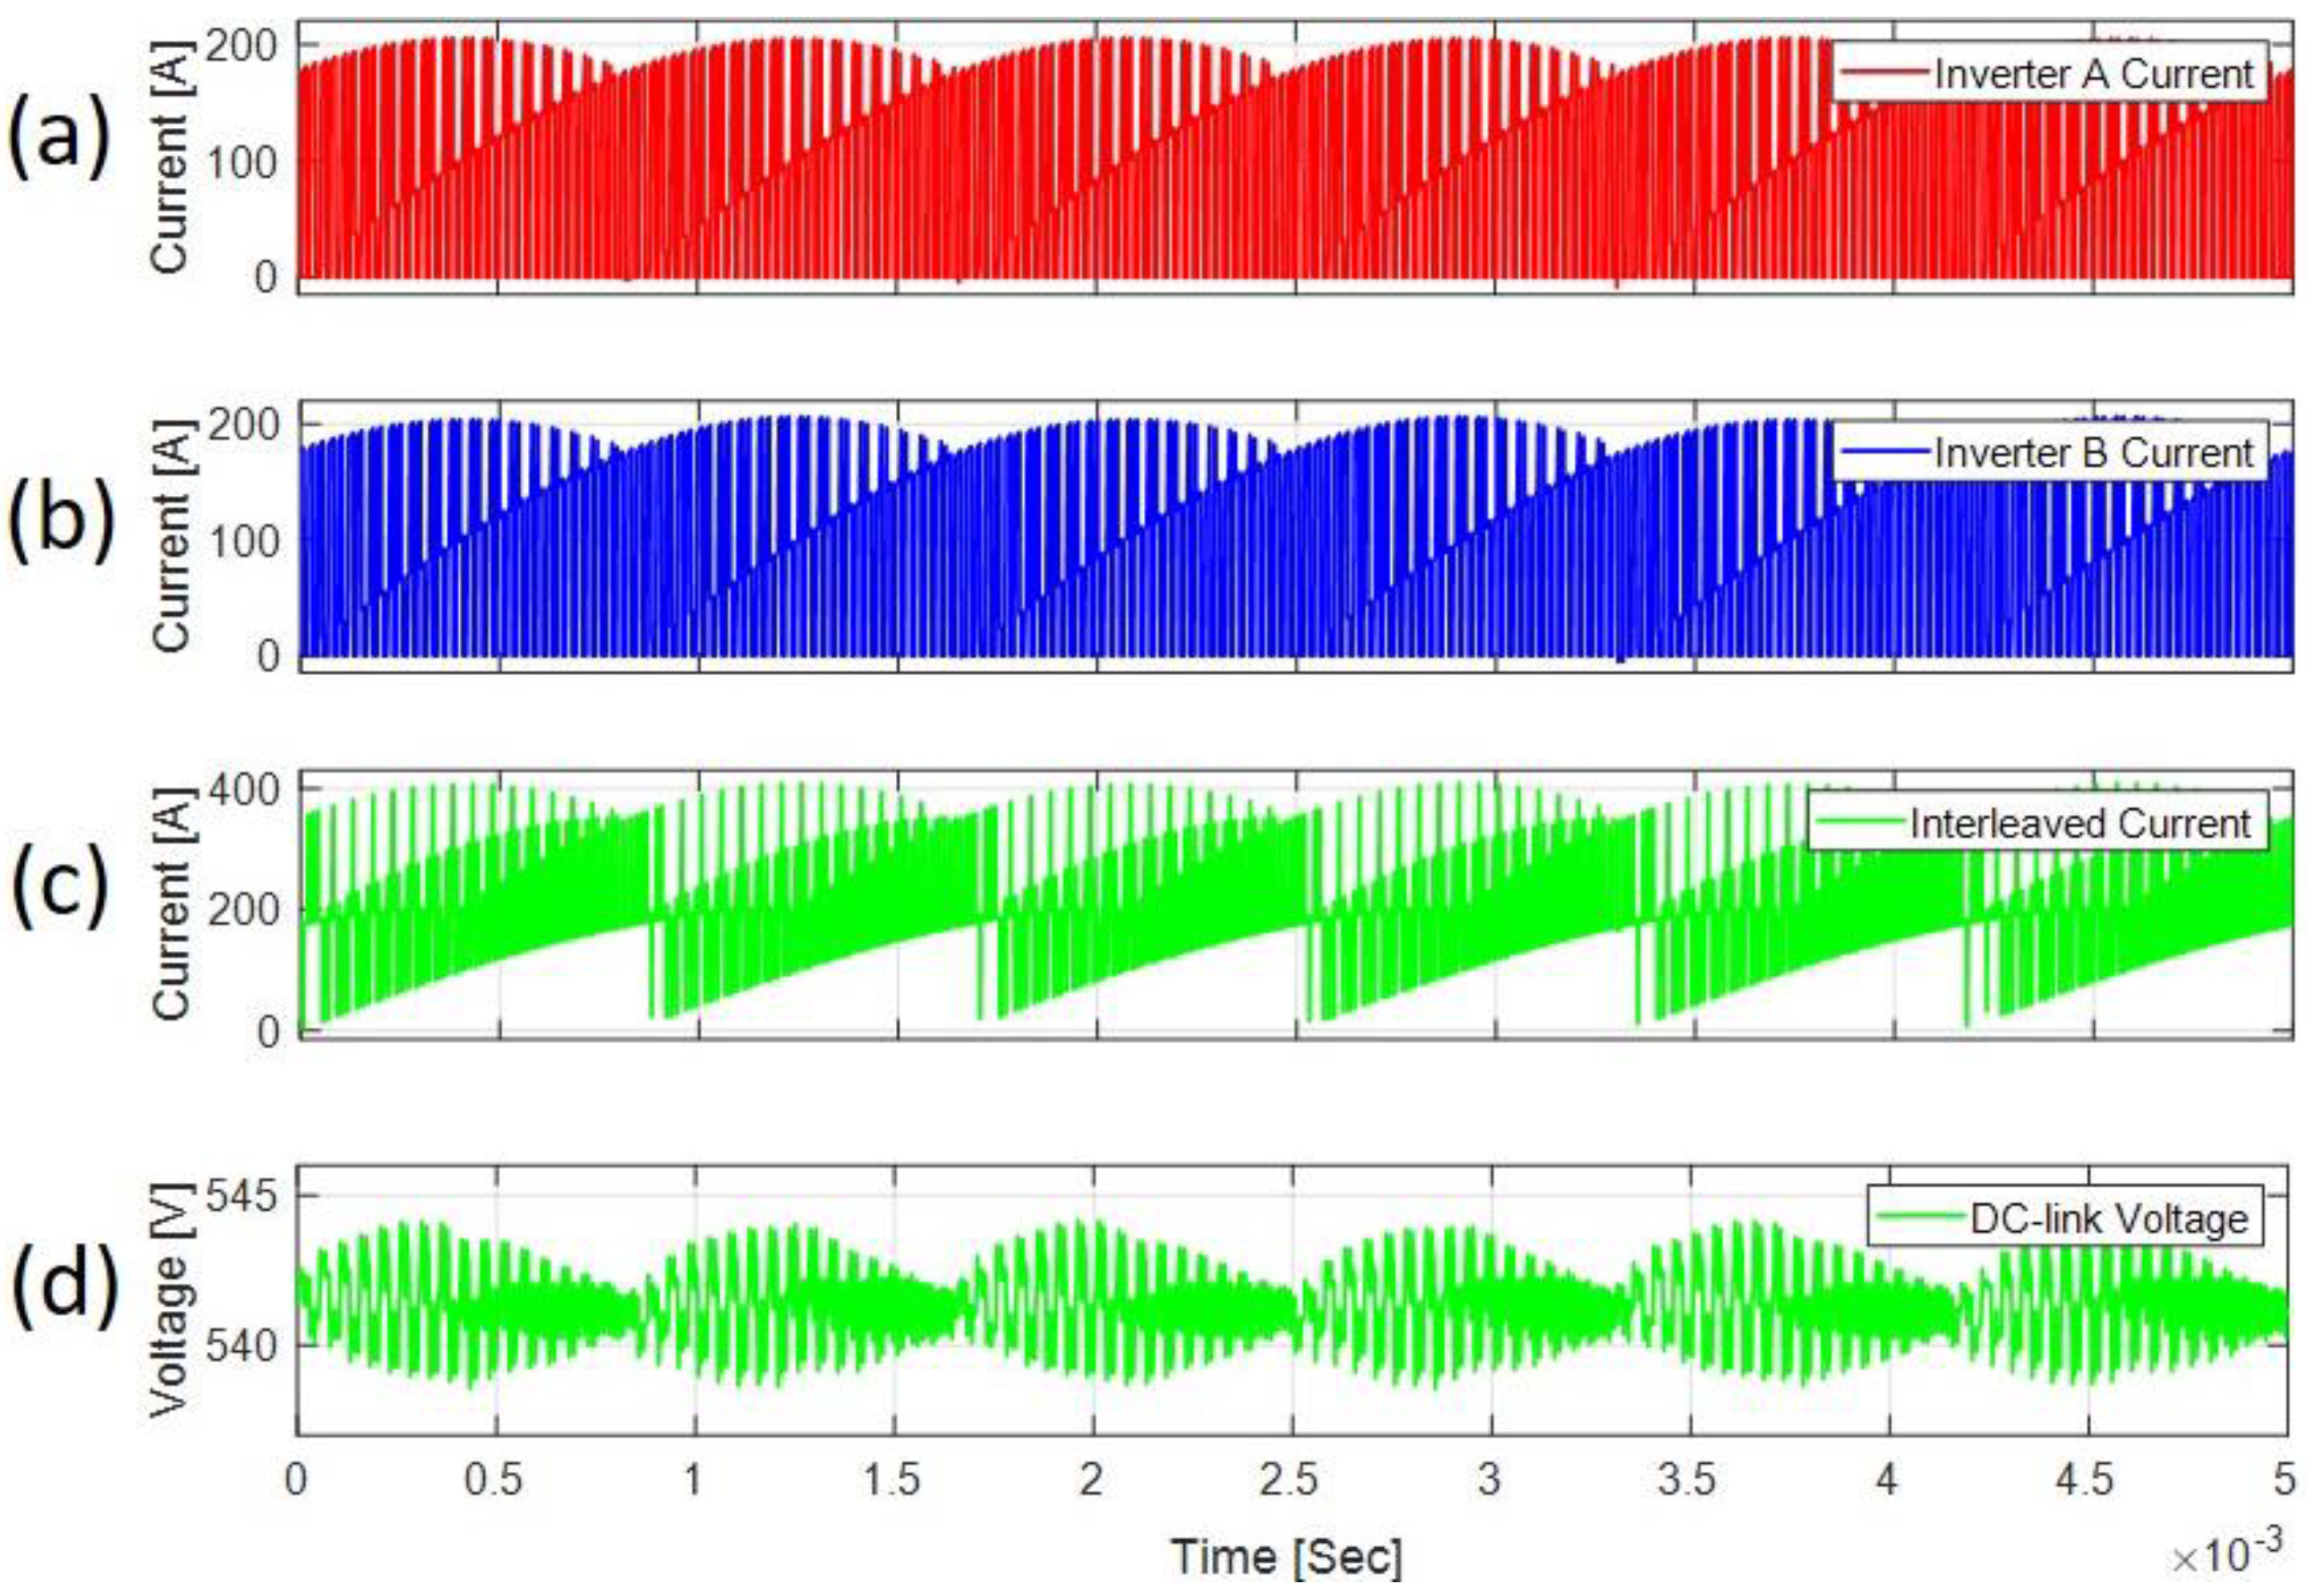
3.1. Passive Notch Filter

Analytical values that are calculated for each point of operation were similar to the result measured for each point of operation in the simulative investigation. A deviation of the results is measured between analytical and simulative I c , R M S by taking their actucal differences and relative fractional difference percentage in Figure 27. Except for a few operating points, it can be observed that most of the operating points deviated less than 1 A, which is a relatively 1% difference. The variables that influence RMS capacitor current I c , R M S are essential to calibrate. Therefore, secondary parameters modulation index, power factor, etc., indirectly influence the DC-link capacitor, and for optimum design of the DC-link capacitor, calibration of variables is vital.
After introducing a passive notch filter in the electric drive train circuit, a results comparison of RMS capacitor current I c , R M S between unfiltered and additionally filtered DC-link capacitor in Figure 28 was performed. It can be observed that significant RMS current of DC-link capacitor I c , R M S is reduced at the different point of operations. It can also be depicted that there is a particular pattern in the decrease of I c , R M S . These points of operation are investigated one by one, which can identify the critical parameters in the formation of a particular pattern and also those that influence the capacitor current. Simulations are carried out with the following parameters (shown in Table 4), which are kept constant in different simulations.
The maximal value of the RMS capacitor current I c , R M S is 170 A, which occurs for an operational point of n = 4000 rpm and M = 240 Nm. Adding an additional passive notch filter tuned to cancel out the second harmonic, the RMS current in the DC-link capacitor can be reduced to 90 A for this point of operation. The new maximal current occurs deep in the field-weakening region at n = 12,000 rpm and M = 40 Nm as shown in Figure 28 (right).
Analysis of the four individual points of operation marked red in Figure 28 can help in elaborating the functionality of a passive notch filter. A summary of data extracted from the I c , R M S and V p p matrix is presented in Table 5. Figure 29 further shows DC-link capacitor current spectrum with dominant harmonics at different four points as marked in Figure 28.
In Figure 30, a result comparison of the peak to peak voltage V p p is depicted between the unfiltered DC-link capacitor (standard electric drive train operation matrix) and passive filtered (right). V p p is reduced in the passive notch filter at different points of operation. The maximum V p p of 18.22 V is reduced to 17.10 V, and the V p p reduction is smaller compared to the significant decrease in I c , R M S by the passive notch filter. The V p p remains mostly unaffected in the flux-weakening region B. Analysis of the individual points of operation can provide the reason for a better current reduction in the nominal operation region A as compared to the flux-weakening region B.
In the simulative investigation, the filter current is also measured, and it is depicted in Figure 31. The I f i l t e r , R M S matrix illustrates the amount of current that passes through the filter capacitor in the passive notch filter. According to Figure 31, a large amount of current passes through the filter capacitor between the speed range of 3000 to 5500 rpm; this significantly reduces the I c , R M S in these peak operation points.

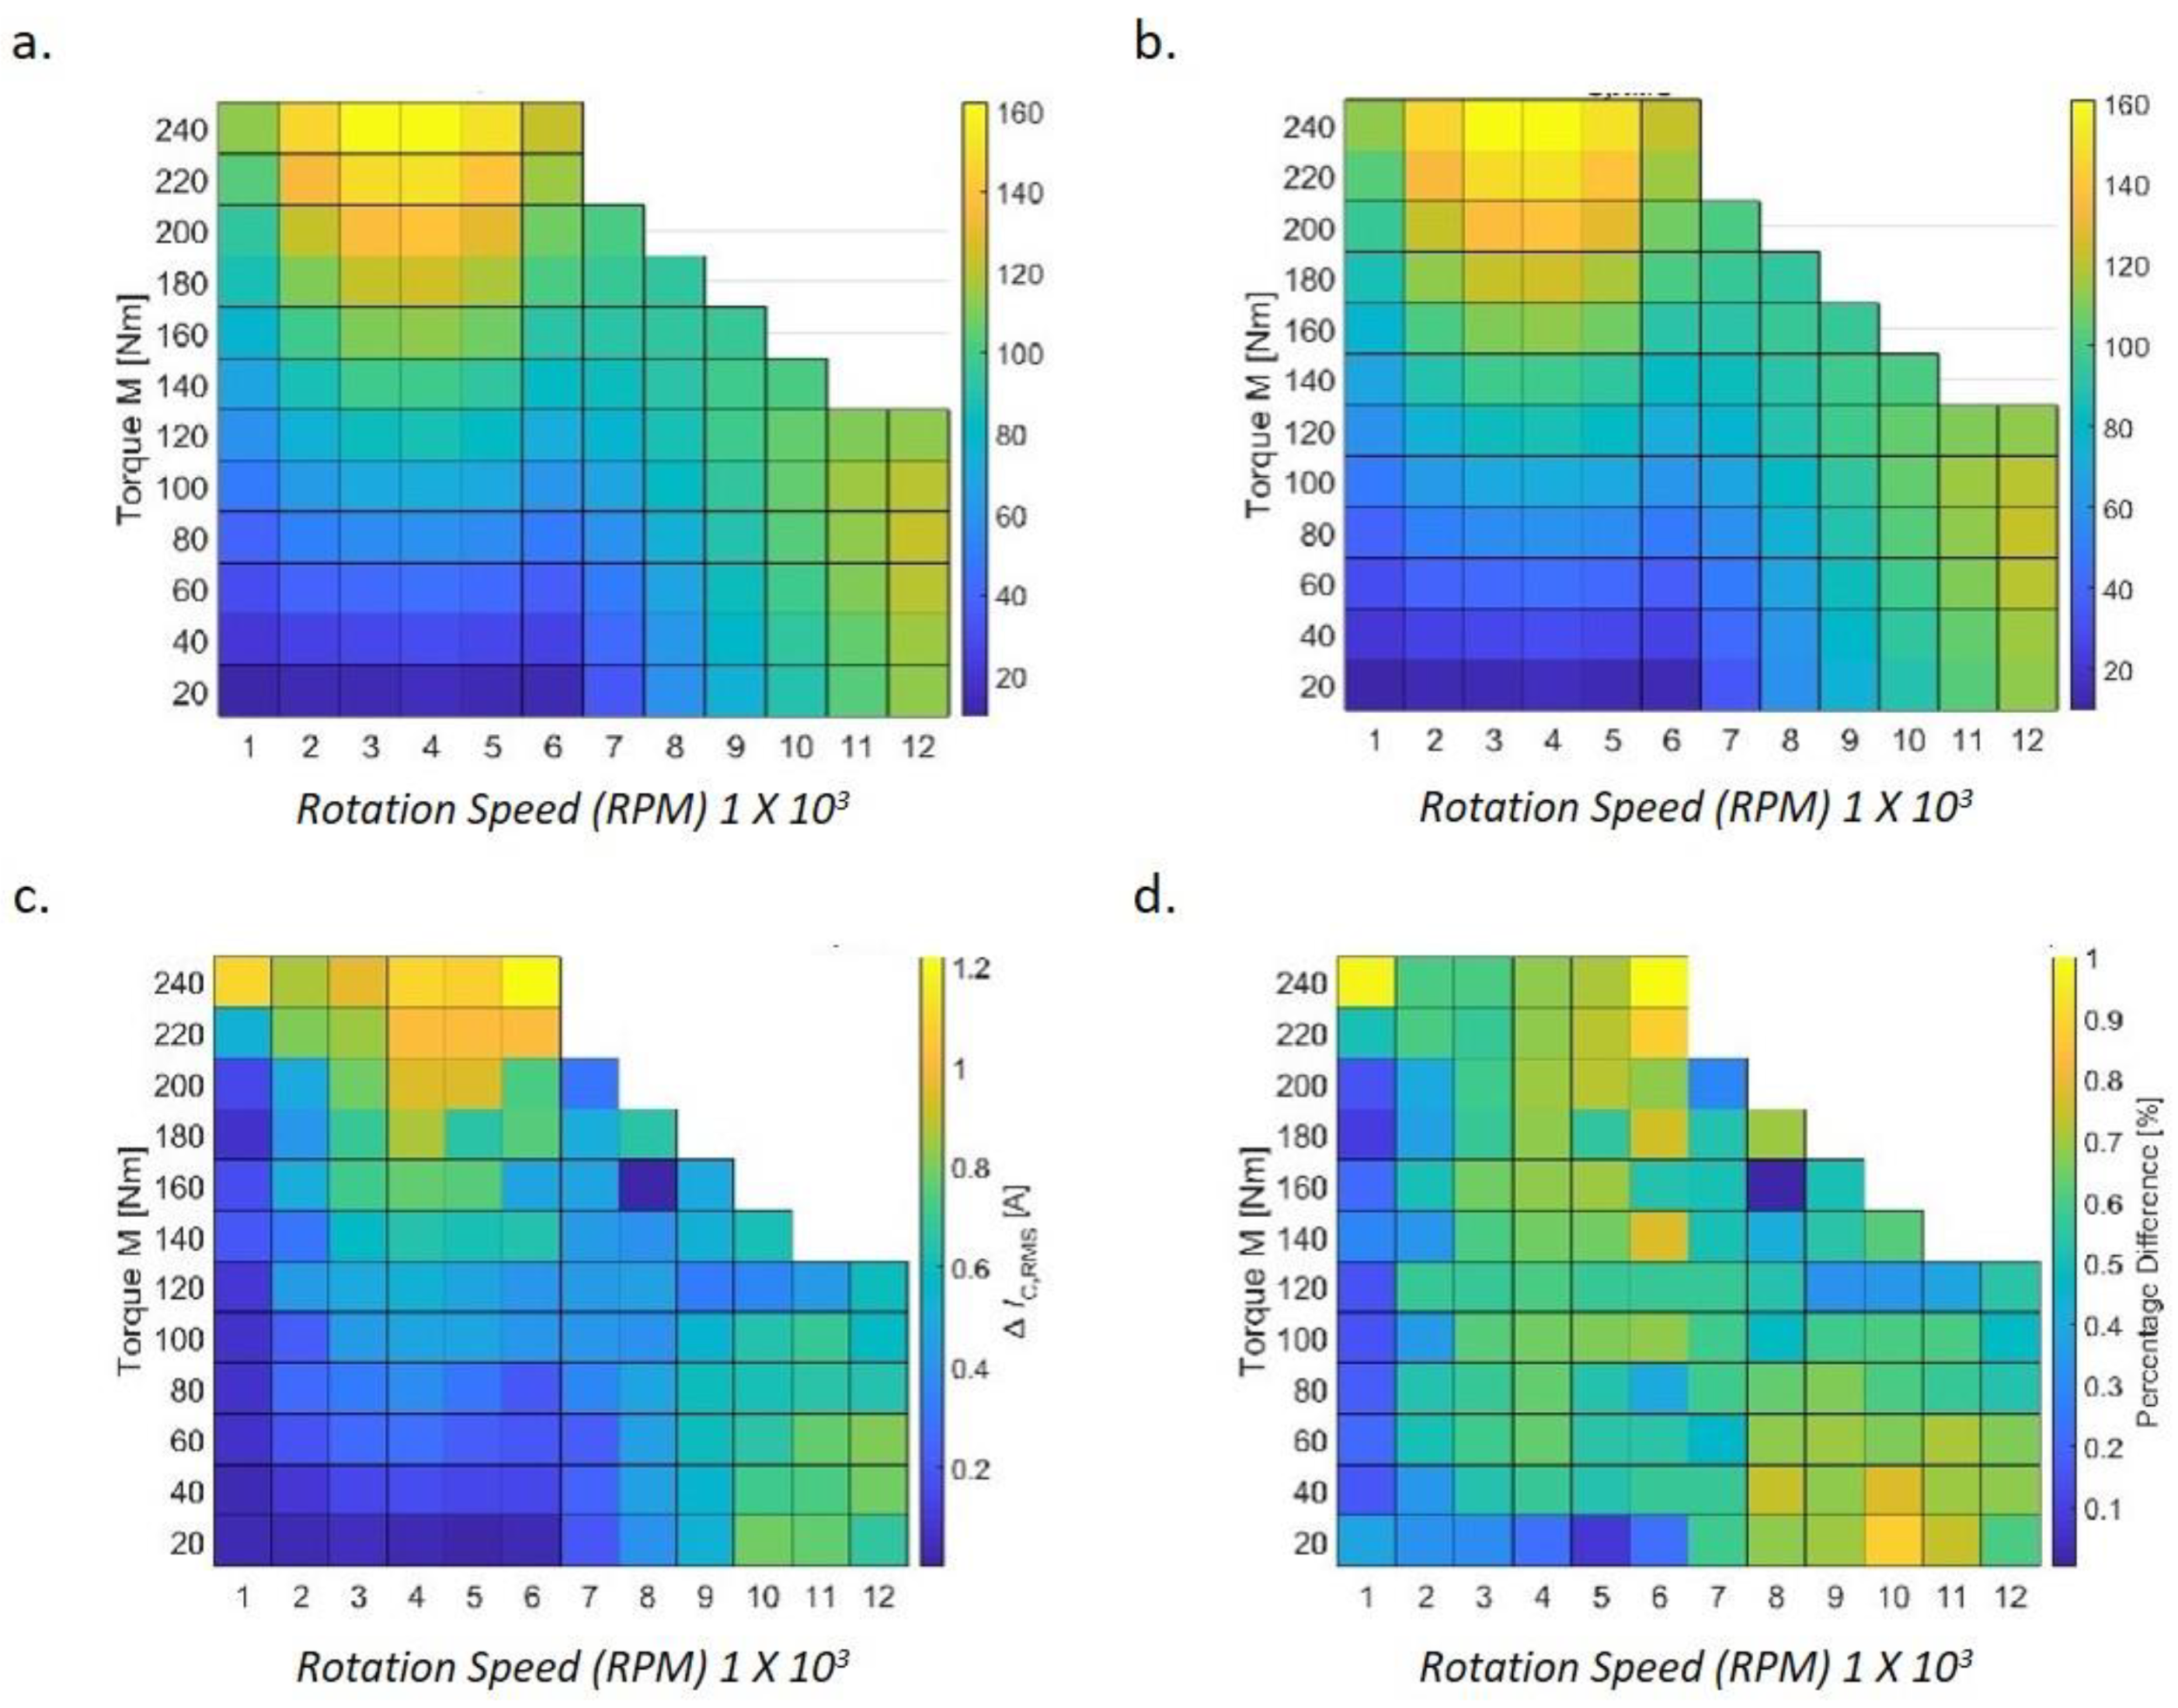
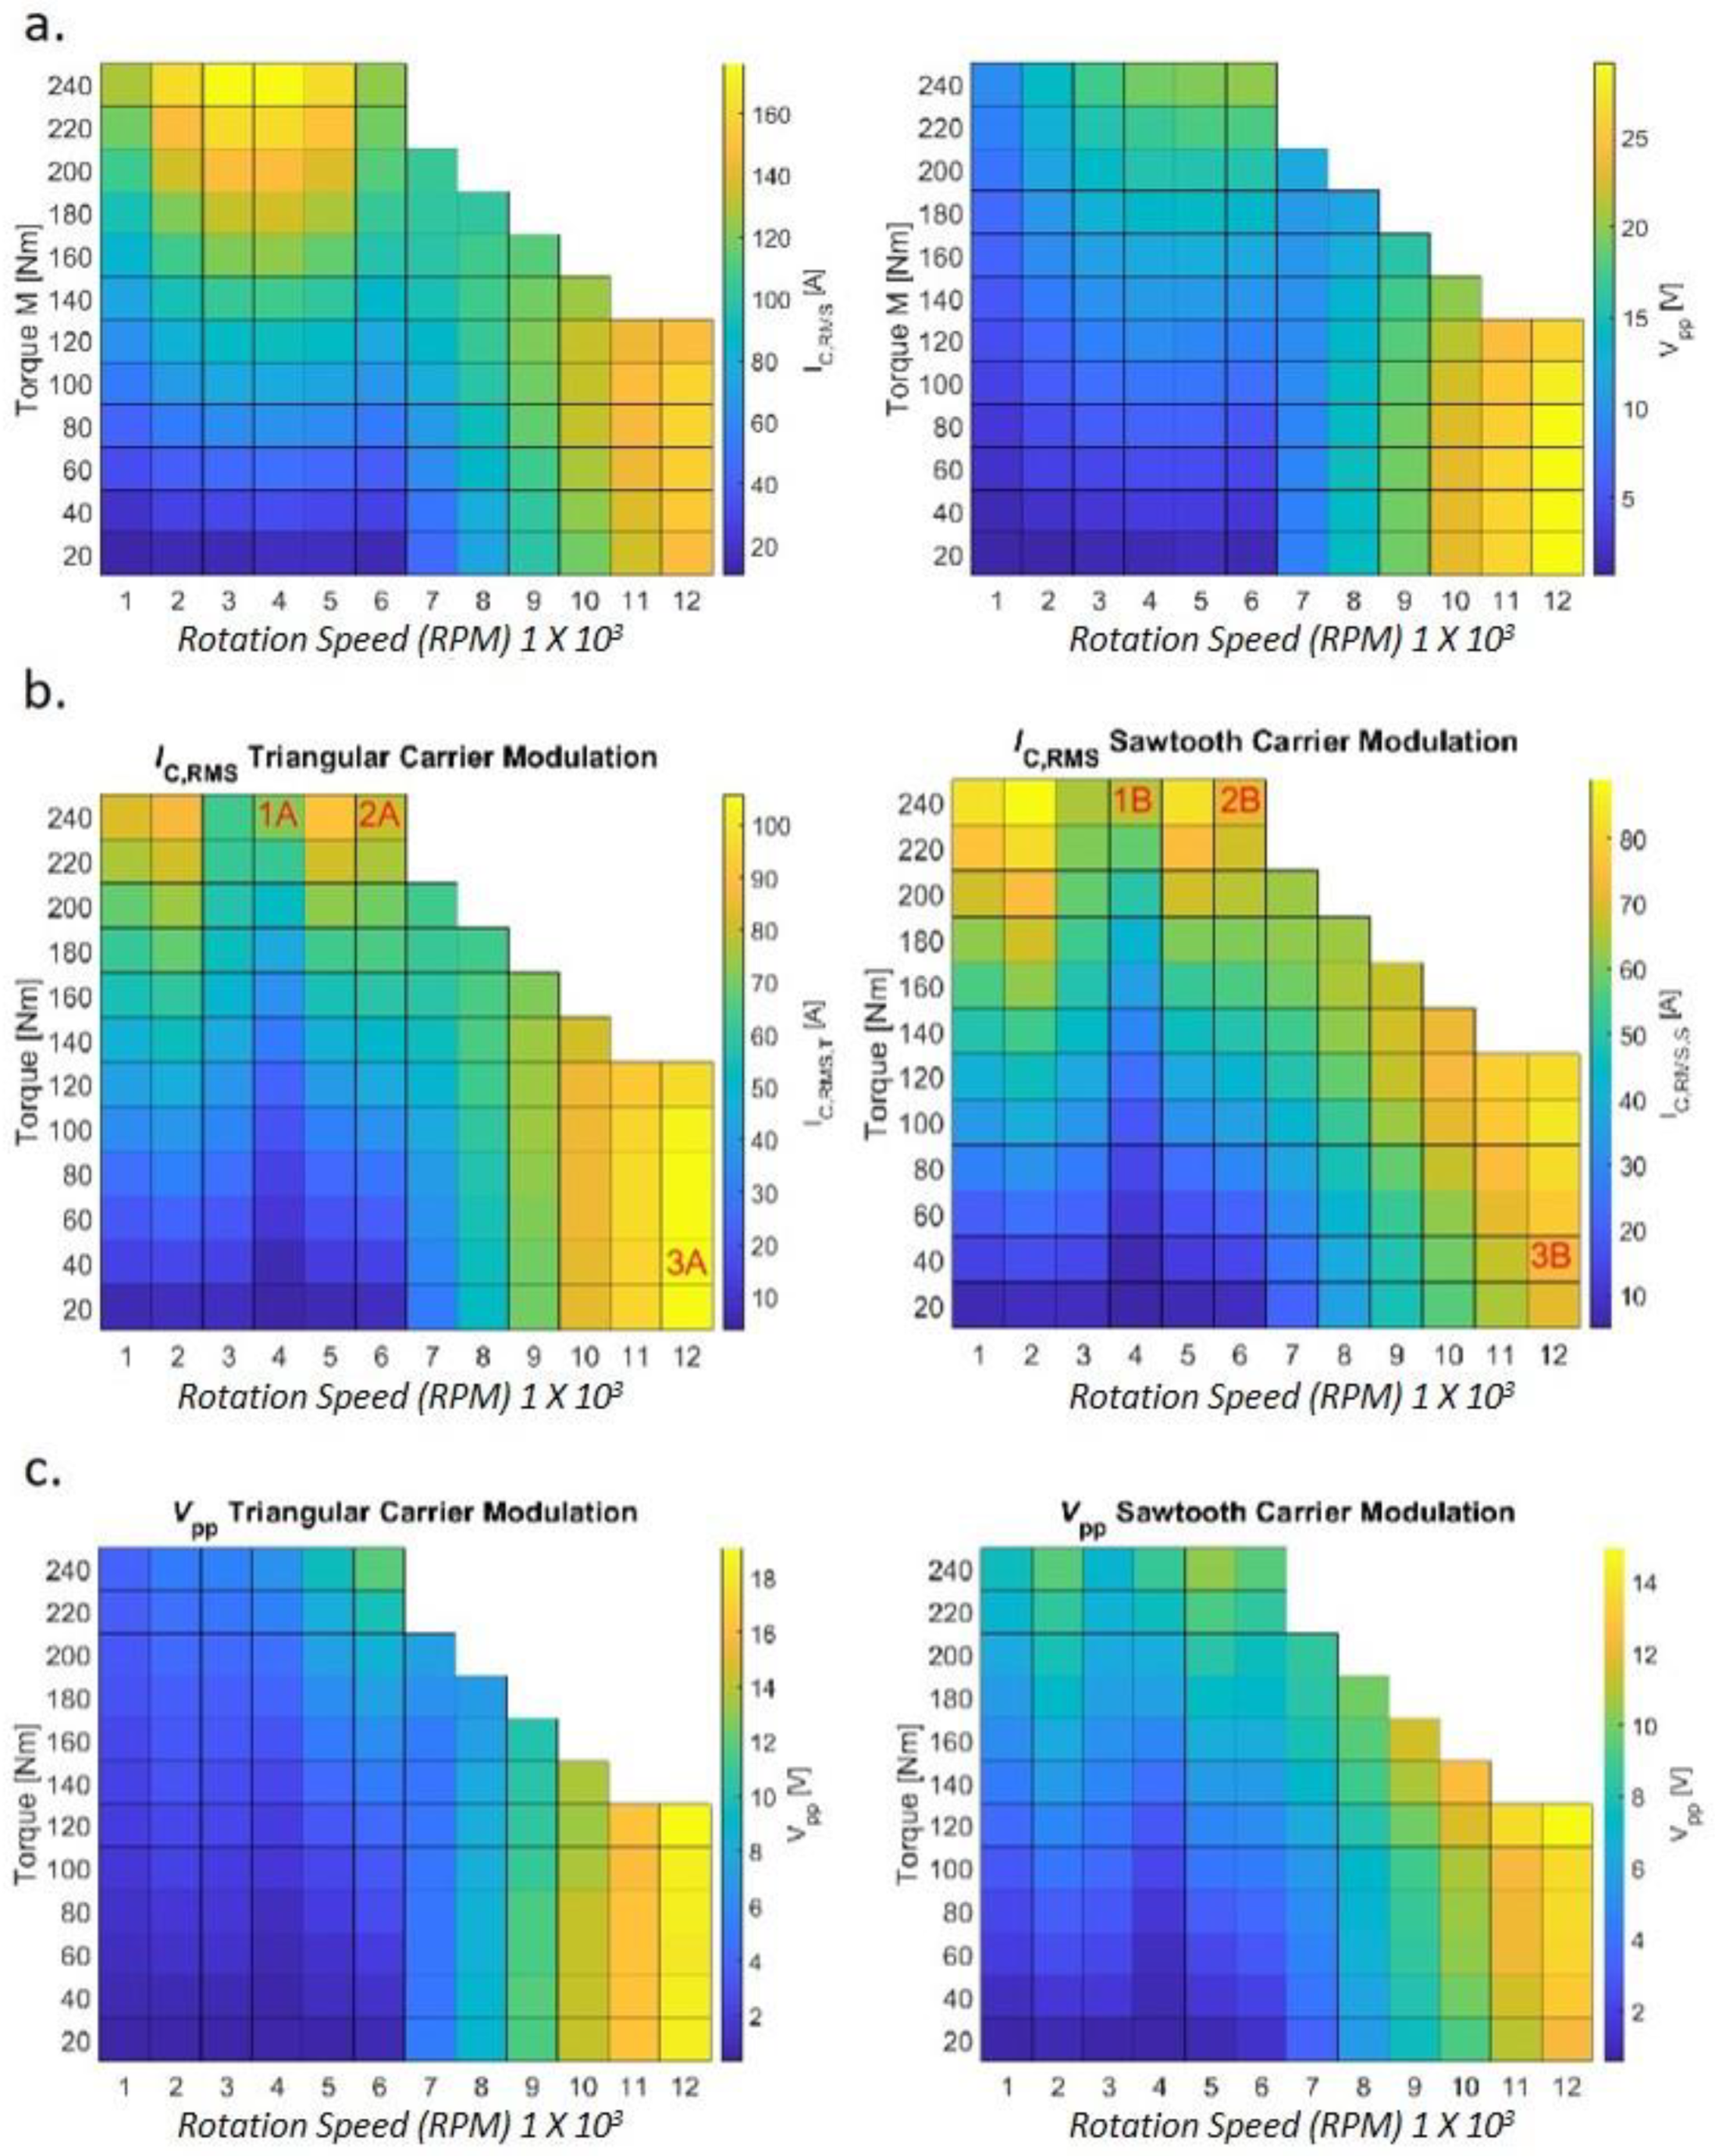
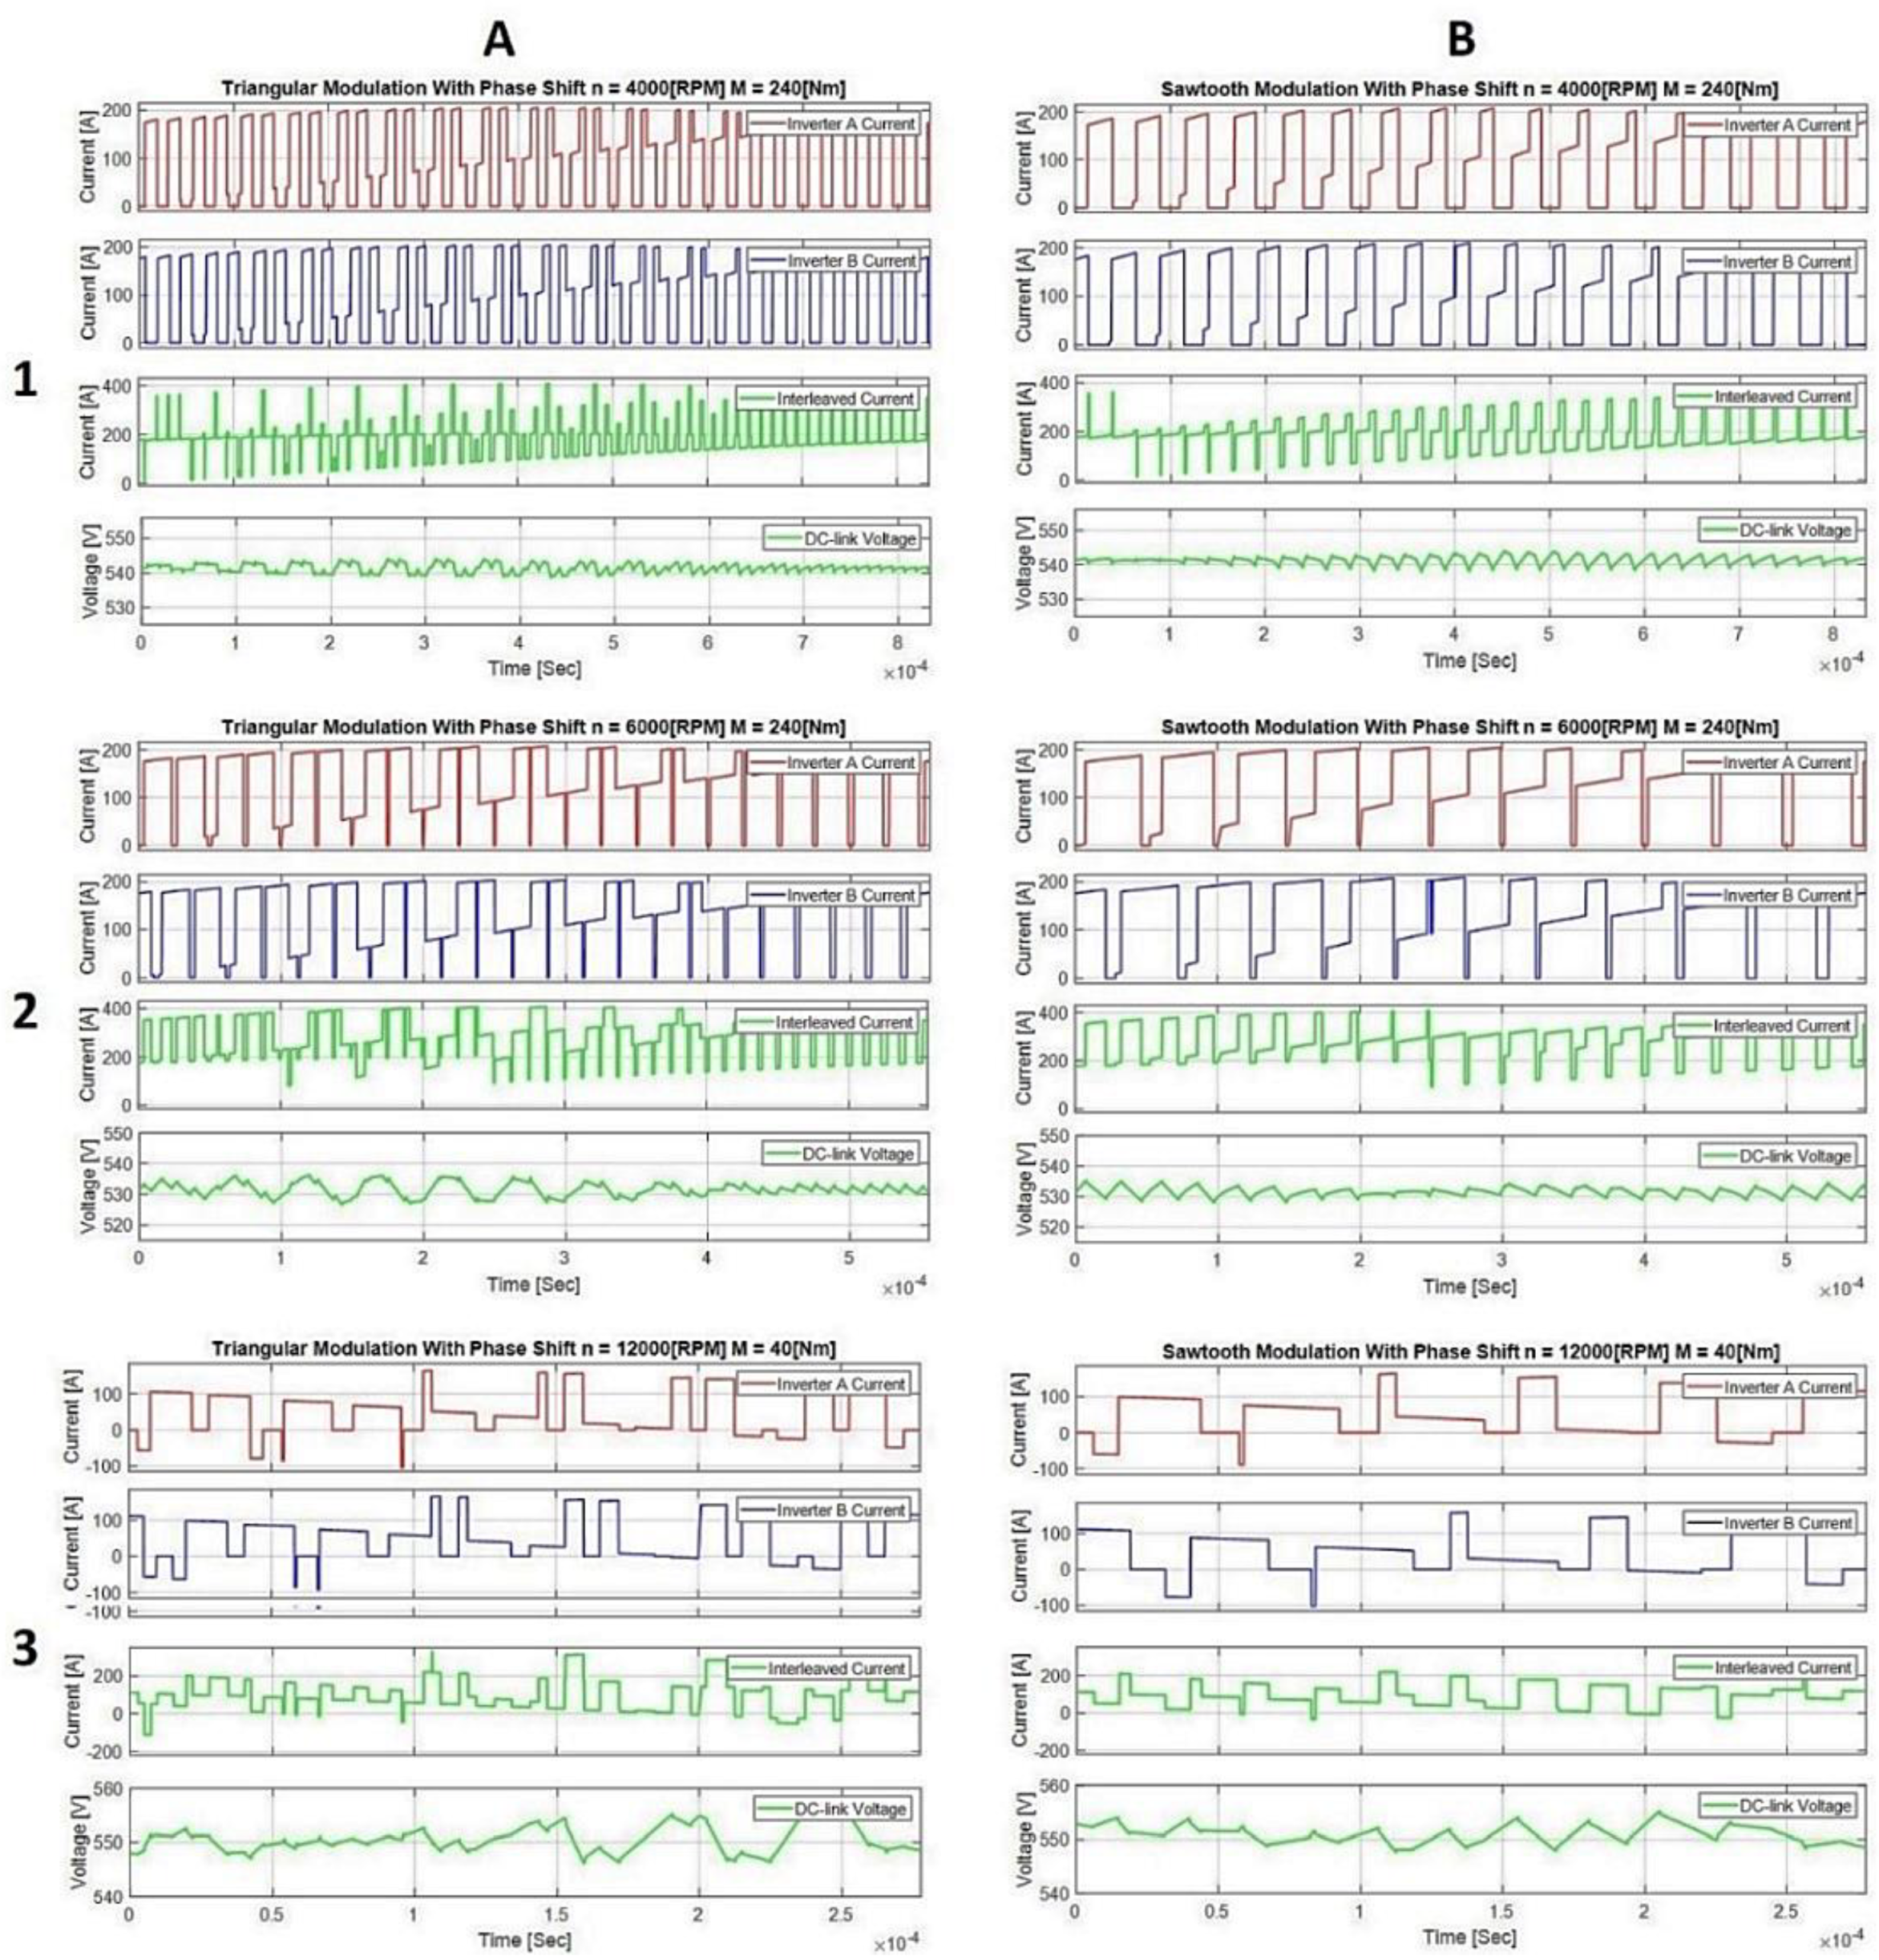
3.2. Change in Modulation

For this technique, two carrier-modulation schemes are used along with phase shift given to the second parallel three-phase inverter. Results are analyzed from the triangular carrier with 90° and saw-tooth carrier with 180° phase shift. Unmodulated results for I c , R M S and V p p are shown in Figure 32a. The I c , R M S matrix for both carrier schemes is compared in Figure 32b. A significant I c , R M S reduction can be observed in both the matrixes when compared to the standard electric drive train operation matrix of I c , R M S in Figure 32a. Figure 32c depicts the V p p matrix of both carrier-modulation schemes. In comparison to the standard electric drive train operation matrix of V p p depicted in Figure 32a, the minimization of the current occurs in both regions of nominal operation and flux-weakening. Peak operation points at 4000 rpm in the standard electric drive train matrix are among the most beneficial when simulated. Simulations are carried out by keeping parameters constant in different simulations.
Analysis of the three individual operation points marked red in Figure 32b can help in elaborating on the functionality of a parallel inverter scheme. A summary of data extracted from the I c , R M S and V p p matrix of change in modulation scheme is shown in Table 6.
The current at the input of the inverter is not continuous but pulsed as illustrated in Figure 33. Due to the three-phase topology of the inverter, the input current is periodic with T/6, where T denotes one electric period of the motor and is reversely proportional to the rotation speed. A single segment among the six segments in one electrical time period is identical to one another. If the equivalent series resistance (ESR) of the DC-link capacitor is neglected, the voltage waveform over the capacitor can be calculated by integrating the AC-component of the inverter current over time. The resulting voltage over the DC-link capacitor is, therefore, also periodic with T/6 as shown in Figure 33d. The height of each voltage ripple is dependent on the charge transferred into the capacitor and drawn from the capacitor with each inverter current pulse. Therefore, the voltage ripple is proportional to the amplitude and the length of each current pulse. This correlation can be drawn from Figure 33 and Figure 34. In Figure 33, it is shown that both currents from the inverters are without any carrier phase shift. Consequently, the interleaving current depicted in Figure 33c has more prominent and lengthier pulses that resulted in higher ripple voltage.
In contrast, a carrier phase shift is introduced in the inverter B, as seen in Figure 34b. The interleaving of current becomes effective to reduce RMS capacitor current I c , R M S by attenuating the current pulses as shown in Figure 34c. In some of the specific duty cycles of a segment, the current pulses are significantly reduced. Therefore, the corresponding voltage ripples are also minimum as shown in Figure 34d. The in-depth analysis of a single segment is presented in the next sections. As seen from Figure 34, each operation point has different output results. Correspondingly, the analysis of each operation point is further split into two modulation modes. The first mode discusses the triangular carrier modulation, and another mode refers to saw-tooth carrier modulation. Results of voltage and current due to these modes are further shown in Figure 35 based on the three different targeted points mentioned in Figure 32b.

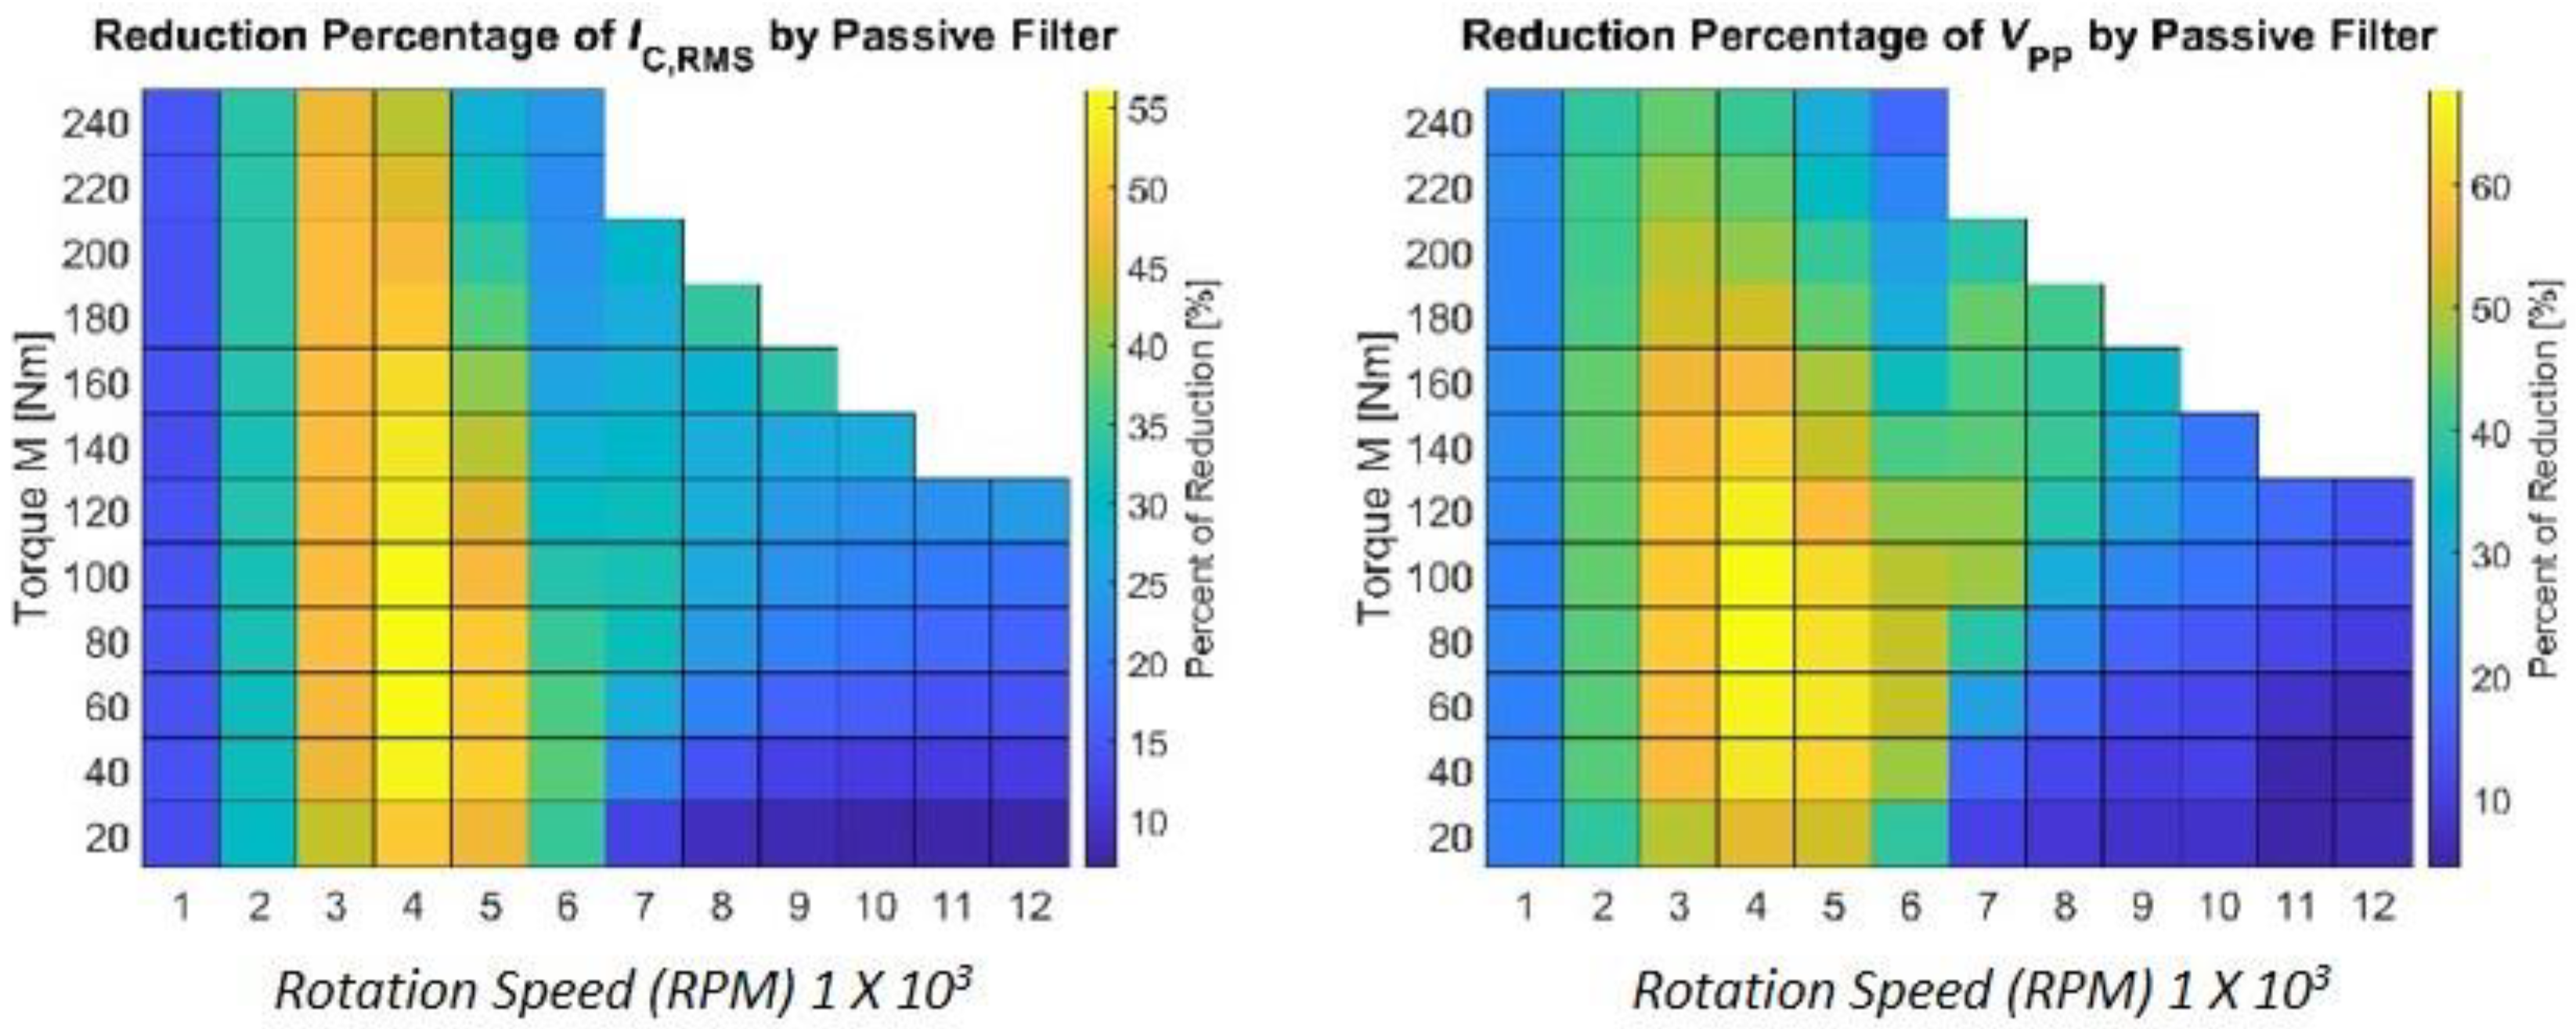
3.3. Optimization of DC-Link Capacitor

The conclusion for passive notch filter can be drawn from the I c , R M S and V p p matrix of the filter capacitor. The minimization of I c , R M S and V p p at each operating point is highlighted in the percentage reduction matrix depicted in Figure 36. The peak operation points for the filtered DC-link capacitor are visible by a bright-yellow highlighted pattern similar to the I c , R M S matrix of unfiltered DC-link capacitor in Figure 28. However, in Figure 36, the bright-yellow color in the matrix corresponds to the most minimized operation point.
The dominant harmonics at these peak operation point are completely damped as elaborated in the operation point 1. These operation points are the most efficient points of operation, where high I c , R M S RMS current is reduced. The filter capacitor is partially able to reduce I c , R M S in the flux-weakening region because several dominate harmonics were left unattenuated except for the second harmonic, which can be seen in the capacitor current spectrum of operation points 3 and 4.
In order to remove the fourth- and sixth-dominant harmonic in the DC-link capacitor, more notch filters can be added in series. In correlation of both carrier modulations, the saw-tooth carrier with 180° phase shift leads to better minimization of I c , R M S and V p p . A reduction percentage matrix for each operating point depicted in Figure 37 makes it clear that the modulation scheme minimizes key parameters effectively.
The V p p and I bat , PP constraints were already defined, where V p p is limited to 16 V and I bat , pp to 10% of battery current and where I bat , pp can be calculated:
I b a t , m a x = P m a x V b a t η
I b a t , p p < 10 % . I b a t , m a x = 27.9   A
The standard drive train operational matrix with classical SVPWM without any auxiliary additional circuit is shown in Figure 38a. It is carried out with standard size C DC link of 500 μF, which also signifies higher V p p in the DC-link capacitor. Subsequently, Figure 38b shows the parallel inverter saw-tooth carrier modulation, which is carried out with smaller C DC link of 150 μF, and it can be noticed that corresponding parameters are well within the boundary conditions.

4. Conclusions

Additional passive notch filters help in significantly reducing RMS current in comparison to peak-to-peak voltage with less efficiency in the flux-weakening region. It also helps in reducing the RMS capacitor current. However, there is always a trade-off because passive components used in an electric vehicle are very bulky and big in size; this adds more weight and occupies more volume. During additional circuit operation, factors such as heat dissipation, leakage current, and the energy storage loss, with respect to time, increase. The drawbacks of using passive filters are faced in terms of space, weight, and additional conduction losses. It is important to remember that the aim of an auxiliary passive filter is to reduce the combined occupancy volume of the DC-link capacitor along with the introduced auxiliary components. From I c , R M S , the V p p matrix of triangular and saw-tooth carrier modulation, along with the comprehensive analysis of the parallel inverter, it can be concluded that these methods significantly assist in reducing the DC-link capacitor. The change of the modulation does not require additional power switches since, for high-power applications, several switches are used in parallel within one phase leg in order to carry the current. For the segmented modulation, the switches only need to be arranged in two groups and controlled with separate PWM signals.
However, the change in modulation requires additional drivers. For a three-phase two-level inverter, the number of drivers must be increased from 6 to 12. Additionally, the parallel windings of the motor must be connected to the six-phase legs of the inverter, which is only possible for application where the motor and the inverter are designed as a unit. In correlation of both carrier modulations, the saw-tooth carrier with 180° phase shift leads to better minimization of I c , R M S and V p p . The saw-tooth carrier gives a homogenous response on I-quadrant operation matrix, in which saw-tooth reduces I c , R M S and V p p overall as well as in the flux-weakening region. Peak operating points of I c , R M S and V p p are reduced to 45% and 55%, respectively, when compared to standard electric drive train operation matrix.
In a comparison of both measures investigated in this topic, it can be concluded that among all the methods, the saw-tooth carrier modulation method used in the parallel three-phase inverter is found to be the most effective method to reduce DC-link capacitor size in the electric drive train circuit by 70%. The DC-link capacitor relationship makes it clear that I c , R M S is remarkably reduced in nominal and flux-weakening regions by using the saw-tooth carrier technique. Correspondingly, a vital feature of this technique is that the saw-tooth carrier requires fewer physical changes in the electric drive framework.

Author Contributions

O.M.B., T.M.B. and M.H.A., conceptualization, methodology, software, and writing original draft; O.M.B., S.R.S.R., M.M.H. and M.T., writing—review and editing; M.M.H., M.T. and S.R.S.R., data curation; M.M.H., O.M.B. and M.H.A., writing—review and editing. All authors have read and agreed to the published version of the manuscript.

Funding

The researchers would like to thank the partnership and engagement programme funding, University of South Wales, UK.

Data Availability Statement

Not applicable.

Acknowledgments

This research is partially supported by the University of South Wales, UK.

Conflicts of Interest

The authors declare no conflict of interest.

List of Abbreviations and Notations

FOCField-oriented control
DCDirect Current
ACAlternating Current
PMSMPermanent magnetic synchronous motor
EVElectric vehicle
RMSRoot mean square
PWMPulse Width Modulation
ESREquivalent series resistance
THDTotal harmonic distortion
SVPWMSpace vector pulse width modulation
DQDirect axis and quadrature axis
v b a t Battery internal voltage
R i n t Battery internal resistance
L i n t Battery internal inductance
cos φ Power factor
p p Pole pairs
P m a x Nominal power
M m a x Maximum torque
R s Stator resistance
n b a s e Rated rotation speed
n r e f Extended rotation speed
η Estimated motor and inverter efficiency
f s w Switching frequency
m The maximal modulation index of the three-phase inverter
I i n , m a x Maximum input phase current
v D C l i n k DC-link capacitor voltage
v s , m a x Maximum phase voltage amplitude
i q Quadrature current
ψ P M Flux linkage
L s Stator inductance
I C , R M S Root mean square of DC-link capacitor current
m Modulation index
I c a p DC-link capacitor current
I i n v , R M S Inverter output current
θ Rotor angle
ζ Damping factor
ω n Resonance frequency
f s w Switching frequency
v D C l i n k Voltage on DC-link capacitor
ψ P M Flux linkage by permanent magnets
ω e l Motor electric angular frequency
i d / i q Direct current/quadrature current
M Torque
L s Stator inductance

References

  1. Frumhoff, P. Global Warming Fact: More Than Half of All Industrial CO2 Pollution Has Been Emitted Since. 1988. Union Concerned Sci. 2014, 15. [Google Scholar]
  2. Leal-Arcas, R.; Morelli, A. The resilience of the Paris Agreement: Negotiating and implementing the climate regime. Geo. Envtl. L. Rev. 2018, 31, 1. [Google Scholar]
  3. Pendolovska, V.; Fernandez, R.; Mandl, N.; Gugele, B.; Ritter, M. Annual European Union Greenhouse Gas Inventory 1990–2011 and Inventory Report 2013; European Environment Agency: Luxembourg, 2013. [Google Scholar]
  4. Singh, K.V.; Bansal, H.O.; Singh, D. A comprehensive review on hybrid electric vehicles: Architectures and components. J. Mod. Transp. 2019, 27, 77–107. [Google Scholar] [CrossRef] [Green Version]
  5. Plötz, P.; Schneider, U.; Globisch, J.; Dütschke, E. Who will buy electric vehicles? Identifying early adopters in Germany. Transp. Res. Part A Policy Pract. 2014, 67, 96–109. [Google Scholar] [CrossRef]
  6. Tsakalidis, A.; Thiel, C. Electric Vehicles in Europe from 2010 to 2017: Is Full-Scale Commercialisation Beginning; Publications Office of the European Union: Luxembourg, 2018. [Google Scholar]
  7. Husain, I. Electric and Hybrid Vehicles: Design Fundamentals; CRC Press: Boca Raton, FL, USA, 2021. [Google Scholar]
  8. Ashfaq, M.; Butt, O.; Selvaraj, J.; Rahim, N. Assessment of electric vehicle charging infrastructure and its impact on the electric grid: A review. Int. J. Green Energy 2021, 18, 657–686. [Google Scholar] [CrossRef]
  9. Heydari-Doostabad, H.; Hosseini, S.H.; Ghazi, R.; O’Donnell, T. Pseudo dc-link EV home charger with a high semiconductor device utilization factor. IEEE Trans. Ind. Electron. 2021, 69, 2459–2469. [Google Scholar] [CrossRef]
  10. Sridharan, S.; Kimmel, J.; Kikuchi, J. DC-Link Capacitor Sizing Considerations for HEV/EV e-Drive Systems; 0148-7191; SAE Technical Paper; WCX 17:SAE World Congress Experience: Detroit, MI, USA, 2017. [Google Scholar]
  11. Qamar, H.; Qamar, H.; Wu, D.; Ayyanar, R. DC Link Capacitor Sizing for 240°—Clamped Space Vector PWM for EV Traction Inverters. In Proceedings of the 2021 IEEE Applied Power Electronics Conference and Exposition (APEC), Phoenix, AZ, USA, 14–17 June 2021; pp. 835–841. [Google Scholar]
  12. Vujacic, M.; Hammami, M.; Srndovic, M.; Grandi, G. Analysis of dc-link voltage switching ripple in three-phase PWM inverters. Energies 2018, 11, 471. [Google Scholar] [CrossRef] [Green Version]
  13. Mnati, M.J.; Abed, J.K.; Bozalakov, D.V.; Van den Bossche, A. Analytical and calculation DC-link capacitor of a three-phase grid-tied photovoltaic inverter. In Proceedings of the 2018 IEEE 12th International Conference on Compatibility, Power Electronics and Power Engineering (CPE-POWERENG 2018), Doha, Qatar, 10–12 April 2018; pp. 1–6. [Google Scholar]
  14. Wen, H.; Xiao, W.; Wen, X.; Armstrong, P. Analysis and evaluation of DC-link capacitors for high-power-density electric vehicle drive systems. IEEE Trans. Veh. Technol. 2012, 61, 2950–2964. [Google Scholar]
  15. Welchko, B.A. Analytical calculation of the RMS current stress on the DC link capacitor for a VSI employing reduced common mode voltage PWM. In Proceedings of the 2007 European Conference on Power Electronics and Applications, Aalborg, Denmark, 2–5 September 2007; pp. 1–8. [Google Scholar]
  16. Nazlee, A.M.; Hamid, N.H.; Hussin, F.A.; Ali, N.B.Z. Space Vector PWM for PMSM simulation using Matlab Simulink. In Proceedings of the 2010 IEEE Asia Pacific Conference on Circuits and Systems, Kuala Lumpur, Malaysia, 6–9 December 2010; pp. 1127–1130. [Google Scholar]
  17. Saidi, H.; Taleb, R.; Mansour, N.; Midoun, A. Three phase inverter using SVPWM method for solar electric vehicle. In Proceedings of the IREC 2015 The Sixth International Renewable Energy Congress, Sousse, Tunisia, 24–26 March 2015; pp. 1–5. [Google Scholar]
  18. Jose, J.; Goyal, G.; Aware, M. Improved inverter utilisation using third harmonic injection. In Proceedings of the 2010 Joint International Conference on Power Electronics, Drives and Energy Systems & 2010 Power India, New Delhi, India, 20–23 December 2010; pp. 1–6. [Google Scholar]
  19. Shi, Y. Field Oriented Control of Permanent Magnet Synchronous Motor with Third-Harmonic Injection Pulse width Modulation to Reduce Quadrotors’ Speed Ripples; New Jersey Institute of Technology: Newark, NJ, USA, 2017. [Google Scholar]
  20. Yesilbag, E.; Ergene, L. Field oriented control of permanent magnet synchronous motors used in washers. In Proceedings of the 2014 16th International Power Electronics and Motion Control Conference and Exposition, Antalya, Turkey, 21–24 September 2014; pp. 1259–1264. [Google Scholar]
  21. Nag, S.S.; Mishra, S.; Joshi, A. A passive filter building block for input or output current ripple cancellation in a power converter. IEEE J. Emerg. Sel. Top. Power Electron. 2015, 4, 564–575. [Google Scholar] [CrossRef]
  22. Meddins, R. Introduction to Digital Signal Processing; Newnes: Oxford, UK, 2000. [Google Scholar]
  23. Karanayil, B.; Agelidis, V.G.; Pou, J. Evaluation of DC-link decoupling using electrolytic or polypropylene film capacitors in three-phase grid-connected photovoltaic inverters. In Proceedings of the IECON 2013—39th Annual Conference of the IEEE Industrial Electronics Society, Vienna, Austria, 10–13 November 2013; pp. 6980–6986. [Google Scholar]
  24. Emadi, A. Automotive Power Electronics and Motor Drives; Illinois Institute of Technology Chicago: Chicago, IL, USA, 2005. [Google Scholar]
  25. Yu, L.; Wang, C.; Shi, H.; Xin, R.; Wang, L. Simulation of PMSM field-oriented control based on SVPWM. In Proceedings of the 2017 29th Chinese Control And Decision Conference (CCDC), Chongqing, China, 28–30 May 2017; pp. 7407–7411. [Google Scholar]
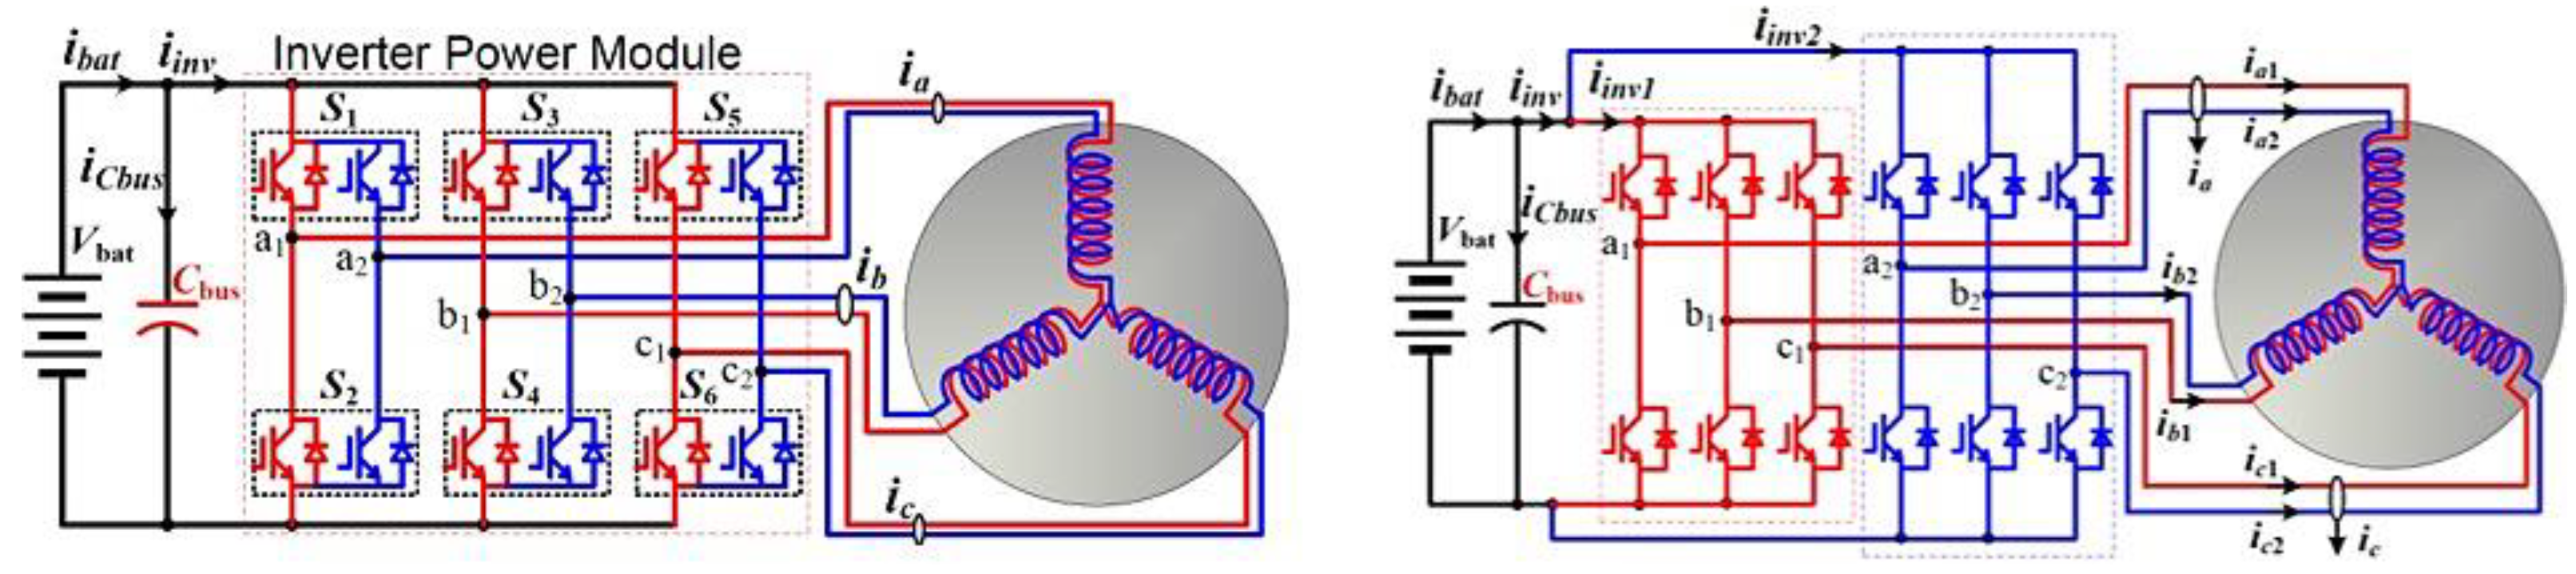
  26. Su, G.-J.; Tang, L. A segmented traction drive system with a small dc bus capacitor. In Proceedings of the 2012 IEEE Energy Conversion Congress and Exposition (ECCE), Raleigh, NC, USA, 15–20 September 2012; pp. 2847–2853. [Google Scholar]
  27. Lyu, X.; Zhou, H.; Curuvija, B.; Cao, D. DC-link RMS current reduction by increasing paralleled 3-phase inverter module number for segmented traction drive. In Proceedings of the 2017 IEEE Applied Power Electronics Conference and Exposition (APEC), Tampa, FL, USA, 26–30 March 2017; pp. 906–911. [Google Scholar]
Figure 1. Total market share of electric vehicles in the European Union [6].
Energies 15 04499 g001
Figure 2. Electric drive train schematic of battery electric vehicle.
Energies 15 04499 g002
Figure 3. Electric vehicle drive train circuit demonstrating DC-link capacitor.
Energies 15 04499 g003
Figure 4. Structure of simulation for study of electric drive train based on PLECS and Simulink interference.
Energies 15 04499 g004
Figure 5. Voltage space vector for three-phase inverter.
Energies 15 04499 g005
Figure 6. Maximum peak voltage comparison of sinusoidal PWM and space vector PWM.
Energies 15 04499 g006
Figure 7. Third-harmonic injection waveform demonstrating the increase of fundamental component.
Energies 15 04499 g007
Figure 8. Graphical representation of Clarke transformation.
Energies 15 04499 g008
Figure 9. Graphical representation of Park transformation.
Energies 15 04499 g009
Figure 10. Domain transformations in FOC.
Energies 15 04499 g010
Figure 11. Control scheme of field-oriented control.
Energies 15 04499 g011
Figure 12. PLECS model of a standard electric drive train.
Energies 15 04499 g012
Figure 13. Simulink model comprising of gate signal generator and control circuit.
Energies 15 04499 g013
Figure 14. The electric drive circuit similar to the model used in PLECS simulation.
Energies 15 04499 g014
Figure 15. Vector space diagram of PMSM.
Energies 15 04499 g015
Figure 16. Graphical visualization of the parameters through PLECS simulation of an electric drive train.
Energies 15 04499 g016
Figure 17. Passive notch filter graphical representation of the filter output.
Energies 15 04499 g017
Figure 18. Bode diagram of passive notch filter parameters.
Energies 15 04499 g018
Figure 19. Electric drive train with an additional filter circuit.
Energies 15 04499 g019
Figure 20. Equivalent circuit of a PMSM in DQ coordinates, where d-axis is at left, and q-axis at right [25].
Energies 15 04499 g020
Figure 21. Vector diagram in the nominal (left) and flux-weakening region (right).
Energies 15 04499 g021
Figure 22. Comparison between the traction drive system (left) and equivalent arrangement with two parallel three-phase inverters (right) Re-printed [26].
Energies 15 04499 g022
Figure 23. Interleaved PWM switching control by two inverter controllers.
Energies 15 04499 g023
Figure 24. PWM modulation signals triangular (left) and saw-tooth (right) along with a phase shift in the second carrier.
Energies 15 04499 g024
Figure 25. Control architecture of parallel inverters in Simulink MATLAB.
Energies 15 04499 g025
Figure 26. Electric drive train in PLECS with two parallel inverters and separate winding connection to the permanent magnetized synchronized motor.
Energies 15 04499 g026
Figure 27. Ampere variations and relative fractional difference percentage between I c , R M S analytically calculated and I c , R M S measured by simulation (a) Analytical I c , R M S of DC-link capacitor; (b) Simulative I c , R M S of DC-link capacitor; (c) Variation between Analytical and Simulative I c , R M S ; (d) Relative difference between Analytical and Simulative I c , R M S .
Energies 15 04499 g027
Figure 28. Simulative result comparison of I c , R M S in I-quadrant operation matrix of PMSM without additional filter (left) and with passive notch filter (right). Here, C D C l i n k = 150 μF; L i n t = 5 μH; R i n t = 150 mΩ; v b a t = 560 V.
Energies 15 04499 g028
Figure 29. DC-link capacitor current spectrum with dominant harmonics at different four points.
Energies 15 04499 g029
Figure 30. Simulative result comparison of V p p in I-quadrant operation matrix of PMSM without additional filter (left) and with passive notch filter (right). Here, C D C l i n k = 150 μF; L i n t = 5 μH; R i n t = 150 mΩ; v b a t = 560 V.
Energies 15 04499 g030
Figure 31. Simulative result of I f i l t e r , R M S for the filter capacitor used in the passive notch filter. Here, C D C l i n k = 150 μF; L i n t = 5 μH; R i n t 150 mΩ; v b a t 560 V.
Energies 15 04499 g031
Figure 32. (a) Unmodulated/filtered I c , R M S and V p p of power train; (b) simulative comparison of I c , R M S ; (c) simulative comparison of V p p (in operation matrix of the standard electric drive train (i) triangular and (ii) saw-tooth carrier modulation; here, C D C l i n k = 150 μF; L i n t = 5 μH; R i n t = 150 mΩ; v b a t = 560 V).
Energies 15 04499 g032
Figure 33. One electric rotation waveform consisting of six identical segments (carrier modulation without pulse shift; n = 4000 rpm, torque = 240 Nm). (a) Inverter ‘A’ Current; (b) Inverter ‘B’ Current; (c) Interleaved Current; (d) DC-link voltage.
Energies 15 04499 g033
Figure 34. One electric rotation waveform consisting of six identical segments (carrier modulation with pulse shift; n = 4000 rpm, torque = 240 Nm) (a) Inverter ‘A’ Current; (b) Inverter ‘B’ Current; (c) Interleaved Current; (d) DC-link voltage.
Energies 15 04499 g034
Figure 35. A comparison of results in single-segment waveform illustrating the effect on I c , R M S by using the triangular and saw-tooth carrier.
Energies 15 04499 g035
Figure 36. Minimization rate matrix of I c , R M S (left) and V p p (right) in the passive notch filter me; here, C D C l i n k = 150 μF; L i n t = 5 μH; R i n t = 150 mΩ; v b a t = 560 V.
Energies 15 04499 g036
Figure 37. Minimization rate matrix of I c , R M S (left) and V p p (right) in parallel inverter; here, C D C l i n k = 150 μF; L i n t = 5 μH; R i n t = 150 mΩ; v b a t = 560 V.
Energies 15 04499 g037
Figure 38. (a) Standard electric drive train operational matrix of V p p (left) and I b a t , PP (right) with the bigger DC-link capacitor size; (b) saw-tooth carrier-modulated electric drive train operational matrix of V p p (left) and I bat , PP (right) with the minimized DC-link capacitor size.
Energies 15 04499 g038
Table 1. Switching patterns and output vectors [17].
Voltage VectorsSwitching VectorsLine-to-Neutral VoltageLine-to-Line Voltage
T A T B T C V a n V b n V c n V a b V b c V c a
V0000000000
V1100 2 3 1 3 1 3 10−1
V2110 1 3 1 3 2 3 01−1
V3010 1 3 2 3 1 3 −110
V4011 2 3 1 3 1 3 −101
V5001 1 3 1 3 2 3 0−11
V6101 1 3 2 3 1 3 1−10
V7111000000
Table 2. The operating parameters of the electric drive drain circuit.
No.ParameterNotationValue
DC-link capacitor constraints
1Battery internal voltage v b a t 560–850 V
2Battery internal resistance R i n t 150 mΩ
3Battery internal inductance L i n t 5 μH
Motor constraints
1Power factor cos φ 0.90
2Pole pairs p p 3
3Nominal power P m a x 150 Kw
4Maximum torque M m a x 240 Nm
5Stator resistance R s 20 mΩ
6Rated rotation speed n b a s e 6000 rpm
7Extended rotation speed n r e f 12,000 rpm
8Estimated motor and inverter efficiency η 0.96
3-Phase inverter constraints
1Switching frequency f s w 20 KHz
2The maximal modulation index of the three-phase inverter m 1.15
Table 3. Parameters’ summaries obtained through the set of relationships.
No.ParameterNotationValue
1Max input phase current I i n , m a x 303.73 A
2DC-link capacitor voltage v D C l i n k 514.45 V
3Max phase voltage amplitude v s , m a x 295.80 V
4Quadrature current i q 386.87 A
5Flux linkage ψ P M 0.1371 Vs
6Stator inductance L s 176.81 μH
Table 4. Electric drive train passive components essential values used in simulations.
ParametersValues
C D C l i n k 150 μF
L i n t 5 μH
R i n t 150 mΩ
v b a t 560 V
Table 5. Summary of important operation points.
Operation Point No.Torque M (Nm)Rotation Speed n (RPM)Unfiltered
DC-Link Capacitor
Passive Filtered
DC-link Capacitor
I c , R M S ( A ) V p p ( V ) I c , R M S ( A ) V p p ( V )
1240400017618.994.99.48
22406000123.820.183.714.5
34012,000153.329135.826.6
412012,000148.626.4118.423.7
Table 6. Summary of the vital point of operations.
Operation Point No.Torque M (Nm)Rotation Speed n (RPM)Triangular Carrier with 90° Ph. ShiftSaw-Tooth Carrier with 180° Ph. Shift
I c , R M S , T ( A ) V p p ( V ) I c , R M S , S ( A ) V p p ( V )
1240400071.86.4365.88.87
2240600080.311.970.99.53
34012,000105.518.373.613.2
Publisher’s Note: MDPI stays neutral with regard to jurisdictional claims in published maps and institutional affiliations.

