Abstract
The hydrogen liquefaction process is highly energy-intensive owing to its cryogenic characteristics, and a large proportion of the total energy is consumed in the subcooling cycle. This study aimed to develop an efficient configuration for the subcooling cycle in the hydrogen liquefaction process. The He-Ne Brayton cycle is one of the most energy-efficient cycles of the various proposed hydrogen liquefaction processes, and it was selected as the base case configuration. To improve its efficiency and economic potential, two different process configurations were proposed: (configuration 1) a dual-pressure cycle that simplified the process configuration, and (configuration 2) a split triple-pressure cycle that decreased the flow rate of the medium- and high-pressure compressors. The ortho–para conversion heat of hydrogen is considered by using heat capacity data of equilibrium hydrogen. Genetic algorithm-based optimization was also conducted to minimize the energy consumption of each configuration, and the optimization results showed that the performance of configuration 1 was worse than that of the base case configuration. In this respect, although less equipment was used, the compression load on each compressor was very intensive, which increased the energy requirements and costs. Configuration 2 provided the best results with a specific energy consumption of 5.69 kWh/kg (3.2% lower than the base case configuration). The total expense of configuration 2 shows the lowest value which is USD 720 million. The process performance improvements were analyzed based on the association between the refrigerant composition and the heat exchange efficiency. The analysis demonstrated that energy efficiency and costs were both improved by dividing the pressure levels and splitting the refrigerant flow rate in configuration 2.
1. Introduction
Hydrogen does not emit greenhouse gases, and its importance as a fossil fuel replacement is thus receiving increasing interest [1]. Hydrogen has a high gravimetric energy content but a low volumetric energy content owing to its low density [2], and various technologies for efficiently storing hydrogen have been studied [3]. Among the various hydrogen storage technologies developed for transportation, high-pressure gaseous storage and liquefied storage are efficient [4], and the former uses the most mature technology. Compressing hydrogen to a high pressure requires a large amount of energy, and high-pressure gaseous storage involves pressurizing hydrogen to 70 MPa [5], whereas the volumetric density is only 39.1 kg/m3 [6]. In contrast, liquefied hydrogen can be stored at atmospheric pressure, and its volumetric density is 70.8 kg/m3, which is approximately 1.8 times that of compressed gaseous hydrogen, so it is suitable for large-scale storage [7].
Owing to these characteristics, liquefying hydrogen is particularly advantageous for long-distance transportation.
However, hydrogen has a low boiling point, and its liquefaction process is thus energy intensive [8]. Natural gas liquefaction processes, which are also energy-intensive processes [9], consume between 0.271 kWh/kg LNG (Liquefied Natural Gas) and 0.352 kWh/kg LNG [10], whereas commercially available hydrogen liquefaction processes require between 11.9 and 15 kWh/kg LH2, which is approximately 50 times the amount of energy required for natural gas liquefaction [11]. This large amount of energy consumed during the hydrogen liquefaction process is related to several factors: first, the boiling point of hydrogen is approximately 20 K, which is approximately 90 K lower than that of natural gas [12]. Since the boiling point of hydrogen is extremely low, a large amount of refrigerant must be pressurized at high pressure and then expanded to lower the temperature of hydrogen. Second, the inversion temperature of hydrogen is also low; therefore, if the temperature is higher than 200 K, the temperature does not decrease, even if hydrogen is expanded [13]. Third, during the hydrogen cooling, ortho-hydrogen is converted into para-hydrogen spontaneously, in which the conversion heat is released [14]. Therefore, additional energy is required to cool hydrogen [14]. In summary, hydrogen liquefaction requires a significant amount of energy due to the properties of the hydrogen, and thus, reducing the amount of energy consumed is a major concern.
Several studies have proposed that the hydrogen liquefaction process could be integrated with waste cold energy recovery. For example, when integrated with other processes, the cold energy of LNG is often applied to the precooling cycle of the hydrogen liquefaction process. Lee et al. [15] proposed an integrated process involving LNG regasification and steam methane reforming. In this respect, LNG cold energy was delivered to feed hydrogen, and then LNG was converted into hydrogen through steam methane reforming. To find an optimal operating condition, the entire process of hydrogen production, liquefaction and CO2 liquefaction was optimized. Bae et al. [16] also attempted to combine the hydrogen liquefaction and LNG regasification processes and conducted a multi-objective optimization that minimized the amount of energy consumed and CO2 emitted. Yang et al. [17] designed a process that used LNG, the LN2 Brayton cycle, and the GH2 Brayton cycle to liquefy hydrogen and improve the amount of energy consumed and the economic feasibility of the process. In addition, Bian et al. [18] used a thermodynamic perspective to analyze the process of using LNG for precooling and dual-pressure Brayton cycles for subcooling, and the results showed that 6.60 kWh/kg of energy was consumed. Furthermore, Mehrpooya et al. [19] proposed a process for simultaneously liquefying hydrogen and natural gas using two mixed refrigerant cycles. Noh et al. [20] proposed the processes of precooling hydrogen using LNG cold energy to support the mixed refrigerant cycle and the precooling process only with LNG cold energy. The result of their study revealed that the SEC of the process precooling only with LNG cold energy was 5.613 kWh/kg-LH2, which was the most energy efficient among their process configurations.
Many studies have focused on optimizing the design of the hydrogen liquefaction cycle to reduce energy consumption. In this respect, Krasae-in et al. [21] proposed a process that applied a mixed refrigerant cycle for precooling and four independent hydrogen Joule–Brayton cycles for subcooling; results showed a specific energy consumption of 5.35 kWh/kg and an efficiency of 54.02%. Naquash et al. [22] developed a conceptual process design in which an additional refrigeration cycle using CO2 as the working fluid was introduced and the SEC of the entire process was 7.63 kWh/kg. Berstad et al. [23] designed a precooling process using a mixed refrigerant and employed the He-Ne Brayton cycle for subcooling; the energy consumption and process efficiency were found to vary depending on whether the Joule–Thomson valve or the liquid expander was used for decompression of the refrigerant in the precooling cycle. Cardella et al. [24] suggested the use of two processes: one employed the HP-H2 Claude cycle for subcooling and the other used the H2-Ne Brayton cycle and H2 cycle for subcooling. The cost of liquefying 1 kg of liquid hydrogen was compared when varying the production capacity. Sadaghiani and Mehrpooya [25] proposed a hydrogen liquefaction process that used two independent mixed refrigerant cycles; the specific energy consumption (SEC) was 4.410 kWh/kg, which was one of the lowest values reported in previous studies, and the exergy efficiency was 67.53%. However, approximately 74% of the total energy of the entire process was consumed during the second refrigeration cycle. Ghorbani et al. [26] proposed a hydrogen liquefaction process consisted of a mixed refrigerant cycle, organic Rankine cycle, adsorption refrigeration system, and solar energy collection system. In this study, the SEC was 4.02 kWh/kg due to the additional power generation, which was one of the lowest energy consumptions, but the process structure became complicated. In addition, Naquash et al. [27] developed a hydrogen liquefaction process with adsorption refrigeration, organic Rankine cycle, and liquid air energy system, in which the SEC was 6.71 kWh/kg. Recently, Bi et al. [28] proposed a hydrogen liquefaction process using a dual-path hydrogen refrigeration cycle, and the optimization was performed to minimize energy consumption. In their work, the SEC was 7.041 kWh/kg.
Since the hydrogen liquefaction process is an energy-intensive process, research has been conducted in various ways to reduce the energy consumption of the process. To enhance the performance of the liquefaction process, it is important to select the proper working fluid, operating condition, and the structure of the cooling cycle [29]. However, there are few studies on modifying the structure of the hydrogen liquefaction process and comparing each design under optimal working fluid composition and operating conditions. In the hydrogen liquefaction process, more energy is consumed in subcooling cycle. Therefore, this study focuses on the operating condition and configuration of the subcooling cycle. The hydrogen liquefaction process proposed by Sadaghiani and Mehrpooya [25] is selected as the base case configuration, and the configuration of the subcooling cycle is modified using (i) a dual-pressure Brayton cycle and (ii) a split triple-pressure Brayton cycle. The ortho–para conversion (O-P conversion) of the hydrogen should be considered because the heat of O-P conversion is larger than the heat of vaporization. Therefore, the O-P conversion of hydrogen is modeled by applying the experimental heat capacity data of the equilibrium hydrogen. Process optimization is conducted to minimize energy consumption by applying the genetic algorithm (GA), and the optimization results are evaluated from thermodynamic and techno-economic perspectives. In particular, the heat exchange analysis is conducted to investigate the impact of proper configuration and operation of the subcooling cycle.
2. Methodology
2.1. Process Description
The major objective of this study is to efficiently configure the subcooling cycle of the hydrogen liquefaction process, and the main concept of this study is illustrated in Figure 1. To achieve our objectives, two different subcooling cycles are proposed and compared. A single-pressure Brayton cycle is selected as the base case configuration. Configuration 1 cools the hydrogen using a dual-pressure Brayton cycle; the refrigerant is divided into two sections after 2-stage compression, and part of them is re-pressurized. Configuration 2 is a split triple-pressure Brayton cycle; the refrigerant is separated after 1-stage compression and part of them is compressed to medium-pressure. This medium-pressure refrigerant is divided again, and part of them is further compressed.
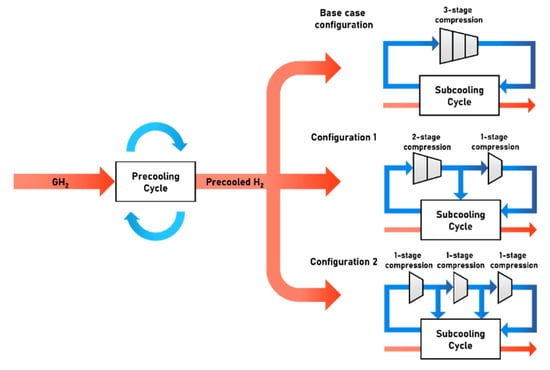
Figure 1.
Schematic diagram of the hydrogen liquefaction process with various modifications of the subcooling cycle configuration.
The simulation of the hydrogen liquefaction process was performed using the commercial process simulation software, Aspen HYSYS V11 (Aspentech). The Peng-Robinson equation of state was applied, which is recommended for use with refrigeration and liquefaction processes [30]. The O-P conversion of hydrogen occurs continuously through catalysts in the heat exchangers. This process aims to liquefy hydrogen at 25 °C and from 2,100 kPa to 130 kPa. The amount of liquefied hydrogen produced during the process was set at 300 tonnes per day (TPD). In the cryogenic process, a minimum temperature difference (MTD) in heat exchangers is generally set as 1–3 °C to reduce the energy consumption of the cooling cycle [31]. Therefore, the MTD was set as 1 °C in this study. The design basis for the simulation is presented in Table 1.

Table 1.
Process design basis.
2.1.1. Precooling Cycle
The state-of-the-art hydrogen liquefaction process proposed by Sadaghiani and Mehrpooya [25], which provides one of the highest energy efficiency reported in previous studies, was selected as the base case configuration. The process flow diagram of the precooling cycle is shown in Figure 2, where the hydrogen streams are labeled H1 to H4, and the refrigerant streams of the precooling cycle are labeled P1 to P26. The refrigerant used in the precooling cycle contains hydrocarbons, and their respective molar fractions are listed in Table 2. Figure 2 shows that the feed hydrogen (H1) flows into the precooling cycle at 25 °C and 2,100 kPa. The refrigerant stream, S1, is pressurized using Comp-1, and liquid and gas are separated and pressurized using Pump-1 and Comp-2 to reach 2,020 kPa. When passing through HX-1 to HX-3, the temperature of the refrigerant decreases to −194.8 °C. The temperature of P20 further decreases through expansion to 200 kPa. The precooling cycle outlet temperature of the hydrogen reaches −195 °C, and it then enters the subcooling cycle.

Figure 2.
Process flow diagram of the precooling cycle.

Table 2.
Molar fractions of precooling cycle refrigerant [33].
2.1.2. Subcooling Cycle: Base Case Configuration
Figure 3 shows the process flow diagram of the base case configuration for the subcooling cycle. The hydrogen streams are labeled H5 to H11, and the inlet conditions are 2,100 kPa and −195 °C. The refrigerant streams of the subcooling cycle are labeled R1 to R22 and comprise He, Ne, and hydrogen. The components and molar fractions of the refrigerant in the base case configuration are given in Table 3. The subcooling cycle uses three compressors, three seawater coolers, three expanders, and six heat exchangers. The refrigerant stream is pressurized to 592.06 kPa, and the high-pressure refrigerant stream, R7, is split into R8, R13, and R18. These separated refrigerant streams flow into the heat exchanger (RHX-1, RHX-2, and RHX-3) for self-cooling and are depressurized to 100 kPa. The operating conditions (temperature, pressure, and mass flow rates) of the refrigerant and hydrogen streams are presented in Table 4.
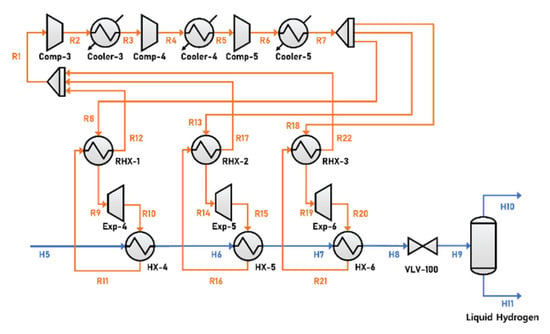
Figure 3.
Process flow diagram of subcooling cycle base case configuration.

Table 3.
Components and molar fractions of refrigerant used in the base case configuration.

Table 4.
Operating conditions of key streams in the base case configuration.
The temperature and pressure of hydrogen flowing into the subcooling cycle and the temperature and pressure of refrigerant stream S1 are identical in configuration 1 and configuration 2.
2.1.3. Subcooling Cycle: Configuration 1
In configuration 1, the process configuration is simplified by removing two heat exchangers and one expander, as shown in Figure 4. The total mass flow rate of the refrigerant is 57.6 kg/s, and its components and molar fractions are shown in Table 5. The refrigerant is pressurized through two-stage compression and it then splits into two streams. One of the streams is pressurized further. After compression, the refrigerant streams expand to cool the hydrogen. This configuration is economically advantageous because it reduces the amount of equipment required. However, larger heat exchangers are required to cover the wide temperature range. In addition, the refrigerant expands at high pressure, and more energy is thus required for pressurization to lower the temperature of hydrogen when two heat exchangers are used. The temperature, pressure, and mass flow rates of the refrigerant and hydrogen streams are presented in Table 6.
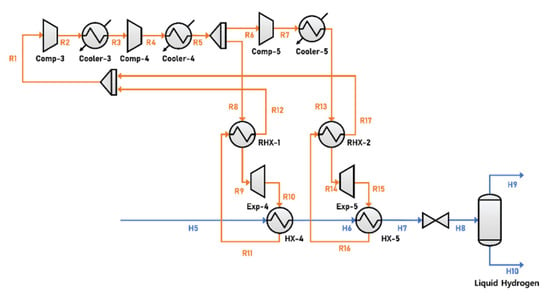
Figure 4.
Process flow diagram of subcooling cycle in configuration 1.

Table 5.
Components and molar fractions of refrigerant used in configuration 1.

Table 6.
Operating conditions of key streams in configuration 1.
2.1.4. Subcooling Cycle: Configuration 2
In configuration 2, hydrogen is cooled by splitting the refrigerant stream when compressed, as shown in Figure 5. The refrigerant is at 64.51 kg/s and its composition is shown in Table 7. The refrigerant stream is divided into two streams as it passes through Comp-3, and one stream is divided again when it passes through Comp-4. One of the streams pressurized in Comp-4 is then further pressurized in Comp-5. The three refrigerant streams under different pressures are expanded to 100 kPa. Cold energy of the refrigerant is then delivered to the hydrogen, and the subcooling cycle lowers the outlet temperature of hydrogen to −252.3 °C.
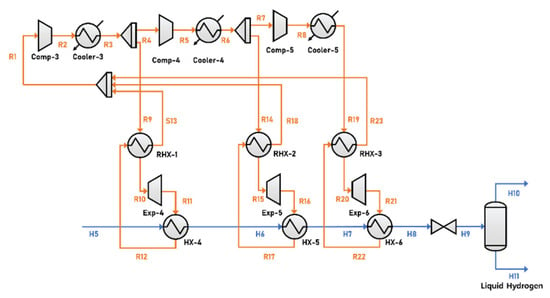
Figure 5.
Process flow diagram of subcooling cycle in configuration 2.

Table 7.
Components and molar fractions of refrigerant used in configuration 2.
This configuration uses the same number of equipment as that of the base case configuration. However, as the refrigerant is split following compression, the mass flow rate of the refrigerant flowing into the medium- and high-pressure compressors is reduced, which means that the size of the compressor and cooler equipment can be reduced. Table 8 lists the operating conditions (temperature, pressure, and mass flow rates) of the refrigerant and hydrogen stream.

Table 8.
Operating conditions of key streams in configuration 2.
2.1.5. O-P Conversion
Hydrogen is composed of two atoms, and it exhibits different properties depending on the spin direction; atoms of ortho-hydrogen spin in the same direction, while atoms of para-hydrogen spin in opposite direction. At a temperature of 25 °C, hydrogen is generally present as 25% para-hydrogen and 75% ortho-hydrogen, but the para-hydrogen proportion increases with a decrease in temperature [34]. To ensure that the design of the hydrogen liquefaction process is rigorous, the heat of O-P conversion needs to be considered. The heat of conversion at 20 K is 527 kJ/kg, which is higher than the latent heat of 447 kJ/kg [35]. If part of the liquid hydrogen exists as ortho-hydrogen, it is then converted to para-hydrogen; this releases conversion heat, which can vaporize liquid hydrogen. The conversion from ortho- to para-hydrogen is necessary to prevent the boil-off of hydrogen during the liquefaction process. In this study, it is assumed that the ortho-hydrogen is converted to para-hydrogen continuously through the catalysis in the heat exchangers. Since the heat of O-P conversion depends on the equilibrium ratio, the thermodynamic properties of hydrogen was modeled using the experimental heat capacity data in the equilibrium ortho–para ratio [36].
Python 3.7.6, and polyfit functions were utilized for polynomial regression of the experimental data. To reduce the error between the experimental data and regression data, the temperature range was separated into two ranges: 77–300 K for the precooling cycle and 20–90 K for the subcooling cycle. Figure 6 shows the curve fitting results of the heat capacity of equilibrium hydrogen in the range of the precooling and subcooling cycles.
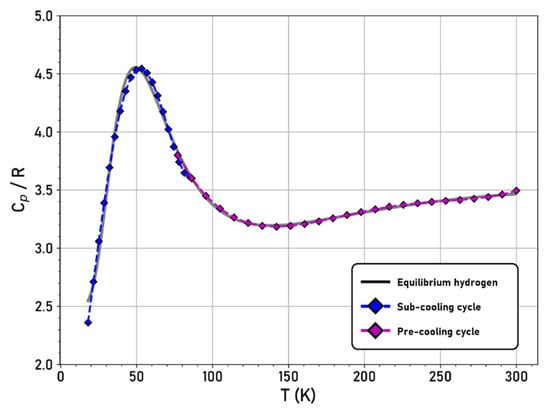
Figure 6.
Heat capacity of equilibrium hydrogen and fitting curve results.
2.2. Optimization Method
2.2.1. Genetic Algorithm (GA)
The hydrogen liquefaction process has many variables, and determining a global solution is thus difficult. The GA is widely used as an effective tool to search for global optima. It can avoid the problem of being trapped in local minima because it mimics biological evolution by modifying the gene combination randomly; it thus effectively obtains a global solution [37].
Figure 7 shows the optimization framework using Aspen HYSYS and the GA in MATLAB (Mathworks, version 2020b). The initial populations were generated randomly and evaluated using the objective function. Some of these were selected, and new populations were generated by crossover and mutation. This procedure was repeated until the termination criteria were satisfied. Table 9 presents the parameters of the GA.
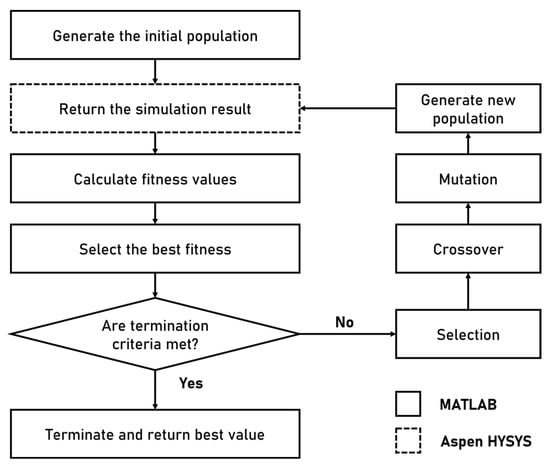
Figure 7.
Flowchart of process optimization using GA.

Table 9.
Parameters of genetic algorithm (GA).
2.2.2. Objective Function
The objective function used in the optimization was set as the minimization of the SEC, which is expressed as follows:
where OBJ and SEC are the objective function and specific energy consumption, respectively. The optimization variables of the base case configuration were the compression ratios of Comp-3, Comp-4, and Comp-5; the mass flow rates of R8, R13, and R18; the temperatures of R11, R16, and R21; and the refrigerant molar compositions of hydrogen, helium, and neon. The optimization variables of configuration 1 were as follows: the compression ratios of Comp-3, Comp-4, and Comp-5; the mass flow rates of R8 and S13; the temperatures of R11 and R16; and the refrigerant molar compositions of hydrogen, helium, and neon. The optimization variables of configuration 2 were the compression ratios of Comp-3, Comp-4, and Comp-5; the mass flow rates of R9, R14, and R19; the temperatures of R12, R17, and R22; the refrigerant molar compositions of hydrogen, helium, and neon.
2.2.3. Constraints
The following physical constraints must be satisfied in all configurations:
where , , , and denote the hot-side temperature, cold-side temperature of the heat exchanger, minimum temperature difference, and compression ratio, respectively. The MTD of heat exchanger should be set as 1 °C to obtain an efficient heat exchange, the compression ratio should be lower than 3.5, and the summation of the refrigerant composition should be 1.
2.3. Energy Analysis
The SEC is calculated as the net power requirement divided by the mass flow rate of liquid hydrogen, as follows:
where is the net energy input, is the mass flow rate of liquid hydrogen, is the energy required for compression, is the energy required for the pump, is the energy generated by the expander, and 3600 is the unit conversion parameter from kg/s to kg/h.
2.4. Techno-Economic Analysis
A techno-economic analysis was used to evaluate the cost reduction in relation to changes in the configuration, and the assumptions adopted for the economic analysis are presented in Table 10.
The total cost of the hydrogen liquefaction process is calculated as:
where is the capital cost, is the annual operating cost, is the interest rate, and is the plant lifetime in units of year.
Capital expenses include the bare module factor, equipment life expectancy, and interest rate. The capital expense equation is expressed as follows:
where 1.18 is used to reflect the contingencies and contractor fee, is the bare module factor, is the equipment purchase cost, is the interest rate, is the equipment life expectancy, is the chemical engineering plant cost index, is the equipment type, and is the required number of equipment units.
The purchase costs for the compressor, expander, and pump are calculated as follows [38,39]:
where is the purchase cost of the compressor, is the power requirement of the compressor, is the purchase cost of the expander, is the power generation of the expander, is the purchase cost of the pump, and is the power requirement of the pump.
The purchase cost of the heat exchanger is modeled as follows:
where is the purchase cost of the shell-and-tube-type heat exchanger, Q is the heat exchange rate, LMTD is the log mean temperature difference in the heat exchanger, CV is the C-value for calculating the shell-and tube-type heat exchangers [40], is the purchase cost of the multi-stream heat exchanger, is the B-value related to the heat exchanger volume, and is the cost per unit volume [41]. The cost parameters related to calculating equipment costs are listed in Table 11.
Operating expenses consist of maintenance costs, cooling water, and electricity costs, and are summarized as follows:
where is the equipment maintenance cost, is the cooling-water cost, and is the electricity cost.
The maintenance cost, cooling cost, and electricity cost are calculated as follows:
where is the plant operating hours, is the cost of cooling water, is the amount of heat to be removed in cooler, is the electricity price, and is the power requirements of the entire plant. The annual maintenance cost is assumed to be 3% of the total CAPEX [42].

Table 10.
Assumptions used in economic analysis.
Table 10.
Assumptions used in economic analysis.
| Parameter | Value |
|---|---|
| Interest rate [43] | 7% |
| Operating hours [42] | 8,000 h/yr |
| Plant operating life [24] | 20 years |
| Electricity wholesale price [44] | USD 0.084/kWh |
| Cooling price [45] | USD 3.54 × 10⁻⁷/kJ |
| Annual maintenance cost [42] | 3% of the total capital cost (USD/yr) |

Table 11.
Cost parameters of main equipment employed.
Table 11.
Cost parameters of main equipment employed.
| Parameter | Value |
|---|---|
| Equipment life expectancy | |
| Compressor [46] | 50,000 h |
| Expander [47] | 100,000 h |
| Others | 200,000 h |
| Bare module factor [48] | |
| Compressor | 2.15 |
| Expander | 2.15 |
| Pump | 3.3 |
| Cooler | 3.17 |
| Heat exchanger | 3.17 |
| CEPCI [49] | |
| 2020 (Base year) | 593.6 |
| 2012 (Pump) | 584.6 |
| 2009 (Compressor and Expander) | 521.9 |
| 1997 (Multi-stream heat exchanger) | 386.5 |
| 1994 (Shell-and-tube type exchanger) | 368.1 |
3. Results and Discussion
3.1. Energy Analysis
The SEC and liquefaction ratios for each configuration are shown in Figure 8. The SECs of the base case configuration, configuration 1, and configuration 2 were 5.88 kWh/kg, 5.94 kWh/kg, and 5.69 kWh/kg, respectively, and their liquefaction ratios were 91.7%, 89.8%, and 99.2%, respectively. The lowest energy consumption was achieved with configuration 2, which provided a 3.2% decrease compared to the base case configuration. The energy analysis results showed that approximately 80% of the energy for the entire process was consumed during the subcooling cycle; this emphasized the need to reduce the amount of energy consumed in the subcooling cycle, and an energy analysis of the subcooling cycle was thus conducted.
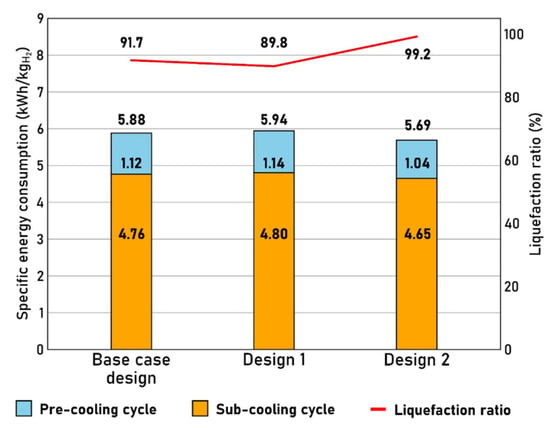
Figure 8.
Specific energy consumption and liquefaction ratio.
In configuration 1, the net power requirement increased and the liquefaction ratio decreased compared to the base case configuration due to its structural limitations. The amounts of energy consumed and generated are listed in Table 12. Although the refrigerant flow rate of configuration 1 was lower than that of the base case configuration, its energy consumption was high because the refrigerant is further pressurized than the base case configuration. The highest pressure obtained was 1,284.3 kPa in configuration 1 compared to 592.1 kPa in the base case configuration; the pressure in configuration 1 needs to increase because the refrigerant expands at high pressure to cool the hydrogen when fewer heat exchangers are used. Therefore, more energy was required even with a low refrigerant flow rate.

Table 12.
Energy analysis results.
In configuration 2, the SEC decreased by 0.19 kWh/kg compared to the base case configuration due to the configuration characteristics. The effect of reducing the refrigerant flow rate is also shown in Table 12. The first compressor involved in subcooling (Comp-3) requires 37,628.2 kW, which accounts for approximately 60% of the amount of subcooling cycle energy consumed. However, as the refrigerant flow rate to the compressor gradually decreases, the amount of energy required also decreases. Thus, configuration 2 liquefies comparatively more hydrogen while consuming less energy.
3.2. Heat Exchange Analysis
A heat exchange analysis is a useful tool for evaluating heat exchange performance [50]. The refrigerant is cooled to an extremely low temperature and cold energy is transferred to hydrogen during the hydrogen liquefaction process; therefore, the heat exchange efficiency is an important factor.
The pinch point is the point at which the temperature difference between the cold and hot sides of the heat exchanger is minimized. At this point, the driving force of the heat exchange is also minimized owing to the small temperature difference [51], and a larger heat exchange area is required. This causes an increase in capital and operating costs. In addition, the heat exchange efficiency increases with a decrease in the temperature difference [52]. In summary, efficient heat exchange is possible when the distance between the heat exchange curves decreases, but this increases the cost. Figure 9 shows heat flow diagrams of the subcooling cycles of the three configurations. The hot-stream and cold-stream curves represent the hydrogen and refrigerant streams, respectively. The MTD of each heat exchanger is higher than the design value of 1 °C.
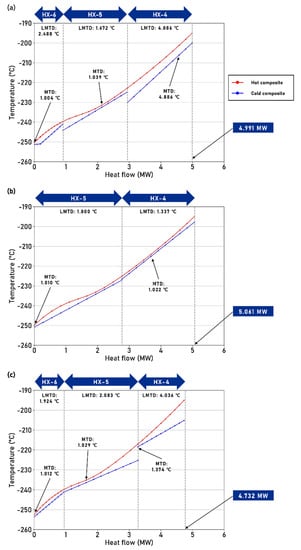
Figure 9.
Heat flow diagrams of subcooling cycle: (a) base case configuration, (b) configuration 1, (c) configuration 2.
Configuration 1 uses two heat exchangers for hydrogen subcooling. As the inlet temperature of hydrogen to the subcooling cycle is fixed, each heat exchanger needs to cover a wider temperature range to liquefy hydrogen. If available, multiple heat exchangers can be installed according to the temperature range, to design an efficient heat exchange system. However, fewer heat exchangers make it difficult to efficiently arrange the equipment, and thus the heat exchanger cost is then increased.
The role of the last heat exchanger that cools hydrogen has a significant influence on the liquefaction rate of hydrogen; as the temperature of hydrogen decreases after being cooled by the refrigerant, a larger amount of liquefied hydrogen is produced. The outlet temperature of hydrogen in subcooling cycle is the lowest in configuration 2. The temperature of the hydrogen is related to the flow rate, pressure, and composition of the refrigerant. In particular, the composition of the refrigerant has a significant influence because the temperature is reduced further with an increase in the proportion of the low-boiling-point component. Hydrogen and helium are considered to be the low-boiling-point components of the subcooling cycle refrigerant, and their percentage fractions within the base case configuration and configuration 2 are 83% and 97%, respectively. The refrigerant temperature can be effectively lowered in configuration 2, owing to the high fraction of hydrogen and helium, which results in a decrease in the heat exchanger outlet temperature of the hydrogen. Furthermore, as a phase transition does not occur during the heat exchange, there is a narrow distance between the cold- and hot-side curves. Hydrogen and helium require additional energy for compression. However, as only some of the refrigerant is additionally compressed to the highest pressure, the increased energy consumption is offset. In summary, the ratio of hydrogen and helium is increased in configuration 2, which enables a lower temperature to be reached and subsequently efficient heat exchange.
3.3. Techno-Economic Analysis
Techno-economic analysis of the three configurations was conducted, and Figure 10 shows the total CAPEX and total OPEX. The total OPEX was calculated assuming that the process had been operating for 20 years. The total costs of the base case configuration, configuration 1, and configuration 2 were calculated as USD 764 million, USD 773 million, and USD 720 million, respectively, and configuration 2 was found to be the most economical. Compared with the base case configuration, the total CAPEX and total OPEX of configuration 2 decreased by 10.8% and 4.0%, respectively.
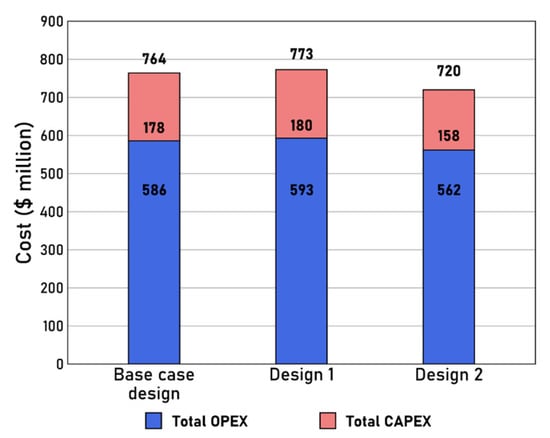
Figure 10.
Results of techno-economic analysis.
A breakdown of the components assessed in the total CAPEX and total OPEX analyses is listed in Table 13. The cost related to the compressor accounted for the largest proportion of the total CAPEX and was calculated as USD 133 million, USD 136 million, and USD 117 million, respectively. The amount of energy required is important when calculating the cost of the compressor. Configuration 1 uses less refrigerant than the base case configuration, but it requires more energy because two heat exchangers are required to cover a wide temperature range, and the refrigerant needs to be pressurized at almost double the pressure of the base case configuration. In configuration 2, there is a gradual decrease in the flow rate of the refrigerant flowing into each compressor, and the amount of energy consumed thus decreases; therefore, the reduction in the amount of energy consumed by the compressors lowers the cost of configuration 2.

Table 13.
Results of cost evaluation.
The heat exchanger is the second most expensive device: USD 38.9 million, USD 38.7 million, and USD 35.3 million, in the base case configuration, configuration 1, and configuration 2, respectively. Although configuration 1 uses fewer heat exchangers than the base case configuration, the equipment cost is similar. The heat exchanger cost is affected by the heat flow rate, and there is a large heat flow rate for each piece of equipment in configuration 1.
Ilkchchy et al. [53] reported that the heat exchange rate is higher when the fluid pressure is higher. In configuration 1, the refrigerant pressure is more than double that of the other configurations; therefore, more heat is transferred, even with a lower amount of refrigerant. Therefore, the cost of the heat exchanger in configuration 1 is relatively high. However, the reduced number of devices offsets the unit cost of the expensive heat exchanger.
The cost of electricity represents the largest operating cost, and it is mainly affected by the energy consumption of the compressors. As the energy consumption in configuration 2 is the lowest, the operating cost is also the lowest.
4. Conclusions
This study aimed to develop an efficient configuration for the subcooling cycle in the hydrogen liquefaction process. Two new systems were designed, and these were compared to an existing base case configuration. The refrigerant was separated after 3-stage compression in the base case configuration and after 2-stage compression in configuration 1. In configuration 2, the refrigerant was separated whenever it passed through the compressor. The processes within these configurations were compared based on energy, heat exchange, and a techno-economic analysis, and the following results were obtained:
- The specific energy consumption was calculated as 5.94 kWh/kg LH2 for configuration 1, an increase of 1% compared to the base case configuration, while the value of configuration 2 was calculated as 5.69 kWh/kg LH2, a decrease of 3.2%. The reduction in energy consumption relates to the efficient heat exchange configuration of configuration 2.
- The composition of the subcooling cycle refrigerant is an important factor. Configuration 2 has a higher ratio of hydrogen and helium compared to the other configuration, and the distance between the hot and cold composite curves thus narrows. The increased energy consumption that can occur owing to changes in the refrigerant composition is offset by the efficient process design.
- The techno-economic analysis showed that configuration 2 was the most economical process for USD 720 million (a decrease of approximately 5.8% compared to the base case configuration), in relation to the reduced energy and equipment costs relating to the efficient process configuration.
In summary, to improve the energy, heat exchange, and techno-economic aspects of the process, dividing the pressure levels and splitting the refrigerant flow rate are beneficial because the refrigerant is efficiently utilized. This study is expected to contribute to developing a commercialized and economical hydrogen liquefaction process.
Author Contributions
Conceptualization, S.P. and W.N.; Data curation, W.N. and J.P. (Jaedeuk Park); Formal analysis, S.P. and W.N.; Funding acquisition, J.P. (Jinwoo Park) and I.L.; Investigation, S.P.; Methodology, S.P. and W.N.; Project administration, J.P. (Jinwoo Park) and I.L.; Resources, W.N. and J.P. (Jaedeuk Park); Software, S.P. and J.P. (Jinwoo Park); Supervision, J.P. (Jinwoo Park) and I.L.; Validation, S.P. and W.N.; Visualization, S.P.; Writing—original draft, S.P.; Writing—review & editing, J.P. (Jinwoo Park) and I.L. All authors have read and agreed to the published version of the manuscript.
Funding
This work was supported by [Korean Institute of Industrial Technology] within the framework of the following projects: “Development of complex parameter smart analysis modules for color customering” [grant number EH-22-0011], [National Research Foundation of Korea (NRF)] grant funded by the Korean Government (MSIT) [grant number 2022R1C1C1003517], and the research grant of Kongju National University in 2022.
Conflicts of Interest
The authors declare no conflict of interest.
Nomenclature
| Abbreviations | |
| CAPEX | capital expenditure |
| CEPCI | chemical engineering plant cost index |
| CR | compression ratio |
| GA | genetic algorithm |
| HX | heat exchanger |
| LH2 | liquid hydrogen |
| LMTD | log mean temperature difference |
| MSHE | multi-stream heat exchanger |
| MTD | minimum temperature difference |
| OBJ | objective function |
| O-P | ortho–para |
| OPEX | operating expenditure |
| PL | plant life |
| SEC | specific energy consumption |
| TPD | ton per day |
| Symbols | |
| B-value | |
| cost | |
| cost per unit volume | |
| C-value | |
| heat flow rate | |
| interest rate | |
| life expectancy of equipment | |
| log mean temperature difference | |
| mass flow rate | |
| bare module factor | |
| operating hours per year | |
| plant life | |
| utility price | |
| heat flow rate | |
| work | |
| Subscripts | |
| counters | |
| base year | |
| capital expenditure | |
| compressor | |
| cooling cost | |
| equipment purchase cost | |
| electricity cost | |
| expander | |
| shell-and tube-type heat exchanger | |
| maintenance cost | |
| multi-stream heat exchanger | |
| net rate | |
| operating expenditure | |
| pump | |
| cost per year |
References
- Dincer, I. Green Methods for Hydrogen Production. Int. J. Hydrogen Energy 2012, 37, 1954–1971. [Google Scholar] [CrossRef]
- Edwards, P.; Kuznetsov, V.; David, W.I. Hydrogen Energy. Philos. Trans. R. Soc. A Math. Phys. Eng. Sci. 2007, 365, 1043–1056. [Google Scholar] [CrossRef] [PubMed]
- Niaz, S.; Manzoor, T.; Pandith, A.H. Hydrogen Storage: Materials, Methods and Perspectives. Renew. Sustain. Energy Rev. 2015, 50, 457–469. [Google Scholar] [CrossRef]
- Abdalla, A.M.; Hossain, S.; Nisfindy, O.B.; Azad, A.T.; Dawood, M.; Azad, A.K. Hydrogen Production, Storage, Transportation and Key Challenges with Applications: A Review. Energy Convers. Manag. 2018, 165, 602–627. [Google Scholar] [CrossRef]
- Li, M.; Bai, Y.; Zhang, C.; Song, Y.; Jiang, S.; Grouset, D.; Zhang, M. Review on the Research of Hydrogen Storage System Fast Refueling in Fuel Cell Vehicle. Int. J. Hydrogen Energy 2019, 44, 10677–10693. [Google Scholar] [CrossRef]
- Yanxing, Z.; Maoqiong, G.; Yuan, Z.; Xueqiang, D.; Jun, S. Thermodynamics Analysis of Hydrogen Storage Based on Compressed Gaseous Hydrogen, Liquid Hydrogen and Cryo-Compressed Hydrogen. Int. J. Hydrogen Energy 2019, 44, 16833–16840. [Google Scholar] [CrossRef]
- Züttel, A. Hydrogen Storage Methods. Naturwissenschaften 2004, 91, 157–172. [Google Scholar] [CrossRef]
- Yin, L.; Ju, Y. Review on the Design and Optimization of Hydrogen Liquefaction Processes. Front. Energy 2020, 14, 530–544. [Google Scholar] [CrossRef]
- Park, J.; Mun, H.; Kim, J.; Lee, I. Advanced Natural Gas Liquefaction Process on LNG Supply Chain with Liquid Air: From Design to Thermodynamic and Techno-Economic Analyses. Energy Convers. Manag. 2022, 252, 115107. [Google Scholar] [CrossRef]
- Lee, I.; Moon, I. Strategies for Process and Size Selection of Natural Gas Liquefaction Processes: Specific Profit Portfolio Approach by Economic Based Optimization. Ind. Eng. Chem. Res. 2018, 57, 5845–5857. [Google Scholar] [CrossRef]
- Al Ghafri, S.; Munro, S.; Cardella, U.; Funke, T.; Notardonato, W.; Trusler, J.P.M.; Leachman, J.; Span, R.; Kamiya, S.; Pearce, G.; et al. Hydrogen Liquefaction: A Review of the Fundamental Physics, Engineering Practice and Future Opportunities. Energy Environ. Sci. 2022. [Google Scholar] [CrossRef]
- Park, J.; Qi, M.; Kim, J.; Noh, W.; Lee, I.; Moon, I. Exergoeconomic Optimization of Liquid Air Production by Use of Liquefied Natural Gas Cold Energy. Energy 2020, 207, 118193. [Google Scholar] [CrossRef]
- Andersson, J.; Grönkvist, S. Large-Scale Storage of Hydrogen. Int. J. Hydrogen Energy 2019, 44, 11901–11919. [Google Scholar] [CrossRef]
- You, H.; Ahn, J.; Jeong, S.; Chang, D. Effect of Ortho-Para Conversion on Economics of Liquid Hydrogen Tanker with Pressure Cargo Tanks. Ships Offshore Struct. 2018, 13, 79–85. [Google Scholar] [CrossRef]
- Lee, D.; Quarme Gbadago, D.; Jo, Y.; Hwang, G.; Jo, Y.; Smith, R.; Hwang, S. Integrating Hydrogen Liquefaction with Steam Methane Reforming and CO2 Liquefaction Processes Using Techno-Economic Perspectives. Energy Convers. Manag. 2021, 245, 114620. [Google Scholar] [CrossRef]
- Bae, J.E.; Wilailak, S.; Yang, J.H.; Yun, D.Y.; Zahid, U.; Lee, C.J. Multi-Objective Optimization of Hydrogen Liquefaction Process Integrated with Liquefied Natural Gas System. Energy Convers. Manag. 2021, 231, 113835. [Google Scholar] [CrossRef]
- Yang, J.H.; Yoon, Y.; Ryu, M.; An, S.K.; Shin, J.; Lee, C.J. Integrated Hydrogen Liquefaction Process with Steam Methane Reforming by Using Liquefied Natural Gas Cooling System. Appl. Energy 2019, 255, 113840. [Google Scholar] [CrossRef]
- Bian, J.; Yang, J.; Li, Y.; Chen, Z.; Liang, F.; Cao, X. Thermodynamic and Economic Analysis of a Novel Hydrogen Liquefaction Process with LNG Precooling and Dual-Pressure Brayton Cycle. Energy Convers. Manag. 2021, 250, 114904. [Google Scholar] [CrossRef]
- Mehrpooya, M.; Sadaghiani, M.S.; Hedayat, N. A Novel Integrated Hydrogen and Natural Gas Liquefaction Process Using Two Multistage Mixed Refrigerant Refrigeration Systems. Int. J. Energy Res. 2020, 44, 1636–1653. [Google Scholar] [CrossRef]
- Noh, W.; Park, S.; Kim, J.; Lee, I. Comparative Design, Thermodynamic and Techno-Economic Analysis of Utilizing Liquefied Natural Gas Cold Energy for Hydrogen Liquefaction Processes. Int. J. Energy Res. 2022, 46, 12926–12947. [Google Scholar] [CrossRef]
- Krasae-In, S.; Stang, J.H.; Neksa, P. Simulation on a Proposed Large-Scale Liquid Hydrogen Plant Using a Multi-Component Refrigerant Refrigeration System. Int. J. Hydrogen Energy 2010, 35, 12531–12544. [Google Scholar] [CrossRef]
- Naquash, A.; Qyyum, M.A.; Min, S.; Lee, S.; Lee, M. Carbon-Dioxide-Precooled Hydrogen Liquefaction Process: An Innovative Approach for Performance Enhancement–Energy, Exergy, and Economic Perspectives. Energy Convers. Manag. 2022, 251, 114947. [Google Scholar] [CrossRef]
- Berstad, D.O.; Stang, J.H.; Nekså, P. Large-Scale Hydrogen Liquefier Utilising Mixed-Refrigerant Pre-Cooling. Int. J. Hydrogen Energy 2010, 35, 4512–4523. [Google Scholar] [CrossRef]
- Cardella, U.; Decker, L.; Sundberg, J.; Klein, H. Process Optimization for Large-Scale Hydrogen Liquefaction. Int. J. Hydrogen Energy 2017, 42, 12339–12354. [Google Scholar] [CrossRef]
- Sadaghiani, M.S.; Mehrpooya, M. Introducing and Energy Analysis of a Novel Cryogenic Hydrogen Liquefaction Process Configuration. Int. J. Hydrogen Energy 2017, 42, 6033–6050. [Google Scholar] [CrossRef]
- Ghorbani, B.; Mehrpooya, M.; Aasadnia, M.; Niasar, M.S. Hydrogen Liquefaction Process Using Solar Energy and Organic Rankine Cycle Power System. J. Clean. Prod. 2019, 235, 1465–1482. [Google Scholar] [CrossRef]
- Naquash, A.; Qyyum, M.A.; Islam, M.; Sial, N.R.; Min, S.; Lee, S.; Lee, M. Performance Enhancement of Hydrogen Liquefaction Process via Absorption Refrigeration and Organic Rankine Cycle-Assisted Liquid Air Energy System. Energy Convers. Manag. 2022, 254, 115200. [Google Scholar] [CrossRef]
- Bi, Y.; Yin, L.; He, T.; Ju, Y. Optimization and Analysis of a Novel Hydrogen Liquefaction Process for Circulating Hydrogen Refrigeration. Int. J. Hydrogen Energy 2022, 47, 348–364. [Google Scholar] [CrossRef]
- Akbari, H.; Sorin, M.; Marcos, B. An Equivalent Temperature Based Approach for Selection of the Most Appropriate Working Fluids for Refrigeration Cycles. Energy Convers. Manag. 2018, 174, 227–238. [Google Scholar] [CrossRef]
- Seyam, S.; Dincer, I.; Agelin-Chaab, M. Analysis of a Clean Hydrogen Liquefaction Plant Integrated with a Geothermal System. J. Clean. Prod. 2020, 243, 118562. [Google Scholar] [CrossRef]
- Lee, I.; Park, J.; Moon, I. Conceptual Design and Exergy Analysis of Combined Cryogenic Energy Storage and LNG Regasification Processes: Cold and Power Integration. Energy 2017, 140, 106–115. [Google Scholar] [CrossRef]
- Bracha, M.; Lorenz, G.; Patzelt, A.; Wanner, M. Large-Scale Hydrogen Liquefaction in Germany. Int. J. Hydrogen Energy 1994, 19, 53–59. [Google Scholar] [CrossRef]
- Cho, S.; Park, J.; Noh, W.; Lee, I.; Moon, I. Developed Hydrogen Liquefaction Process Using Liquefied Natural Gas Cold Energy: Design, Energy Optimization, and Techno-economic Feasibility. Int. J. Energy Res. 2021, 45, 14745–14760. [Google Scholar] [CrossRef]
- Leachman, J.W.; Jacobsen, R.T.; Lemmon, E.W.; Penoncello, S.G. Thermodynamic Properties of Cryogenic Fluids; International Cryogenics Monograph Series; Springer International Publishing: Cham, Switzerland, 2017; ISBN 978-3-319-57833-0. [Google Scholar]
- Qyyum, M.A.; Riaz, A.; Naquash, A.; Haider, J.; Qadeer, K.; Nawaz, A.; Lee, H.; Lee, M. 100% Saturated Liquid Hydrogen Production: Mixed-Refrigerant Cascaded Process with Two-Stage Ortho-to-Para Hydrogen Conversion. Energy Convers. Manag. 2021, 246, 114659. [Google Scholar] [CrossRef]
- Le Roy, R.J.; Chapman, S.G.; Mccourt, F.R.W. Accurate Thermodynamic Properties of the Six Isotopomers of Diatomic Hydrogen. J. Phys. Chem. 1990, 94, 923. [Google Scholar] [CrossRef]
- Bajpai, P.; Kumar, M. Genetic Algorithm—An Approach to Solve Global Optimization Problems. Indian J. Comput. Sci. Eng. 2010, 1, 199–206. [Google Scholar]
- Couper, J.R.; Penney, W.R.; Fair, J.R.; Walas, S.M. Chemical Process Equipment: Selection and Design; Gulf Professional Publishing: Waltham, MA, USA; Oxford, UK, 2005. [Google Scholar]
- Dutta, A.; Karimi, I.A.; Farooq, S. Economic Feasibility of Power Generation by Recovering Cold Energy during LNG (Liquefied Natural Gas) Regasification. ACS Sustain. Chem. Eng. 2018, 6, 10687–10695. [Google Scholar] [CrossRef]
- ESDU Data Item No. 94042. Selection and Costing of Heat Exchangers, Shell-and-Tube Type; ESDU: London, UK, 1994. [Google Scholar]
- ESDU Data Item No. 97006. Selection and Costing of Heat Exchangers, Plate-Fin Type; ESDU: London, UK, 2003. [Google Scholar]
- Peters, M.S.; Timmerhaus, K.D.; West, R.E. Plant Design and Economics for Chemical Engineers; McGraw-Hill: New York, NY, USA, 2003; Volume 4. [Google Scholar]
- Park, J.; Lee, I.; You, F.; Moon, I. Economic Process Selection of Liquefied Natural Gas Regasification: Power Generation and Energy Storage Applications. Ind. Eng. Chem. Res. 2019, 58, 4946–4956. [Google Scholar] [CrossRef]
- Korea Power Exchange. Available online: https://www.kpx.or.kr/www/contents.do?key=225 (accessed on 1 September 2021).
- Turton, R. Analysis, Synthesis, and Design of Chemical Processes; Prentice Hall: Upper Saddle River, NJ, USA, 2012. [Google Scholar]
- Neittaanmäki, P.; Repin, S.; Tuovinen, T. Mathematical Modeling and Optimization of Complex Structures; Computational Methods in Applied Sciences; Springer International Publishing: New York, NY, USA, 2016; Volume 40, ISBN 978-3-319-23563-9. [Google Scholar]
- Slottner, P. Life Extension of SIEMENS Industrial-Sized Gas Turbines. In Proceedings of the 18th Symposium of the Industrial Application of Gas Turbines Committee, Banff, AB, Canada, 19–21 October 2009. [Google Scholar]
- Ulrich, G.D.; Vasudevan, P.T. Chemical Engineering Process Design and Economics: A Practical Guide, 2nd ed.; Process Publishing: Bala Cynwyd, PA, USA, 2018. [Google Scholar]
- The Chemical Engineering Plant Cost Index. Available online: https://chemengonline.com/ (accessed on 1 September 2021).
- Lee, I.; Moon, I. Economic Optimization of Dual Mixed Refrigerant Liquefied Natural Gas Plant Considering Natural Gas Extraction Rate. Ind. Eng. Chem. Res. 2017, 56, 2804–2814. [Google Scholar] [CrossRef]
- Ebrahimi, A.; Ghorbani, B.; Ziabasharhagh, M. Pinch and Sensitivity Analyses of Hydrogen Liquefaction Process in a Hybridized System of Biomass Gasification Plant, and Cryogenic Air Separation Cycle. J. Clean. Prod. 2020, 258, 120548. [Google Scholar] [CrossRef]
- Lee, I.; You, F. Systems Design and Analysis of Liquid Air Energy Storage from Liquefied Natural Gas Cold Energy. Appl. Energy 2019, 242, 168–180. [Google Scholar] [CrossRef]
- Fardi Ilkhchy, A.; Jabbari, M.; Davami, P. Effect of Pressure on Heat Transfer Coefficient at the Metal/Mold Interface of A356 Aluminum Alloy. Int. Commun. Heat Mass Transf. 2012, 39, 705–712. [Google Scholar] [CrossRef][Green Version]
Publisher’s Note: MDPI stays neutral with regard to jurisdictional claims in published maps and institutional affiliations. |
© 2022 by the authors. Licensee MDPI, Basel, Switzerland. This article is an open access article distributed under the terms and conditions of the Creative Commons Attribution (CC BY) license (https://creativecommons.org/licenses/by/4.0/).