Abstract
Reactive dyeing is primarily used in the textile industry to achieve a high level of productivity for high-quality products. This method requires heating a large amount of freshwater for dyeing and cooling for the biological treatment of discharged wastewater. If the heat of the wastewater discharged from the textile industry is recovered, energy used for heating freshwater and cooling wastewater can be significantly reduced. However, the energy efficiency of this industry remains low, owing to the limited use of waste heat. Hence, this study suggested a cost-optimal heat exchanger network (HEN) in a heat pump-assisted textile industry wastewater heat recovery system with maximizing energy efficiency simultaneously. A novel two-step approach was suggested to develop the optimal HEN in heat pump-assisted textile industry wastewater heat recovery system. In the first step, the system was designed to integrate the heat exchanger and heat pump to recover waste heat effectively. In the second step, the HEN in the newly developed system was retrofitted using super-targeted pinch analysis to minimize cost and maximize energy efficiency simultaneously. As a result, the proposed wastewater heat recovery system reduced the total annualized cost by up to 43.07% as compared to the conventional textile industry lacking a wastewater heat recovery system. These findings may facilitate economic and environmental improvements in the textile industry.
1. Introduction
In the textile industry, reactive dyeing is primarily used to produce large quantities of high-quality products. During reactive dyeing, cellulose fibers are immersed in a dissolved reactive dye solution; the fibers are then dyed via bonding between the dye and molecules on the surface of the fibers. Reactive dyeing requires freshwater to be heated to induce the reaction of the dye and fibers, as well as wastewater cooling for biological treatment [1]. As the wastewater discharged by the textile industry contains large amounts of waste heat, the energy required for heating freshwater could be reduced if wastewater was reclaimed for heating. The energy required for cooling the wastewater could also be reduced because its baseline temperature would be lowered during the recovering process. However, the limited use of waste heat and generally inefficient use of energy increases textile production costs. Currently, the operating costs for freshwater heating and wastewater cooling account for 16.2% and 6.7% of production costs, respectively, in the textile dyeing plant in South Korea, which does not use the heat of wastewater. Therefore, it is essential to adopt an appropriate wastewater heat recovery system in the textile industry to use energy more effectively.
Currently, the effective and economical utilization of wastewater heat in the textile industry is being intensively researched. Kandilli and Koclu [2] reduced textile industry energy consumption by installing a wastewater heat recovery system with an optimized counter-flow plate heat exchanger (PHE) to recover heat from the dyeing process. To install the counter-flow PHE, the mass flow rate and inlet temperature of the wastewater and freshwater were adjusted. As a result, when wastewater and freshwater passed through the heat exchanger at 10.00 and 7.00 m3/h and 52.4 °C and 59.5 °C, respectively, the exergy efficiency increased by up to 1.28 times as compared to the existing recovery system. Kannoh [3] used a heat pump to recover wastewater heat from 30–50 °C discharged from a textile washing process. When 1.39 × 10⁹ J/h of heat was recovered from wastewater discharged at a rate of 60 m3/h, hot water (80 °C) could be obtained at a rate of 3.48 × 10⁹ J/h. Rakib et al. [4] saved 5716 MWh of energy and USD 47,100/y by recovering the heat of wastewater discharged from textile dyeing through a heat recovery system with a counter-flow heat exchanger. Moreover, the payback period for their system was approximately 11 months, confirming the feasibility of recovery systems with simple configurations. Elahee [5] reduced the energy used during textile finishing by recovering the heat of the wastewater discharged from the dyeing process through a shell and tube heat exchanger. As a result, the fossil fuel consumption of the finishing process was reduced by up to 10%, and the economic feasibility of this system was confirmed by a short payback period of only nine months.
Despite the many contributions of wastewater heat recovery systems to increasing energy efficiency in the textile industry, several challenges remain. First, because all wastewater discharged from each process in the textile industry contains a considerable amount of heat, it is essential to recover as much of it as possible to increase the energy efficiency. However, only the heat of wastewater discharged from one process has been recovered in most previous studies, rendering a limited heat recovery efficiency. Second, the heat exchanger networks (HENs) in conventionally developed wastewater heat recovery systems are not optimally configured, so energy efficiency in the textile industry is not being maximized. Currently, in other industries, research designing an optimal HEN in wastewater heat recovery systems through pinch analysis, which retrofits the configuration to maximize energy efficiency, is actively being conducted. Alhajri et al. modified an existing HEN using pinch analysis to optimize the crude oil distillation operation in the petrochemical industries [6]. HEN retrofit scenarios were divided into less modification, such as re-sequencing and re-piping existing heat exchangers, and more modifications, such as installing a new heat exchanger and adding a stream split. As a result of the retrofit scenario with less HEN modifications, it could save about 4 MW of potential energy compared to the current operation and required a pay-back period of 0.57 years. As a result of the retrofit scenario with more HEN modifications, about 10.38 MW of energy could be saved, and a pay-back period of 0.87 years was required. Jeong et al. optimized the HEN of the dehydration processes of liquefied natural gas (LNG) plants through pinch analysis to reduce operating costs and maximize heat conduction of energy plants [7]. When conducting pinch analysis, the differences between the heat exchange temperatures were reduced by several low-level utilities. The results show that about 61% of the total heat supply can be replaced with low-pressure steam, and the annual operating costs savings can be about 17%. Therefore, it is necessary to develop optimally configured HENs via pinch analysis in wastewater heat recovery system through pinch analysis in the textile industry like in other industries.
To address these challenges, the development of a wastewater heat recovery system via pinch analysis with thorough consideration of the operation method of dyeing plants is crucial in the textile industry. In this study, a two-step approach was used to develop an optimal HEN in a wastewater heat recovery system to maximize energy efficiency and minimize cost simultaneously in the textile industry. First, to develop an energy-efficient wastewater heat recovery system, a process model of the system comprising a heat exchanger and heat pump was developed. Here, the heat of the high- and low-temperature wastewater was recovered through a heat exchanger and heat pump, respectively. Second, to maximize the energy efficiency and minimize the cost of the heat recovery system, the HEN was retrofitted in various configurations using super-targeted pinch analysis. The most economically retrofitted wastewater heat recovery system was then determined via economic assessment, and the appropriateness of the proposed system was confirmed.
This study is the first in which an attempt has been made to integrate a heat exchanger and heat pump in a wastewater heat recovery system to efficiently recover the heat of wastewater discharged from various processes in the textile industry. The developed wastewater heat recovery system was retrofitted more efficiently and cost-effectively via pinch analysis and an economic assessment, thus enabling both economic and environmental improvements relative to conventional heat recovery systems. This study developed a wastewater heat recovery system suitable for the textile industry through pinch analysis while thoroughly considering the complex operation method of dyeing plants for the first time. By illustrating an efficiently designed wastewater heat recovery system for the textile industry based on the proposed two-step approach, this study may provide guidance for the design of wastewater heat recovery systems in the future.
2. Methodology
2.1. Process Description
Pre-treatment, dyeing, and after-treatment processes are currently used in the textile industry. First, in the pre-treatment process, bleaching, washing, and acidification are performed first to remove impurities in the fibers that may interfere with dyeing and to make them white [8]. Second, in the dyeing process, pre-treated fibers are dyed with reactive dyes (i.e., by molecular bonding). Finally, in the after-treatment process, cold rinsing, washing, hot rinsing, and finishing are performed to remove the reactive dyes and residues from the fabric. Table 1 lists the operating time and the temperature and flow rate of the discharged wastewater in each process [9]. For additional improvements in dyeing quality, freshwater is heated to 60 °C beforehand, and the temperature is steadily increased to 96 °C during the dyeing process [10]. Subsequently, the wastewater discharged during each stage is cooled to 40 °C for biological treatment.

Table 1.
Operating time and temperature and flow rate of discharged wastewater in each stage of the dyeing process.
2.2. Process Model Development
2.2.1. Thermodynamic Model and Underlying Assumptions
The thermodynamics of the developed process model were described using the Peng–Robinson equation of state [11], which can be used to perform multi-component liquid–vapor-phase equilibrium calculations and to calculate the thermodynamic properties of a working fluid. Because various substances are mixed in wastewater, it is suitable to use the Peng–Robinson equation to develop a wastewater heat recovery system for the textile industry. This equation is given as follows:
where P is the pressure (Pa), R is the gas constant (8.314 J/mol·K), T is the absolute temperature (K), V is the molar volume (m3/mol), a and b are fluid-specific constant that depends on temperature and a fluid-specific constant, the subscripts c and re denote the critical point and reduced by critical point, respectively, and ω indicates the acentric factor for the component of interest. The following assumptions were made for modeling of the wastewater heat recovery system; the related literature was referenced for missing data [12,13].
- Multiple textile plants were alternated to operate the heat recovery system in a steady state;
- A heat pump compressor was used to isentropically compress the refrigerant;
- Declines in the efficiency of heat recovery due to substances present in the wastewater were neglected.
2.2.2. Process Modeling
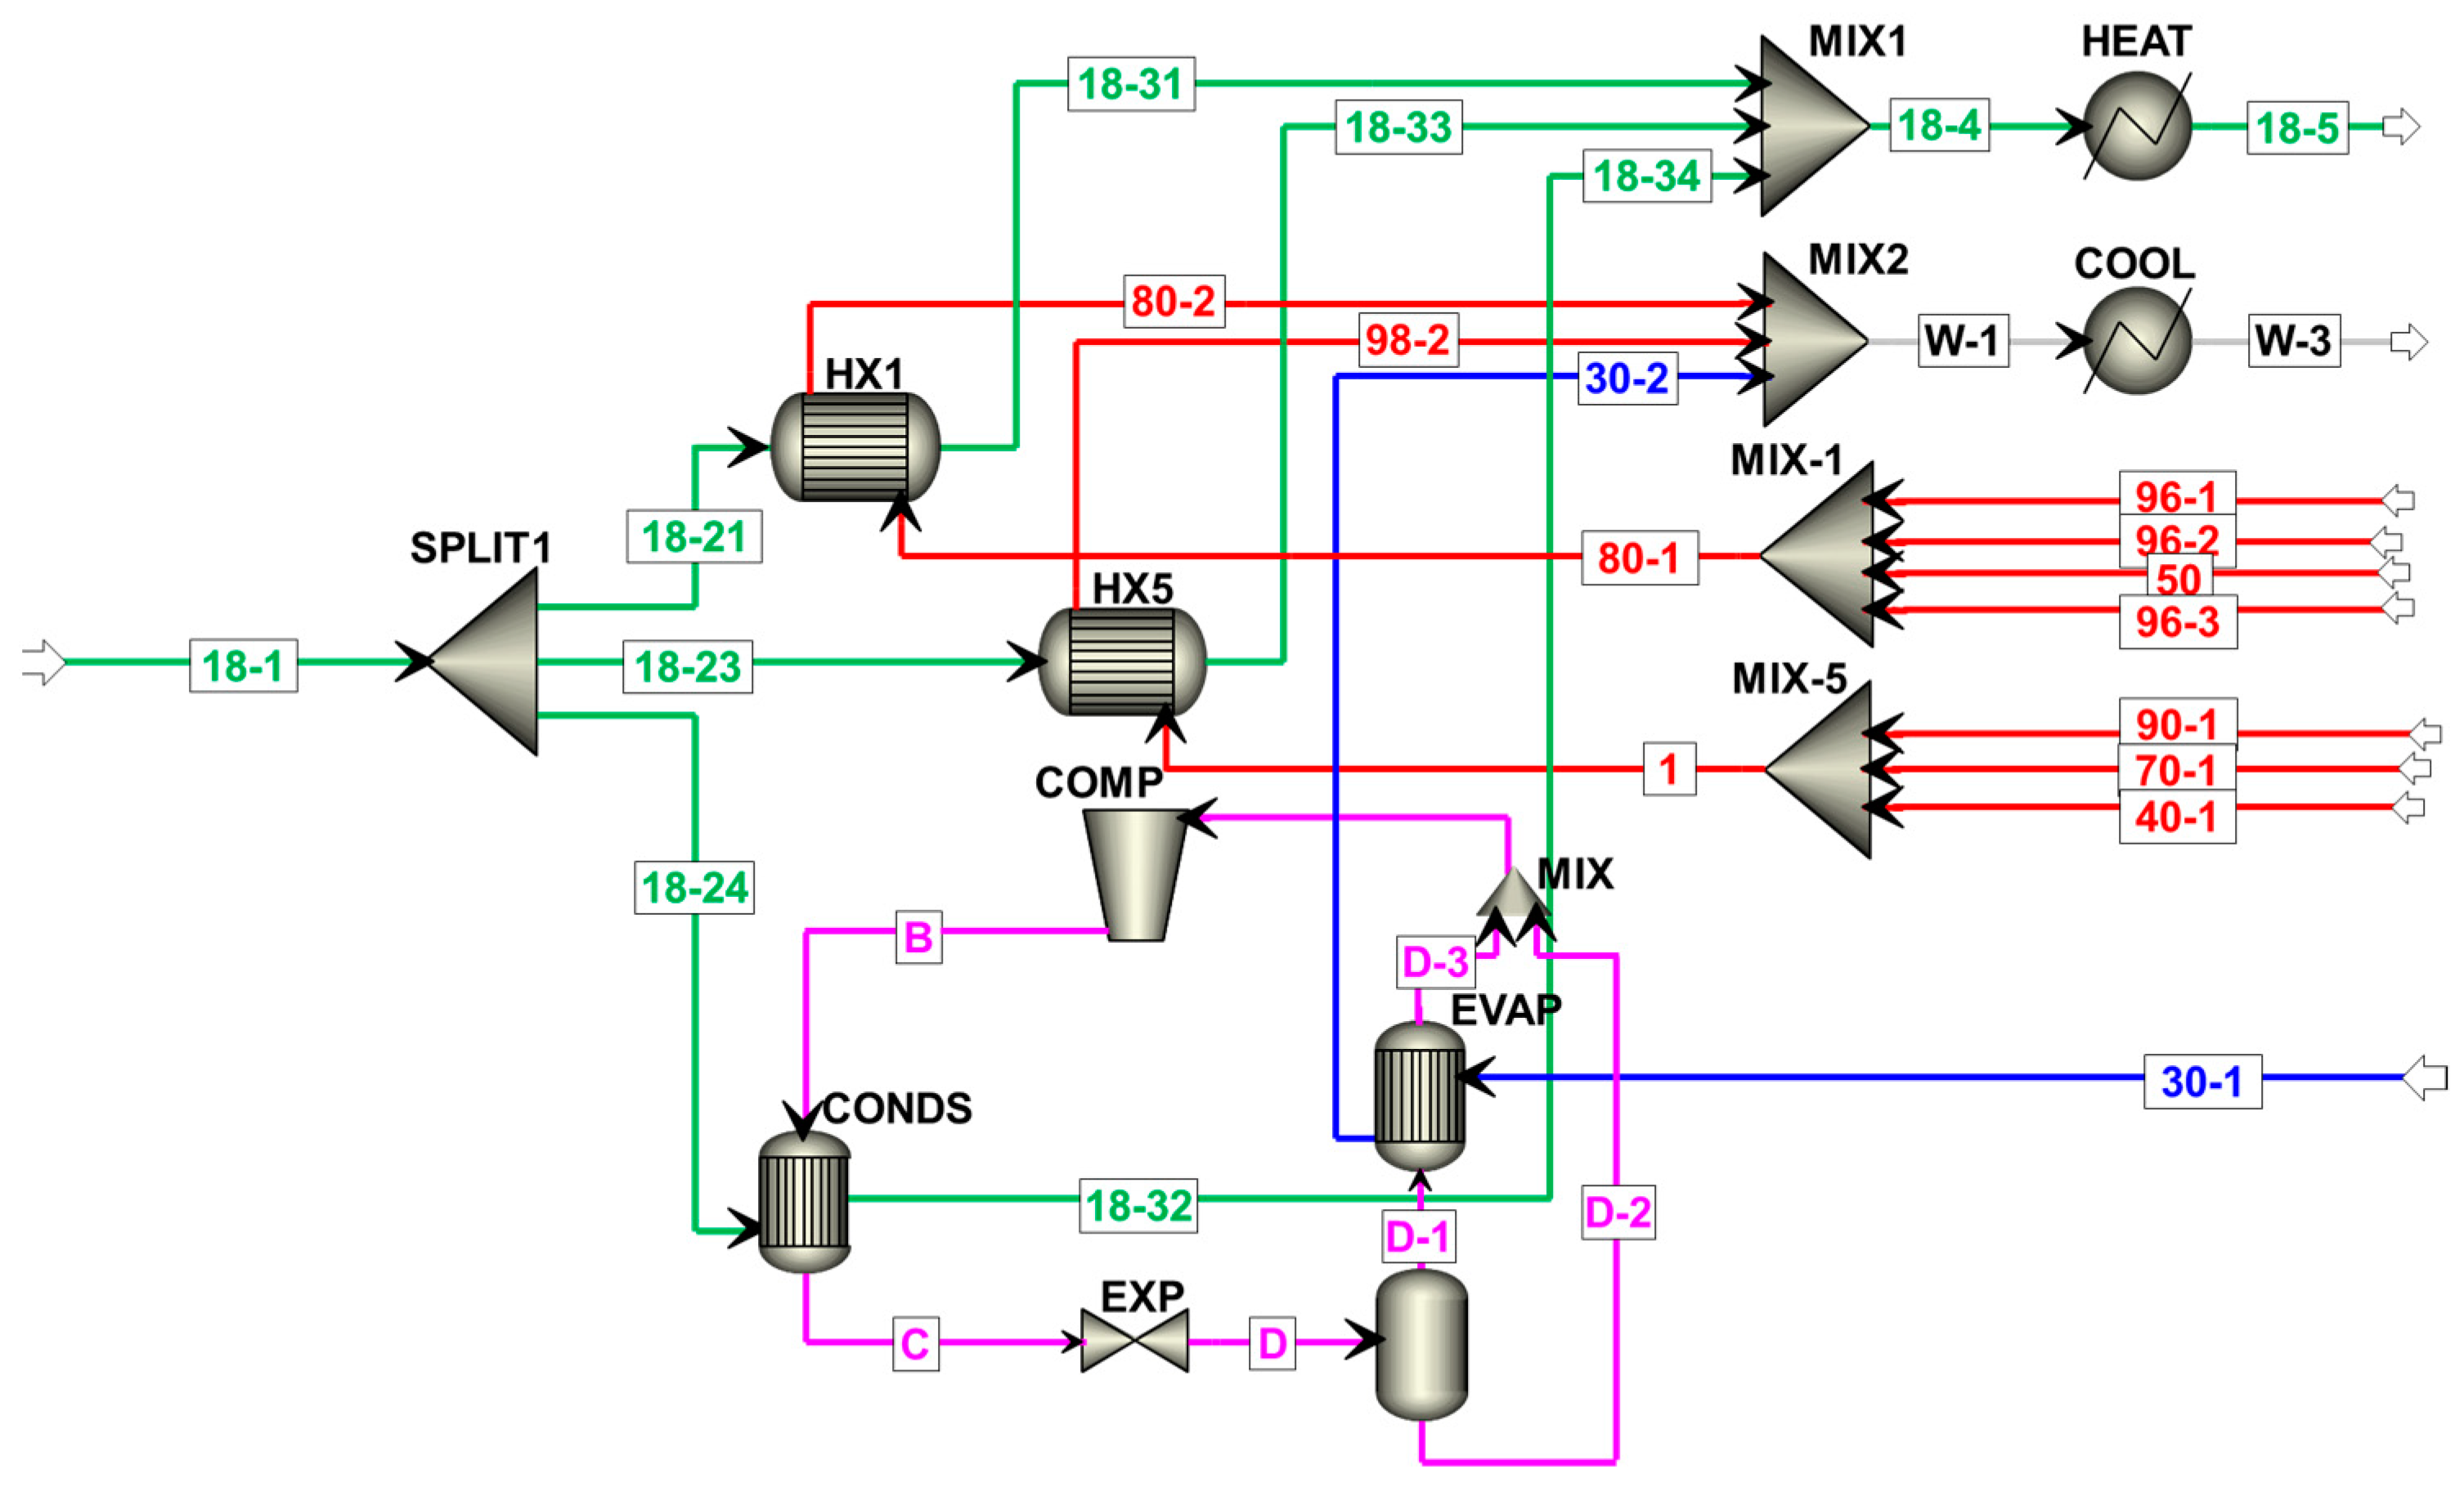
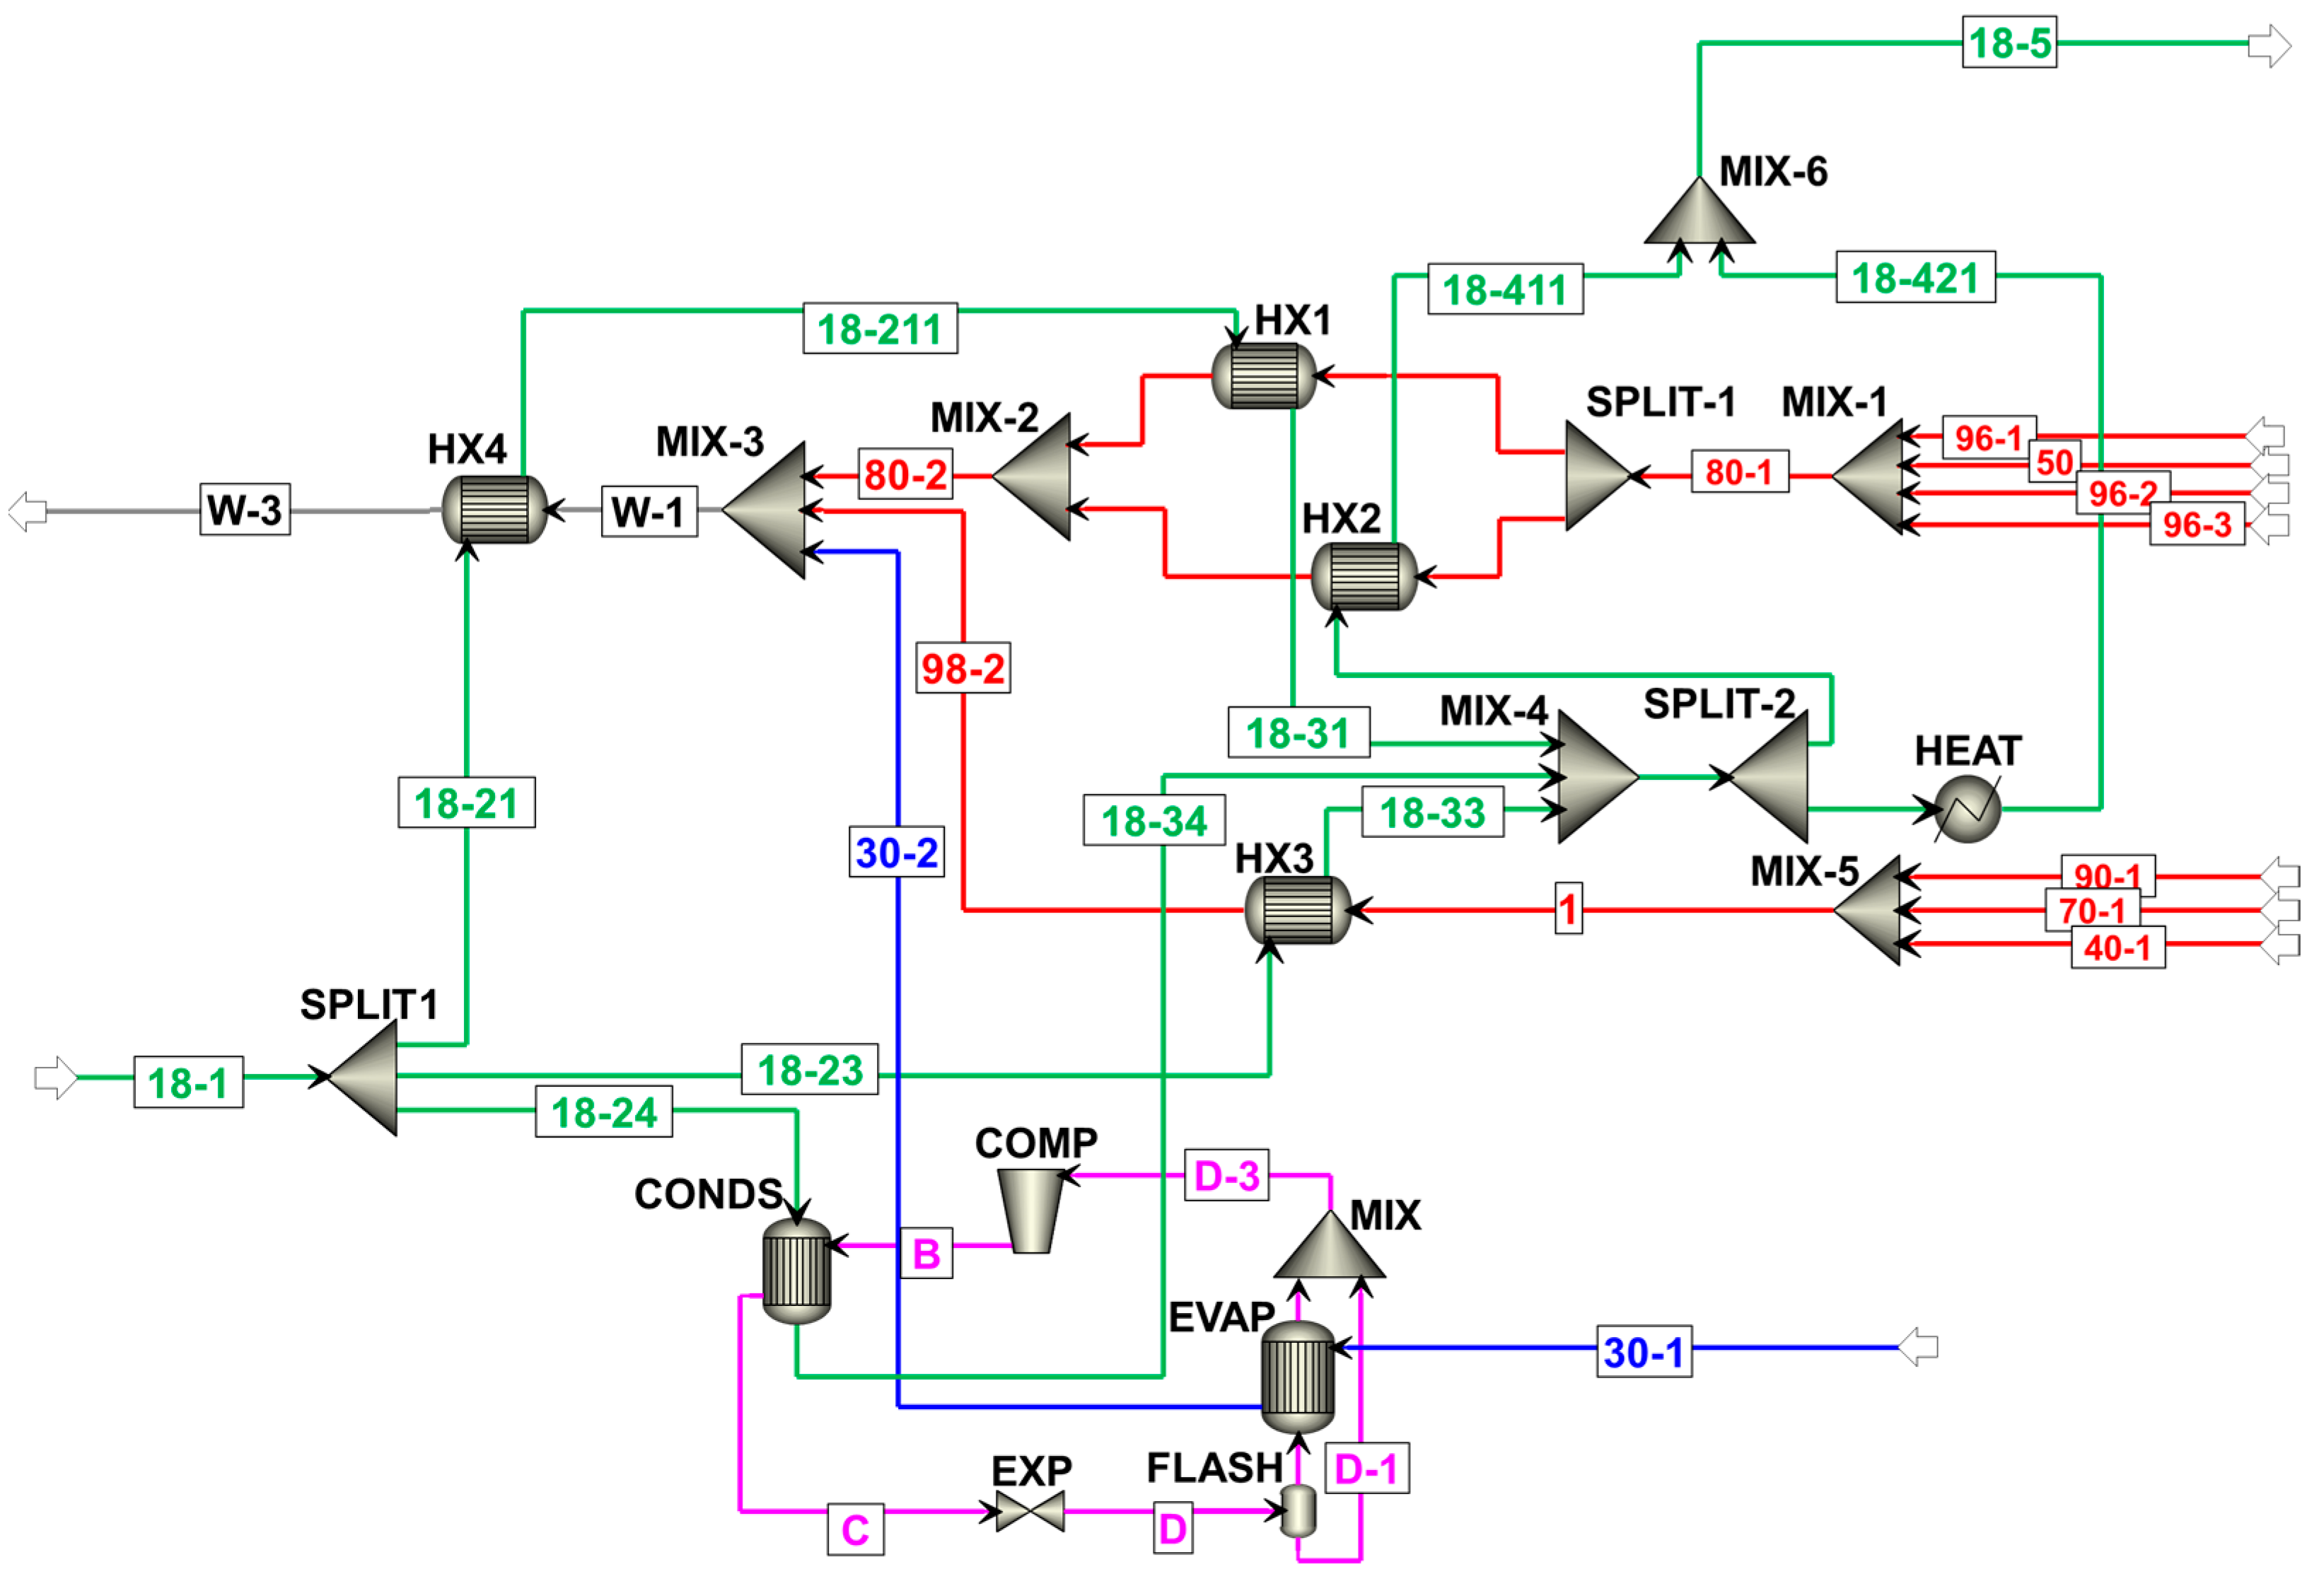
In this study, the Aspen Plus Process Simulator v. 11.0 (Aspen Technology, Inc., Bedford, MA, USA) was used for process simulation. Figure 1 shows the process model of the wastewater heat recovery system. To recover heat efficiently, a heat pump was used when the wastewater temperature was <30 °C; otherwise, a heat exchanger was used [14]. Here, for focusing on presenting a wastewater heat recovery system of a new configuration that integrates a heat exchanger and a heat pump for efficient heat recovery, the heat pump with the most straightforward configuration was presented in this system, and R134a was used as a refrigerant in the heat pump. Furthermore, the wastewater discharged from a previous shift was collected in real-time to preheat the freshwater for the following shift. Thus, only the wastewater heat from the cold rinsing process was recovered through a heat pump, while that discharged from bleaching, dyeing, washing, and finishing was collected in a tank, and the heat was recovered through a heat exchanger. The heat recovery system developed in this study was then used to heat freshwater before the dyeing process. Table 2 and Table 3 show the specifications of the model of the components used.

Figure 1.
Schematic of the process model for the wastewater heat recovery system. Abbreviations: COMP, compressor; CONDS, condenser; EVAP, evaporator; EXP, expansion valve; HX, heat exchanger; HEAT, (heater); COOL, (cooler); MIX, mixer; SPLIT, splitter.
Table 2.
Specifications of the heat exchanger, cooler, heater, and splitter.
Table 3.
Specifications of the heat pump.
The first feed freshwater, represented by the green line in Figure 1, went through a splitter, and each split parcel of freshwater went through a heat exchanger and heat pump. The second feed—high-temperature wastewater (red line)—was collected in a tank. Here, from bleaching to dyeing processes and from washing to finishing processes, wastewater was collected in another tank. The collected wastewater then passed through a heat exchanger. The last feed—low-temperature wastewater (blue line)—passed through a heat pump. After the split freshwater was preheated by the heat exchanger and heat pump, it was collected in a tank and heated to the target temperature. Meanwhile, the high- and low-temperature wastewater cooled by the heat exchanger and heat pump was collected in a tank and cooled to the target temperature.
2.3. Improving the HEN via Pinch Analysis
To maximize the efficiency and minimize the cost of the wastewater heat recovery system, the HEN was retrofitted using super-targeted pinch analysis, which systematically modified the configuration of the recovery process. In pinch analysis, the amount of heat exchanged between streams is first determined to improve the efficiency of the heat recovery process. Here, the higher the energy recovery from the heat exchange between the streams, the lower were the operating costs due to the lower energy consumption. However, improving heat recovery also increases capital costs by increasing the area over which heat is exchanged; thus, there is a trade-off between capital and operating costs. Therefore, in this study’s pinch analysis, a super-targeting method that derived a cost-optimal heat recovery process was used to retrofit the HEN.
In this study, the retrofit target of a cost-optimized wastewater heat recovery system was first derived via super-targeted pinch analysis, and the system was retrofitted according to the targets by re-sequencing and re-piping existing heat exchangers, installing a new heat exchanger, and adding a stream split. To derive the retrofit target, the total annualized cost (TAC) with capital and operating costs was calculated using composite curves, a graphical representation based on the amount of heat exchanged between streams and the temperature change of streams. Figure 2 shows the hot and cold composite curves of the HEN in the wastewater heat recovery system. First, in the section where the hot composite curve and the cold composite curve do not overlap, external energy utility is required in HEN because heat exchange does not occur between hot and cold streams. Second, in the section where the composite curves overlap, heat exchange occurs between streams, and the heat exchange areas are required in HEN. By the composite curves analysis results, the capital, operating costs, and TAC targets of HEN are acquired.
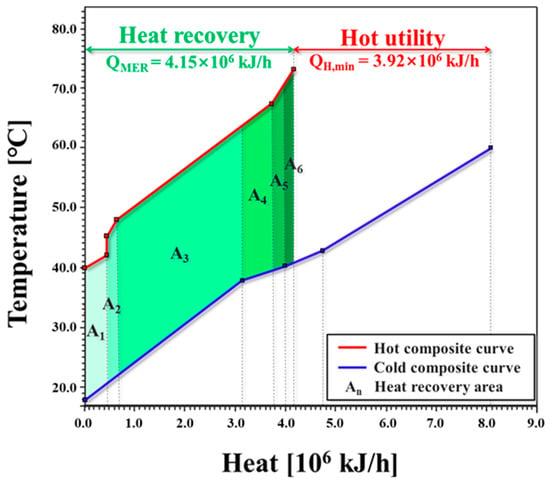
Figure 2.
Hot and cold composite curves of the HEN in the wastewater heat recovery system.
The equations for calculating the TAC, capital, and operating cost targets are shown in (6)–(13) [15,16,17,18,19]:
where (USD/y) represents the TAC target of the HEN, (USD) and (USD/y) represent the capital and operating cost targets of the HEN, and , (%), and (y) represent the annualization factor, rate of return, and plant life, respectively.
This study assumed an of 10% and a of five years, such that the could be written as follows:
where and (m2) represent the target of heat exchanger units target and the total heat exchange area, respectively. Parameters , , and are the cost constants that vary according to the materials of construction, pressure rating, and type of exchanger. Specifically, represents the installation cost, and and represent the duty/area-related cost coefficients of the heat exchanger. For the heat recovery system in this study, , , and were 10,000, 800, and 0.6, respectively [9]. The target of the heat exchanger units, , was calculated as follows:
where and represent the number of process and utility streams above/below the pinch, respectively. The target of the total heat exchange area, , was calculated as follows:
where (m2), (kJ/h), (°C), and (kJ/h∙m2 °C) represent the target area, amount of exchanged heat, logarithmic mean temperature difference, and heat transfer coefficient of the stream transferred at each interval, respectively; h and c denote the hot and cold streams. The operating cost of the HEN, , was determined from Equation (13):
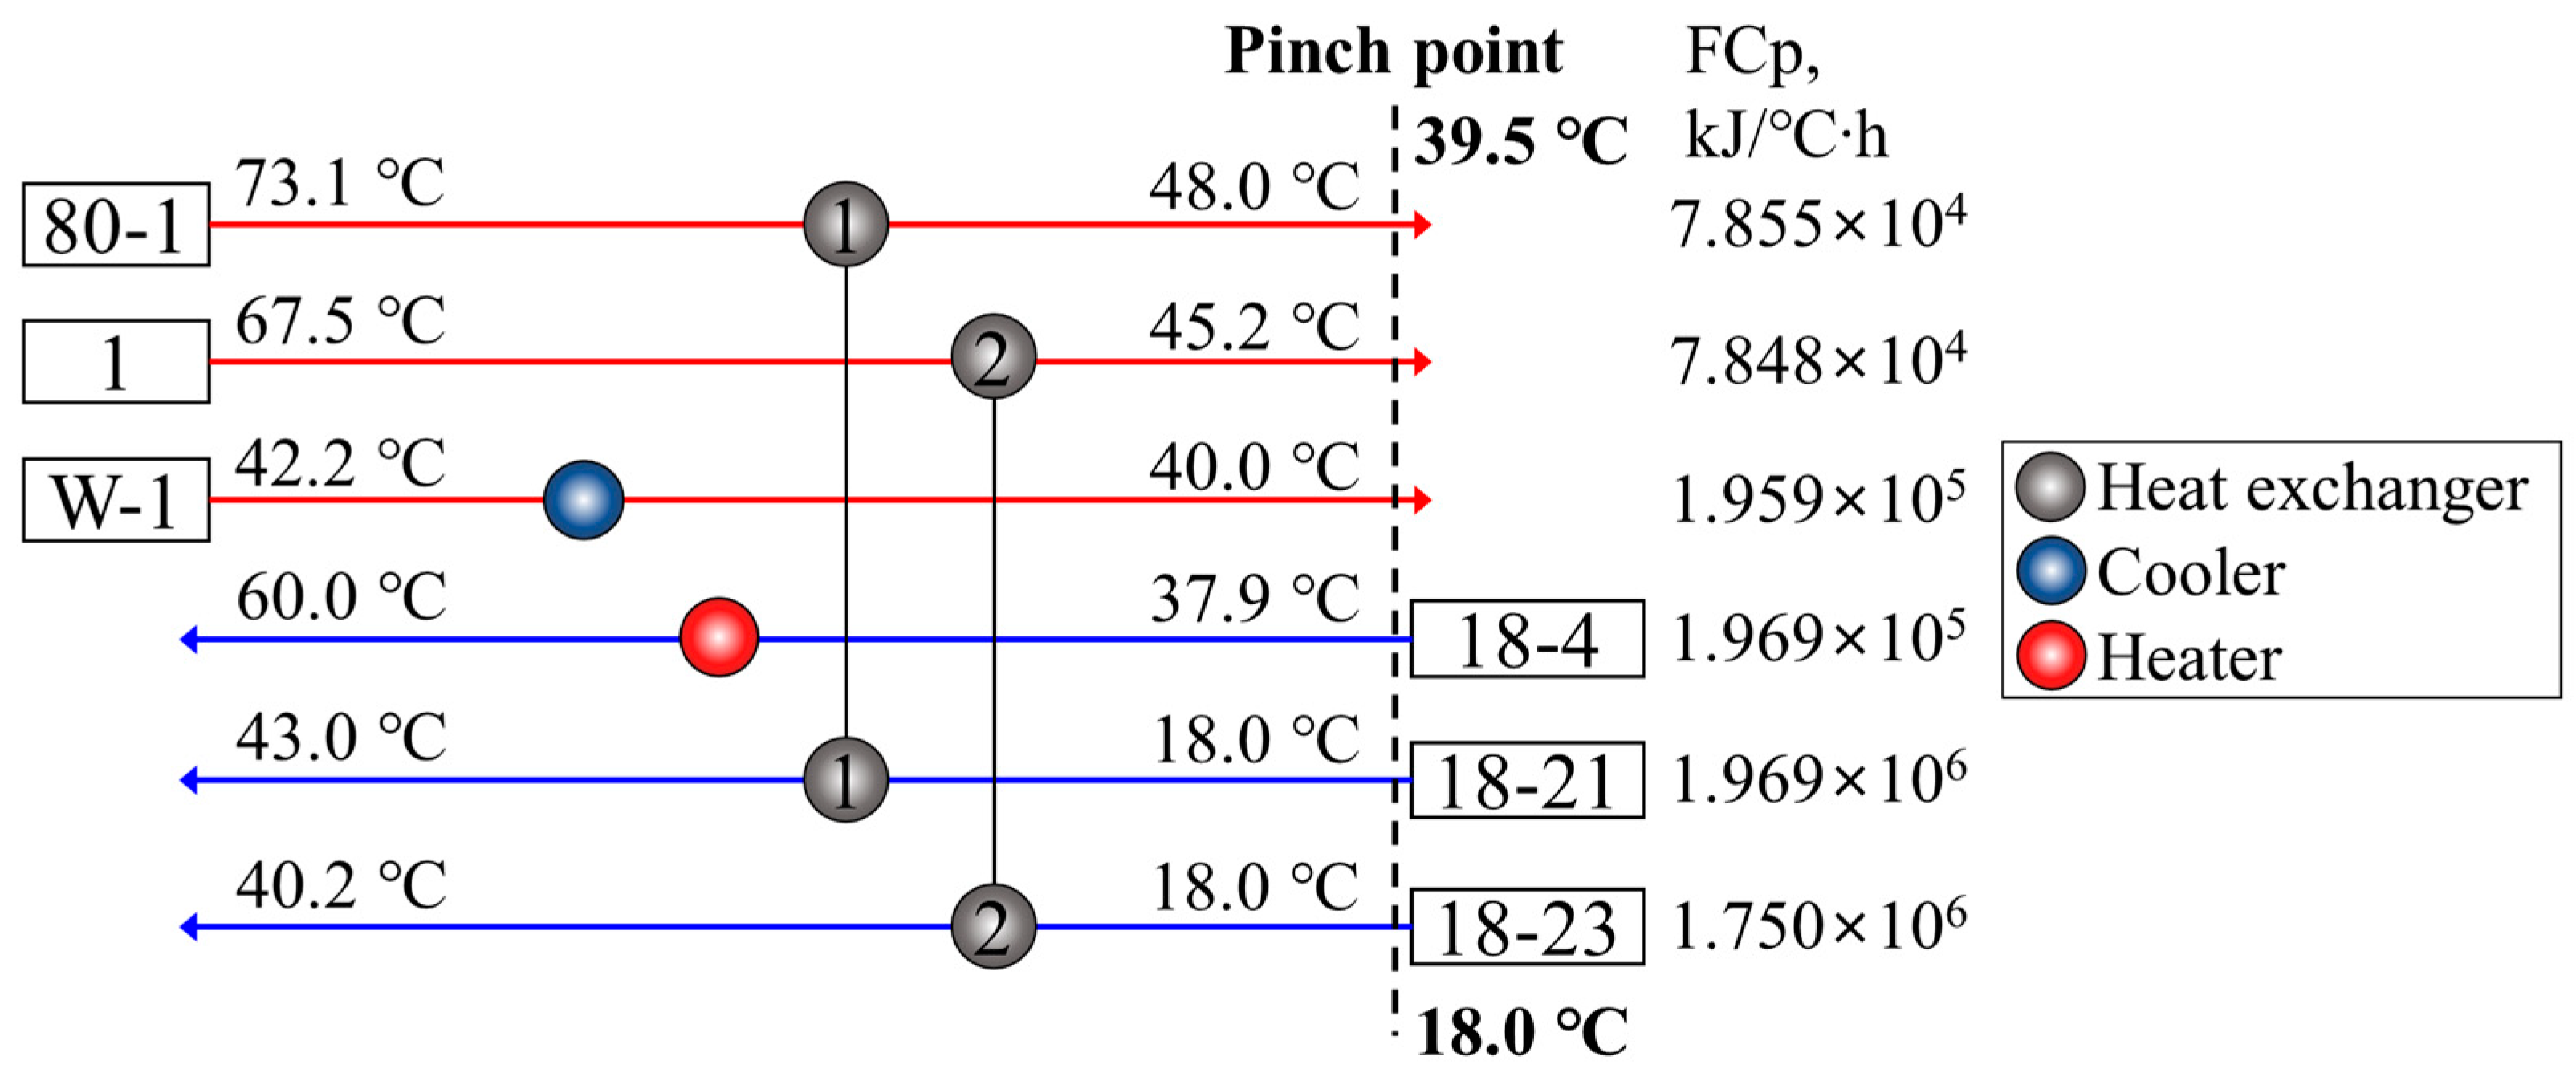
where and (USD/kJ) represent the utility costs for hot and cold utilities, and (kJ/h) and (kJ/h) represent the energy targets for the hot and cold utilities, respectively. Figure 3 shows the grid diagram of the HEN in the wastewater heat recovery system before retrofitting was completed with an Aspen Energy Analyzer (Aspen Technology, Inc., Bedford, MA, USA).

Figure 3.
Grid diagram of HEN in the wastewater heat recovery system before retrofitting.
2.4. Economic Assessment
An economic assessment was conducted to determine the most economically retrofitted wastewater heat recovery system and to confirm the feasibility of the proposed system. The TAC of the system was calculated by considering both the capital and operating costs [20]:
2.4.1. Capital Costs
The total capital cost (CC) of the proposed wastewater system consisted of the capital costs of the HEN and heat pump and was calculated using Equations (15) and (16):
where (USD) represents the capital cost of the heat pump. Because the heat pump of the proposed system was composed of a compressor (comp), evaporator (evap), condenser (conds), expansion valve (exp), and flash drum (fd), the capital cost of the heat pump was calculated by adding the capital costs of these components. The capital cost of the compressor was calculated as [21]:
where (USD) is the base capital cost, represents the cost index, refers to the output power density, and = USD 1.8 × 10³ and = 0.77 for the compressor. The capital costs of the evaporator and condenser in the heat pump were calculated using as follows [15,17]:
where (USD) denotes the capital cost of the heat exchanger. Because the evaporator and condenser are types of heat exchangers, their capital costs were calculated using the equation for the heat exchanger. Parameters , and are the cost constants that vary according to the materials of construction, pressure rating, and type of exchanger. The variables , , and of the evaporator and condenser are the same as those of the HEN heat exchanger. Here, this study assumed that = 0 and = USD 11,000 [22,23].
2.4.2. Operating Costs
The total operating cost (OC) of the proposed wastewater heat recovery system consisted of the HEN and heat pump capital costs and was calculated using Equations (20)–(22):
where (USD/y) represents the operating cost of the heat pump. As the compressor was the only piece of equipment that used the operating cost of the heat pump, was calculated using the compressor equation, wherein (USD/kJ) and (kW) represent the cost of electricity and the power required for the compressor, respectively. Data from the Aspen Process Economic Analyzer (Aspen Technology, Inc., Bedford, MA, USA) were referenced to determine the value of .
3. Results and Discussion
This section describes the results of retrofitting the HEN in the developed heat pump assisted-wastewater heat recovery system by pinch analysis. When retrofitting the HEN in the developed system, the coefficient of performance (COP) of the heat pump in the system was unchanged. Herein, the COP of the heat pump was 2.8 because 91,712 kJ/s of heat was exchanged in the condenser, and 35,750 kW of power was used in the compressor. Then, this section describes economic evaluation to derive the most economically retrofitted HEN and confirm the appropriateness of the proposed system. Finally, it describes sensitivity analysis results to verify the stability of the cost-optimal system.
3.1. Improvements to the HEN from Pinch Analysis
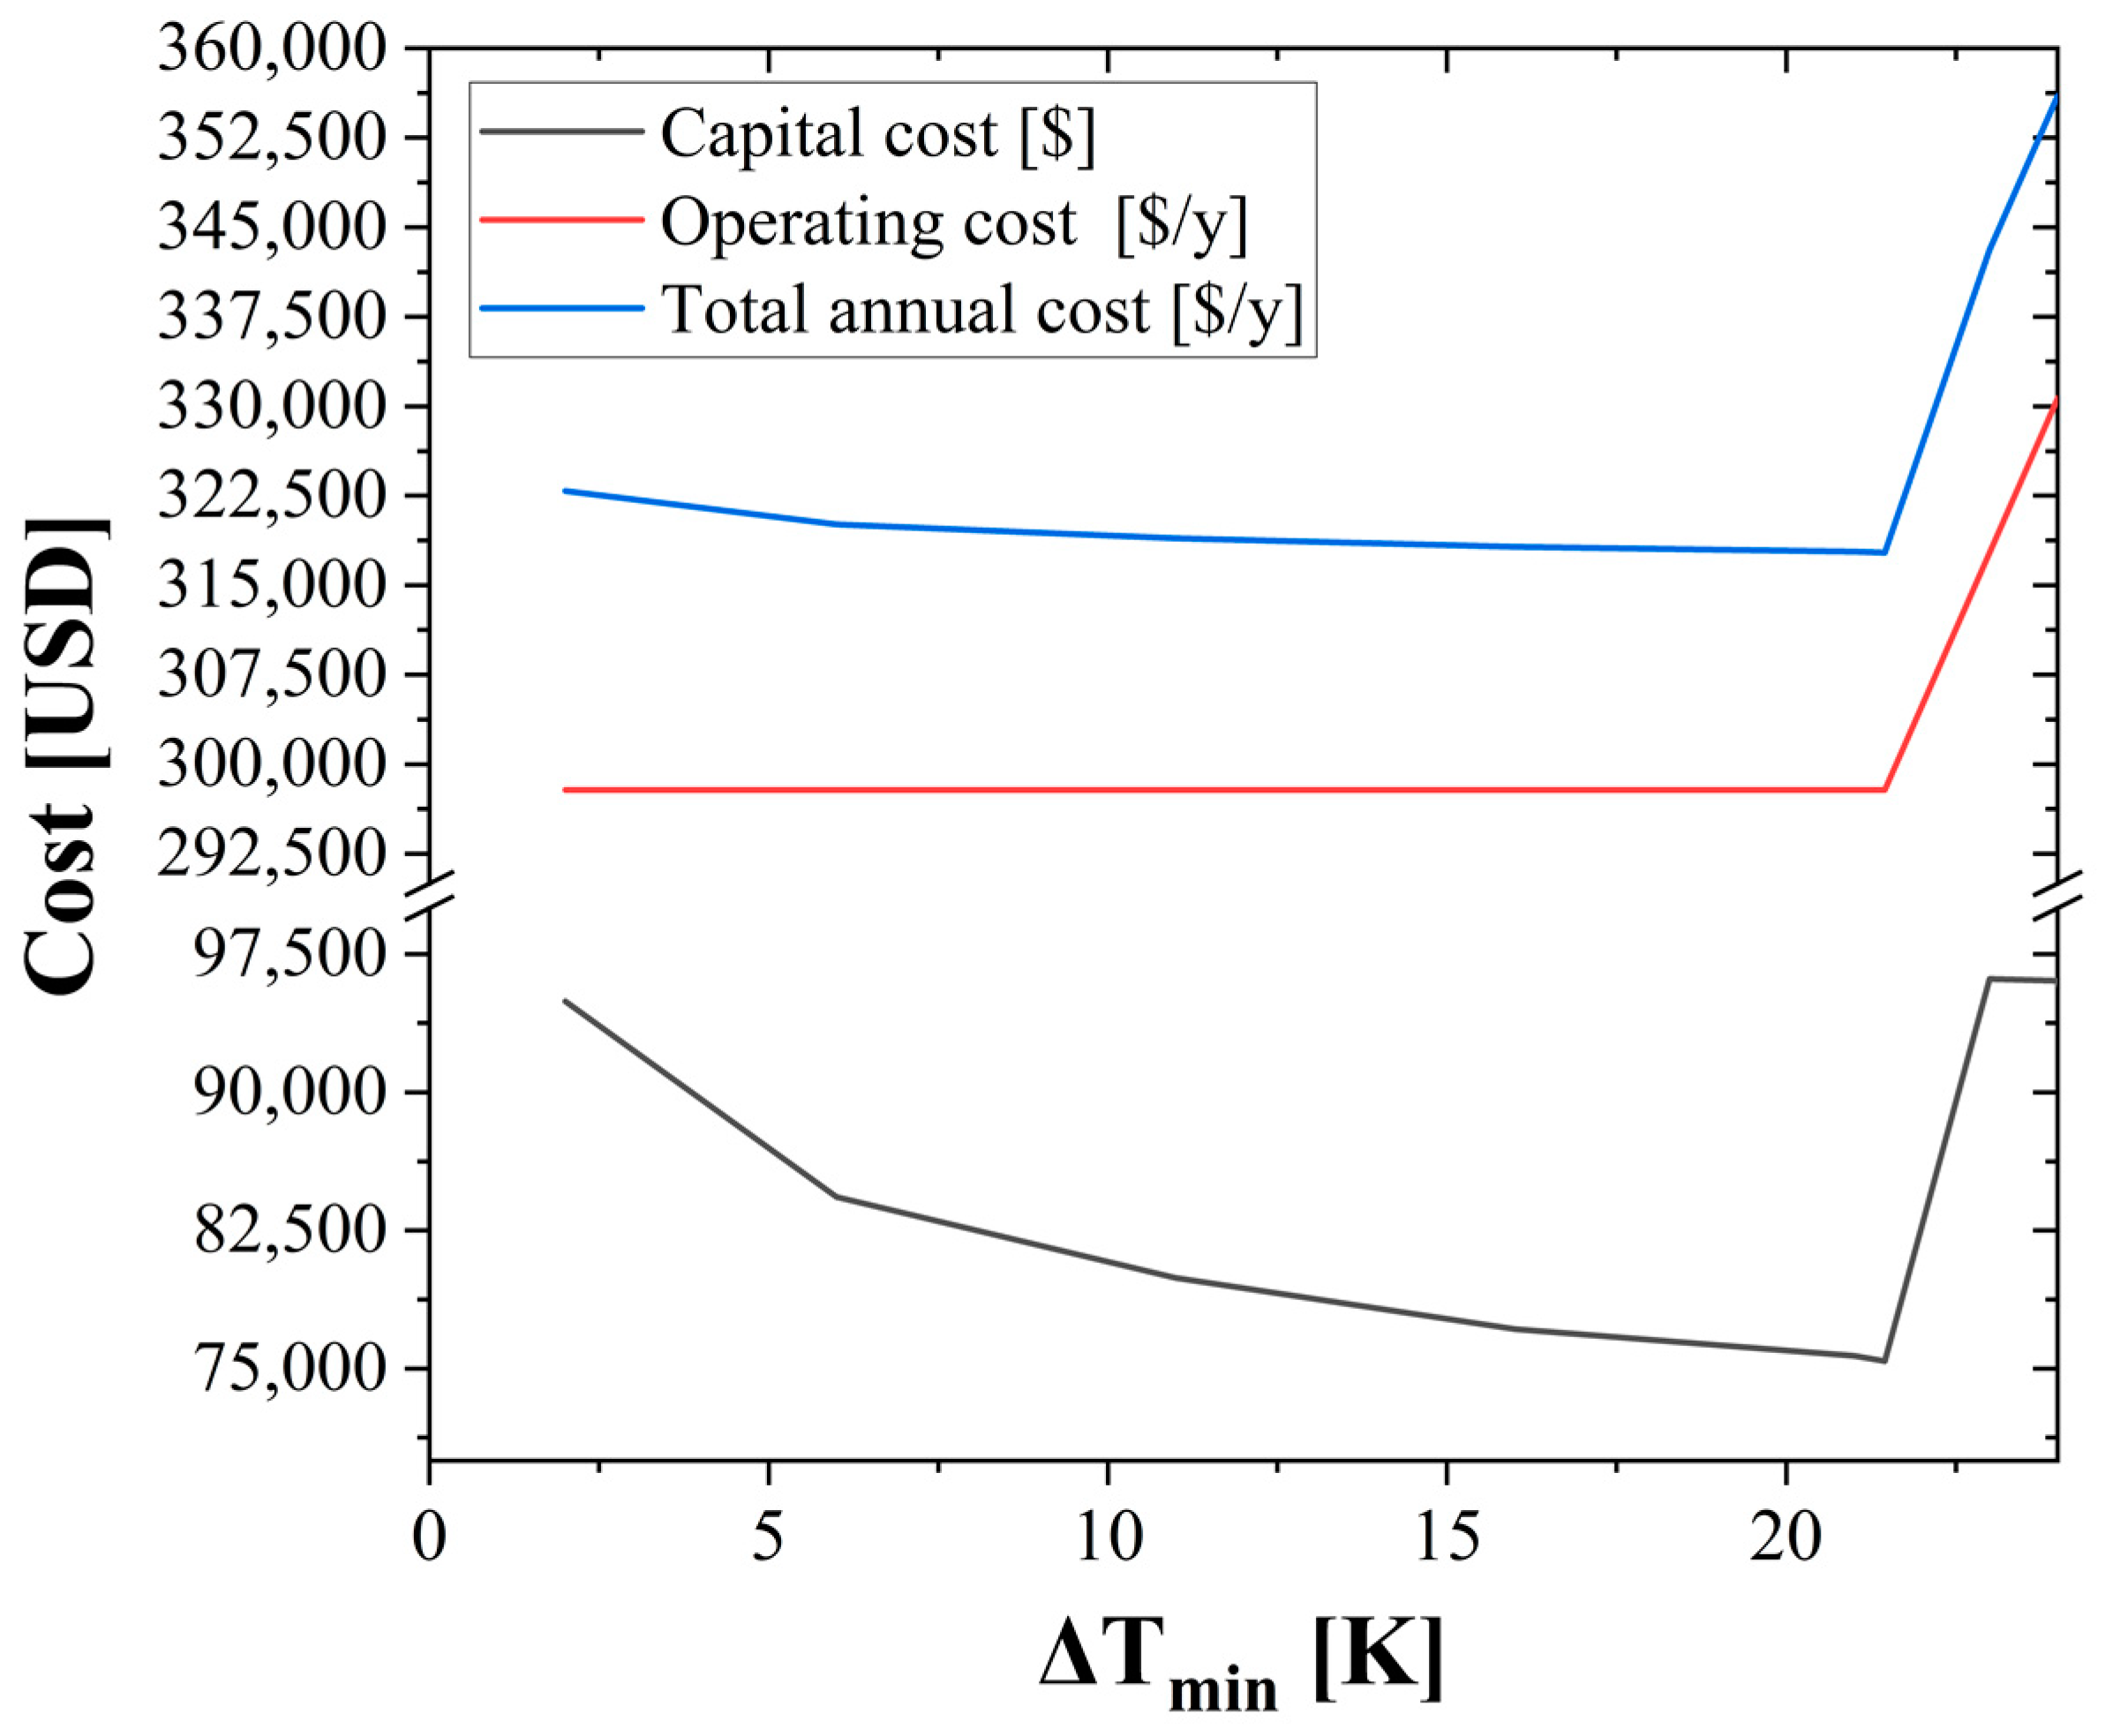
Figure 4 shows the cost targets of HEN in the wastewater heat recovery system according to the minimum allowed temperature difference (∆Tmin). The capital cost target increased when ∆Tmin decreased below 21.46 K because of an increase in the heat exchange area. However, when ∆Tmin increased above 21.46 K, this cost target increased due to the necessity for an additional heater and cooler. Meanwhile, the operating cost target did not change when ∆Tmin was less than 21.46 K because no additional hot and cold utilities were required owing to the sufficient heat exchange between the streams. When ∆Tmin increased above 21.46 K, the operating cost target increased because new hot and cold utilities were simultaneously required. The TAC targets of the system were lowest when ∆Tmin = 21.46 K. To maximize the efficiency of the wastewater heat recovery system, while also ensuring some measure of economic improvement, it was retrofitted using the targets derived via pinch analysis.
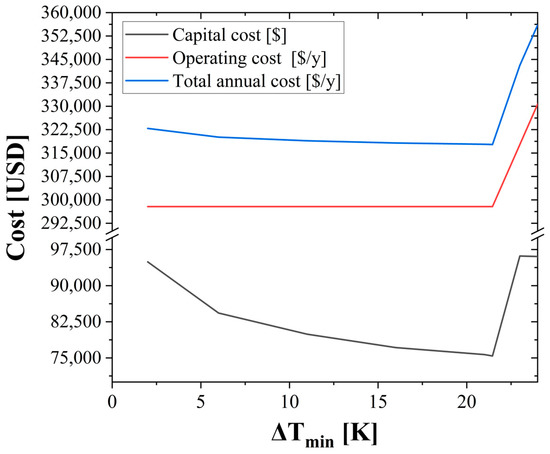
Figure 4.
Cost targets of the HEN in the wastewater heat recovery system relative to the change in minimum allowed temperature difference (∆Tmin).
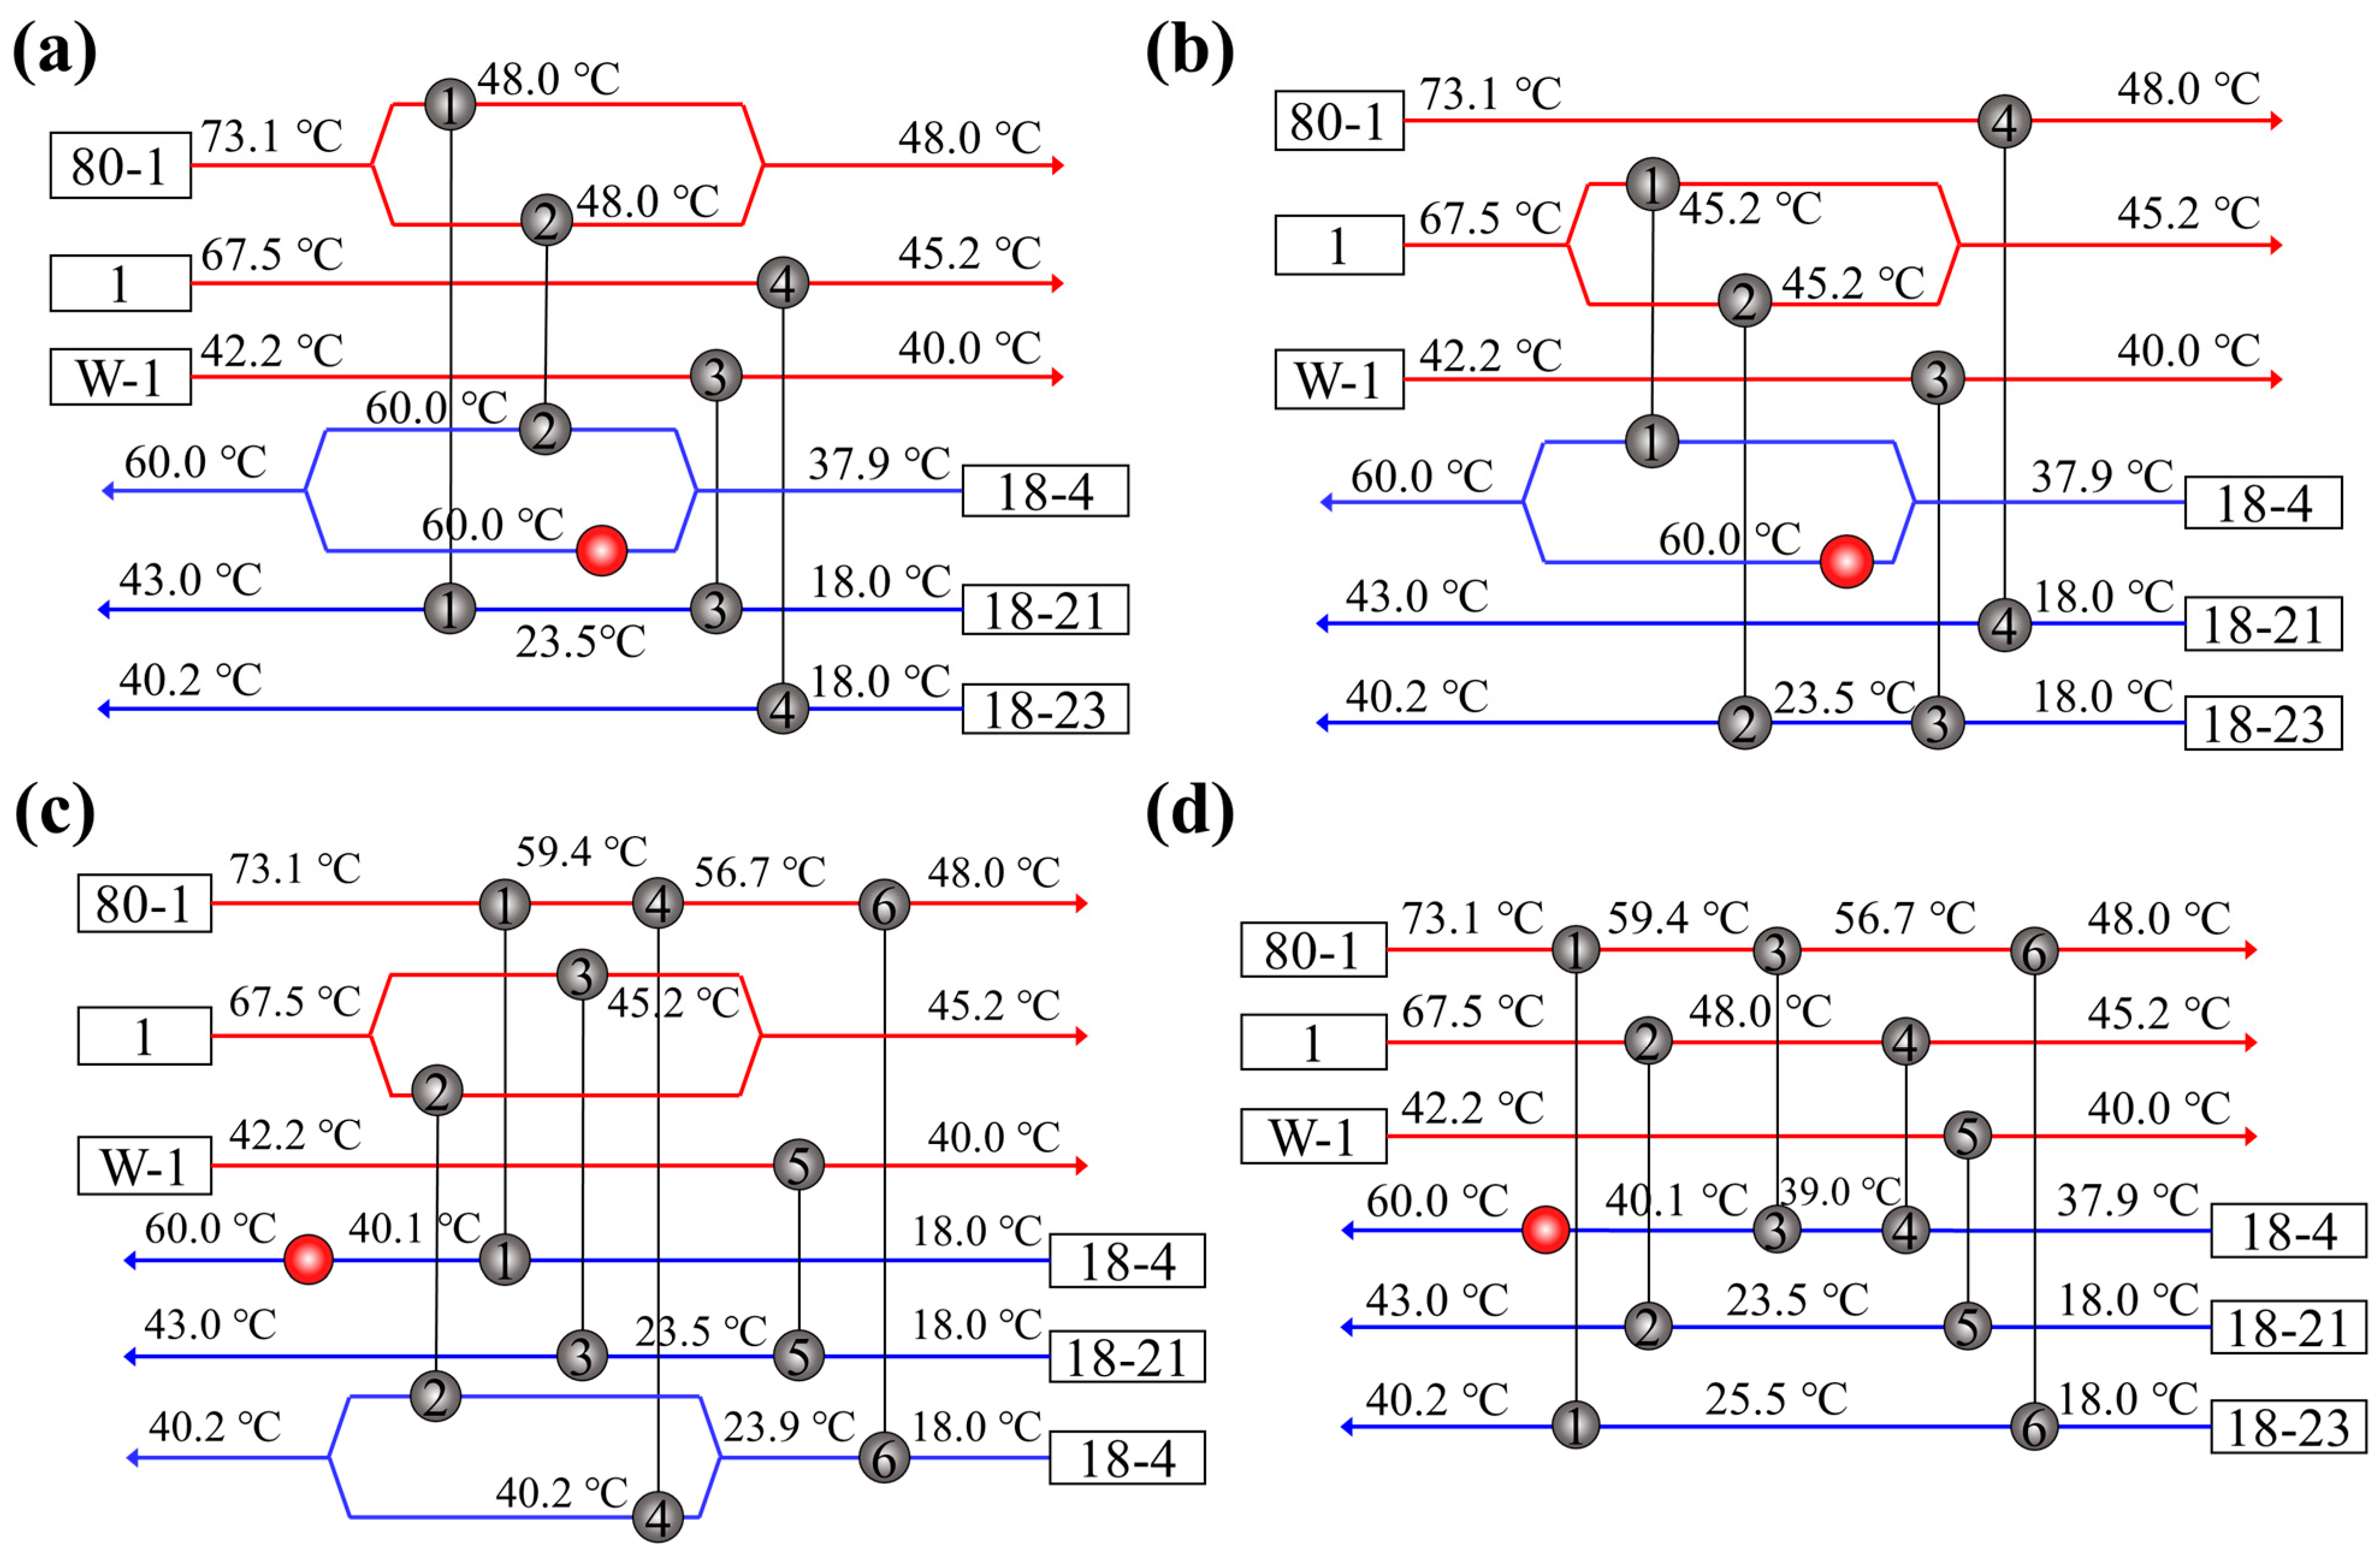
The HEN in the wastewater heat recovery system was retrofitted using an Aspen Energy Analyzer, which efficiently modified the configuration based on a systematic algorithm. When retrofitting the HEN, because the degree of freedom will be increased by several manipulated variables, including unknowns, such as temperature, duties, and area, the HEN can be retrofitted into various configurations. Figure 5 shows grid diagrams of the retrofitted HEN in the developed wastewater heat recovery systems and Table 4 lists the HEN retrofitting results.
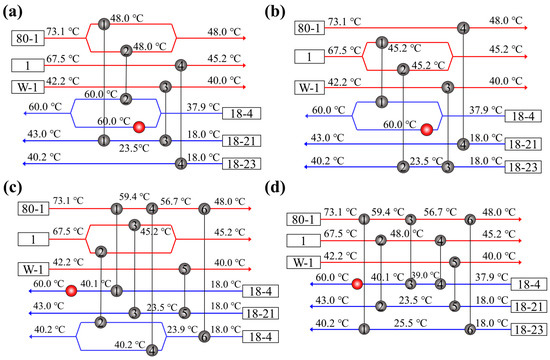
Figure 5.
Grid diagrams of the retrofitted HEN in the wastewater heat recovery systems: (a) design a; (b) design b; (c) design c; (d) design d.
Table 4.
Results of HEN retrofitting.
In Figure 5, ‘80-1’ indicates the collected wastewater from 1–4 stages of the textile industry, ‘1’ indicates the collected wastewater from 6–8 stages of the textile industry, and ‘W-1’ indicates the collected heat exchanged wastewaters through the heat exchanger and heat pump’. ‘18-4’, ‘18-21’, and ‘18-4’ indicate the split freshwater. The temperature changes of streams by heat exchange are shown in the front and backward of the heat exchanger.
3.2. Economy of the Proposed Wastewater Heat Recovery System
To calculate the TAC of the proposed wastewater heat recovery systems, the capital and operating costs of the HEN and heat pump were needed. The same heat pump specifications were equally applied to all of the systems; therefore, and were identical. The total capital cost (USD 163,311) was composed of the combined costs of the system components: = USD 129,309, = USD 10,332, = USD 12,670, = $0, and = USD 11,000. Additionally, , which is identical to , was constant at USD 22,431/y because the power required for the compressor () in all scenarios was 32.75 kW.
The TAC, considering the costs of the heat pump and HEN in the proposed wastewater heat recovery systems, is shown in Table 5. The lowest TAC in a retrofitted system derived by pinch analysis was USD 381,302, and this system was able to reduce the TAC by 43.07% relative to conventional textile dyeing processes lacking a wastewater heat recovery system. Based on the results of economic assessment, the significant economic improvement was confirmed by applying the wastewater heat recovery system developed via a two-step approach in this study. Figure 6 shows the flow diagram of the final wastewater heat recovery system, and Table 6 and Table 7 list its specifications.
Table 5.
Capital and operating costs and TAC of the retrofitted wastewater heat recovery systems.
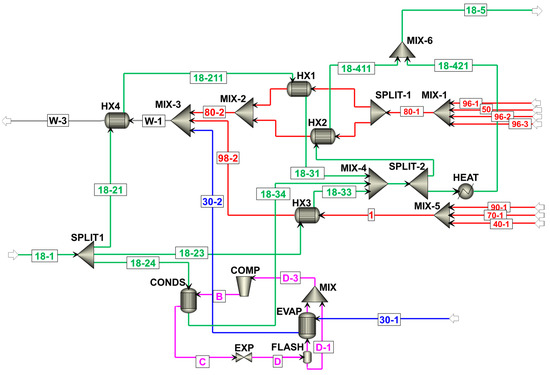
Figure 6.
Flow diagram of the final wastewater heat recovery system.
Table 6.
Specifications of the heat exchanger in the final wastewater heat recovery system.
Table 7.
Specifications of the splitter in the final wastewater heat recovery system.
3.3. Sensitivity Analysis
In general, to verify the stability of the results derived from the study, sensitivity analysis on the variables affecting the results is essential [24]. Therefore, the sensitivity analysis was conducted to confirm the stability that the optimal HEN in heat pump-assisted textile industry wastewater heat recovery system had the lowest TAC. In this section, the effect of , , and , which is the main parameter of TAC, was confirmed.
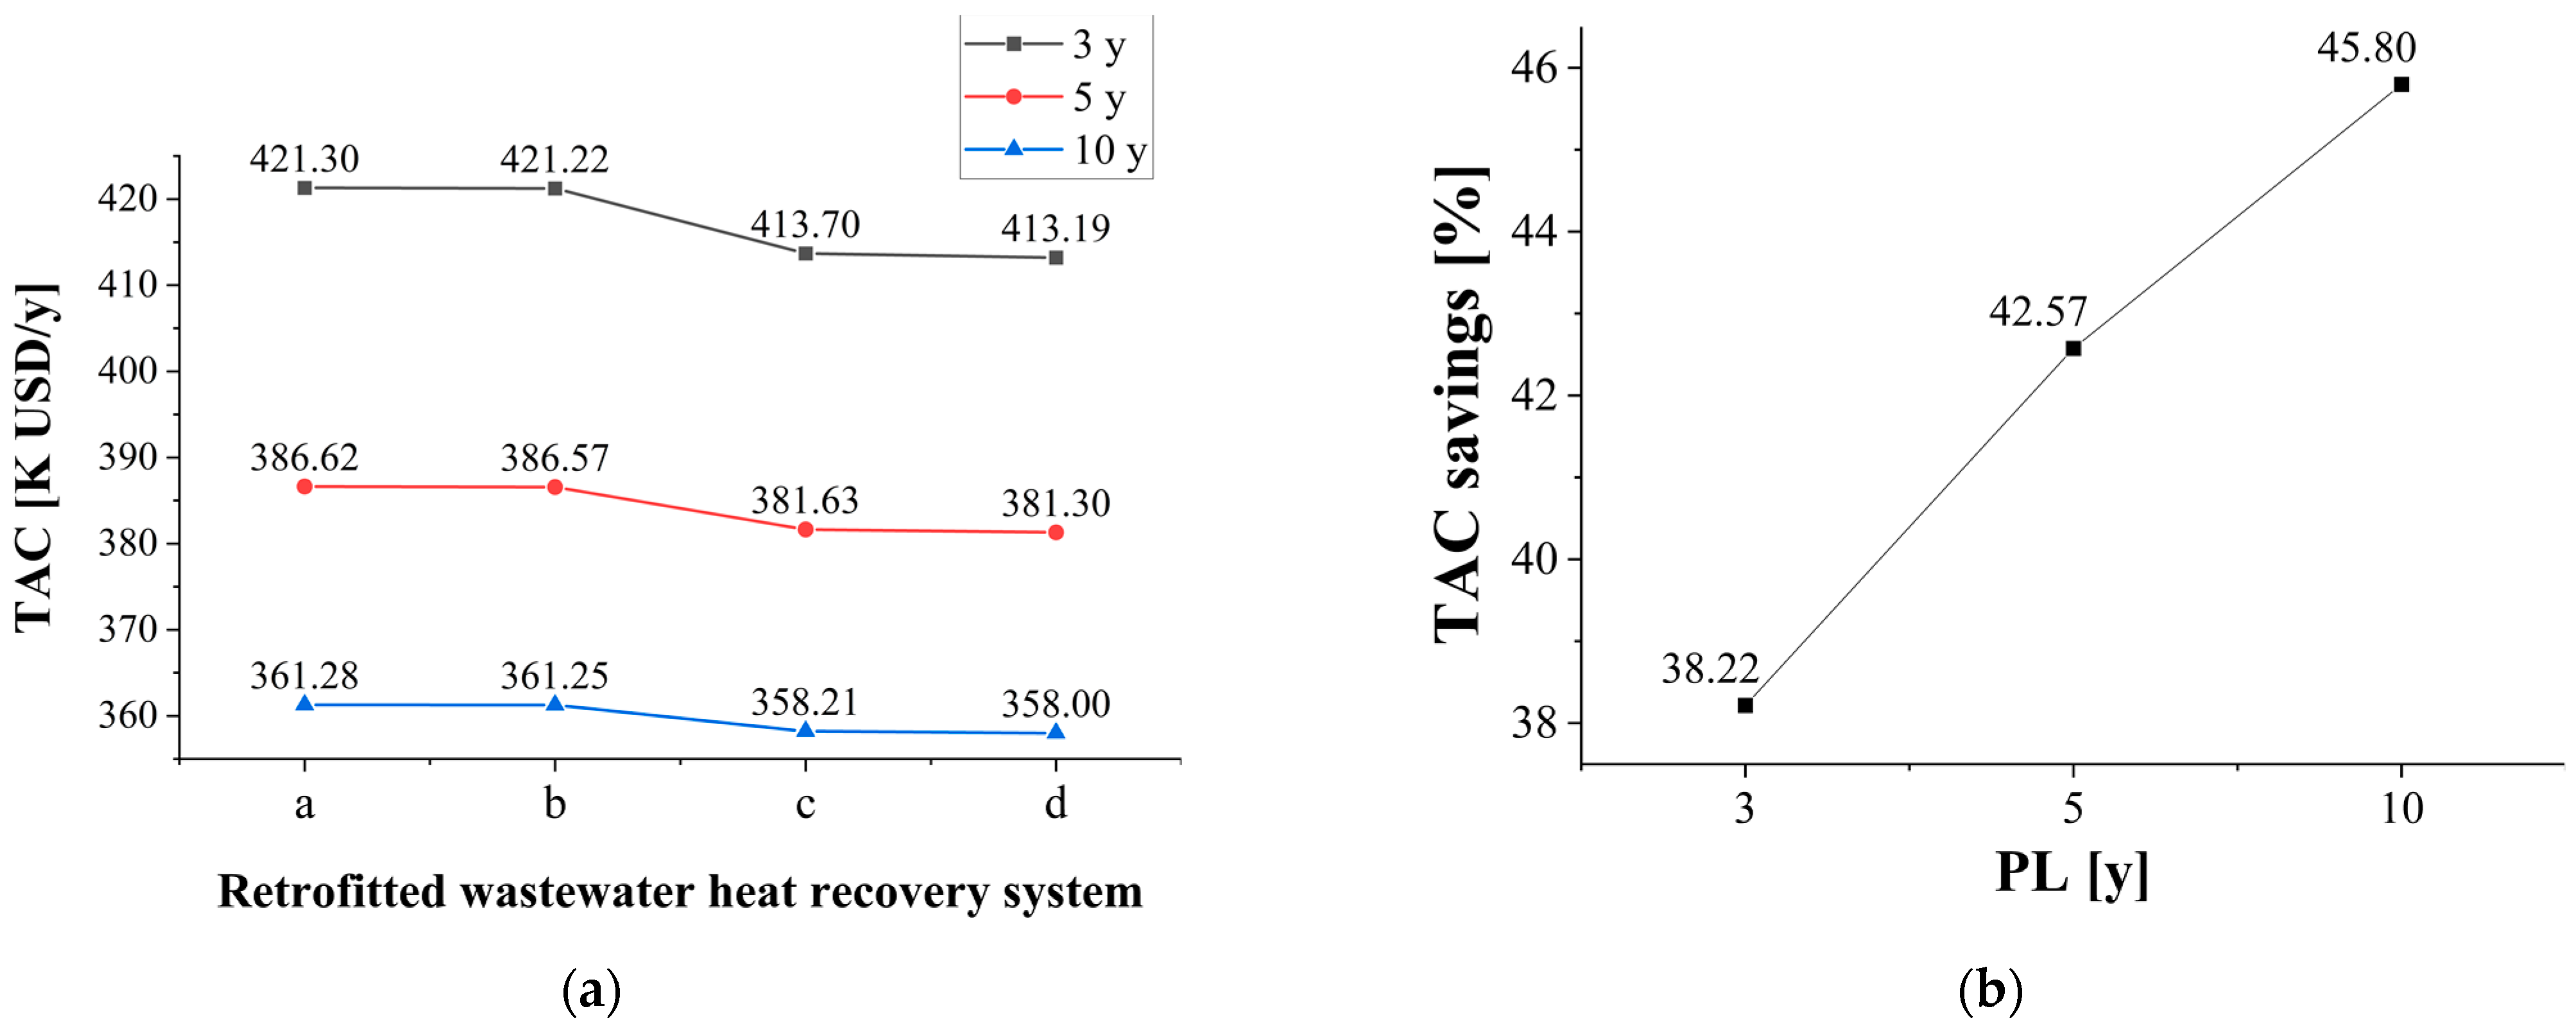
First, sensitivity analysis of on TAC was conducted because could be changed depending on the situation of the textile plant. Thus, as shown in Figure 7, sensitivity analysis of TAC was conducted by changing to 3 years and 10 years. Figure 7a represents the TAC of each retrofitted system as the changes, and Figure 7b shows the maximum possible TAC savings as the changes.
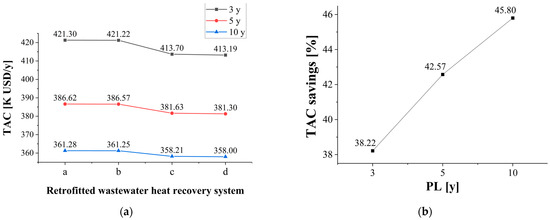
Figure 7.
Sensitivity analysis of PL on TAC. (a) TAC of each retrofitted wastewater heat recovery system as changes, (b) Maximum TAC savings as changes.
As shown in Figure 7a, the difference in TAC between the four retrofitted wastewater heat recovery systems gradually decreased as the increased. By Equations (6) and (7), as increases, decreases, so the effect of on TAC becomes greater than that of . As shown in Figure 7b, the larger the , the larger the TAC savings because the significant of the proposed wastewater heat recovery system, which integrates the heat exchanger and heat pump, gradually reduces the effect on TAC as the becomes longer.
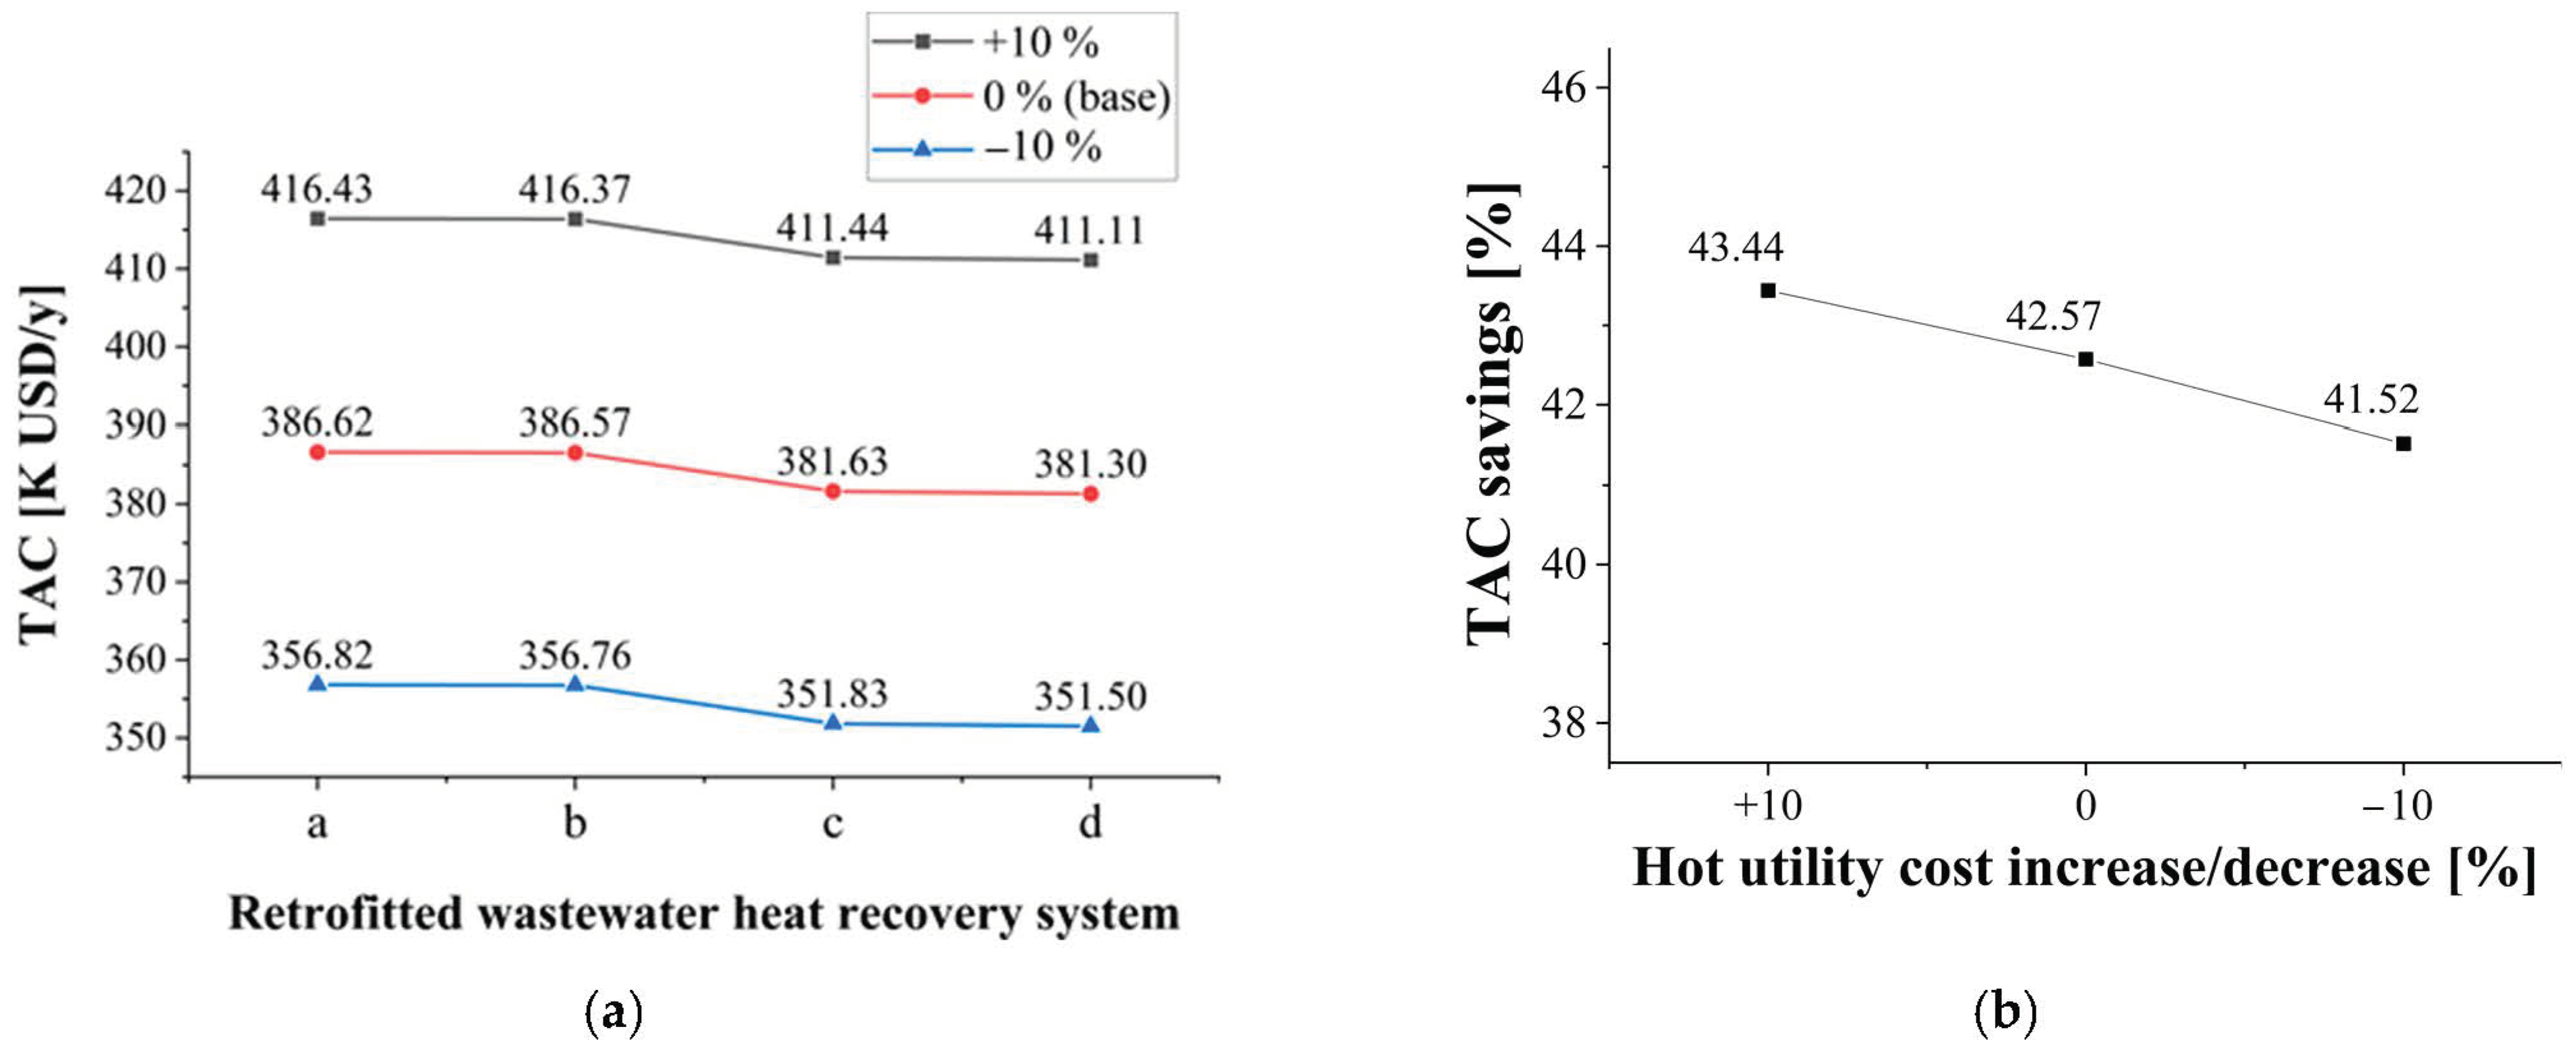
Second, sensitivity analysis of on TAC was conducted by increasing or decreasing by 10%, since can fluctuate according to the type of fuel used for making utilities, the efficiency of the boiler, etc. [24]. Figure 8a shows the TAC change of each retrofitted wastewater heat recovery system when increases or decreases by 10%. Figure 8b shows the maximum TAC savings according to the change in .
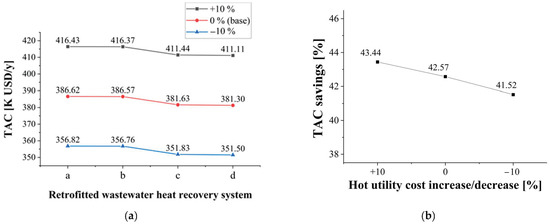
Figure 8.
Sensitivity analysis of on TAC. (a) TAC of each retrofitted wastewater heat recovery system as changes, (b) maximum TAC savings as changes.
Even if was changed in Figure 8a, the difference in TAC between each retrofitted wastewater heat recovery system was the same. Since all the proposed retrofitted systems recover the same amount of heat, all retrofitted systems used the same amount of hot utility and had the same , so the difference in TAC was equal. In Figure 8b, the TAC savings decreased as decreased because, even though the proposed system reduced a large amount of energy compared to the conventional textile industry, the energy saving costs decreased by lowered .
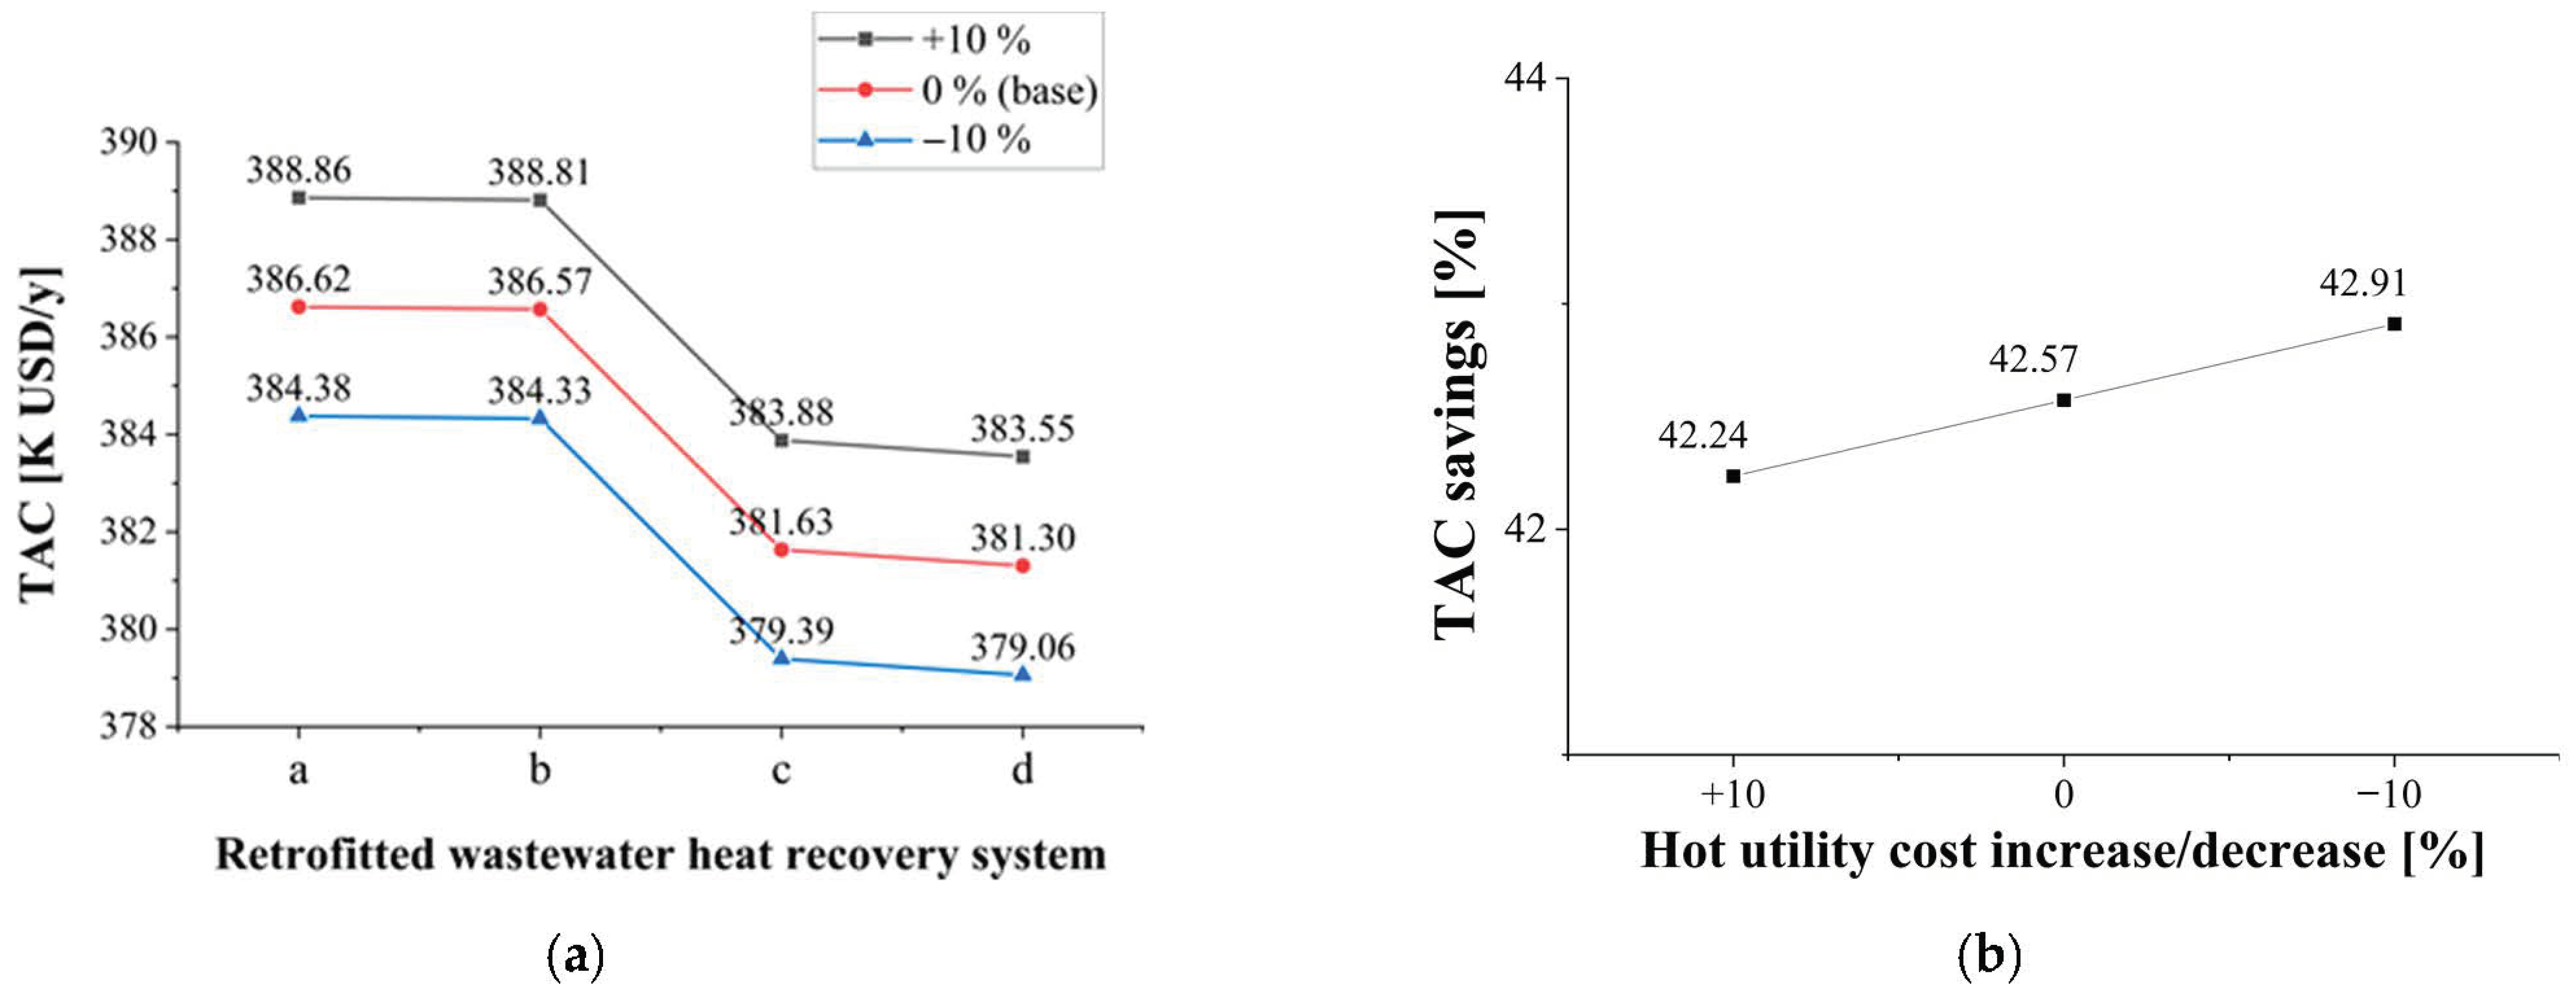
Finally, a sensitivity analysis of on TAC was conducted by increasing or decreasing by 10% because can change every year by fuel cost adjustment fee, climate and environmental costs, and such [24]. Figure 9a shows the TAC change of each retrofitted system when increases or decreases by 10%, and Figure 9b shows the maximum TAC savings according to the change in .
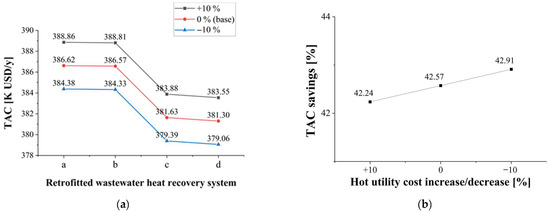
Figure 9.
Sensitivity analysis of on TAC. (a) TAC of each retrofitted wastewater heat recovery system as changes, (b) maximum TAC savings as changes.
In Figure 9a, the difference in TAC between each retrofitted wastewater heat recovery system did not change despite the change in because all systems used a heat pump of the same specification and used the same amount of electricity. In Figure 9b, TAC savings increased as decreased because, as the decreases, additional electricity costs due to the use of a heat pump in the system are reduced, allowing more TAC savings compared to the existing textile industry.
4. Conclusions
In the textile industry, reactive dyeing for producing large volumes of high-quality products consumes enormous amounts of energy owing to the absence of a proper heat recovery system. Therefore, this study proposed a cost-optimal HEN in the heat pump-assisted textile industry wastewater heat recovery system to maximize the energy efficiency and minimize the cost of the textile industry using a two-step approach. In the first step, the system was designed to integrate the heat exchanger and heat pump to recover waste heat effectively considering the operation condition of textile industry. In the second step, to minimize cost and maximize energy efficiency simultaneously, the HEN in the developed system was modified using super-targeted pinch analysis. The suggested two-step approach enables the energy-efficient and cost-effective design of wastewater heat recovery systems, through which significant economic and environmental benefits can be achieved. The results of an economic assessment suggest that the proposed wastewater heat recovery system, which was retrofitted via super-targeted pinch analysis, was able to reduce the TAC by 43.07% compared with the conventional textile industry without a wastewater heat recovery system. Therefore, this study can serve as a guideline for the design of future wastewater heat recovery systems offering both environmental and economic improvements.
This study focused on designing optimal HEN in the wastewater heat recovery system with a fixed heat pump configuration. However, considering the optimal HEN and the heat pump configuration with a high coefficient of performance simultaneously, it will be possible to design a genuinely optimal wastewater heat recovery system. Therefore, advanced heat pump configuration design in the wastewater heat recovery system will be significant in future studies.
Author Contributions
Conceptualization, Y.K. and J.L.; methodology, Y.K. and J.L.; software, Y.K.; validation, Y.K., J.L. and H.C.; formal analysis, Y.K. and J.L.; investigation, Y.K.; resources, J.Y.S., S.H. and H.L.; data curation, J.Y.S., S.H. and H.L.; writing—original draft preparation, Y.K.; writing—review and editing, H.C.; visualization, Y.K.; supervision, H.C.; project administration, J.Y.S., S.H., H.L. and H.C.; funding acquisition, H.C. All authors have read and agreed to the published version of the manuscript.
Funding
This research was funded by the Korea Institute of Industrial Technology within the framework of the following projects: “Development of Global Optimization System for Energy Process,” grant numbers EM-21-0022, IR-21-0029, and IZ-21-0052] and “Development of Complex Parameter Smart Analysis Modules for Color Customering,” grant number EH-21-0008.
Data Availability Statement
Not applicable.
Conflicts of Interest
The authors declare no conflict of interest.
Nomenclature
| Variable | Description |
| The total annualized cost (TAC) of HEN (USD/y) | |
| The capital cost target of HEN (USD) | |
| The operating cost target of HEN (USD/y) | |
| The heat exchanger units target (-) | |
| Target area of heat exchanger network (HEN) (m2) | |
| The number of process and utility streams above the pinch (-) | |
| The number of process and utility streams below the pinch (-) | |
| Target area of heat exchanger at each interval of the composite curve (m2) | |
| amount of exchanged heat at each interval of the composite curve (kJ/h) | |
| The logarithmic mean temperature difference at each interval of the composite curve (°C) | |
| The heat transfer coefficient of the hot stream at each interval (kJ/(h∙m2∙°C)) | |
| The heat transfer coefficient of the cold stream at each interval (kJ/(h∙m2∙°C)) | |
| The energy target for hot utility (kJ/h) | |
| The energy target for cold utility (kJ/h) | |
| The total capital cost of the wastewater heat recovery (WWHR) system (USD) | |
| The capital cost of the heat pump (USD) | |
| The capital cost of the compressor in heat pump (USD) | |
| The capital cost of the evaporator in heat pump (USD) | |
| The capital cost of the condenser in heat pump (USD) | |
| The capital cost of the expansion valve in heat pump (USD) | |
| The capital cost of the flash drum in heat pump (USD) | |
| The capital cost of the heat exchanger (USD) | |
| The operating cost of the heat pump (USD/y) | |
| Parameter | Description |
| The annualization factor (-) | |
| The rate of return (%) | |
| The plant life (y) | |
| the installation cost of the heat exchanger (-) | |
| The duty related cost set coefficients of the heat exchanger (-) | |
| The area related cost set coefficients of the heat exchanger (-) | |
| The utility cost for hot utility (USD/kJ) | |
| The utility cost for cold utility (USD/kJ) | |
| The output power density of the compressor (kW) | |
| The power required for the compressor (kW) | |
| The cost for electricity required for the compressor (USD/kJ) |
References
- Lim, J.; Lee, H.; Cho, H.; Shim, J.Y.; Lee, H.; Kim, J. Novel Waste Heat and Oil Recovery System in the Finishing Treatment of the Textile Process for Cleaner Production with Economic Improvement. Int. J. Energy Res. 2022, 1–14. [Google Scholar] [CrossRef]
- Kandilli, C.; Koclu, A. Assessment of the Optimum Operation Conditions of a Plate Heat Exchanger for Waste Heat Recovery in Textile Industry. Renew. Sustain. Energy Rev. 2011, 15, 4424–4431. [Google Scholar] [CrossRef]
- Kannoh, S. Heat Recovery from Warm Waste Water at Dyeing Process by Absorption Heat Pump. J. Heat Recover. Syst. 1982, 2, 443–451. [Google Scholar] [CrossRef]
- Rakib, M.I.; Saidur, R.; Mohamad, E.N.; Afifi, A.M. Waste-Heat Utilization – The Sustainable Technologies to Minimize Energy Consumption in Bangladesh Textile Sector. J. Clean. Prod. 2017, 142, 1867–1876. [Google Scholar] [CrossRef]
- Elahee, K. Heat Recovery in the Textile Dyeing and Finishing Industry: Lessons from Developing Economies. J. Energy S. Afr. 2010, 21, 9–15. [Google Scholar] [CrossRef]
- Alhajri, I.H.; Gadalla, M.A.; Abdelaziz, O.Y.; Ashour, F.H. Retrofit of Heat Exchanger Networks by Graphical Pinch Analysis—A Case Study of a Crude Oil Refinery in Kuwait. Case Stud. Therm. Eng. 2021, 26, 101030. [Google Scholar] [CrossRef]
- Jeong, M.; Rho, S.G.; Kang, C.H.; Hwang, I.J. Optimization of Heat Exchanger Network in the Dehydration Process Using Utility Pinch Analysis. Korean J. Chem. Eng. 2020, 37, 1565–1572. [Google Scholar] [CrossRef]
- Asaduzzaman; Miah, M.R.; Hossain, F.; Li, X.; Zakaria; Quan, H. A Study on the Effects of Pre-Treatment in Dyeing Properties of Cotton Fabric and Impact on the Environment. J. Text. Sci. Eng. 2016, 6, 274. [Google Scholar] [CrossRef] [Green Version]
- Pulat, E.; Etemoglu, A.B.; Can, M. Waste-Heat Recovery Potential in Turkish Textile Industry: Case Study for City of Bursa. Renew. Sustain. Energy Rev. 2009, 13, 663–672. [Google Scholar] [CrossRef]
- Wu, X.; Xing, Z.; He, Z.; Wang, X.; Chen, W. Performance Evaluation of a Capacity-Regulated High Temperature Heat Pump for Waste Heat Recovery in Dyeing Industry. Appl. Therm. Eng. 2016, 93, 1193–1201. [Google Scholar] [CrossRef]
- Peng, D.; Robinson, D.B.; Peng, D.; Robinson, D.B. A New Two-Constant Equation of State A New Two-Constant Equation of State. ACS Omega 2002, 15, 59–64. [Google Scholar]
- Gou, X.; Fu, Y.; Shah, I.A.; Li, Y.; Xu, G.; Yang, Y.; Wang, E.; Liu, L.; Wu, J. Research on a Household Dual Heat Source Heat Pump Water Heater with Preheater Based on Aspen PlusX. Energies 2016, 9, 1026. [Google Scholar] [CrossRef] [Green Version]
- Bouhadjar, S.I.; Deowan, S.A.; Galiano, F.; Figoli, A.; Hoinkis, J.; Djennad, M. Performance of Commercial Membranes in a Side-Stream and Submerged Membrane Bioreactor for Model Textile Wastewater Treatment. Desalin. Water Treat. 2016, 57, 5275–5285. [Google Scholar] [CrossRef]
- Nagpal, H.; Spriet, J.; Murali, M.K.; McNabola, A. Heat Recovery from Wastewater—a Review of Available Resource. Water 2021, 13, 1274. [Google Scholar] [CrossRef]
- Townsend, D.W.; Linnhoff, B. Surface Area Targets for Heat Exchanger Networks. In Proceedings of the IChemE Annual Research Meeting, Bath, UK, 23 April 1984. [Google Scholar]
- Kemp, I.C. Data Extraction and Energy Targeting. In Pinch Analysis and Process Integration, 2nd ed.; Kemp, I.C., Ed.; Butterworth-Heinemann: Oxford, UK, 2007; pp. 41–98. ISBN 978-0-7506-8260-2. [Google Scholar]
- Smith, R. Chemical Process: Design and Integration; Wiley: New York, NY, USA, 2005; ISBN 9780470011911. [Google Scholar]
- Towler, G.; Sinnott, R. Chapter 9—Economic Evaluation of Projects, 2nd ed.; Butterworth-Heinemann: Boston, MA, USA, 2013; pp. 389–429. ISBN 978-0-08-096659-5. [Google Scholar]
- Lim, J.; Jeong, S.; Kim, J. Deep Neural Network-Based Optimal Selection and Blending Ratio of Waste Seashells as an Alternative to High-Grade Limestone Depletion for SOX Capture and Utilization. Chem. Eng. J. 2021, 133244. [Google Scholar] [CrossRef]
- Lim, J.; Lee, J.; Moon, I.; Cho, H.; Kim, J. Techno-Economic Comparison of Amine Regeneration Process with Heat-Stable Amine Salt Reclaiming Units. Energy Sci. Eng. 2021, 2529–2543. [Google Scholar] [CrossRef]
- Kamarudin, S.K.; Daud, W.R.W.; Som, A.M.; Takriff, M.S.; Mohammad, A.W. Technical Design and Economic Evaluation of a PEM Fuel Cell System. J. Power Sources 2006, 157, 641–649. [Google Scholar] [CrossRef]
- Ozgener, O.; Hepbasli, A.; Ozgener, L. A Parametric Study on the Exergoeconomic Assessment of a Vertical Ground-Coupled (Geothermal) Heat Pump System. Build. Environ. 2007, 42, 1503–1509. [Google Scholar] [CrossRef]
- Loh, H.P.; Lyons, J.; White, C.W., III. Process Equipment Cost Estimation, Final Report; National Energy Technology Lab. (NETL): Morgantown, WV, USA, 2002. [Google Scholar]
- Kim, Y.; Lim, J.; Cho, H.; Kim, J. Novel Mechanical Vapor Recompression-Assisted Evaporation Process for Improving Energy Efficiency in Pulp and Paper Industry. Int. J. Energy Res. 2022, 46, 3409–3427. [Google Scholar] [CrossRef]

Publisher’s Note: MDPI stays neutral with regard to jurisdictional claims in published maps and institutional affiliations. |
© 2022 by the authors. Licensee MDPI, Basel, Switzerland. This article is an open access article distributed under the terms and conditions of the Creative Commons Attribution (CC BY) license (https://creativecommons.org/licenses/by/4.0/).