Abstract
This paper examines the application of surface drilling parameters and drilling optimization techniques, such as mechanical specific energy (MSE) and equivalent strength (EST), in detecting hydrate gas-bearing sediments during drilling operations. Gas hydrates are usually detected from 3D seismic imaging and later confirmed with Measurement-While-Drilling (MWD)/Logging-While-Drilling (LWD) data and collected core samples. Here, we describe an analysis of the time-based surface drilling parameters recorded from two wells drilled during the International Ocean Discovery Program (IODP) Expedition 372A offshore of New Zealand and the Indian National Gas Hydrate Program Expedition 02 (NGHP-02) offshore of India. The investigation revealed that drilling parameters, as well as MSE/EST methods, can and should be used to monitor and optimize the drilling process and to detect lithological/tectonic (fractures, fault zones, rock hardness, etc.) changes in the drilled substrata and signs of the dynamic changes in the downhole environment (tool vibration, washouts, pack-offs, etc.). However, surface drilling parameters with MSE models cannot explicitly determine the hydrate gas-bearing sediments. This qualitative analysis of whether the gas-bearing sediments consist of hydrates can only be accomplished with the use of the MWD/LWD suite, preferably located as close as possible to the bit.
1. Introduction
Natural Gas Hydrates (NGH) are ice-like crystalline compounds formed by natural gas (methane, ethane, propane, and the lower hydrocarbons) and water molecules in environments of low temperature (2–18 °C) and/or high pressure (3.5–14.5 MPa) [1] found in permafrost and marine continental sediments worldwide [2,3]. The physical properties of bulk gas hydrates are very similar to those of pure ice. As a result, sediments containing hydrate in the pore space are similar to sediments containing non-hydrate (normal) ice. The morphology of the gas hydrates has large effects on sedimentary physical properties, from seismic velocity on a large scale to borehole electrical resistivity on a smaller scale, and therefore, gas hydrate morphology impacts the amount of gas hydrate saturation estimated from geophysical data [4,5]. It is also assumed that saturated gas hydrate-bearing sediments increased the in situ formation compressive strength [6] and are more challenging to drill, affecting drilling parameters such as the rate of penetration and torque [7] and MSE/EST.
Gas hydrates are considered to be one of the most important targets in the energy sector for the near future. This is due to the very high quantity of methane diffused worldwide in this form (1013–1017 m3, depending on the estimation source) [8,9].
The gas hydrate accumulations among shallow gas, shallow faulting, and turbidites in deep-water shallow marine sediments over several years of oil and gas exploration are considered risky and unwanted safety and stability hazards that need to be considered when preparing offshore drilling campaigns [10]. Two main categories of hazards associated with gas hydrates—marine geohazards and marine engineering hazards—can be distinguished [11].
Marine geohazards can further be divided into submarine landslides, earthquakes, greenhouse gas emissions, and marine ecological hazards. The occurrence of landslides on the continental slope and potential dissociation of the gas hydrates related to rapid changes in the pressure/temperature regime is thought to be correlated with sediment deformation, slumping, and even debris flows in Storrega, Norway [12], Cape Fear in the USA [13], and in the Dongsha Area of Northern China [14].
Marine engineering hazards are related to drilling and production from hydrate fields. These operations pose issues regarding stability hazards in rapid changes to the pressure regime and increasing the temperature profile of the sediments in the vicinity of the wellbore [11]. Additionally, large amounts of dissociated methane can infiltrate the drill pipe, resulting in a sharp increase in drilling fluid pressure and causing a blowout and borehole collapse.
Other engineering hazards can include borehole instabilities, changes to drilling fluid, well cleaning, and cementing/casing failure as a borehole is drilled through the Gas Hydrate Bearing Sediment (GHBS) zones.
Recently, the attitude toward hydrate gas-bearing sediments in shallow sediments has shifted as they have become one of the most important hydrocarbon targets. Several countries, such as Japan, USA, Canada, China, India, and Korea, either on their own through national oil companies or through international scientific collaboration, such as the pre-2013 Integrated Ocean Drilling Program (IODP) and the post-2013 International Ocean Discovery Program (IODP), commenced exploration and production tests [15,16,17,18,19,20].
The distribution of gas hydrates is usually inferred from 2D and 3D seismic reflection profiles as a well-defined, dense (high sonic velocity) layer of a bottom simulating reflection (BSR) [21], suggesting that large amounts of methane are trapped within a water crystal structure forming a solid similar to ice. For the precise location and depth distribution of the gas hydrate sediments, the strategy of drilling a wellbore with highly sophisticated suites of MWD/LWD tools is used [17,19,22]. These tools detect the differences in acoustic and electric properties between gas hydrate saturated sediments and non-saturated sediments.
Surface drilling parameters are recorded every time a wellbore is drilled. Some of the drilling parameters are sensitive to changes in lithology, rock strength, and pressure regime and can be utilized similarly to MWD/LWD logging techniques to map gas hydrate distribution [6,23]. Several drilling optimization techniques [6,24,25,26,27,28] that have been developed over the years to improve and lower the drilling cost of a well can be utilized to enhance and help complement defining the occurrence of gas hydrate in sedimentary sections.
The primary goal of this paper was to review whether the surface drilling parameters collected from two boreholes with well-defined gas hydrate-bearing sediments coupled with drilling optimization techniques could define hydrate-bearing sediments in a similar way to downhole logging tools. Thus, the continuous evaluation of drilling parameters, MSE/EST, and their correlation with the LWD measurements allow for a full estimation of gas hydrate saturations and morphology of gas hydrate occurrence while drilling.
Here, we analyze time-based drilling parameters and apply the MSE/EST methods to drilling data from the NGHP-02-23A and U1517A drill sites. We discuss the application of the methodology and compare the calculated MSE/EST with selected logging data to verify that drilling parameters, as well as drilling optimization techniques, can help identify gas-bearing sediments.
2. Materials and Methods
2.1. Site Location
In this study, we focused on two wells drilled in two different locations by two different drilling vessels. First analyzed was well NGHP-02-23A, drilled by the JAMSTEC drillship “Chikyu” in 2015 during the Indian National Gas Hydrate Program Expedition 2, as shown in Figure 1. The program was designed to investigate the distribution and occurrence of gas hydrates in the Krishna Godavari, offshore of India [17].

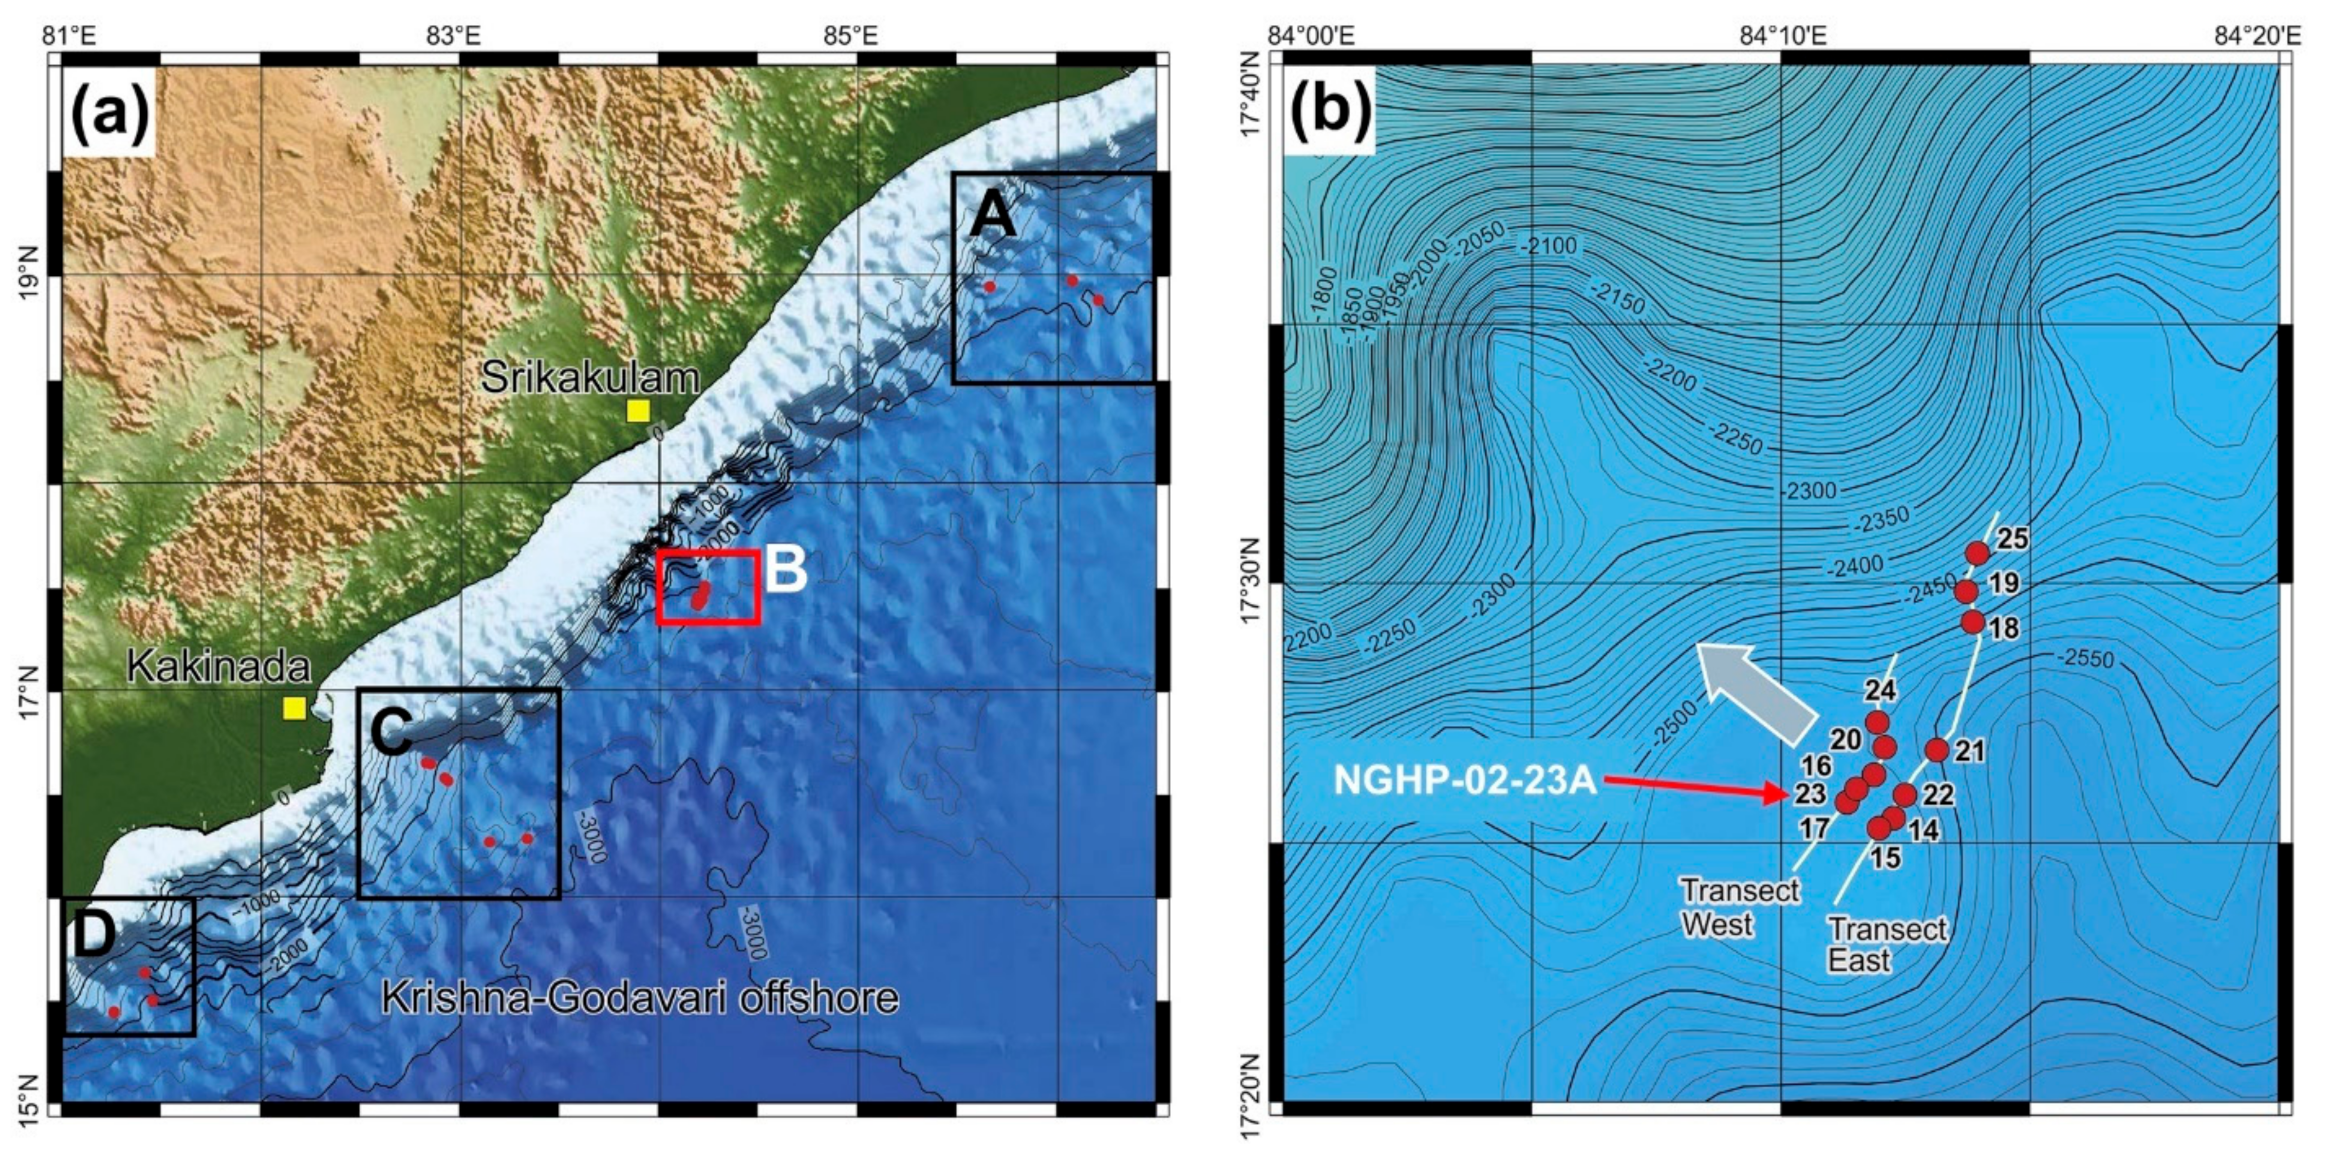
Figure 1.
The study area (a) with drill sites in Areas A, B, C and D in the Krishna-Godavari Basin offshore eastern India. (b) Zoomed location of Area B with twelve sites drilled for LWD and five sites (NGHP-02-16, -17, -19, -22 and -23) for coring operations during the NGHP-02. The grey arrow indicates the upward direction of the crest of the anticline in Area-B. The red arrow indicates NGHP-02-23A in the West Transect, from which the data was used in this study. Modified after [29].
The other well, U1517A, was drilled in 2017 by the IODP drillship “JOIDES Resolution” during IODP Expedition 372A Creeping Gas Hydrate Slides at the Hikurangi margin, Tuaheni Landslide Complex, New Zealand [22], shown in Figure 2.
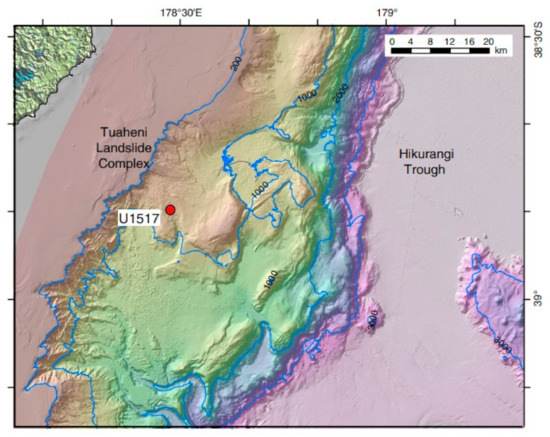
Figure 2.
Location of U1517A wellsite in the Tuaheni Landslide Complex, New Zealand during IODP Exp. 372A. Modified after [22].
2.2. Methodology
Time-based drilling data collected from a network of surface sensors installed at the drilling vessel were utilized in the assessment of the paper. The advantage of working with the surface drilling parameters is that they are an integral part of the drilling vessel instrumentation and are readily accessible for a user to monitor, adjust, and analyze the drilling process. Measured drilling parameters, as can be seen in Table 1, provide an experienced driller with information on how the downhole environment shifts due to mechanical, lithological, and tectonic changes as the drilling progresses.

Table 1.
A list of surface drilling parameters used in the analysis.
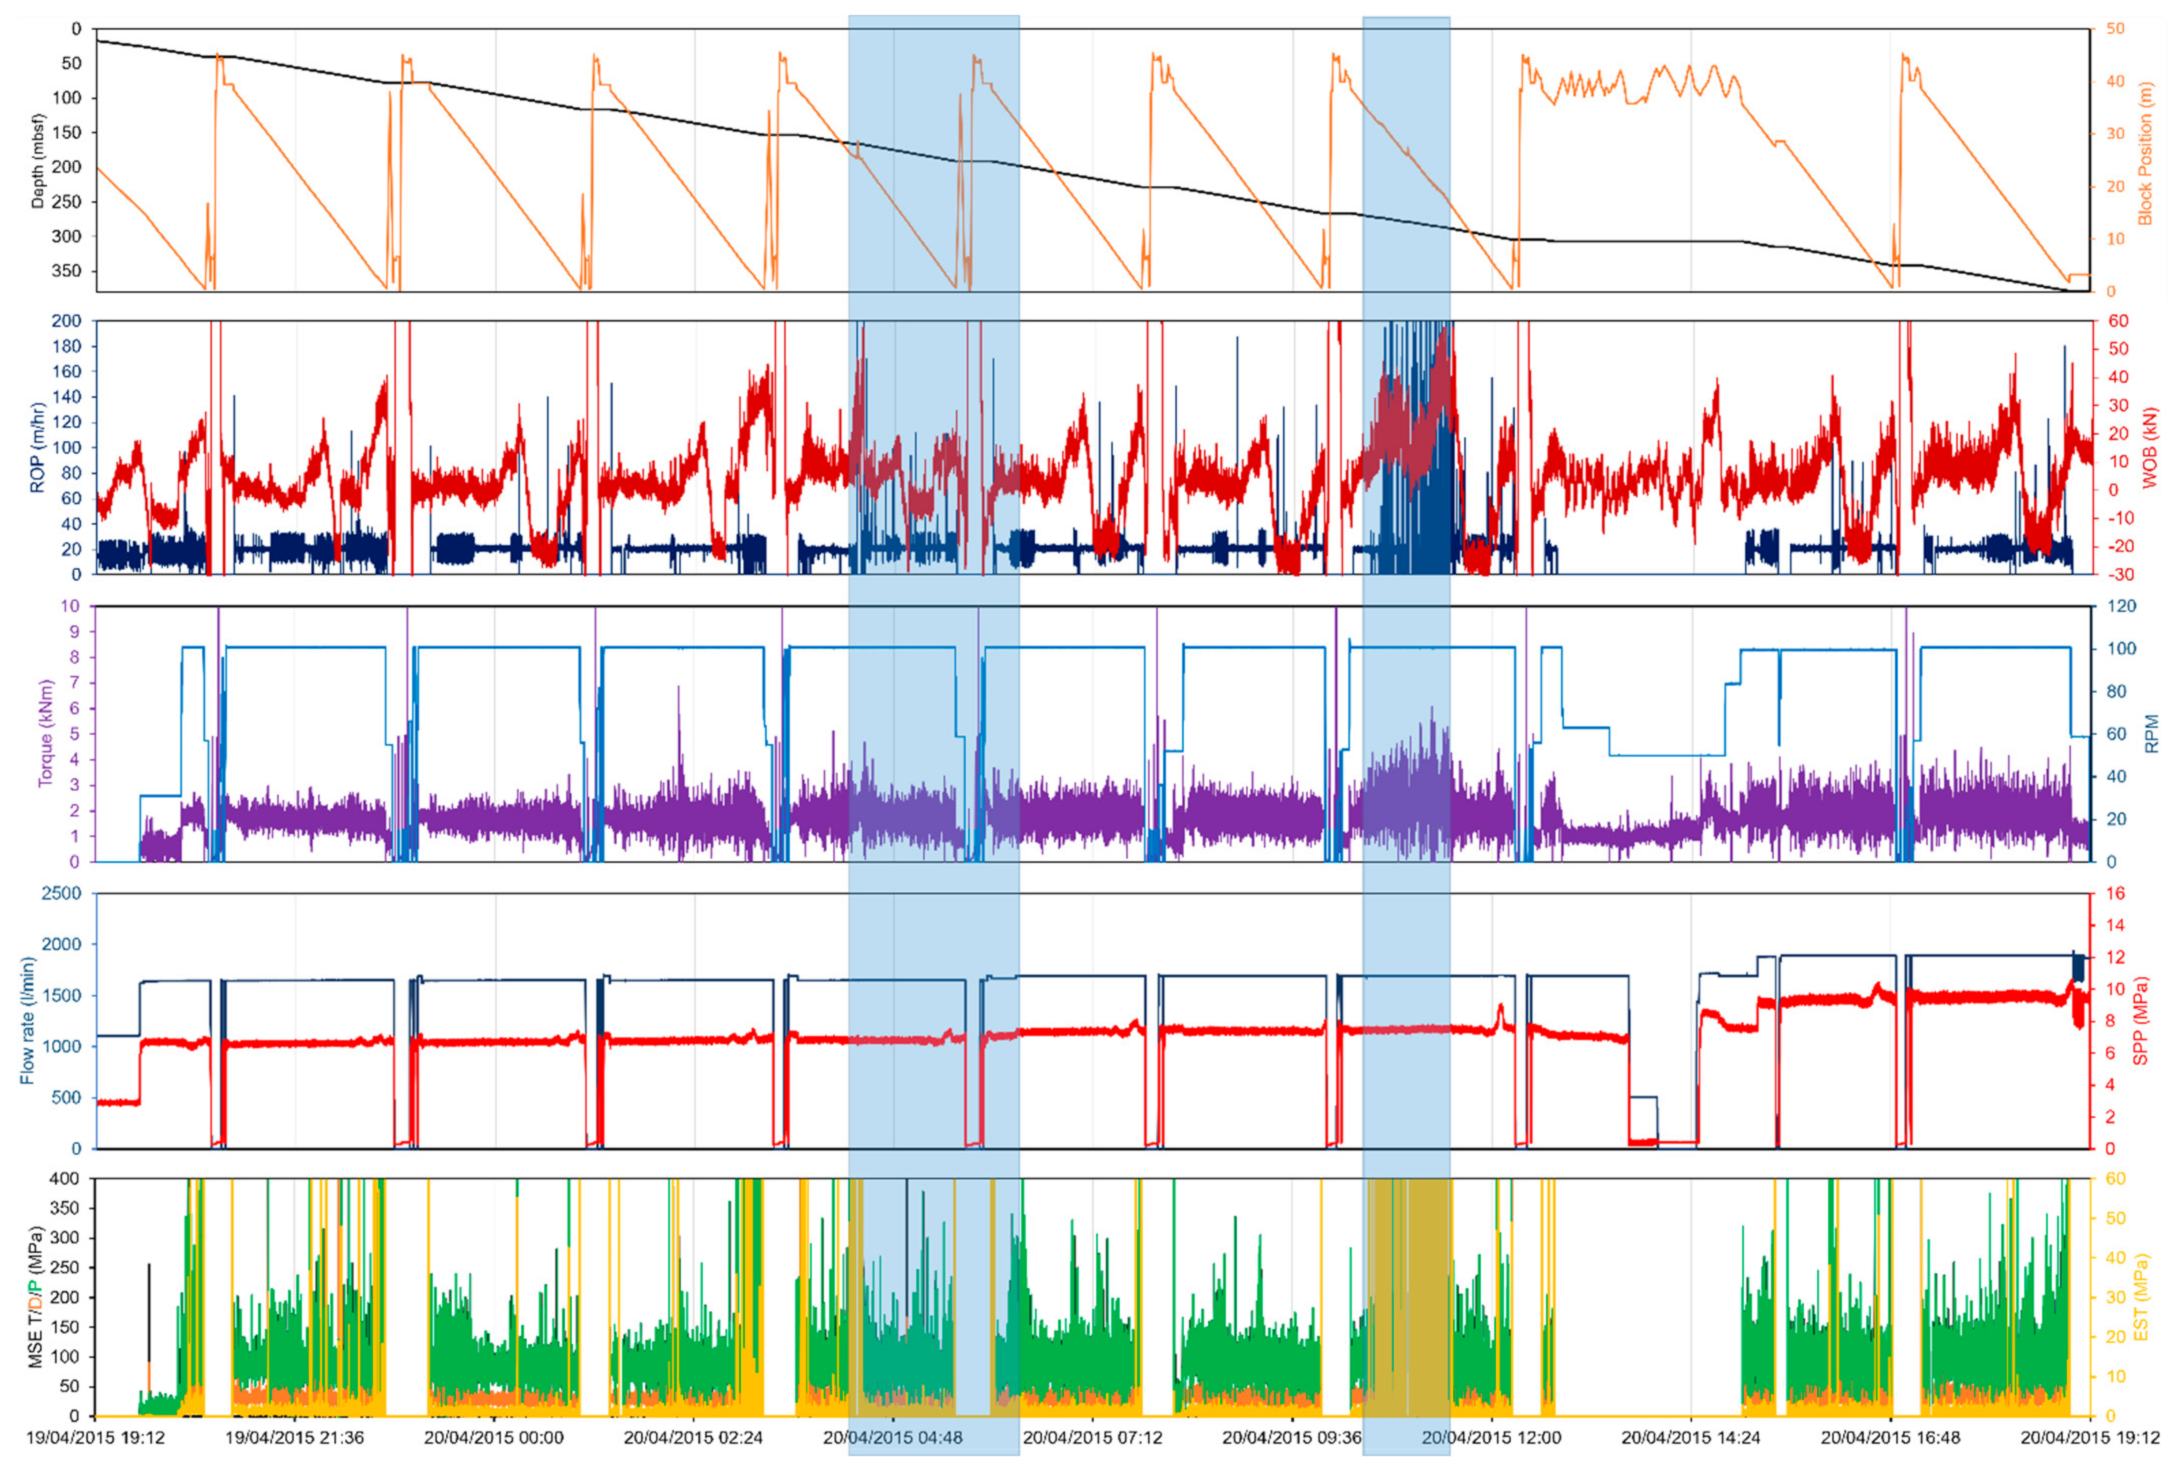
The processing of the surface drilling data consisted of plotting the raw drilling parameters in the time domain to check for data noise and any outliers (Figure 3). Outliers are the ones that are situated far away from the main clusters of observation data. An important factor to consider before removing any outliers is to find out whether they consist of relevant information or are the result of erroneous readings from sensors. In some datasets, for example, when dealing with kick detection or stuck pipe event, the important information could be apparent in the outlying points. Data noise also presents valuable information on the downhole drilling environment; for example, rapid oscillations in ROP and increasing TRQ may suggest interbedded lithology or drilling through a fracture zone. Subsequently, the time-based data were averaged over 60 s intervals and converted into a depth-based domain (Figure 4), preserving the detail of the drilling data seen in the time-based domain. It must be stressed here that the data processing was kept to a minimum to avoid losing any important components of the drilling process and well responses that could be missed in heavily manipulated datasets. Most of the analysis was performed using time-based data and supplemented with depth-based information when needed.
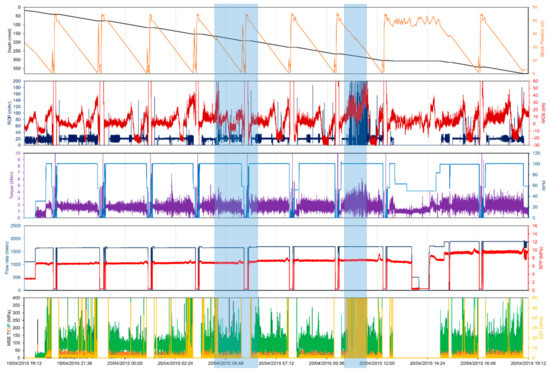
Figure 3.
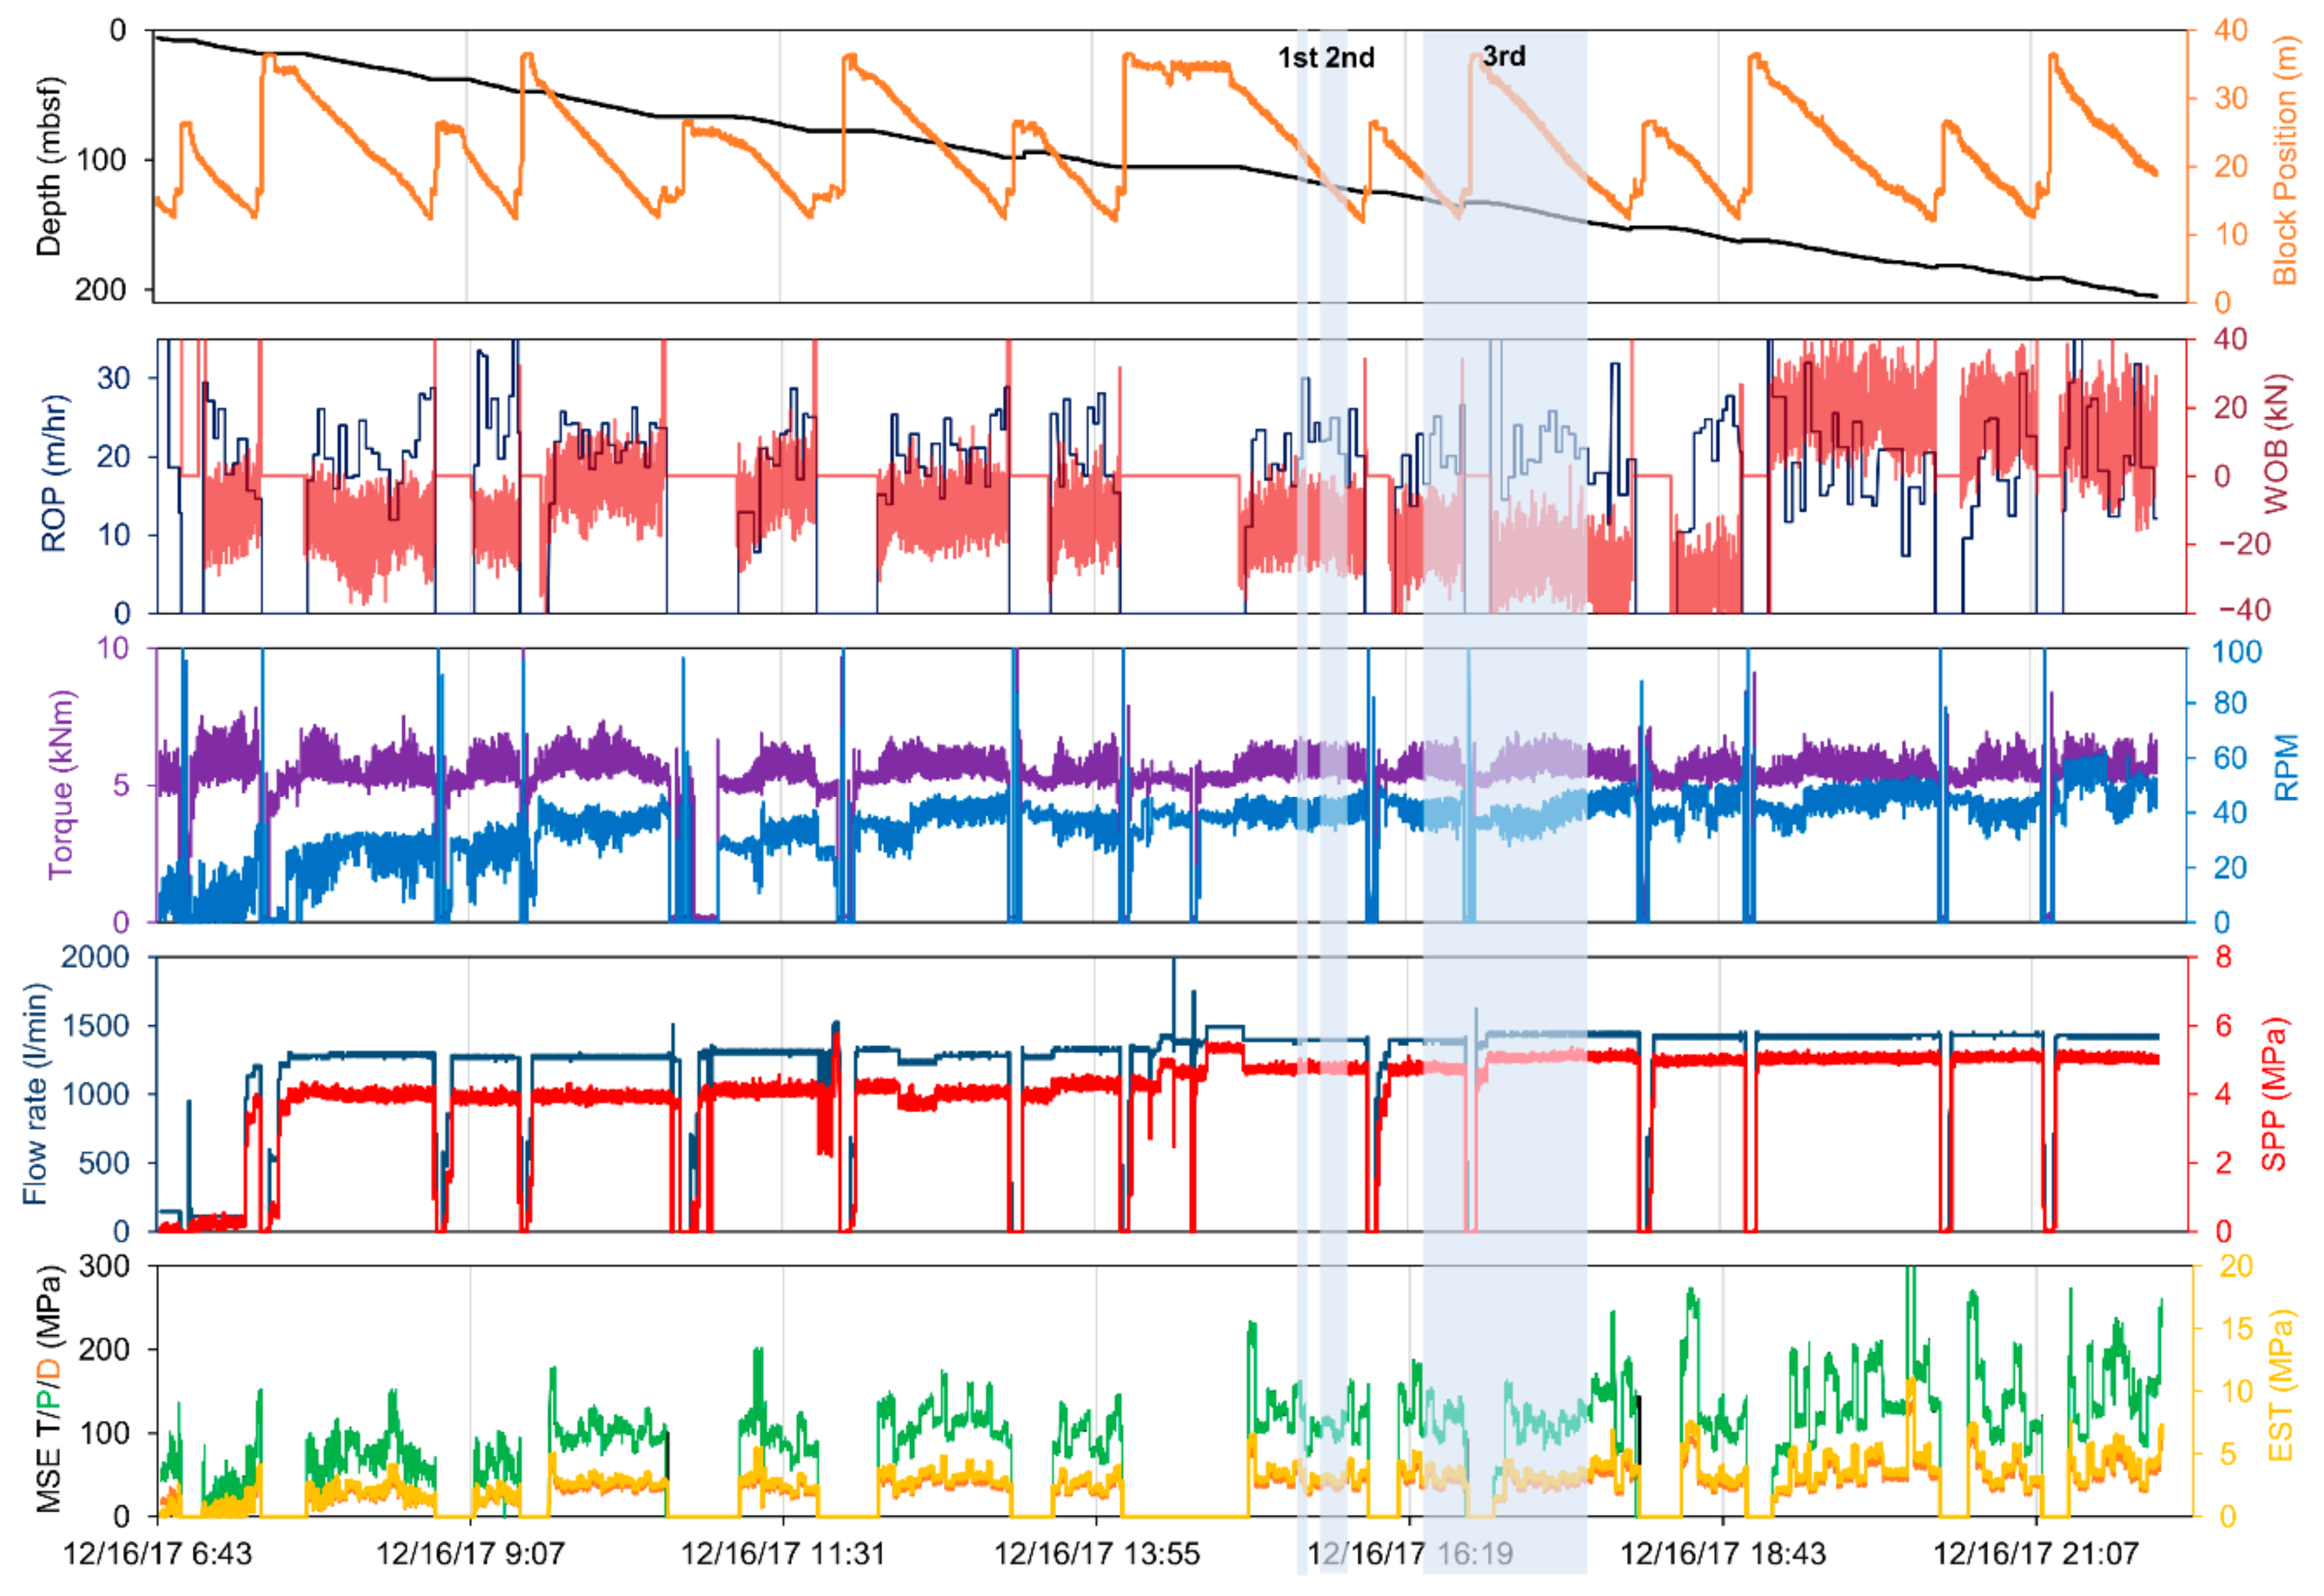
An example of recorded time-based drilling parameters together with calculated MSE/EST used for analysis for NGHP-02-23A well. Light blue shaded areas between 165.3–198.5 mbsf and 270–288.6 mbsf represent gas hydrate accumulations defined from seismic imaging and downhole logging.
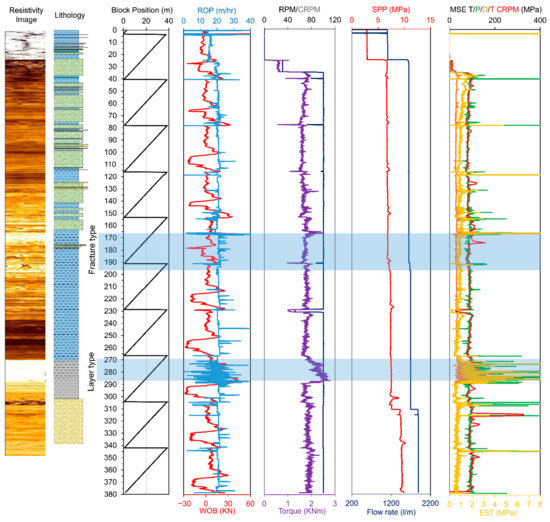
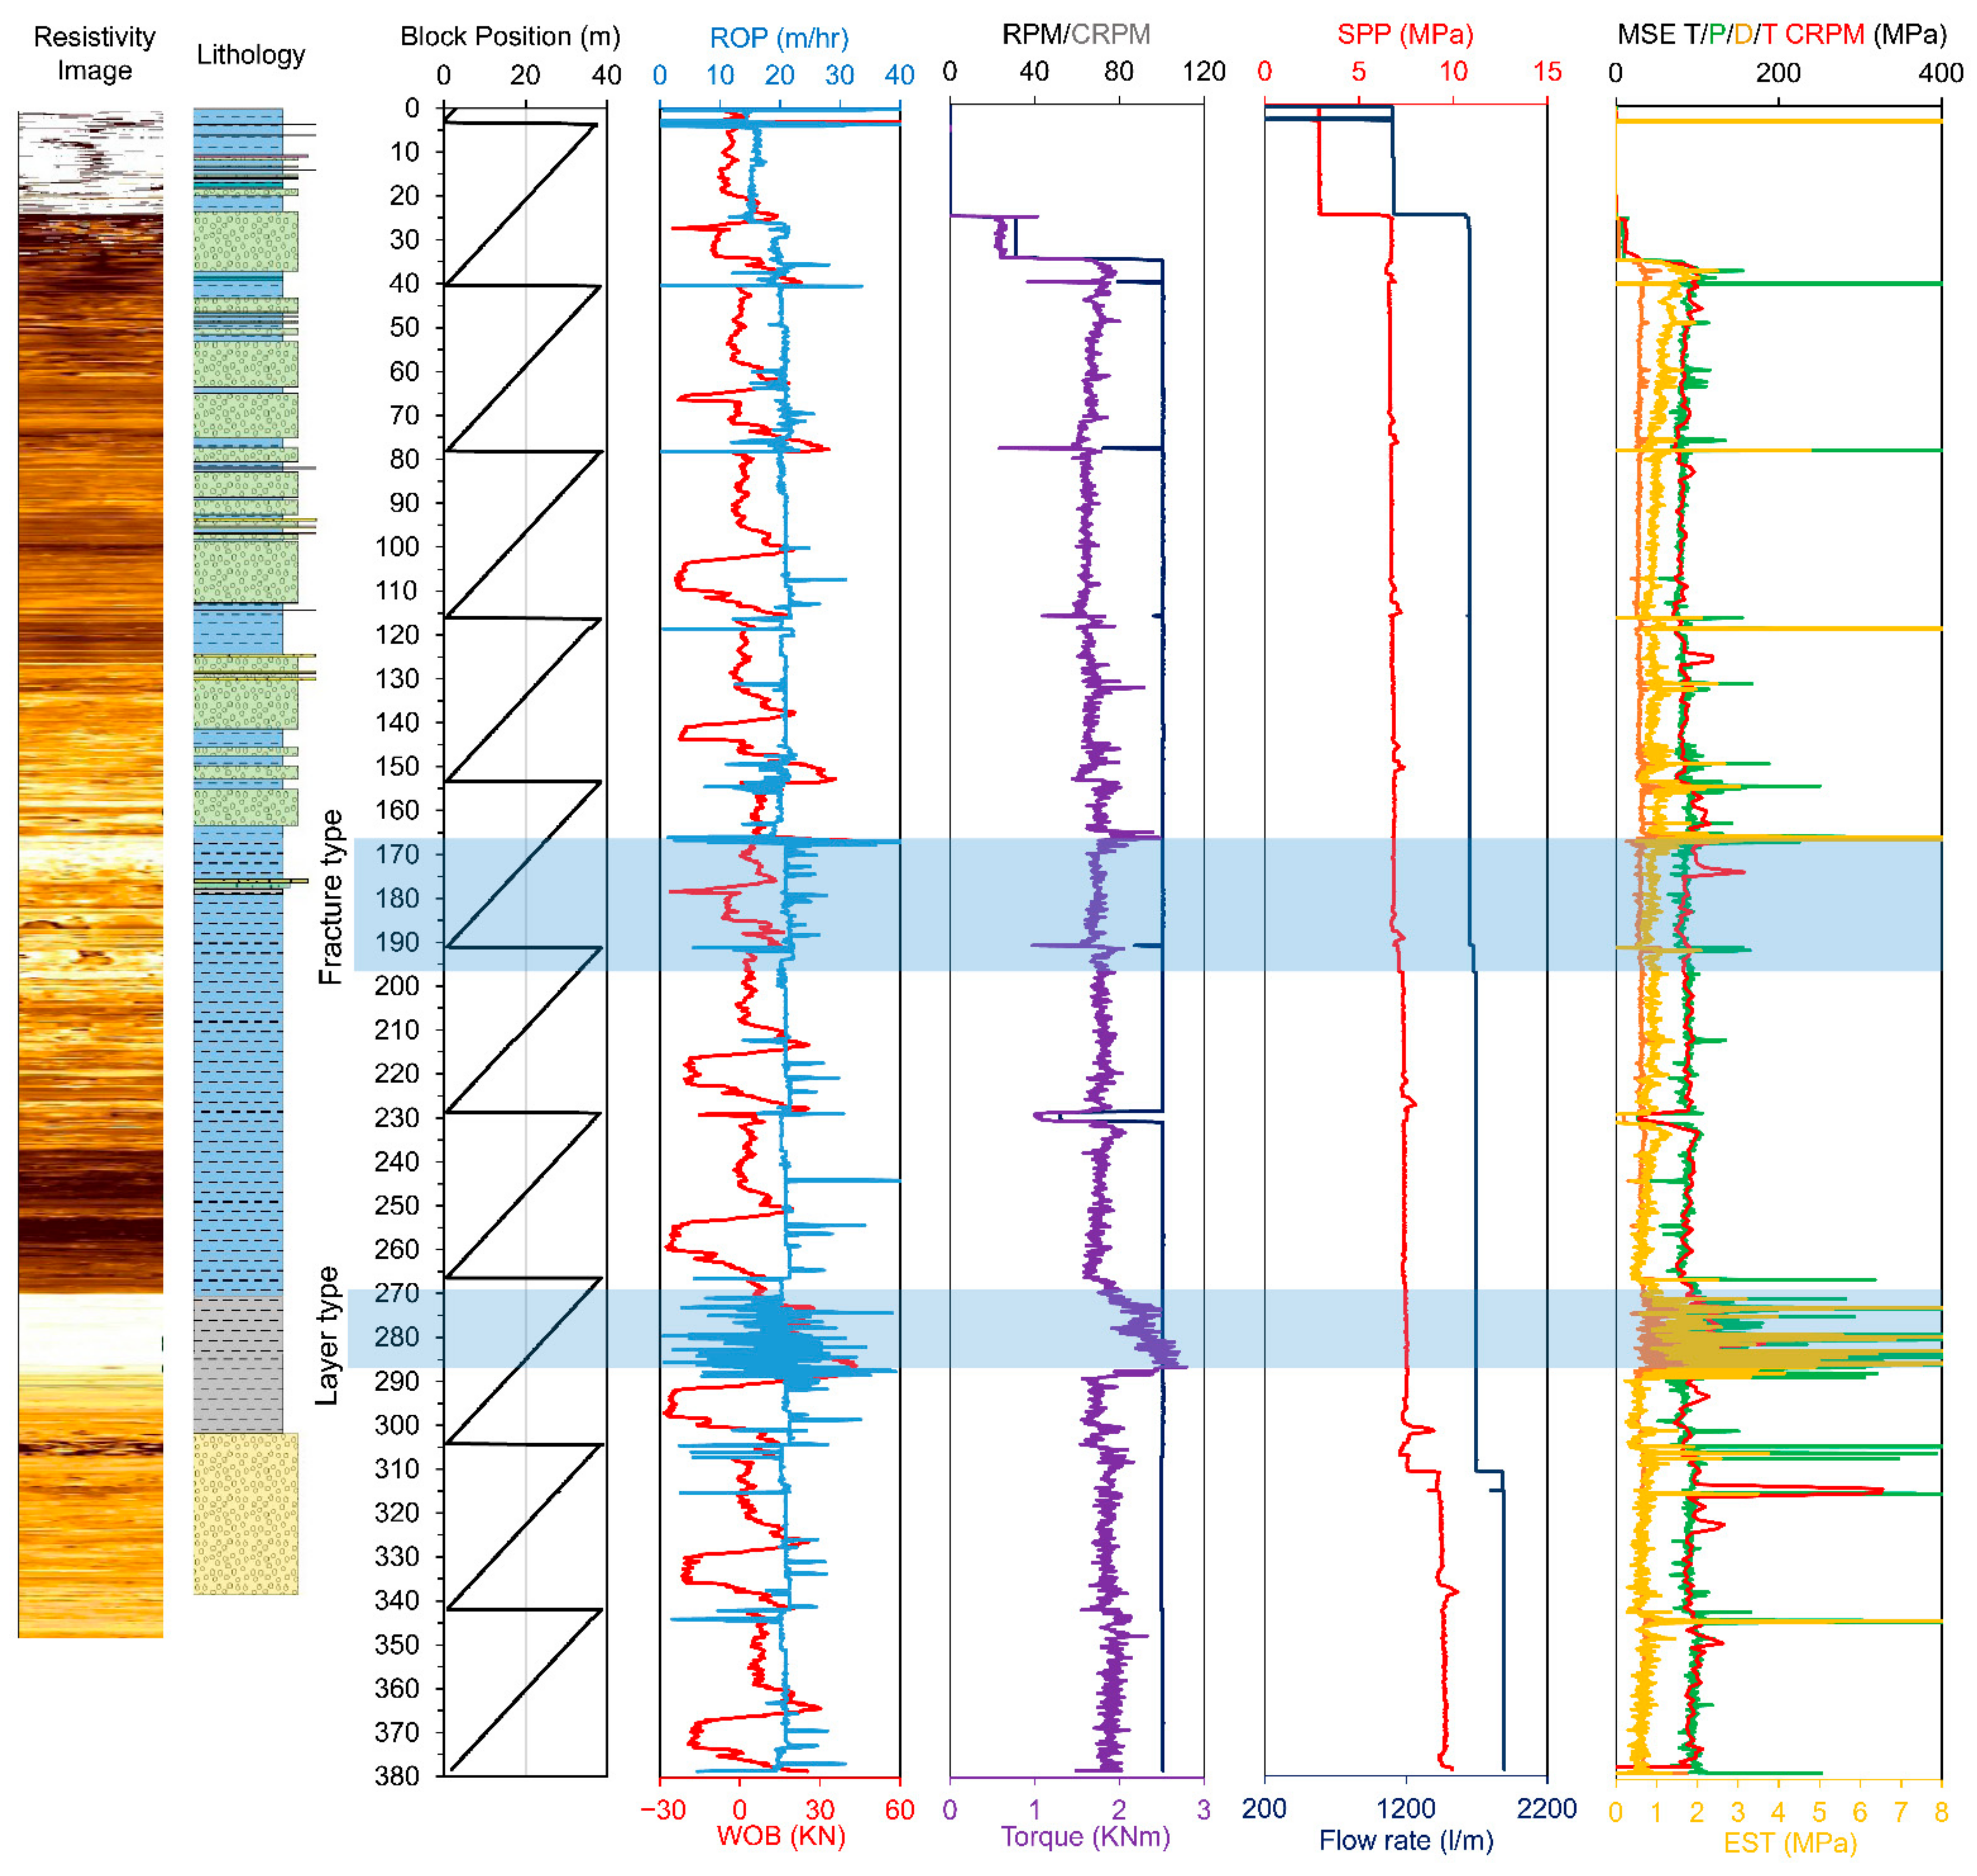
Figure 4.
An example of converted time-based drilling parameters to depth-based together with calculated MSE/EST used for analysis for NGHP-02-23A well. Light blue shaded areas between 165.3–198.5 mbsf and 270–288.6 mbsf represent gas hydrate accumulations defined from seismic imaging and downhole logging.
WOB and hook load data were also analyzed not only to assess the drilling process but also with respect to drilling vessel motion due to tides and heave. Both wells were drilled via drillships, so there was an added complication of heave as the drillship moved up and down over a relatively stationary horizontal position. Quite often, it can be observed that even small heaves affect WOB despite the use of compensators (active or passive).
Drilling efficiency methods based on the Specific Energy (SE) or Mechanical Specific Energy (MSE) model built on the original work conducted by Teale [24] are routinely used to maximize ROP, lower vibration, and generally reduce the cost of a well. MSE and EST calculations were carried out on both raw and processed time- and depth-based data, as can be seen in Figure 3 and Figure 4. MSE is defined as the mechanical work performed to remove a unit volume of rock. Teale also observed that the minimum specific energy is assumed to be equal to or slightly below the confined compressive strength (CCS) of the drilled rock.
MSE Teale [24]:
where WOB is weight on bit (lbs), RPM is the bit rotation (rpm), TRQ is the surface torque (lbf-ft), ROP is the rate of penetration (ft/h), and AB is the borehole cross-sectional area (in2).
In the above model, surface-measured torque is a key variable. Since the torque is measured at the surface and not at the bit, the calculation of MSE on the basis of this model contains large sources of error. Therefore, it is only used qualitatively as a trending tool.
Several derivatives of the original SE method [6,24,25,27,28], as shown below, have been developed to maximize ROP and attempt to calculate the in-situ rock strength from drilling parameters.
Pessier and Fear [25]:
and
where WOB is weight on bit (lbs), RPM is the bit rotation (rpm), TRQ is the surface torque (lbf-ft), ROP is the rate of penetration (ft/h), AB is the borehole cross-sectional area (in2), DB is the bit diameter (in), and μ is a bit-specific coefficient of sliding friction introduced to express torque as a function of WOB. In Pessier and Fear’s model, the parameters are also obtained from the surface drilling parameters. However, the calculation precision is improved; as a result, it is commonly used in the drilling industry. In this model, the bit torque is calculated through WOB. The WOB data are usually based on the surface measurement, but downhole WOB data can also be used to improve the calculation precision even further.
MSE Dupriest and Koederitz [27]:
Dupriest and Koederitz assumed that peak bit efficiencies are always in the 30–40% range and thus believed that the mechanical efficiency was 35% [27].
EST Hamada [6,28]:
where TRQdr is the drilling component of the surface TRQ (Nm) calculated as the difference between the measured torque TRQm and the background torque TRQb (see below for more details), RPM is the bit rotation (rpm), ROP is the rate of penetration (m/min), and R1 and R2 represent the outer and inner radius of the bit, respectively (m). The EST in Hamada’s model represents the differential stress needed to break the formation and displays the comparability with drilled rock in situ compressive strength [28].
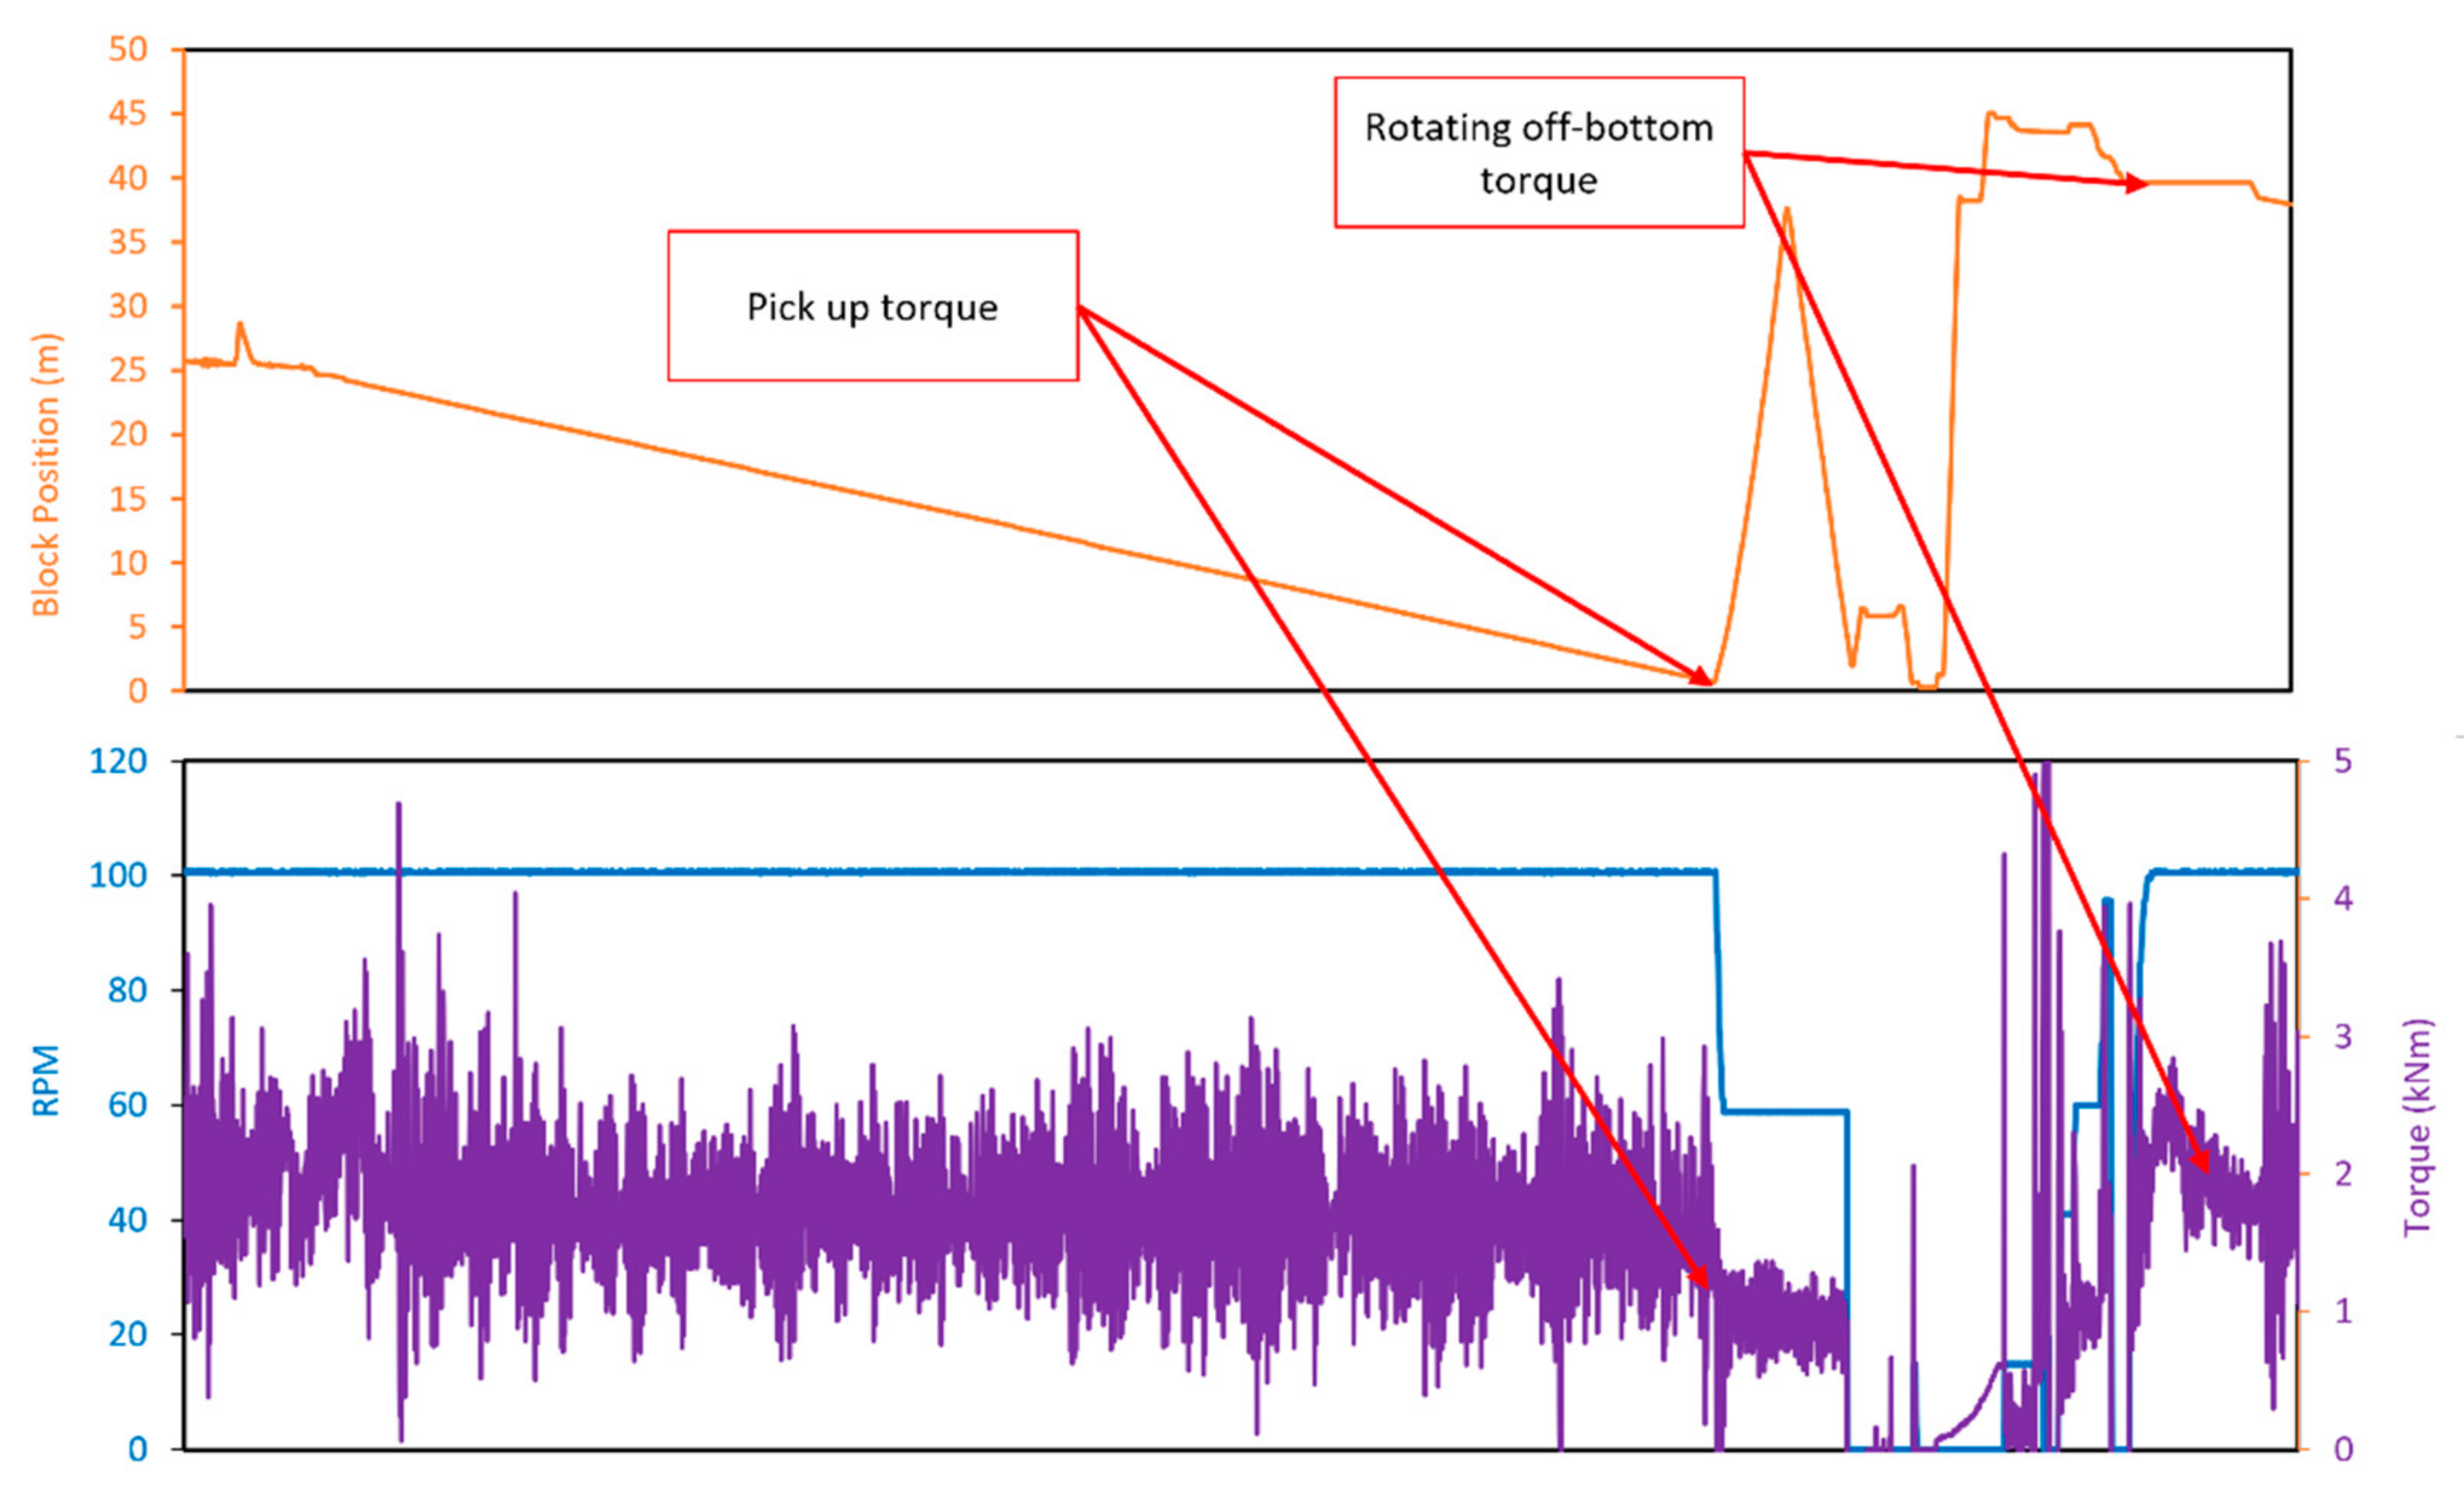
Since both wells were vertical, it was assumed that most of the axial load on the bit, i.e., WOB, RPM, and resultant TRQ, were transferred directly from the top drive to the bit. However, the background TRQ values were required by the EST calculations, in which the force applied to the formation is expressed by the difference between the measured torque TRQm and the background torque TRQb [6]. In order to determine the drilling component of the TRQ measured at the surface, a simple analysis of the pickup and rotating-off-bottom torque (Figure 5) was conducted at every connection. The pickup torque is usually the torque when the drill string has just been picked up off the bottom at the stand down to clean the hole from potentially accumulated cuttings (backream) around the bottom hole assembly (BHA) and seconds before the RPM is reduced to avoid damaging the borehole walls on the way up by fully rotating the BHA. The weight on hook is also collected at that moment for torque and drag calculations.

Figure 5.
An example of selected pick-up off-bottom and rotating off-bottom torque used in off-bottom torque calculations.
The rotating off-bottom torque was collected after the connection was made (a new stand of pipe was added to continue drilling) and the string was out of slips without WOB applied and with full drilling RPM. There was no torque on bit (TOB) either because the bit was not engaged in the formation. These two measurements provide a very good indication of the background torque (and can also provide signs of worsening borehole conditions), such as friction between the borehole walls and the drill string, drill string and drilling fluids, and suspended cuttings or between the drill string and seawater in the case of riserless drilling.
The MSE/EST models are best used as trending tools along with other surface drilling parameters. When a bit is operating at its highest efficiency, the minimum MSE is reached, and it correlates with the CCS of the formation. This correlation can be used in real-time by observing whether the MSE (min) is roughly equal to the CCS of the formation while adjusting drilling parameters such as WOB or RPM to maximize ROP. However, if the MSE (min) increases significantly and is much higher than the CCS of the formation, it suggests that the drilling system is not optimal and that the system is undergoing changes caused by drilled lithology, tectonics, drill string mechanics, operations, etc.
Therefore, MSE/EST methods can be applied in the same way to detect hydrate gas-bearing sediments, which are predicted to have increased in-situ compressive strength due to NGH saturation.
3. Results
With the advent of many drilling operations worldwide in sediments containing gas hydrates, this study aimed to disseminate the usefulness of surface drilling parameters in detecting hydrate-bearing intervals. This might be the first study that exclusively concentrates on time-based surface drilling parameters and MSE/EST methods to define, detect, and understand downhole dynamics and the structure of hydrate-saturated sediments.
3.1. NGHP-02-23A
The drilling operations in the NGHP-02-23A well commenced with no rotation and low drilling fluid flow using the hydraulic force of the fluid leaving the bit nozzles (jetting) for the first 25 m in order to minimize washing out the highly unconsolidated sediments [19]. As the formation became more competent, around 25 mbsf, the rotary speed increased from 0 to 30 rpm for another 10 m before being adjusted to the full drilling rotary speed at 100 rpm. The initial flow rate was set at 1100 L/min and later increased to 1600 L/min from 25 mbsf to 306.5 mbsf. The flow rate was increased by an additional 100 L/min to 1700 L/min to aid borehole cleaning, from 306.5 mbsf to the borehole TD at 378 mbsf. Once the drilling routine was established and the rig was steadily making a hole, most of the surface drilling parameters were kept steady. Under these conditions, sudden changes in torque, SPP, and the ROP, i.e., the presence of drilling breaks, can be the most influential in determining the shift to downhole conditions and lithology.
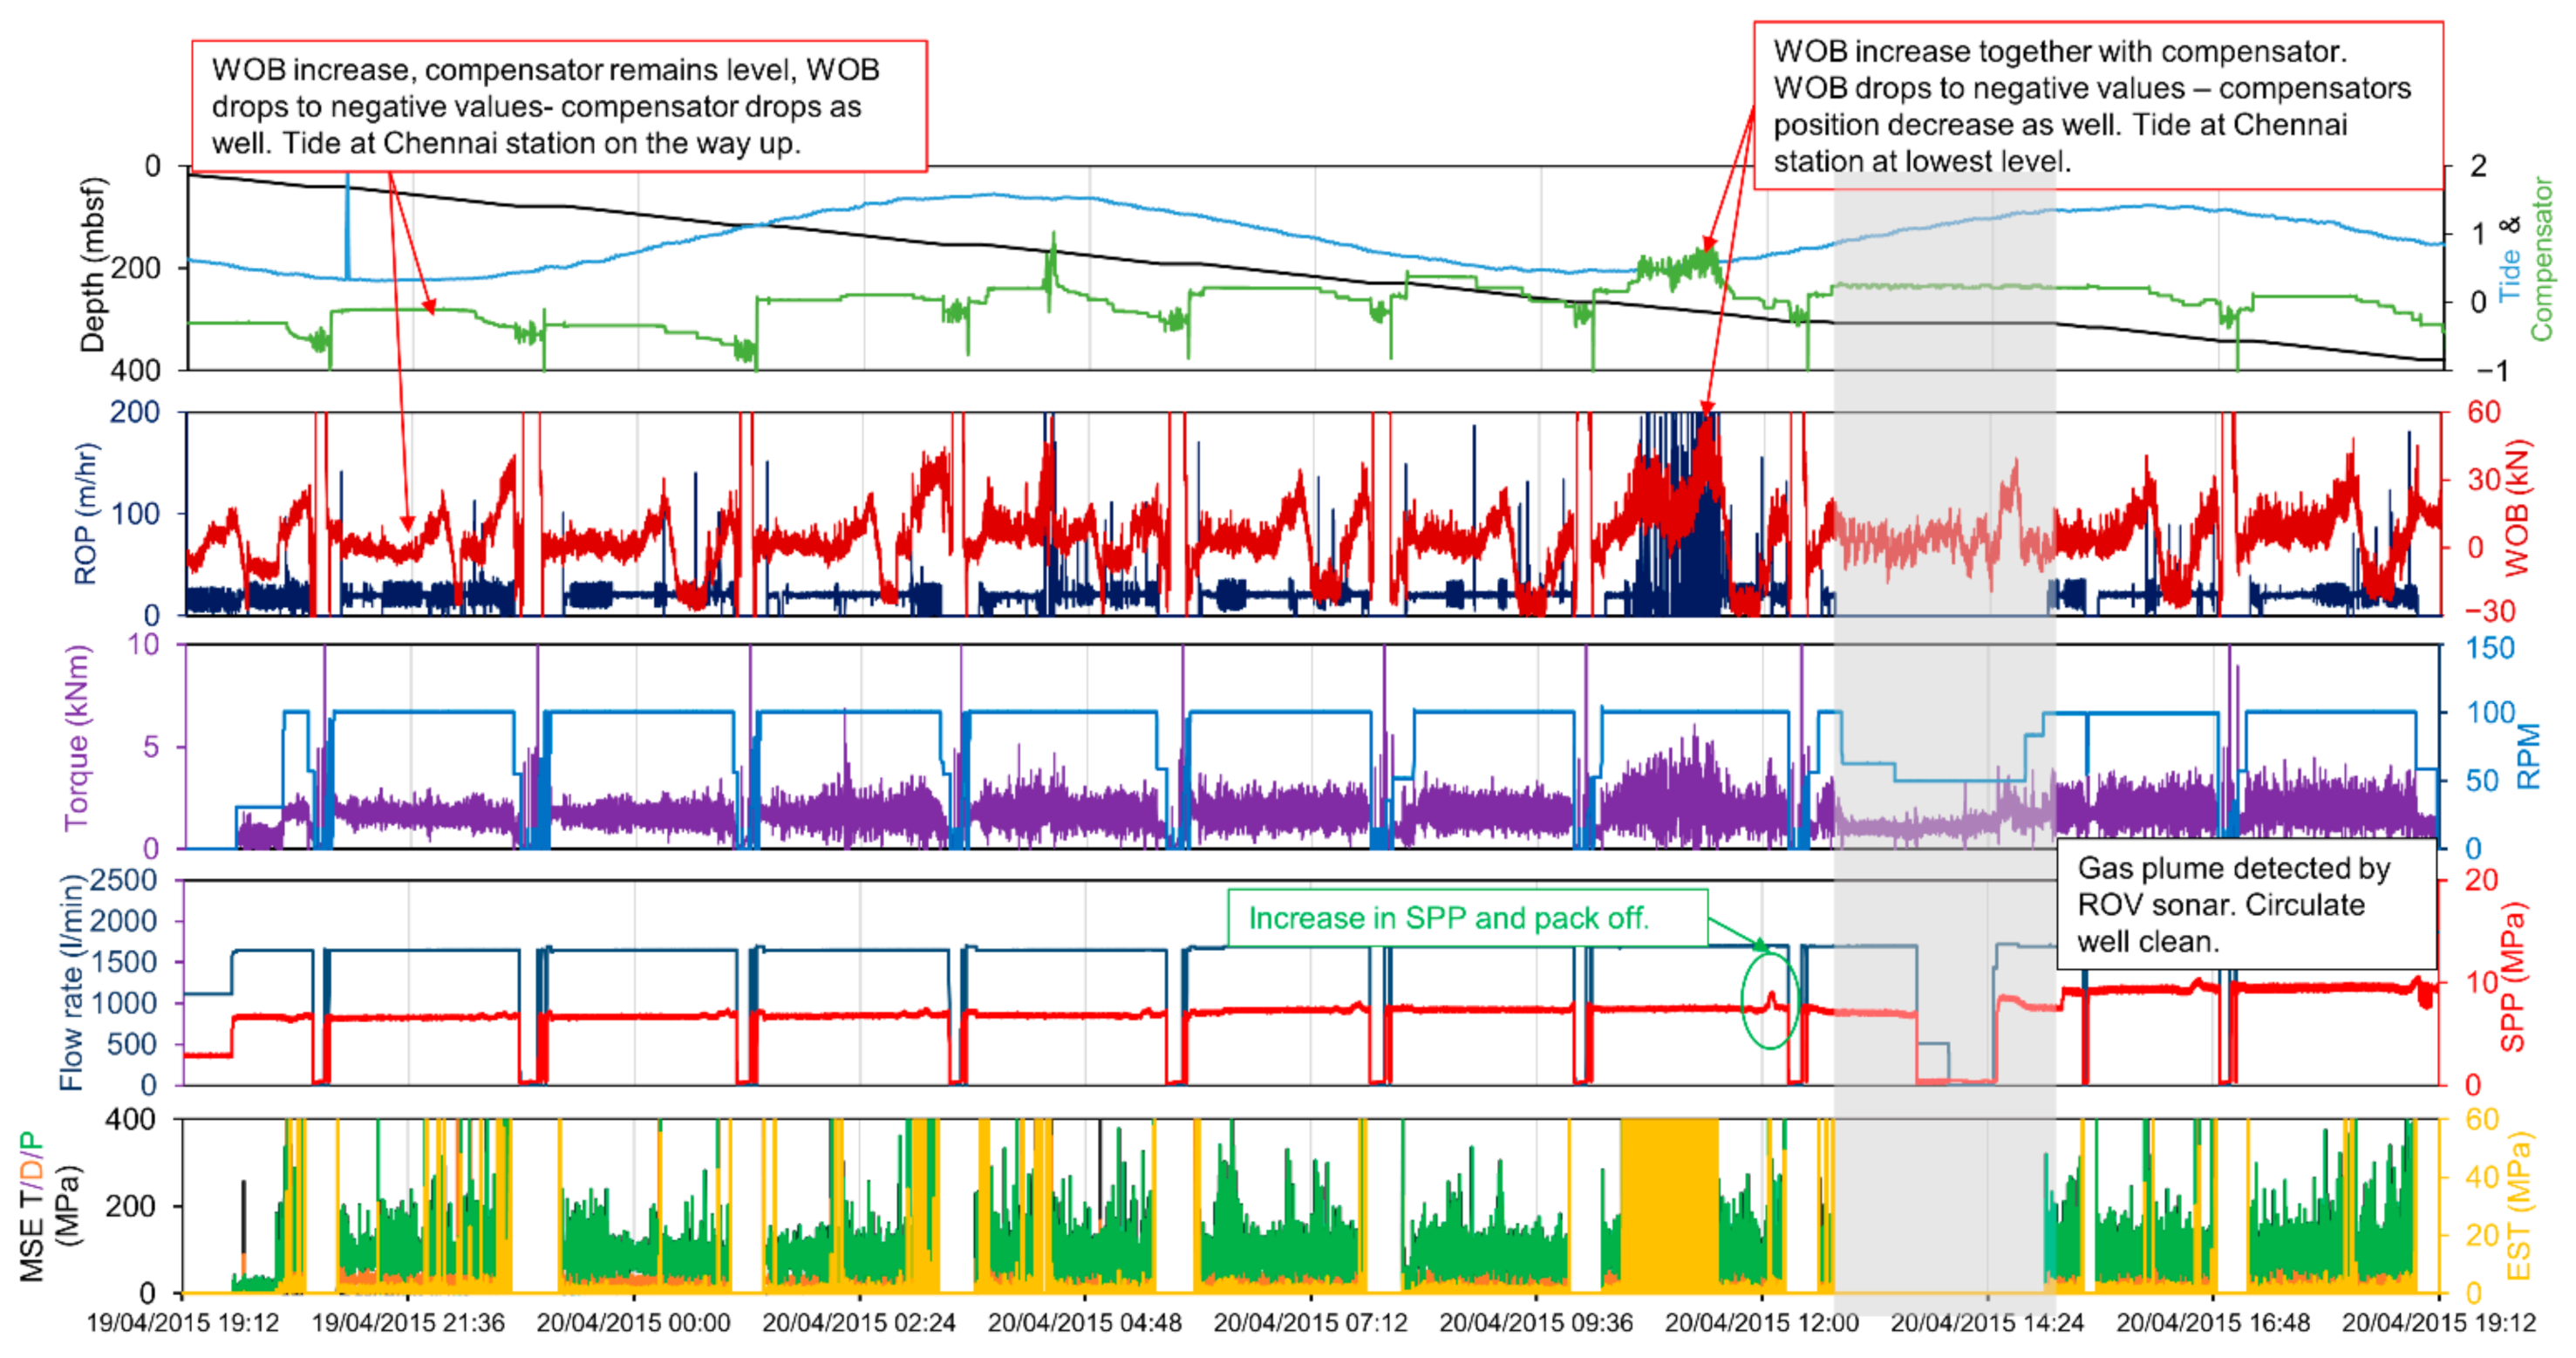
Throughout the drilling of the NGHP-02-23A well, WOB was generally kept low, between 0–10 kN for the first 20 m of every stand. For the remaining 20 m of every stand, WOB rose sharply to 20–40 kN and subsequently dropped to negative 10–30 kN, followed by a rapid increase back to around 30 kN at the stand down. Such a high fluctuation of WOB may be related to tide and heave, as shown in Figure 6, and/or the fact that WOB was controlled to maintain the ROP.

Figure 6.
Correlation of sudden changes in WOB with tide and compensator’s position. Time-based drilling parameters and calculated MSE/EST layout. The grey shaded area indicates time spent on circulating wellbore after spotted gas plume by ROV sonar. The green circle and arrow indicate a sudden increase in SPP and pack-off.
The ROP response to changes in WOB was very incidental, and the general trend of the ROP remained 20–25 m/h throughout the well with some very rapid oscillations of 10–15 m/h. These oscillations in the ROP data can partially be attributed to WOB changes and to drilling through interbedded lithology of potentially very different compressive strengths, coarseness, etc., as can be seen in Figure 7.
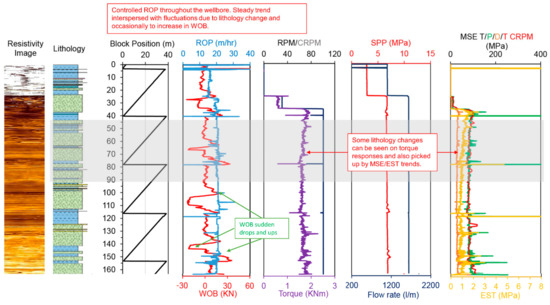
Figure 7.
Correlation of drilling parameters and calculated MSE/EST with drilled lithology (grey shaded area). Green arrows indicate sudden drops and increases in WOB.
TRQ measurements in the well were low, 1–2 kNm, and gradually increased to 2–4 kNm toward the bottom of the well. Some spikes in the TRQ measurements of up to 6 kNm can be seen at 40 m, 60 m, 80 m, 120 m, 130 m, 140 m, 150 m, and 163 m. These can be attributed to downhole changes, most likely lithological (interbedded formations/sand/gravel stringers) or tectonic (occurrence of fracture zones) (Figure 8). Between 266 and 288.6 mbsf, at the start of a new stand, TRQ measurements gradually increased from 1.5 kNm to 5.7 kNm as a result of a steady increase in WOB up to nearly 50 kN for the first 20 m of that stand before dropping to negative values. The resultant ROP also increased and oscillated as WOB increased. No change was seen in the surface RPM. The MWD/LWD collar rotary sensor, however, detected some fluctuations in rotary speed (Figure 8). The increase in WOB may be attributed to an attempt made by the drilling crew/auto driller to maintain the ROP at around 20–25 m/h, or it could explained by the drilling vessel going through a change between low and high tide, forcing the drill string deeper into the formation as the drilling vessel moved downward (Figure 6), or encountering an interval of greater compressive strength, requiring a higher WOB to drill through it. The drilling optimization trends maintained approximately steady values of 85–90 MPa and 1 MPa for MSE and EST, respectively, toward the bottom of the well. There were, however, some noteworthy peaks recorded at 40 m, 60 m, 80 m, 120 m, 130 m, 140 m, and 150–165 m intervals (Figure 7) that correspond to the bit and the drill string drilling through the interbedded lithology in the wellbore. The first gas hydrate interval, as defined by MWD/LWD tools between 165.3 mbsf and 198.5 mbsf, did not exhibit a significant change in the MSE/EST trend. There were two smaller peaks at 175 mbsf and 190 mbsf, respectively, which can be correlated with drilling through a stringer. The most significant increase in MSE and EST readings to approximately 400 MPa and 4 MPa, respectively, occurred between 270 and 288.6 mbsf, indicating that the drill string and bit underwent dynamic changes.
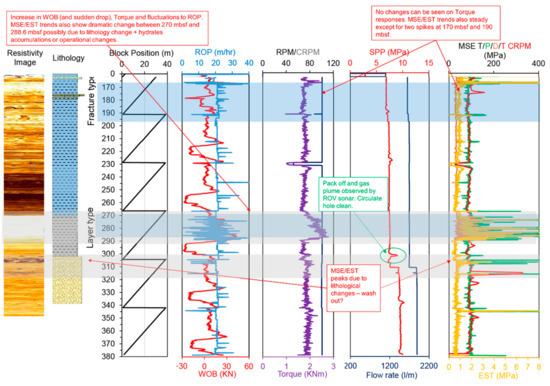
Figure 8.
Correlation of drilling parameters and calculated MSE/EST with drilled lithology (blue and grey shaded areas). The green circle and arrow indicate a sudden increase in SPP and potential pack-off.
The interval, as was later confirmed with the MWD/LWD responses and subsequent observance of a gas plume release from the borehole, consisted of highly concentrated gas hydrate accumulations in sand-rich reservoir systems that altered the physical properties of the sediment [2], making it much denser and, therefore, more difficult to drill than it would usually be. Drilling continued to stand down at 306 mbsf, where a spike in SPP indicated a potential pack-off (Figure 8). A gas plume at the same depth was detected by the ROV sonar. The drilling was halted, and the hole was circulated for two hours. The drilling of the NGHP-02-23A well resumed with set drilling parameters and increased flow rate from 1640 L/min to 1770 L/min without further problems to well TD at 378 mbsf.
3.2. U1517A
Figure 9 shows the drilling operations in well U1517A commenced with a low rotary speed and a very low drilling fluid flow using the hydraulic force to initiate the removal of the unconsolidated shallow sediments during the first 16 m and minimize washing out [22].

Figure 9.
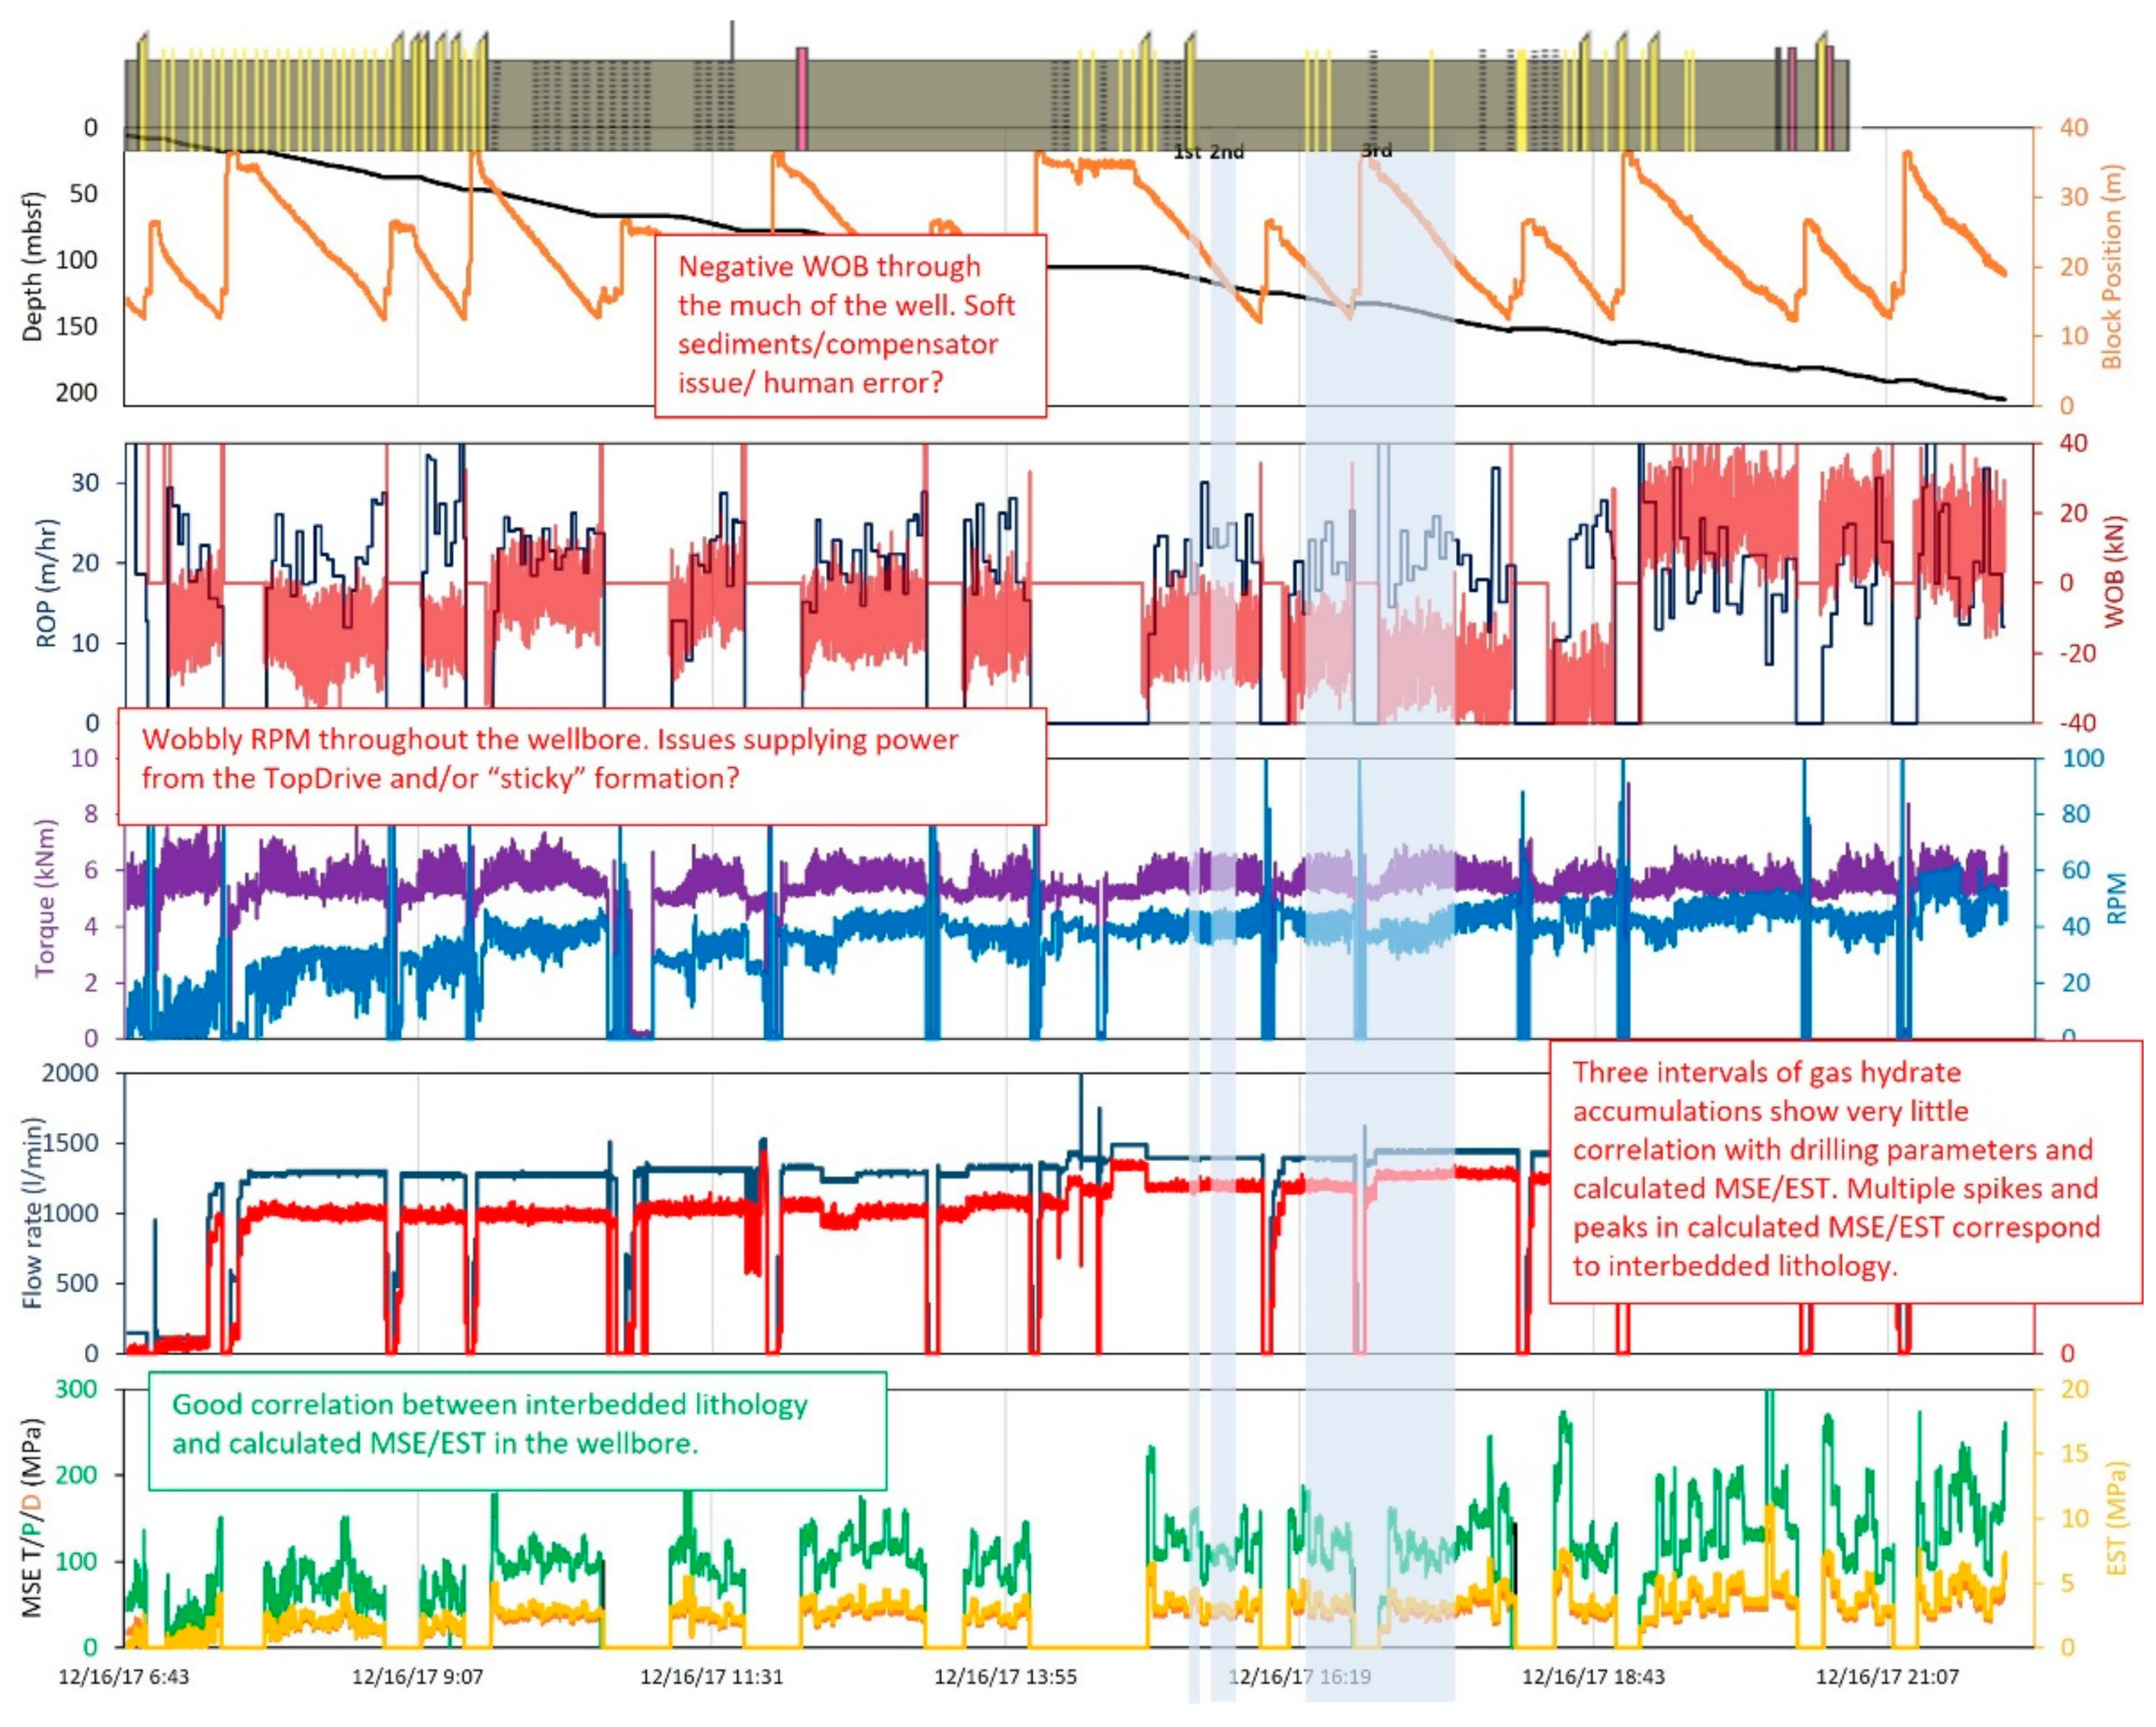
Time-based series for wellbore U1517A. Shaded areas present the three gas hydrate intervals detected in the wellbore by MWD/LWD logging tools.
From 16 mbsf onwards, the flow rate increased to 1265 L/min, and the rotary speed was increased to 20 rpm while drilling down to 36 mbsf. The rotary speed was adjusted again to 40–60 rpm for the remainder of the drilling process (Figure 9). Weight on bit in the U1517A well, as shown in Figure 9 and Figure 10, was negative throughout much of the drilling, with just two short intervals of 50–66 mbsf and 67–77 mbsf in which WOB was positive (0–15 kN). Drilling from 161 mbsf onward showed WOB values between 0 and 40 kN, although they gradually decreased to 10 kN toward the bottom of the wellbore. The ROP throughout the drilling of the well was maintained around 20 m/h, with multiple intervals as low as 9 m/h and as high as 30 m/h.
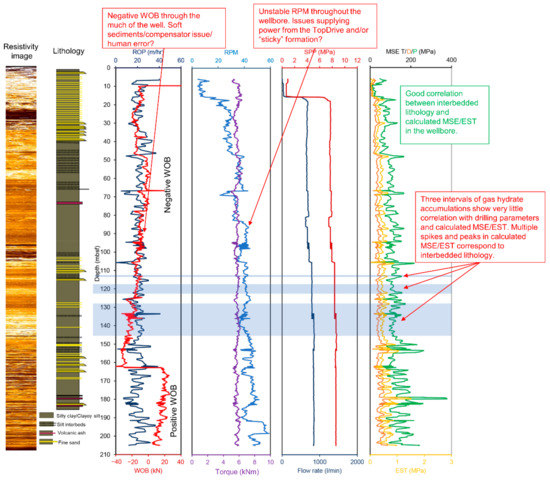
Figure 10.
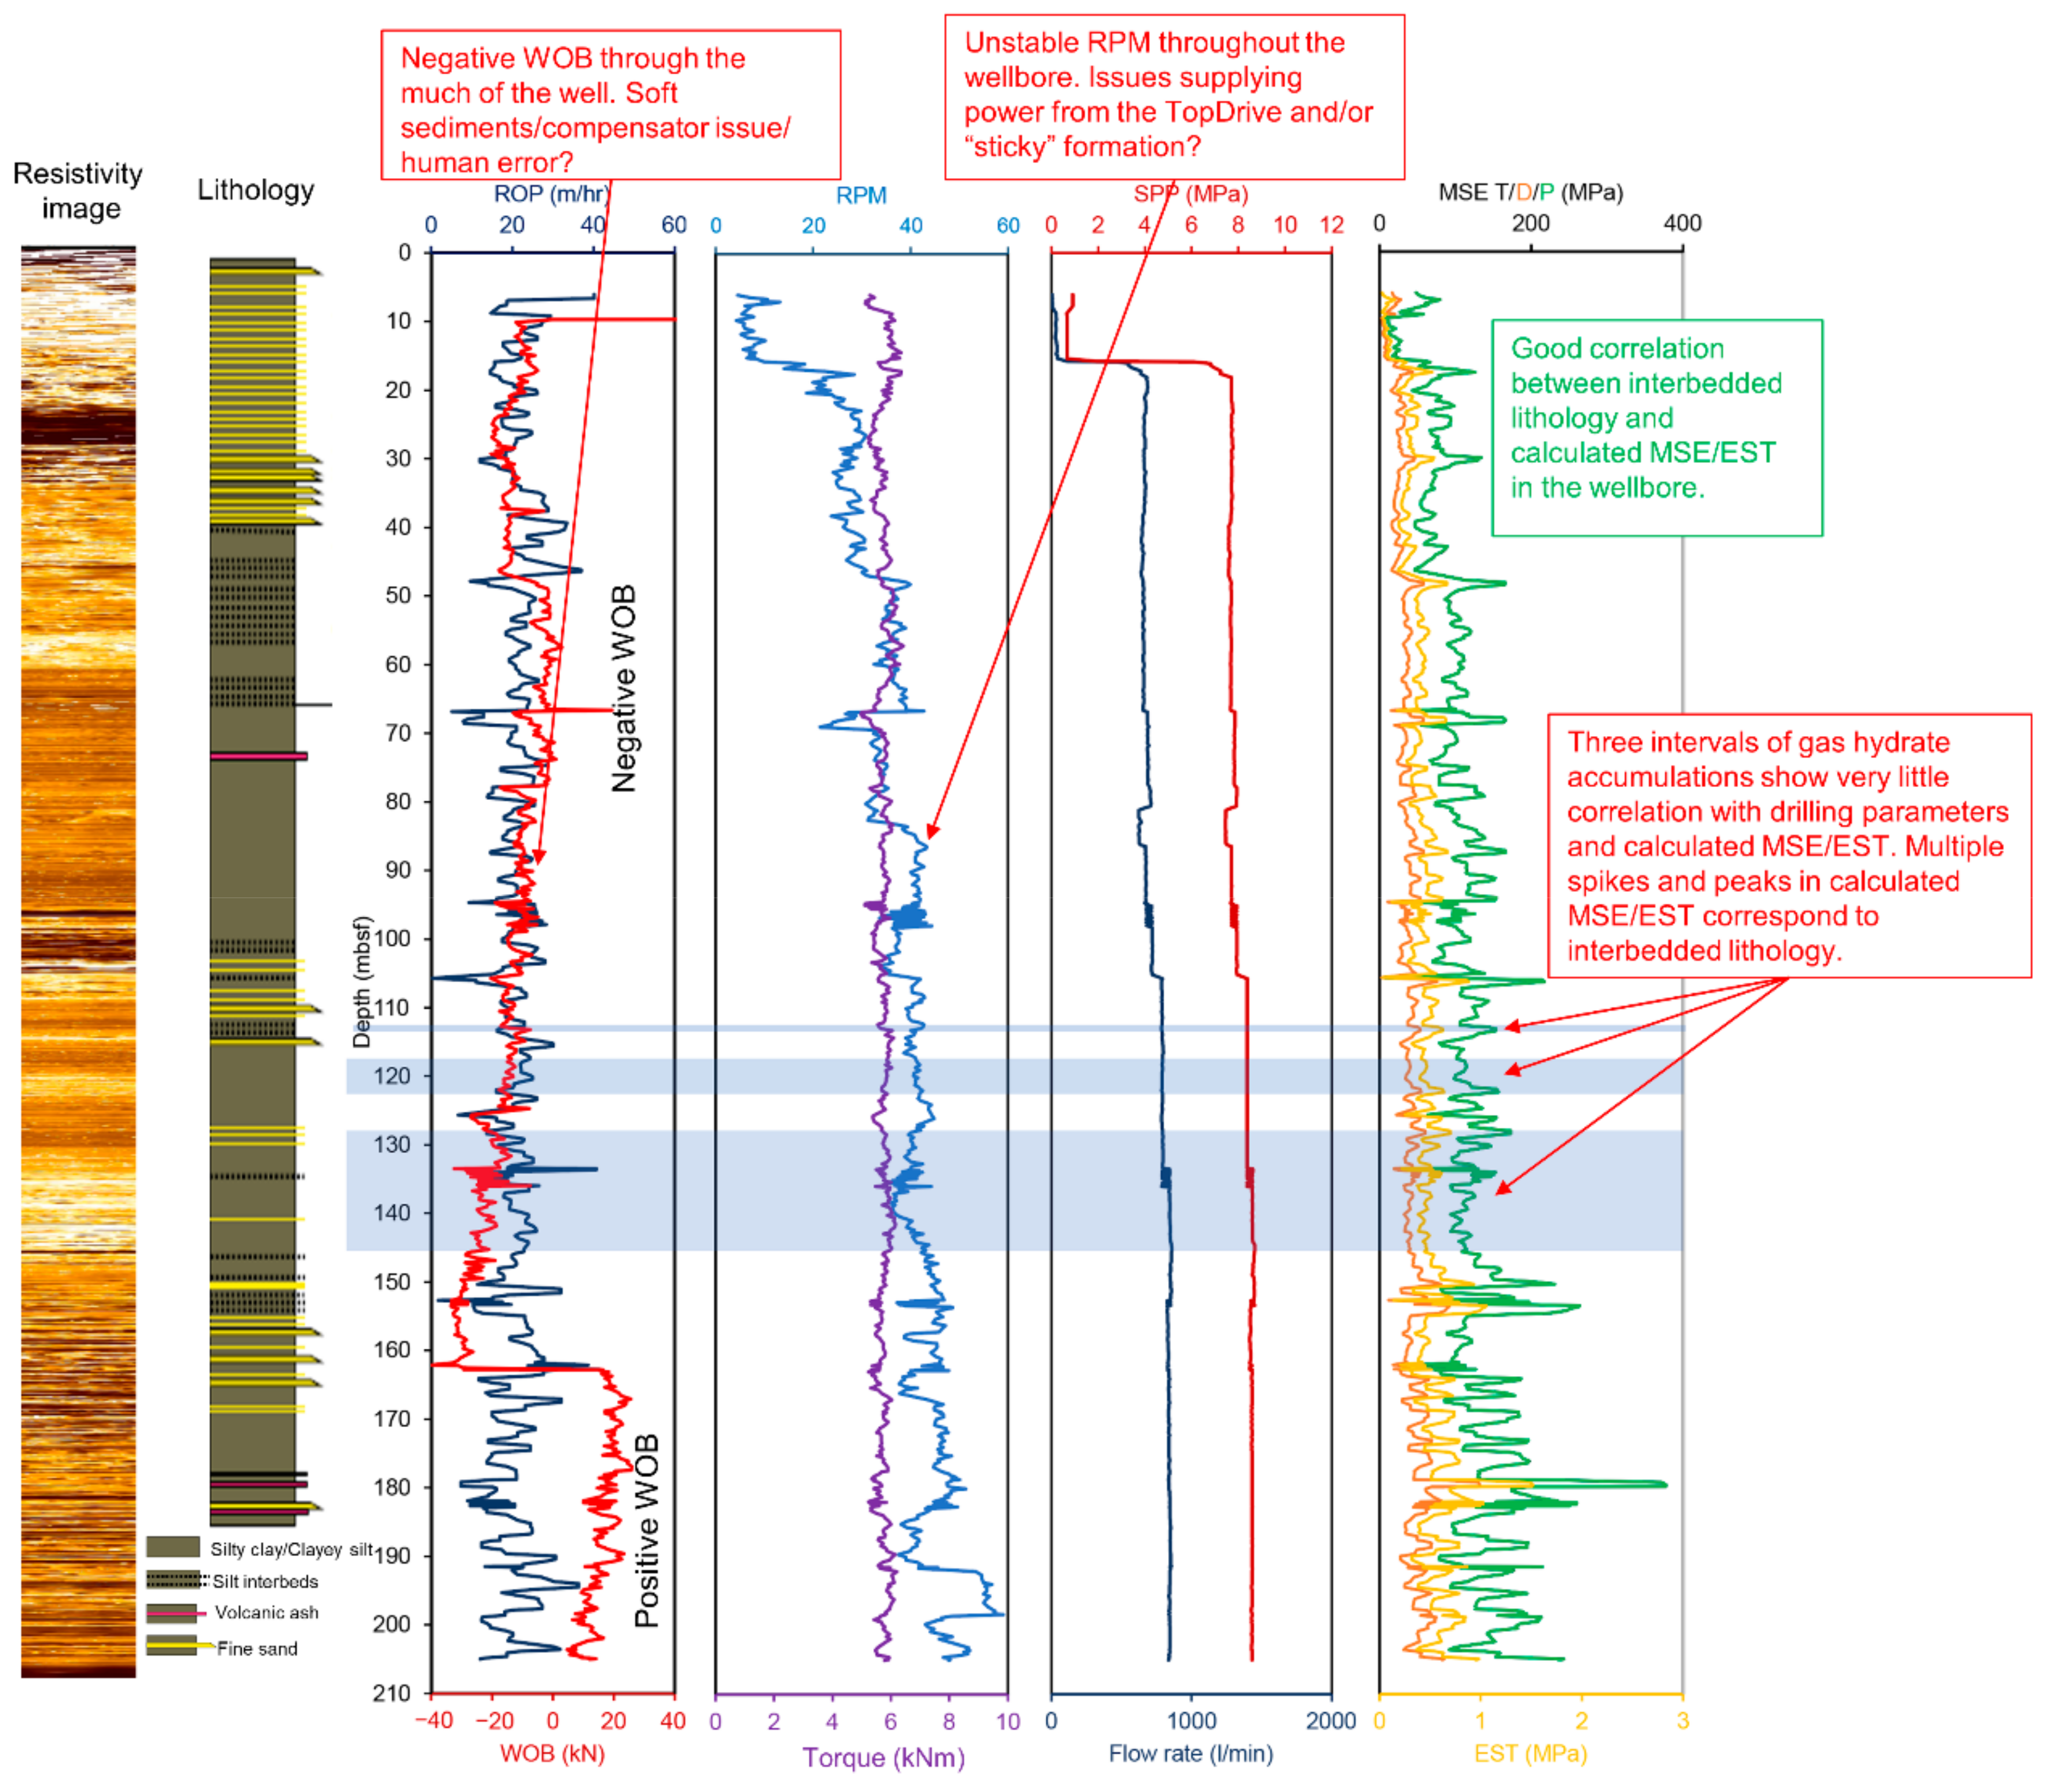
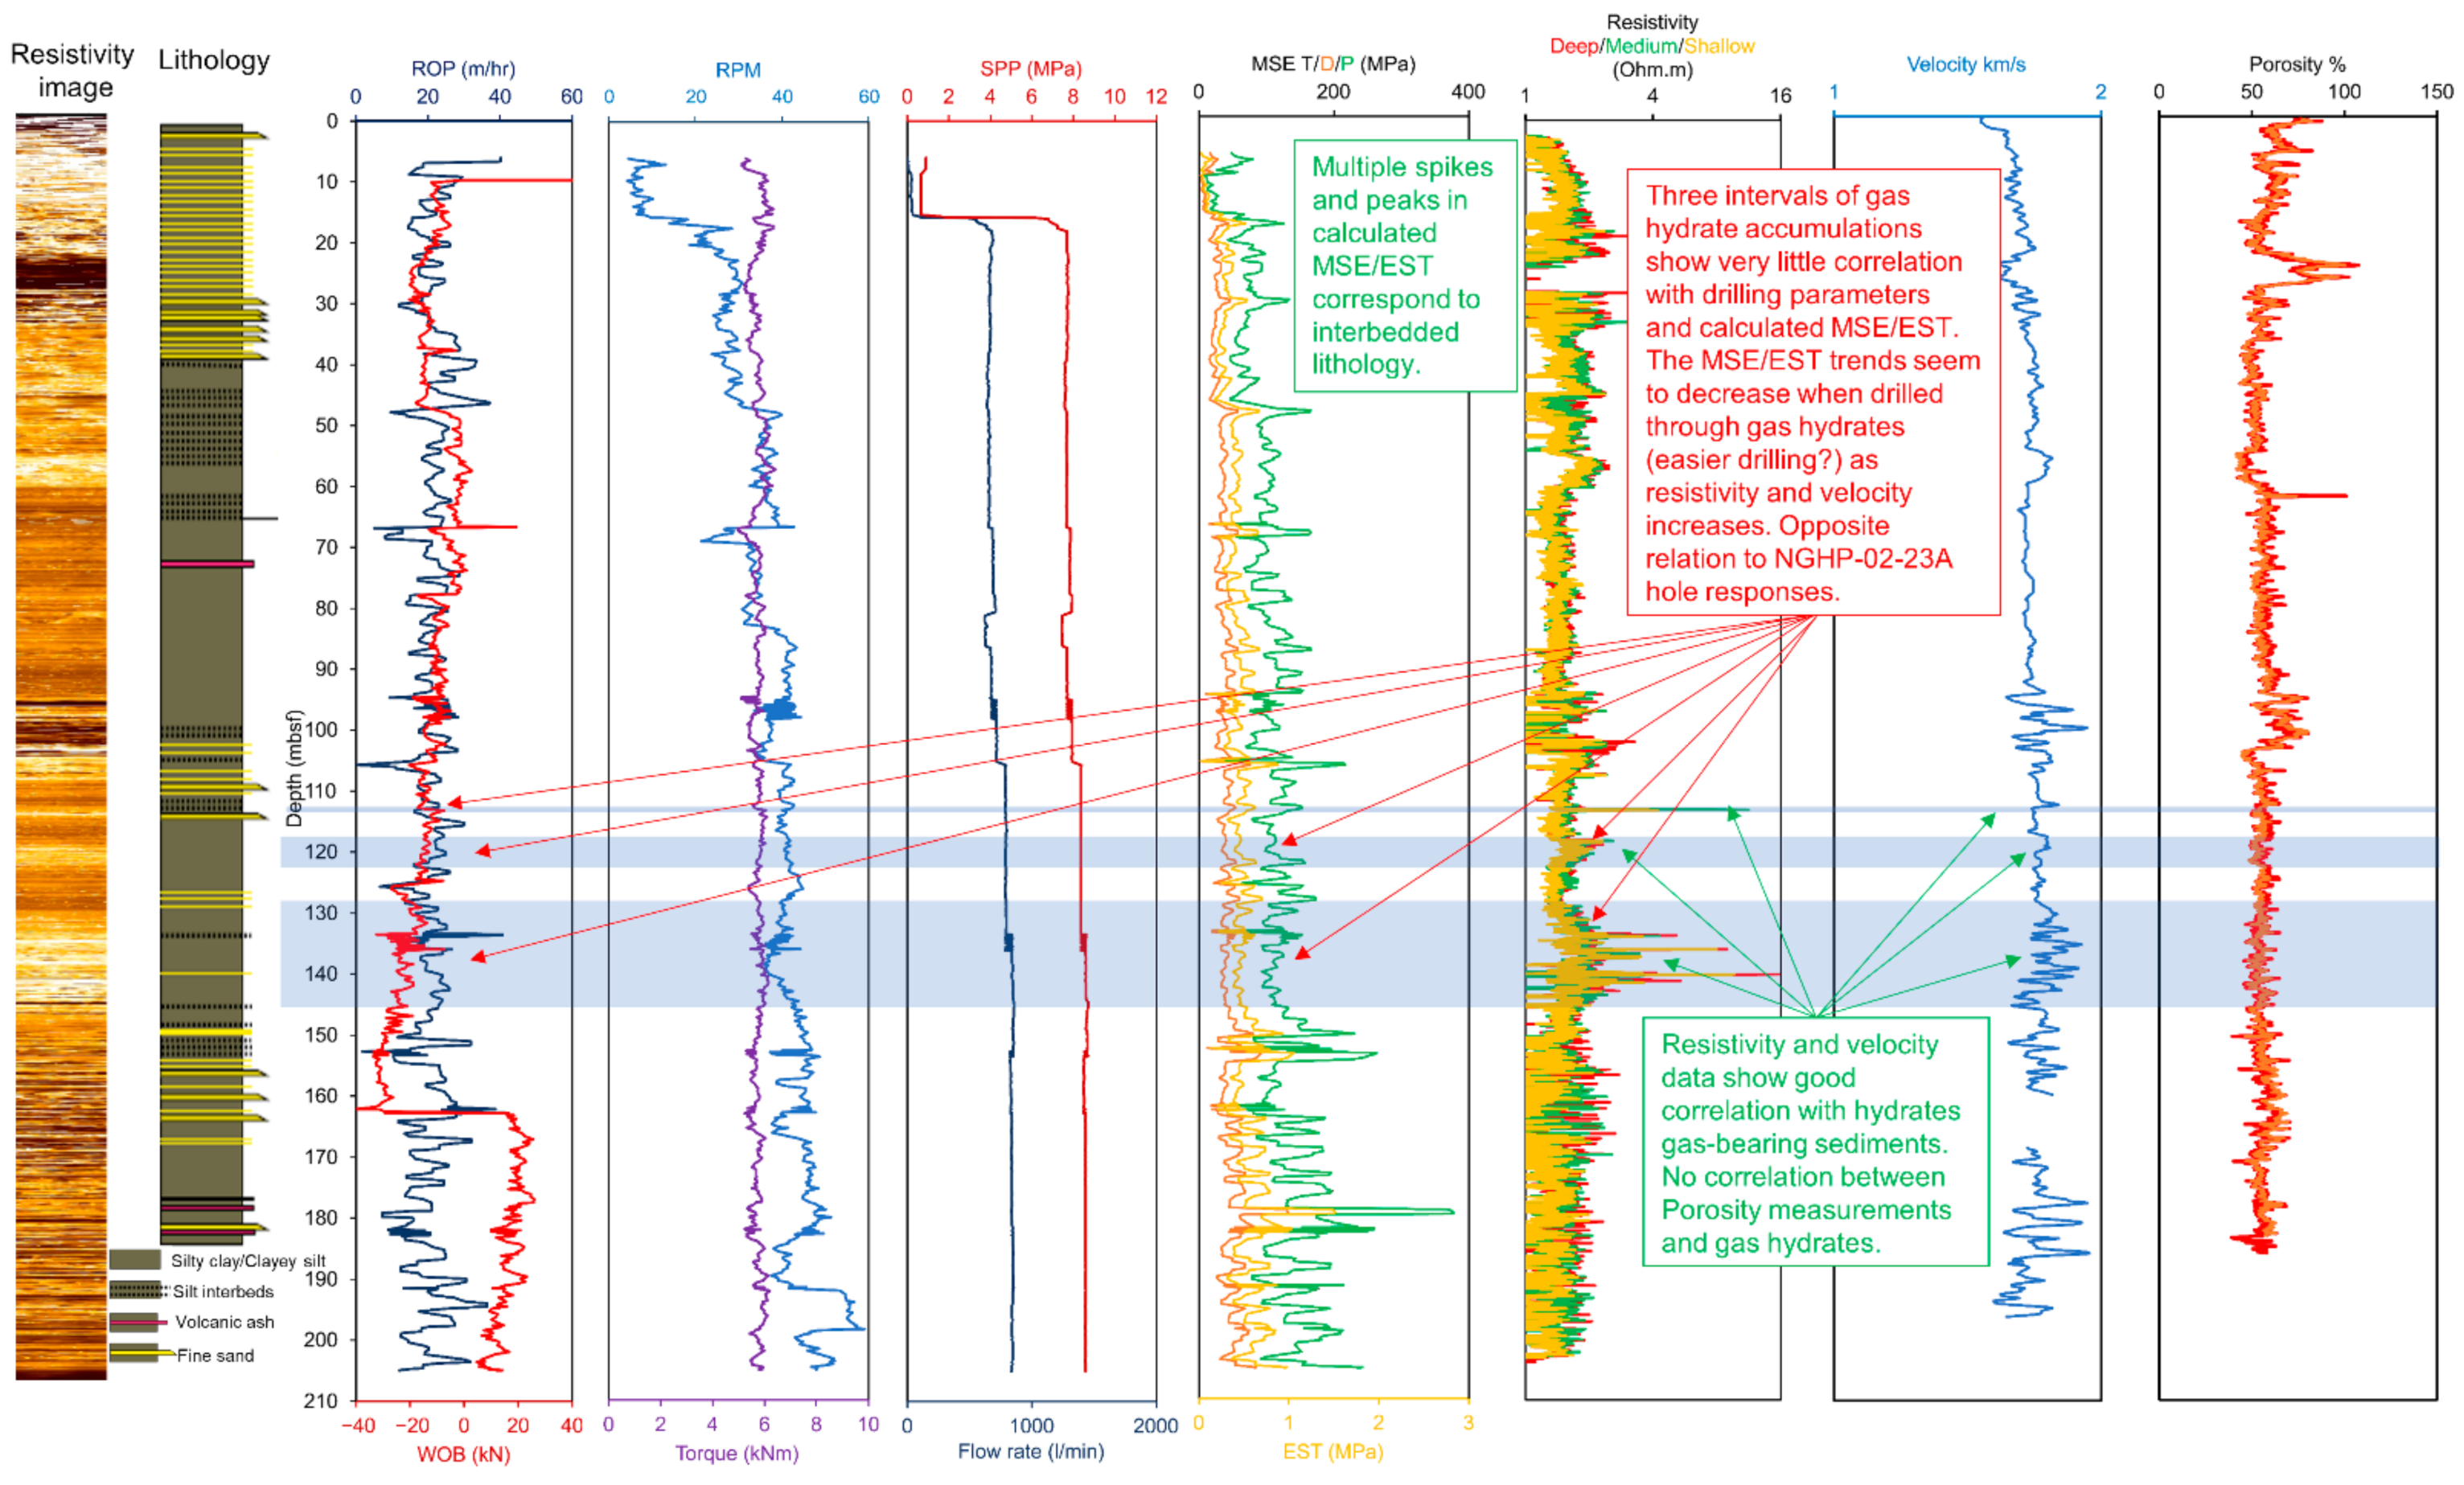
Depth-based series for wellbore U1517A correlated with lithology column and resistivity image. Shaded areas present the three gas hydrate intervals detected in the wellbore by MWD/LWD logging tools.
Throughout the drilling of the U1517A well, the rotary speed was constantly being adjusted, suggesting underlying issues with available power from the top drive and/or a very “sticky” formation downhole that momentarily slowed down the rotary movement just seconds before releasing it back. The resultant torque measurements showed a mirror-like pattern to RPM, suggesting that a higher rotary speed could have improved and smoothened overall drilling operations (Figure 10).
The MSE/EST trends in both time-based and depth-based calculations show a steadily increasing baseline with multiple peaks of varying amplitude and a relatively good correlation between the drill string/bit and interbedded lithology (Figure 10).
The three gas hydrate intervals at 113–113.3 mbsf, 117.5–121 mbsf, and 128–145 mbsf, although defined by MWD/LWD data, were not so clearly defined in the recorded surface drilling parameters and MSE/EST (Figure 10 and Figure 11).
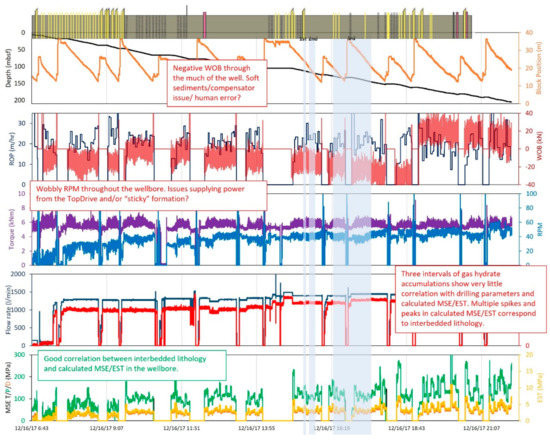
Figure 11.
Time-based series for wellbore U1517A correlated with lithology column. Shaded areas present the three gas hydrate intervals detected in the wellbore by MWD/LWD logging tools.
When looking at the macro scale of the logs, it is possible to notice a high amplitude waveform superimposed in all the recorded data. It is believed that these high oscillations in the data are related to the heave and work of the drilling vessel compensator.
4. Discussion and Interpretation
The time-based drilling data and MSE/EST trends in the NGHP-02-23A borehole allowed a detailed correlation with MWD/LWD responses, such as resistivity along the whole wellbore, as seen in Figure 12. Some high values and deviations were seen in the drilling parameters and MSE/EST models from the established trends, especially inside the hydrate-bearing intervals (e.g., 270–288.6 mbsf), corresponding well with resistivity responses. Other peaks and deviations in the drilling parameters and MSE/EST models were less pronounced (e.g., 165.3–198.5 mbsf) but still correlated with increased resistivity responses indicated as GHBS. The presence of highly saturated GHBS was later confirmed when the ROV’s sonar detected a gas plume on the sea floor, and the borehole needed to be circulated clean.

Figure 12.
Depth-based drilling data series for wellbore NGHP-02-23A correlated with image log and lithology column (left side of the plot) and resistivity data (right side). Shaded areas present the two gas hydrate intervals detected in the wellbore by MWD/LWD logging tools.
Other sharp peaks and increases in ROP, torque, and WOB along the borehole seemed to correlate well with interbedded lithology, as seen in the lithology column and image log in Figure 12. Very little response or correlation to these peaks could be seen on the resistivity log (Figure 12).
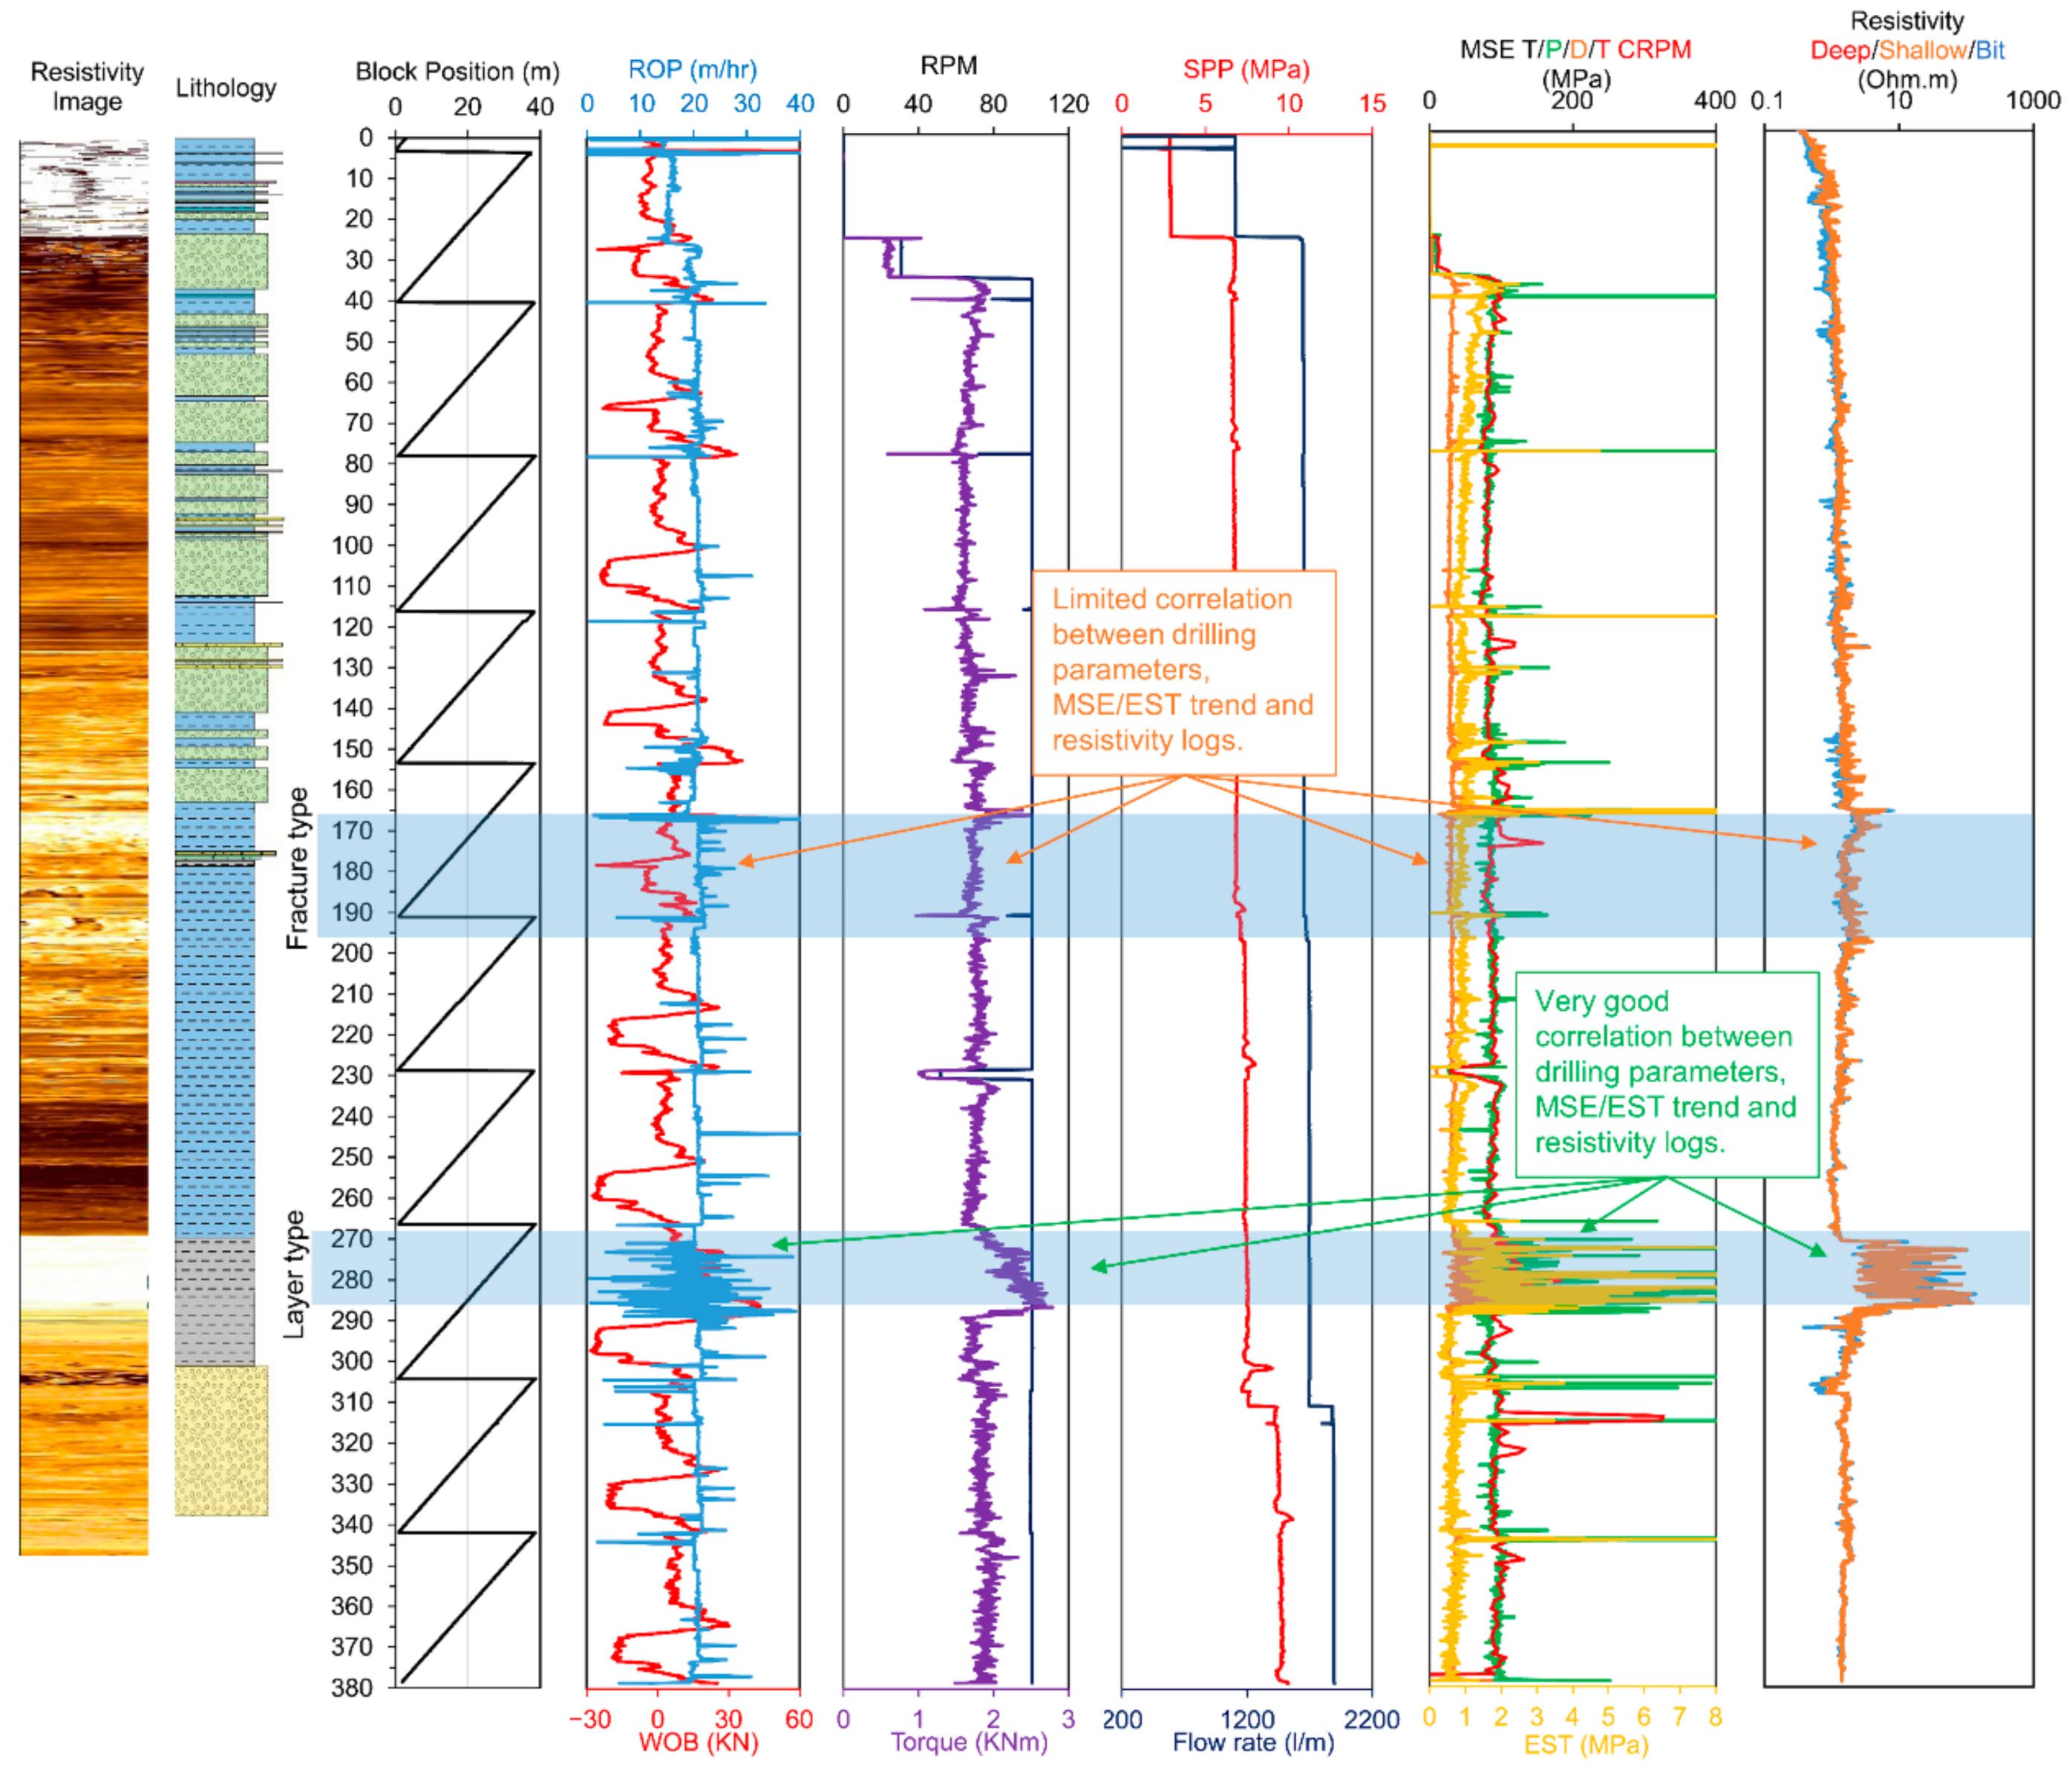
The U1517A well drilling data analysis, however, showed very little correlation between drilling parameters and MSE/EST trends and MWD/LWD (resistivity, sonic, porosity) responses, as seen in Figure 13.

Figure 13.
Depth-based drilling data series for wellbore U1517A correlated with image log and lithology column (left side of the plot), resistivity, sonic, and porosity data (right side). Shaded areas present the three gas hydrate intervals detected in the wellbore by MWD/LWD logging tools.
The MSE/EST trends gradually increased over time, with multiple peaks throughout. Those peaks in the MSE/EST trends seemed to correspond well with interbedded lithology only when compared with the lithology and image logs (Figure 13). The trends of the MSE/EST models with the three hydrate-bearing intervals at 113–113.3 mbsf, 117.5–121 mbsf, and 128–145 mbsf showed lower responses compared with the NGHP-02-23A, suggesting that the GHBSs were softer and weaker, i.e., easier and more efficient to drill. Although there was little correlation between the surface drilling parameters and the resistivity, sonic, and porosity responses in the borehole, the lower MSE/EST responses in the gas hydrate-bearing intervals may suggest otherwise.
The observed differences in both the surface drilling parameters and MSE/EST models (high values and trends in NGHP-02-23A borehole, no change or lower values and trends in U1517A) and the MWD/LWD responses to hydrate gas-bearing sediments may be related to local variations in the hydrate gas saturation, local lithology, formation texture, and drill bits used to drill the wellbores, as every drill bit has its own cutting structure and signature.
Nonetheless, the current analysis provides both the operators and researchers with a new option for GHBS detection, as often, the surface drilling parameters are overlooked in favor of more expensive logging tools. They can, however, be used locally in gas hydrate field appraisal and development, building a database that could enhance knowledge and reduce cost in future drillings. The drilling parameters can be used on par with logging data, helping with and complementing hydrates assessment. They are also invaluable when collecting cores, as no logging data are available during the operations.
With the advent of machine learning and high-frequency data sampling rates, it may, in the near future, be possible to use the drilling parameters and associated drilling signatures of the bits to drill for hydrates. The use of machine learning and high-frequency sampling can allow for building a database in which all available data, including drilling responses from various boreholes in each field, can be stored and analyzed, providing a better and fuller picture of GHBS delineation and extent. High-frequency sampling combined with large databases, machine learning algorithms, and AI will allow the filtering of the received data and a focus on, for example, the lithological component, hydrate gas saturation, or the prediction of where the next GHBS can be found. Additionally, with the use of specially designed and instrumented collars installed near the bit (Halliburton’s Cerebro in-bit package) [30], measuring the rock’s mechanical properties can also be used to collect and train, in real-time, AI with machine learning algorithms in order to detect changes in the lithology, gas saturation, type of drilling dysfunction (vibration), etc. Utilizing underwater drilling robots, such as those operated by the MARUM Research Center for Marine Environmental Sciences at Bremen University, the German-owned MEBO200 [31,32,33], the JAMSTEC (Japan-owned) Boring Machine System (BMS), and Fugro’s Seafloor Drill II (SFDII), seem to be ideal tools for future drilling. These seafloor drilling machines can remotely drill/core/log from the research vessel in water depths of up to 3000 m (4000 m in the case of Fugro’s SFDII) and 200 m for MEBO200, 150 m for SFDII, and 60 m in the case of BMS. Both machines record drilling parameters in real-time and can potentially be equipped with specially designed and instrumented near-bit collars, which can be used to detect, for example, sediments saturated with gas hydrates. Such an arrangement will significantly reduce the cost of the appraisal part of the hydrate assessment using a drillship or a semisubmersible.
5. Conclusions
Two wells with hydrate-bearing sediments were drilled with highly sophisticated MWD/LWD tools during two scientific expeditions, 372A and NGHP-02. In this paper, we analyzed the surface drilling parameters that were continuously recorded during the drilling process.
Our analysis focused on time-based drilling data in which the whole process of drilling and downhole changes could be observed and complemented with depth-based data when necessary. The results of the analysis suggest that the drilling parameters, as well as MSE/EST methods, can be used to monitor and optimize the drilling process and to detect lithological/tectonic (fractures, fault zones, rock hardness, etc.) changes in the drilled substratum and signs of the dynamic changes in the downhole environment (tool vibration, washouts, pack-offs, etc.).
However, the drilling data, along with the MSE/EST models, cannot absolutely confirm hydrates gas-bearing sediments. This qualitative analysis on whether the drilled sediments consist of hydrates can only be determined using an MWD/LWD suite of tools, preferably located as close as possible to the bit, or by coring.
Author Contributions
Conceptualization, A.W.; methodology A.W.; formal analysis, A.W.; investigation, A.W.; data curation, M.K.; writing—original draft preparation, A.W. and M.K.; supervision, M.K.; project administration, M.K. All authors have read and agreed to the published version of the manuscript.
Funding
This research received no external funding.
Institutional Review Board Statement
Not applicable.
Informed Consent Statement
Not applicable.
Data Availability Statement
All data are available from the authors upon request.
Acknowledgments
This research used samples and data from Expedition 372 provided by the International Ocean Discovery Program. The authors are grateful to the Ministry of Petroleum and Natural Gas of the Government of India, Oil and Natural Gas Corporation Limited (ONGC), the Directorate General of Hydrocarbons (DGH), and all other NGHP partner organizations for providing the opportunity to contribute to the NGHP-02 Expedition and this Special Issue of Energies. The authors wish to thank two anonymous reviewers for their comments on an earlier version of this paper. The authors wish to thank Sean Toczko of JAMSTEC for his comments and English review of this paper. The authors wish to thank Yohei Hamada of JAMSTEC for sharing his data related to EST procedure and calculation.
Conflicts of Interest
The authors declare that they have no conflict of interest.
References
- Xu, C.-G.; Li, X.-S. Research Progress on Methane Production from Natural Gas Hydrates. RSC Adv. 2015, 5, 54672–54699. [Google Scholar] [CrossRef]
- Kvenvolden, K.A.; Lorenson, T.D. The Global Occurrence of Natural Gas Hydrate. Geophys. Monogr. Ser. 2000, 124, 3–18. [Google Scholar] [CrossRef]
- Kvenvolden, K.A. Methane Hydrate—A Major Reservoir of Carbon in the Shallow Geosphere? Chem. Geol. 1988, 71, 41–51. [Google Scholar] [CrossRef]
- Gabitto, J.F.; Tsouris, C. Physical Properties of Gas Hydrates: A Review. J. Thermodyn. 2010, 2010, 271291. [Google Scholar] [CrossRef] [Green Version]
- Du Frane, W.L.; Stern, L.A.; Weitemeyer, K.A.; Constable, S.; Pinkston, J.C.; Roberts, J.J. Electrical Properties of Polycrystalline Methane Hydrate. Geophys. Res. Lett. 2011, 38, 2–6. [Google Scholar] [CrossRef]
- Hamada, Y.; Hirose, T.; Saito, S.; Moe, K.; Wu, H.Y.; Tanikawa, W.; Sanada, Y.; Nakamura, Y.; Shimmoto, Y.; Sugihara, T.; et al. Equivalent Formation Strength as a Proxy Tool for Exploring for the Location and Distribution of Gas Hydrates. Mar. Pet. Geol. 2019, 108, 356–367. [Google Scholar] [CrossRef]
- Merey, Ş. Drilling of Gas Hydrate Reservoirs. J. Nat. Gas Sci. Eng. 2016, 35, 1167–1179. [Google Scholar] [CrossRef]
- Boswell, R.; Collett, T.S. Current Perspectives on Gas Hydrate Resources. Energy Environ. Sci. 2011, 4, 1206–1215. [Google Scholar] [CrossRef]
- Li, X.S.; Xu, C.G.; Zhang, Y.; Ruan, X.K.; Li, G.; Wang, Y. Investigation into Gas Production from Natural Gas Hydrate: A Review. Appl. Energy 2016, 172, 286–322. [Google Scholar] [CrossRef] [Green Version]
- McConnell, D.R.; Zhang, Z.; Boswell, R. Review of Progress in Evaluating Gas Hydrate Drilling Hazards. Mar. Pet. Geol. 2012, 34, 209–223. [Google Scholar] [CrossRef]
- Wang, F.; Zhao, B.; Li, G. Prevention of Potential Hazards Associated with Marine Gas Hydrate Exploitation: A Review. Energies 2018, 11, 2384. [Google Scholar] [CrossRef] [Green Version]
- Kvalstad, T.J.; Andresen, L.; Forsberg, C.F.; Berg, K.; Bryn, P.; Wangen, M. The Storegga Slide: Evaluation of Triggering Sources and Slide Mechanics. Mar. Pet. Geol. 2005, 22, 245–256. [Google Scholar] [CrossRef]
- Hornbach, M.J.; Lavier, L.L.; Ruppel, C.D. Triggering Mechanism and Tsunamogenic Potential of the Cape Fear Slide Complex, U.S. Atlantic Margin. Geochem. Geophys. Geosyst. 2007, 8, 1722. [Google Scholar] [CrossRef] [Green Version]
- Li, L.; Lei, X.; Zhang, X.; Sha, Z. Gas Hydrate and Associated Free Gas in the Dongsha Area of Northern South China Sea. Mar. Pet. Geol. 2013, 39, 92–101. [Google Scholar] [CrossRef]
- Nair, V.C.; Gupta, P.; Sangwai, J.S. Gas Hydrates as a Potential Energy Resource for Energy Sustainability. In Sustainable Energy Technology and Policies: A Transformational Journey; De, S., Bandyopadhyay, S., Assadi, M., Mukherjee, D.A., Eds.; Springer: Singapore, 2018; Volume 1, pp. 265–287. ISBN 978-981-10-7188-1. [Google Scholar]
- Klar, A.; Deerberg, G.; Janicki, G.; Schicks, J.; Minshull, T.; Riedel, M.; Fietzek, P.; Mosch, T.; Tinivella, U.; De La Fuente, M.; et al. Gas Hydrate Technology: State of the Art and Future Possibilities for Europe; COST European Cooperation in Science and Technology: Brussels, Belgium; MIGRATE Marine Gas Hydrate: Kiel, Germany, 2017. [Google Scholar]
- Collett, T.S.; Boswell, R.; Waite, W.F.; Kumar, P.; Roy, S.K.; Chopra, K.; Singh, S.K.; Yamada, Y.; Tenma, N.; Pohlman, J.; et al. India National Gas Hydrate Program Expedition 02 Summary of Scientific Results: Gas Hydrate Systems along the Eastern Continental Margin of India. Mar. Pet. Geol. 2019, 108, 39–142. [Google Scholar] [CrossRef]
- Collett, T.S. Gas Hydrate Production Testing—Knowledge Gained. In Proceedings of the Offshore Technology Conference, Houston, TX, USA, 6–9 May 2019; pp. 6–9. [Google Scholar] [CrossRef]
- Singh, J.; Kumar, P.; Shukla, K.M.; Majumdar, C. Logging While Drilling Data Acquisition Challenges in Gas Hydrate Wells—India’s Gas Hydrate Expedition—02. In Proceedings of the Offshore Technology Conference Asia, Kuala Lumpur, Malaysia, 20–23 March 2018. [Google Scholar] [CrossRef]
- Fujii, T.; Suzuki, K.; Takayama, T.; Tamaki, M.; Komatsu, Y.; Konno, Y.; Yoneda, J.; Yamamoto, K.; Nagao, J. Geological Setting and Characterization of a Methane Hydrate Reservoir Distributed at the First Offshore Production Test Site on the Daini- Atsumi Knoll in the Eastern Nankai Trough, Japan. Mar. Pet. Geol. 2014, 66, 310–322. [Google Scholar] [CrossRef]
- Rajput, S.; Müller, T.M.; Clennell, M.B.; Rao, P.P.; Thakur, N.K. Constraints on Seismic Reflections and Mode Conversions at Bottom Simulating Reflectors Associated with Gas Hydrates. J. Pet. Sci. Eng. 2012, 88–89, 48–60. [Google Scholar] [CrossRef]
- Barnes, P.M.; Pecher, I.A.; LeVay, L.J.; Bourlange, S.M.; Brunet, M.M.Y.; Cardona, S.; Clennell, M.B.; Cook, A.E.; Crundwell, M.P.; Dugan, B.; et al. Site U1517. In Proceedings of the International Ocean Discovery Program; International Ocean Discovery Program: College Station, TX, USA, 2019; Volume 372. [Google Scholar] [CrossRef]
- Merey, Ş. Evaluation of Drilling Parameters in Gas Hydrate Exploration Wells. J. Pet. Sci. Eng. 2019, 172, 855–877. [Google Scholar] [CrossRef]
- Teale, R. The Concept of Specific Energy in Rock Drilling. Int. J. Rock Mech. Min. Sci. 1965, 2, 57–73. [Google Scholar] [CrossRef]
- Pessier, R.C.; Fear, M.J. Quantifying Common Drilling Problems with Mechanical Specific Energy and a Bit-Specific Coefficient of Sliding Friction. In Proceedings of the SPE Annual Technical Conference and Exhibition, Washington, DC, USA, 4–7 October 1992; pp. 373–388. [Google Scholar] [CrossRef]
- Pessier, R.C.; Wallace, S.N.; Oueslati, H. Drilling Performance Is a Function of Power at the Bit and Drilling Efficiency. In Proceedings of the IADC/SPE Drilling Conference and Exhibition (IADC/SPE 151389), San Diego, CA, USA, 6–8 March 2012; pp. 1–16. [Google Scholar] [CrossRef]
- Dupriest, F.E.; Koederitz, W.L. Maximizing Drill Rates with Real-Time Surveillance of Mechanical Specific Energy. In Proceedings of the SPE/IADC Drilling Conference, Amsterdam, The Netherlands, 23–25 February 2005; pp. 1–10. [Google Scholar] [CrossRef]
- Hamada, Y.; Kitamura, M.; Yamada, Y.; Sanada, Y.; Moe, K.; Hirose, T. Continuous Depth Profile of Mechanical Properties in the Nankai Accretionary Prism Based on Drilling Performance Parameters. Sci. Rep. 2018, 8, 2622. [Google Scholar] [CrossRef]
- Saito, S.; Hsiung, K.H.; Sanada, Y.; Moe, K.; Hamada, Y.; Nakamura, Y.; Wu, H.Y.; Shinmoto, Y.; Yamada, Y. Gas Hydrate Occurrence and Distribution Controlled by Regional Geological Structure off Eastern India: Estimates from Logging-While-Drilling in Area-B, National Gas Hydrate Program Expedition 02 (NGHP-02). Mar. Pet. Geol. 2019, 108, 216–225. [Google Scholar] [CrossRef]
- Haecker, A.; Lakings, J.; Marshall, E.; Ulla, J. A Novel Technique for Measuring (Not Calculating) Young’s Modulus, Poisson’s Ratio and Fractures Downhole: A Bakken Case Study. In Proceedings of the SPWLA 58th Annual Logging Symposium, Oklahoma City, OK, USA, 17–21 June 2017. [Google Scholar]
- Freudenthal, T.; Wefer, G. Drilling Cores on the Sea Floor with the Remote-Controlled Sea Floor Drilling Rig MeBo. Geosci. Instrum. Methods Data Syst. 2013, 2, 329–337. [Google Scholar] [CrossRef] [Green Version]
- Riedel, M.; Freudenthal, T.; Bialas, J.; Papenberg, C.; Haeckel, M.; Bergenthal, M.; Pape, T.; Bohrmann, G. In-Situ Borehole Temperature Measurements Confirm Dynamics of the Gas Hydrate Stability Zone at the Upper Danube Deep Sea Fan, Black Sea. Earth Planet. Sci. Lett. 2021, 563, 116869. [Google Scholar] [CrossRef]
- Riedel, M.; Freudenthal, T.; Bergenthal, M.; Haeckel, M.; Wallmann, K.; Spangenberg, E.; Bialas, J.; Bohrmann, G. Physical Properties and Core-Log Seismic Integration from Drilling at the Danube Deep-Sea Fan, Black Sea. Mar. Pet. Geol. 2020, 114, 104192. [Google Scholar] [CrossRef]


Publisher’s Note: MDPI stays neutral with regard to jurisdictional claims in published maps and institutional affiliations. |
© 2022 by the authors. Licensee MDPI, Basel, Switzerland. This article is an open access article distributed under the terms and conditions of the Creative Commons Attribution (CC BY) license (https://creativecommons.org/licenses/by/4.0/).