
Seasonal Performance Evaluation of Air-Based Solar Photovoltaic/Thermal Hybrid System


Department of Architectural Engineering, Kyonggi University, Suwon 16227, Korea
Energies 2022, 15(13), 4695; https://doi.org/10.3390/en15134695
Submission received: 31 May 2022
/
Revised: 15 June 2022
/
Accepted: 20 June 2022
/
Published: 27 June 2022
(This article belongs to the Special Issue Energy Performance, Management and Recovery in Buildings)
Abstract
:Recently, the use of novel renewable energy has attracted attention for suppressing the generation of carbon dioxide to prevent global warming. There is growing interest in energy reduction in buildings using solar energy because of its ease of use and repair and excellent maintenance. Therefore, in this study, air-based Photovoltaic thermal (PVT) systems, which can increase the utilization of solar energy, are compared with the existing PV system through measurement. PVT systems can increase the amount of power generation by lowering the temperature of the panel using air passing through the lower part of the panel. It is also possible to use the heated air obtained from the panel as indoor heating or for supplying hot water in a building. As a result of measuring the performance of existing PV panels and PVT panels under the same weather conditions, the power generation efficiency of PVT panels through which air passes increases compared to PV panels. Overall, an air-based PVT system can utilize solar energy about three times more than existing PV systems by utilizing solar heat and solar power. In summer, thermal collection and power generation by PVT were 51.9% and 19.0%, respectively, and power generation by PV was 18.0%. In contrast, the amount of thermal collection and power generation in winter was 43.5% and 20.3%, respectively, and the amount of power generated by PV was 18.7%. As such, it is necessary to review methods for utilizing the increase in power generation in winter and thermal collection in summer.
1. Introduction
Recently, there has been increasing interest in the use of novel renewable energy because of global warming caused by the use of fossil fuels and the danger of nuclear power generation. Accordingly, the Intergovernmental Panel on Climate Change (IPCC) aims to reduce carbon dioxide emissions by at least 45% compared to 2010 by 2030 and achieve carbon neutrality by 2050 to limit the increase in the global average temperature to 1.5 °C by 2100 [1]. Countries around the world voluntarily presented greenhouse gas reduction goals in 2016 and agreed to present a long-term, low-emission development strategy (LEDS) and national greenhouse gas reduction goal (Nationally Determined Contribution, NDC) [2,3]. Efforts to minimize greenhouse gas emissions using novel renewable energy are continuing, suggesting strategies suitable for each sector such as energy supply, industry, transportation, and buildings. Among various renewable energies, research on the use of solar power is being actively conducted due to its infinite energy source, ease of system installation, and excellent maintenance.
Although Photovoltaics (PV) systems have many advantages, such as varied applicability, they can only generate electricity during the daytime. Moreover, expensive batteries are required to store the remaining power, which delays the supply to industrial sites, such as construction sites [4,5]. Therefore, interest and research on PVT (Photovoltaics/Thermal) systems that can generate electricity using sunlight and collect solar heat at the same time are increasing. The PVT system has the advantage of allowing a liquid or air with a low relative temperature to pass through the back of the solar panel to control the decrease in power generation efficiency due to an increase in the panel temperature. Furthermore, fluid heated by solar energy can be used as a hot water supply or indoor heating in a building [6,7].
N. Syakirah Nazri announced that maximum solar energy effectiveness can be up to 80.3% using the air-based PVT system, and the PVT system can have higher power generation efficiency than existing PV systems [8]. In another study on the air-based PVT system, A. Numan Ozakin conducted a simulation review to reduce the panel surface temperature by 10–15 °C by passing air under the panel [9]. In addition, a study result was announced that the power generation efficiency increased by 15% due to the increase in wind speed. A study by A. Lateef Abdulla found that by applying the liquid PVT system, the panel surface temperature decreased by 5–9 °C, compared to the conventional PV, resulting in an increase in power generation efficiency [10]. Diego Vittorini suppressed the temperature rise of the PV panel by supplying 2 L of cooling water per minute [11]. As a result, the power generation efficiency was increased by 33%, compared to the conventional PV. In Lee’s research, flow analysis of the air-based PVT collector was conducted to obtain the greatest cooling effect in the horizontal arrangement structure, through which the accumulated power generation amount could be increased [12]. Nelson Calderón-Henao et al. performed experiments and simulations on the difference in the amount of power generation according to the temperature change in the PV. It was found that the combination of TEG (Thermoelectric generator) and PVG (Photovoltaic generator) technology proposed in this study can bring about a 6.05% efficiency increase [13]. Bruno Meneghel Zilli et al. presented a reduction in the efficiency of PV due to an increase in temperature and reviewed the effect of temperature reduction using a water-cooled sprinkler. As a result, it was found that the efficiency increased by about 9 to 12% by cooling the panel [14]. P. Pounraj et al. conducted an experiment on the effect of applying the Peltier system for the cooling of PV panels. The power required to operate the Peltier uses the power generated by PV, and the cooling by the Peltier shows that the efficiency increases by about 38% [15]. B. Praveen Kumar et al. performed an experiment comparing the appropriate heights of water (0.05 m, 0.10 m, and 0.15 m) to lower the temperature of a solar panel. The temperature changes and efficiency increase in each condition were examined and, as a result, the proposed PVT showed an increase in efficiency of about 25%, compared to the conventional solar system [16].
In addition, various studies are being conducted on the use of PVT systems as a method of minimizing the energy consumption of buildings. In Kang’s study, by comparing the performance of PVT by application type, it was found that installing it in a place that is abundant in solar radiation, such as a roof, is about 23.4% more advantageous in terms of energy production than exterior wall application [17]. Franz Hengel reviewed how to increase the efficiency of the system by linking the PVT system and a heat pump; however, it was suggested that additional research is required to achieve the break-even point due to the high initial investment cost [18]. Alba Ramos’ research found that combining a liquid PVT system with a heat pump could improve the system’s performance and reduce the power consumption for cooling [19].
As described above, various studies are being conducted on the applicability of the PVT system; however, studies on the simultaneous measurement of PV and PVT under the same conditions and the comparisons of seasonal performance are insufficient. Therefore, in this study, the performance of PV and PVT systems under the same weather conditions is measured, and the results are compared to examine the effect of using an air-based PVT system. In addition, in the case of short-term measurement, it is difficult to generalize the performance and improvement effect of the target system, because the performance result changes depending on the outside temperature at the time of measurement. Therefore, in this study, the performance difference of the system according to the change in the outdoor temperature is measured, and the necessity of the system performance reflecting the outdoor temperature is presented. By verifying the performance of the PVT system, which increases the utilization of solar energy through the increase in solar power generation efficiency and the use of solar heat, it is judged that it can contribute to the application expansion of the renewable energy and energy savings.
2. Materials and Methods
Measurements were made on the rooftop of Gyeonggi University (latitude 37.30°, longitude 127.04°) in Suwon-si, Korea [20]. In this experiment, by passing air under the existing PV panel, the increase in power generation due to the decrease in the temperature of the solar panel and the heat collection efficiency according to the temperature increase in the passing air were investigated. Changes in temperature and power generation under the same conditions were compared by dividing them into summer and winter seasons. The target panel faced south and was installed at an angle of 30 degrees, and the area of all target panels was 1.52 m2 (1600 mm × 950 mm). The target PV panel was composed of a single-crystalline silicon Passivated Emitter and Rear Cell (PERC). The conceptual diagram of the panel used in this experiment is described in Figure 1, and aspects such as the panel inlet temperature, upper/lower surface temperature, and panel outlet temperature were measured to investigate the temperature change in the upper and lower parts of the panel by passing air through the lower part of the panel. To compare the amount of power generation and power generation efficiency, solar radiation, current, and voltage were measured. Table 1 and Table 2 show the results of these measurements. The measurement was conducted every 1 s, and the average result for 10 min was shown considering the fluctuations according to the external conditions.
3. Measurement Results
3.1. Comparison of Temperature Results
The experiment was conducted from 16 August 2021 to 25 March 2022. In the measurement period, data were analyzed based on the measurement results of three days in summer (18 to 20 August, ‘21) and three days in winter (21 to 23 March, ‘22). The three-day target was selected based on the data showing two or more sunny days, and the characteristics of each season were presented. Figure 2 shows the insolation amount and outdoor temperature in summer and winter. The amount of solar insolation on the panel side in summer was 3351 Wh, 5618 Wh, and 4019 Wh, respectively, for 3 days, representing an average of about 4329 Wh, and the outdoor temperature was measured as a minimum of 24.8 °C and a maximum of 37.1 °C. In winter, the amount of insolation on the panel side was 5638 Wh, 4823 Wh, and 4019 Wh, respectively, for 3 days, representing an average of about 4827 Wh, and the outdoor temperature was measured as a minimum of −7.6 °C and a maximum of 15.0 °C.
In the case of PVT panels, where air can pass through the lower part of the panel, the temperature decreased by up to 7.6 °C, compared to the existing PV at the top of the panel in summer, and the average temperature decreased by about 2.7 °C during the period. This temperature decreased by up to 11.3 °C and averaged 2.1 °C in winter (Figure 3). In contrast, in the case of the lower panel temperature, the temperature change was relatively insignificant, with a maximum of 1.8 °C and an average of 0.5 °C in summer and a maximum of 0.6 °C and an average of 0.1 °C in winter (Figure 4).
The temperature of the air passing through the PVT panel increases through heat exchange with the panel. The temperature of the passing air of the panel heated by solar radiation showed a maximum temperature increase of 4.8 °C and an average of 3.3 °C in summer and a maximum temperature increase of 4.9 °C and an average of 1.8 °C in winter (Figure 5). It is judged that such an increase in atmospheric temperature has a high correlation with insolation. As the amount of insolation increases, the exit temperature also rises, thus it is judged that the optimum efficiency will be exhibited when the maximum amount of insolation is obtained by adjusting the angle of sunlight entering the panel (Figure 6).
Figure 7 shows the heat collection effect owing to the increase in the temperature of the air passing through the PVT panel. The volume of air generated by the fan applied in this experiment was 4.82 m3/min (the fan had a diameter of 9 cm and the average wind speed was 12.63 m/s). In the summer, the maximum and average heat collection amount calculated from the temperature difference between the inlet and outlet of the panel, the amount of air, and the specific heat of air were 684.4 W and 326.0 W, respectively; in the winter, these values were 486.5 W and 252.8 W. It was shown that the air passing through the bottom of the PVT panel can reduce the surface temperature, increase the amount of power generated, and help collect additional thermal energy.
3.2. Comparison of Power Generation Change
To investigate the effect of increasing the power generated by the PVT panels through surface temperature reduction by an air-based PVT system, the power generated by conventional PV and PVT panels in different seasons was compared. As shown in Figure 8, the maximum power generated by the PVT panel through which air can pass was increased by 11.0 W in the summer and 19.5 W in the winter. However, because it is difficult to quantitatively analyze the change in the amount of electricity due to changes in insolation, this study analyzed the relationship between solar radiation and the power generated by each PV and PVT panel. Figure 9 shows the correlation between solar power and power generation; as indicated in the figure, the power generated by a PVT panel increased by approximately 5.1% in the summer and 14.3% in the winter, compared to a PV panel for the corresponding period.
The power generation efficiency of PV and PVT panels was calculated based on the measured solar radiation and power generation. As shown in Figure 10, the power generation efficiency of the PVT panel was 19.0% in summer and 20.3% in winter, and the corresponding value for PV was 18.0% in summer and 18.7% in winter. Based on this, it can be confirmed that the increase in the power generation efficiency resulting from the air flow under the panel was approximately 8.6%. In addition, as shown in Figure 11, the solar energy utilization efficiency for PVT was 67.2%, based on an average annual heat-collecting effect of approximately 47.7%, which was a significant increase compared with the corresponding value of 18.3% for PV. However, for the application of PVT, it is necessary to not only increase the amount of power generated but also analyze the correlation with the heat load on the target building; additionally, it is crucial to review control measures at higher temperatures.
As such, the improvement effect of system efficiency and PVT depends on the outdoor temperature at the time of measurement. In particular, in the case of short-term measurement, the difference from the actual value may be large depending on the outside temperature at the time of measurement, so it is necessary to indicate the system performance considering the outside temperature. In this study, based on the measurement results in summer and winter, the relationship between the amount of power generation according to the outdoor temperature as well as the insolation was reviewed through regression analysis. As shown in Table 3, the outdoor temperature was found to have a significant effect on the amount of solar power generation. In addition, the difference in annual power generation was compared when the figure showing the relationship between solar insolation and power generation in the performance curve shown in Figure 9 was used and when the influence of outdoor temperature was considered. For meteorological data, the ‘TRNSYS standard meteorological data, Seoul’ was used. As a result, as shown in Table 4, it was found that a difference in annual power generation of −6.8 to 4.8% can occur. As such, in order to indicate the performance of the solar energy system, it was judged that a notation method that reflects not only solar radiation but also outdoor temperature is necessary.
4. Conclusions
This study involved the measurement and analysis of the power generation and thermal collection performance of existing PV and PVT systems among new and renewable energy systems that demonstrate the highest applicability in buildings and present significant advantages in terms of maintenance.
The target system considered in this study was an air-based PVT system, which introduced outside air through the lower part of the existing PV panel to lower the surface temperature of the panel and increase the solar power generation efficiency by approximately 8.6% annually. In addition, owing to an increase in the temperature of passing air, thermal energy was produced at an average of 47.5% per year, which is expected to be utilized in heating systems in buildings.
By a comparative analysis of the data measured in summer and winter, the panel temperature lowering effect, resulting from forced air flow, was found to be relatively low in the summer when the outdoor temperature was high. Therefore, further research on the cooling effect of the panel and change in the power generation efficiency according to a change in the outdoor temperature is necessary.
As can be seen from the measurement results in summer and winter, the efficiency of solar power generation varies according to the outside temperature. Therefore, in order to evaluate the performance of the solar energy system through short-term measurement, the external temperature during the measurement period should be reviewed at the same time. As a result of adding outdoor temperature to the annual expected power generation through regression analysis, it was found that there was a difference of −6.8 to 4.8% in power generation, compared to the case where the insolation alone was predicted.
In addition, to effectively utilize the elevated air temperature in a building, it is necessary to further review methods for attaining the required temperature by adjusting the rotation speed of the air intake fan; additionally, it is vital to review the method itself and the effect of its utilization in buildings.
Funding
This work was supported by Kyonggi University Research Grant 2020, Funding Number: 2020-001.
Institutional Review Board Statement
Not applicable.
Informed Consent Statement
Not applicable.
Data Availability Statement
Not applicable.
Conflicts of Interest
The author declares no conflict of interest.
References
- Intergovernmental Panel on Climate. Climate Change 2021 The Physical Science Basis; Intergovernmental Panel on Climate: Geneva, Switzerland, 2021; ISBN 9789291691586. [Google Scholar]
- Clapp, C.; Briner, G.; Karousakis, K. Low-Emission Development Strategies(LEDS): Technical, Institutional and Policy Lessons; OECD Publishing: Paris, France, 2010. [Google Scholar]
- United Nations. Nationally Determined Contributions under the Paris Agreement; United Nations: Rome, Italy, 2021. [Google Scholar]
- Lämmle, M.; Oliva, A.; Hermann, M.; Kramer, K.; Kramer, W. PVT Collector Technologies in Solar Thermal Systems: A Systematic Assessment of Electrical and Thermal Yields with the Novel Characteristic Temperature Approach. Sol. Energy 2017, 155, 867–879. [Google Scholar] [CrossRef]
- Yu, G.; Yang, H.; Yan, Z.; Kyeredey, M. A Review of Designs and Performance of Façade-Based Building Integrated Photovoltaic-Thermal (BIPVT) Systems. Appl. Therm. Eng. 2021, 182, 116081. [Google Scholar] [CrossRef]
- Wajs, J.; Golabek, A.; Bochniak, R.; Mikielewicz, D. Air-Cooled Photovoltaic Roof Tile as an Example of the BIPVT System e An Experimental Study on the Energy and Exergy Performance. Energy 2020, 197, 117255. [Google Scholar] [CrossRef]
- Singh, G.; Kumar, S.; Tiwari, G.N. Design, Fabrication and Performance Evaluation of a Hybrid Photovoltaic Thermal ( PVT ) Double Slope Active Solar Still. DES 2011, 277, 399–406. [Google Scholar] [CrossRef]
- Syakirah, N.; Fudholi, A.; Bakhtyar, B.; Hoy, C.; Ibrahim, A.; Ha, M.; Mat, S.; Sopian, K. Energy Economic Analysis of Photovoltaic–Thermal-Thermoelectric (PVT-TE) Air Collectors. Renew. Sustain. Energy Rev. 2018, 92, 187–197. [Google Scholar] [CrossRef]
- Numan, A.; Kaya, F. Effect on the Exergy of the PVT System of Fi Ns Added to an Air-Cooled Channel: A Study on Temperature and Air Velocity with ANSYS Fluent. Sol. Energy 2019, 184, 561–569. [Google Scholar] [CrossRef]
- Lateef, A.; Misha, S.; Tamaldin, N.; Rosli, M.A.M.; Sachit, A. Case Studies in Thermal Engineering Theoretical Study and Indoor Experimental Validation of Performance of the New Photovoltaic Thermal Solar Collector (PVT) Based Water System. Case Stud. Therm. Eng. 2020, 18, 100595. [Google Scholar] [CrossRef]
- Vittorini, D.; Castellucci, N.; Cipollone, R. Heat Recovery Potential and Electrical Performances In- Fi Eld Investigation on a Hybrid PVT Module. Appl. Energy 2017, 205, 44–56. [Google Scholar] [CrossRef]
- Gu, G.; Gu, Y. Flow Analysis and Experimental Study of Air Type PVT Collector. In Proceedings of the SAREK Conference, Pyeongchang, Korea, 20–22 June 2018; pp. 949–952. [Google Scholar]
- Calder, N.; Jos, O.; Henrique, E.; Franco, M.; Eduardo, E.; Lora, S.; Scherer, H.F.; Mauricio, D.; Maya, Y.; Hideo, O.; et al. Numerical–Experimental Performance Assessment of a Non-Concentrating Solar Thermoelectric Generator ( STEG ) Operating in the Southern Hemisphere. Energies 2020, 13, 2666. [Google Scholar]
- Meneghel, B.; Miguel, A.; Nelson, S.; De Souza, M.; Secco, D.; Eduardo, C.; Nogueira, C.; Hideo, O.; Junior, A. Performance and Effect of Water-Cooling on a Microgeneration System of Photovoltaic Solar Energy in Paran A. J. Clean. Prod. 2018, 192, 477–485. [Google Scholar] [CrossRef]
- Pounraj, P.; Winston, D.P.; Kabeel, A.E.; Kumar, B.P.; Manokar, A.M.; Sathyamurthy, R.; Christabel, S.C. Experimental Investigation on Peltier Based Hybrid PV/T Active Solar Still for Enhancing the Overall Performance. Energy Convers. Manag. 2018, 168, 371–381. [Google Scholar] [CrossRef]
- Praveen, B.; Winston, D.P.; Pounraj, P.; Manokar, A.M.; Sathyamurthy, R.; Kabeel, A.E. Experimental Investigation on Hybrid PV/T Active Solar Still with effective Heating and Cover Cooling Method. Desalination 2018, 435, 140–151. [Google Scholar] [CrossRef]
- Kang, J.; Kim, J.; Kim, J. A Study on the Performance Comparisons of Air Type BIPVT Collector Applied on Roofs and Facades. J. Korean Sol. Energy Soc. 2010, 30, 56–62. [Google Scholar]
- Hengel, F.; Heschl, C.; Inschlag, F.; Klanatsky, P. International Journal of Thermo Fl Uids System efficiency of Pvt Collector-Driven Heat Pumps. Int. J. Thermofluids 2020, 5–6, 100034. [Google Scholar] [CrossRef]
- Ramos, A.; Chatzopoulou, M.A.; Guarracino, I.; Freeman, J.; Markides, C.N. Hybrid Photovoltaic-Thermal Solar Systems for Combined Heating, Cooling and Power Provision in the Urban Environment. Energy Convers. Manag. 2017, 150, 838–850. [Google Scholar] [CrossRef]
- Choi, Y.; Kim, H.B. Analysis of Solar Energy Utilization Effect of Air-Based Photovoltaic/Thermal System. Energies 2021, 14, 8586. [Google Scholar] [CrossRef]
Figure 1.
Schematic of experimental arrangement and experimental setup.
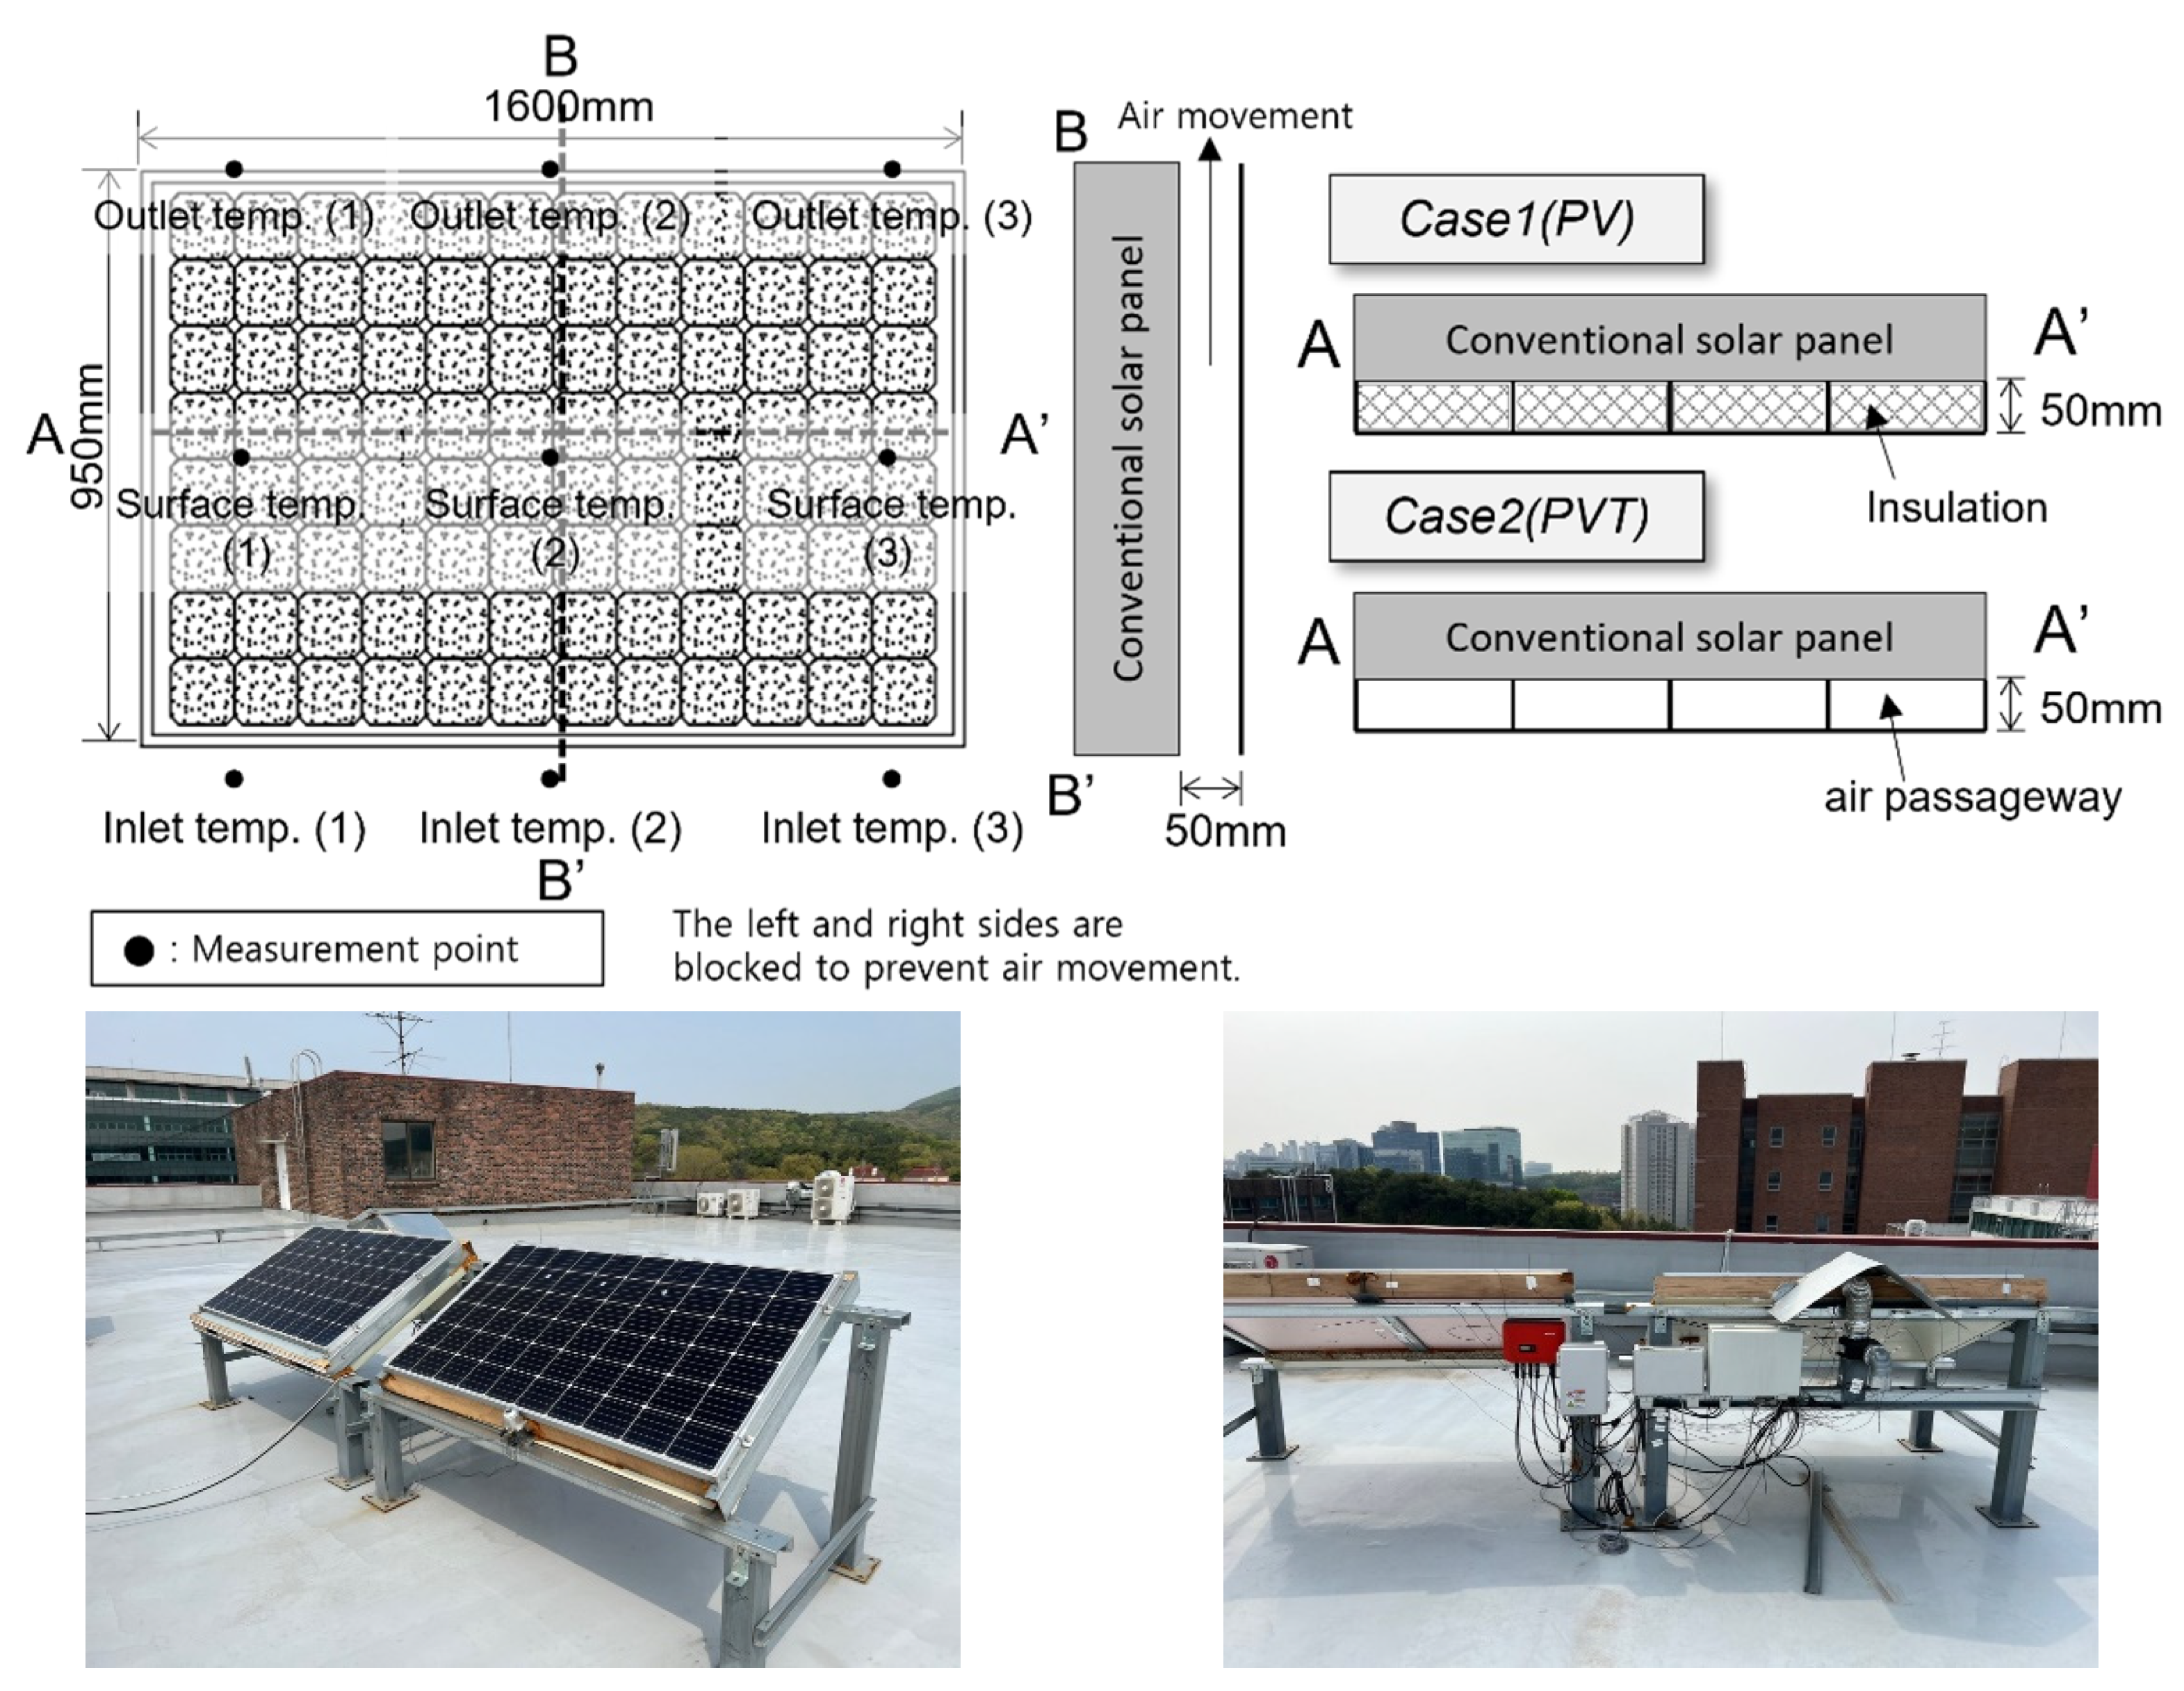
Figure 2.
Solar radiation and outside temperature: (a) summer; (b) winter.

Figure 3.
Upper surface temperature of the panels: (a) summer; (b) winter.


Figure 4.
Lower surface temperature of the panels: (a) summer; (b) winter.

Figure 5.
Outlet temperature of PVT panel: (a) summer; (b) winter.

Figure 6.
Relationship between insolation and outlet temperature rise: (a) summer; (b) winter.


Figure 7.
Thermal collection by PVT panel: (a) summer; (b) winter.

Figure 8.
Change in power generated by PV and PVT panels: (a) summer; (b) winter.

Figure 9.
Relationship between insolation and power generation: (a) summer; (b) winter.

Figure 10.
Power generation efficiency of PVT and PV: (a) summer; (b) winter.

Figure 11.
Solar energy utilization efficiency of PVT and PV: (a) summer; (b) winter.


Table 1.
Equipment specification.
| Items | Instrument | Specification |
|---|---|---|
| Temperature | Thermal couple T-type | Range: −200–250 °C, Accuracy: ±0.5 °C, Resolution: 0.1 °C |
| Solar radiation | EKO MS-40 pyranometer ISO 9060:2018 Class C (second class) | Range: 0–2000 W/m2, Accuracy: ±0.2% |
| Electric energy | Solar volt/Current unit | 10 A/50 mV shunt |
| Wind speed | Testo 405i hot-wire anemometer | Range: 0–30 m/s, Accuracy: ±0.1–0.3 m/s |
| Data logger | Hioki Memory Hilogger LR8400 | Temperature resolution: 0.01 °C, Voltage resolution: 500 nV |
Table 2.
Measurement items.
| Number | Item | Number | Item |
|---|---|---|---|
| 1 | Outside temperature | 15 | PVT lower air temperature |
| 2 | PVT air inlet temperature 1 | 16 | PV upper air temperature |
| 3 | PVT air inlet temperature 2 | 17 | PV upper-surface temperature 1 |
| 4 | PVT air inlet temperature 3 | 18 | PV upper-surface temperature 2 |
| 5 | PVT upper-air temperature | 19 | PV upper-surface temperature 3 |
| 6 | PVT upper-surface temperature 1 | 20 | PV lower-surface temperature 1 |
| 7 | PVT upper-surface temperature 2 | 21 | PV lower-surface temperature 2 |
| 8 | PVT upper-surface temperature 3 | 22 | PV lower-surface temperature 3 |
| 9 | PVT lower-surface temperature 1 | 23 | PV lower-air temperature |
| 10 | PVT lower-surface temperature 2 | 24 | Pyranometer |
| 11 | PVT lower-surface temperature 3 | 25 | PVT current |
| 12 | PVT air outlet temperature 1 | 26 | PVT voltage |
| 13 | PVT air outlet temperature 2 | 27 | PV current |
| 14 | PVT air outlet temperature 3 | 28 | PV voltage |
Table 3.
Results of regression analysis.
| PVT Results | PV Results | ||||
|---|---|---|---|---|---|
| Regression Statistics | Regression Statistics | ||||
| Multiple R | 0.960 | Multiple R | 0.952 | ||
| R Square | 0.922 | R Square | 0.907 | ||
| Adjusted R Square | 0.922 | Adjusted R Square | 0.907 | ||
| Standard Error | 22.710 | Standard Error | 21.954 | ||
| Observations | 437 | Observations | 436 | ||
| ANOVA | ANOVA | ||||
| Significance F | Significance F | ||||
| Regression | 2.7276 × 10−241 | Regression | 3.9829 × 10−224 | ||
| Coefficients | p-Value | Coefficients | p-Value | ||
| Intercept | 20.29 | 2.60443 × 10⁻¹⁴ | Intercept | 17.53 | 6.53258 × 10⁻¹² |
| Outdoor temperature | −0.62 | 2.23992 × 10⁻¹¹ | Outdoor temperature | −0.27 | 0.001779559 |
| Solar radiation | 0.26 | 7.0797 × 10−242 | Solar radiation | 0.23 | 1.8234 × 10−225 |
Table 4.
Annual power generation forecast result.
| Power Generation Based on the Coefficient of Summer Performance Curve Results (Figure 9a) (MWh) | Power Generation Based on the Coefficient of Winter Performance Curve Results (Figure 9b) (MWh) | Estimated Power Generation including Outside Temperature (MWh) | |
|---|---|---|---|
| PVT | 1.15 | 1.29 | 1.20 |
| PV | 1.09 | 1.13 | 1.08 |
Publisher’s Note: MDPI stays neutral with regard to jurisdictional claims in published maps and institutional affiliations. |
© 2022 by the author. Licensee MDPI, Basel, Switzerland. This article is an open access article distributed under the terms and conditions of the Creative Commons Attribution (CC BY) license (https://creativecommons.org/licenses/by/4.0/).
Share and Cite
MDPI and ACS Style
Choi, Y. Seasonal Performance Evaluation of Air-Based Solar Photovoltaic/Thermal Hybrid System. Energies 2022, 15, 4695. https://doi.org/10.3390/en15134695
AMA Style
Choi Y. Seasonal Performance Evaluation of Air-Based Solar Photovoltaic/Thermal Hybrid System. Energies. 2022; 15(13):4695. https://doi.org/10.3390/en15134695
Chicago/Turabian StyleChoi, Youngjin. 2022. "Seasonal Performance Evaluation of Air-Based Solar Photovoltaic/Thermal Hybrid System" Energies 15, no. 13: 4695. https://doi.org/10.3390/en15134695
Note that from the first issue of 2016, this journal uses article numbers instead of page numbers. See further details here.