Abstract
This paper aims at presenting a novel effective approach to probabilistic analysis of distribution power grid with high penetration of PV sources. The novel method adopts a Gaussian Mixture Model for reproducing the uncertainty of correlated PV sources along with a piece-wise-linear approximation of the voltage-power relationship established by load flow problem. The method allows the handling of scenarios with a large number of uncertain PV sources in an efficient yet accurate way. A distinctive feature of the proposed probabilistic analysis is that of directly providing, in closed-form, the joint probability distribution of the set of observable variables of interest. From such a comprehensive statistical representation, remarkable information about grid uncertainty can be deduced. This includes the probability of violating the safe operation conditions as a function of PV penetration.
1. Introduction
The growing penetration of photovoltaic (PV) generators in power distribution grid is expected to greatly increase the statistical uncertainty of power balance problem from the supply side [1]. Such an uncertainty can jeopardize the power grid operation health [2]. For such reasons, there is today great interest in innovative and efficient simulation tools for power grid probabilistic analysis [3,4,5]. Such novel tools should be able to predict the many potential adverse effects that massive distributed PV injection can bring with it, e.g., over voltage, unacceptable voltage or current variations.
To this aim, simulation tools should own some relevant features. First, they have to rely on realistic statistical models of PV uncertainty and be able to exploit the information supplied by measurements and historic data set [6]. Several approaches to PV modeling have been proposed in the literature [7], some of which are focused on reproducing metereological conditions variability [8,9] while some others directly exploit PV delivered power data [10].
Evidences gained from such data-driven approaches show that: (a) PV delivered power follows non-standard statistical distributions [10,11], (b) geographically close PV plans tend to exhibit a certain degree of correlation. Techniques for including sources correlations are mostly based on Copula Method (CM) [12,13], or on Gaussian Mixture Models (GMM) [14,15]. These latter are particularly attractive since they provide a closed-form model for approximating the joint statistical distribution of many PV sources with arbitrary precision [16].
A second desirable feature of envisaged simulation tools is they should employ numerically effective probabilistic methods, allowing rapid explorations of several scenarios with power sources connected at different potential injection points. The basic and reference probabilistic method is still the iterative Monte Carlo (MC) simulation for the flexibility and accuracy it can ensure. The main limitation of MC is the slow convergence of its iterative scheme and the long computational times it can require. Several probabilistic acceleration techniques have be proposed that approximate the input-output relationship between PV injected powers and node voltages variations. Many of such techniques rely on polynomial chaos expansions [17,18,19] and have been proved to supply excellent results. Unfortunately, they suffer of the curse of dimensionality and loose much of their effectiveness when the number of statistical parameters involved grows to much [20]. This can just be the case for grid with high penetration PV generators.
To cope with such issues, in this paper we present an original methodology exploiting the evidence that, in the Load Flow (LF) problem, the dependence of node voltages on injected PV powers is almost linear for small relative power variations [21,22]. As a consequence, the multivariate voltage-power relationship can be accurately approximated through local piece-wise linear (PWL) approximations. To improve accuracy, the hyperplanes forming PWL approximation are centered at those points in the statistical space where the joint Probability Density Function (PDF) of the PV sources is large.
The original contributions of this paper include:
- A method for modeling with arbitrary precision the joint PDF of many correlated PV sources starting from data sets of PV delivered power. The method relies on a Gaussian Mixture Model (GMM) and produces a clusterization of injected power values. In fact, each Gaussian component identifies a data cluster while the Gaussian mean value vectors determine the centers of the clusters.
- An accurate PWL approximation of the multivariate voltage-power relationship in the grid. This is determined by exploiting the typical computational flow of a LF simulation tool. More specifically, we show how the voltage sensitivity calculation provides the information required to build the local hyperplane approximation at each cluster center.
- The demonstration of how the proposed PWL method allows the computing of closed-form expressions, i.e., a GMM, for the joint PDF of a set of observable variables of interest, i.e., a set of node voltages at critical buses in the grid.
The joint PDF can be used to calculate the uncertainty intervals of node voltages as well as the probability of violating safe operation conditions. Such computational capabilities are crucial in order to assess the PV hosting capacity of a given distribution grid.
The methodology is shown only for the case of PV system, but can be generalized to other renewable energy sources.
The remainder of this paper is organized as follows: Section 1 briefly reviews LF formulation and voltage sensitivity computation. Section 2, Section 3 and Section 4 illustrate the novel contributions of this paper. In fact, in Section 2, we describe the data-driven GMM of correlated PV sources while, in Section 3, the rational behind PWL probabilistic analysis and its implementation details are outlined. Finally, in Section 4, we present several numerical experiments which prove the accuracy and efficiency of the proposed PWL method along with its many potentialities as uncertainty quantification tool.
2. Power Flow Analysis and Sensitivity Computation
We consider a generic power distribution network composed of N nodes. The power flow problem consists in calculating the node voltage values producing the desired power flow at the network terminals. The problem is formulated mathematically by a set of nonlinear equations of the type:
for , where , are voltage and current phasors at node n, vector collects all voltages, while denotes complex power at node n with and being the active and reactive power, respectively. Furthermore, node currents are related to node voltages by means of
where are the entries of the node admittance matrix. This one is determined by node-interconnection elements, such as grid lines, transformers and phase shifters, which are described by their admittance matrix. Power specification at the terminal nodes are given by loads and generators [22]. In this paper, the complex electrical quantities appearing in the power flow problem (1) are described in Cartesian coordinates (i.e., by their real and imaginary parts) and the resulting nonlinear equations are solved with Newton–Raphson (NR) method. Adopting vector-based notation, the nth voltage phasor , is represented by the vector
collecting its real and imaginary parts and , respectively. Similarly, the power flow Equations (1) and (2) can be transformed into the associated vector form
and
respectively, where and and are the conductance and the susceptance, respectively. In [23] it has been shown how vector forms (4), (5) and their derivatives allow efficient implementation through complex array operations. In this paper, instead, we describe how the power flow equations can be exploited to compute the sensitivity of some observable electric variables in the power grid (e.g., node voltages at critical buses) versus a set of parameters , for , representing uncertainty. To this aim, we observe that the power flow Equations (4) and (5), collected for , form a system of nonlinear real equations that can be denoted in compact form as:
where is the column vector assembling node voltages real and imaginary parts while denotes the parameters vector. In the subsequent Section 2, we will select as uncertainty parameters the (normalized) active power injected in a set of actor nodes where PV generators are expected to be inserted. However, the sensitivity analysis that we are going to present is general and can be applied to any set of electrical parameters in the grid. Let us call the solution of the power flow problem (6) for a given value of parameters vector. A small perturbation of parameters will produce a small perturbation of node voltages such that the power flow problem (6) can be written as:
where are second-order terms. In the limit that perturbation goes to zero, neglecting second-order terms, we derive the matrix system:
The term is the Jacobian matrix, while is the sensitivity matrix that contains the unknown (partial) derivatives of real and imaginary parts of node voltages versus parameters, i.e., and . Finally, the right-hand side matrix collects the derivatives of power flow equations versus parameters. For instance, when the parameters are the active powers injected at nodes, i.e., , from (4) we see that the columns of are vectors with a single 1 at position and all zero the other terms.
It is worth observing how the solution of the sensitivity problem (8) requires little extra computation compared to the solution of nonlinear problem (6) since from this last one the Jacobian matrix and its LU decomposition are already available.
Finally, from and , the sensitivity of voltage magnitudes can be deduced as follows:
3. Gaussian Mixture Model of Correlated PV Sources
We are interested in reproducing, in a realistic way, the statistical uncertainty associated with the power delivered by representative PV installations distributed along the grid. The technique that we propose is general and can be applied to any available data set independently of the way it has been obtained (e.g., through measurements, historic data set or simulations).
The values of the power delivered by D PV sources, during a given daily time window (e.g., during the central hours of the day) are collected over several days and normalized
to the maximum installed power for the dth source. For such a PV source, the values supply the (simultaneously-detected) samples data set from which the (empirical) statistical distribution of random variable can be determined. Variables are distributed over the interval .
Common features exhibited by the PV delivered active power are: (a) normalized powers follow non-standard statistical distributions; (b) geographically close power sources show a certain degree of correlation that should be properly reproduced into the model.
To handle such a general case, we adopt a Gaussian Mixture Model (GMM), i.e., the joint PDF of random variables is approximated by a model of the type [16,24]:
Each component is a multi-variate Gaussian density defined by its mean and covariance matrix [25]. The weighting parameters are the mixing coefficients satisfying the conditions to be probabilities:
As a result, in the expression (11), the mixing coefficients can be seen as the prior probability of picking the kth component. i.e, , while each component reduces to the probability of conditioned to k, i.e., . With this interpretation, (11) can be rewritten as
For a given data set , with , formed by samples, the parameters , and in (11) can be extracted with an elegant and powerful iterative technique referred to as Expectation Maximization (EM) [24]. The main computational steps of EM algorithm are reported in the Appendix A, while an efficient implementation of EM can be found in the Matlab routine fitgmdist.m.
In the rest of this Section 2, we illustrate some features of the EM algorithm by exploiting a freely-available data set of PV measurements [26]. This dataset presents data from several PV plants installed in the same site, so the ground irradiance and weather conditions are the same. The only difference is in the panel technologies, their exposure, and the type of power control. The active power delivered by ten PV plants over the considered daily time window, i.e., from 12:00 p.m. to 1:00 p.m., after normalization to the maximum installed power, provide the samples of the random variables , with of type (10).
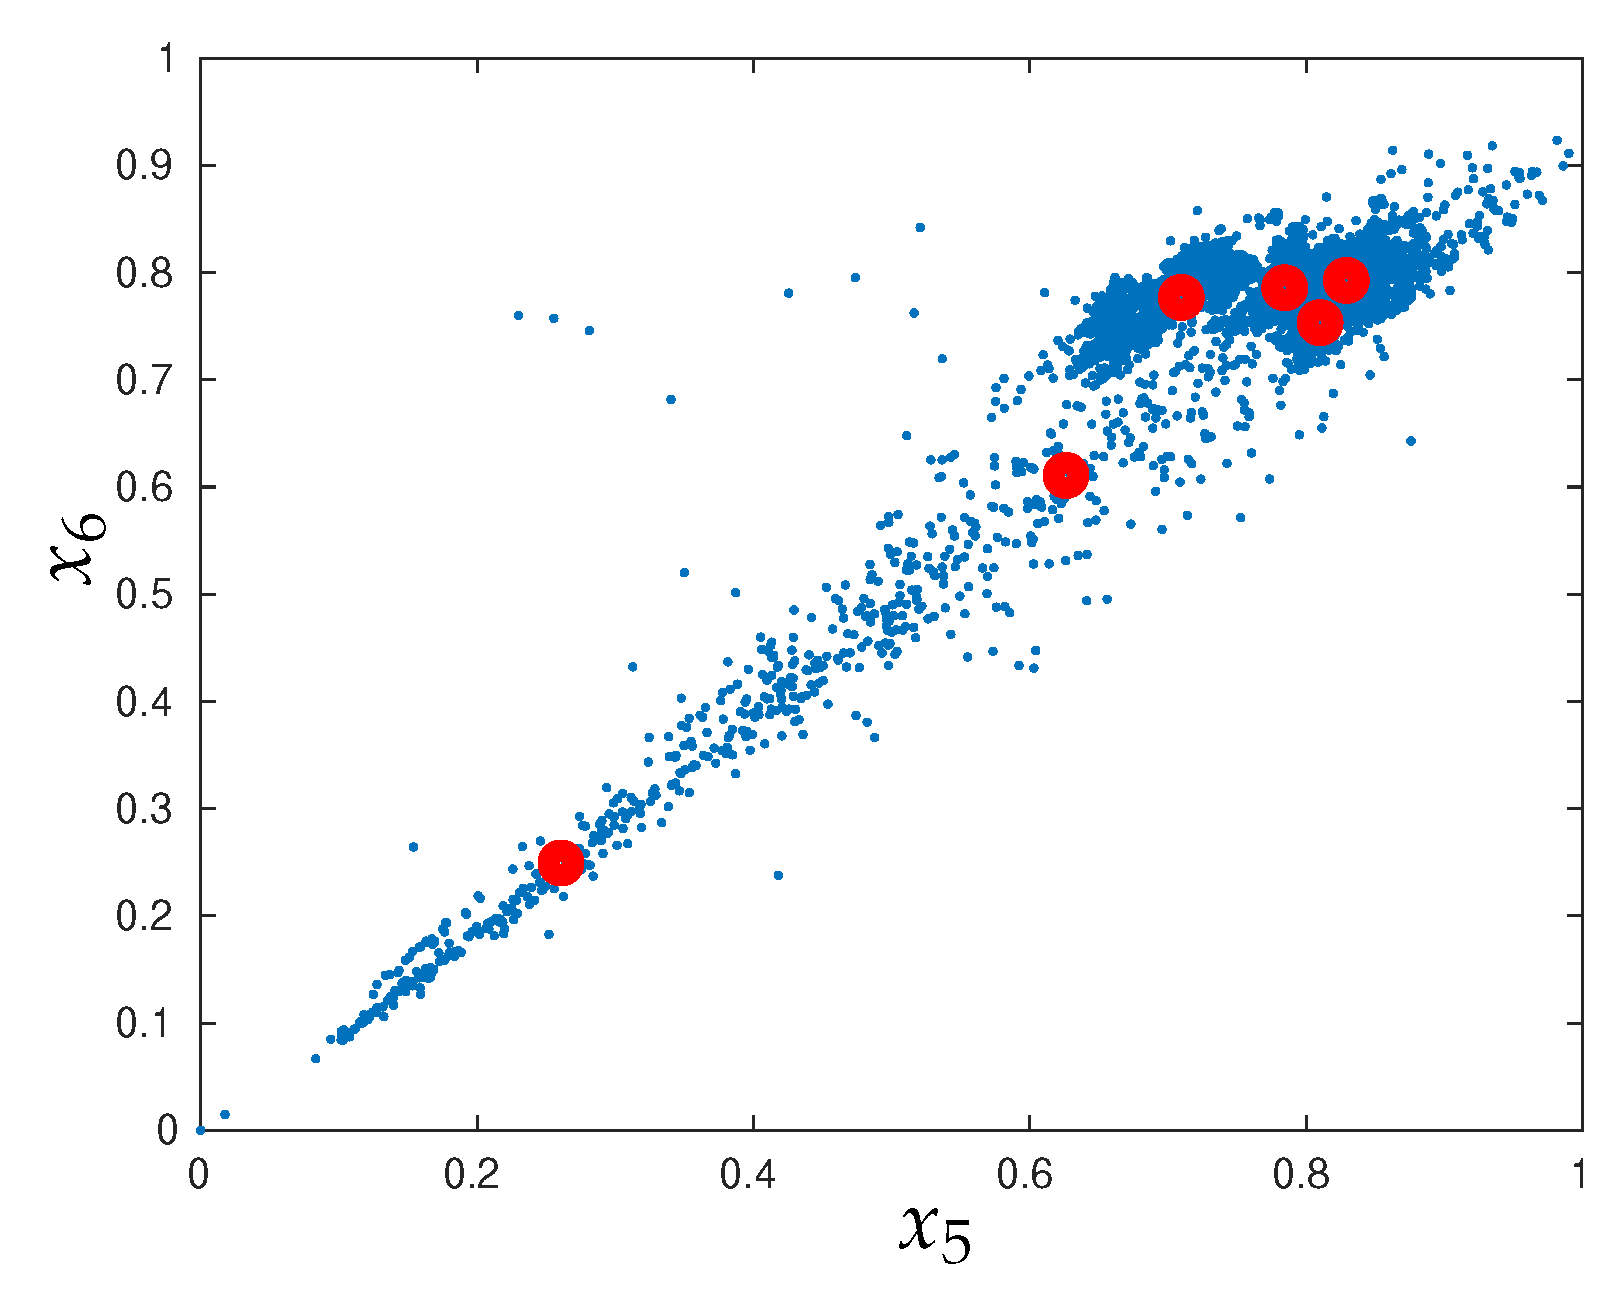
The EM algorithm is then applied to this data set assuming a growing number K of Gaussian components. Figure 1 shows the scattered plot of variables , samples along with the projection of the mean values onto the , subspace. Such variables exhibit a high degree of correlation since their samples tend to concentrate along the plane diagonal.

Figure 1.
(Blue Dot): Scattered plot of variables , samples; (Red Circles) the projection of the mean values calculated by EM algorithm.
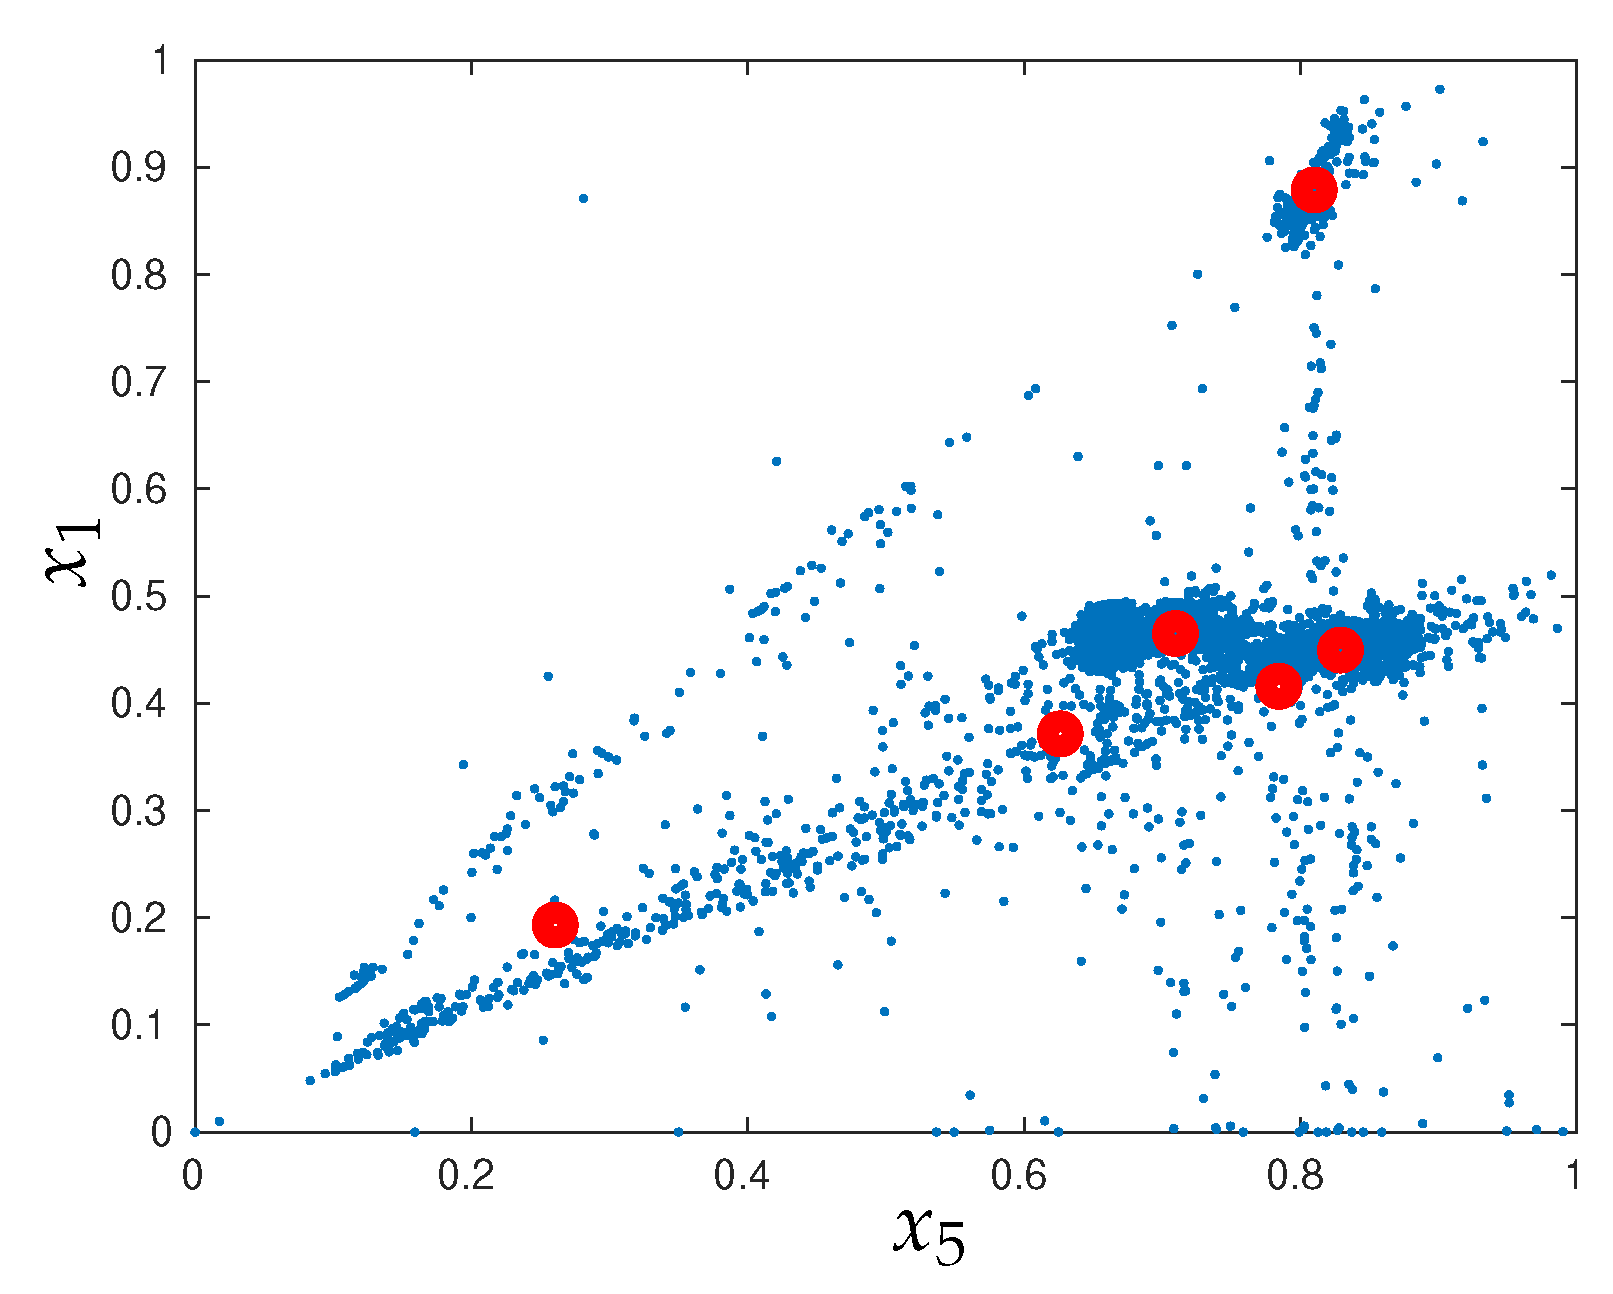
Figure 2 reports, as a second example, the scattered plot of variables , samples and the projection of mean values on the subspace they define. Variables , are less correlated among them and their samples are distributed over a larger portion of the plane.
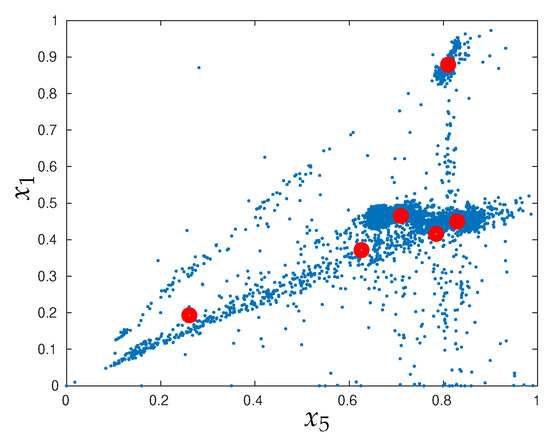
Figure 2.
(Blue Dot): Scattered plot of variables , samples; (Red Circles) the projection of the mean values calculated by EM algorithm.
Some observations are in order.
- As it is well known in the literature, the EM works as a clustering algorithm where the mean values represent the centers of the clusters [24].
- EM tends to place the cluster centers where the samples are more dense that is where the joint is large. As a result, in the regions with high samples density the centers are close among them while they are spaced apart in those regions with low sample density.
The aforementioned observations will be exploited in the PWL probabilistic analysis implementation presented in next Section 3.
In the rest of this section, it remains to see how, given a data set , an adequate number K of Gaussian components can be fixed. Even though some techniques for selecting K are available in the literature [24], we preferred to adopt the following eurism that revealed to work well with PV data. The eurism consists in increasing gradually the cluster number K in EM algorithm till it appears one cluster containing a too small fraction of the samples. In fact, the membership degree of a given sample to the kth cluster can be calculated as:
The sample is assigned to the cluster with the highest membership degree , for . In this way, all the samples are distributed among the clusters so that the kth cluster will contain samples or equivalently the fraction of samples . When the fraction of samples within the smallest cluster goes down a given threshold (e.g., ) the algorithm is stopped. Figure 3 reports the fraction of samples in the smallest cluster versus the number K of Gaussian components for the example herein considered.
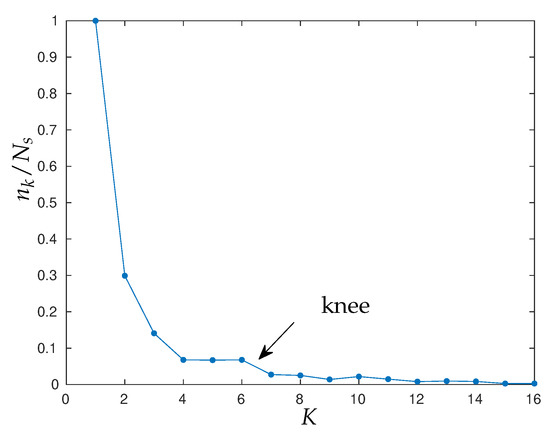
Figure 3.
Fraction of samples in the smallest cluster versus the number K of clusters.
It is seen how passing from to the fraction of samples in the smallest cluster has a knee and reduces to about . This means that the Gaussian components in excess of six account for very small fractions of samples and thus are statistically negligible. For the considered example, is an adequate number of Gaussian components.
4. Piece-Wise Linear Probabilistic Analysis
4.1. The Probabilistic Problem
We consider a distribution power grid containing D PV generators whose delivered active powers are represented by D random variables having a GMM joint PDF (11).
We are interested in calculating the PDF of a set of observable electrical variables , with in the grid, for instance the module of the node voltage at some critical buses. Observable variables are assembled in the vector .
For any sample (i.e., any statistical realization) of vector its elements , scaled by the associated installed power , provide the values of the PV powers to be injected into the grid. A deterministic load flow analysis of the grid, with such injected PV powers, allows the determination of the corresponding value assumed by the observable variables in the vector . Such a computational flow is the elementary mechanism which is at the basis of Monte Carlo PLF method. A very large number of samples of are generated according to the joint PDF (11) and the related are computed performing a deterministic load flow analysis for each sample. A sufficiently large set of computed sample of allows the estimation of the statistical distribution, that is the marginal of each desired observable variable. Unfortunately, due to the slow convergence rate, MC can require several ten of thousands samples (i.e., repeated load flow analyses) to achieve satisfactory approximations. Techniques for accelerating MC rely on the observation that the load flow analysis establishes a deterministic vector valued relationship
between the parameters (e.g., PV injected powers) and the observable variables (e.g., the node voltages). In other terms, the element of vector are multi-variate functions of the parameters. Acceleration techniques thus employ compact models, referred to as surrogate models, for approximating such multi-variate functions .
Stochastic Response Surface Methods (SRSM) or techniques based on generalized Polynomial Chaos (gPC) adopt series expansions of multi-variate polynomial basis functions spanning the whole statistical/parameter space to approximate [17,18,19]. The success of such techniques in PLF analysis relies on the fact that load-flow-established relationships are commonly almost linear and thus they can be accurately approximated by series expansions of low order (commonly order ) polynomials. For problems of small size, a few load flow simulations are enough to build the surrogate model, i.e., to calculate the coefficients that weight the polynomials in the series. However, such techniques suffer of the curse of dimensionality since the number of weighting coefficients in the gPC expansion, corresponding to the minimum number of required load flow simulations, is given by , with D being the number of statistical parameters and the expansion order [17]. As a result, the number of required LF simulations grows super-linearly with D and . For instance, an order-2 gPC expansion requires (at least) 66 simulations for parameters whereas it requires (at least) 1326 simulations for parameters. If an order-3 gPC model is adopted, the required minimum number of simulations to perform grows to 286 for and for .
4.2. Piece-Wise Linear Approximation
The idea behind the novel method consists in: replacing the multi-variate polynomials spanning the whole domain/space with piece-wise linear approximations built around those points in the parameter space where the joint probability is large.
When the joint probability is given by model (11), the means of the Gaussian components can be used to build the piece-wise approximation. In fact, in view of the analysis presented in Section 2, we know that the Gaussian means are the centers of the clusters where samples density is large.
Thus, in a neighborhood of the kth center , the vector valued relationship (15) can be linearized as:
The term
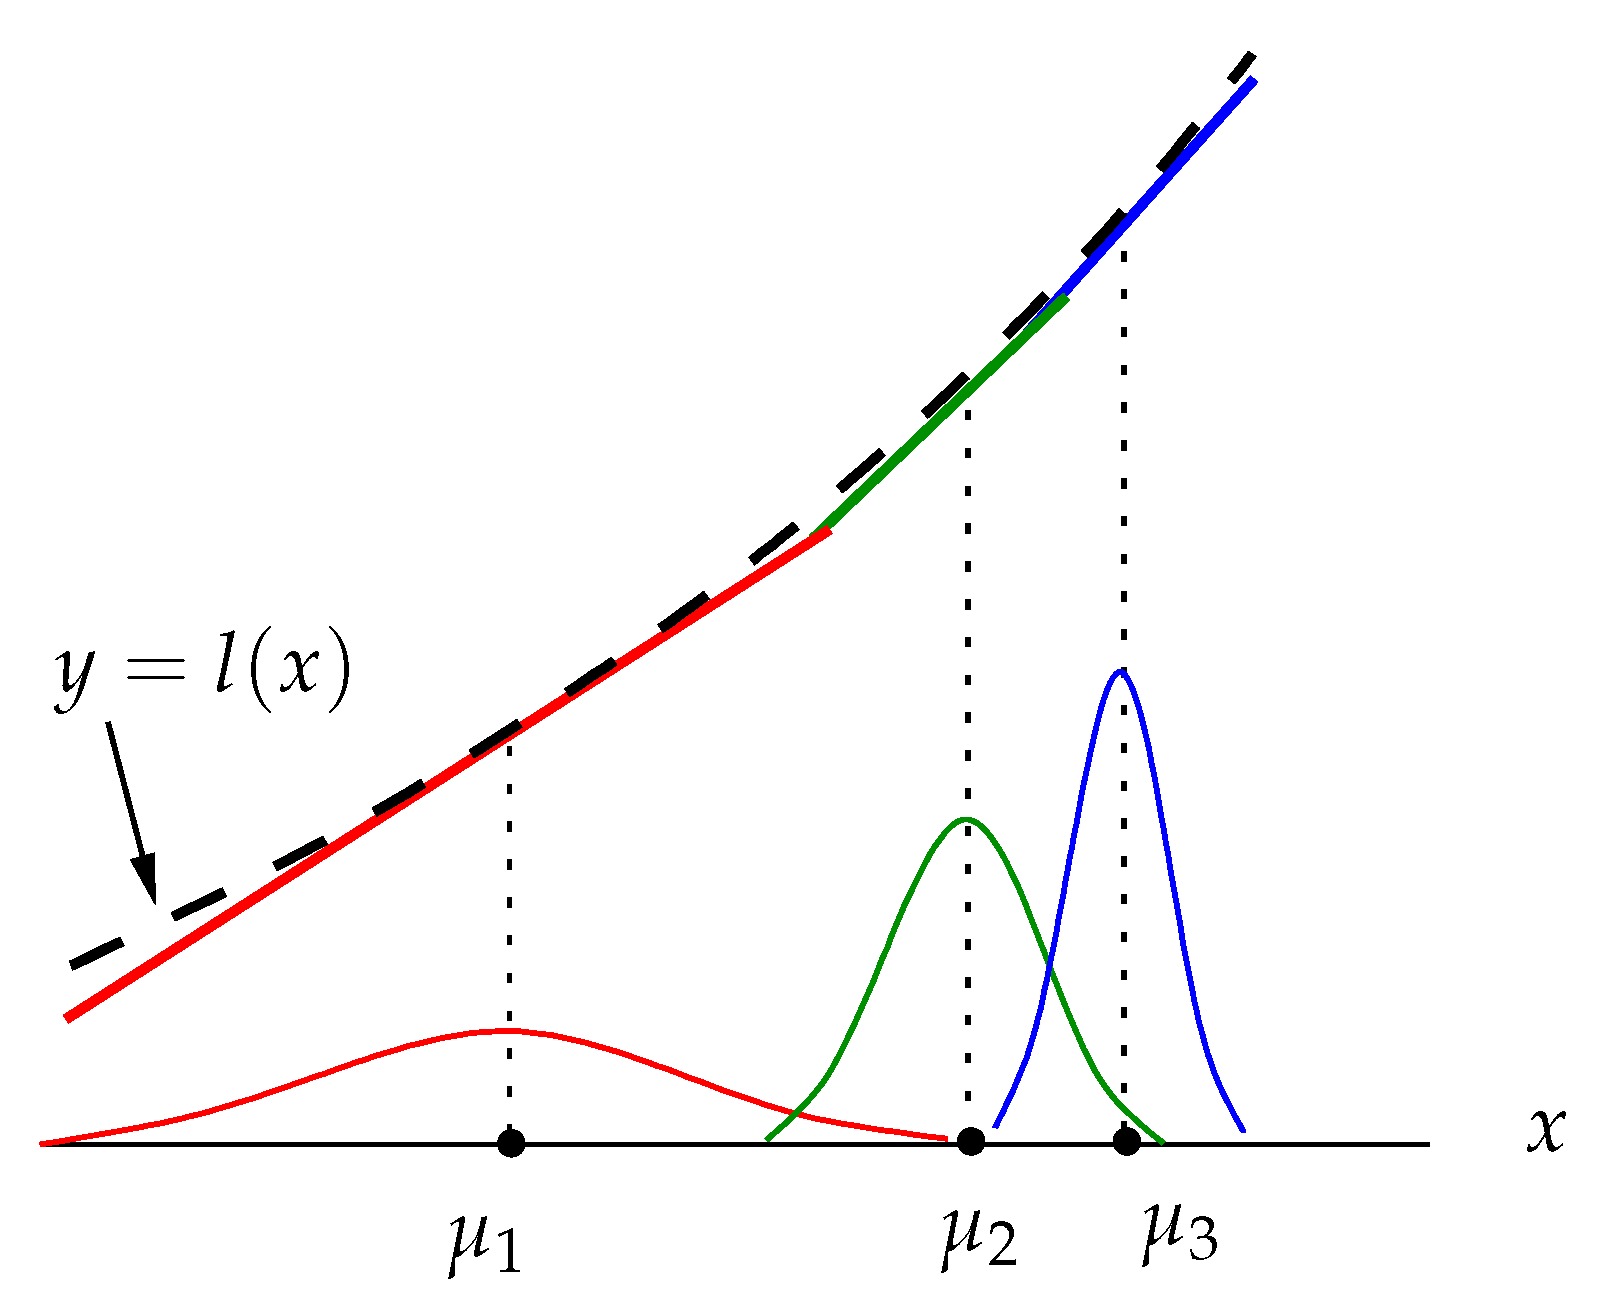
is a matrix containing the sensitivities of observable variables versus parameters computed at . Once, the load flow problem has been solved, the computation of sensitivities requires little extra time. The rational behind piece-wise linear approximation can be qualitatively illustrated with the help of Figure 4 showing the case of a single parameter x problem.
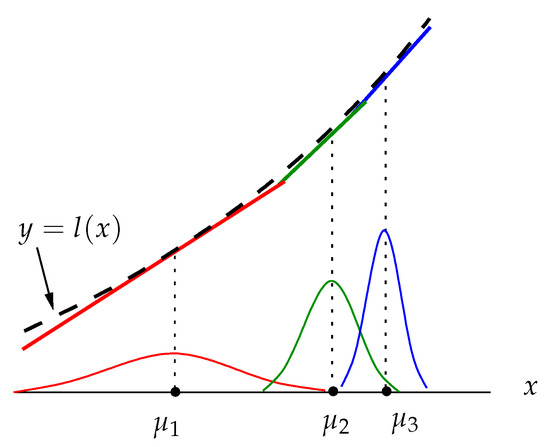
Figure 4.
Piece-wise linear approximation of the almost linear relationship around the GMM centers. Approximation accuracy is greater where is large.
In this example, the is given by the superposition of the three scaled Gaussian components reported in Figure 4. According to EM algorithm described in Section 2, the two centers and are placed where the is large and are close one each other. On the contrary, the center is placed at a greater distance apart where the is much smaller. As a result, the linearizations around and , where the majority of x samples will indeed occur, match tightly the load flow relationship while for , the linearization accuracy can be relaxed. In this way, the inaccuracy due to local linearization involves a few samples eventually producing a negligible effects on calculation.
Thanks to linearization (16), the , i.e., conditioned to the fact that the kth Gaussian component has been selected, is a multi-variate Gaussian distribution too whose mean vector and covariance matrix are easily computed [25]. In fact,
and
where denotes the expectation operator. Finally, exploiting conditional probability properties, we derive the GMM for the observable variables vector :
In conclusion, the GMM describing the joint statistics of uncertain PV powers is propagated through the load flow problem to describe the joint statistics of uncertain observable variables .
5. Numerical Experiments
The simulation experiments are performed on a modified three-phase version of the IEEE 69 bus test case [27]. This case is a single phase equivalent that we make three-phase in our simulation software [23]. For our simulation we use the same loads of the original case and the distribution grid topology, with the buses numbering reported in Figure 5.
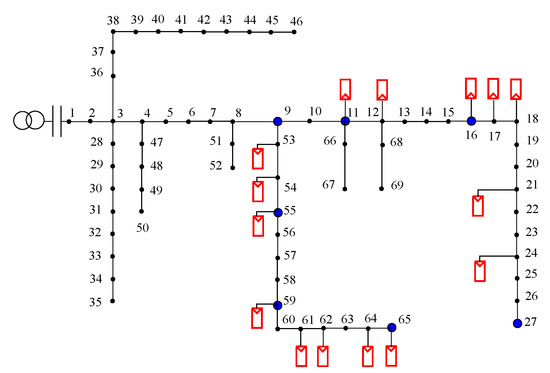
Figure 5.
The IEEE 69 bus distribution grid. In red the PV and in Blue the point of observation.
The single-phase IEEE 69, bus grid is first extended to a three-phase network by replicating the deterministic single-phase loads (i.e., the nominal active and reactive powers they absorb) at the three phases of each bus. Second, uncertainty is reproduced into the three-phase grid by injecting random PV generators distributed along the feeders. PV generators are connected to the three phases of fifteen buses as highlighted in Figure 5 and this results in an unbalanced three-phase network. Table 1 lists the injection bus numbers along with their nominal active power .

Table 1.
Injection Buses.
PV injected active powers are determined from nominal active power as follows:
where here denotes the PV penetration level, i.e., the ratio between the installed PV power and the nominal active one, while are normalized random variables defined as (10) extracted from a representative wide measurement data set [26]. On the whole, the number of random parameters is .
We want to quantify the impact that PV power injection uncertainty, with different penetration , can have on node voltages at some critical bus in the grid.
In the first experiment, in order to verify the effectiveness of the proposed method, we calculate the marginal PDF of the voltage nodes in the grid by using: (1) the proposed PWL methodology; (2) the MC method (with ) used here as a reference. To this aim, the joint of the random normalized powers is approximated by a GMM of the type (11). The GMM parameters (, and ) are determined with EM algorithm as seen in Section 2 (and in the Appendix A) and an adequate number of Gaussian components for the considered data set is found to be . Figure 6 shows the statistical distributions for some node voltages module (Phase-A) along the feeder from Bus-9 to Bus-65 as computed with PWL and MC methods when a PV penetration level is assumed. Similarly, Figure 7 reports the for some node voltages along the feeder from Bus-11 to Bus-27 for the same penetration level.
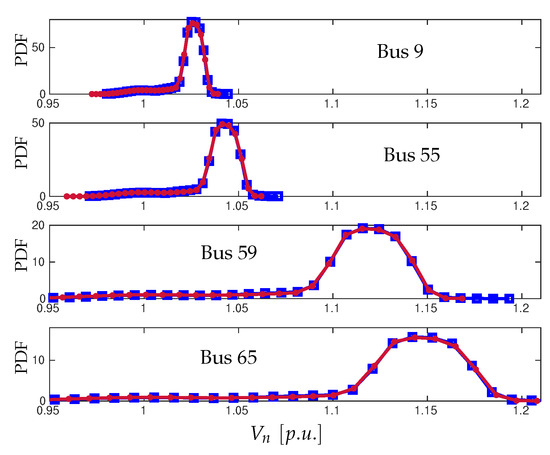
Figure 6.
at Buses {9, 55, 59, 65} along the feeder: (Square blue marker) computed with MC; (Dot red marker) computed with PWL method.

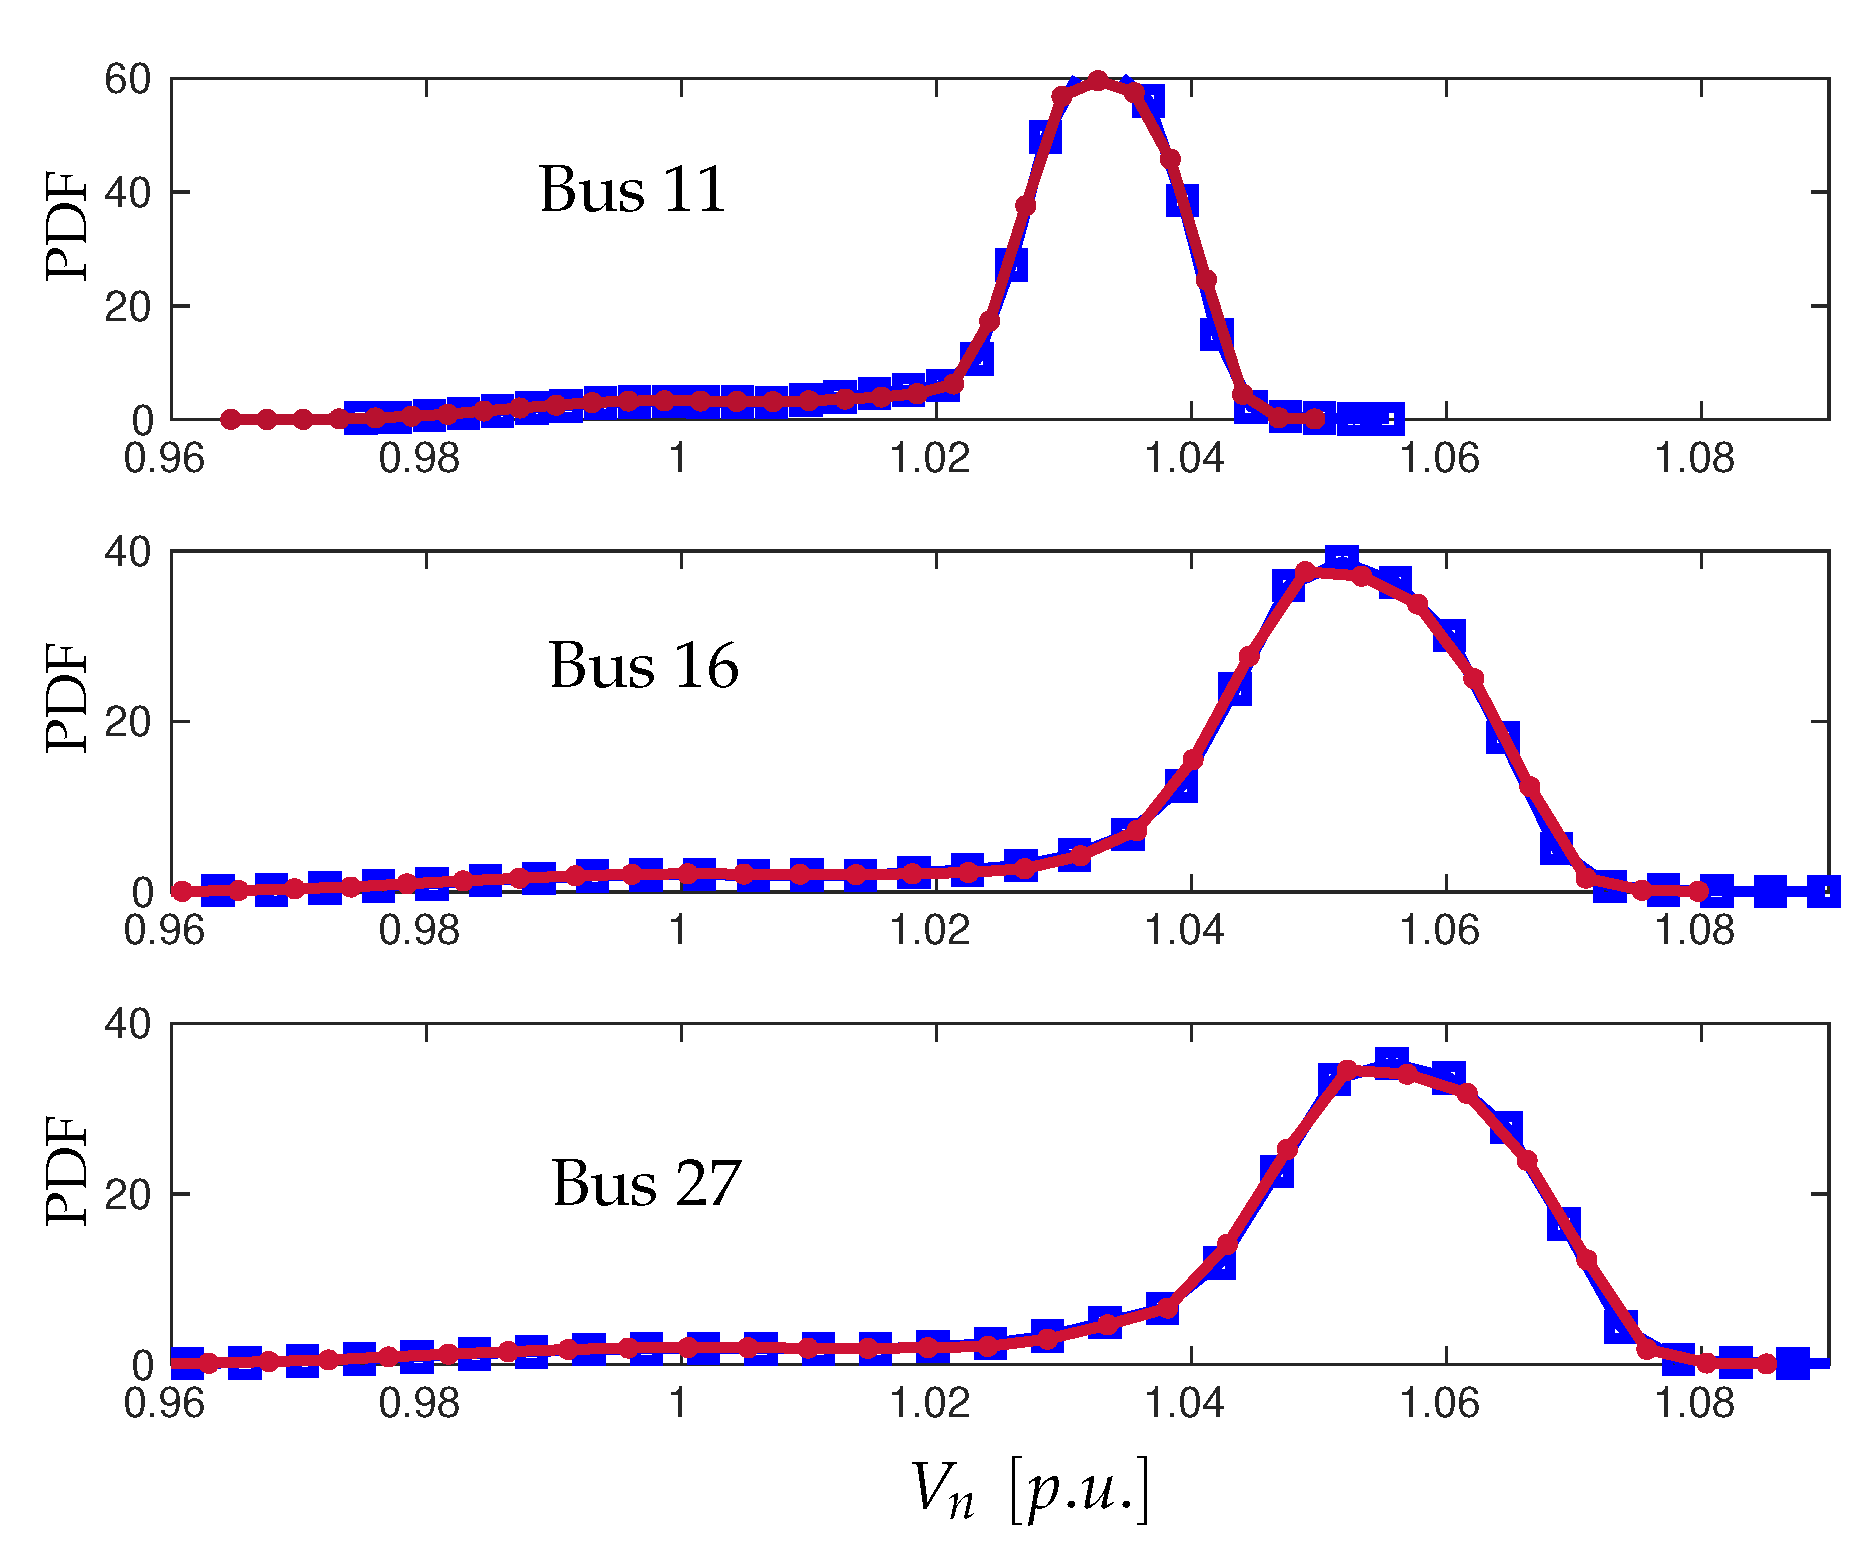
Figure 7.
at Buses {11, 16, 27} along the feeder: (Square blue marker) computed with MC; (Dot red marker) computed with PWL method.
Some observations are in order.
- 1
- In all of the nodes of the grid, the PDFs calculated by PWL and MC reference method match with excellent accuracy, the relative difference between them being always <0.5%.
- 2
- Marginal PDFs represent the a priori probability distributions of node voltages and are calculated from PV uncertainty model with no further information available (e.g., with no measurement information). In this condition, from Figure 6 and Figure 7, it is seen how voltage magnitude uncertainty interval grows moving from the internal Bus-9 towards external Bus-65 as well as from Bus-11 to Bus-27. Thus, Bus-65 and Bus-27 are the critical Buses in this grid, i.e., the ones with large voltage uncertainty.
- 3
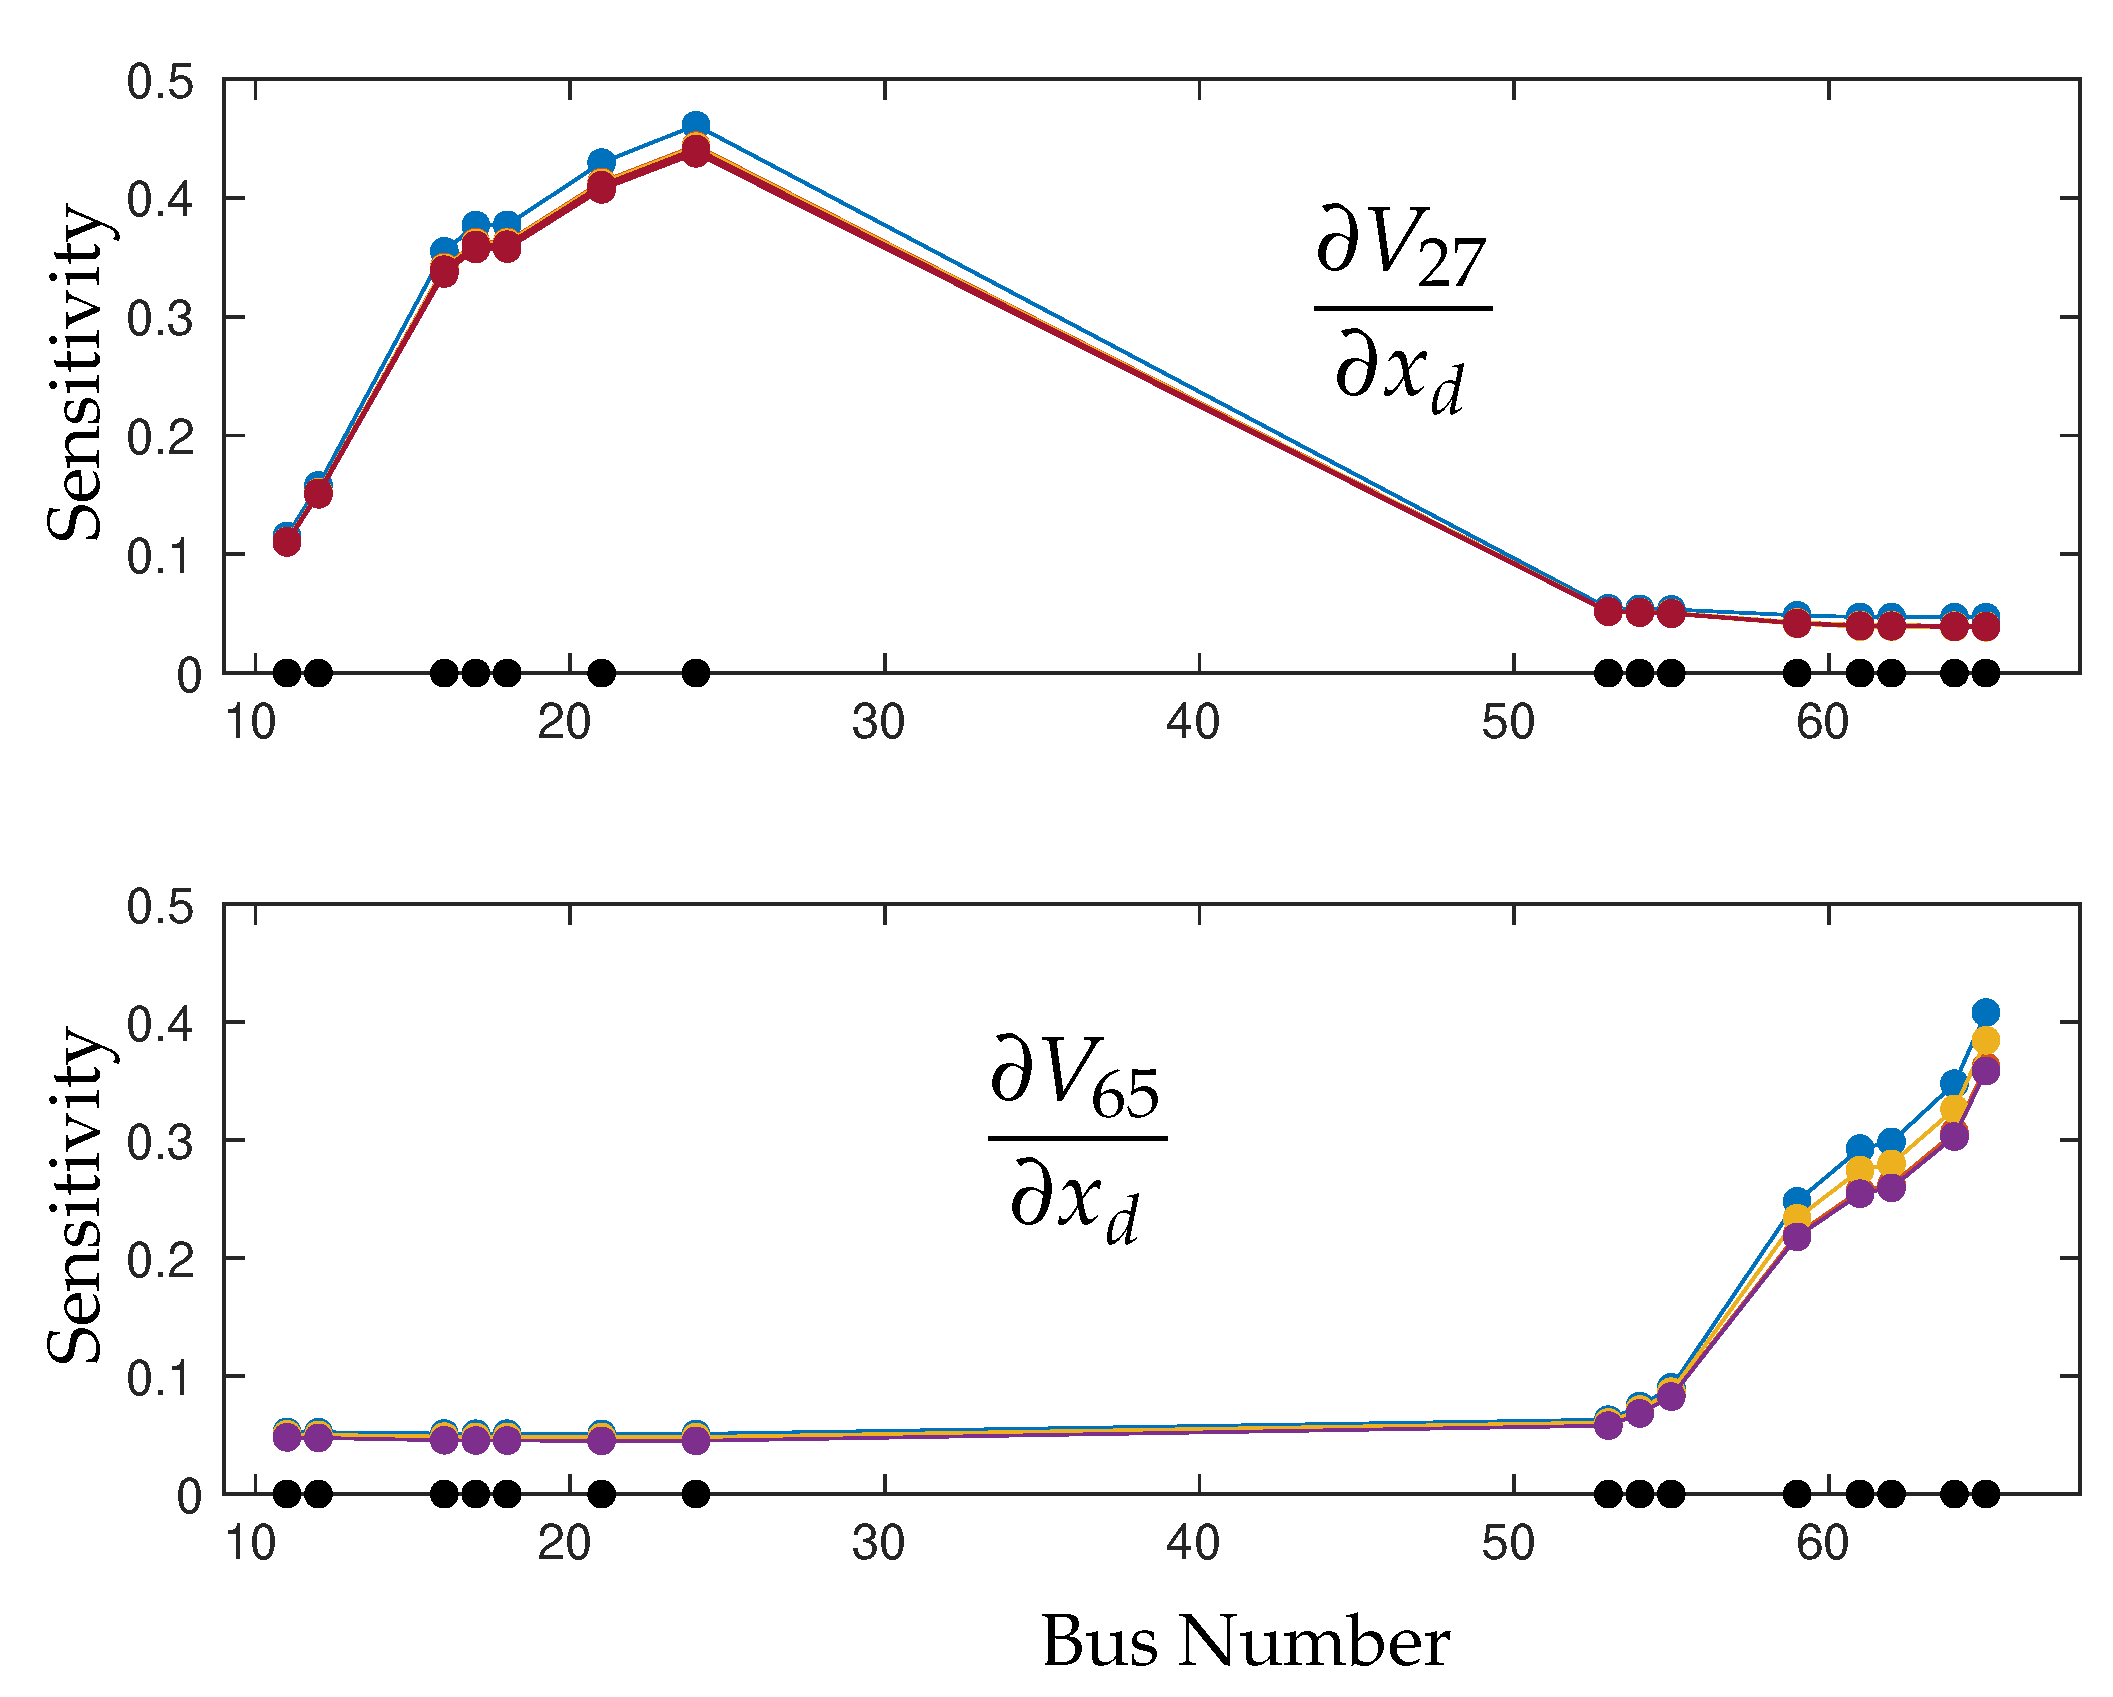
- Figure 8 shows the sensitivities of voltage magnitude at Bus-27 and Bus-65 (Phase-A) versus PV power at injection Buses (Phase-A). It is seen how voltage at Bus-27 exhibits large sensitivity with respect to injection Buses from 11 to 24 whereas voltage at Bus-65 mainly depends on power injection at Buses from 53 to 65.
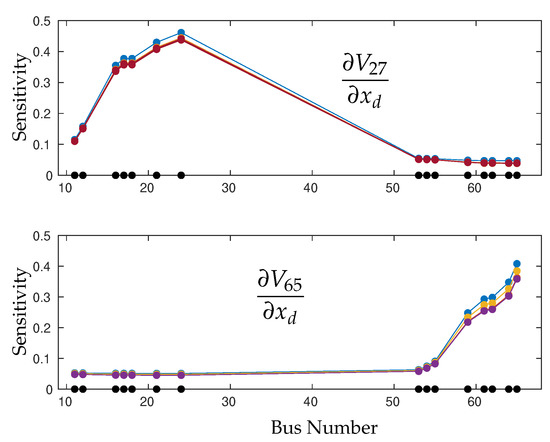 Figure 8. Sensitivities of voltage at Bus-27 and Bus-65 versus PV power at injection Buses.
It is worth observing how the sensitivity curves in Figure 8 are multi-valued functions: the sensitivity of a given voltage versus a given injection Bus number can take several values within an interval. This is due to the fact that sensitivity values reported in Figure 8 are computed at different cluster centers in the parameter space. Such space-varying sensitivity values determine the local piece-wise linear (PWL) approximations of voltage-power relationship.
- 4
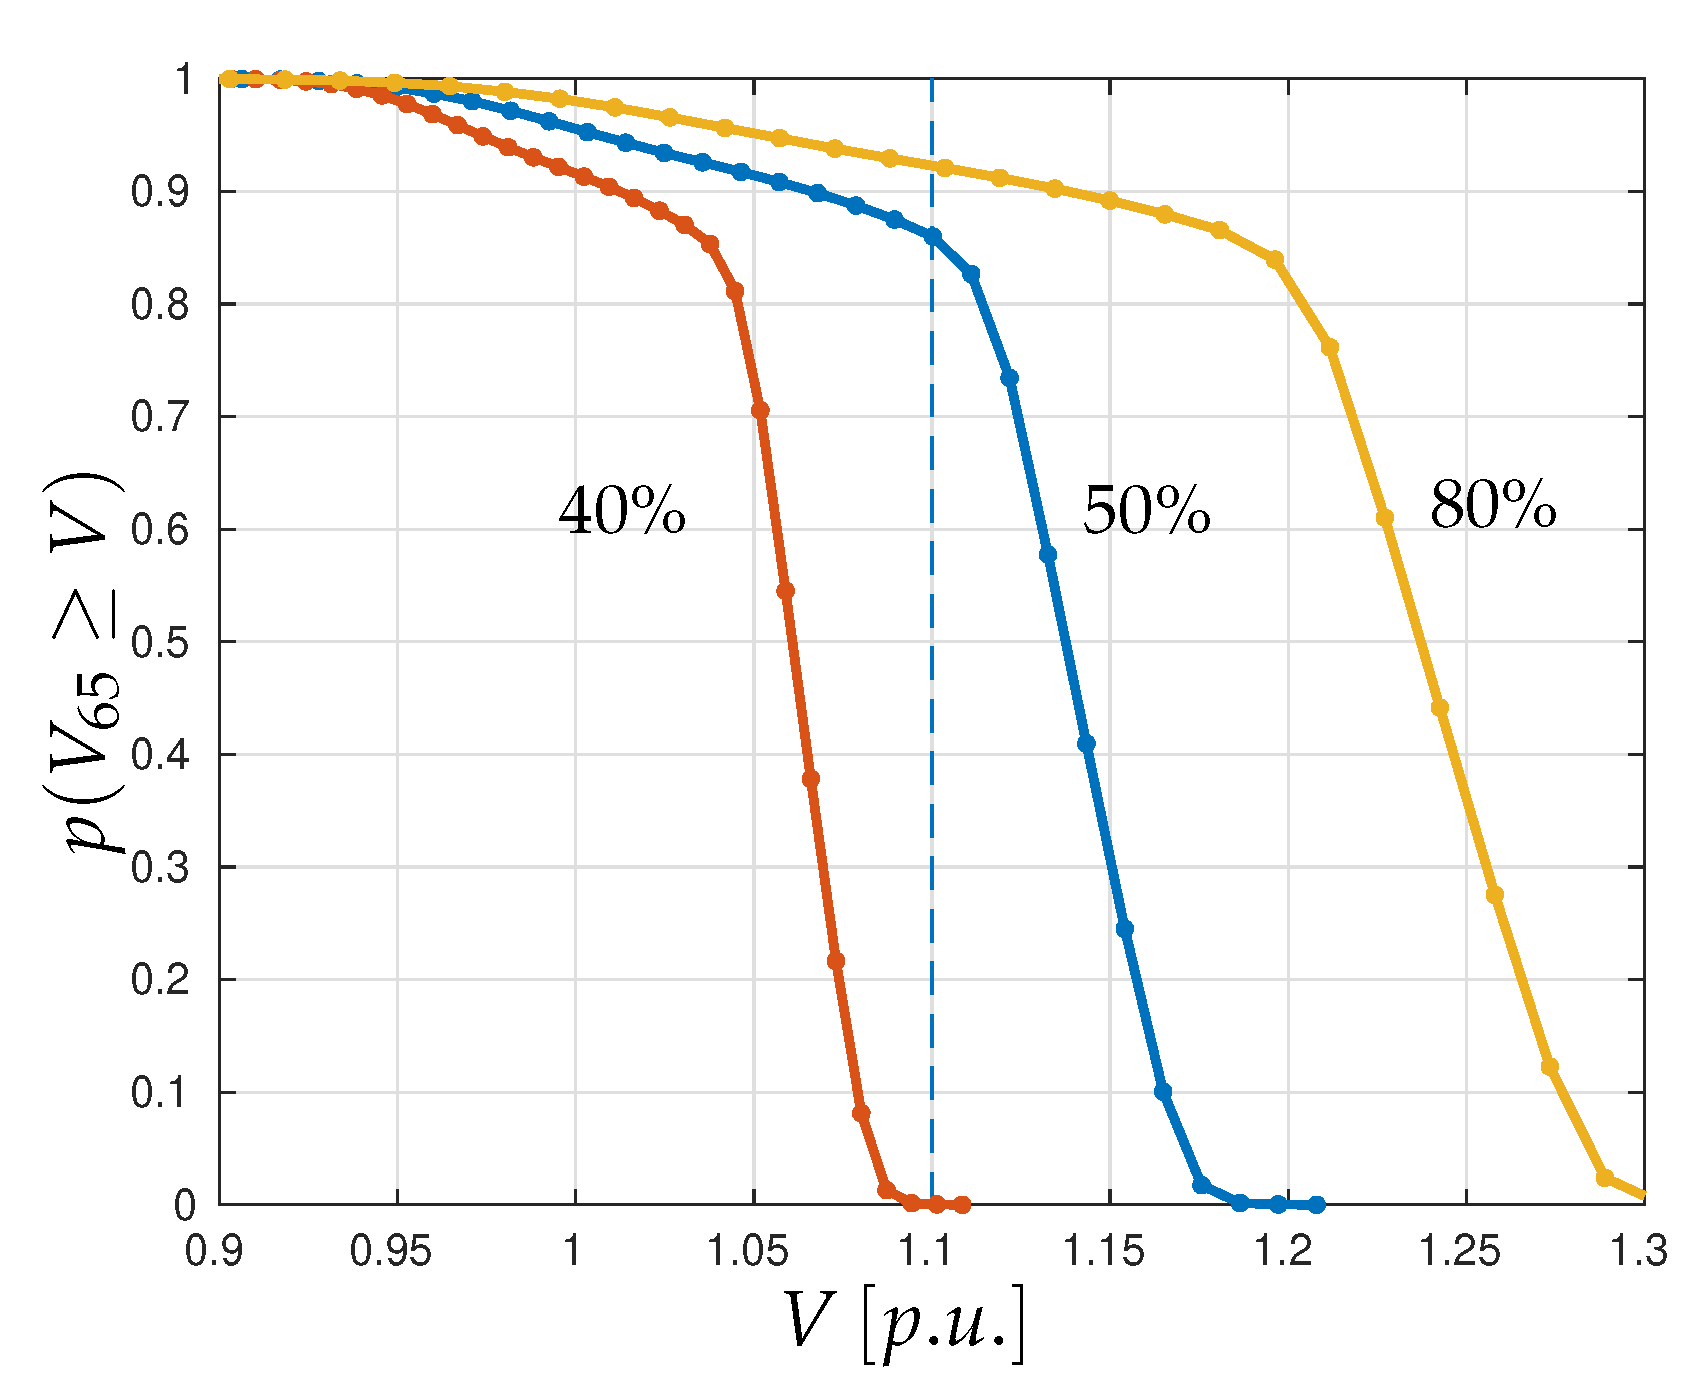
- The knowledge of marginal PDFs allows the evaluation of the probability that voltage magnitudes violate safe operating conditions. In fact, given and the Cumulative Distribution Function (CDF), the probability that voltage violates a upper threshold V can be calculated as:Thanks to the numerical efficiency of PWL simulation, we can rapidly explore several scenarios with different PV penetrations and evaluate threshold violation occurrence. Figure 9 reports the probabilities for growing penetration levels. For instance, if an upper threshold voltage p.u. is fixed, voltage violates the constraint with probability for PV penetration . The probability of violating the upper threshold limit p.u. is of ≈92% for PV penetration whereas it is decisively zero for . This means that, for the assumed upper threshold voltage, a PV hosting capacity corresponding to PV penetration is a safe limit.
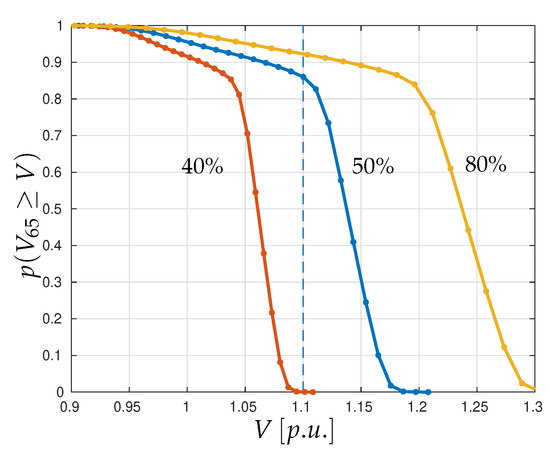 Figure 9. Probability of violating upper value V for growing penetration levels computed with PWL method.
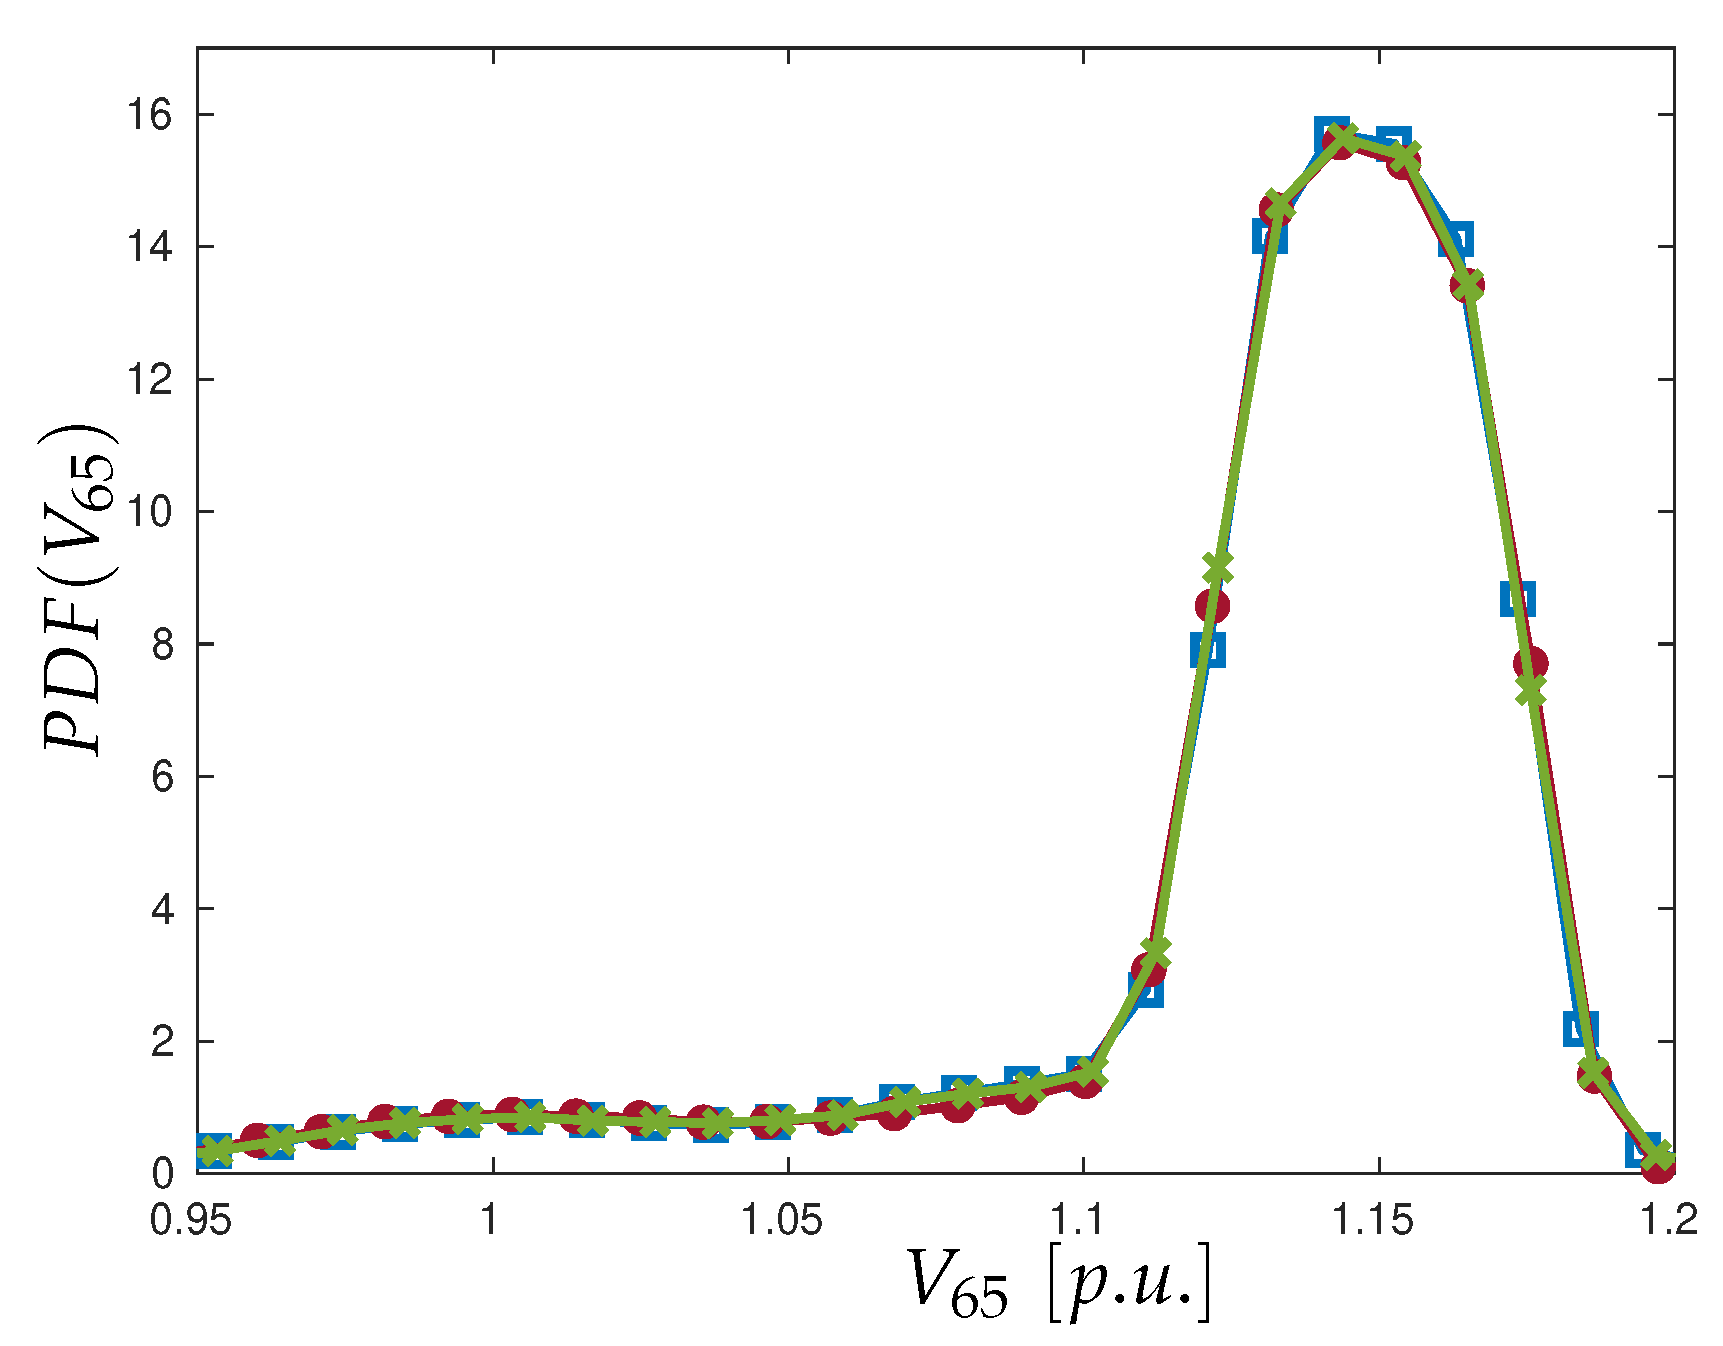
In the second experiment, we compare the PWL method to another state-of-the art technique employed in probability load flow problems. The technique relies on Copula method [28] for modeling correlated PV sources combined with generalized-Polynomial-Chaos (gPC) approximation [17,18,19]. Figure 10 reports the at Bus-65, in the IEEE 69 bus grid with PV random sources and penetration level , as computed with reference MC (10,000 simulations), with PWL method and with Copula+gPC method for expansion order . It is seen how the PDF shape predicted by both Copula+gPC and PWL method fit with great accuracy that given by reference MC method.
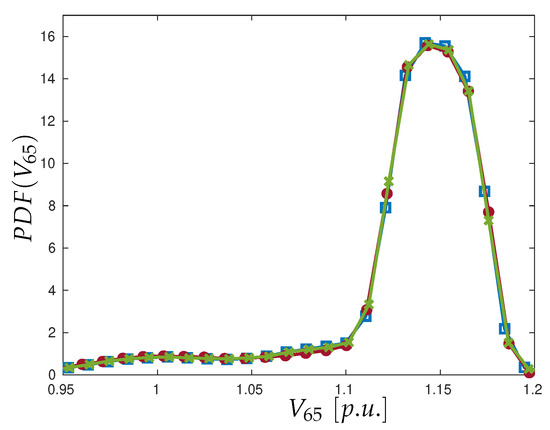
Figure 10.
Detail of the at Bus-65: (Square blue marker) computed with reference MC; (Dot red marker) computed with PWL method; (Green cross marker) computed with Copula and gPC (for expansion order ).
In Table 2, we report the number of Load Flow simulations required by the three methods, their simulation times on the same Quad-core computer, and the relative error (in PDF calculation) with respect to reference MC. It is seen how, in this experiment, PWL method introduces a remarkable speed-up compared to MC and a speed-up compared to Copula+gPC method.
Table 2.
Methods Comparison.
6. Discussion
In this paper an innovative approach to the probabilistic analysis of power grid with high PV penetration has been illustrated. The proposed approach is able to reproduce the uncertainty of correlated PV sources through a GMM model. The GMM method is general and can be applied to any type of data no matter if obtained with meter measurements, historic data set or simulations.
The proposed probabilistic analysis adopts a PWL approximation of the voltage-power LF relationship built around the GMM centers. PWL approximation exploits the multivariate information provided by voltage sensitivity calculations and allows the overcoming of the curse of dimensionality limitation exhibited by other surrogate models. For such reasons, it can be applied in those cases where PV injection is distributed in a large number of nodes.
In addition, it has been shown how the PWL method allows the deriving of closed-form expressions, for the joint PDF of a set of observable variables of interest by propagating the input GMM to the output. Via numerical examples, it has been shown how GMM model can be employed to identify critical buses in the grid, evaluate their a priori uncertainty intervals as well as the probability of violating safe operation conditions as a function of PV penetration. As a result, the numerically-efficient PWL analysis described in this paper is expected to become a worthwhile tool in the complex problem of estimating PV hosting capacity [29].
Author Contributions
Conceptualization, G.G. and P.M.; Data curation, G.G.; Formal analysis, L.D.; Investigation, G.G.; Methodology, P.M.; Software, P.M.; Validation, L.D.; Writing—review & editing, G.G., L.D. and P.M. All authors have read and agreed to the published version of the manuscript.
Funding
This research received no external funding.
Institutional Review Board Statement
Not applicable.
Informed Consent Statement
Not applicable.
Data Availability Statement
https://dkasolarcentre.com.au/ accessed on 1 January 2022.
Conflicts of Interest
The authors declare no conflict of interest.
Appendix A
In this Appendix, we sketch the main computational steps of the Expectation Maximization (EM) algorithm that, for a given data set , with , of samples and a given number K of Gaussian components (i.e., of clusters), calculates the parameters , and in GMM (11). The algorithm relies on computing the probability that sample i belongs to cluster k as follows:
The GMM parameters are derived as:
and
Expressions (A2)–(A4) are not a closed-form solution for the parameters because the terms depend themselves on parameters. However, the above equations can be evaluated in an iterative way. Starting from an initial guess for , and , expression (A1) is used to estimate the terms that, in turn, after substitution in (A2)–(A4) provide a better estimation for parameters. The algorithm has been proved to converge. More details can be found in [24], Ch. 9.
References
- Impram, S.; Varbak Nese, S.; Oral, B. Challenges of renewable energy penetration on power system flexibility: A survey. Energy Strategy Rev. 2020, 31, 100539. [Google Scholar] [CrossRef]
- Mortazavi, H.; Mehrjerdi, H.; Saad, M.; Lefebvre, S.; Asber, D.; Lenoir, L. A Monitoring Technique for Reversed Power Flow Detection With High PV Penetration Level. IEEE Trans. Smart Grid 2015, 6, 2221–2232. [Google Scholar] [CrossRef]
- Chevalier, S.; Schenato, L.; Daniel, L. Accelerated Probabilistic Power Flow in Electrical Distribution Networks via Model Order Reduction and Neumann Series Expansion. IEEE Trans. Power Syst. 2021, 37, 2151–2163. [Google Scholar] [CrossRef]
- Memon, Z.A.; Trinchero, R.; Xie, Y.; Canavero, F.G.; Stievano, I.S. An Iterative Scheme for the Power-Flow Analysis of Distribution Networks based on Decoupled Circuit Equivalents in the Phasor Domain. Energies 2020, 13, 386. [Google Scholar] [CrossRef] [Green Version]
- Tang, J.; Ni, F.; Ponci, F.; Monti, A. Dimension-Adaptive Sparse Grid Interpolation for Uncertainty Quantification in Modern Power Systems: Probabilistic Power Flow. IEEE Trans. Power Syst. 2016, 31, 907–919. [Google Scholar] [CrossRef]
- Vallée, F.; Klonari, V.; Lisiecki, T.; Durieux, O.; Moiny, F.; Lobry, J. Development of a probabilistic tool using Monte Carlo simulation and smart meters measurements for the long term analysis of low voltage distribution grids with photovoltaic generation. Int. J. Electr. Power Energy Syst. 2013, 53, 468–477. [Google Scholar] [CrossRef]
- Ramadhani, U.H.; Shepero, M.; Munkhammar, J.; Widén, J.; Etherden, N. Review of probabilistic load flow approaches for power distribution systems with photovoltaic generation and electric vehicle charging. Int. J. Electr. Power Energy Syst. 2020, 120, 106003. [Google Scholar] [CrossRef]
- Lai, C.S.; Jia, Y.; McCulloch, M.D.; Xu, Z. Daily clearness index profiles cluster analysis for photovoltaic system. IEEE Trans. Ind. Informatics 2017, 13, 2322–2332. [Google Scholar] [CrossRef]
- Li, F.; Lin, Y.; Guo, J.; Wang, Y.; Mao, L.; Cui, Y.; Bai, Y. Novel models to estimate hourly diffuse radiation fraction for global radiation based on weather type classification. Renew. Energy 2020, 157, 1222–1232. [Google Scholar] [CrossRef]
- Gruosso, G.; Maffezzoni, P. Data-driven uncertainty analysis of distribution networks including photovoltaic generation. Int. J. Electr. Power Energy Syst. 2020, 121, 106043. [Google Scholar] [CrossRef]
- Fan, M.; Vittal, V.; Heydt, G.T.; Ayyanar, R. Probabilistic power flow studies for transmission systems with photovoltaic generation using cumulants. IEEE Trans. Power Syst. 2012, 27, 2251–2261. [Google Scholar] [CrossRef]
- Widén, J.; Shepero, M.; Munkhammar, J. Probabilistic load flow for power grids with high PV penetrations using copula-based modeling of spatially correlated solar irradiance. IEEE J. Photovoltaics 2017, 7, 1740–1745. [Google Scholar] [CrossRef]
- Palahalli, H.; Maffezzoni, P.; Gruosso, G. Gaussian Copula Methodology to Model Photovoltaic Generation Uncertainty Correlation in Power Distribution Networks. Energies 2021, 14, 2349. [Google Scholar] [CrossRef]
- Wang, Z.; Kang, J.; Cheng, L.; Pei, Z.; Dong, C.; Liang, Z. Mixed Gaussian Models for Modeling Fluctuation Process Characteristics of Photovoltaic Outputs. Front. Energy Res. 2019, 7, 76. [Google Scholar] [CrossRef] [Green Version]
- Ke, D.; Chung, C.; Sun, Y. A novel probabilistic optimal power flow model with uncertain wind power generation described by customized Gaussian mixture model. IEEE Trans. Sustain. Energy 2015, 7, 200–212. [Google Scholar] [CrossRef]
- Alspach, D.; Sorenson, H. Nonlinear Bayesian estimation using Gaussian sum approximations. IEEE Trans. Autom. Control 1972, 17, 439–448. [Google Scholar] [CrossRef]
- Xiu, D.; Karniadakis, G.E. The Wiener–Askey polynomial chaos for stochastic differential equations. SIAM J. Sci. Comput. 2002, 24, 619–644. [Google Scholar] [CrossRef]
- Ren, Z.; Li, W.; Billinton, R.; Yan, W. Probabilistic power flow analysis based on the stochastic response surface method. IEEE Trans. Power Syst. 2015, 31, 2307–2315. [Google Scholar] [CrossRef]
- Gruosso, G.; Netto, R.S.; Daniel, L.; Maffezzoni, P. Joined Probabilistic Load Flow and Sensitivity Analysis of Distribution Networks Based on Polynomial Chaos Method. IEEE Trans. Power Syst. 2020, 35, 618–627. [Google Scholar] [CrossRef]
- Munikoti, S.; Natarajan, B.; Jhala, K.; Lai, K. Probabilistic Voltage Sensitivity Analysis to Quantify Impact of High PV Penetration on Unbalanced Distribution System. IEEE Trans. Power Syst. 2021, 36, 3080–3092. [Google Scholar] [CrossRef]
- Fan, M.; Vittal, V.; Heydt, G.T.; Ayyanar, R. Probabilistic Power Flow Analysis With Generation Dispatch Including Photovoltaic Resources. IEEE Trans. Power Syst. 2013, 28, 1797–1805. [Google Scholar] [CrossRef]
- Powell, L. Power System Load Flow Analysis; Electrical Engineering; Mcgraw-Hill: New York, NY, USA, 2004. [Google Scholar]
- Maffezzoni, P.; Gruosso, G. Complex-Array-Operation Newton Solver for Power Grids Simulations. IEEE Access 2020, 8, 47984–47992. [Google Scholar] [CrossRef]
- Bishop, C.M. Pattern Recognition and Machine Learning, 1st ed.; Springer: Berlin/Heidelberg, Germany, 2006. [Google Scholar]
- Papoulis, A.; Pillai, U. Probability, Random Variables and Stochastic Processes, 4th ed.; McGraw-Hill: New York, NY, USA, 2001. [Google Scholar]
- DKA Solar Centre. Alice Springs Project. Available online: https://dkasolarcentre.com.au/ (accessed on 1 February 2022).
- Das, D. Optimal placement of capacitors in radial distribution system using a Fuzzy-GA method. Int. J. Electr. Power Energy Syst. 2008, 30, 361–367. [Google Scholar] [CrossRef]
- Munkhammar, J.; Widén, J.; Hinkelman, L.M. A copula method for simulating correlated instantaneous solar irradiance in spatial networks. Sol. Energy 2017, 143, 10–21. [Google Scholar] [CrossRef]
- Abad, M.S.S.; Ma, J.; Zhang, D.; Ahmadyar, A.S.; Marzooghi, H. Probabilistic Assessment of Hosting Capacity in Radial Distribution Systems. IEEE Trans. Sustain. Energy 2018, 9, 1935–1947. [Google Scholar] [CrossRef]


Publisher’s Note: MDPI stays neutral with regard to jurisdictional claims in published maps and institutional affiliations. |
© 2022 by the authors. Licensee MDPI, Basel, Switzerland. This article is an open access article distributed under the terms and conditions of the Creative Commons Attribution (CC BY) license (https://creativecommons.org/licenses/by/4.0/).