Article

Renewable Energy Community Pairing Methodology Using Statistical Learning Applied to Georeferenced Energy Profiles

by
Alexandre Lucas
* and
Salvador Carvalhosa
INESC Technology and Science (INESC TEC), 4200-465 Porto, Portugal
*
Author to whom correspondence should be addressed.
Energies 2022, 15(13), 4789; https://doi.org/10.3390/en15134789
Submission received: 7 April 2022 / Revised: 13 May 2022 / Accepted: 18 May 2022 / Published: 29 June 2022

Abstract

:
Renewable energy communities (REC) are bound to play a crucial role in the energy transition, as their role, activities, and legal forms become clearer, and their dissemination becomes larger. Even though their mass grid integration, is regarded with high expectations, their diffusion, however, has not been an easy task. Its legal form and success, entail responsibilities, prospects, trust, and synergies to be explored between its members, whose collective dynamics should aim for optimal operation. In this regard, the pairing methodology of potential participants ahead of asset dimensioning seems to have been overlooked. This article presents a methodology for pairing consumers, based on their georeferenced load consumptions. A case study in an area of Porto (Asprela) was used to test the methodology. QGIS is used as a geo-representation tool and its PlanHeat plugin for district characterization support. A supervised statistical learning approach is used to identify the feature importance of an overall district energy consumption profile. With the main variables identified, the methodology applies standard K-means and Dynamic Time Warping clustering, from which, users from different clusters should be paired to explore PV as the main generation asset. To validate the assumption that this complementarity of load diagrams could decrease the total surplus of a typical PV generation, 18 pairings were tested. Results show that, even though it is not true that all pairings from different clusters lead to lower surplus, on average, this seems to be the trend. From the sample analyzed a maximum of 36% and an average of 12% less PV surplus generation is observed.

1. Introduction

Renewable energy communities (REC) are expected to have a pivotal role to reach European energy and decarbonization goals. Their implementation, however, is not a straightforward process and relies on multiple factors such as local policies, individual financial expectations, technological adoption level, trustworthiness, risk perception, identifying suitable and willing participants, or governance, just to mention a few. Tackling this means recognizing that, despite the transposition of the electricity market directive to local legislation, there are still numerous member states with very low REC. Consumer awareness towards market participation, through flexibility provision, intracommunity services, and digitalization should be increased, by developing the necessary tools for informative and effective decision making.

1.1. Landscape and Regulatory Framework

In 2019, the European Union (EU) published the Clean Energy for all Europeans Package (CEP) [1], proceeded by the Green Deal strategy document [2], setting the climate and energy targets, looking at the 2030 horizon, and the regulatory framework to achieve those ambitions. The digitalization of the energy sector over the last few years, along with citizen engagement increase, and new technologies such as electric vehicles (EV), energy management systems, smart meters, and local PV generation, are paving the way for new business models and the way energy is perceived and consumed. The regulatory package clarifies many concepts and roles to accomplish the set targets, among them, the role of renewable energy communities (REC).
According to a 2019 report by the JRC [3] on the topic, in Europe, there were over 3500 renewable energy cooperatives and other types of energy communities, and the number keeps on increasing as member states clarify and mature their legal frameworks. Most of these communities are in the Netherlands, the UK, Sweden, and, above all, Germany. Although energy decarbonization is still far from being achieved, the green transition seems to be definitively in progress. According to preliminary Eurostat data, in 2020, more electricity came from renewables than from fossil fuels for the first time. REC rules and guidelines from the CEP electricity directive are being, and in the same case were already, transposed to national laws with some variations by member states, but the categories of focus rely mainly on 4 aspects: activities, participants, autonomy, and effective control.
Energy communities can both follow the traditional approach to business or engage in new activities. Typically, smaller-scale community initiatives are mostly involved in renewable generation. However, as the concept matures, energy communities have started to take on new roles of energy and energy services providers. The energy initiatives, analyzed by the JRC [3], show that they might engage in some or all of the following summarized activities:
  • Consumption and sharing: the energy produced by the energy community is shared and used inside the community, often called self and collective consumption of electricity from the co-owned generating resources.
  • Supply: the sale of electricity and gas to customers. Often, larger communities, which have a high number of retail customers in their vicinity, may also engage in aggregation activities, combining load flexibility or generation to bid, purchase or auction in electricity markets [4].
  • Distribution: ownership and/or management of community distribution networks, including electricity, district heating, or gas networks. Cooperatives may participate in generation and distribution, but their central business is the network infrastructure [5].
  • Generation: from co-owned assets such as solar, wind, or hydro, where members do not self-consume the energy produced but instead feed it into the network and sell it to a supplier [6].
  • Energy services include projects for the renovation of buildings, energy auditing, consumption monitoring, heating, and air quality assessments for energy efficiency. It may extend to smart grid integration, energy monitoring, and energy management for network operation.
  • Electro-mobility: Services promoting car sharing, charging stations operation and management, or provision of EV cards for members and cooperatives.

1.2. Renewable Energy Community in Research

Renewable Energy Communities, have been a well-covered topic in the literature, especially since the release of the CEP and the clear statement by the ETIP SNET [7] research roadmap until 2030. The roadmap identifies REC, as an important enabler of the user-centric energy transition, with the ability to promote consumer sustainability awareness, demand response sensitivity, renewable energy technology adoption, and even flexibility markets. This is expected as research supports policy development, and many issues only start to arise, when concepts are put into practice. Authors in [8] provide an overview of success factors that may influence, the creation and growth of energy communities. They point out the great contribution of research projects under the European Frameworks to the study, tool development, and consumer engagement regarding REC. Particularly, the funding effort from the research frameworks in H2020 was remarkable and unleashed many research subjects. Various classifications may describe the vast work done, but for the purpose of framing this study, one can divide them into the following three: (i) Asset dimensioning and optimizations, (ii) socioeconomic impacts, barriers, and willingness of adoption and (iii) specification and development of new algorithms for REC and efficient operations

1.2.1. Asset Dimensioning and Optimization

On this topic, a mediatic project was developed under the NRG2peers consortium [9]. The project used a gamification approach to connect energy communities together, in a peer-to-peer approach aiming to support knowledge sharing on asset dimensioning, finance, business models, specific actions, and other aspects of creating and upscaling energy communities and the preliminary results have already been published [10]. Another project under the H2020 framework is MERLON [11,12]. It introduces an integrated modular local energy management framework, for the holistic operational and optimization of local energy systems, in the presence of high shares of volatile distributed renewable energy sources. The consortium considered different elements such as reliability, the flexibility of consumers, and DSO needs. Even though they consider the load profile, hence the time domain, the geographic domain is however not considered. The project produced an online tool called RENERGISE, which helps in the design of the community based on a resource-based option. It provides the dynamics of the system’s potential revenues and performance estimates regarding the self-sufficient ratio or consumption ratio. Another approach is from the DSO side, which looks at aspects such as node capacity allocation. Yet another approach, is focused on social engagement for the potential participants to interact and realize their potential by promoting workshops for awareness increase. Other studies focus on exploring the synergies of participants in a resource-based approach. Authors in [13], model three different energy community configurations, sustained on collective photovoltaics self-consumption, varying the centralization level configurations. Their results show for example, that all the studied collective arrangements can promote a higher penetration of photovoltaic capacity (up to 23%) and a modest reduction in the overall cost of electricity.

1.2.2. Social-Economic Impact Evaluation of REC

This category of factors refers to the social, cultural, economic, and political setting, within which energy communities operate. The geographical location of community-based energy projects implies that economic differences play a role in their development. In general, the EU Member States with higher levels of disposable income, have a higher concentration of community energy initiatives. Community energy is most prevalent in the higher-income countries of Northern Western Europe, and less in Southern Europe and Eastern Europe. The variety of initiatives shows, however, that there is an interdependency of economic benefits and wider social and moral goals that, are tied to community engagement. Research [13] shows that a mix between social capital, civic-minded behavior, environmental concerns, and interpersonal trust, are important factors that motivate members to join energy communities. This interdependency of social and financial interests can strongly influence the size, type, and design of successful energy communities’ projects. The correlation between regions with higher levels of education and engagement in energy community projects is another factor highlighted in research [14].
Regarding European projects, the CIRCE [15] consortium is developing an e-market environment to enable stakeholders in creating contacts and proposing initiatives to carry out their specific ideas. The specific goal is to provide connections among the actors involved in the supply chain. In addition, the BENEFFICE [16] project is working on creating IoT-based innovations [17], able to leverage the ecosystem of stakeholders through low-cost, “plug-and-play-and forget” devices, but also on empowerment and a rewards approach, based on an alternative monetary currency [18]. The implementation of tools and platforms also has the goal of empowering citizens in becoming active, toward the implementation of energy-related actions, particularly around energy sharing from renewables generation [19].
The H2020 SocialRES project [20], is another example that provides a perspective from a social dynamic point of view. It provides a better understanding of socioeconomic, gender, sociocultural, and socio-political factors, and their interrelations with technological, regulatory, and investment-related aspects. The project has three objectives: (i) Comparative analysis of success potential; (ii) Comprehensive assessment of cooperation potential; (iii). Decision-making support and citizens empowerment [21].

1.2.3. Specification and Development of New Algorithms for REC and Efficient Operations

The LIGHTNESS [22] with preliminary results [23] and the RENAISSANCE [24] projects are developing methods to support citizens’ empowerment in the generation, sharing, and selling of renewable energy, through local engagement processes, and policy recommendations, and enabling platforms. Specifically, in the RENAISSANCE project, 4 demonstrators are being developed in Spain [25], Netherlands, Belgium [26], and Greece. Also 10 replication sites around the world. They apply a stakeholder co-creation methodology for design analysis size and revenue creation metrics. Under this category, compensation, and remuneration aspects are covered as well. Authors in [27] present a smart energy community management approach, which is capable of implementing P2P trading and managing household energy storage systems. A smart residential community concept is proposed, consisting of domestic users and a local energy pool, in which users are free to trade with the local energy pool and enjoy cheap renewable energy while avoiding the installation of new energy generation equipment.
From the categories of studies described above, it is evident that the trend is towards an assumed REC composition, where willing consumers pair with each other, without knowing the best fit members to pair with. Given the importance of REC and its effective use and behavior, there is the need to investigate its composition complementarities beyond the proximity, physical and geographical limitations, to incorporate the best dynamic match available in terms of load profile. In this study we describe a methodology and apply it to real data, to pair potential members of a renewable energy community.
The motivation for this work surges from the observation that, there is an unleashed potential in REC given the low numbers in several member states. This has several reasons, but an important one is the need to increase the awareness of potential members, provide supporting tools to assist their decisions, decrease risk perception, and mature expectations. In this article we provide the following contributions:
-
A brief revision of the main categories of research addressing REC
-
Methodology presentation for pairing REC members based on clustering
-
Case study presentation to apply the methodology
-
Verification of complementarity potential using pairing examples from the case study.
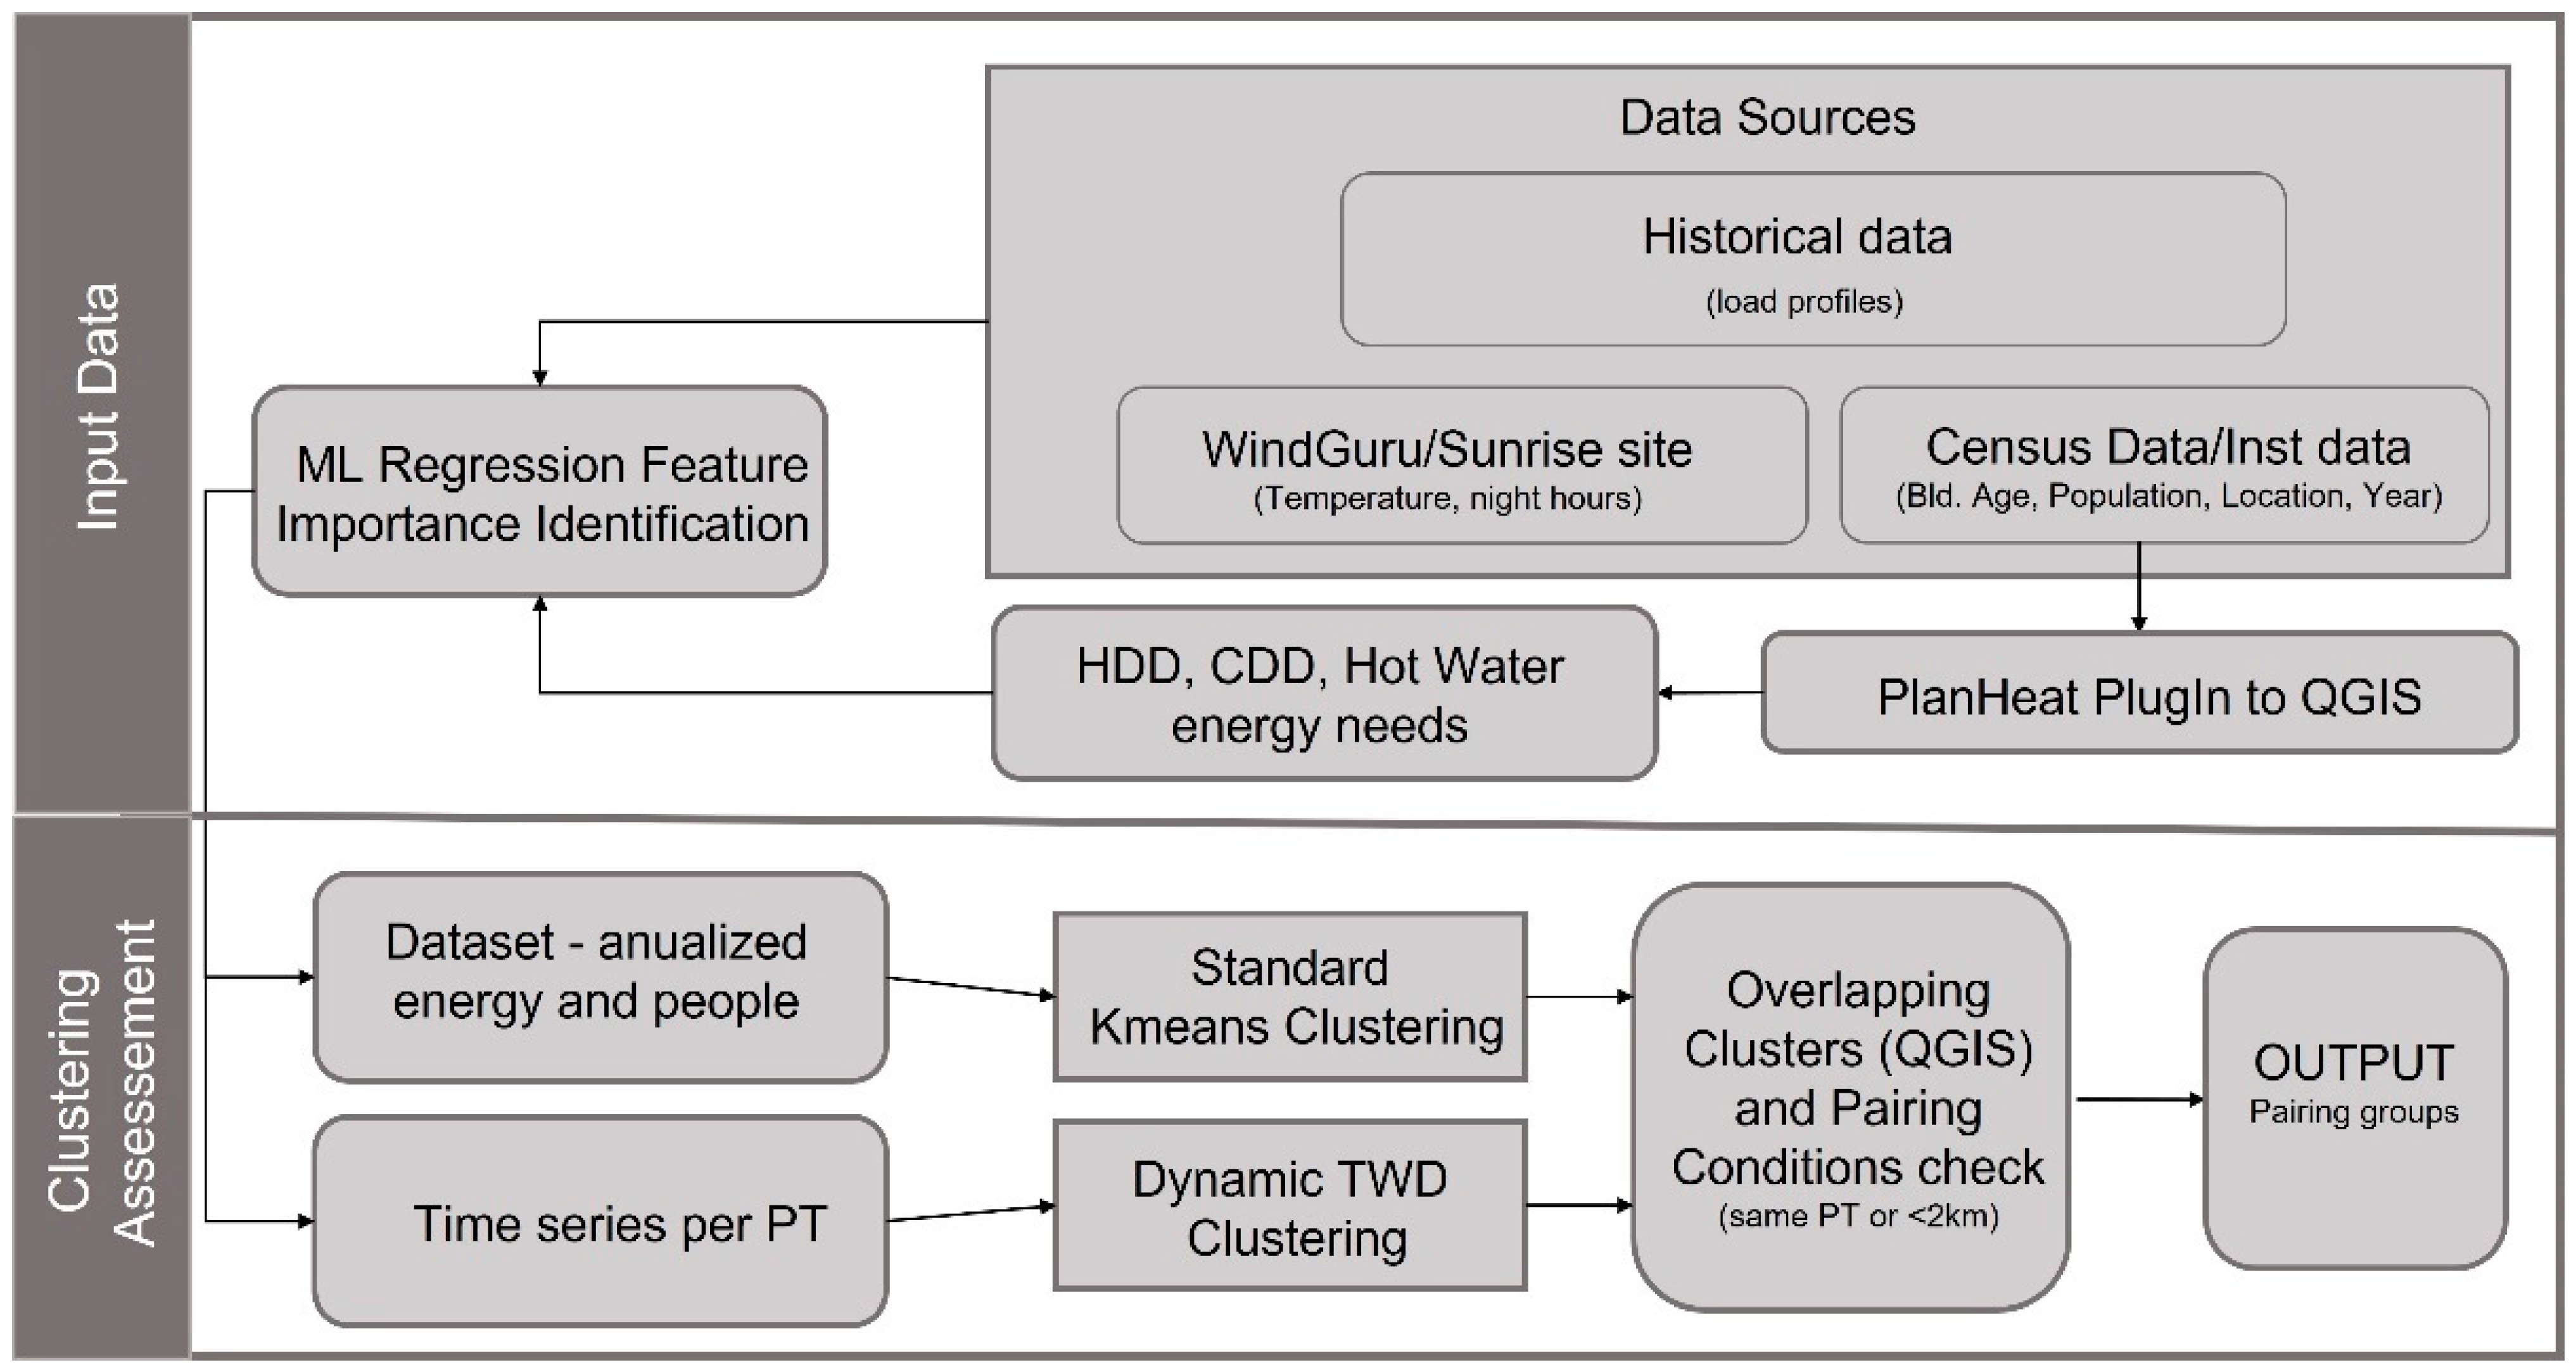
We believe that only after such methodology is applied and the pairing takes place, the assets should be dimensioned, and the corresponding investment analysis is done. We believe that this approach is a guide to increase awareness for social engagement of interested prosumers and would improve the return-on-investment of REC participants when complementarity is verified. The overall benefit is to de-risk investment in shared energy resources and maximizes the benefits, of new local energy communities. If the community members’ consumptions are not complementary, just from a collective auto-consumption point of view, it does not make sense to be in a community. In such a case, it would only bring advantages, if there was a co-investment, where risks and capital are shared in a nonlinear way (with scale effect), which rarely is the case.

2. Methodology

2.1. Renewable Energy Communities Paring

The reasons to engage in a REC are diverse and not exclusively the maximization of auto consumption. However, collective auto-consumption through reduction of surplus generating energy is in fact, the main driver to optimize resources, sharing, and promote efficient consumption. It is hence, used as a measure of success in this article for pairing members. By analyzing potential REC participants’ load consumptions profiles, three scenarios may occur:
  • The users’ consumption profiles are similar, and they overlap very well with the existent generation amplitude and hours. In this case, unless there are economies of scale and other investment synergies, users would not need to be in a REC as no surplus exist and most of the potential auto consumption is satisfied individually.
  • There are different load consumption profiles (peaks and valleys in different hours), whose difference does not improve auto-consumption. This can happen if a generation profile serves some consumer(s), but the surplus generation does not serve other(s) different user consumption profiles. This can happen if there is a mismatch with generation hours, such as night hours, which is unlikely especially if users in the same category are considered (residential, commercial, industrial, services, etc.). However, it depends on the assets dimensioned for the REC. If storage exists, then such profiles could be complementary as they can consume the stored electricity at different timings, but with a higher cost of infrastructure.
  • There are different load consumption profiles (peaks and valleys in different hours), whose differences improve the auto-consumption by capturing the generation hours and surplus that other consumer(s) cannot, which in practice is the most likely scenario to happen.
It is important to acknowledge that different profiles, do not imply complementarity as described above. The exact complementarity will depend on resource choice and dimensioning. It is considered that complementarity means a pairing that promotes higher use of surplus energy from existing generation assets (such as PV). Figure 1 shows an example, of two load diagrams, pairing similar profiles Figure 1a and different profiles Figure 1b. The complementarity is verified qualitatively if, higher collective auto-consumption is observed. Figure 1c shows that the resulting curve from those that belong to the same cluster in Figure 1a, does not enable as high auto-consumption as the resulting curve from the two complementary profiles.
Once the groups are identified for pairing, the size of the groups needs to be considered in terms of total energy consumption, to balance the contributions from the various clustered profiles. To develop this paring exercise using real data, a case study was considered to build the data sets and to verify the premise that, users from different clusters paired together, tend to have higher complementarity (lower generation surplus), than consumers from the same cluster. The surplus is measured in kWh and corresponds to the sum of all observations in a year of generation, not auto consumed, by the pairing of user 1 and user 2, given by Equation (1):
S u r p l u s = i = 1 8760 [ ( P g e n i ( P u s e r 1 i + P u s e r 2 i ) ) > 0 ]
All hourly observations in a year (8760) were standard scaled in terms of generation and consumption profiles so that the amplitude and the size of the consumers would not interfere with the analysis. The Z-score function in excel was used, which standardizes each value with regard to its time-series mean and standard deviation. After that, the generation is subtracted with the resultant consumption of the pairing. The remaining positive values (generation not consumed) are added.
Figure 2 shows the steps carried out in the proposed methodology. It starts by defining the year 2019 for the analysis (the last pre-pandemic year). The local DSO provided the georeferenced metering data, from the domestic secondary substations/Power Transformers (referred to here further as PTs), and helped identify, all the other commercial PTs. For privacy reasons and GDPR compliance, all commercial entities were contacted directly during the study, for data collection and consent.
We are confident that >98% of the data was collected, provided by load consumption, electricity bills, or other estimation proxies. The methodology starts by adding to the load consumption records, the data from the location’s (Asprela) weather, on an hourly basis, and sunlight hours from the WindGuru and the SunRiseandSunset websites. This is complemented by data from the censos 2021, for buildings and population characterization, as well as institutional data or commercial space details (number of clients and working hours). The location and year were input to QGIS to represent geographically the neighborhoods and provide inputs to the PlanHeat plugin. Similar district characterizations can be found in the literature using PlanHeat [28,29], and it is well accepted in the community. This plugin provides the heating, cooling, and hot water energy needs. Data treatment is needed after this stage, to address missing values and outliers. A machine learning regression was then carried out, for the 8760 observations (each hour), for all PTs, to identify the main features influencing energy consumption (dependent variable) dynamics. Once those variables were identified, two unsupervised learning models were run to cluster the PTs, based on two datasets (one per each). Atypical consumers, which may constitute by themselves single clusters have to be removed (considered outliers). One dataset captures total energy consumption, the number of people under each meter for the year 2019, and the PT category. The second dataset captures the hourly time dynamics of the energy consumption; hence a time-series clustering is needed. The output provided is two lists of georeferenced clusters, which are uploaded to QGIS for matching evaluation, and a color code is used to provide a visual recommendation on pairing. To verify complementarity, random pairings are done using a set of profiles from the same clustering, and another set of profiles from different clusters. The surplus generation is compared to see if different clustering pairing results in higher or lower surplus than the same cluster pairing.

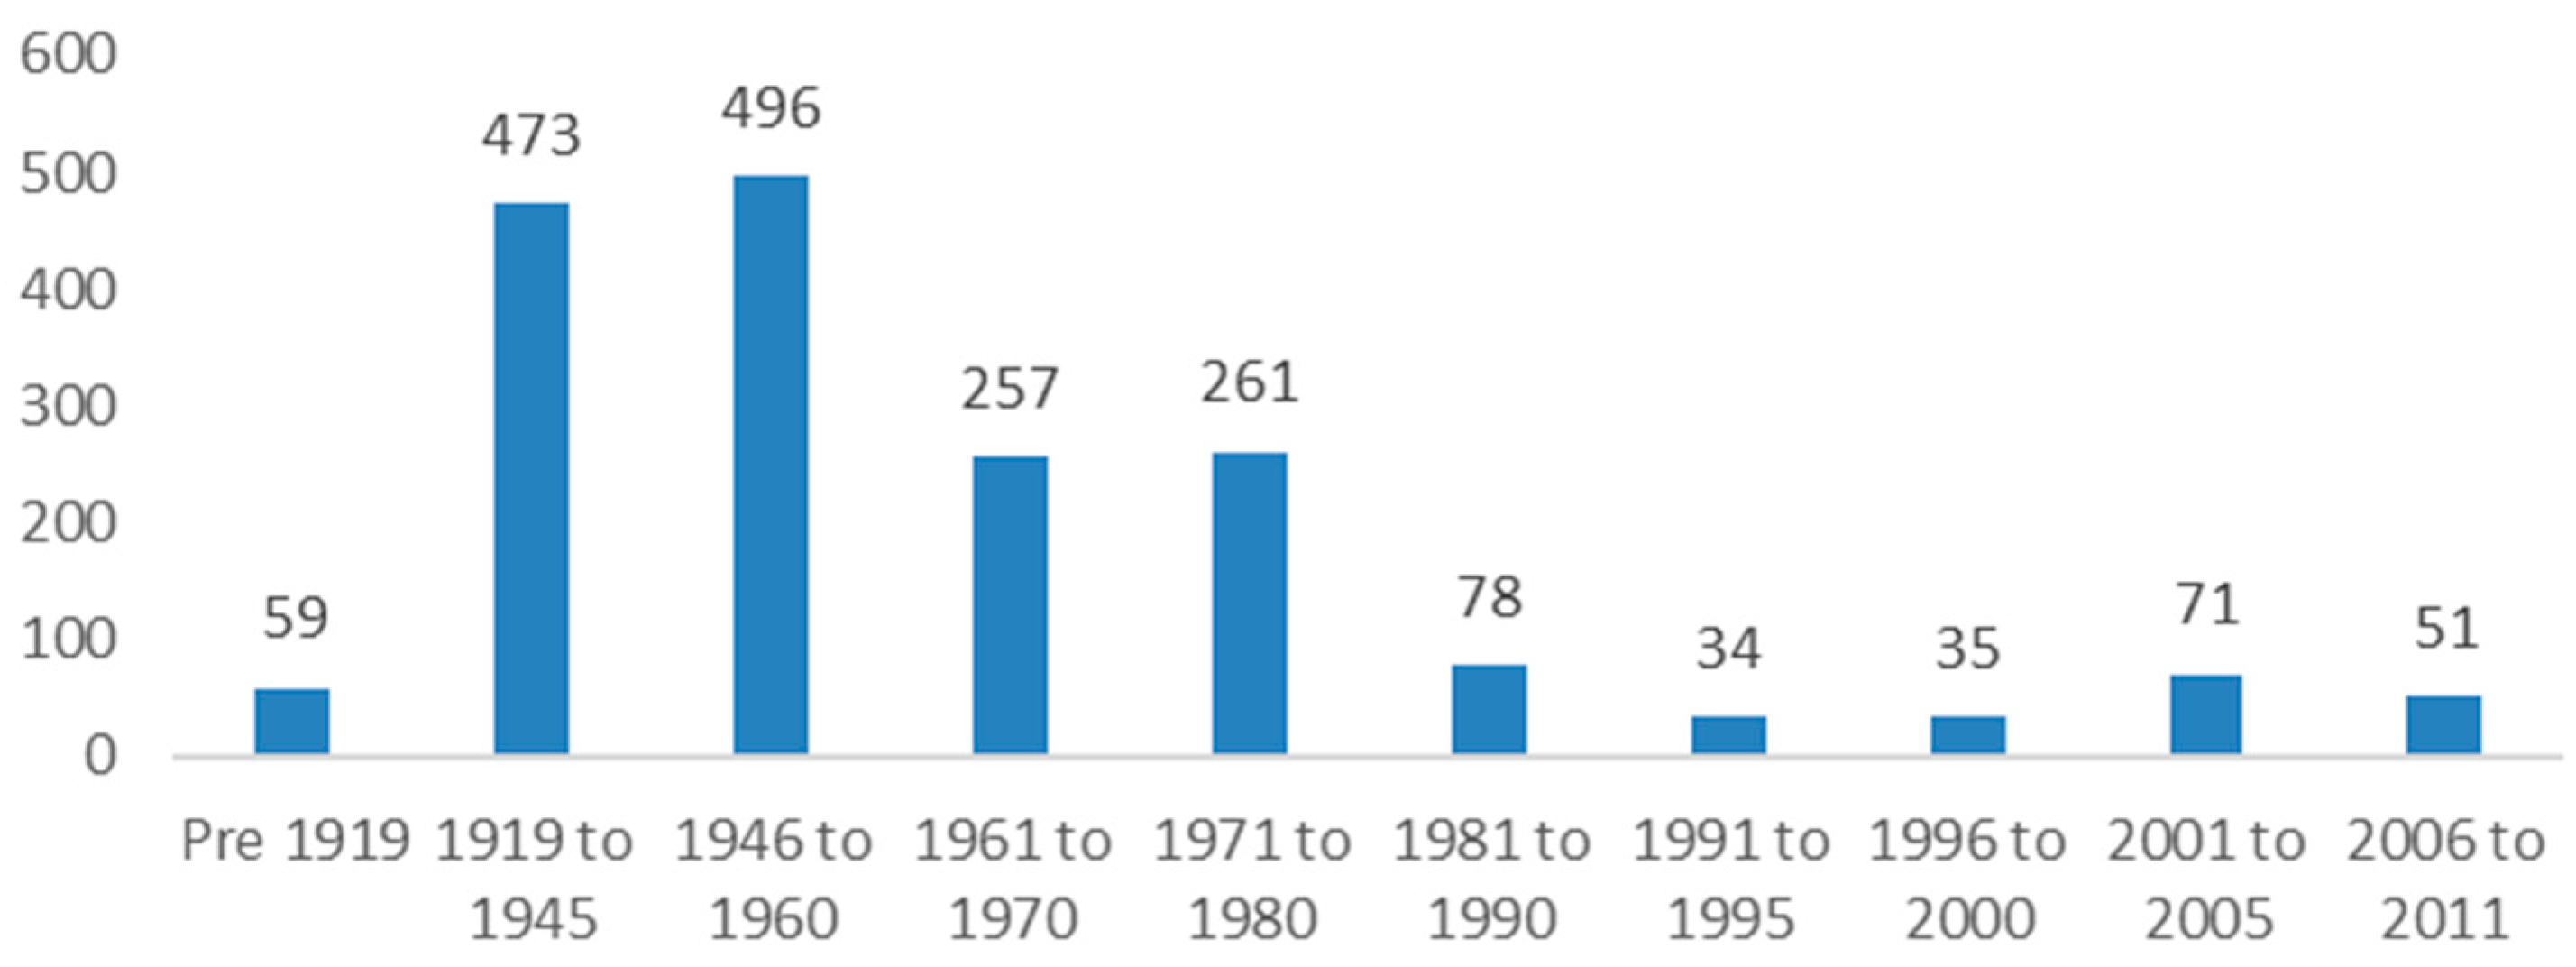
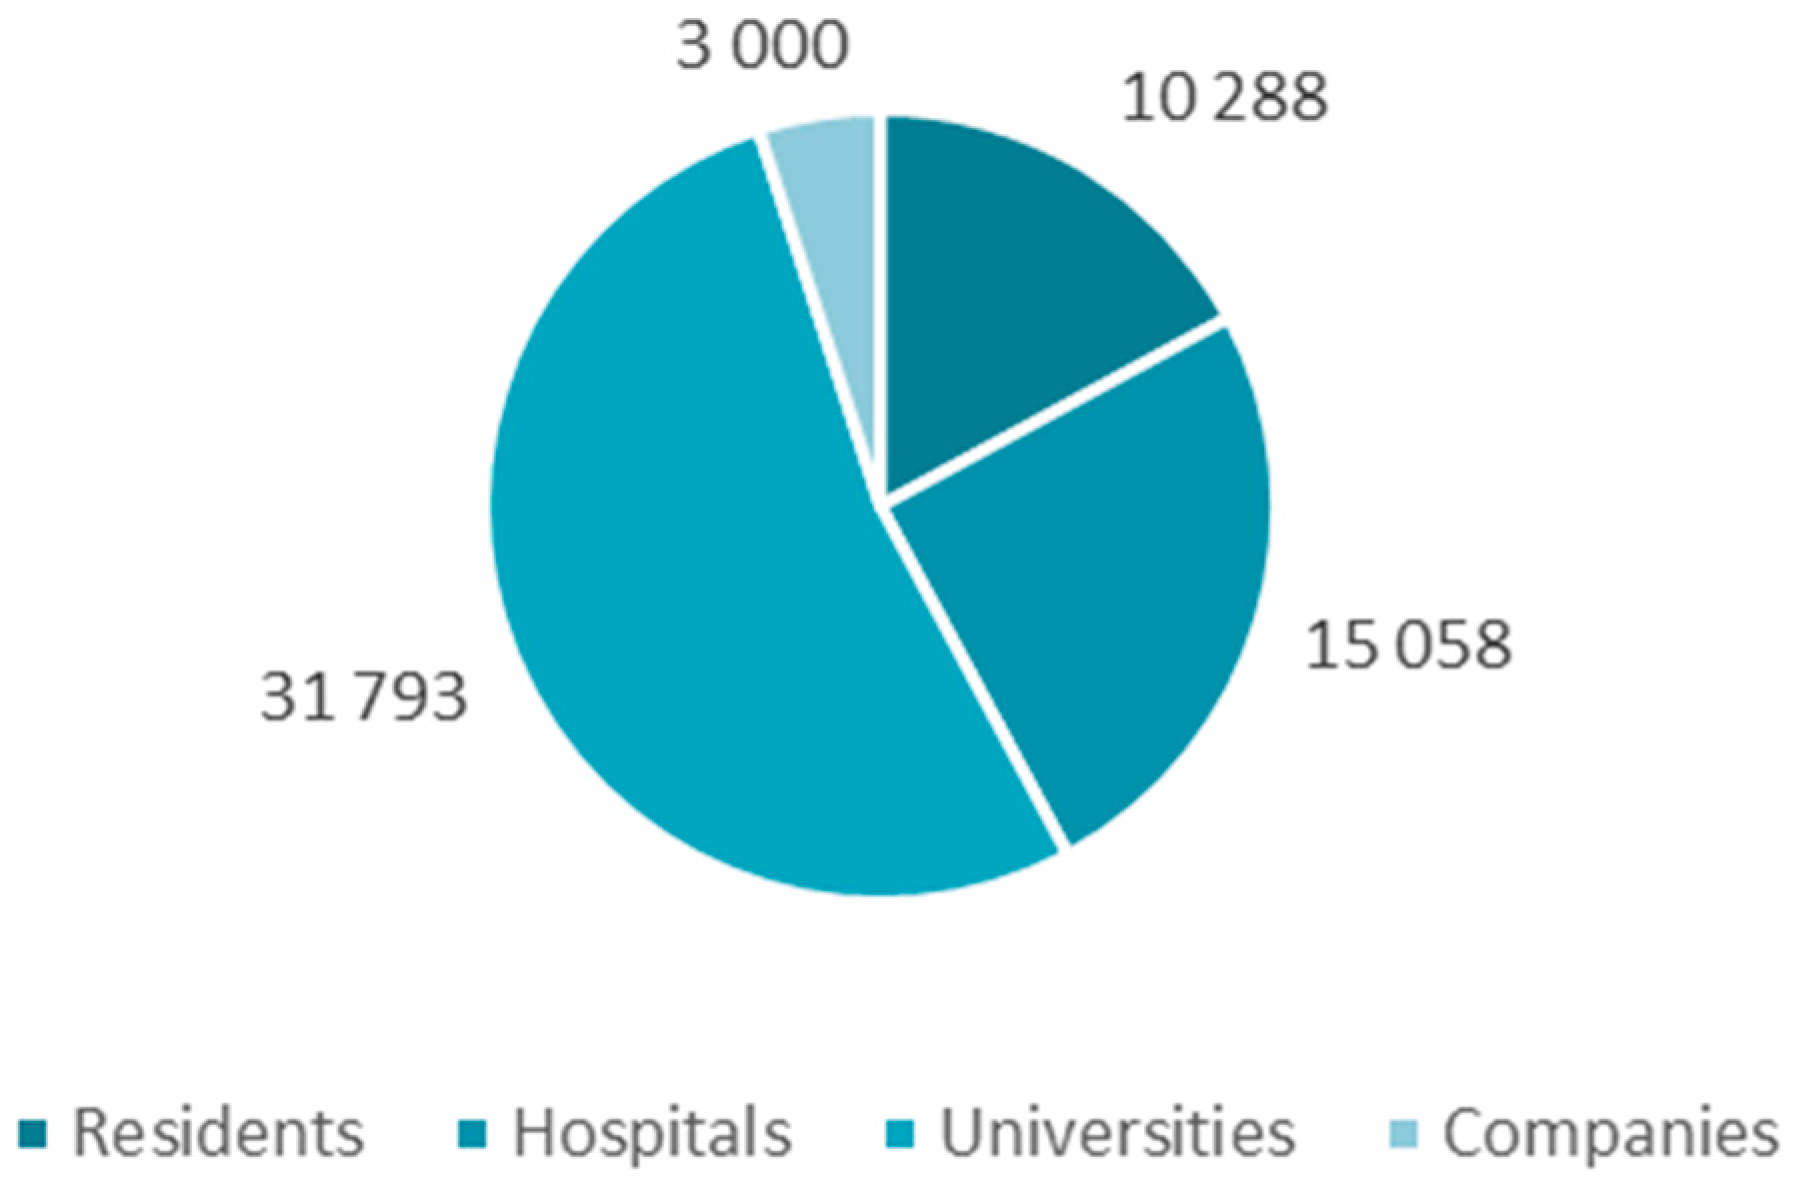
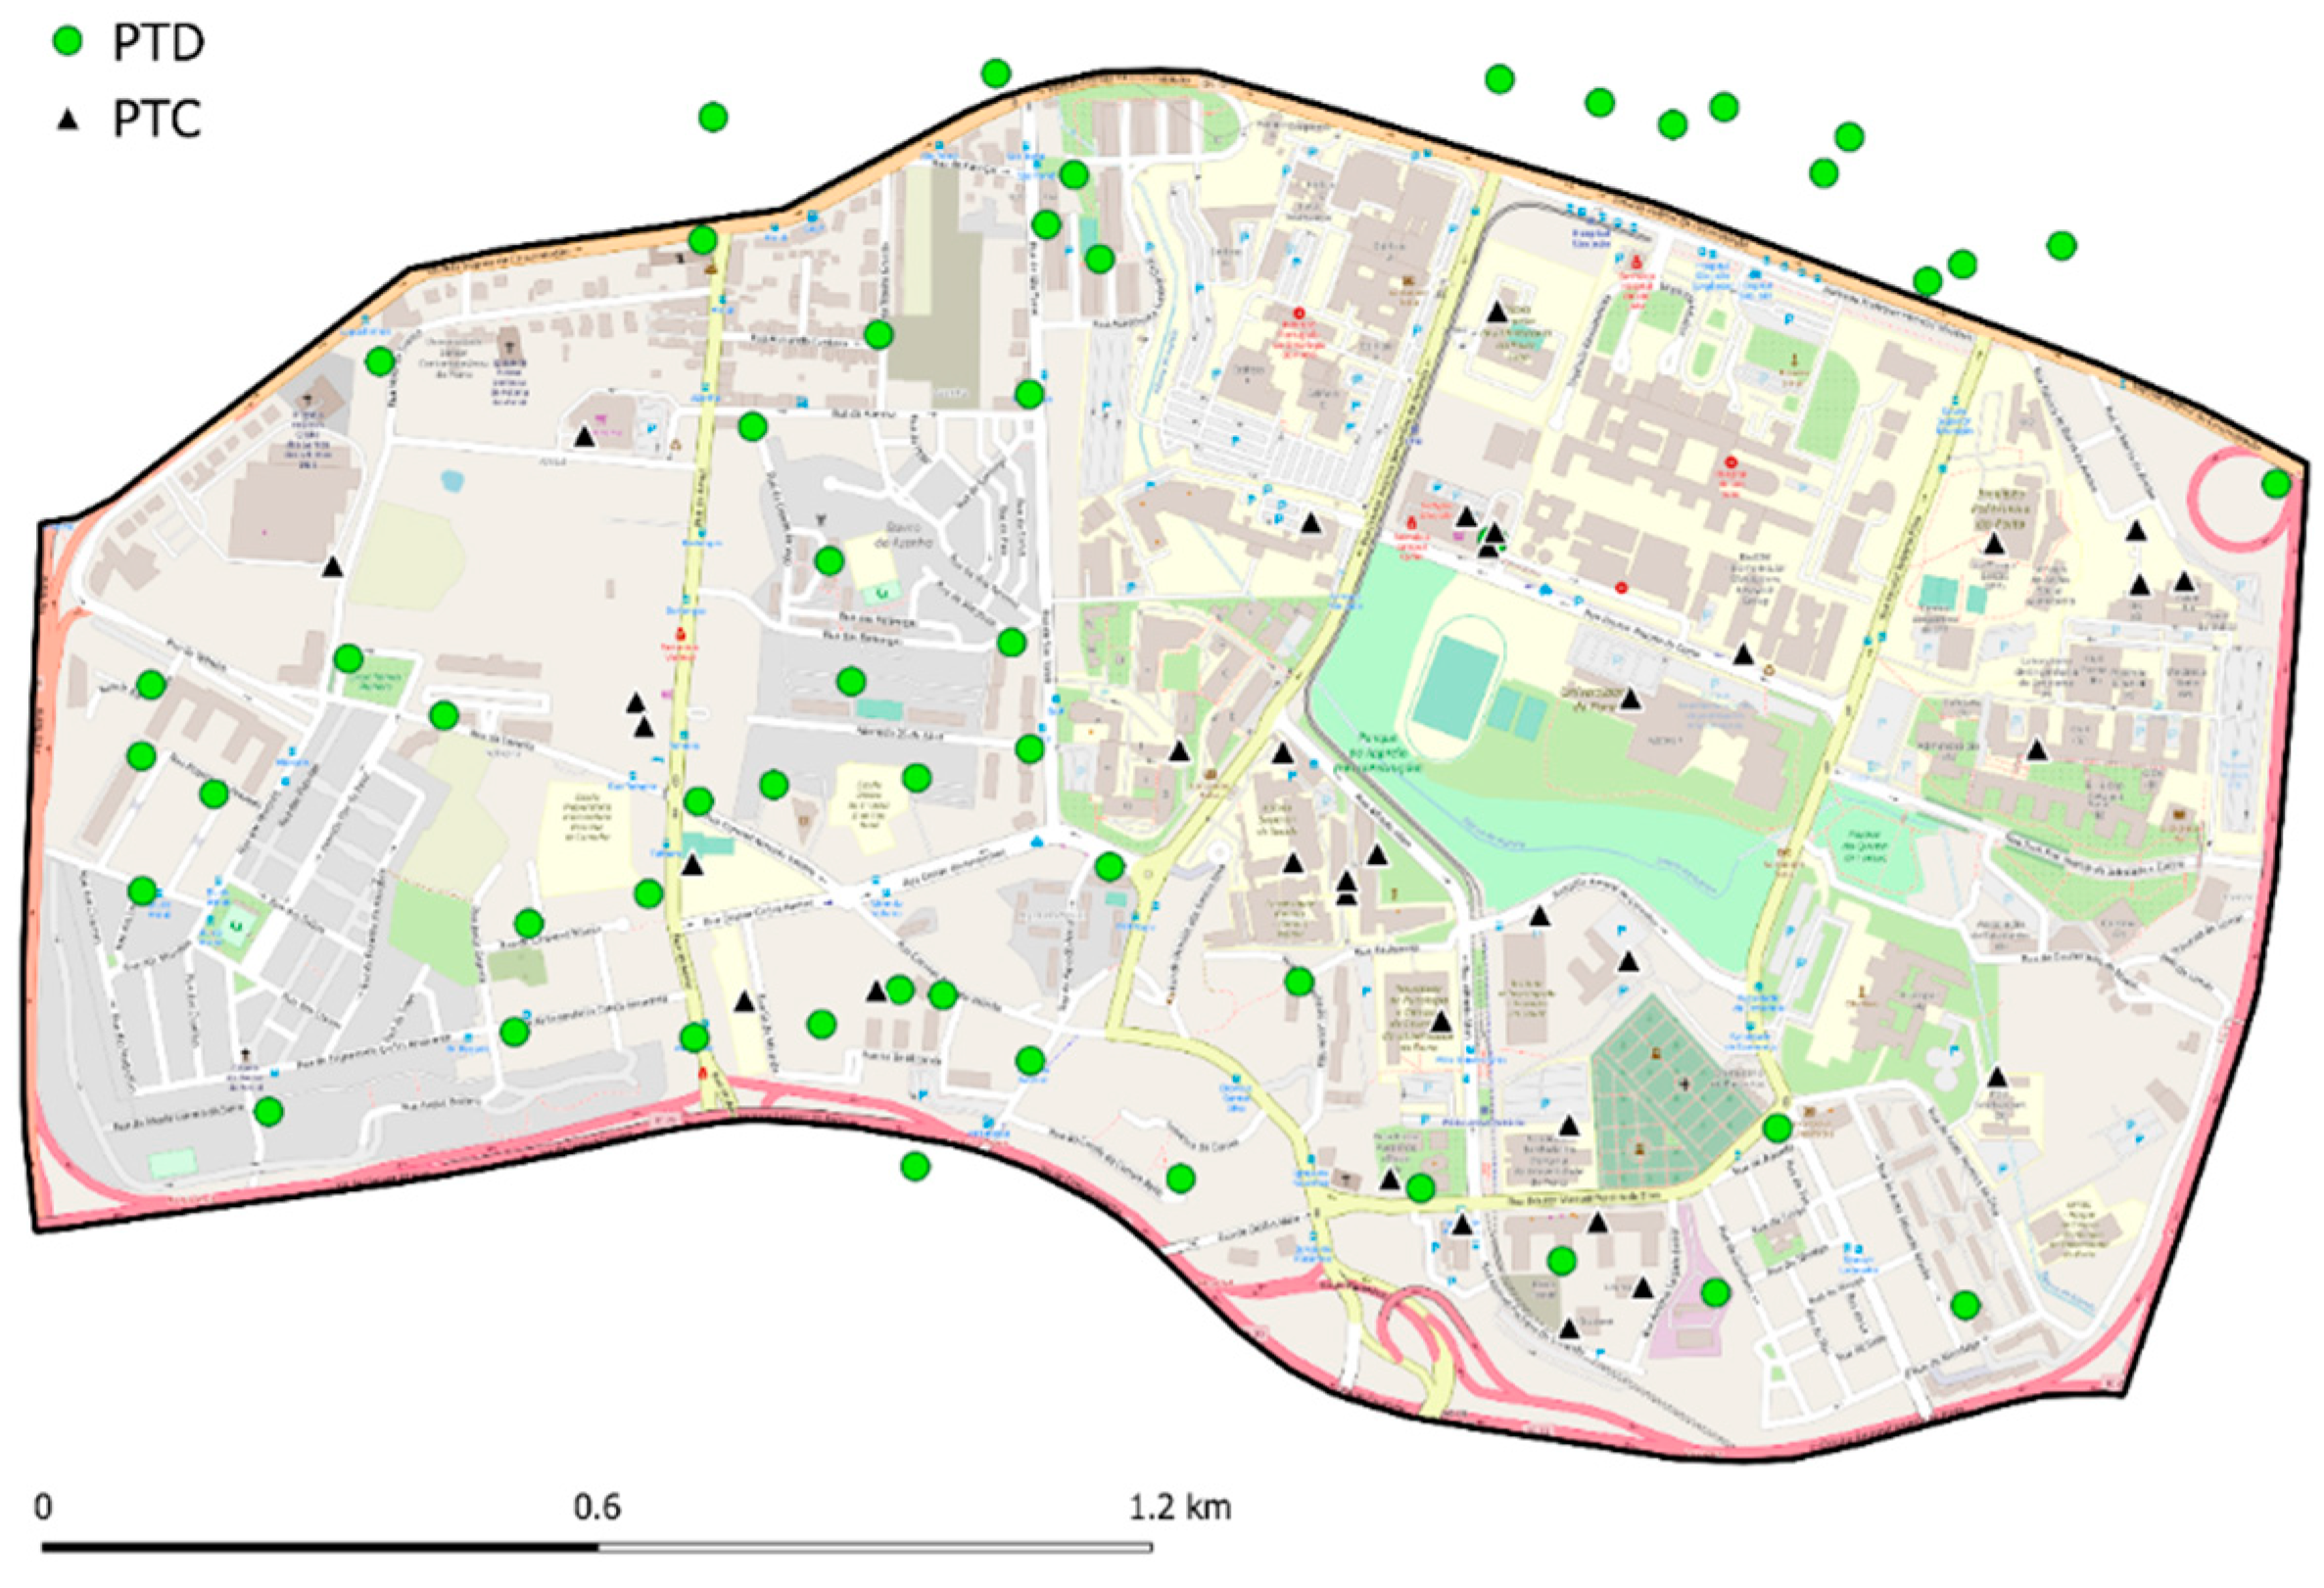
2.2. Case Study: Asprela

The case study considered for this project was the Asprela district, situated in the northern part of Portugal, the city of Porto, with a total area of approximately 2.64 km2.
According to the Köppen System climate classification [30], the city of Porto has a Csb (Dry-warm summer, Mediterranean) climate. Figure 3 shows the climate classification of Porto and the surrounding area, where an annual average high temperature of 20 °C can be observed and an annual average low temperature of 11 °C. The region has a mean of 12.2 h of daylight hours per day per year. It is important to consider both temperature and daylight hours, as they will impact the energy needs of the infrastructures within the Asprela district.
According to the Portuguese censos [31,32] data from 2011, there were 1815 buildings within the borders of the campus, of these, 1411 were identified using QGIS software and plugin tools, separated by decade in Figure 4. The difference between both numbers is because in QGIS, continuous buildings such as apartment buildings with multiple entrances, count only as one building, while in the censos data, these buildings are counted by the entrance. As the power flow data is collected at the Power Transformer level, the exact number of buildings identified in QGIS, will not have an adverse impact on the final analysis.
According to Figure 4, close to 57% of the buildings within the district were built before 1960, which means poor construction technics, low thermal insulation, and high energy needs.
For this analysis, the population of the district was divided into two different categories, the resident population, and the floating population. As the name implies, the resident population refers to everyone that resides within the district, and the floating population is every person that commutes daily to the district but who is not a resident.
Data from the 2011 censos estimates a total of 10,288 people residing within the borders of Asprela, however, the floating population had to be estimated using several sources such as public and private transportation data, the number of students enrolled in the different universities, as well as staff, public information regarding all the companies, relative to workforce numbers, and occupancy data from healthcare institutions.
An estimated floating population of approximately 50,000 people was identified, which can be split into the following categories shown in Figure 5.
The Campus of Asprela contains 2 hospitals as well as 12 distinct universities, with a relatively low number of companies, based within its borders, which explains the contribution of each sector to the floating population. Regarding the electrical infrastructure of the district, there are 53 domestic power transformer secondary substations (PTDs), and 41 commercial power transformers substations (PTCs). The total installed power regarding the PTDs is 19.98 MVA and the PTCs are 53.7 MVA. According to the DSO, the PTs are all over-dimensioned and range from 30% to 40% in capacity usage, hence perfectly capable of taking new users and assets. There is also 2 High Voltage to Medium Voltage Substations that supply the Asprela district, each with a total installed power of 60 MVA. Concerning Public Street lighting the district has a total installed power of 222.71 kVA of LED, Sodium Vapor, and Mercury Vapor.
The methodology applied to the described case study can be applied to higher granular data (individual customer level). However due to privacy reasons, this data could not be obtained individualized, only aggregated. We hence assume that the behavior/pattern of each consumer under a certain PT, is very similar, even more, if we consider that they are part of the same cluster, which is a fair assumption. Table 1 summarizes all the PTs designated, in each category (domestic or commercial). Since the hospital facilities are the largest consumers (PTCs with the metro station), in a higher order of magnitude, it was not considered in the analysis. The remaining list included 88 PTs.
Figure 6 shows all the considered consumption points for the analysis. As can be observed, some of the PTDs are located outside of the Asprela district border, however, they supply buildings in the Asprela district and for that reason, they are considered in this analysis. The PTs are differentiated between domestic and commercial, with circles and triangles respectively.

2.3. Supervised and Unsupervised Models

To obtain the feature importance of the model, a supervised approach was used by applying the XGBoost [33] package in Python and the Shapley interpreter. The following independent variables were considered: Hour, Day of year, Month, Season, Min of Light/day, Day/Night, Temperature °C, People on Campus, Heating Needs (kWh), Cooling Needs (kWh), and Hot water (kWh). The dependent variable was the electricity consumption in kWh. We acknowledge that the energy needs variables, due to heating, cooling, and hot water are not fully electricity-driven. However, are taken as drivers (from PlanHeat), of the total energy consumption, which may influence the electricity consumption.
Regarding the two clustering models, the first one used is a standard clustering algorithm as K-mean, which is based on Euclidean distances, and the second one is Dynamic Time Warping (DTW) [34]. The second approach was chosen because the distance measures used in standard clustering algorithms, such as Euclidean distance, are often not appropriate to time series, as they compare point to point in time. This is due to the inability of the algorithm to consider time shifts, ignoring the time dimension of the data. Even if two time series are highly correlated (such as two sinusoids), but one is shifted by a given time step or period, Euclidean distance would not be capable of effectively measuring their close relation. Instead, it is better to use DTW to compare series, where a range of points in time (before and after a given observation) is considered. DTW is hence a frequently used technique to measure similarities between two temporal sequences, that do not align exactly in length, time, or speed.

3. Results and Discussion

Regarding the regression model, the dataset was split linearly, with a 70–30% split between train and test data. The RMSE was 121.84 with an R2 score of 0.98. The main variables influencing the energy consumption were identified by the feature importance interpreter feature. The results are presented in Figure 7, showing the feature’s importance to the model output, with the direction of the corresponding impact. The way to interpret the chart is similar to a violin plot. For clarity, consider the minutes of daylight in a day variable, as an example. The more minutes of light there is in a day, represented by the yellow dots (high value), the less impact it will have on the model output, which is the electricity consumption. On the contrary, the less daylight there is (green dots) the more impact on electricity consumption it will have. This is due most likely, to lighting needs, especially public lighting.
Figure 8 shows the corresponding bar plot, which takes the mean absolute value of each feature over all the instances (rows) of the dataset, providing the absolute impact.
From Figure 8, it can be observed that the influencing factors are the ones related to the time, namely daily variation and the people flow in the area (flow and outflow of the district).
Considering the influencing factors, the two unsupervised machine learning approaches were applied. Due to their nature, two clustering exercises were run to capture the people fluctuation dimension and the time-varying factor. Since two clusters result in two ways to group profiles, likely, there is not a perfect match between both, so we overlap and make sure the distinctive ones belong to both and the ones who are not being left out or can be in either group (neutral). The Elbow Method was used to identify the optimal number of clusters. By default, the scoring parameter metric is set to “distortion”, which computes the sum of squared distances from each point to its assigned center. Figure 9 presents the scoring according to the method; hence two clusters are used.
The DTW clustering model ran the 8760 h for 2019, which took about 12 h to complete processing the data. To avoid such long processing times, we advise the use of cloud computing or the use of GPUs, if more profiles are considered. Due to the density of the observations, plotting the entire dataset clustering would not make it visible. For that reason, for the sake of clarity, Figure 10, presents the results for 168 h (1 week), where individual clustered patterns can be observed. The red pattern corresponds to the cluster centroid, and the green lines are the consumption time series of the dataset. The cluster results are however for the full year corresponding to the following array: [1, 1, 1, 1, 1, 1, 1, 1, 1, 1, 1, 1, 1, 1, 1, 1, 1, 1, 1, 1, 1, 1, 1, 1, 1, 1, 1, 1, 1, 1, 1, 1, 1, 1, 1, 1, 1, 1, 1, 1, 1, 1, 1, 1, 1, 1, 1, 1, 1, 1, 1, 1, 1, 1, 0, 1, 1, 1, 0, 0, 1, 1, 1, 1, 1, 1, 1, 1, 1, 1, 1, 0, 1, 0, 1, 0, 0, 0, 0, 0, 0, 1, 1, 1, 1, 1, 1]. Each number position corresponds to the PT list in Table 1, and each number the assigned cluster. Category 1 is here further referred to as cluster 1 and category 0 as cluster 2.
The standard k-Means clustering, was processed with three variables: (i) the total energy consumption for each PT (kWh), (ii) a categorical number referring to domestic or commercial PT (1 or 2) and (iii) the number of people estimated to be served by each of them. The values were submitted to standard scaling. The clustering results provided the following array: [1, 1, 1, 1, 1, 1, 1, 1, 1, 1, 1, 1, 1, 1, 1, 1, 1, 1, 1, 1, 1, 1, 1, 1, 1, 1, 1, 1, 1, 1, 1, 1, 1, 1, 1, 1, 1, 1, 1, 1, 1, 1, 1, 1, 1, 1, 1, 1, 1, 1, 1, 0, 0, 0, 0, 0, 0, 0, 0, 0, 0, 0, 0, 0, 0, 0, 0, 0, 0, 0, 0, 0, 0, 0, 0, 0, 0, 0, 0, 0, 0, 0, 0, 0, 0, 0, 0]. Figure 11 visually represents the clustering centroids and groups, plotting the number of people against energy consumption.
Both the standard K-means and time-series clustering results were input again to QGIS for geographic representation and overlapping. There was a 70.5% match between the two clusters, which provides a reasonably good confirmation of distinct characteristics for clustering. Figure 12 presents those PTs with a match between the two clustering algorithms in green rhombus shape, whereas those inconclusive/neutral are represented in white circles.
In Portugal, the DL 15/2022 [35], emphasizes the proximity factor for members of a community below 2 km or the need to belong to the same higher substation. The composition, however, can have multiple formats according to the clustering results.
To verify the assumption that the pairing methodology leads to increased performance (lower generation surplus), the following example in Table 2, provides a sample of 18 pairing options. Equation (1) was applied to the parings in Table 2 and the surplus was calculated for each hour and added for the full year. Since the values are standard scaled, the amplitude and size of both the generation and consumption of the pair, will not interfere with the analysis. This means that each of the samples has a sample mean of 0 and a sample standard deviation of 1. Thus, they can be added without one variable having an undue influence on the outcome.
The results are coherent with expectations and appear to show a higher surplus in cluster 1 than in cluster 2. This may be because the members paired from cluster 1 are mostly from domestic PTs, where typically the peak demand does not match the generation peak from PVs. On the contrary, users from cluster 2, tend to be commercial with similar hours of functioning closer to the ones of PV generation. They do not, however, have significant demand on weekends, which contributes to surplus. It can be observed that when members from different clusters are paired together, they tend to have on average a higher auto-consumption (lower surplus) of 12% in the sample group analyzed, with a maximum of 36% (PTD1-PTD14 against PTD1-PTC_FPCEUP pairs). This does not happen in all pairings from different clusters, as is the case of the pairing between Portis and both PTC_CLF2 and PTC_FMDUP (with 4773.18 and 4688.79 surpluses respectively), which outperform the pairing of PTD1 with both PFIF and RES_UP (6960.88 and 6960.87 surplus respectively). The complementarity will be different depending on the resources chosen (for example storage). However, for this likely scenario of a REC adopting PV generation, the trend is clear and hence it is advised that this analysis is followed.
The presented clustering model and historical analysis is a tool that could be implemented in an online platform, where willing participants, in each area, could submit their historical data and be paired (recommended) with suitable members. We recommend this step to be the initial engagement trigger, to initiate the process among consumers. Online platforms already exist to support communities, such as Enerjettic from the RENAISSANCE project, where consumers can monitor their own energy needs as well as their neighbor’s or Our-energy.eu [36], which offers citizens and members of new energy communities, best practices and learning opportunities about different concepts, while enabling contact with other interested members in their vicinity. Another example is the platform from BEcoop [37], the project is developing a knowledge exchange platform to enable collaborations among different stakeholders, minimizing costs, and sharing information in a peer-to-peer approach. We hence recommend that the methodology presented in this article could be functionality to be added to similar social enabling initiatives.

4. Conclusions

The study was initiated with the assumption that users in an energy community, should complement each other, in terms of load consumption. This required a grouping exercise to suggest pairing opportunities and exploring these complementarities. The variables for these datasets were identified from a regression model using the XGBT algorithm. The georeferenced dataset is complemented by information gathered from the district censos, private organizations, and load consumption provided by the DSO. Two clustering models were developed, applying DTW and k-means. The two clustering results when overlapped in QGIS, revealed a match higher than 70%, which suggests that the clusters use robust variables to group potential members of an energy community. Verification of the initial complementarity assumption was carried out using a sample of 18 pairings, from the same and different clusters. The results revealed that not all pairings lead to improved performance, reducing the surplus of PV generation, however on average this tends to be so, with an average reduction of 12% and a maximum of 36% in the sample analyzed. This analysis is ahead of the dimensioning of assets, and at this point only qualitative analysis is possible. However, for a quantitative verification at a cost level and detailed auto-consumption rate, further work is advised. The tool is recommended to be integrated into online platforms, as a pairing suggestion for members willing to integrate a REC. Failure to explore synergies with complementary consumption patterns may lead to a mere increase in the size of the collective consumption, which means that a consumer could individually outperform his integration in a REC, in terms of risk/reward.

Author Contributions

Conceptualisation and methodology A.L.; software A.L.; validation S.C.; investigation S.C. and A.L.; writing A.L.; original draft preparation A.L.; writing—review and editing A.L. and S.C.; supervision A.L. All authors have read and agreed to the published version of the manuscript.

Funding

This research was developed within the Asprela + Sustentável project, which has received funding from the EEGrants under the administrative arrangement 03/Aviso #4 with the operating entity Secretaria-Geral do Ambiente e Ação Climática.

Institutional Review Board Statement

Not applicable.

Informed Consent Statement

Not applicable.

Data Availability Statement

Data is contained within the article.

Conflicts of Interest

The authors declare no conflict of interest.

References

  1. European Commission. Clean Energy for All Europeans Package—European Commission. 20 October 2017. Available online: https://ec.europa.eu/energy/en/topics/energy-strategy/clean-energy-all-europeans (accessed on 2 February 2022).
  2. Communication from the Commission to the European Parliament; The European Council. The European Economic and Social Committee and the Committee of Regions; The European Green Deal COM/2019/640 Final; Office for Official Publications of the European Communities: Brussels, Belgium; Luxembourg, 2019; p. 24. [Google Scholar]
  3. Caramizaru, A.; Uihlein, A. Energy Communities: An Overview of Energy and Social Innovation; JRC Report 119433; Publications Office of the European Union: Luxembourg, 2020; p. 9. [Google Scholar] [CrossRef]
  4. European Council. Directive (EU) 2019/944/EC of the European Parliament and of the Council of 5 June 2019 concerning common Rules for the Internal Market for Electricity. Off. J. Eur. Union 2019, L 158/125, 75. [Google Scholar]
  5. Yildiz, Ö.; Rommel, J.; Debor, S.; Holstenkamp, L.; Mey, F.; Müller, J.R.; Radtke, J.; Rognli, J. Renewable energy cooperatives as gatekeepers or facilitators? Recent developments in Germany and a multidisciplinary research agenda. Energy Res. Soc. Sci. 2015, 6, 59–73. [Google Scholar] [CrossRef]
  6. Council of European Energy Regulators, Regulatory Aspects of Self-Consumption and Energy Communities, CEER Report C18-CRM9_DS7-05-03. June 2019; p. 53. Available online: https://www.ceer.eu/documents/104400/-/-/8ee38e61-a802-bd6f-db27-4fb61aa6eb6a. (accessed on 14 March 2022).
  7. ETIP SNET R&I Roadmap 2020–2030 (Updated 02/2020). Available online: https://www.etip-snet.eu/etip_publ/etip-snet-ri-roadmap-2020-2030/. (accessed on 14 March 2022).
  8. Boulanger, S.O.M.; Massari, M.; Longo, D.; Turillazzi, B.; Nucci, C.A. Designing Collaborative Energy Communities: A European Overview. Energies 2021, 14, 8226. [Google Scholar] [CrossRef]
  9. NRG2Peers. Available online: https://nrg2peers.com (accessed on 12 February 2022).
  10. D’Oca, S.; Breukers, S.; Slingerland, S.; Boekelo, M.; van Welie, M.J.; Moscardi, C.; Aggeli, A.; Burgstaller, K.; Coosemans, T.; Hueting, R.; et al. A Social Engagement Fast Track on Energy Communities—Key Lesson Learned from H2020 EU Projects. Environ. Sci. Proc. 2021, 11, 17. [Google Scholar] [CrossRef]
  11. MERLON. Available online: www.merlon-project.eu (accessed on 12 February 2022).
  12. Papadaskalopoulos, D.; Woolf, M.; Chrysanthopoulos, N.; Strbac, G. Business models and barriers towards the development of local energy systems in europe: Insights from the merlon project. In Proceedings of the CIRED 2021—26th International Conference and Exhibition on Electricity Distribution, Online Conference, 20–23 September 2021; pp. 3269–3273. [Google Scholar] [CrossRef]
  13. Luz, G.P.; E Silva, R.A. Modeling Energy Communities with Collective Photovoltaic Self-Consumption: Synergies between a Small City and a Winery in Portugal. Energies 2021, 14, 323. [Google Scholar] [CrossRef]
  14. Salvatore, R.; Aljosa, I.; Henner, B.; Karoliina, A.; Faller, F. Co2mmunity Working Paper 2.3-Developing a Joint Perspective on Community Energy: Best Practices and Challenges in the Baltic Sea Region; Lund University: Lund, Sweden, 2019; 34p. [Google Scholar]
  15. CIRCE. Available online: www.fcirce.es/en/horizon-2020 (accessed on 12 February 2022).
  16. BENEFFICE. Available online: www.beneffice.eu (accessed on 12 February 2022).
  17. Protopapadakis, E.; Doulamis, A.; Kaselimi, M. Changing User’s energy consumption behavior using IOT. In Proceedings of the 7th International Symposium & 29th National Conference on Operational Research, Chania, Greece, 14–16 June 2018. [Google Scholar]
  18. Garbi, A.; Malamou, A.; Michas, N.; Pontikas, Z.; Doulamis, N.; Protopapadakis, E.; Mikkelsen, T.N.; Kanellakis, K.; Baradat, J.-L. BENEFFICE: Behaviour change, consumption monitoring and analytics with complementary currency rewards. In Proceedings of the Sustainable Places Conference 2019, Cagliary, Italy, 5–7 June 2019. [Google Scholar]
  19. Launonen, H.; Tisov, A.; Germini, A.M.; Olivadese, R.; Koroleva, K.; Lukasik, M.; Malamou, A.; Arabsolgar, D.; Zacharis, E.; Garbi, A. Exploitation of the European Research Projects Aiming to Achieve a Behavior Change for Energy Saving Through Innovative IT Solutions. In Proceedings of the Sustainable Places Conference 2019, Cagliary, Italy, 5–7 June 2019. [Google Scholar]
  20. Social Res. Available online: https://socialres.eu (accessed on 12 February 2022).
  21. Wu, H.; Carroll, J.; Denny, E. Harnessing citizen investment in community-based energy initiatives: A discrete choice experiment across ten European countries. Energy Res. Soc. Sci. 2022, 89, 102552, ISSN 2214-6296. [Google Scholar] [CrossRef]
  22. LIGHTNESS. Available online: www.lightness-project.eu (accessed on 12 February 2022).
  23. Slingerland, S.; Young, J.; Mourik, R.; Lutz, L. Energy Communities for Just Energy Transitions on a Local Scale: Initial Lessons from the Lightness Project. Environ. Sci. Proc. 2021, 11, 29. [Google Scholar] [CrossRef]
  24. Renaissance. Available online: www.renaissance-h2020.eu (accessed on 12 February 2022).
  25. Lode, M.L.; Felice, A.; Ander, M.A.; De Silva, J.; Lopeze, M.E.; Lowitzsch, J.; Coosemans, T.; Camargo, L.R. Coupling Rural Development with the Development of Energy Communities: A Participatory Study in Vega De Valcarce, Spain; SSRN: Rochester, NY, USA, 15 April 2022. [Google Scholar] [CrossRef]
  26. Felice, A.; Rakocevic, L.; Peeters, L.; Messagie, M.; Coosemans, T.; Camargo, L.R. An assessment of operational economic benefits of renewable energy communities in Belgium. J. Phys. Conf. Ser. 2021, 2042, 12033. [Google Scholar] [CrossRef]
  27. Zhou, S.; Hu, Z.; Gu, W.; Jiang, M.; Zhang, X.-P. Artificial intelligence based smart energy community management: A reinforcement learning approach. CSEE J. Power Energy Syst. 2019, 5, 1–10. [Google Scholar] [CrossRef]
  28. Sismanidis, P.; Keramitsoglou, I.; Barberis, S.; Dorotić, H.; Bechtel, B.; Kiranoudis, C.T. PLANHEAT’s Satellite-Derived Heating and Cooling Degrees Dataset for Energy Demand Mapping and Planning. Remote Sens. 2019, 11, 2048. [Google Scholar] [CrossRef] [Green Version]
  29. Oregi, X.; Hermoso, N.; Prieto, I.; Izkara, J.L.; Mabe, L.; Sismanidis, P. Automatised and georeferenced energy assessment of an Antwerp district based on cadastral data. Energy Build. 2018, 173, 176–194. [Google Scholar] [CrossRef]
  30. Arnfield, A.; John. Köppen climate classification. In Encyclopedia Britannica, 11 November 2020. Available online: https://www.britannica.com/science/Koppen-climate-classification. (accessed on 14 March 2022).
  31. Censos. Available online: https://censos.ine.pt/ (accessed on 12 February 2022).
  32. Instituto Nacional de Estatística (INE). Censos 2011, Resultados Definitivos—Portugal. Report, INE Portugal 2012, p. 560, I.P., ISSN 0872-6493, ISBN 978-989-25-0181-9. Available online: https://censos.ine.pt/ngt_server/attachfileu.jsp?look_parentBoui=148313382&att_display=n&att_download=y (accessed on 12 February 2022).
  33. Chen, C.; Guestrin, T. XGBoost: A Scalable Tree Boosting System. In Proceedings of the 22nd ACM SIGKDD International Conference on Knowledge Discovery and Data Mining (KDD ‘16), San Francisco, CA, USA, 13–17 August 2016; pp. 785–794. [Google Scholar] [CrossRef] [Green Version]
  34. Giorgino, T. Computing and Visualizing Dynamic Time Warping Alignments in R: ThedtwPackage. J. Stat. Softw. 2009, 31, 1–24. [Google Scholar] [CrossRef] [Green Version]
  35. Presidência do Conselho de Ministros. Decreto-Lei n. 15/2022 de 14 de janeiro. Diário da República, 1.a série, 2022. Available online: http://files.dre.pt/1s/2022/01/01000/0000300185.pdf (accessed on 14 March 2022).
  36. Our-Energy. Available online: http://our-energy.eu (accessed on 12 February 2022).
  37. BeCoop. Available online: https://www.becoop-project.eu/ (accessed on 12 February 2022).
Figure 1. PV generic generation profile with noncomplementary users’ load profiles (a), complementary user’s load profiles (b), and resultant consumption potential (c).
Energies 15 04789 g001
Figure 2. The methodology followed for pairing REC participants through clustering.
Energies 15 04789 g002
Figure 3. Asprela district location and corresponding climate characterization.
Energies 15 04789 g003
Figure 4. Number of buildings according to the decade of construction.
Energies 15 04789 g004
Figure 5. Number of people in the Asprela Campus by sector.
Energies 15 04789 g005
Figure 6. Domestic (PTD) and Commercial (PTC) secondary substation location in the district.
Energies 15 04789 g006
Figure 7. Partial dependences and feature importance of the regression model.
Energies 15 04789 g007
Figure 8. Partial dependences and feature importance of the regression model.
Energies 15 04789 g008
Figure 9. The Elbow Method shows the optimal k.
Energies 15 04789 g009
Figure 10. Time-series (green) clustering results for 1 week of observations (red centroid) using DTW.
Energies 15 04789 g010
Figure 11. K-means clusters relation between the number of people and electricity consumption.
Energies 15 04789 g011
Figure 12. k-Means and DTW clustering overlap in green if they match and white if not.
Energies 15 04789 g012
Table 1. List of PTs serving the Asprela district.
CategoryPT_ID
Domestic PT PTD_1; PTD_3; PTD_4; PTD_5; PTD_6; PTD_7; PTD_8; PTD_9; PTD_10; PTD_11; PTD_12; PTD_13; PTD_14; PTD_15; PTD_16; PTD_17; PTD_18; PTD_19; PTD_20; PTD_21; PTD_22; PTD_23; PTD_24; PTD_25; PTD_26; PTD_28; PTD_29; PTD_30; PTD_31; PTD_32; PTD_33; PTD_34; PTD_35; PTD_36; PTD_37; PTD_38; PTD_39; PTD_40; PTD_41; PTD_42; PTD_43; PTD_44; PTD_45; PTD_46; PTD_47; PTD_50; PTD_51; PTD_52; PTD_54; PTD_55; PTD_56; PTD_59; PTD_60
Commercial PTUPORT; FPCEUP; FEUP; FEP; FADEUP; FMDUP; FMUP; ISEP; Continente; Pingo Doce; Froiz; Campus; IPP + ESE; ESENF; ESS_1; ESS_2; UPTEC; CLF_1; CLF_2; FFA; Portis; Hotel_B; PFIF; RES_UHUB; RES_UP; RES_SH; RES_LL; RES_VS1; RES_VS2; INESC; INEGI; i3S; IPATIMUP; IMINT (CISTER); AIC
Table 2. Cluster Pairing Combination sample and resulting yearly surplus (kWh standard scaled).
Both from Cluster 1Surplus Both from Cluster 2Surplus From Clusters 1 and 2Surplus
PTD1-PTD36487.573983Portis-RES_UP7176.359PTD1-PTC_FPCEUP 4707.002256
PTD1-PTD47063.682571Portis-RES_UHUB7176.365PTD1-PTC_FMDUP4801.681378
PTD1-PTD56765.905141Portis-RES_SH7176.372PTD1-PTC_CLF24838.0883
PTD1-PTD66768.926405Portis-Hotel B7176.362PTD1-PTC_Portis6960.8778
PTD1-PTD77299.579286Portis-CLF24773.183PTD1-PFIF6960.88241
PTD1-PTD147303.262303Portis-FMDUP4688.797PTD1-RES_UP6960.875657
Average kWh6948.154948Average kWh 6361.24Average kWh5871.567967
Publisher’s Note: MDPI stays neutral with regard to jurisdictional claims in published maps and institutional affiliations.

