Article

Study on Fatigue Life Prediction and Acoustic Emission Characteristics of Sandstone Based on Mesoscopic Crack Propagation Mechanism

1
School of Mechanics and Civil Engineering, China University of Mining and Technology (Beijing), Beijing 100083, China
2
Key Laboratory of Shale Gas and Geoengineering, Institute of Geology and Geophysics, Chinese Academy of Sciences, Beijing 100029, China
3
College of Earth and Planetary Sciences, University of Chinese Academy of Sciences, Beijing 100049, China
4
State Key Laboratory of Coal Resources and Safe Mining, China University of Mining and Technology (Beijing), Beijing 100083, China
*
Author to whom correspondence should be addressed.
Energies 2022, 15(13), 4807; https://doi.org/10.3390/en15134807
Submission received: 18 May 2022 / Revised: 24 June 2022 / Accepted: 26 June 2022 / Published: 30 June 2022

Abstract

:
Even when the maximum stress is less than the peak stress under conventional loading, fatigue failure of rock is likely to occur, thereby showing its unique characteristics. The present study summarized the factors affecting rock fatigue life from the perspective of phenomenology and studied the fatigue damage process of rock from the microscopic perspective. However, the meso-mechanical mechanism of fatigue–tension failure of rocks is still not very clear, and there are few studies on rock fatigue life that use meso-crack propagation models. In this paper, a mesoscopic model considering wing crack propagation is introduced to examine the fatigue failure of sandstone. A fatigue life prediction formula of sandstone was deduced via a combination with the Paris formula. This formula can quantitatively characterize the impact of upper limit stress and lower limit stress on the fatigue life of sandstone and explain the reason why upper limit stress has a greater influence on the fatigue process of sandstone. Such a prediction formula is applicable only under the condition of low confining pressures, which mainly cause tensile failure due to mesoscopic wing crack propagation. Acoustic emission signals during fatigue failure were monitored and then analyzed using a clustering method and a moment tensor inversion method. Therefore, the tensile or shear properties of mesoscopic failure could be distinguished according to acoustic emission characteristics in different stages of fatigue crack propagation. The results showed that crack sources causing sandstone fatigue failure are mainly tension-type when confining pressure is less than 10 MPa, which further verifies the proposed prediction model of sandstone fatigue life under low confining pressures.

1. Introduction

The mechanical behavior of rocks depends on the stress environment and loading path. For example, under dynamic cyclic loading, the strength and deformation characteristics of rocks are significantly different than those under static monotonic loading conditions. In general, cyclic loading brings the rock to failure at a stress level that is lower than the peak intensity obtained by monotonic loading, which is a phenomenon known as “fatigue”. In the field of engineering geology, the collapse disaster of rock mass in strong earthquake areas is usually related to the fatigue failure of rocks; thus, it is of great significance to understand the fatigue characteristics of rocks to guide engineering designs. Erarslan et al. [1] carried out fatigue tests on Brisbane tuff disc specimens with different stress amplitudes, and they studied the fatigue damage mechanism of rock and its relationship with fracture toughness through means of scanning electron microscopy and other tools. Song et al. [2] studied the effects of different loading frequencies on uniaxial and triaxial fatigue characteristics of rocks, and they predicted the upper limit stress of rock fatigue failure through a stress–life curve for rocks. Bagde et al. [3] pointed out that both the loading frequency and amplitude have an important influence on the behavior of rocks under dynamic cyclic loading conditions. By defining several different damage variables, Xiao et al. [4] pointed out that the damage evolution greatly depends on factors such as the upper limit stress, amplitude and fatigue initial damage.
In the field of rock mechanics, analytical methods usually used include phenomenological methods [5] and meso-mechanical methods [6]. Based on the meso-mechanics method, Ashby and Hallam [7] established initial stress criteria for crack propagation in rocks under different confining pressures. According to the propagation mechanism of microcracks in rocks under compressive stress, Basista and Gross [8] obtained the nonlinear deformation law during the deformation and failure of rocks and reconstructed a stress–strain curve during rock failure. Combining the methods of fracture mechanics and meso-mechanics, Diederichs and Stephen [9] studied the effect of tensile crack growth on rock instability and failure under compressive stress. Since the meso-mechanical method can describe the nucleation, propagation and convergence of cracks, and it can reflect changes in the material’s macro-mechanical properties through the processes of nucleation, propagation and convergence of these cracks, it is of great significance to reveal the internal mechanisms of rock materials during compression failure. However, in previous studies using meso-mechanical methods, the damage and failure mechanisms of rocks under static confining pressure were mainly studied, and the mechanisms of rock failure under fatigue loads were mainly based on phenomenological methods. Therefore, it is necessary to further study the mechanisms of rock failure under fatigue load through the progressive propagation of microcracks.
Recently, the acoustic emission (AE) technique was considered a reliable method for continuously monitoring the progressive damage process of rocks in real time [10]. AE is actually a kind of stress wave, which is closely related to the expansion of cracks in a rock during fracture [11]. Using the AE monitoring technique and with the evolution of AE parameters, many scholars investigated the characteristic stresses of brittle rock during the fracture process, such as crack initialization stress, crack damage stress, etc. [12,13,14]. Furthermore, certain parameters, such as the AE b value [15,16] and entropy value [17], can characterize the crack propagation stage and damage degree of the material. In laboratory tests, the AE technique has been applied to loading tests in a variety of stress environments, such as the uniaxial monotonic loading, conventional triaxial loading and true triaxial loading of rocks [18,19,20]. The application of the AE technique to study the failure process of rocks under fatigue loads is relatively rare, so further research is necessary.
Although most studies have made qualitative analyses on the factors affecting the fatigue life of rocks, there are few quantitative results. In addition, the fatigue failure of rock under low confining pressure is mainly tensile failure, but the fatigue failure of rock is rarely studied using mesoscopic tensile crack propagation. In this paper, the fatigue failure of rock under low confining pressure was studied through the meso-tensile wing crack propagation model, which can correspond to the actual fracture morphology of rock. Based on this, our goal was to reveal the fatigue failure mechanism from the perspective of a mesoscopic crack propagation mechanism. Firstly, this was investigated by introducing a wing crack propagation model showing how upper limit stresses, stress differences and other factors affect the fatigue life of sandstone. Secondly, a fatigue life prediction formula was deduced by combining it with the Paris formula. Lastly, the tensile or shear properties of mesoscopic cracks of sandstone during fatigue failure were characterized by analyzing their AE signals.

2. Description of the Theoretical Model and AE Methods

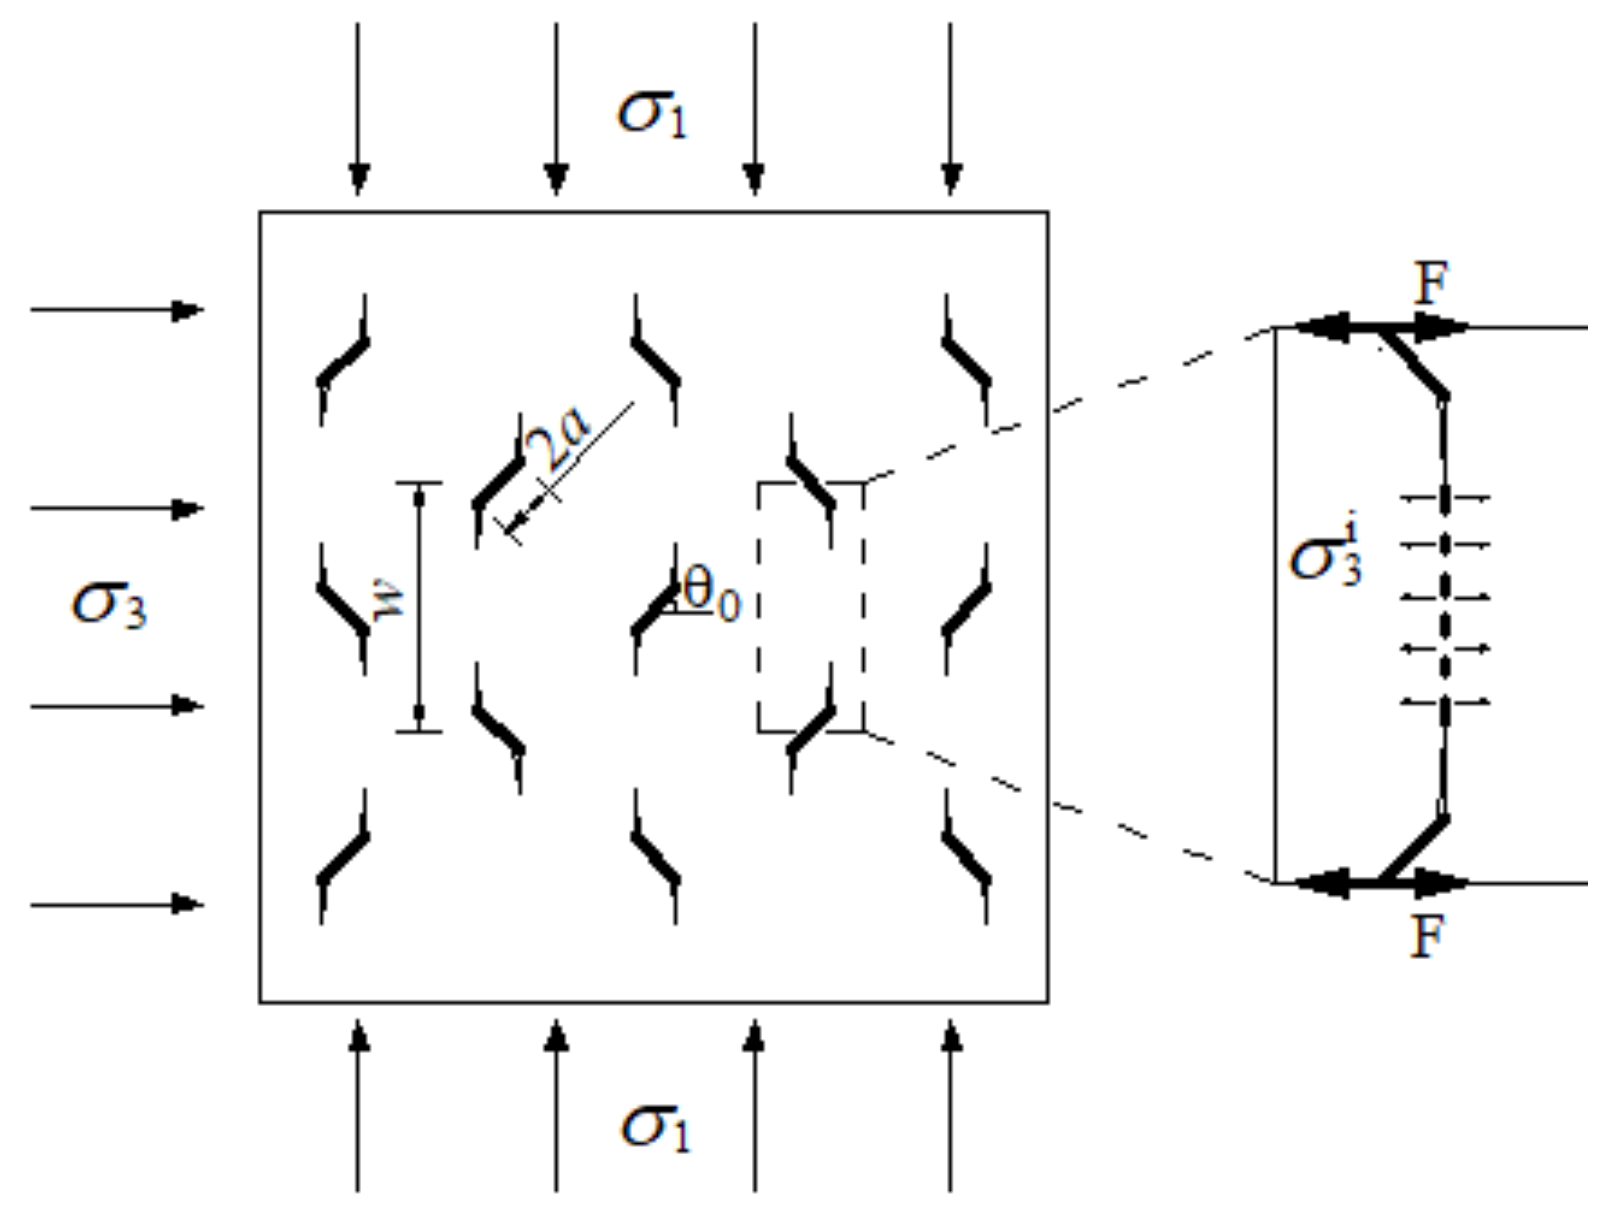
2.1. Fatigue Failure Mechanism from the Perspective of Wing Crack Propagation

From the perspective of mesoscopic propagation to study rock fracture, the microcrack propagation process in rock can be divided into two stages, namely, the crack initial stage and the wing crack propagation stage. According to the experimental results of Ashby and Sammis [21], after initialization of the cracks, the wing cracks deviate from their original positions and propagate in the direction parallel to the maximum compressive principal stress σ1. The stress intensity factor of the single wing crack can be then expressed as:
K I = 2 a τ cos θ 0 π ( L + λ a ) σ 3 π L ,
where a and θ0 represent the length and angle of the initial inclined crack, respectively; L represents the propagation length of the wing crack; λ is an empirical parameter; and τ′ is the net shear stress on the intial inclined crack surface, and its value is:
τ = ( σ 1 σ 2 ) sin θ 0 cos θ 0 μ ( σ 1 cos 2 θ 0 + σ 2 sin 2 θ 0 ) .
In addition, the effect of the interaction between multiple cracks on the wing crack propagation process must be considered, as shown in Figure 1, where F = 2 a τ cos θ 0 and the reason for the existence of σ 3 i is to balance F; its value is:
σ 3 i = F w 2 ( L + a sin θ 0 ) ,
where w represents the distance between the centers of two adjacent cracks. Then, using the superposition principle and considering that σ 3 i is tensile stress yields the stress intensity factor of the wing crack tip:
K I = F π ( L + λ a ) + F w 2 ( L + a sin θ 0 ) π L σ 3 π L .
In the field of fatigue crack propagation research of materials, the most widely used method was proposed by Paris and Erdogan [22] on the basis of experiments in 1963. According to the crack propagation characteristics of the material during the fatigue loading process, Paris and Erdogan found that the fatigue crack propagation of the material experienced three stages, and the stable propagation stage of the fatigue crack accounted for the largest proportion. Based on this, Paris and Erdogan summarized the fatigue life prediction formula of the material under uniaxial tensile load as:
d L d N = C ( Δ K ) m ,
where L is the length of the crack; N is the cycles of fatigue load; and C and m are the material constants, which are affected by environmental factors and loading frequency. The classic schematic diagram of crack growth obtained by the Paris formula, namely, the S–N curve, is shown in Figure 2.
According to the analysis by Horii and Nemat-Nasser [23], for a friction-bending crack, KI is at the maximum, KII is close to 0 and the crack growth is controlled only by KI. Therefore, the Paris formula is still applicable during the wing crack propagation process under compressive load.
Consider the case of uniaxial compression, where σ3 is equal to 0. When KI = KIC, the wing crack can continue to propagate. Introducing function f(L) gives:
f ( L ) = 1 π ( L + λ a ) + 1 w 2 ( L + a sin θ 0 ) π L .
In the fatigue loading process, the upper limit stress is expressed as σmax, and the lower limit stress is expressed as σmin. Therefore, from Equation (10), we can obtain:
K max = 2 a cos θ 0 σ max sin θ 0 cos θ 0 μ σ max cos 2 θ 0 f L ,
K min = 2 a cos θ 0 σ min sin θ 0 cos θ 0 μ σ min cos 2 θ 0 f L .
Combining Equations (7) and (8) gives:
Δ K = 2 a cos θ 0 sin θ 0 cos θ 0 μ cos 2 θ 0 σ max σ min f L ,
Substituting Equation (9) into Equation (5) after integration, the fatigue life prediction formula of rock under uniaxial fatigue load can be expressed as:
N = 1 C 2 a cos θ 0 sin θ 0 cos θ 0 μ cos 2 θ 0 σ max σ min m L 1 L 2 d L [ f ( L ) ] m ,
where L1 and L2 are the two solutions of Equation (11), respectively. Equation (11) is shown as follows:
2 a cos θ 0 sin θ 0 cos θ 0 μ cos 2 θ 0 σ max f ( L ) = K IC .
The variation trend of f(L) with L is shown in Figure 3.
When the axial stress reaches σmax for the first time, the stress intensity factor KI at the tip of the wing crack is equal to the fracture toughness KIC of the rock material. As the number of fatigue cycles increases, the wing crack length increases gradually. It can be seen from Figure 3 that when the length of the wing crack is greater than L1 and less than L2, f(L) is less than f(L1), so the stress intensity factor at the tip of the wing crack is less than the fracture toughness KIC of the rock material. Under this condition, wing cracks propagate stably. When the wing crack length increases to L2, the stress intensity factor at the tip of the wing crack is, again, equal to the fracture toughness of the rock material. When the wing crack length is greater than L2, the stress intensity factor at the tip of the wing crack is greater than the fracture toughness of the rock material under the condition that the upper limit stress is σmax. Since the stress intensity factor of the material cannot be greater than the fracture toughness, the wing crack will propagate unstably and cause fatigue failure of the rock. Through the above analysis, it can be seen that when the wing crack length is between L1 and L2, the fatigue crack propagation is stable, so the upper and lower limits of the integral in Equation (10) are L1 and L2, respectively. Since L1 and L2 are determined by the upper limit stress σmax, the effect of upper limit stress on rock fatigue life is more significant than that of lower limit stress.

2.2. AE Methods

In brittle materials, the main source of AE is crack propagation. Typical AE parameters include duration, rise time, amplitude, count and energy. The physical meaning of the AE parameters is shown in Figure 4.

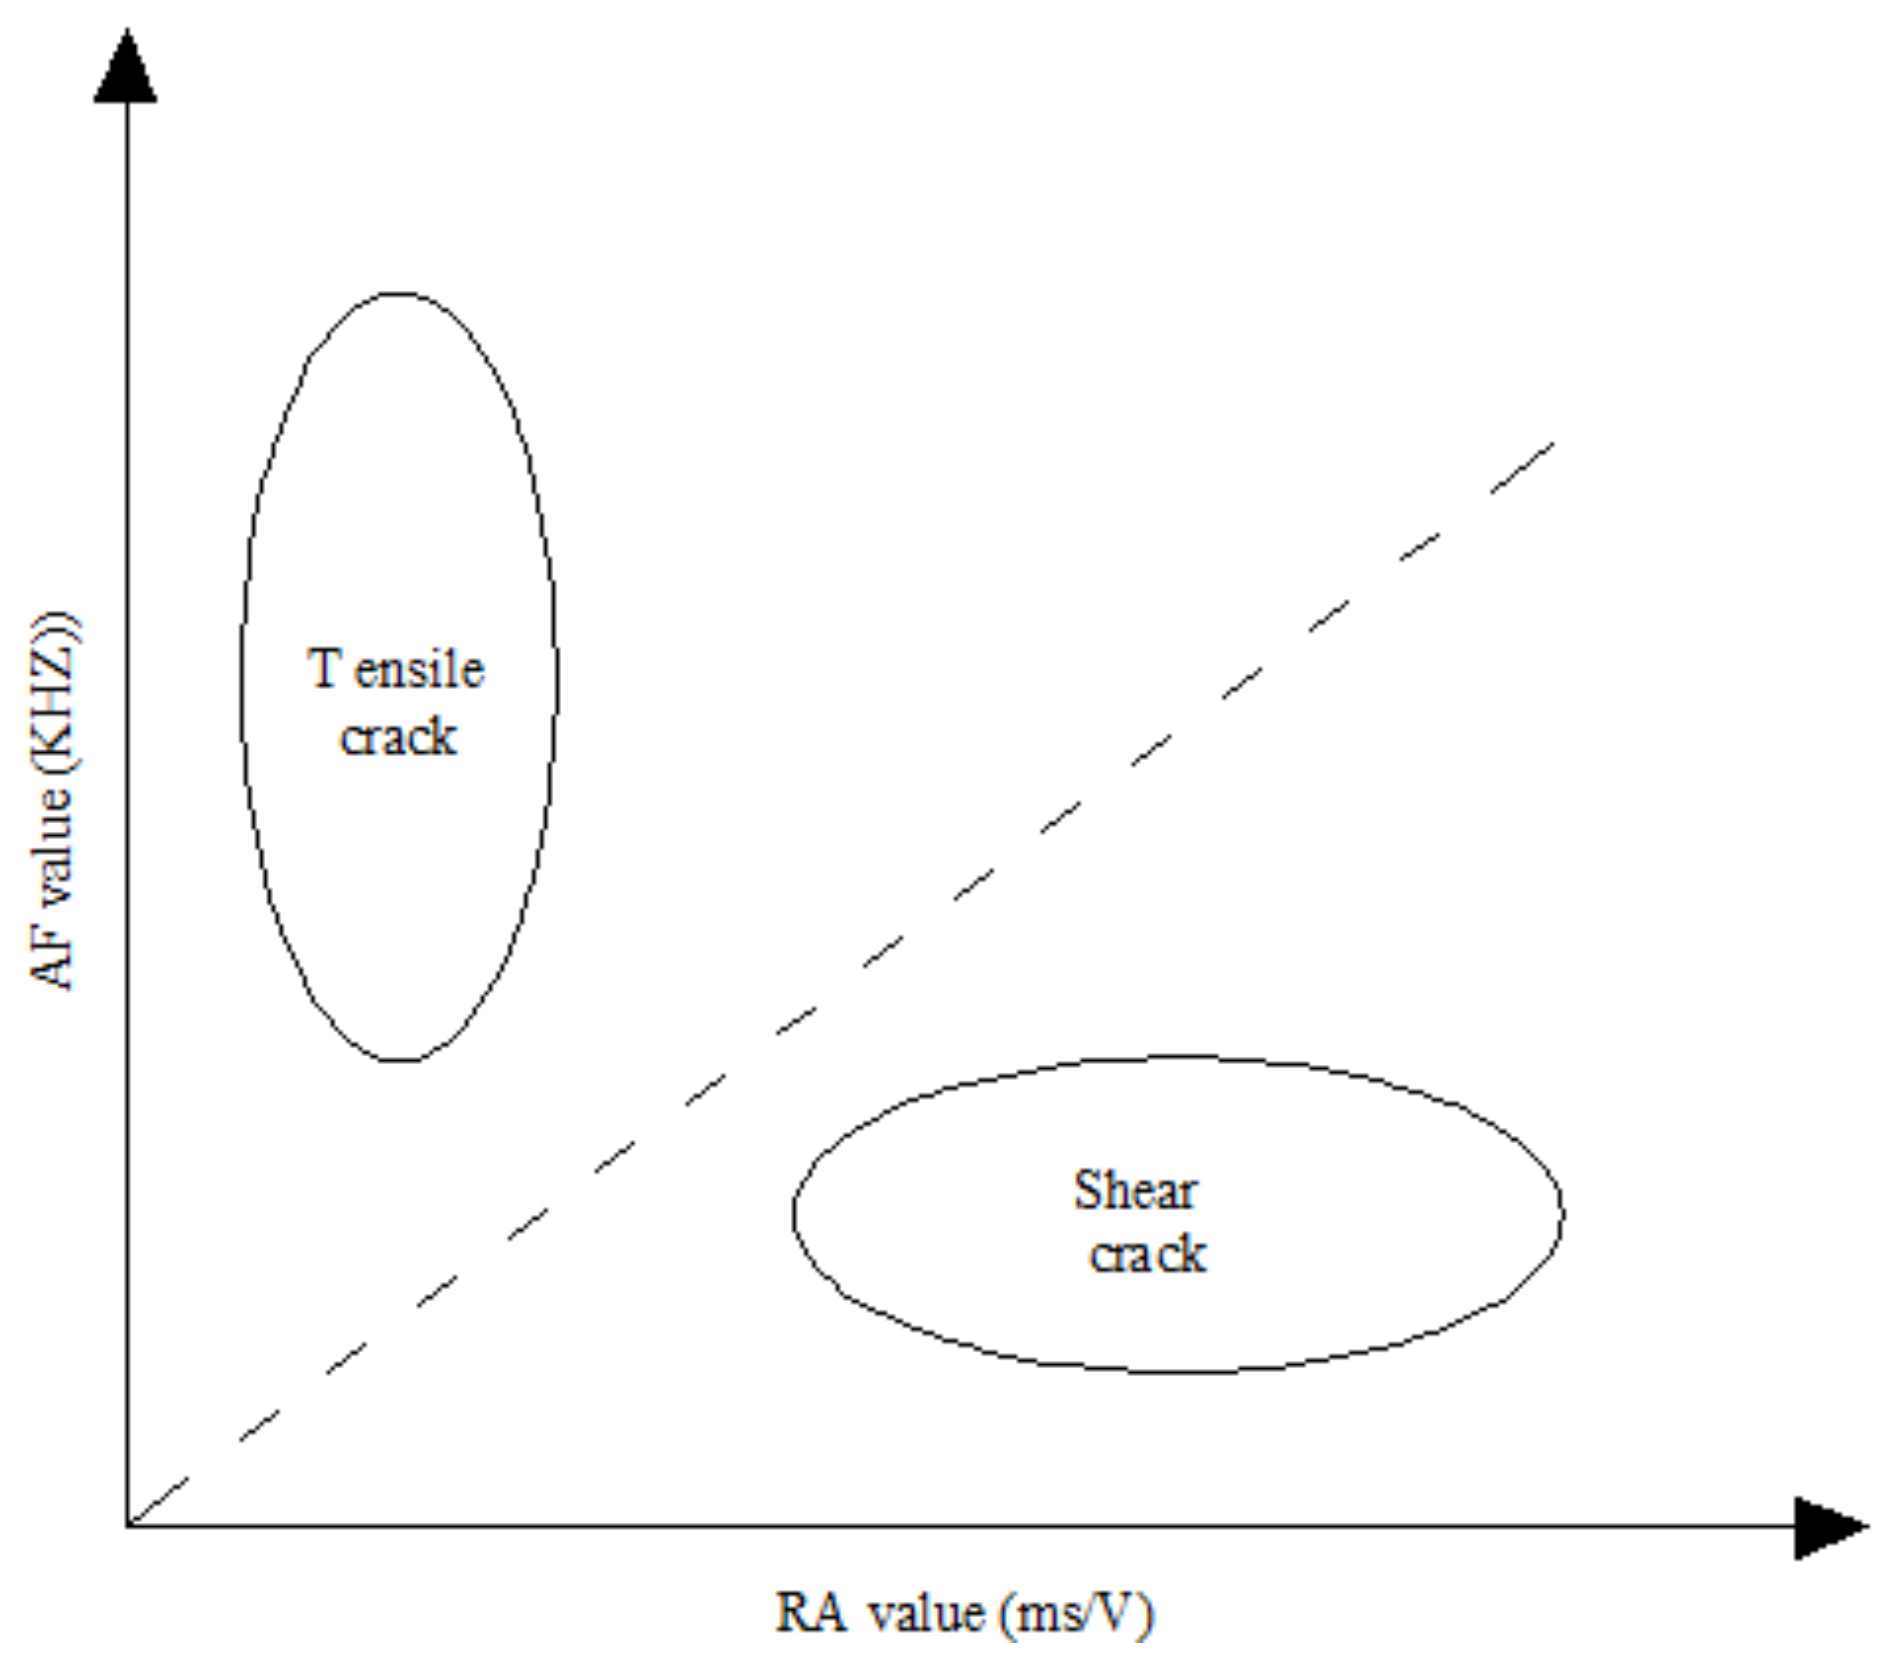
2.2.1. Crack Classification by RA and AF Values

The fracture of rock units is divided into tensile and shear fractures. The purpose of crack classification is to distinguish tensile and shear fractures. Using AE to distinguish crack types, there are two main methods, that is, moment tensor analysis [24] and the clustering method [25]. The clustering method judges whether the AE crack source belongs to the tension type or the shear type through looking at the values of RA and AF. The classification method is shown in Figure 5.

2.2.2. Crack Classification Using Moment Tensor Method

With the moment tensor method, the microcrack mechanism in rock can be divided into tension type, shear type and mixed type. The moment tensor method is an inversion method, which can be obtained as follows:
A ( x ) = C S R e t , r R r 1   r 2   r 3 × m 11 m 12 m 13 m 21 m 21 m 22 m 31 m 32 m 33 r 1 r 2 r 3 ,
where CS is the sensor coupling coefficient; Re(t,r) is the reflection coefficient of the source wave; R is the distance vector between the source and the sensor; r1, r2 and r3 are the direction cosine matrices; and mij represents the individual components of the moment tensor. According to the method suggested by Ohtsu [26], the classification of AE sources can be determined by:
λ 1 / λ 1 = X + Y + Z λ 2 / λ 1 = 0 . 5 Y + Z λ 3 / λ 1 = X 0 . 5 Y + Z ,
where λ1, λ2 and λ3 are the three normalized eigenvalues of the moment tensor, and they are arranged in descending order. The method of judging the type of crack source according to the moment tensor is: when A ≥ 60%, the crack source is shear type; when A ≤ 40%, the crack source is tensile type; when 40% < A < 60%, the crack source is mixed type.

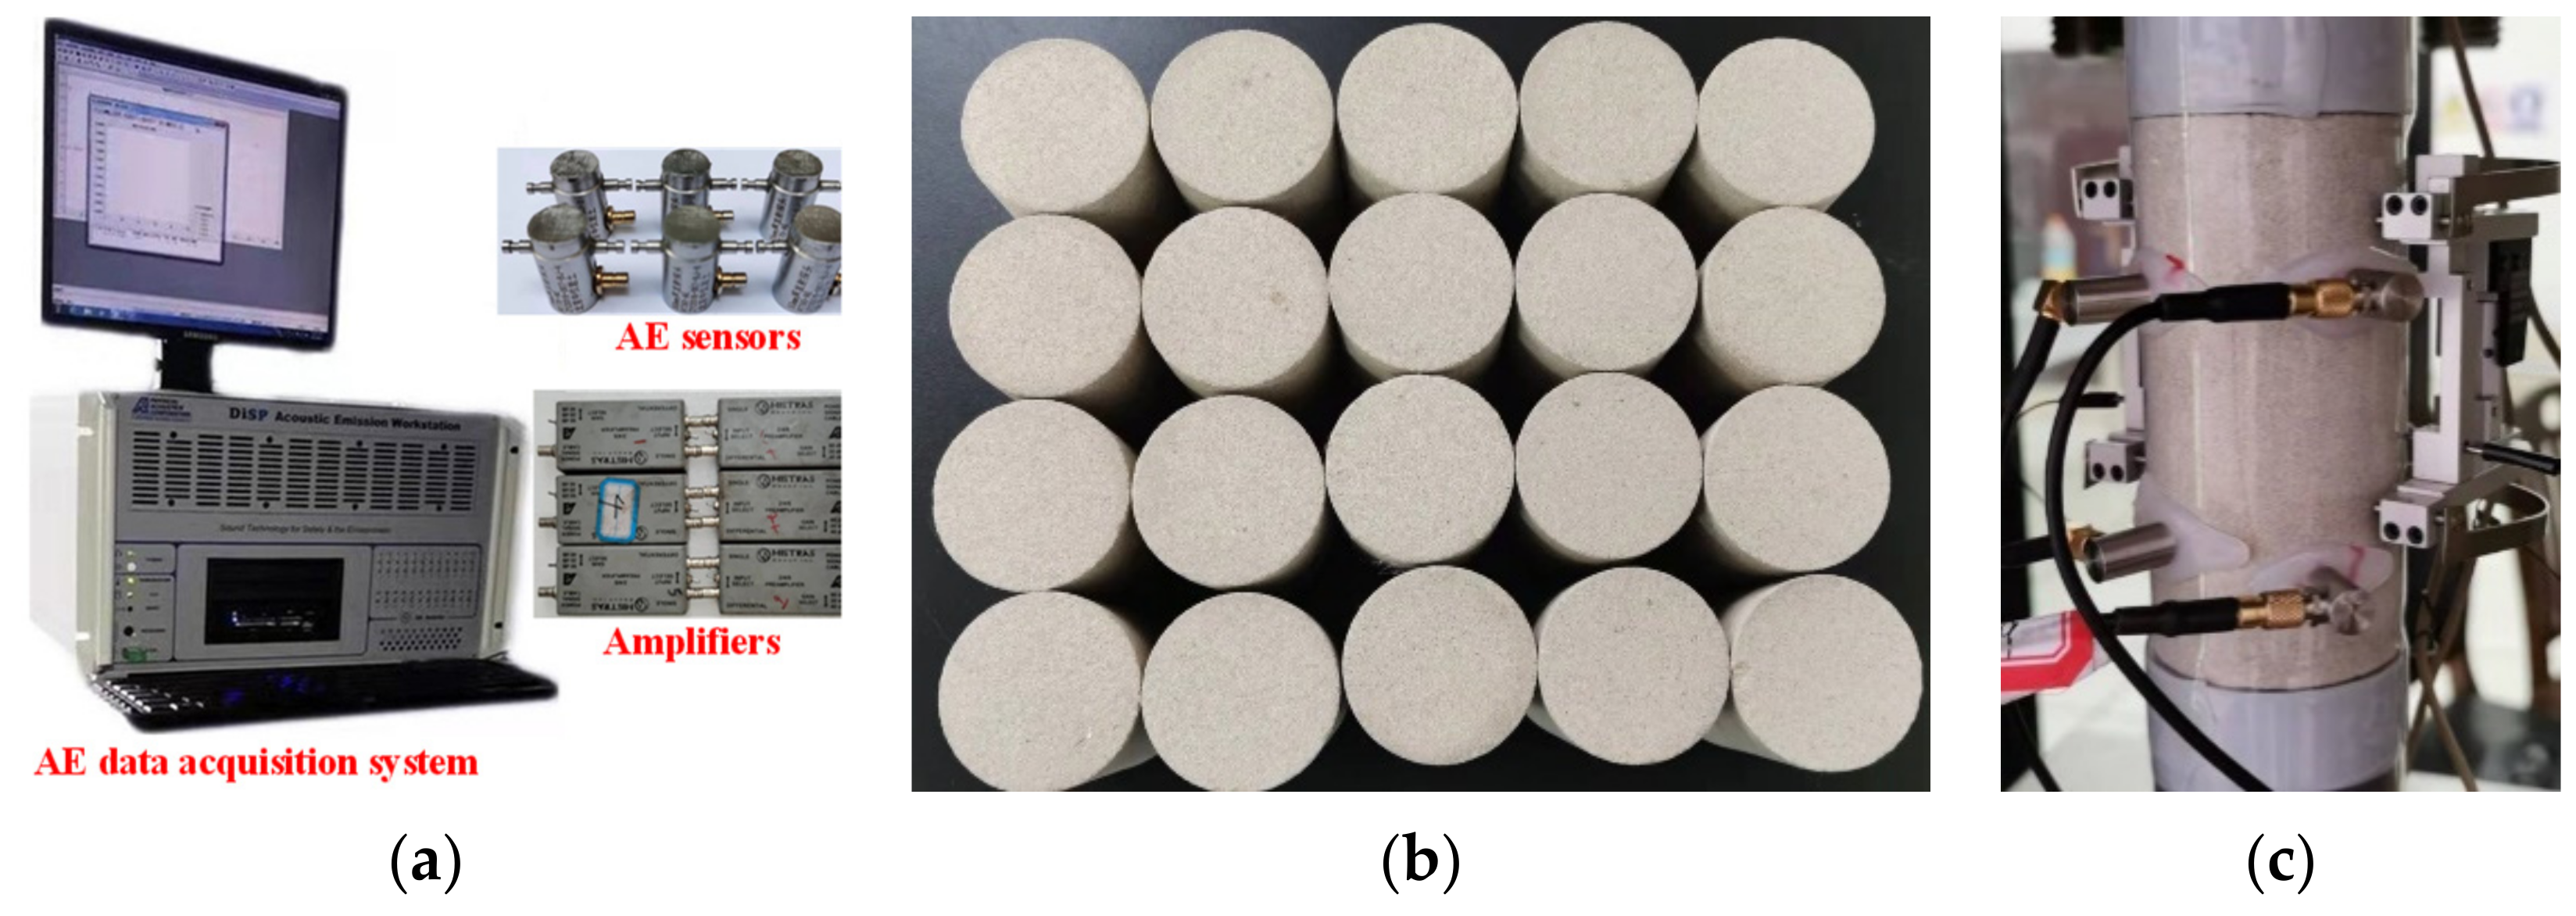
3. Experimental Setup and Sample Description

A yellow sandstone sample was used in the experiment; its length and diameter were 100 mm and 50 mm, respectively, and the parallelism of the sample surface was controlled within 0.2 mm. During the test, the MTS815 mechanical testing machine was used for fatigue loading. First, monotonic loading was performed by controlling the size of the load, and the loading rate was 0.1 KN/s. When the load size was equal to the upper limit stress, fatigue loading was performed, and the frequency of fatigue loading was 1 Hz.
AE signals of sandstone samples during fatigue failure process were collected synchronously by PCI-2 AE instrument developed by American Physical Acoustics Company. A total of 6 AE sensors were used in the fatigue test. The sensor surface was processed into an arc surface so that it could fit more closely with the sandstone sample. The AE threshold was set to 40 dB; the preamplifier multiple was set to 60 dB. The AE instrument and sample assembly are shown in Figure 6.

4. Results and Discussion

Firstly, the conventional triaxial loading experiment of sandstone under different confining pressure conditions was carried out. The stress–strain curve of sandstone is shown in Figure 7.
According to the stress–strain curve characteristics of sandstone under different confining pressures, the meso-mechanical parameters in Equation (4) were determined to be:
KIC = 0.38 MPa·m1/2, μ = 0.62, b = 3.3 × 10⁻⁴ m,
θ0 = 65.36°, w = 1.6 × 10⁻³ m, λ = 0.05.

4.1. Theoretical and Experimental Results Analysis of Sandstone Fatigue Life

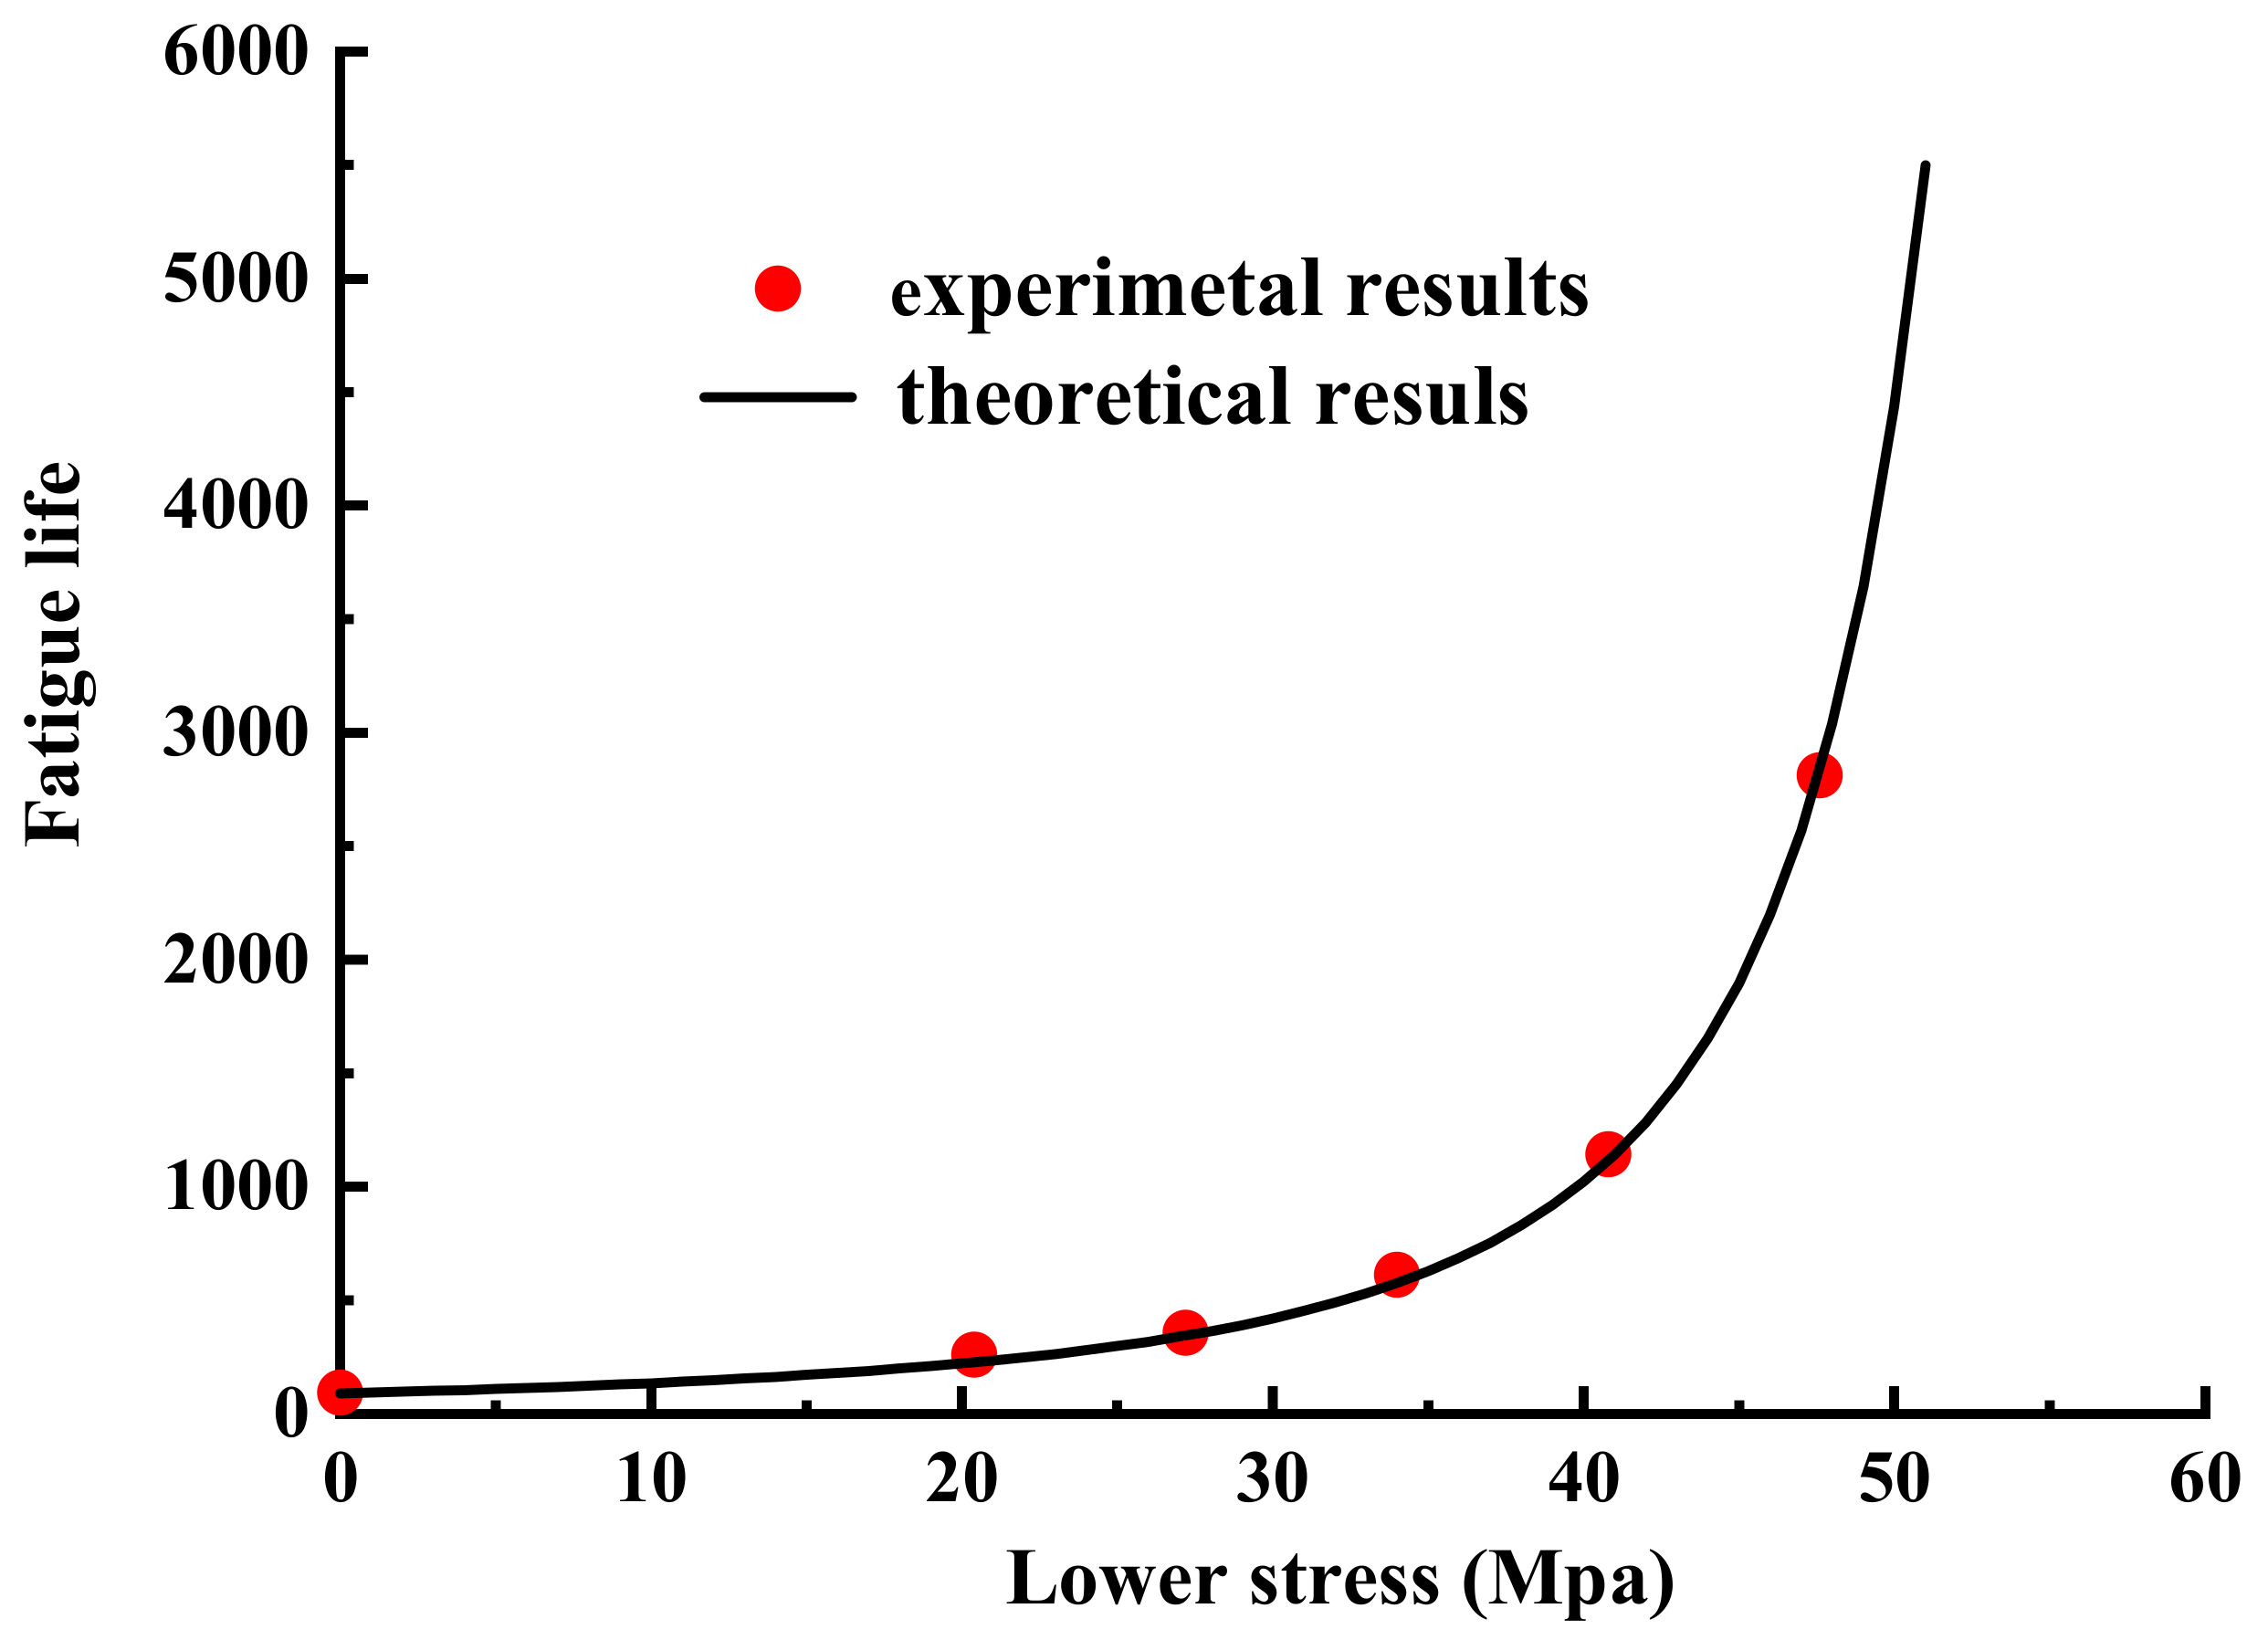
4.1.1. The Effect of Lower Limit Stress on Fatigue Life

Using Equation (10) to predict the fatigue life of rock, it was necessary to determine the upper and lower integral limits L1 and L2, respectively. According to Equation (10), the evolution law of wing crack length L with axial stress σ1 under different confining pressures could be obtained, as shown in Figure 8. The values of L1 and L2 were determined according to the wing crack length corresponding to the upper limit stress σmax in Figure 8.
To determine the fatigue life of rock, one of the key problems is to determine the material constants C and m. Since the values of C and m are not as easy to obtain directly as those of metal materials, the two values need to be obtained indirectly first. Therefore, the upper limit stress value was fixed first, and the fatigue life value of a group of sandstone samples was obtained by changing the lower limit stress value. The fatigue stress–strain curves of some sandstone samples are shown in Figure 9.
According to the results of the fatigue tests, the fatigue life of sandstone samples at different lower limit stress values could be obtained, as shown in Table 1.
According to the data values in Table 1, the values of C and m were about 2.06 × 10⁻⁵ and 2.3, respectively. According to the obtained meso-mechanical parameter values and Equation (10), the theoretical fatigue life of sandstone samples could be calculated and compared with the data obtained in the experiment, as shown in Figure 10.
It can be seen from Figure 10 that when the upper limit stress was fixed, the fatigue life of the sandstone sample gradually increased with the increase in the upper limit stress, and the theoretical prediction value was in good agreement with the experimental results.

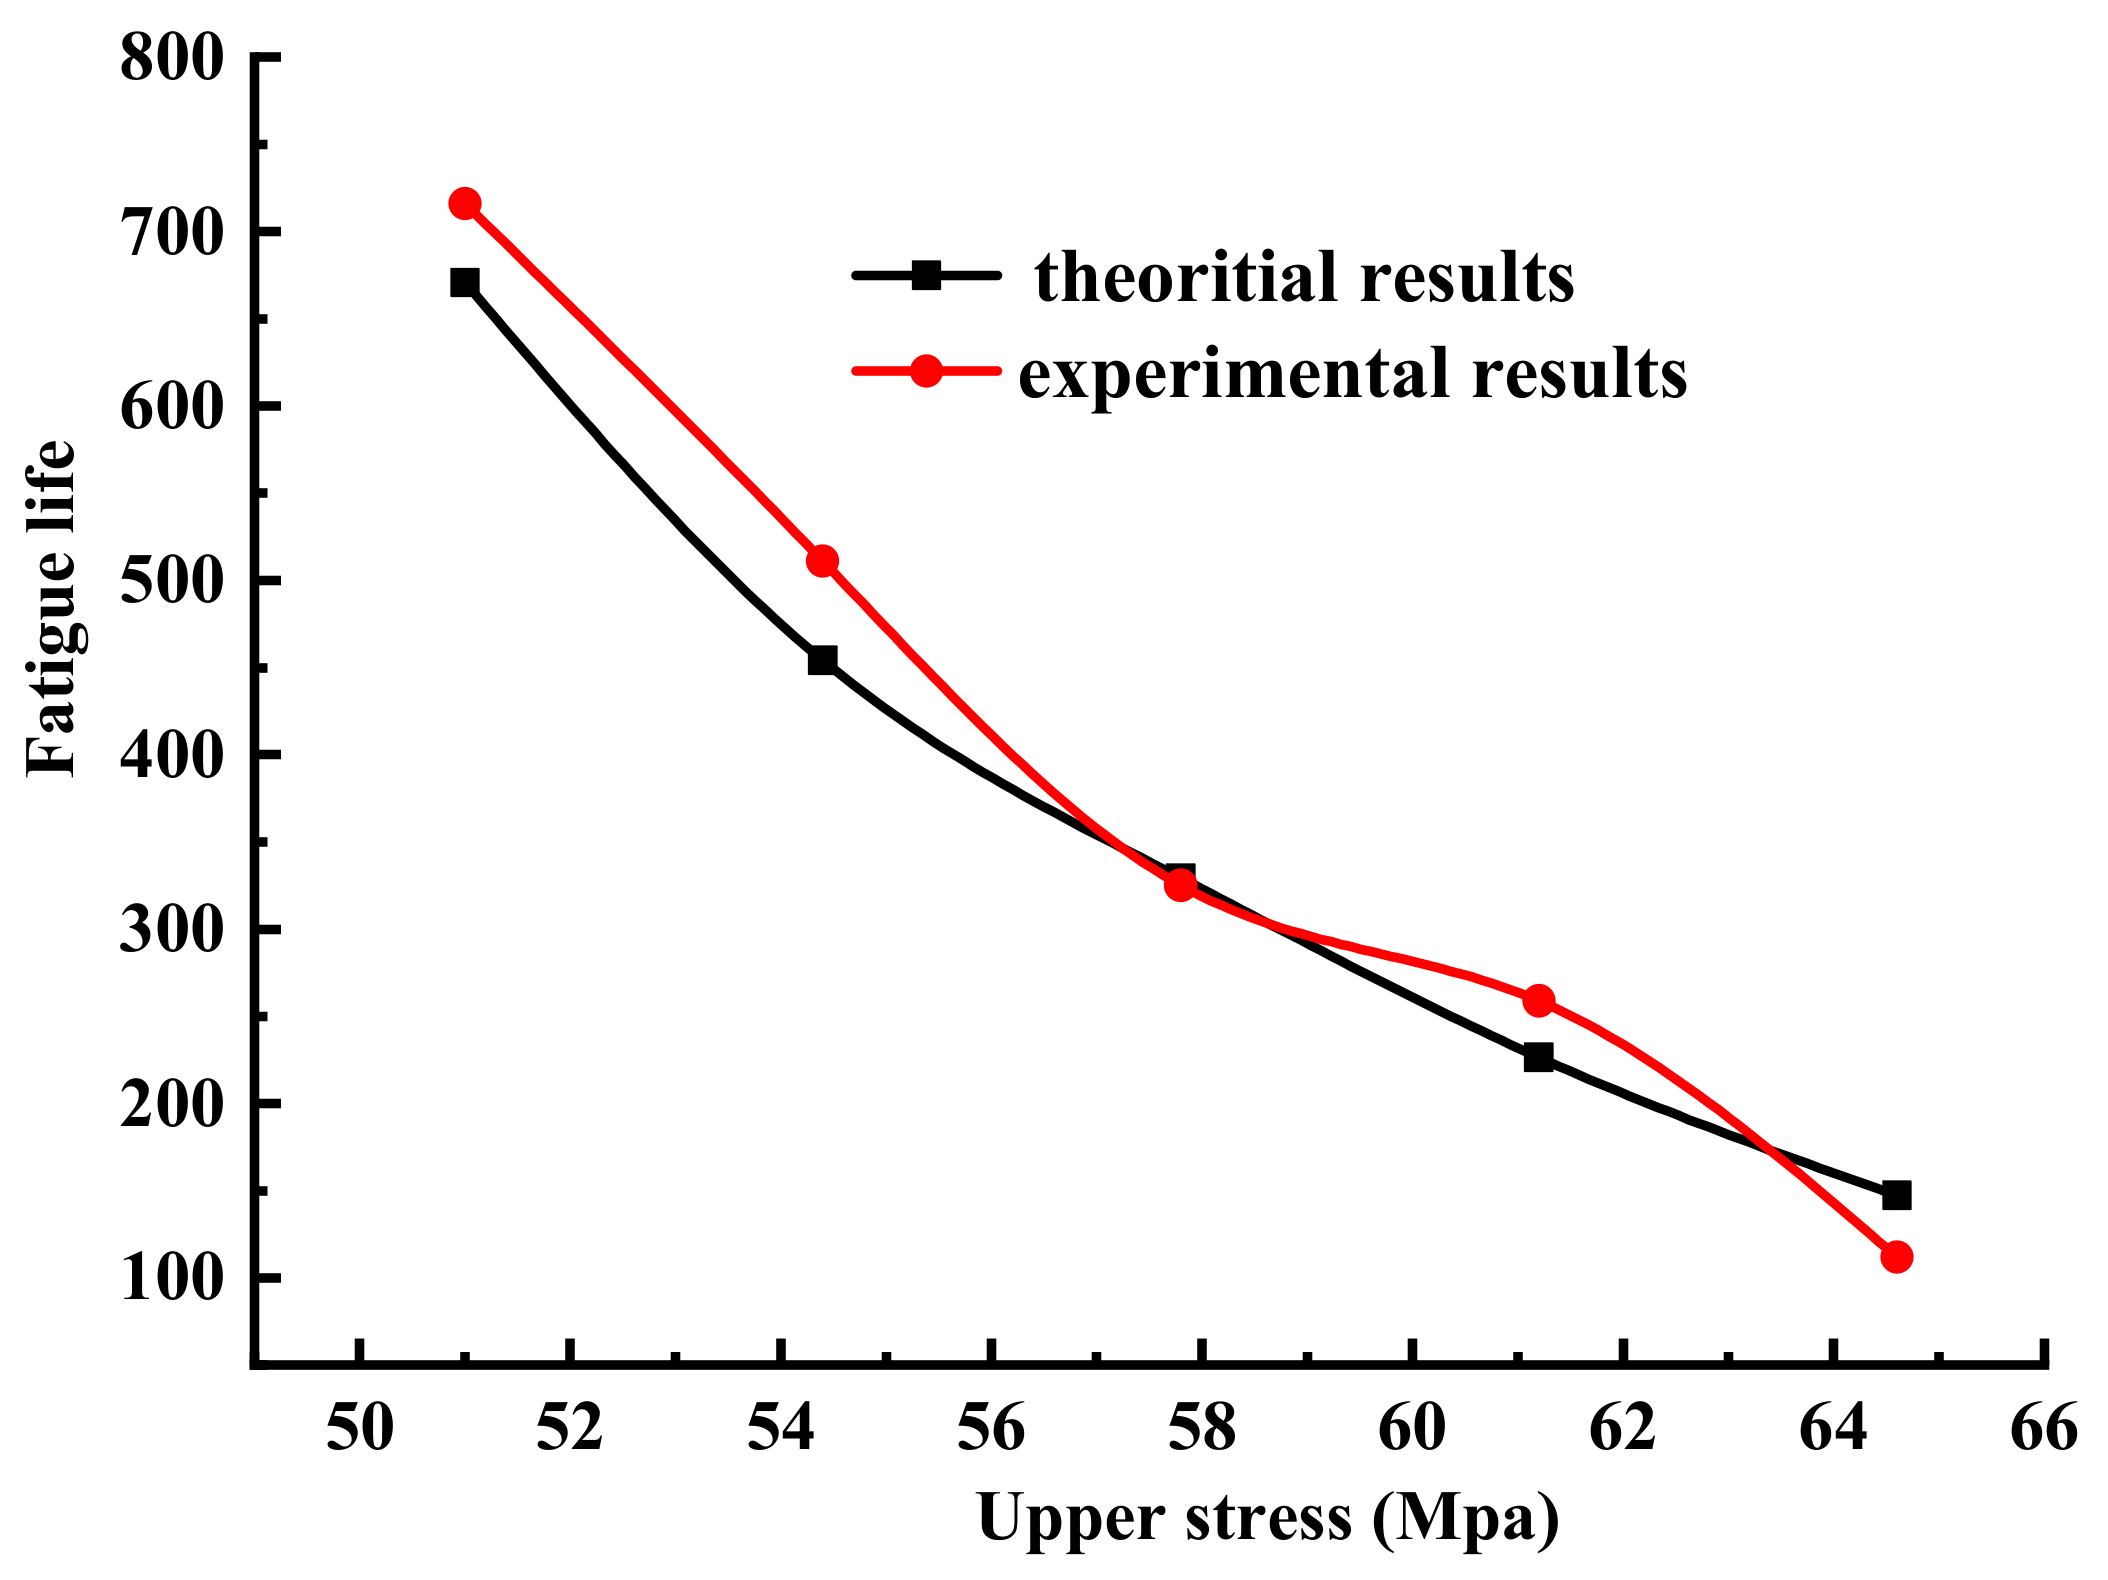
4.1.2. The Effect of Upper Limit Stress on Fatigue Life

The fatigue stress–strain curves of sandstone Samples F2-1 and F2-5 are shown in Figure 11.
According to the results of the fatigue tests, the fatigue life of sandstone samples at different lower limit stress values could be obtained, as shown in Table 2.
According to the obtained meso-mechanical parameter values and Equation (10), the theoretical fatigue life of sandstone samples under different upper stresses could be calculated and compared with the data obtained in the experiments, as shown in Figure 12.
It can be seen from Figure 12 that when the lower limit stress was fixed, the fatigue life of the sandstone samples gradually decreased with the increase in the upper limit stress, and the theoretical prediction value was in good agreement with the experimental result, which showed the accuracy of the fatigue prediction model.
The fatigue life of rock is affected by the upper limit stress and the lower limit stress. An increase in the upper limit stress and decrease in the lower limit stress can significantly reduce the fatigue life of rock. From the analysis of the results from Samples F1-3 and F2-2, under the condition of the same differential stress, the lower limit stress of Sample F1-3 was greater than that of Sample F2-2. Therefore, the fatigue life of Sample F1-3 may be larger than that of Sample F2-2 only from the perspective of the lower limit stress. Since the upper limit stress of Sample F1-3 was larger than that of Sample F2-2, the fatigue life of Sample F1-3 may be smaller than that of Sample F2-2 only from the perspective of the upper limit stress. However, the fatigue life of Sample F1-3 was obviously smaller than that of Sample F2-2, both from the experimental results and the theoretical prediction results. Thus, it was theoretically proved that the influence of upper limit stress on rock fatigue life is greater than that of lower limit stress.
Haghgouei et al. [27] studied the factors affecting rock fatigue life through experiments, and they found that when the upper limit stress is fixed, the fatigue life of rock gradually decreases with an increase in stress amplitude, and there is a negative power exponential relationship, which is consistent with the model results in this paper. Through experimental research, Li et al. [28] pointed out that the upper limit stress is the main factor affecting the fatigue life of rock, and the fatigue life prediction model in this paper confirmed this point of view.

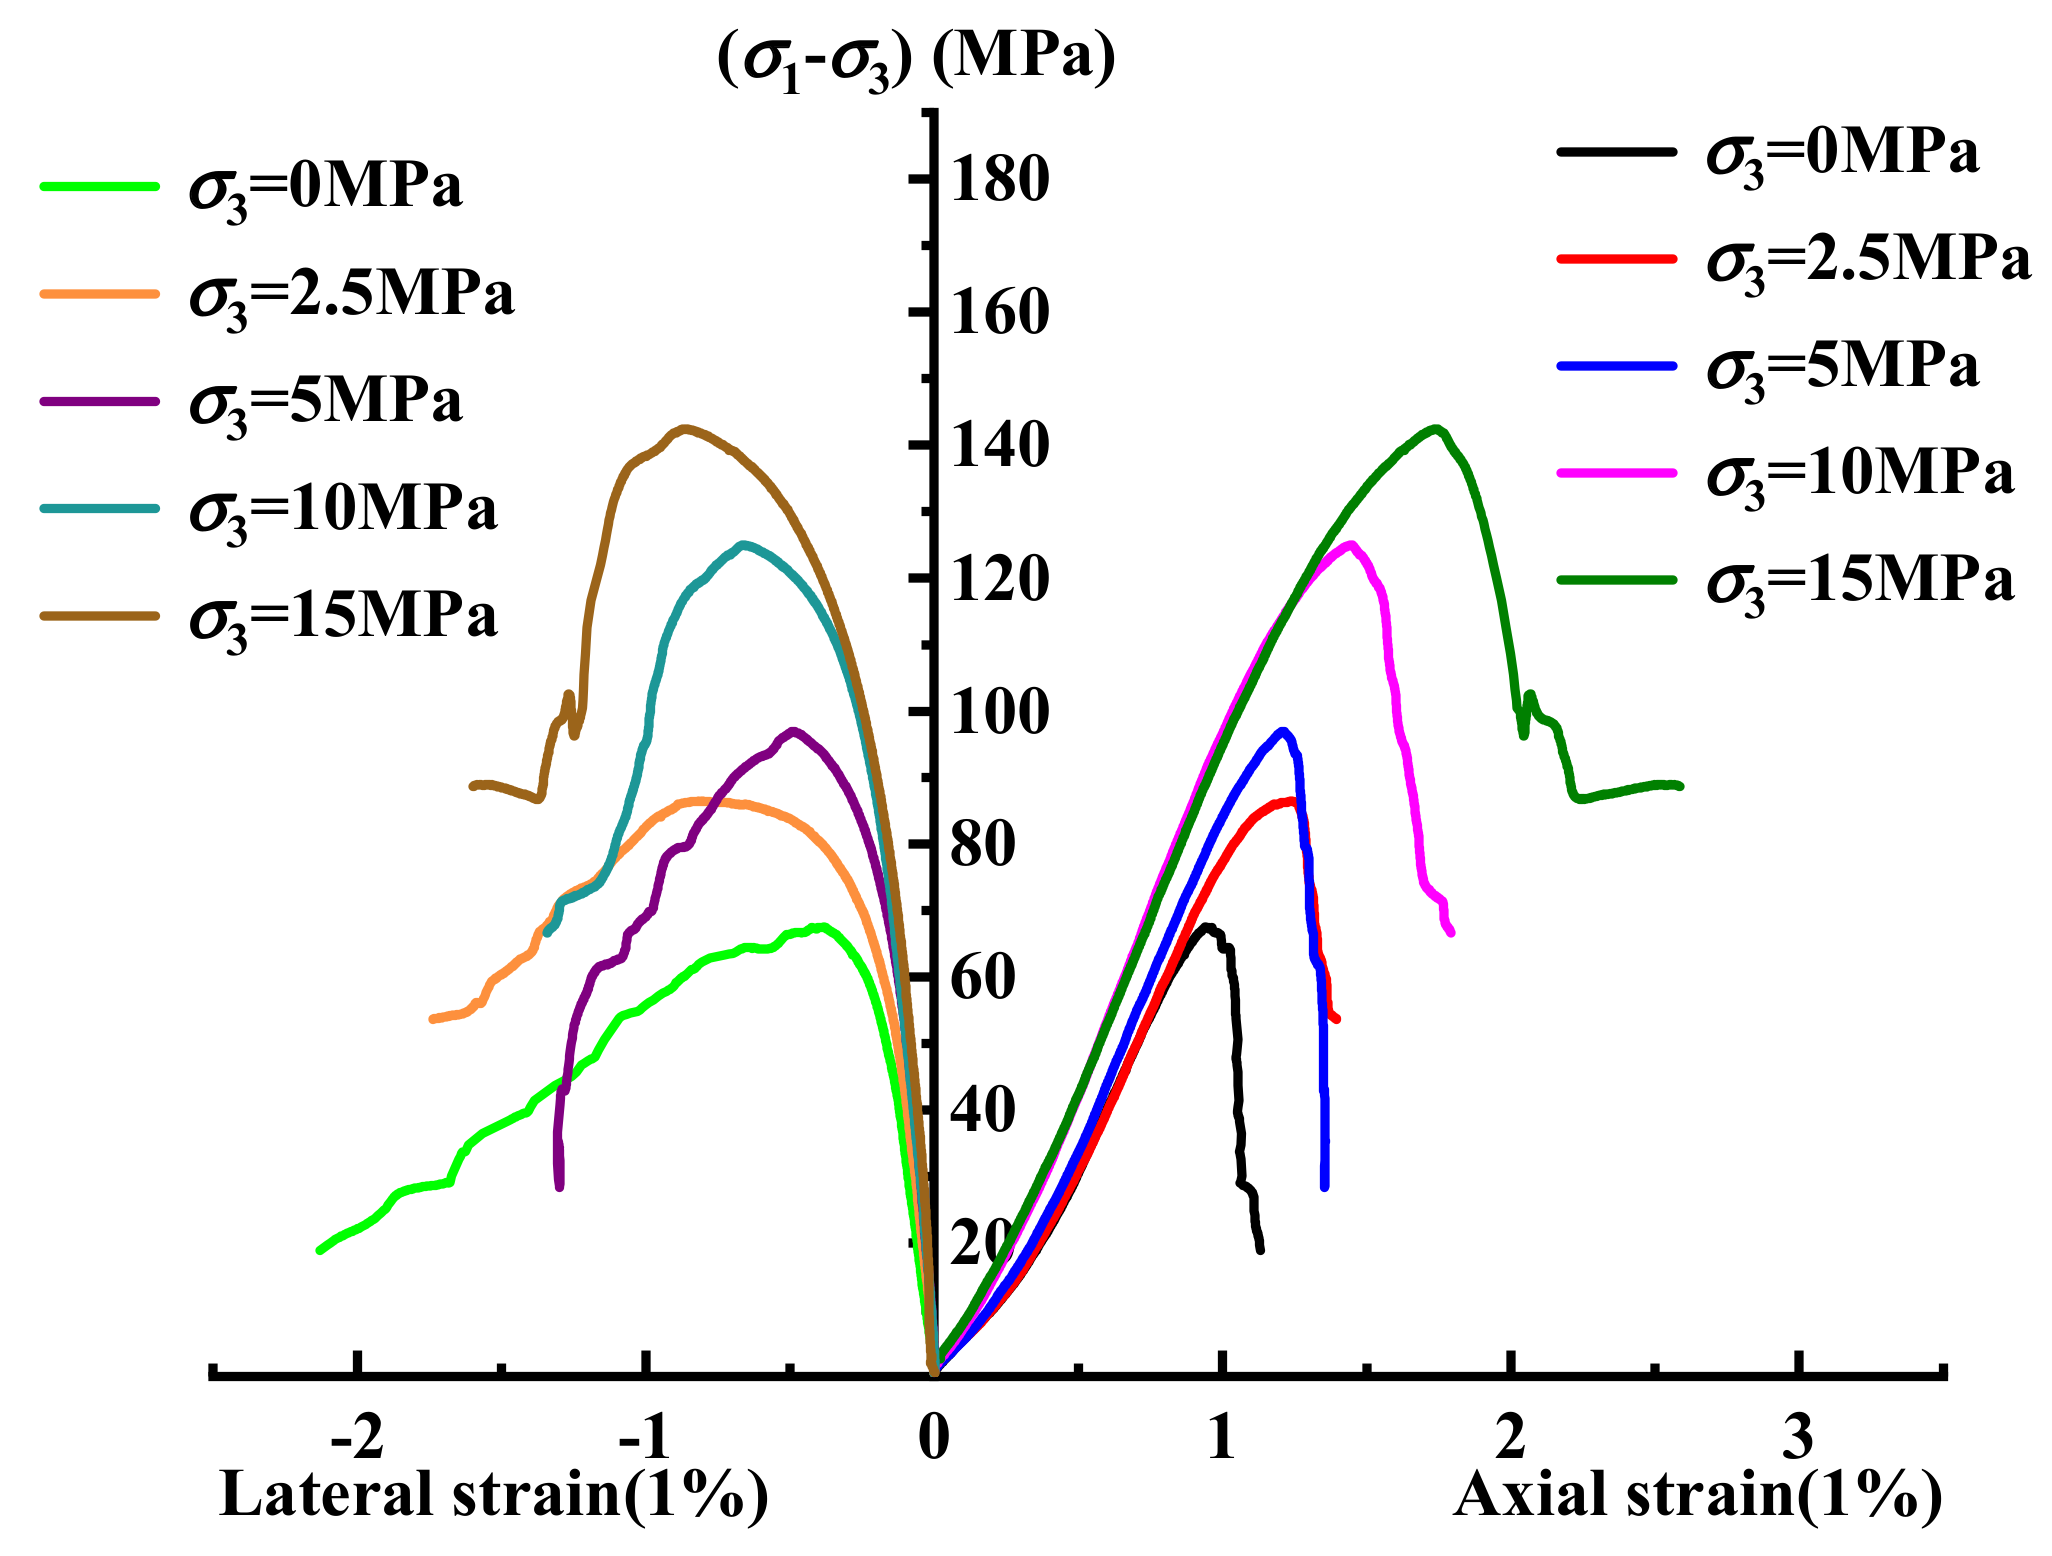
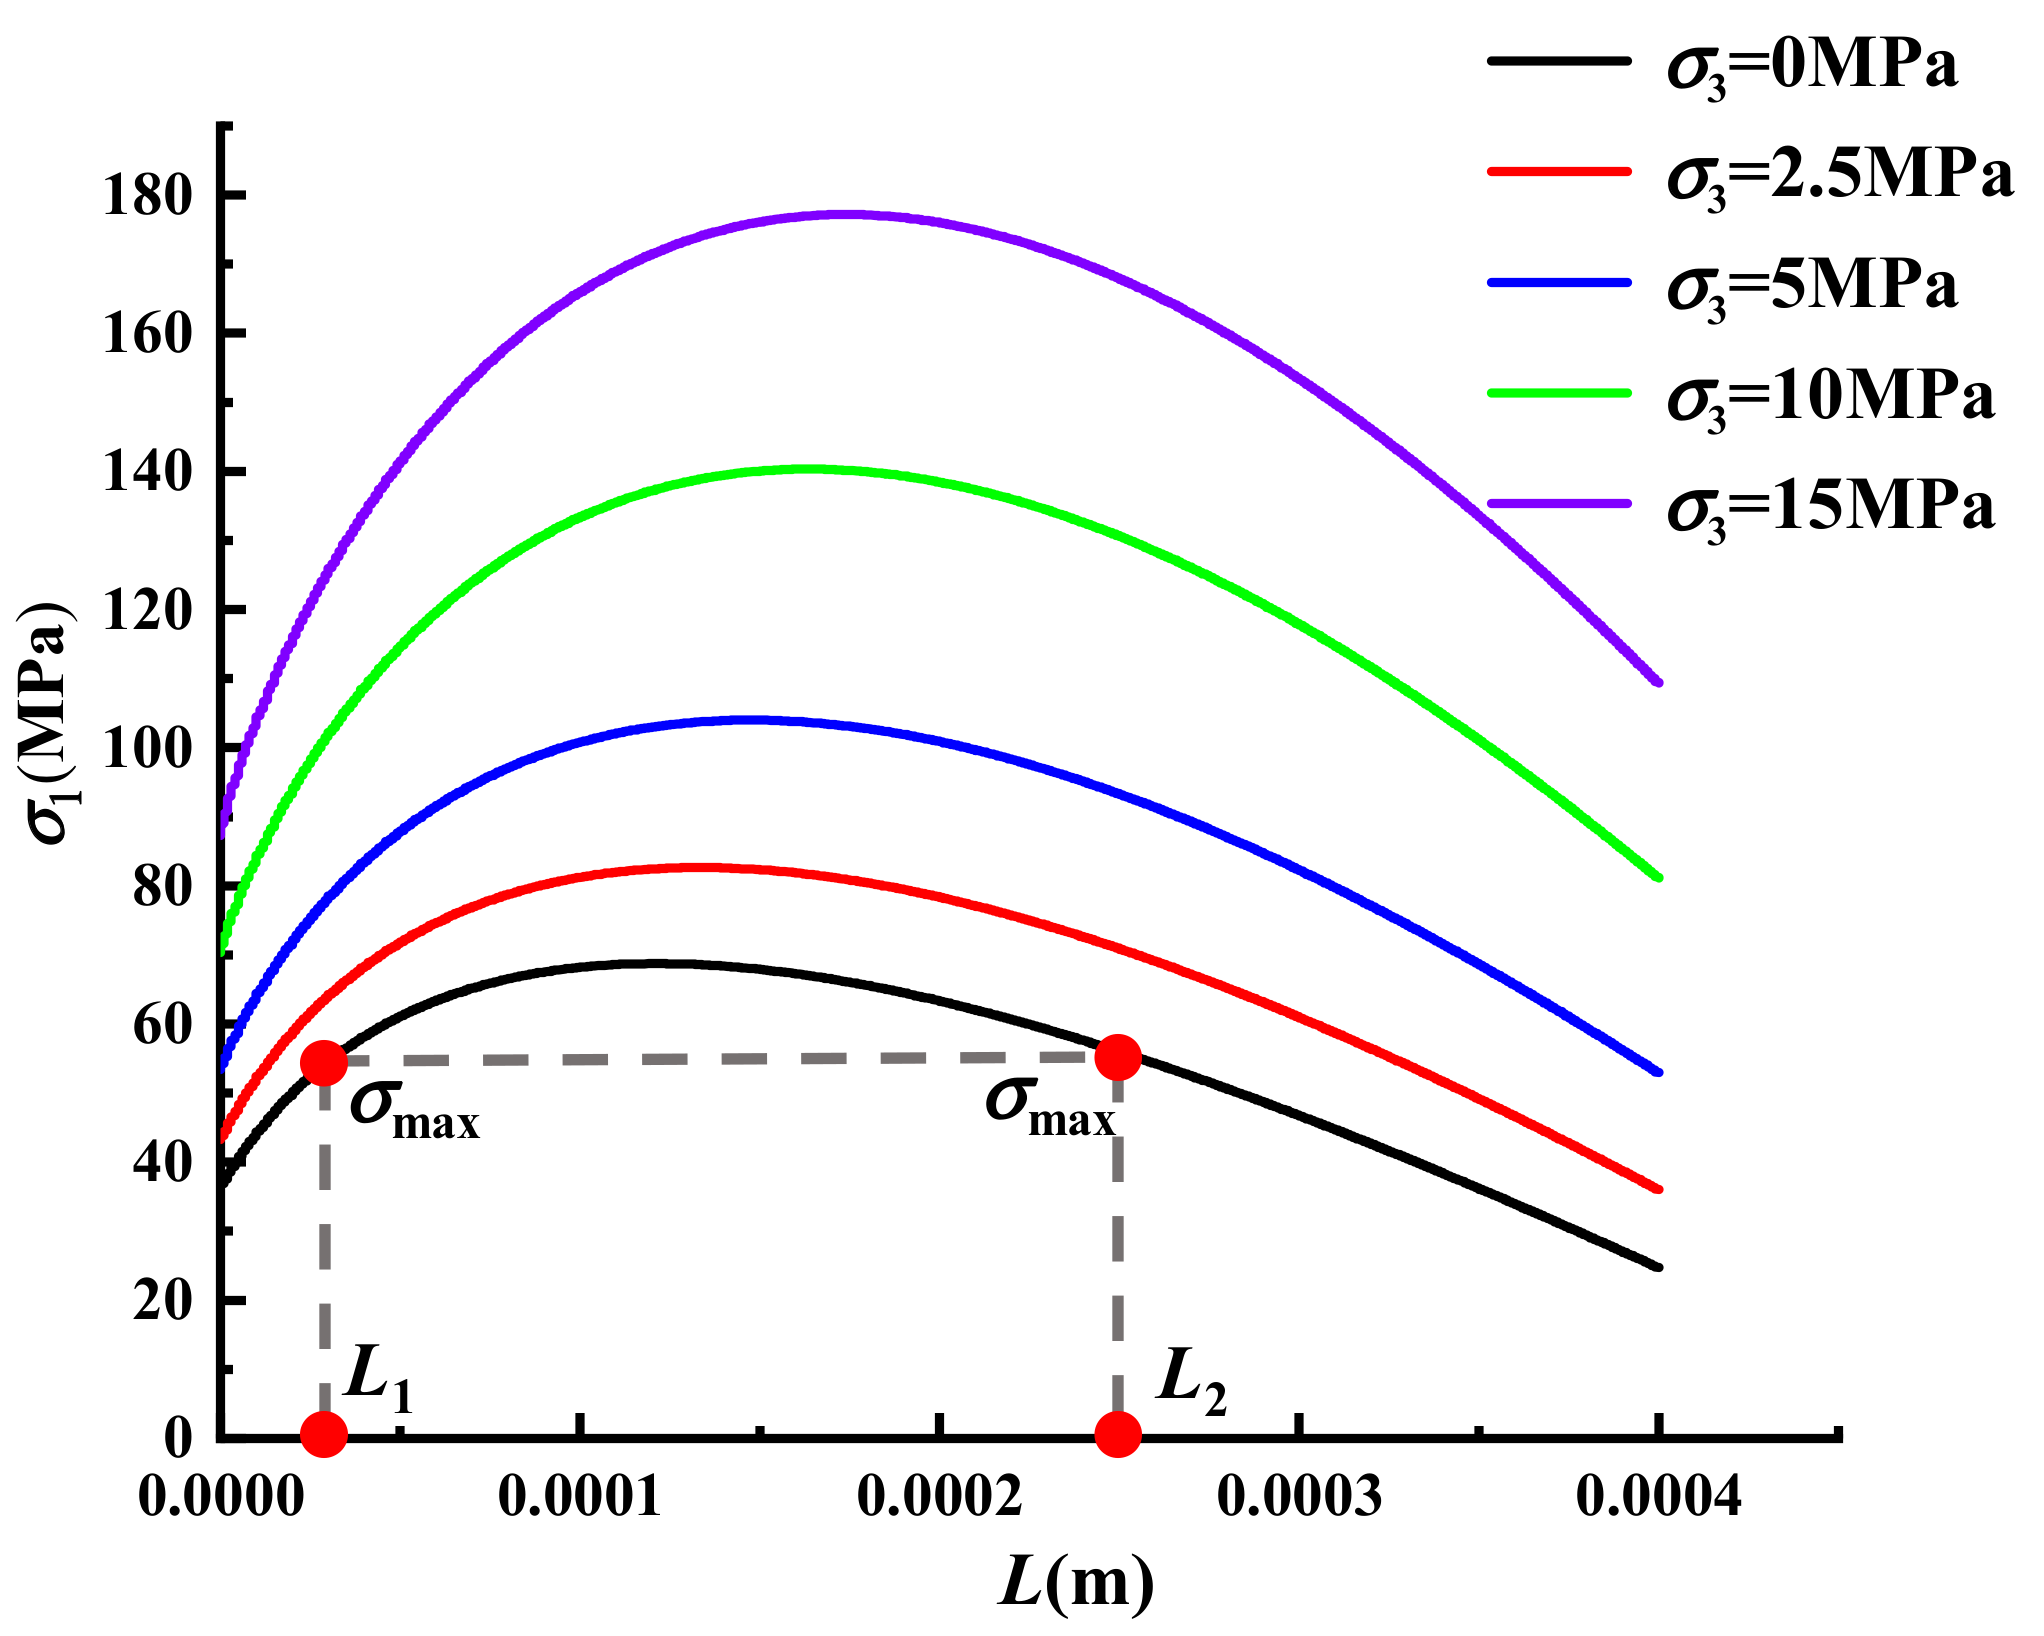
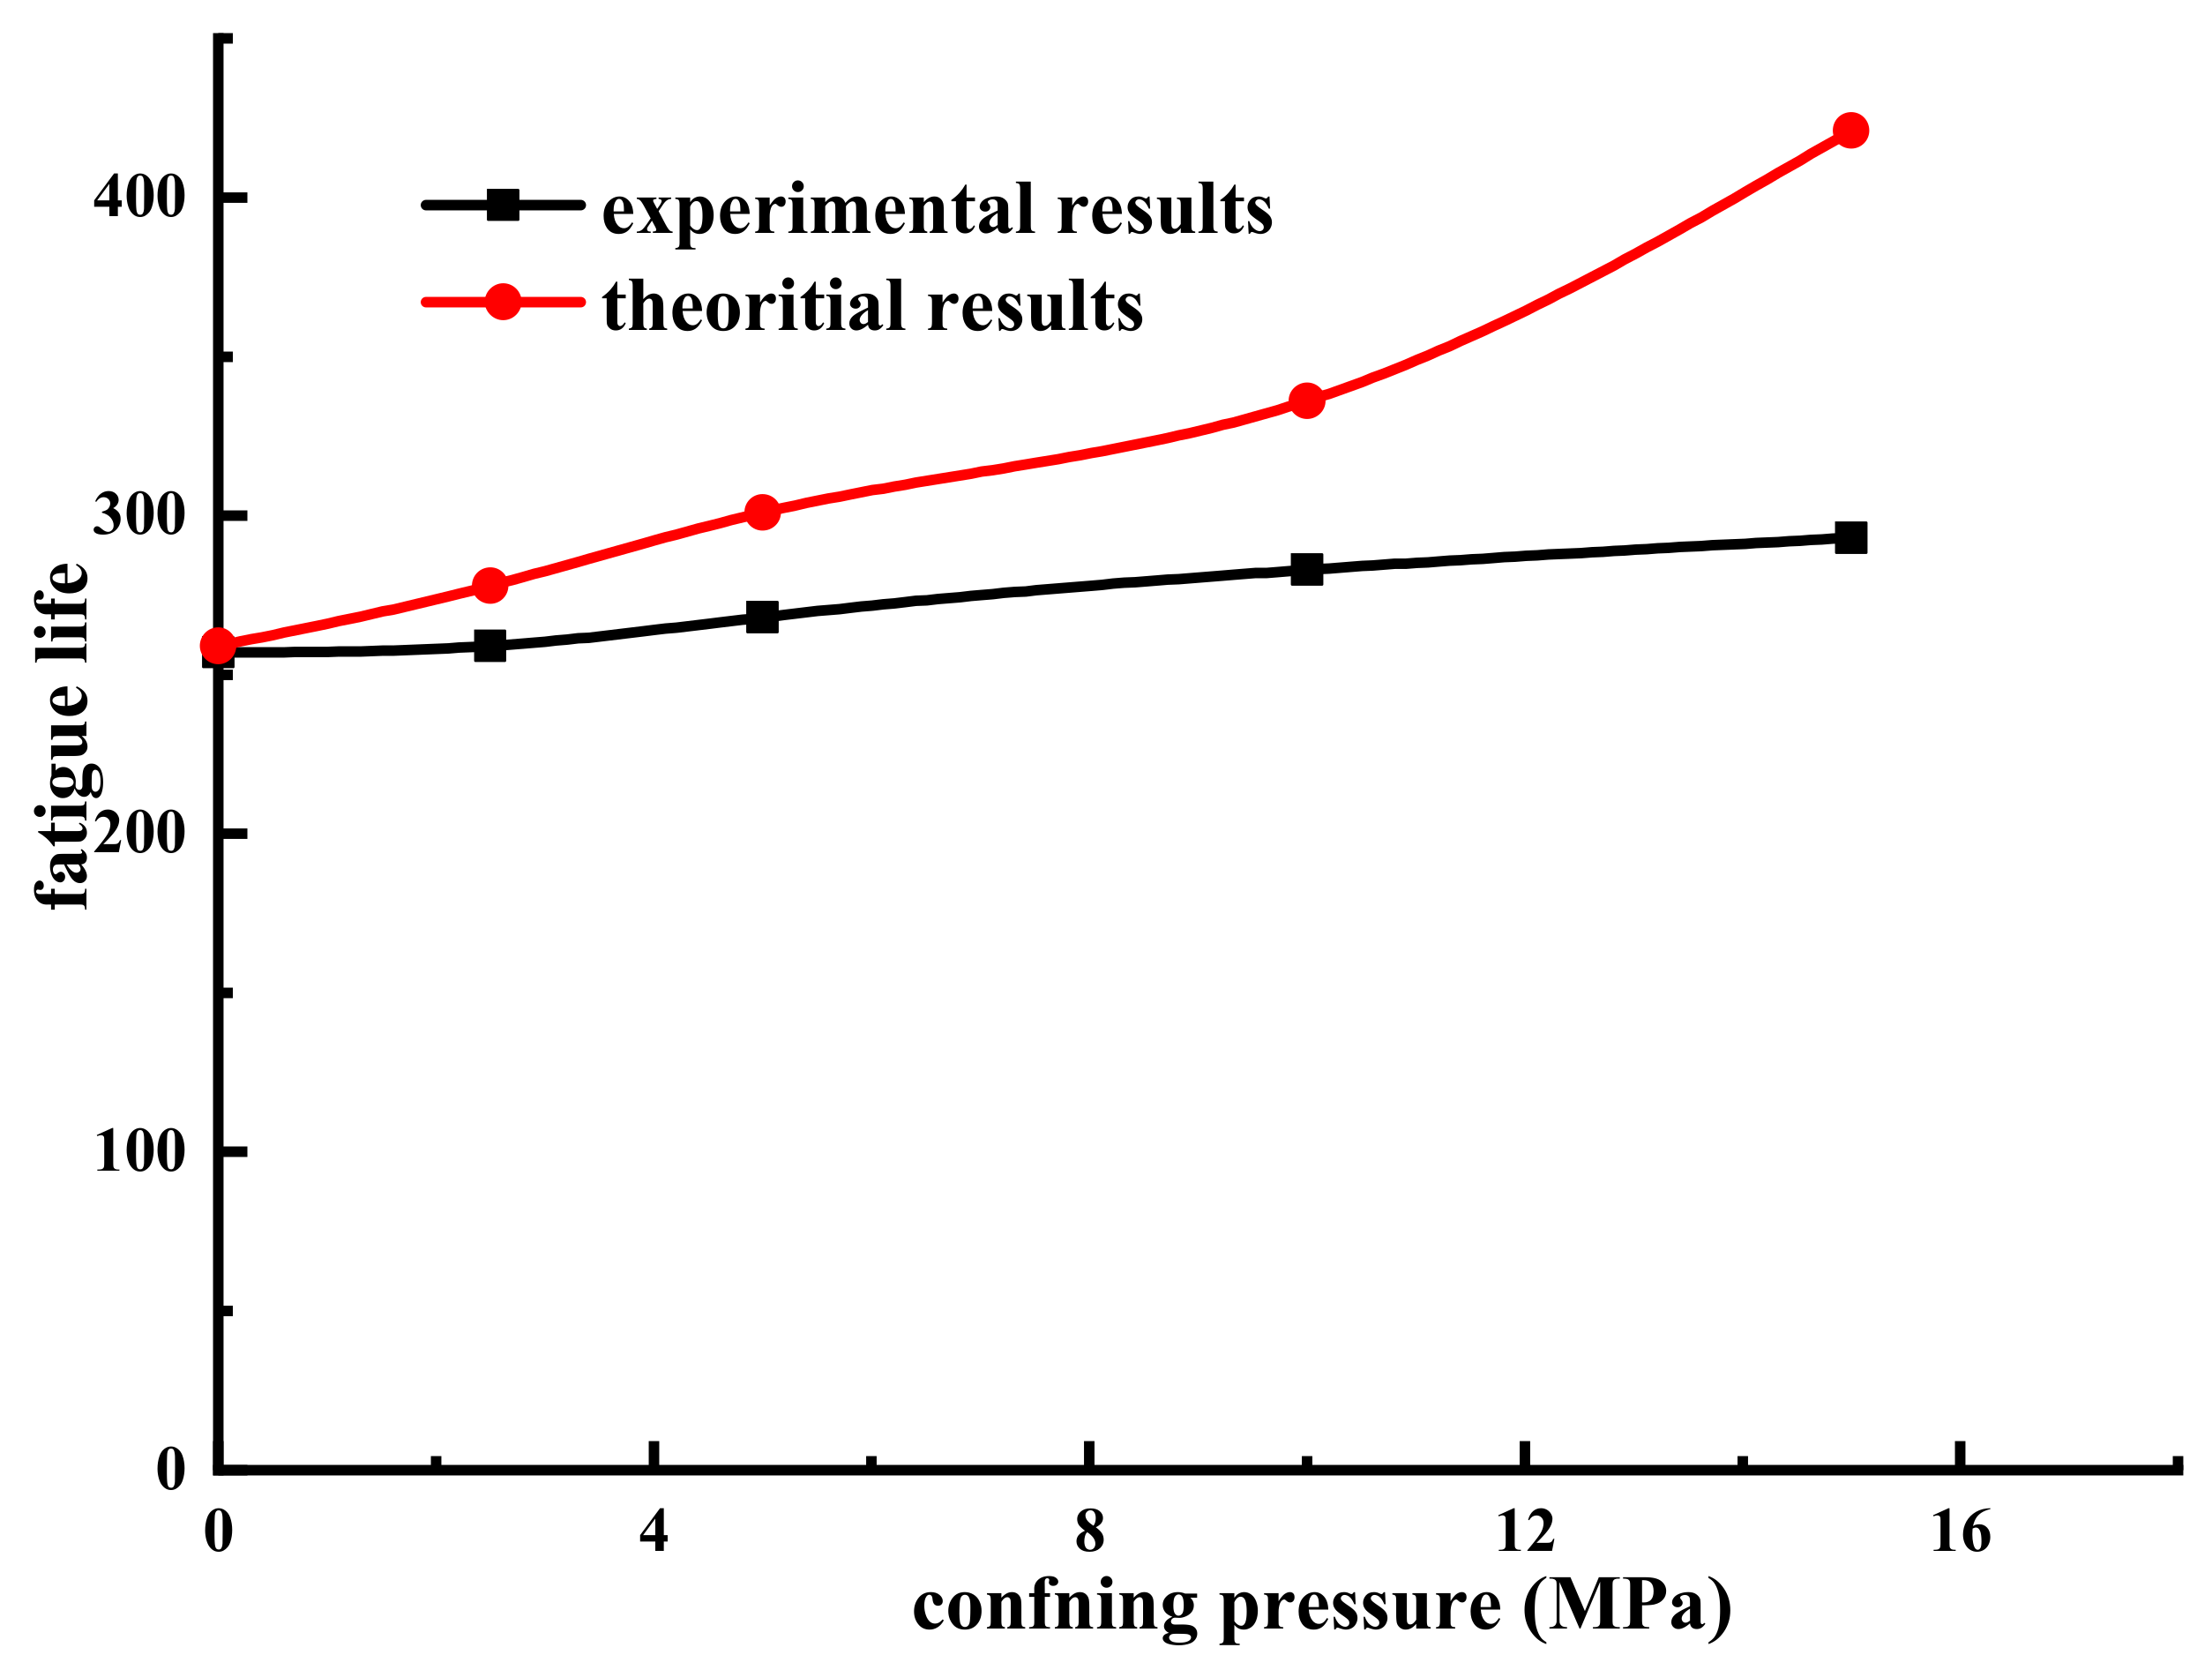
4.1.3. The Effect of Confining Pressure on Fatigue Life

A total of five groups of different confining pressure values were set in the experiment to study the effect of confining pressure on the fatigue life of sandstone. The upper limit stress ratio was set to 0.9 of the quasi-static strength of the sandstone under the corresponding confining pressure conditions, and the stress variation range was 40.8 MPa. The stress–strain curves of the sandstone when the confining pressure was 5 MPa or 10 MPa are shown in Figure 13.
The fatigue life of sandstone samples under different confining pressures was obtained through experiments, as shown in Table 3.
It can be seen from Equations (4) and (9) that the fatigue life formula of sandstone samples under different confining pressures was the same as that of uniaxial fatigue; the difference lay in the difference between L1 and L2. Therefore, combining Figure 8 and Equation (10), the theoretical fatigue life of sandstone samples under different confining pressures was obtained, and the comparison with the experimental value is shown in Figure 14.
It can be seen from Figure 14 that when the upper limit stress ratio and the stress difference were the same, the fatigue life of the sandstone sample increased with an increase in the confining pressure, which was consistent with the results of Liu et al. [29]. At the same time, under the action of confining pressure, the theoretically predicted fatigue life of the sandstone samples was smaller than that of the experimental results, but this difference was not very large when the confining pressure was less than or equal to 10 MPa, which was still reliable as a prediction result. However, when the confining pressure was equal to 15 MPa, the difference between the theoretical prediction and the experimental results was relatively large. The reason for this phenomenon could be seen from the actual fracture morphology of the sandstone specimen, as shown in Figure 15.
It can be seen from Figure 15 that when the confining pressure was not more than 10 MPa, the macroscopic cracks of the sandstone samples were tensile cracks. When the confining pressure was equal to 15 MPa, the macroscopic fracture of the sandstone sample was shear fracture. Since the premise of the establishment of the fatigue life prediction formula was that rocks undergo tensile fracture in the form of wing crack propagation, the fatigue shear fracture of sandstone when the confining pressure was 15 MPa was no longer within the scope of application of this fatigue life prediction formula.

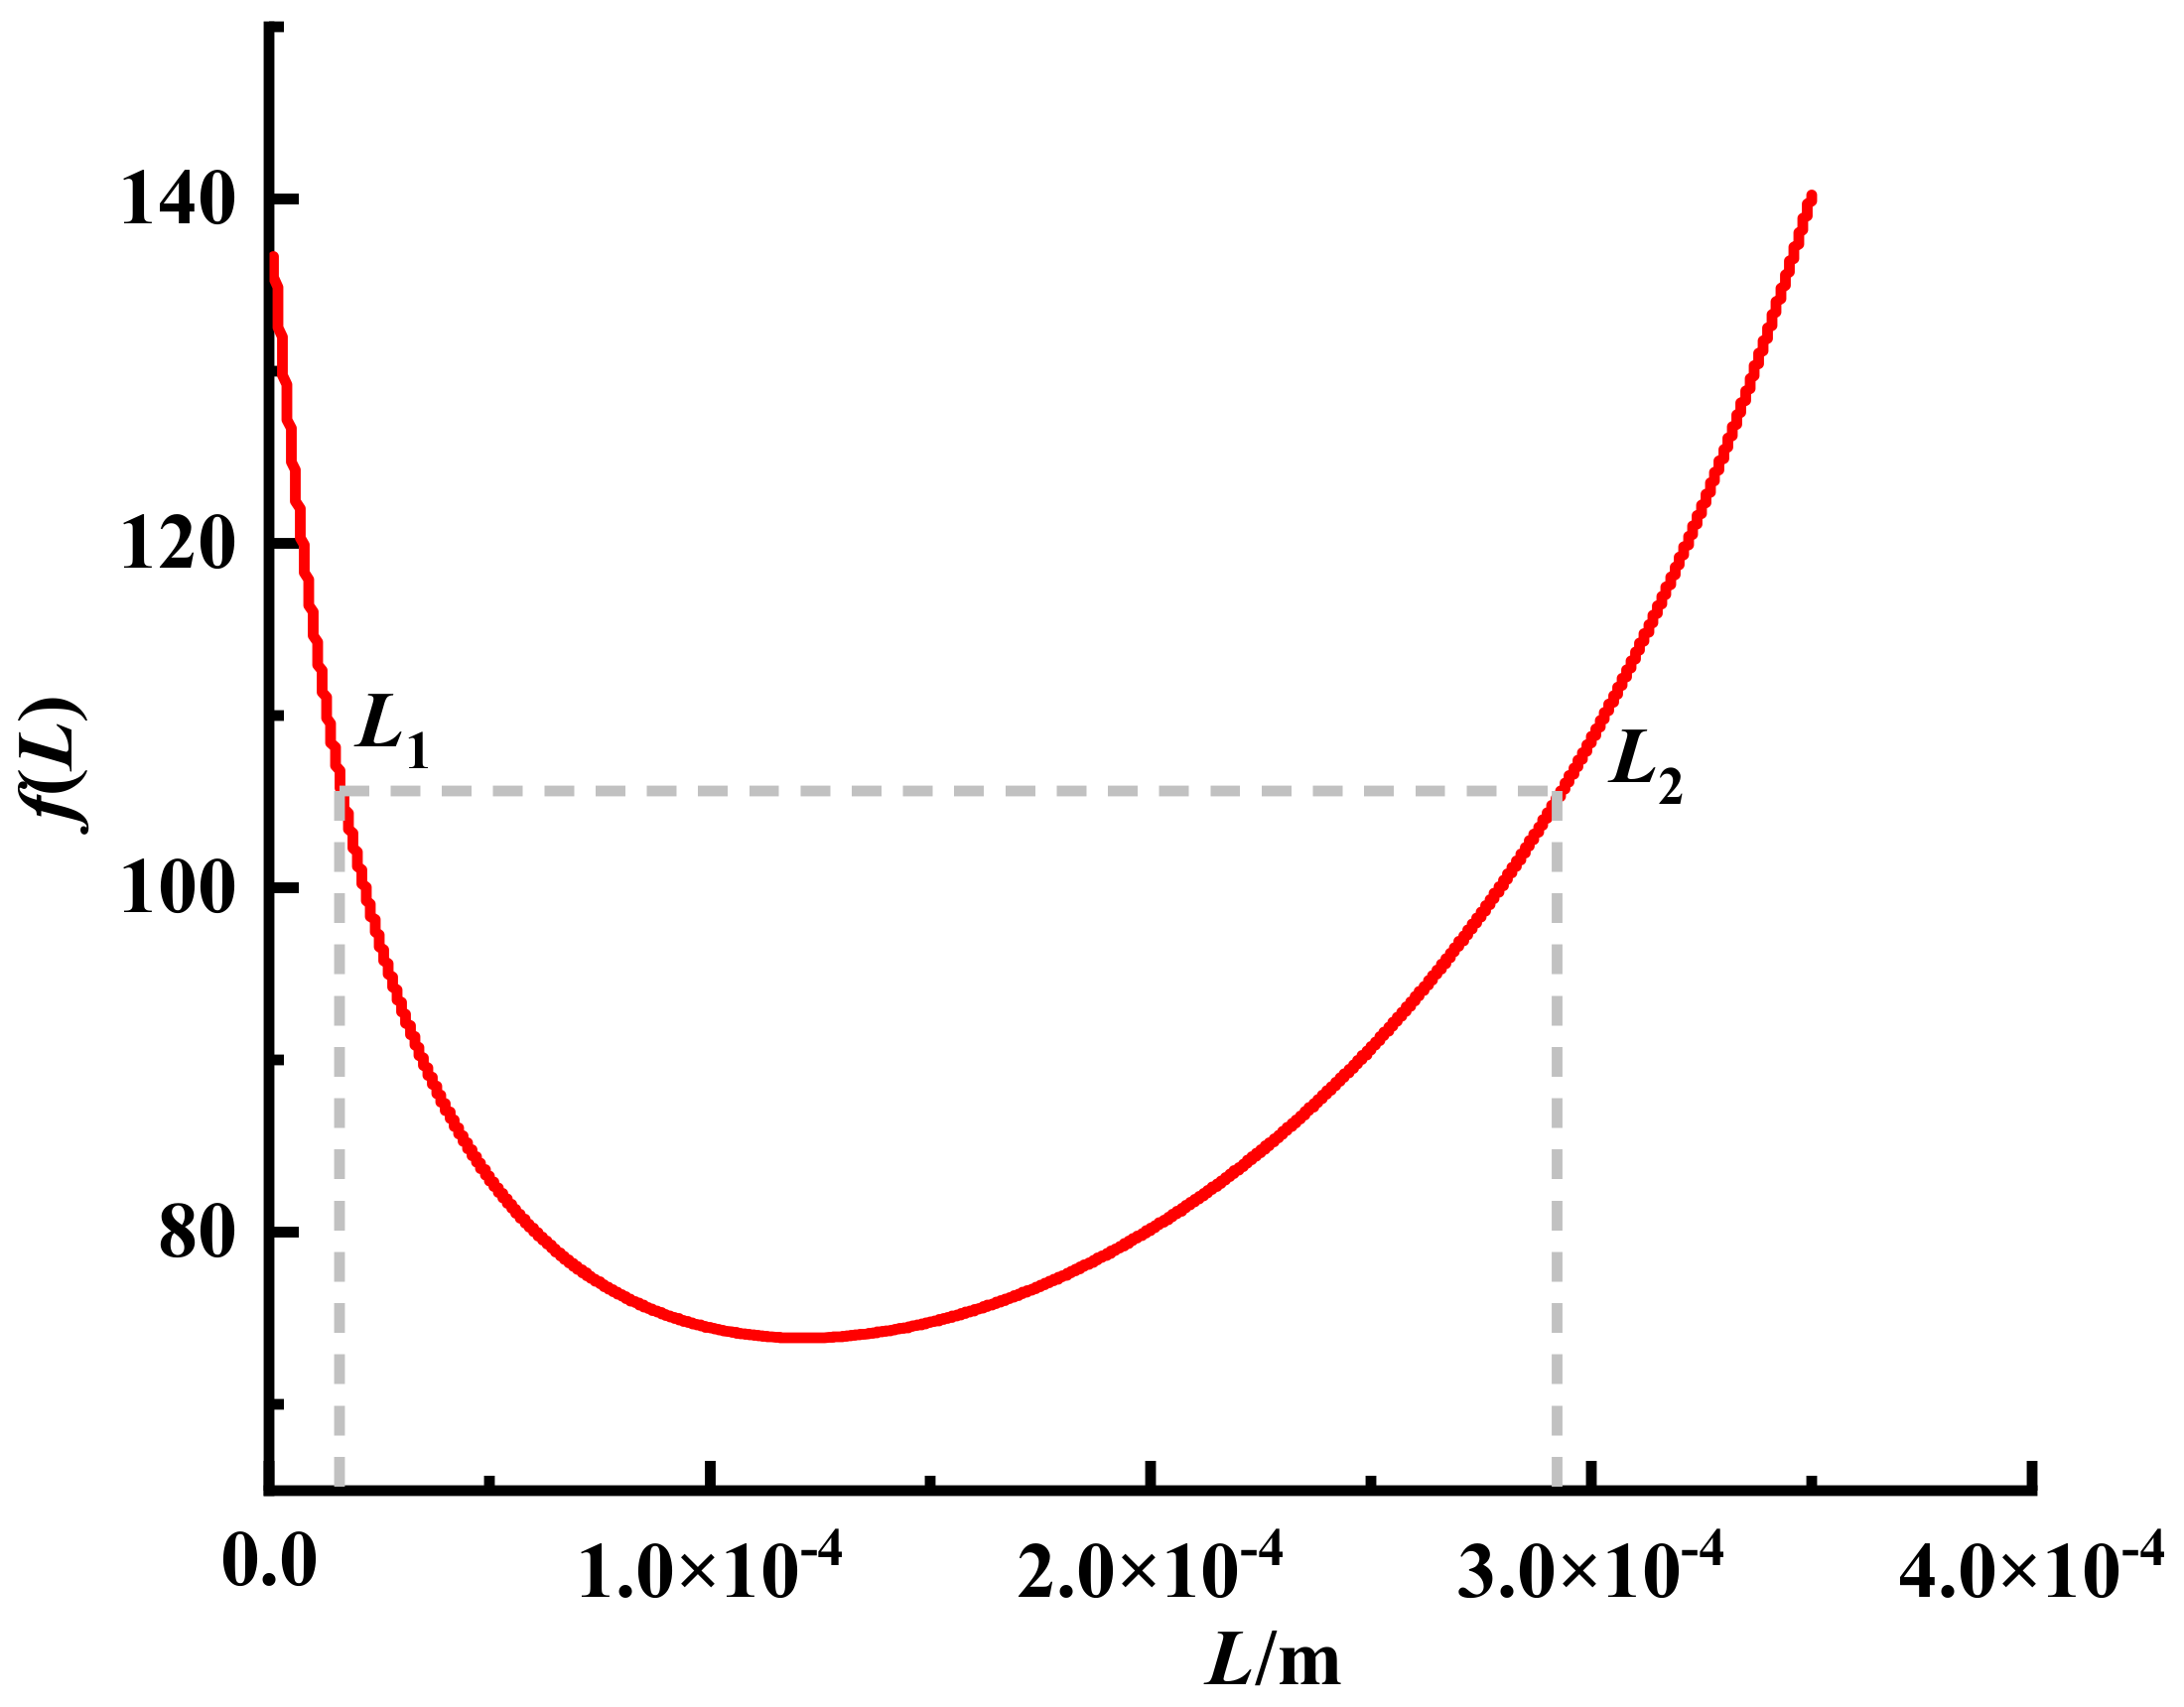
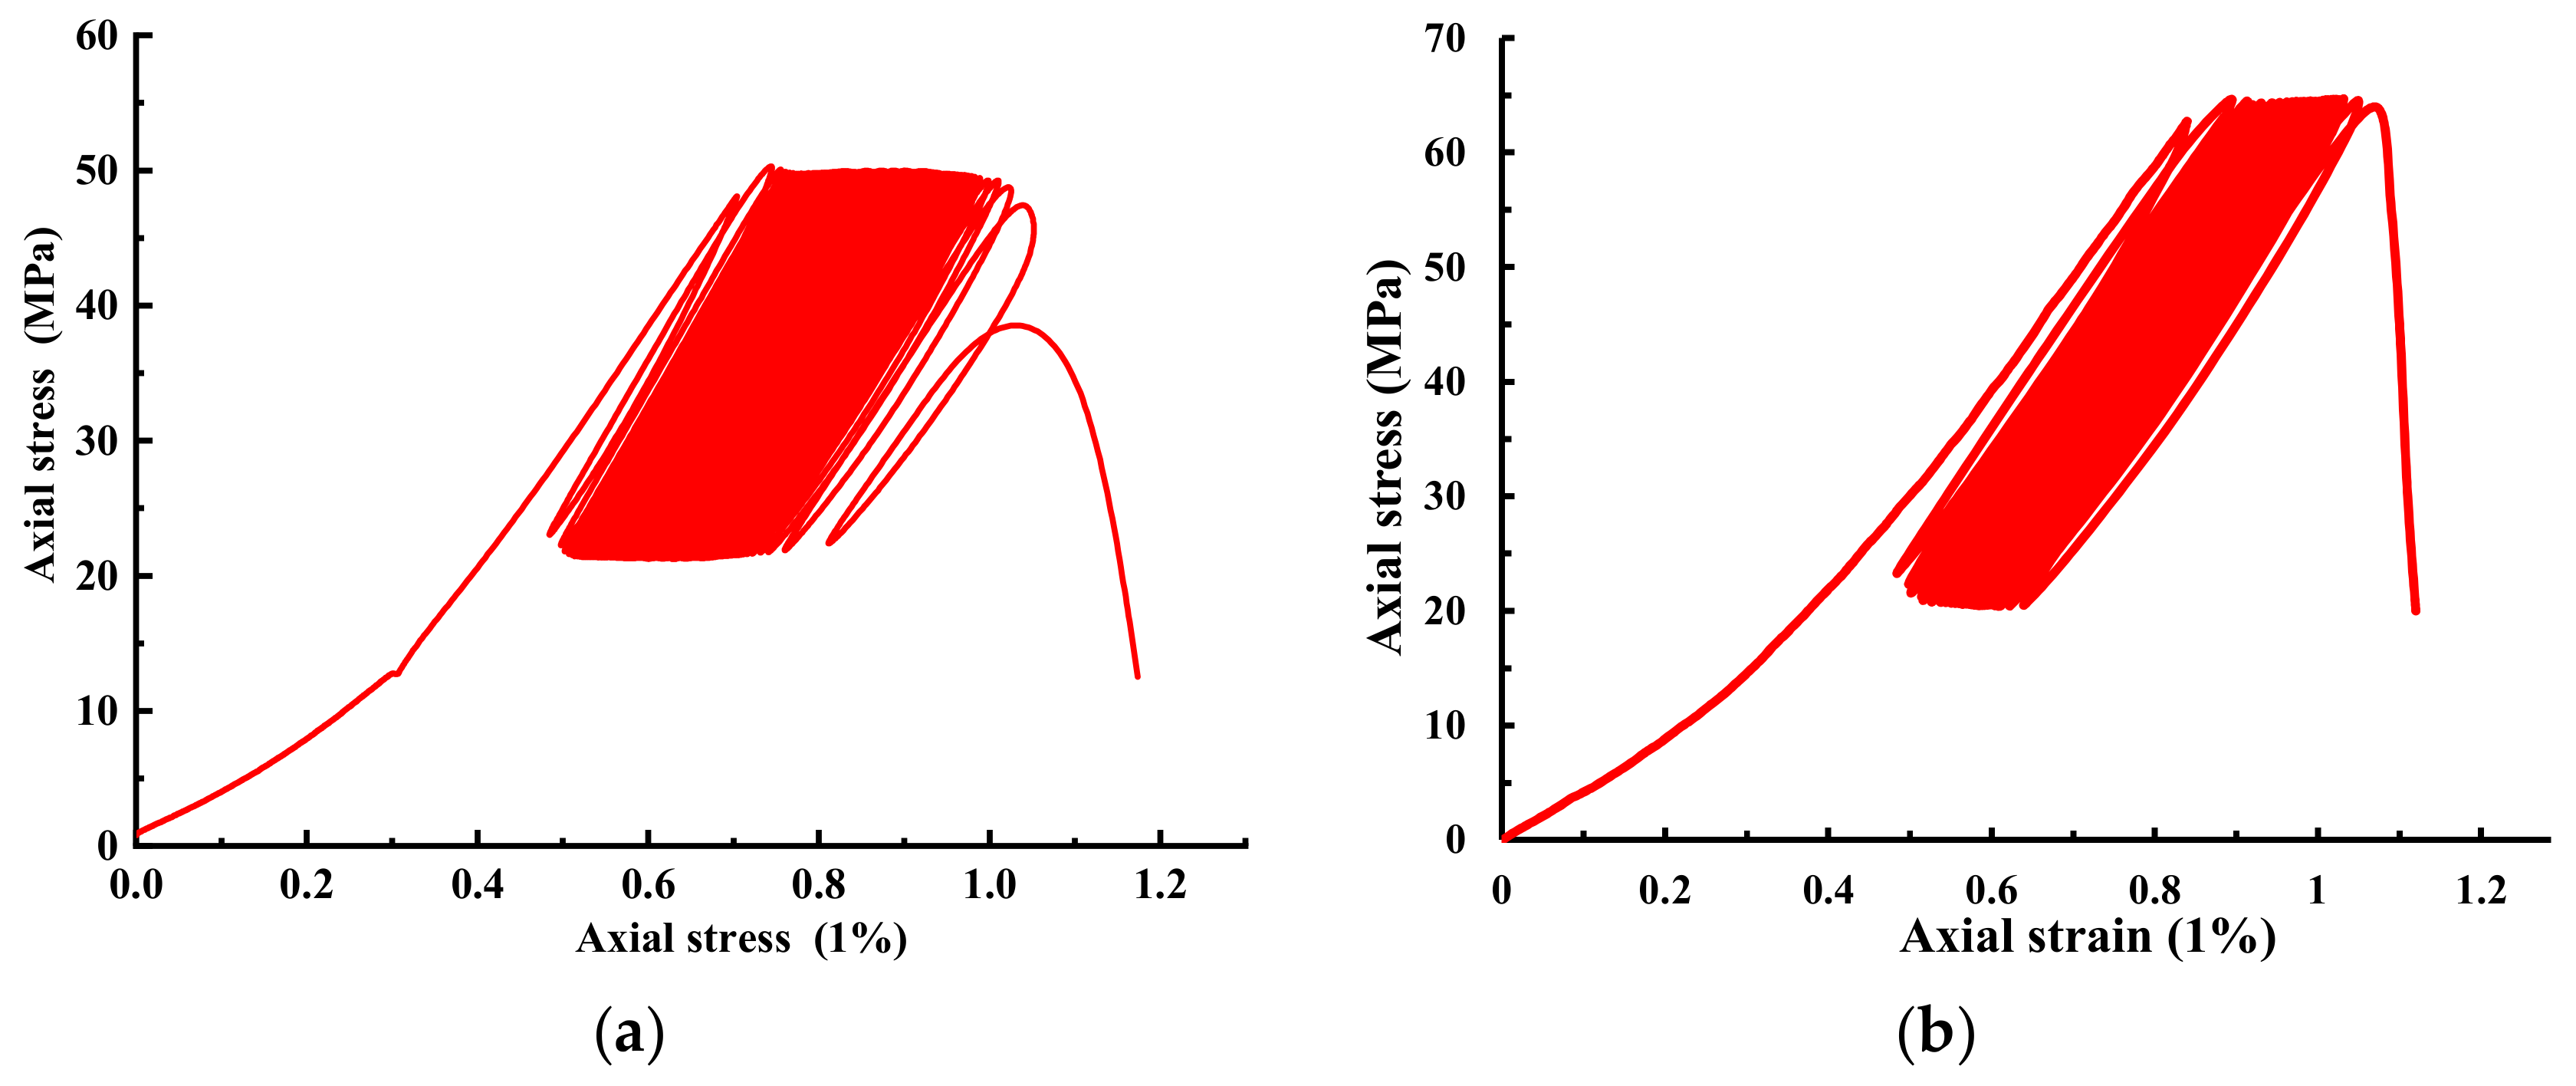
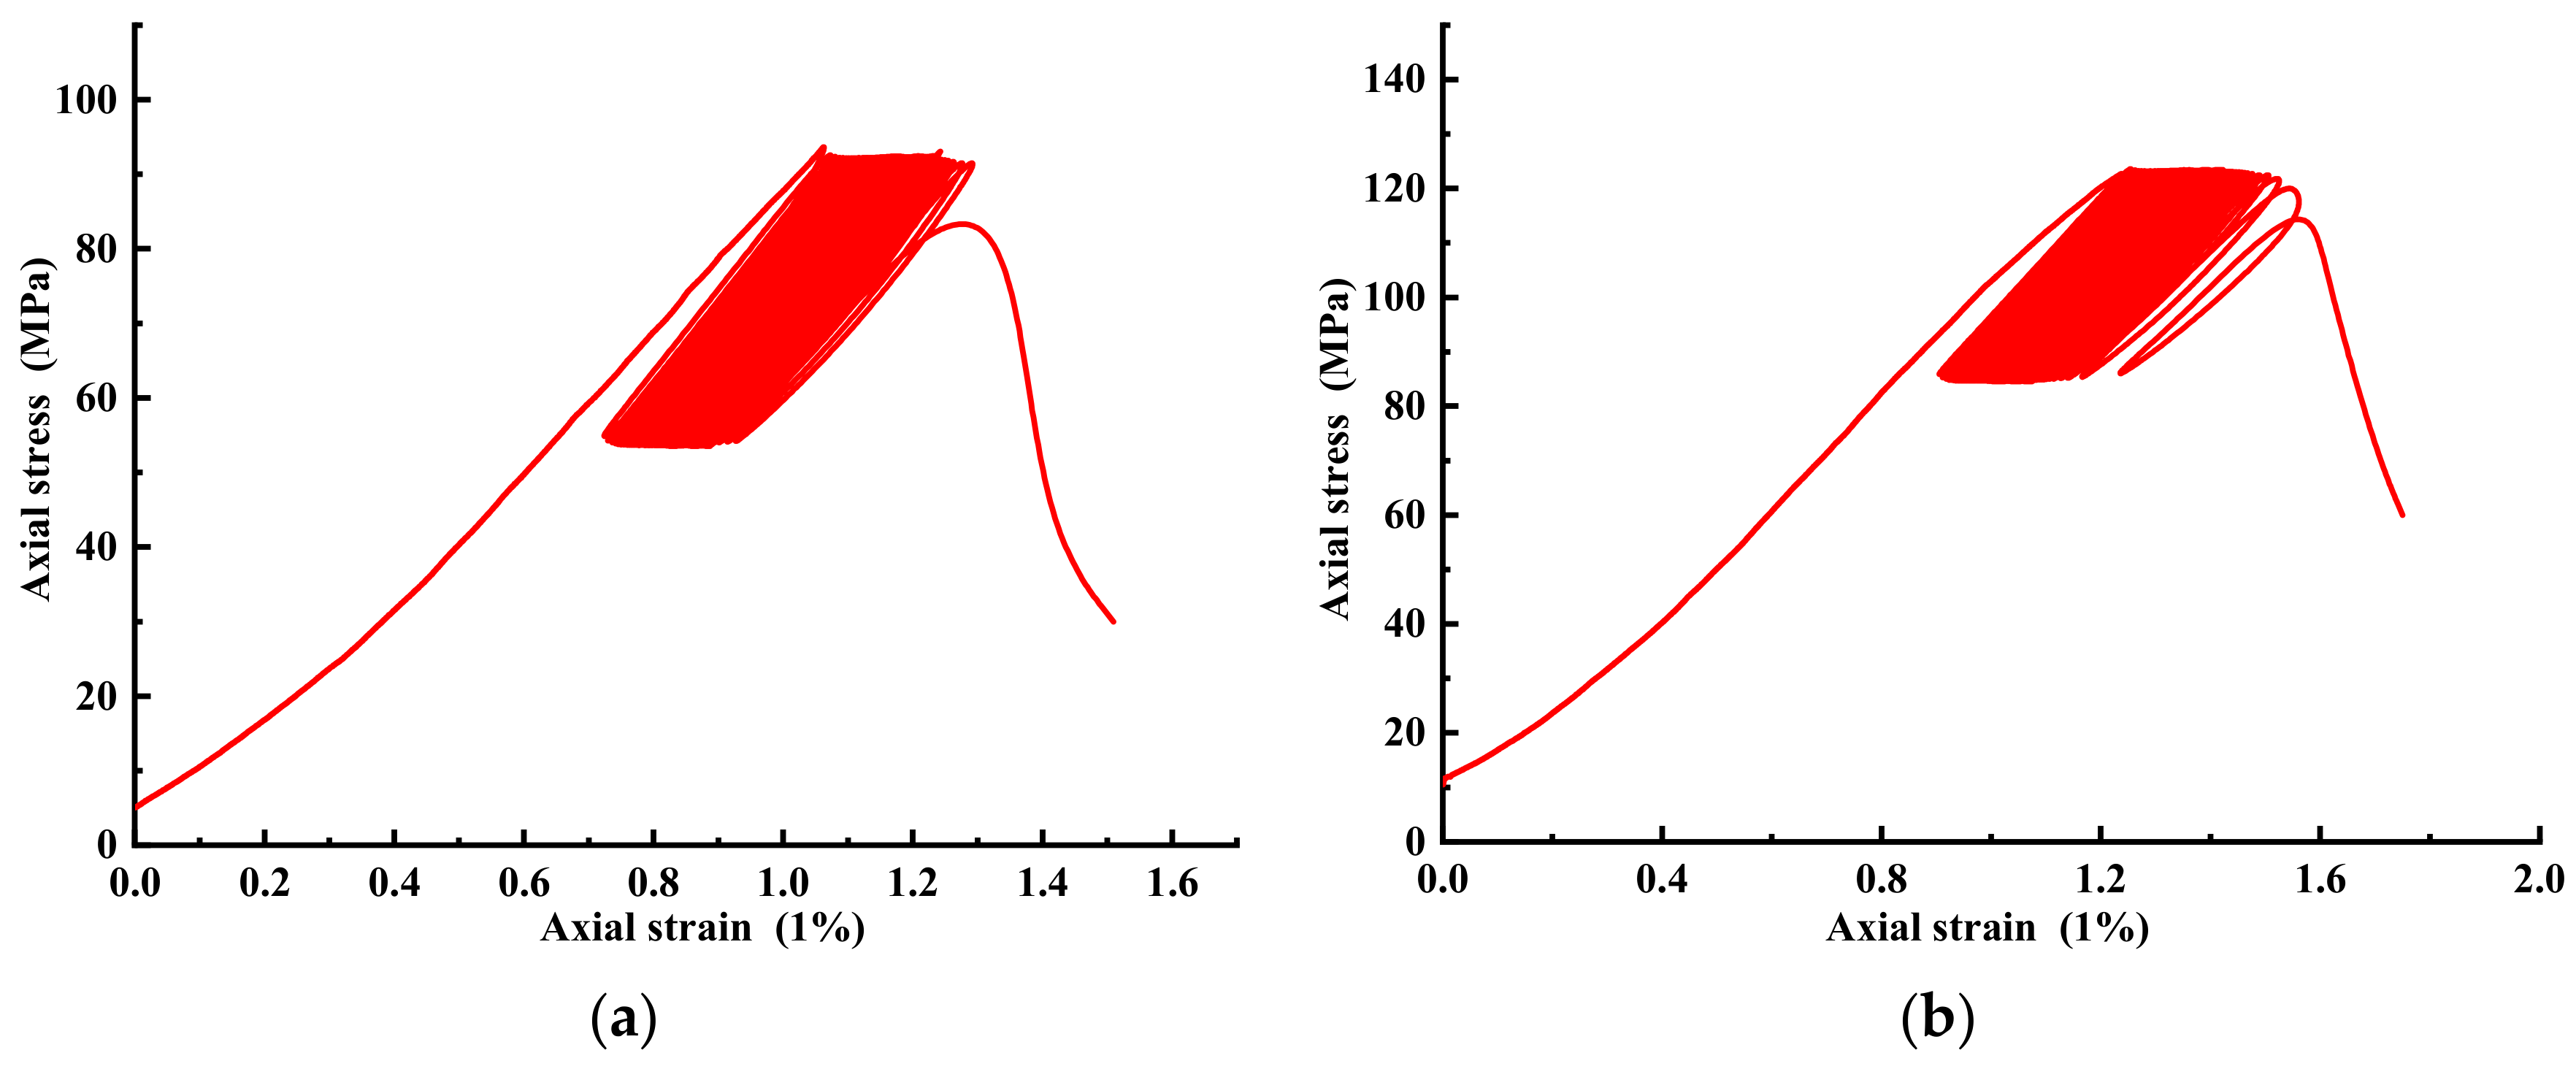
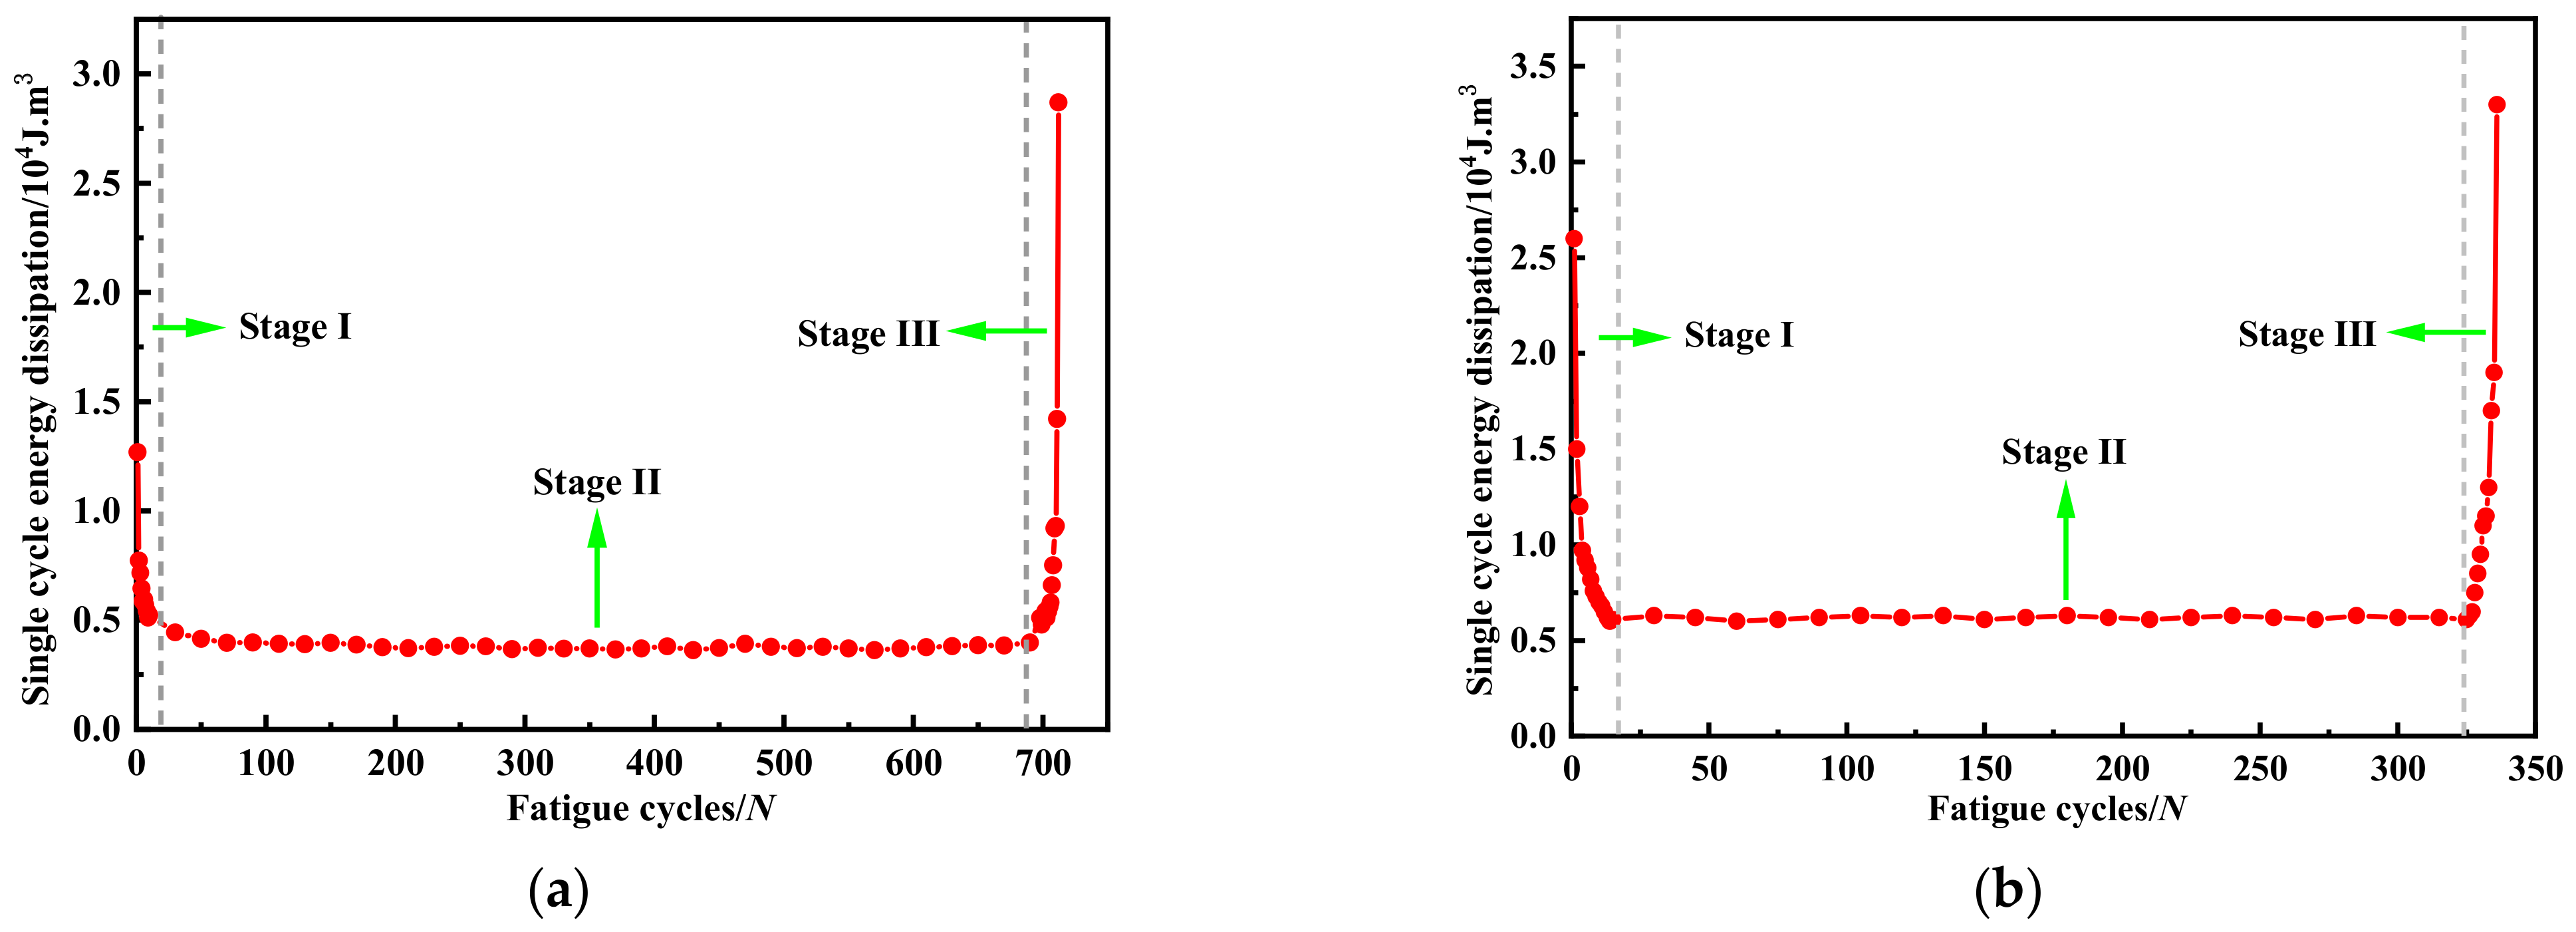
4.1.4. Fatigue Crack Growth Stage Analysis

The fatigue life prediction model was proposed based on the characteristics of the stable growth stage of fatigue cracks, and it cannot reflect the characteristics of the entire fatigue loading stage. In order to study the damage characteristics of the rock during the entire fatigue loading stage, the dissipated energy during the fatigue process was calculated according to the fatigue stress–strain curve, as shown in Figure 16 below.
As can be seen from Figure 16, the evolution of dissipative energy in the fatigue loading process of sandstone could be divided into three stages, which corresponded to the fatigue crack initiation stage, the fatigue crack stable growth stage and the fatigue crack unstable growth stage. In the initiation and unstable propagation stages of fatigue crack, the dissipation energy of a single cycle was larger, and the variation rate was faster. In the steady fatigue crack propagation phase, the dissipated energy of a single cycle remained unchanged. The proportion of cycle times in the stable fatigue propagation stage was more than 90% of the total fatigue cycle times, which explained the rationality of predicting rock fatigue life by using the characteristics of the stable fatigue propagation stage.

4.1.5. Limitations and Future Works

In addition to the upper limit stress, lower limit stress and confining pressure, the loading frequency is also an important factor affecting rock fatigue life. Bagde and Petros [30] studied a fatigue test using sandstone and showed that the rock fatigue life tends to decrease with an increase in frequency. Attewell and Farmer [31] studied the fatigue life of dolomite under loading frequencies of 0.3, 2.5, 10.0 and 20.0 Hz and found that the rock fatigue life increased with an increase in loading frequency, and there was a fitting empirical formula. Ishizuka and Abe [32] carried out a large number of uniaxial and triaxial fatigue tests with granite, and the loading frequency ranged from 2.5 × 10⁻⁴ to 1 Hz. The results showed that the fatigue life of granite increased with an increase in loading frequency. However, the rock fatigue life prediction model in this paper did not reflect the effect of loading frequency. In future research, the effect of loading frequency on rock fatigue life will be investigated, and the fatigue life prediction model will be further enriched.
In this paper, a series of sandstone fatigue tests were carried out, and the fatigue life prediction model of sandstone when the confining pressure was less than or equal to 10 MPa was proposed through crack propagation of the tension wing. However, this model is not applicable to situations where the rock suffers from shear fatigue failure. Therefore, it is necessary to further study the meso-mechanical mechanism of rocks when shear fatigue failure occurs. Future work will be carried out on the shear fatigue failure of rock, and the fatigue shear failure of rock will be studied by increasing the confining pressure, and a corresponding fatigue life prediction model will be proposed.
The fatigue life prediction model in this paper had a good effect on the fatigue life prediction of sandstone. The homogeneity of sandstone was relatively high, there was no obvious natural defect, and the fatigue failure of sandstone was a typical brittle tensile failure. At present, it is speculated that the applicable scope of the fatigue life prediction model in this paper is sandstone, limestone, basalt and other rocks with high homogeneity and obvious brittle failure characteristics, but it is no longer applicable to rocks such as granite and shale. Future research will carry out fatigue tests on different types of rocks and contain in-depth discussions on the applicable scope of rock fatigue life prediction models.

4.2. AE Results Analysis

4.2.1. Crack Classification Results by RA and AF Values

According to the RA and AF values of the sandstone samples F2-1 and F3-3 during the fatigue loading process, the crack type was identified. Then, the energies of tensile-type AE events and shear-type AE events with the fatigue loading process were obtained, as shown in Figure 17.
It can be seen from Figure 17 that the energy of AE during the fatigue loading process was mainly tension-type AE, and the evolution of the accumulated energy of AE was divided into three stages, i.e., fatigue crack initial propagation stage, fatigue crack stable propagation stage and fatigue crack unstable propagation stage. The evolution law of AE cumulative energy and dissipation energy was basically the same. The AE energy was relatively large in the initial stage; the AE energy increased linearly with cycles in the stable propagation stage of fatigue crack, and the AE energy increased rapidly in the stage of fatigue crack instability propagation. Therefore, the rapid increase in AE energy can be used as precursor information for predicting rock fatigue failure. The classification results of AE crack sources showed that tension cracks were mainly produced in the fatigue failure process of sandstone samples, which was consistent with the macroscopic crack morphology of sandstone samples and further proves that it is reasonable to predict the fatigue life of rock with the wing crack propagation model. In addition, the rapid increase in accumulated AE energy can be used as one of the precursors for predicting the instability propagation of rock fatigue cracks.

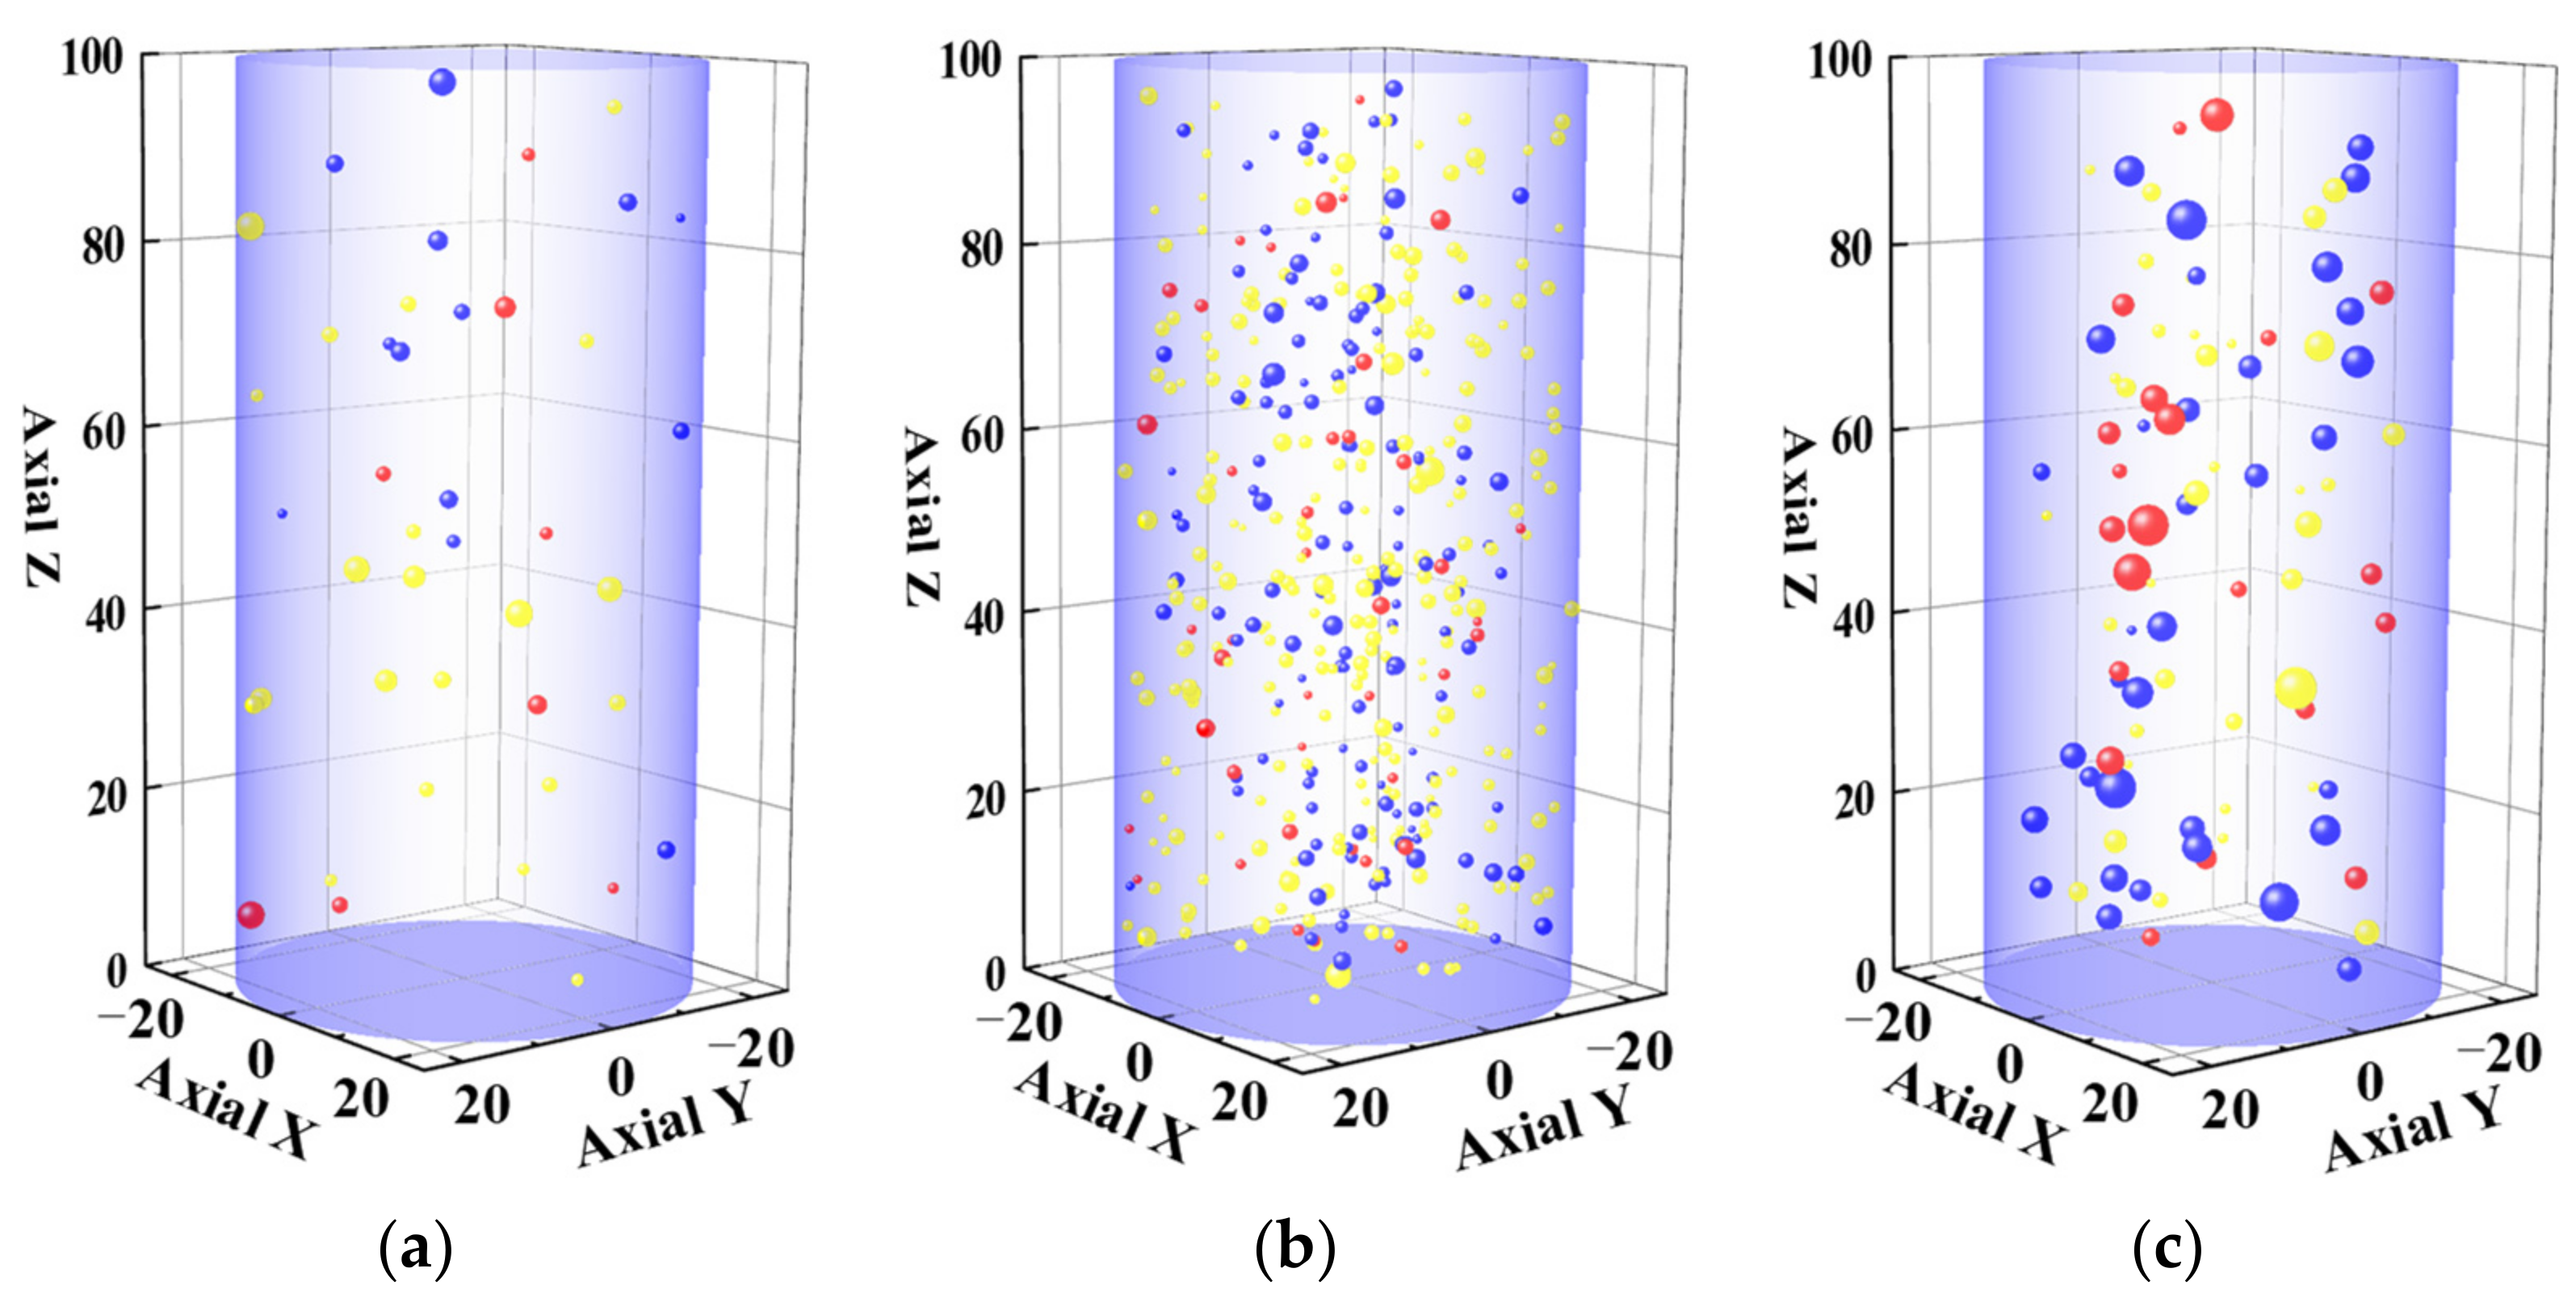
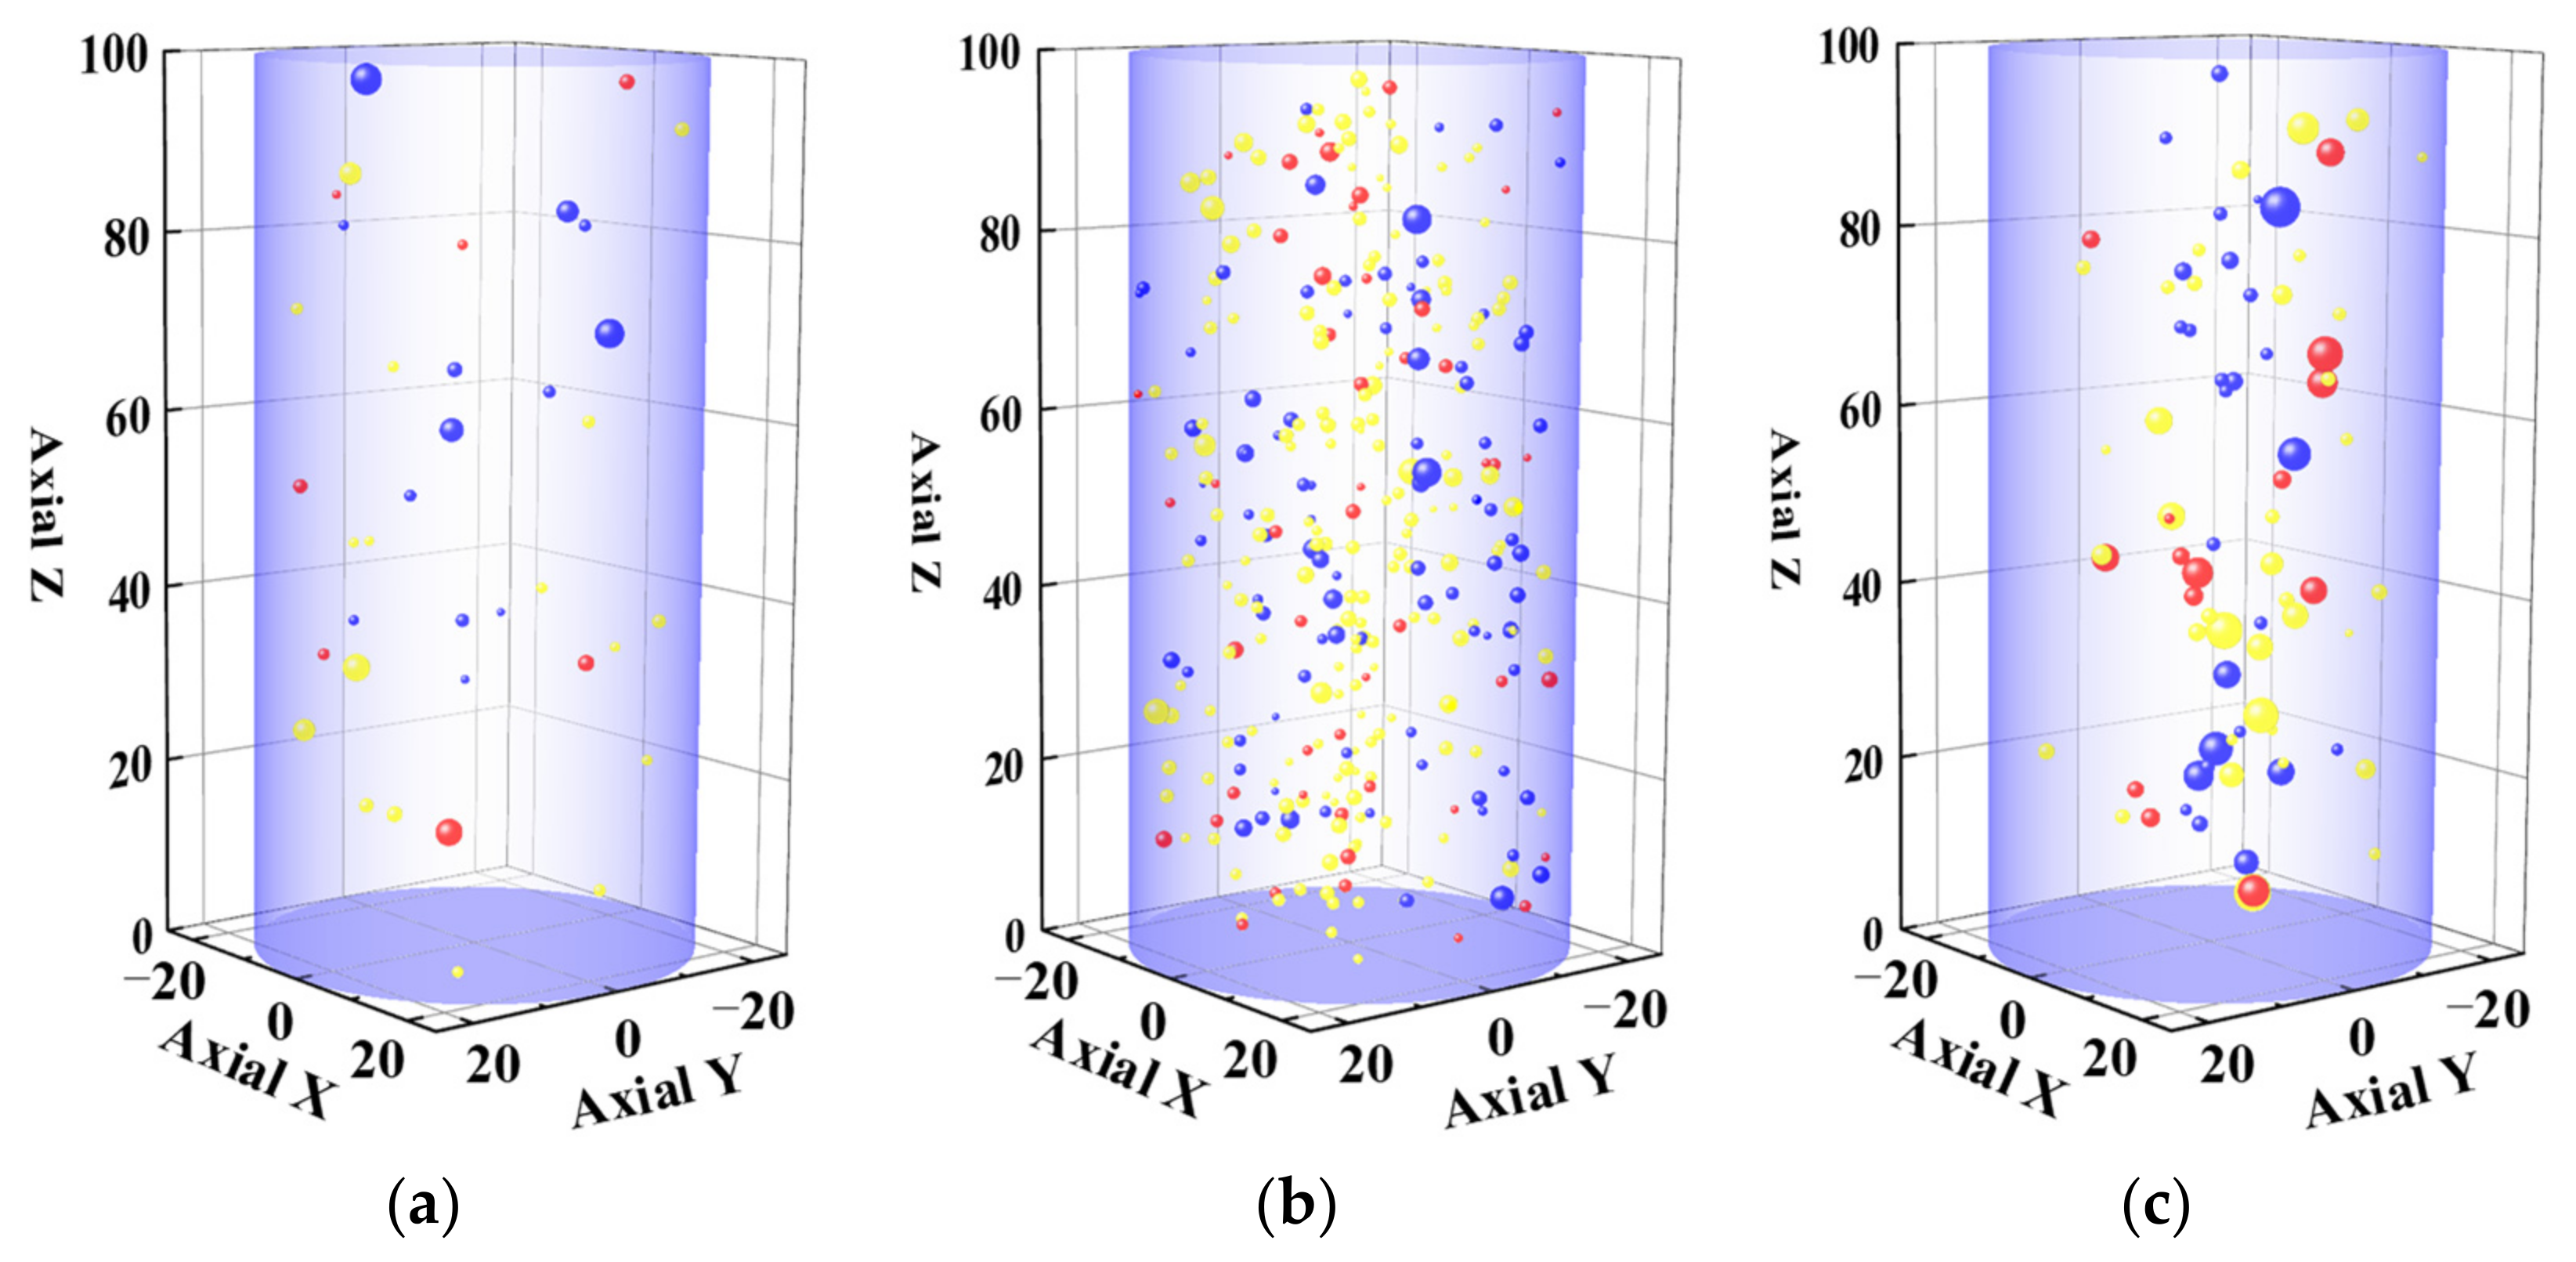
4.2.2. Crack Classification Results Using the Moment Tensor Method

According to the fatigue crack growth stages in Figure 16, the crack source mechanisms of Sample F2-1 and Sample F3-3 at different crack propagation stages were studied by using the moment tensor method, as shown in Figure 18 and Figure 19. The yellow sphere represents the tension-type AE, the blue sphere represents the mixed-type AE, the red sphere represents the shear-type AE and the volumes of the spheres are proportional to the AE energy.
The inversion results using AE moment tensor showed that the crack sources of Samples F2-1 and F3-3 in the process of fatigue loading were mainly tensile, followed by mixed AE; few were shear AE. AE events mainly occurred in the stage of stable fatigue crack propagation, and the energies of each AE event were basically the same. In the unstable propagation stage of fatigue cracks, the energy of a single AE event was relatively large and basically distributed along the macroscopic fracture zone of the rock, so the fatigue failure of the rock can be predicted using this feature.

5. Conclusions

In this paper, the meso-mechanical mechanism of sandstone fatigue failure was studied using the wing crack propagation model. The main factors affecting the fatigue failure of rock were analyzed; these factors mainly included the upper limit stress value, lower limit stress value and confining pressure. The main purpose of this paper was to quantitatively analyze these external factors that affect rock fatigue life. At the same time, combined with the AE method, the precursor information for crack instability propagation during the sandstone fatigue loading process was analyzed. The main conclusions were as follows:
  • Through the combination of the wing crack propagation model and Paris formula, the fatigue failure mechanism of sandstone was expounded. This model can better predict the fatigue life of sandstone, and it reflects the influence of upper limit stress, lower limit stress and confining pressure on sandstone fatigue life. The model also proves that in the process of rock fatigue loading, the upper limit stress has a greater effect on the rock fatigue failure process than the lower limit stress.
  • The theoretical model and experimental results both showed that the fatigue life of sandstone increases with the increase in confining pressure. At the same time, the prediction of rock fatigue life using the wing crack model is based on tensile fatigue failure, so when the confining pressure is large and rock fatigue shear failure occurs, the rock fatigue life deduced by the wing crack growth model is no longer applicable.
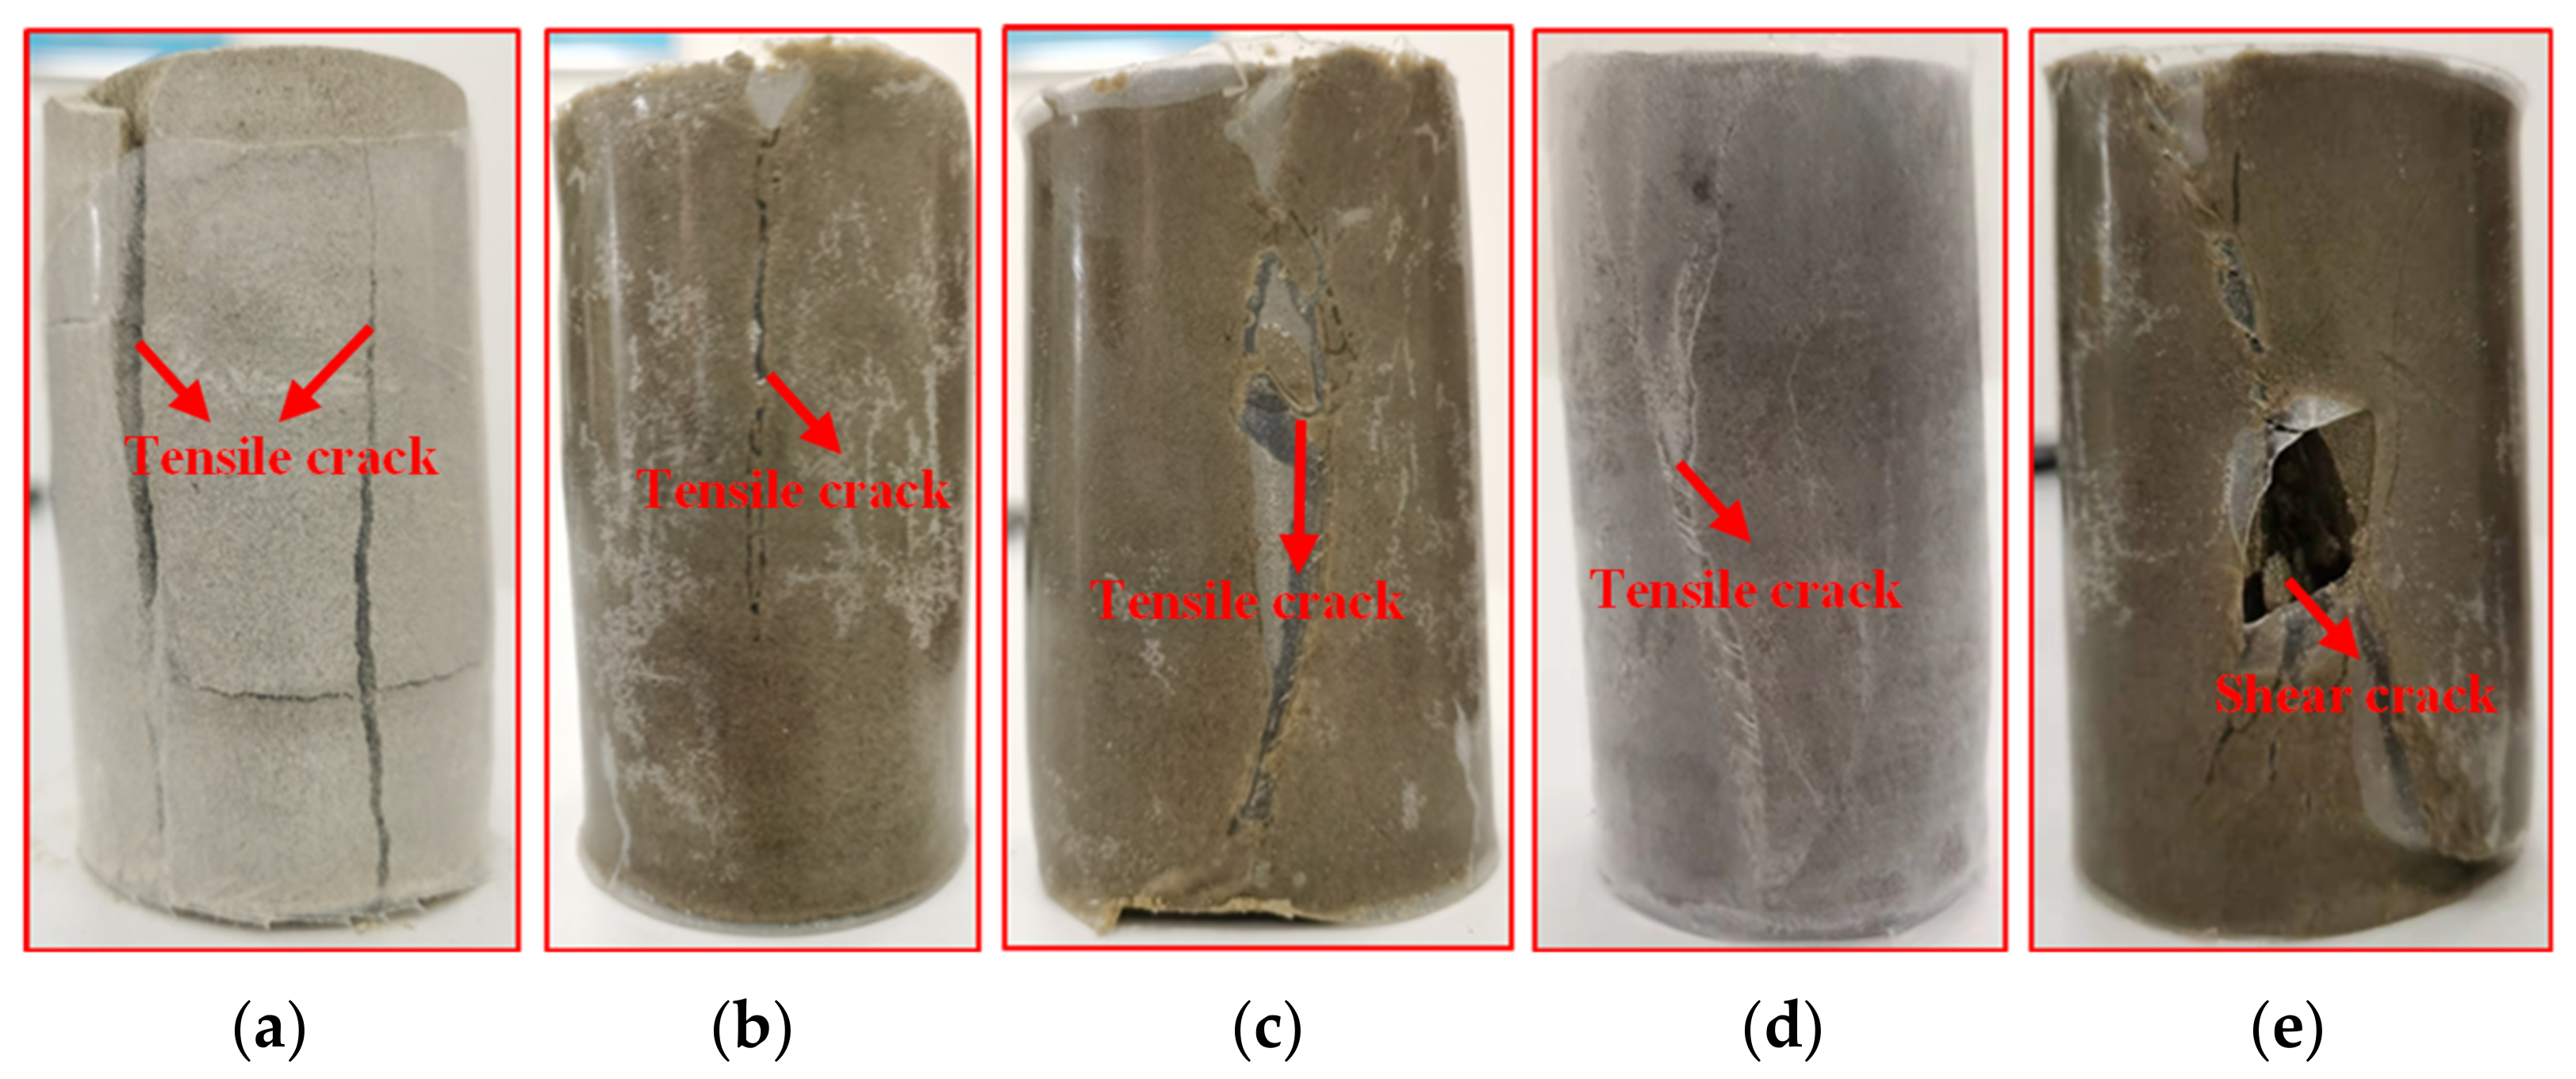
  • The AE method is a reliable method for predicting the fatigue failure process of rock. The AE clustering method can effectively identify the crack propagation stage of sandstone samples in the process of fatigue failure and establish precursor information for sandstone fatigue failure. Through the AE clustering method and moment tensor method, it was verified that the cracks produced by sandstone during the fatigue failure process under the condition of low confining pressure are mainly in the form of tension.

Author Contributions

Conceptualization, Z.C.; Data curation, K.S.; Formal analysis, K.S.; Supervision, L.Z.; Writing—original draft, K.S.; Writing—review & editing, Z.C. and R.P. All authors have read and agreed to the published version of the manuscript.

Funding

This work was supported by the Second Tibetan Plateau Scientific Expedition and Research Program (STEP) (Grant No. 2019QZKK0904), the National Natural Science Foundation of China (Grant No. 41972296) and the Fundamental Research Funds for the Central Universities (Grant No. 2022YJSMT05).

Institutional Review Board Statement

Not applicable.

Informed Consent Statement

Not applicable.

Data Availability Statement

Data will be provided upon request to the corresponding author.

Conflicts of Interest

The authors declare no conflict of interest.

References

  1. Erarslan, N.; Williams, D. The damage mechanism of rock fatigue and its relationship to the fracture toughness of rocks. Int. J. Rock Mech. Min. Sci. 2012, 56, 15–26. [Google Scholar] [CrossRef]
  2. Song, R.; Bai, Y.M.; Zhang, J.P.; Jiang, D.Y. Experimental investigation of the fatigue properties of salt rock. Int. J. Rock Mech. Min. Sci. 2013, 64, 68–72. [Google Scholar] [CrossRef]
  3. Bagde, M.N.; Petroš, V. Fatigue properties of intact sandstone samples subjected to dynamic uniaxial cyclical loading. Int. J. Rock Mech. Min. Sci. 2005, 42, 237–250. [Google Scholar] [CrossRef]
  4. Xiao, J.Q.; De, X.D.; Jiang, F.L.; Xu, G. Fatigue damage variable and evolution of rock subjected to cyclic loading. Int. J. Rock Mech. Min. Sci. 2010, 47, 461–468. [Google Scholar] [CrossRef]
  5. Simo, J.C.; Ju, J.W. Strain- and stress-based continuum damage models-II. Computational aspects. Int. J. Solids Struct. 1987, 23, 821–840. [Google Scholar] [CrossRef]
  6. Ju, J.W. On two-dimensional self-consistent micro mechanical damage models for brittle solids. Int. J. Solids Struct. 1991, 27, 227–258. [Google Scholar] [CrossRef]
  7. Ashby, M.F.; Hallam, S.D. The failure of brittle solids containing small cracks under compressive stress states. Acta Met. 1986, 34, 497–510. [Google Scholar] [CrossRef]
  8. Basista, M.; Gross, D. The sliding crack model of brittle deformation: An internal variable approach. Int. J. Solids Struct. 1998, 35, 487–509. [Google Scholar] [CrossRef]
  9. Diederichs, M.S. Instability of Hard Rockmasses, the Role of Tensile Damage and Relaxation. Ph.D. Thesis, University of Waterloo, Waterloo, ON, Canada, 1999. [Google Scholar]
  10. Kim, J.-S.; Lee, K.-S.; Cho, W.-J.; Choi, H.-J.; Cho, G.-C. A Comparative Evaluation of Stress-Strain and Acoustic Emission Methods for Quantitative Damage Assessments of Brittle Rock. Rock Mech. Rock Eng. 2015, 48, 495–508. [Google Scholar] [CrossRef]
  11. Koerner, R.M.; McCabe, W.M.; Lord, A.E. Overview of acoustic emission monitoring of rocks tructures. Rock Mech. Rock Eng. 1981, 14, 27–35. [Google Scholar] [CrossRef]
  12. Diederichs, M.S.; Kaiser, P.K.; Eberhardt, E. Damage initiation and propagation in hard rock during tunnelling and the influence of near-face stress rotation. Int. J. Rock Mech. Min. Sci. 2004, 41, 785–812. [Google Scholar] [CrossRef]
  13. Zhao, X.G.; Cai, M.; Wang, J.; Ma, L.K. Damage stress and acoustic emission characteristics of the Beishan granite. Int. J. Rock Mech. Min. Sci. 2013, 64, 258–269. [Google Scholar] [CrossRef]
  14. Khazaei, C.; Hazzard, J.; Chalaturnyk, R. Damage quantification of intact rocks using acoustic emission energies recorded during uniaxial compression test and discrete element modeling. Comput. Geotech. 2015, 67, 94–102. [Google Scholar] [CrossRef]
  15. Carpinteri, A.; Lacidogna, G. Damage evaluation of three masonry towers by acoustic emission. Eng. Struct. 2007, 29, 1569–1579. [Google Scholar] [CrossRef]
  16. Farhidzadeh, A.; Salamone, S.; Luna, B.; Whittaker, A. Acoustic emission monitoring of a reinforced concrete shear wall by b-value based outlier analysis. Struct. Health Monit. 2013, 12, 3–13. [Google Scholar] [CrossRef]
  17. Chai, M.Y.; Zhang, Z.X.; Quan, D. A new qualitative acoustic emission parameter based on Shannon’s entropy for damage monitoring. Mech. Syst. Signal Processing 2018, 100, 617–629. [Google Scholar] [CrossRef]
  18. Eberhardt, E.; Stead, D.; Stimpson, B. Quantifying progressive pre-peak brittle fracture damage in rock during uniaxial compression. Int. J. Rock Mech. Min. Sci. 1999, 36, 361–380. [Google Scholar] [CrossRef]
  19. Chang, S.-H.; Lee, C.-I. Estimation of cracking and damage mechanisms in rock under triaxial compression by moment tensor analysis of acoustic emission. Int. J. Rock Mech. Min. Sci. 2004, 41, 1069–1086. [Google Scholar] [CrossRef]
  20. Su, G.; Shi, Y.; Feng, X.; Jiang, J.; Zhang, J.; Jiang, Q. True-Triaxial Experimental Study of the Evolutionary Features of the Acoustic Emissions and Sounds of Rockburst Processes. Rock Mech. Rock Eng. 2018, 51, 375–389. [Google Scholar] [CrossRef]
  21. Ashby, M.F.; Sammis, C.G. The damage mechanics of brittle solids in compression. Pure Appl. Geophys. 1990, 133, 489–521. [Google Scholar] [CrossRef]
  22. Paris, P.; Erdogan, F. A Critical Analysis of Crack Propagation Laws. J. Basic Eng. 1963, 85, 528. [Google Scholar] [CrossRef]
  23. Horii, H.; Nemat-Nasser, S. Compression-induced microcrack growth in brittle solids: Axial splitting and shear failure. J. Geophys. Res. 1985, 90, 3105. [Google Scholar] [CrossRef]
  24. Shigeishi, M.; Ohtsu, M. Acoustic emission moment tensor analysis: Development for crack identification in concrete materials. Constr. Build. Mater. 2001, 15, 311–319. [Google Scholar] [CrossRef]
  25. Aggelis, D.G. Classification of cracking mode in concrete by acoustic emission parameters. Mech. Res. Commun. 2011, 38, 153–157. [Google Scholar] [CrossRef]
  26. Ohtsu, M. Simplified moment tensor analysis and unified decomposition of acoustic emission source: Application to in situ hydrofracturing test. J. Geophys. Res. 1991, 96, 6211–6221. [Google Scholar] [CrossRef]
  27. Haghgouei, H.; Baghbanan, A.; Hashemolhosseini, H.; Jamali, S. Variable Amplitude Fatigue Life Prediction of Rock Samples Under Completely Reversed Loading. Geotech. Geol. Eng. 2021, 39, 1951–1962. [Google Scholar] [CrossRef]
  28. Li, R.; Wang, Y.; Fu, F. Research on Fatigue Damage and Affecting Factors of Defected Rock Mass Based on Ultrasonic Wave Velocity. Teh. Vjesn. Tech. Gaz. 2019, 26, 1061–1067. [Google Scholar]
  29. Liu, E.L.; He, S.M.; Xue, X.H.; Xu, J. Dynamic Properties of Intact Rock Samples Subjected to Cyclic Loading under Confining Pressure Conditions. Rock Mech. Rock Eng. 2011, 44, 629–634. [Google Scholar] [CrossRef]
  30. Bagde, M.N.; Petros, V. Waveform effect on fatigue properties of intact sandstone in uniaxial cyclical loading. Rock Mech. Rock Eng. 2005, 38, 169–196. [Google Scholar] [CrossRef]
  31. Attewell, P.B.; Farmer, I.W. Fatigue behaviour of rock. Int. J. Rock Mech. Min. Sci. Geomech. Abstr. 1973, 10, 101–109. [Google Scholar] [CrossRef]
  32. Ishizuka, Y.; Abe, T. Fatigue behaviour of granite under cyclic loading. In Static and Dynamic Considerations in Rock Engineering; CRC Press: Boca Raton, FL, USA, 1990; pp. 139–147. [Google Scholar]
Figure 1. Wing crack propagation under the interaction of multiple cracks.
Energies 15 04807 g001
Figure 2. Typical relationship between log (dL/dN) and log (ΔK).
Energies 15 04807 g002
Figure 3. The function f(L) varies with the length of the wing crack L.
Energies 15 04807 g003
Figure 4. Basic parameters of an AE waveform.
Energies 15 04807 g004
Figure 5. Crack classification using RA and AF values.
Energies 15 04807 g005
Figure 6. AE instrument and sample setup. (a) PCI-2 AE equipment; (b) sandstone samples; and (c) sample setup.
Energies 15 04807 g006
Figure 7. Stress–strain curves of sandstone samples under different confining pressures.
Energies 15 04807 g007
Figure 8. Variation process of wing crack length with axial stress under different confining pressures.
Energies 15 04807 g008
Figure 9. Fatigue stress–strain curves of sandstone samples at different lower limit stresses. (a) Sample F1-1; (b) Sample F1-6.
Energies 15 04807 g009
Figure 10. Variation law of fatigue life of sandstone samples with lower limit stress when the upper limit stress is fixed (σmax = 61.2 Mpa).
Energies 15 04807 g010
Figure 11. Fatigue stress–strain curves of sandstone at different lower limit stresses. (a) Sample F2-1; (b) Sample F2-5.
Energies 15 04807 g011
Figure 12. Variation law of fatigue life of sandstone samples with upper limit stress when the lower limit stress is fixed (σmin = 20.4 Mpa).
Energies 15 04807 g012
Figure 13. Fatigue stress–strain curves of sandstone under different confining pressures. (a) Sample F3-2; (b) Sample F3-3.
Energies 15 04807 g013
Figure 14. The fatigue life of sandstone varies with confining pressure when the upper limit stress ratio is 0.9 (σmax = 0.9 σp).
Energies 15 04807 g014
Figure 15. The morphology of sandstone samples after failure under fatigue loading. (a) σ3 = 0 MPa; (b) σ3 = 2.5 MPa; (c) σ3 = 5 MPa; (d) σ3 = 10 MPa; (e) σ3 = 15 MPa.
Energies 15 04807 g015
Figure 16. Evolution law of dissipative energy during the whole process of fatigue loading. (a) F2-1; (b) F3-3.
Energies 15 04807 g016
Figure 17. The cumulative energy evolution law of different types of AE during fatigue loading process based on the RA and AF values. (a) Sample F2-1; (b) Sample F3-3.
Energies 15 04807 g017
Figure 18. AE moment tensor inversion results for F2-1 at different fatigue crack growth stages. (a) Fatigue crack initial propagation stage; (b) fatigue crack stable propagation stage; (c) fatigue crack unstable propagation stage.
Energies 15 04807 g018
Figure 19. AE moment tensor inversion results for F3-3 at different fatigue crack growth stages. (a) Fatigue crack initial propagation stage; (b) fatigue crack stable propagation stage; (c) fatigue crack unstable propagation stage.
Energies 15 04807 g019
Table 1. The influence of lower limit stress on the fatigue life of yellow sandstone samples.
Sample No.F1-1F1-2F1-3F1-4F1-5F1-6
Upper stress/Mpa61.261.261.261.261.261.2
Upper stress ratio0.900.900.900.900.900.90
Lower stress/Mpa020.427.234.040.847.6
Lower stress ratio/Mpa00.30.40.50.60.7
Stress difference/Mpa61.240.834.027.220.413.6
Stress difference ratio0.900.600.500.400.300.20
Fatigue life9125935661211412812
Table 2. The influence of upper limit stress on the fatigue life of yellow sandstone samples.
Sample No.F2-1F2-2F2-3F2-4F2-5
Upper stress/Mpa51.054.457.861.261.2
Upper stress ratio0.750.800.850.900.95
Lower stress/Mpa20.420.420.420.420.4
Lower stress ratio/Mpa0.30.30.30.30.3
Stress difference/Mpa29.634.037.440.844.2
Stress difference ratio0.450.500.550.600.65
Fatigue life716511325259112
Table 3. The influence of confining pressure on the fatigue life of yellow sandstone samples.
Sample No.F1-2F3-1F3-2F3-3F3-4
Upper stress/Mpa61.274.393.6125.1159.5
Upper stress ratio0.90.90.90.90.9
Lower stress/Mpa20.433.552.884.3118.7
Lower stress ratio/Mpa0.300.410.510.610.68
Stress difference/Mpa40.840.840.840.840.8
Confining pressure/Mpa02.551015
Fatigue life259278301336421
Publisher’s Note: MDPI stays neutral with regard to jurisdictional claims in published maps and institutional affiliations.

