
Influence of the Working Parameters of the Chassis Dynamometer on the Assessment of Tuning of Dual-Fuel Systems


Abstract
:1. Introduction
2. Materials and Methods
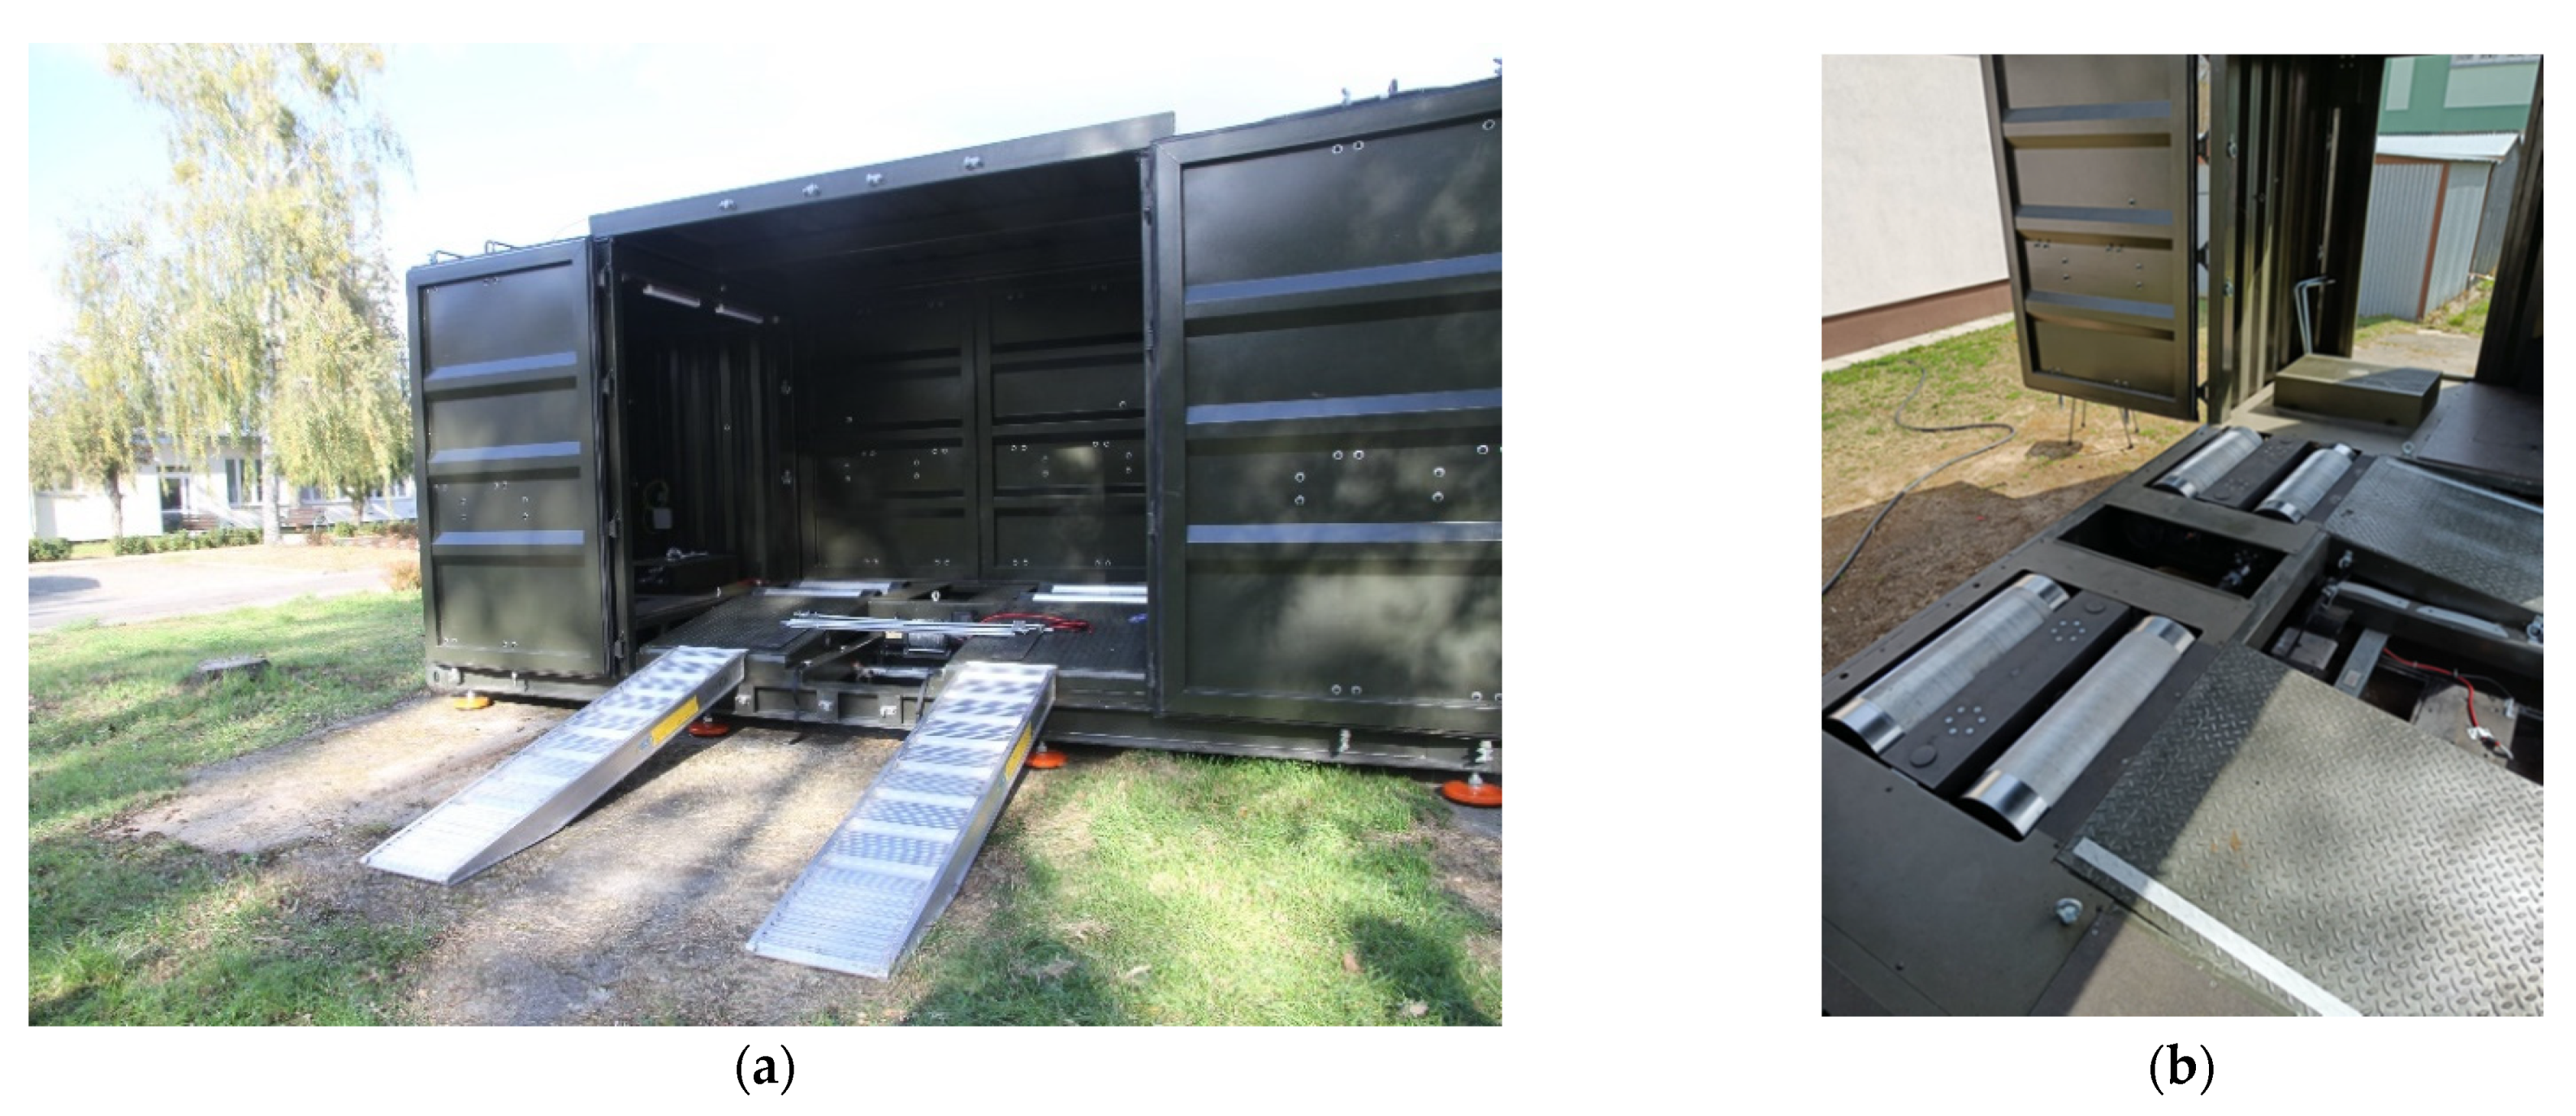
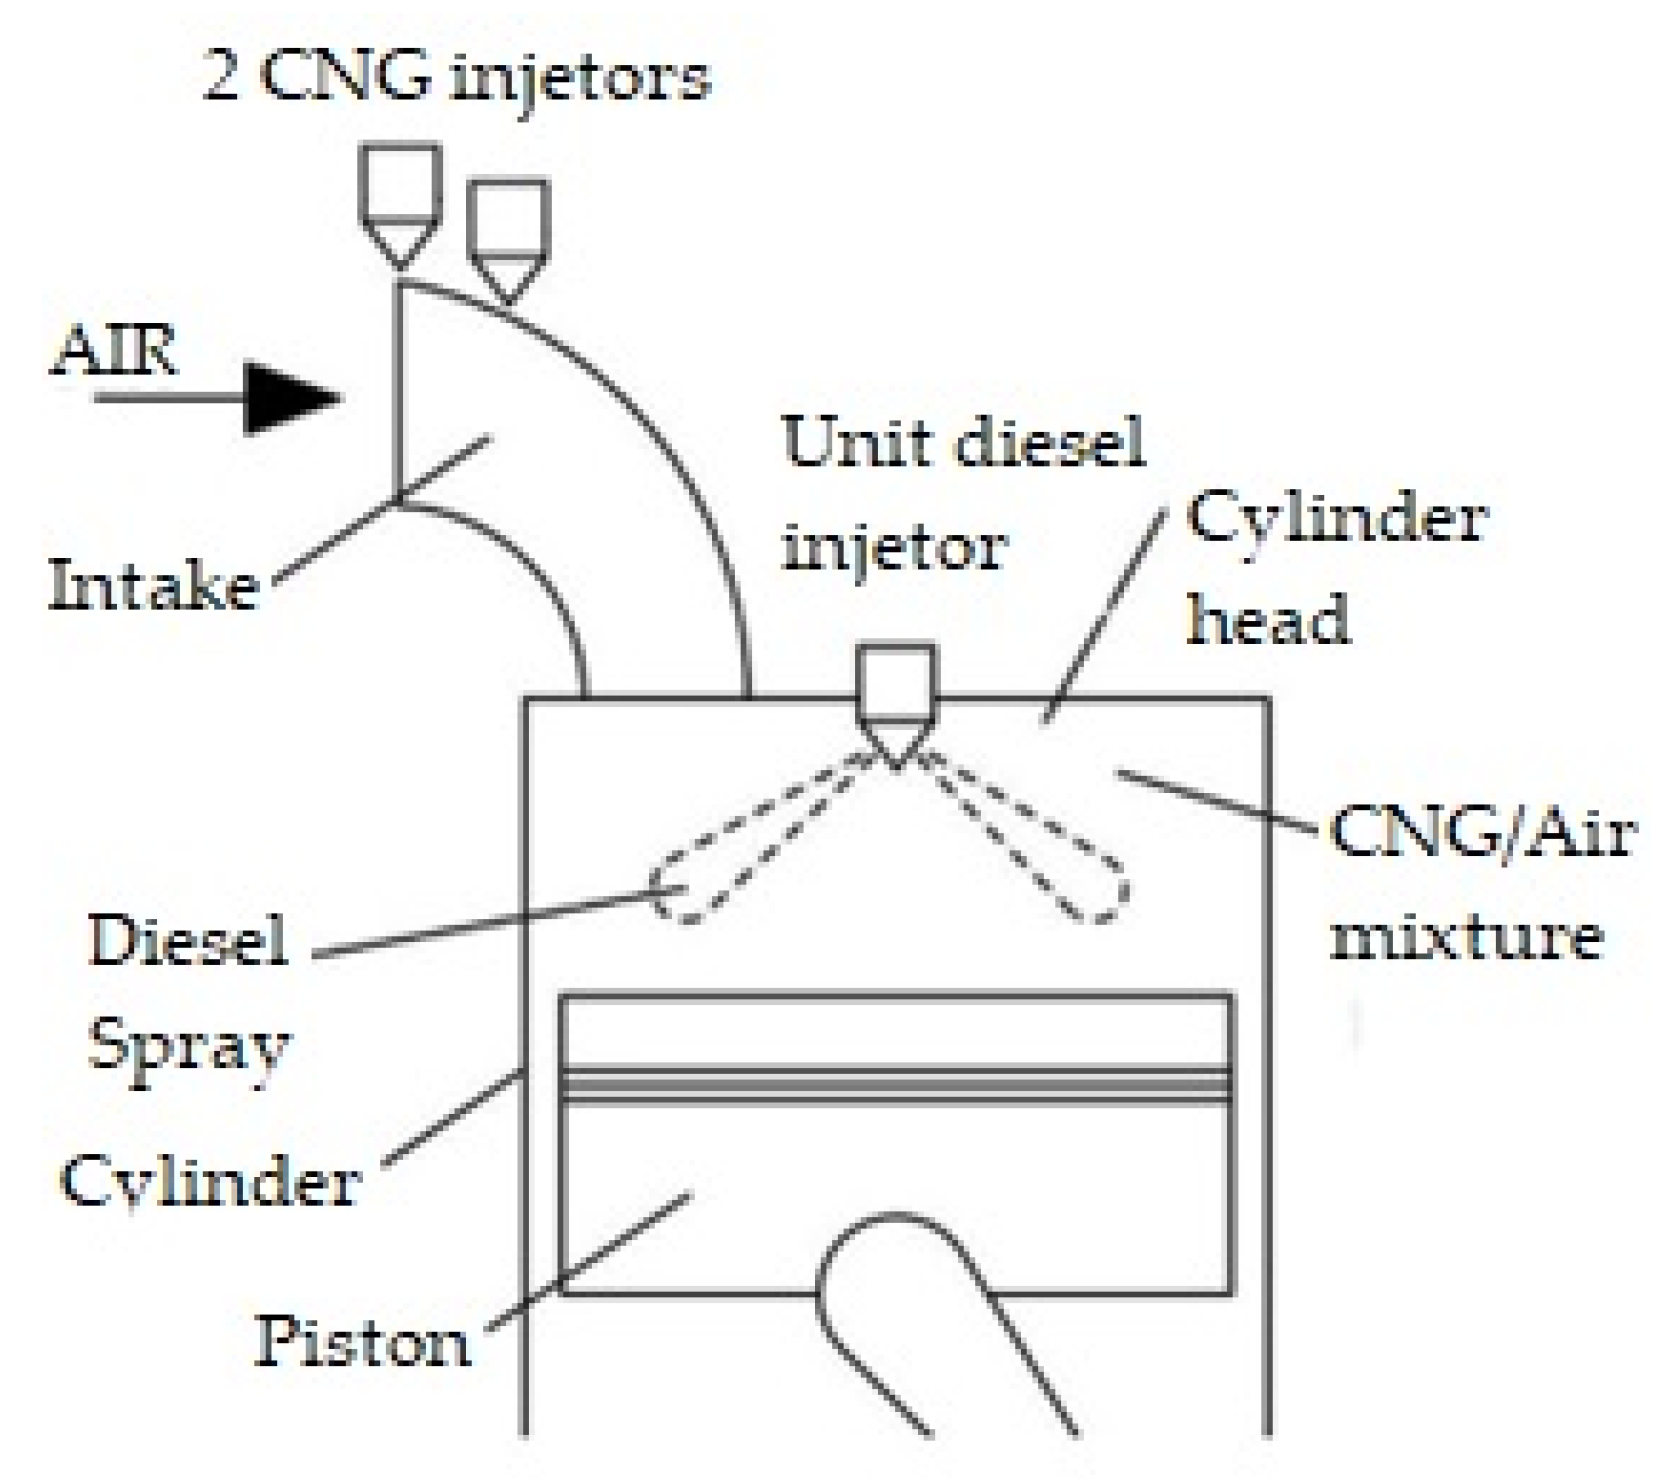
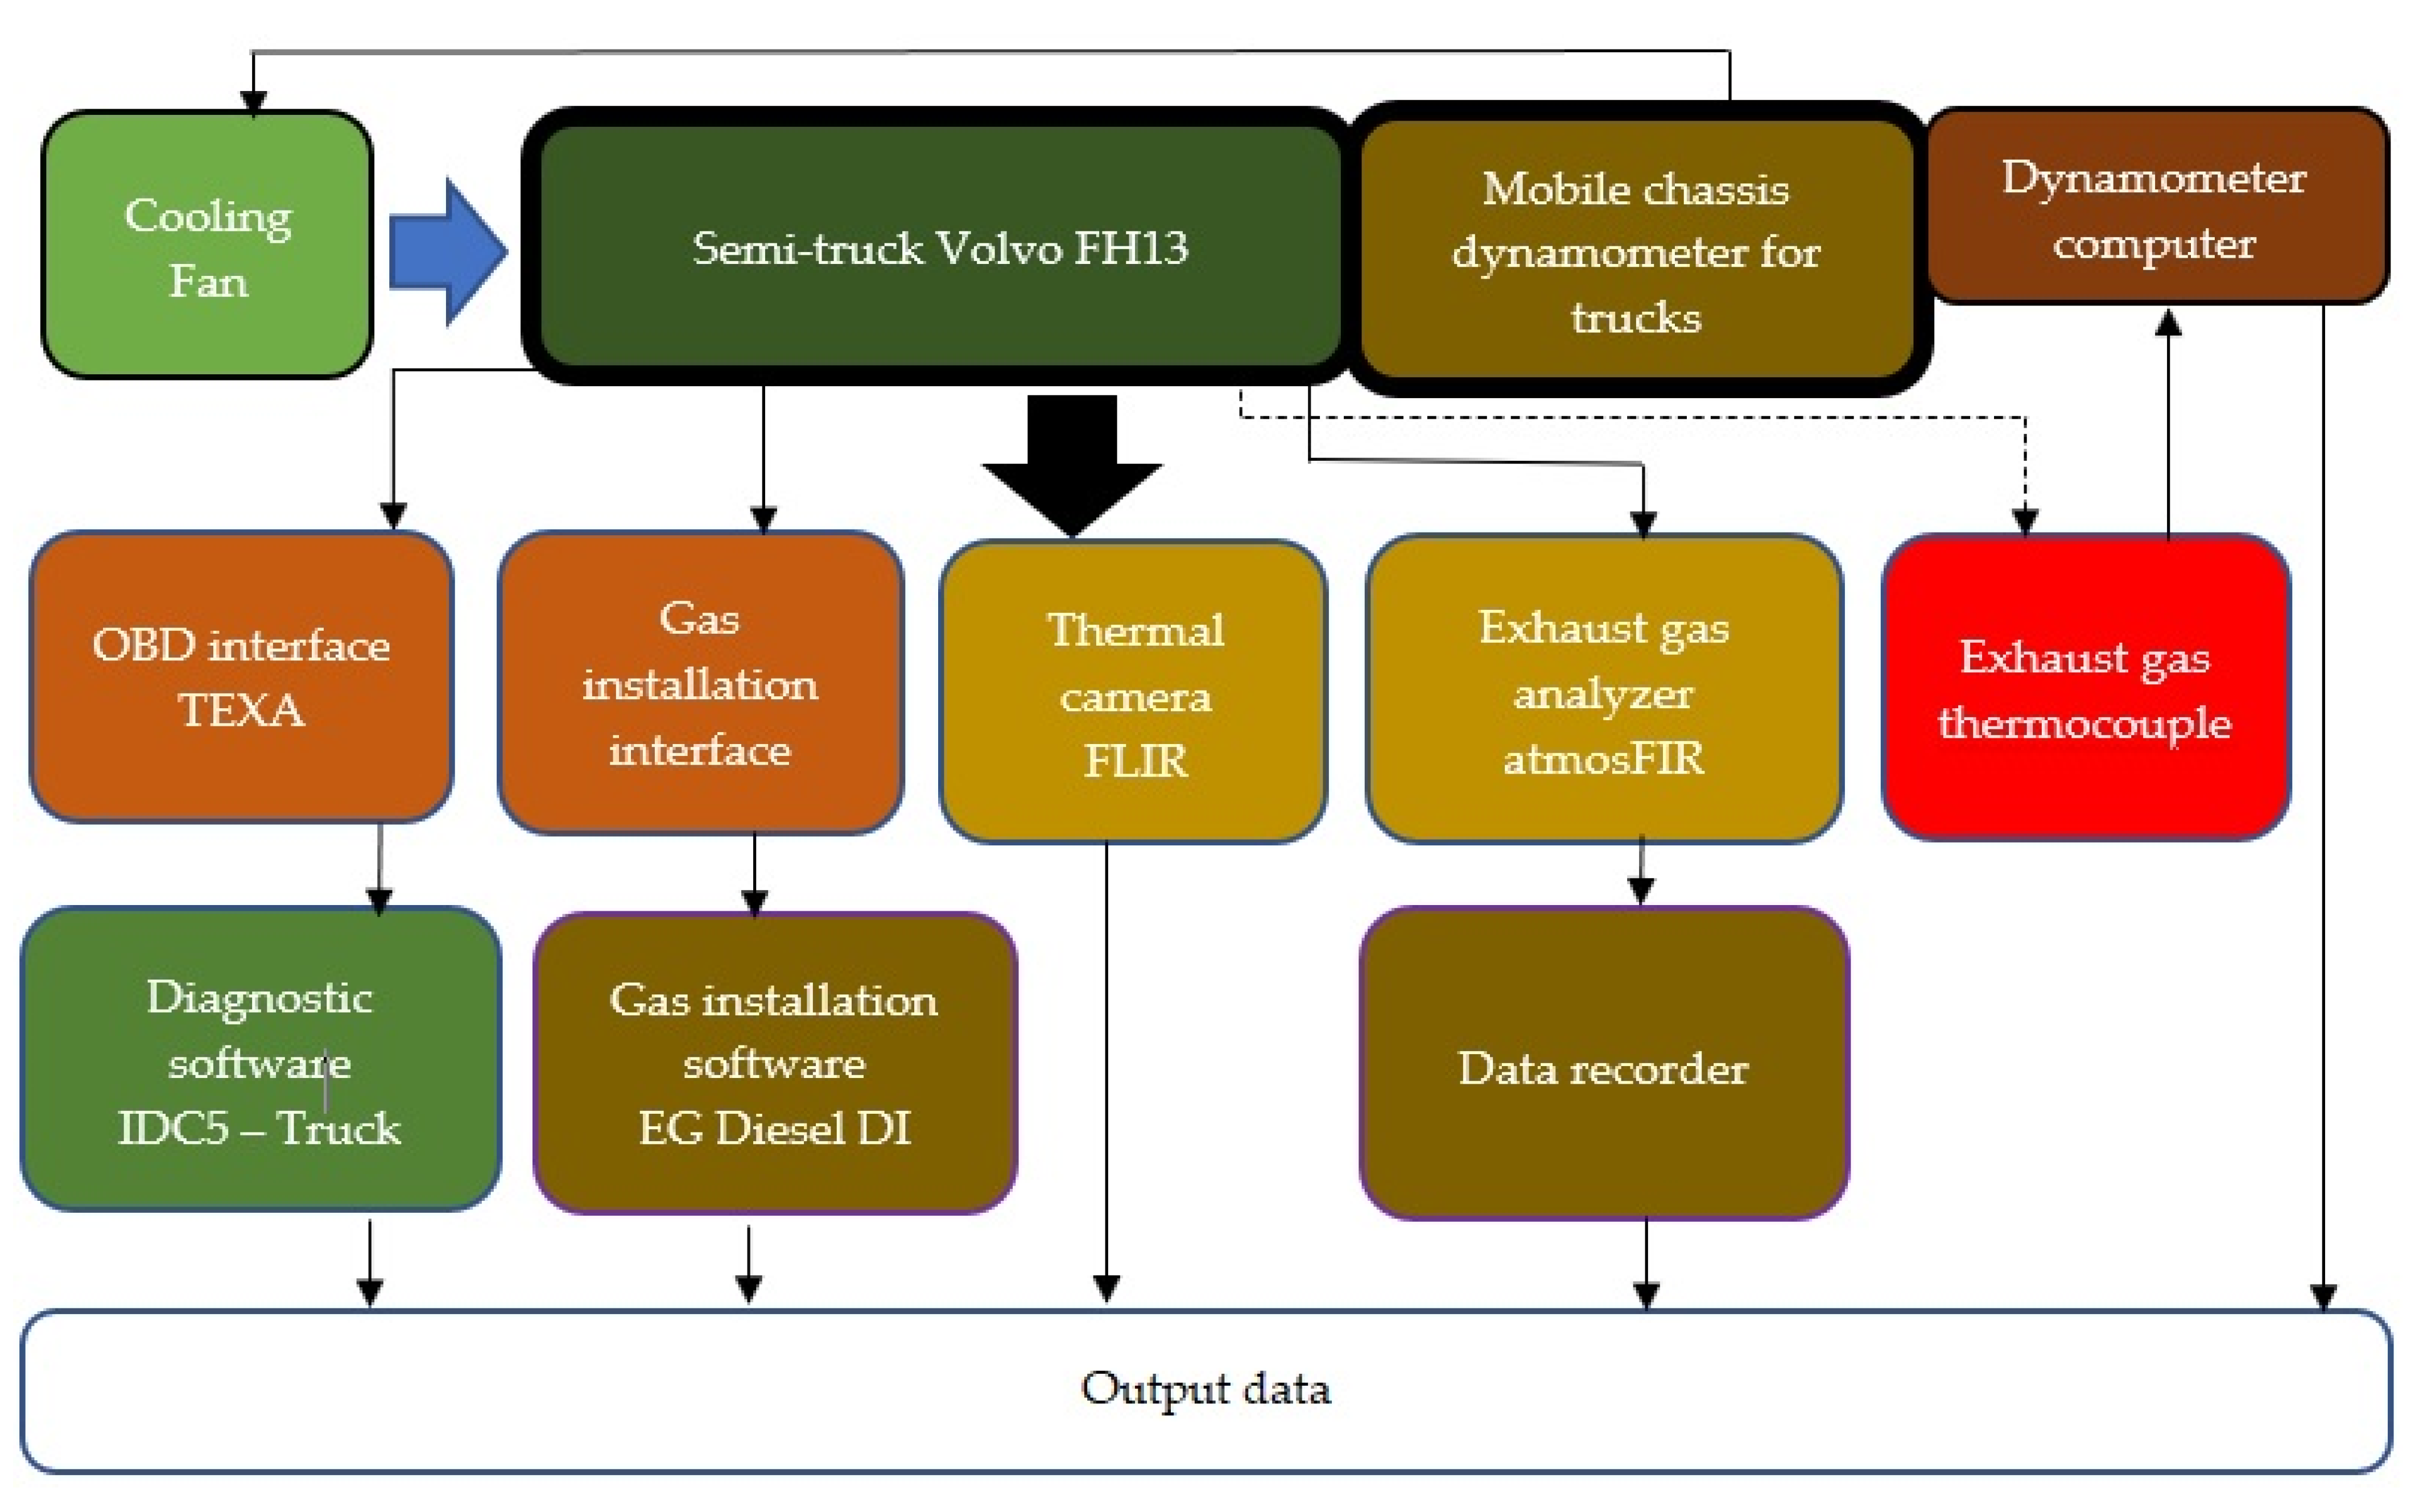
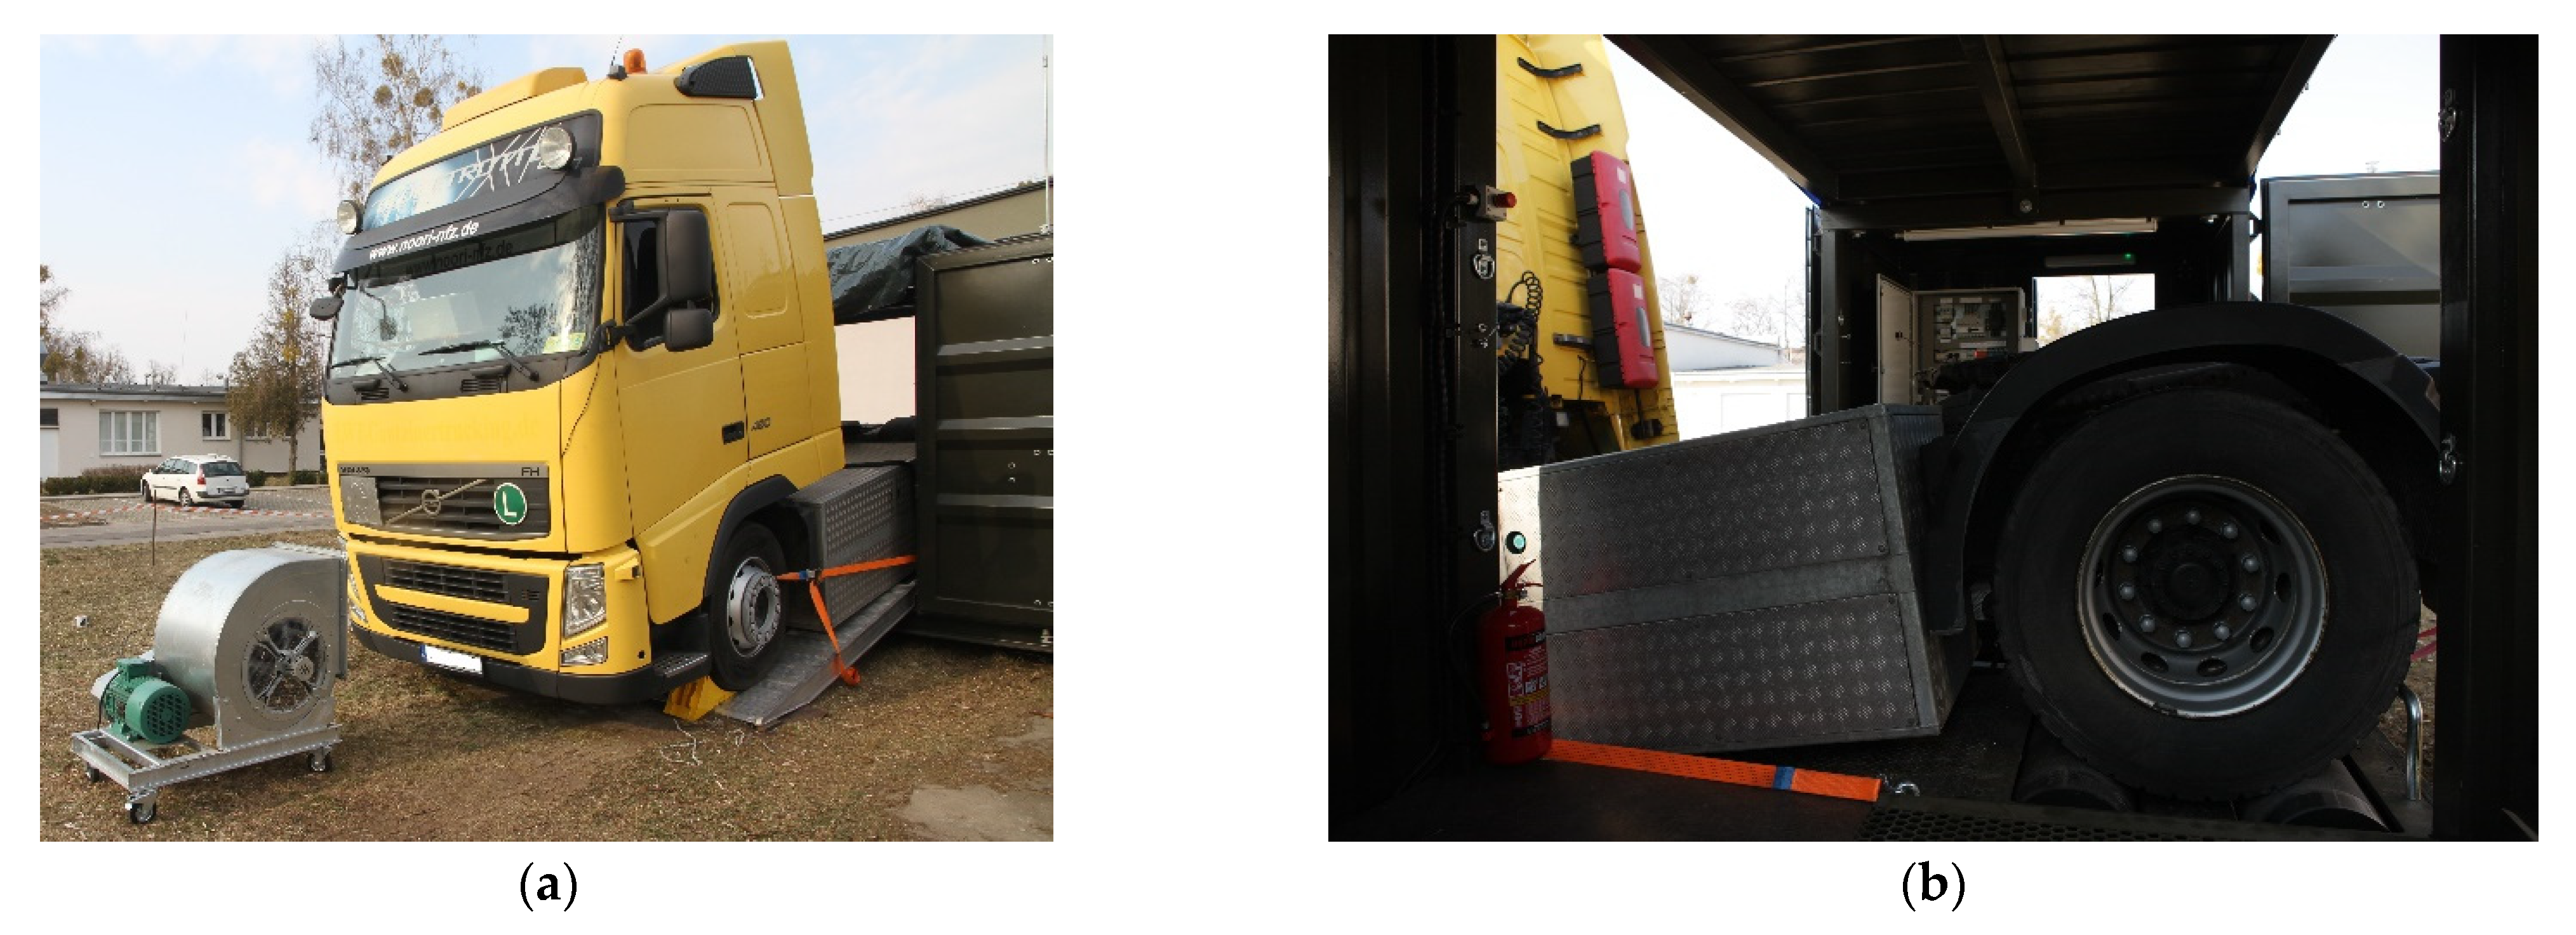
2.1. Research Setup—Materials
- The operation of the dual fuel (CNG/diesel) system controller;
- The work of the chassis dynamometer;
- The operation of the semi-tractor engine control system.
- Engine rotational speed [RPM];
- Vehicle travel speed [km/h];
- Boost pressure [bar];
- Torque [Nm];
- Hourly basic fuel consumption—diesel fuel [kg/h];
- Engine load [%];
- Engine management system errors.
2.2. Methodology
- Preliminary data settings for the technical (physical) data of the test vehicle on the dynamometer;
- Selection of the operating range of the vehicle’s engine (gear selection);
- The influence of the value of the forced load of the vehicle driving axle;
- Selection of the dyno working mode appropriate to the expected tasks;
- The impact of the correctness of the selection of the scope of the analysis of data on losses in the drive system.
3. Results
3.1. Settings for the Technical (Physical) Data of the Test Vehicle on the Dynamometer
3.2. Selection of the Operating Range of the Vehicle’s Engine (Gear Selection)
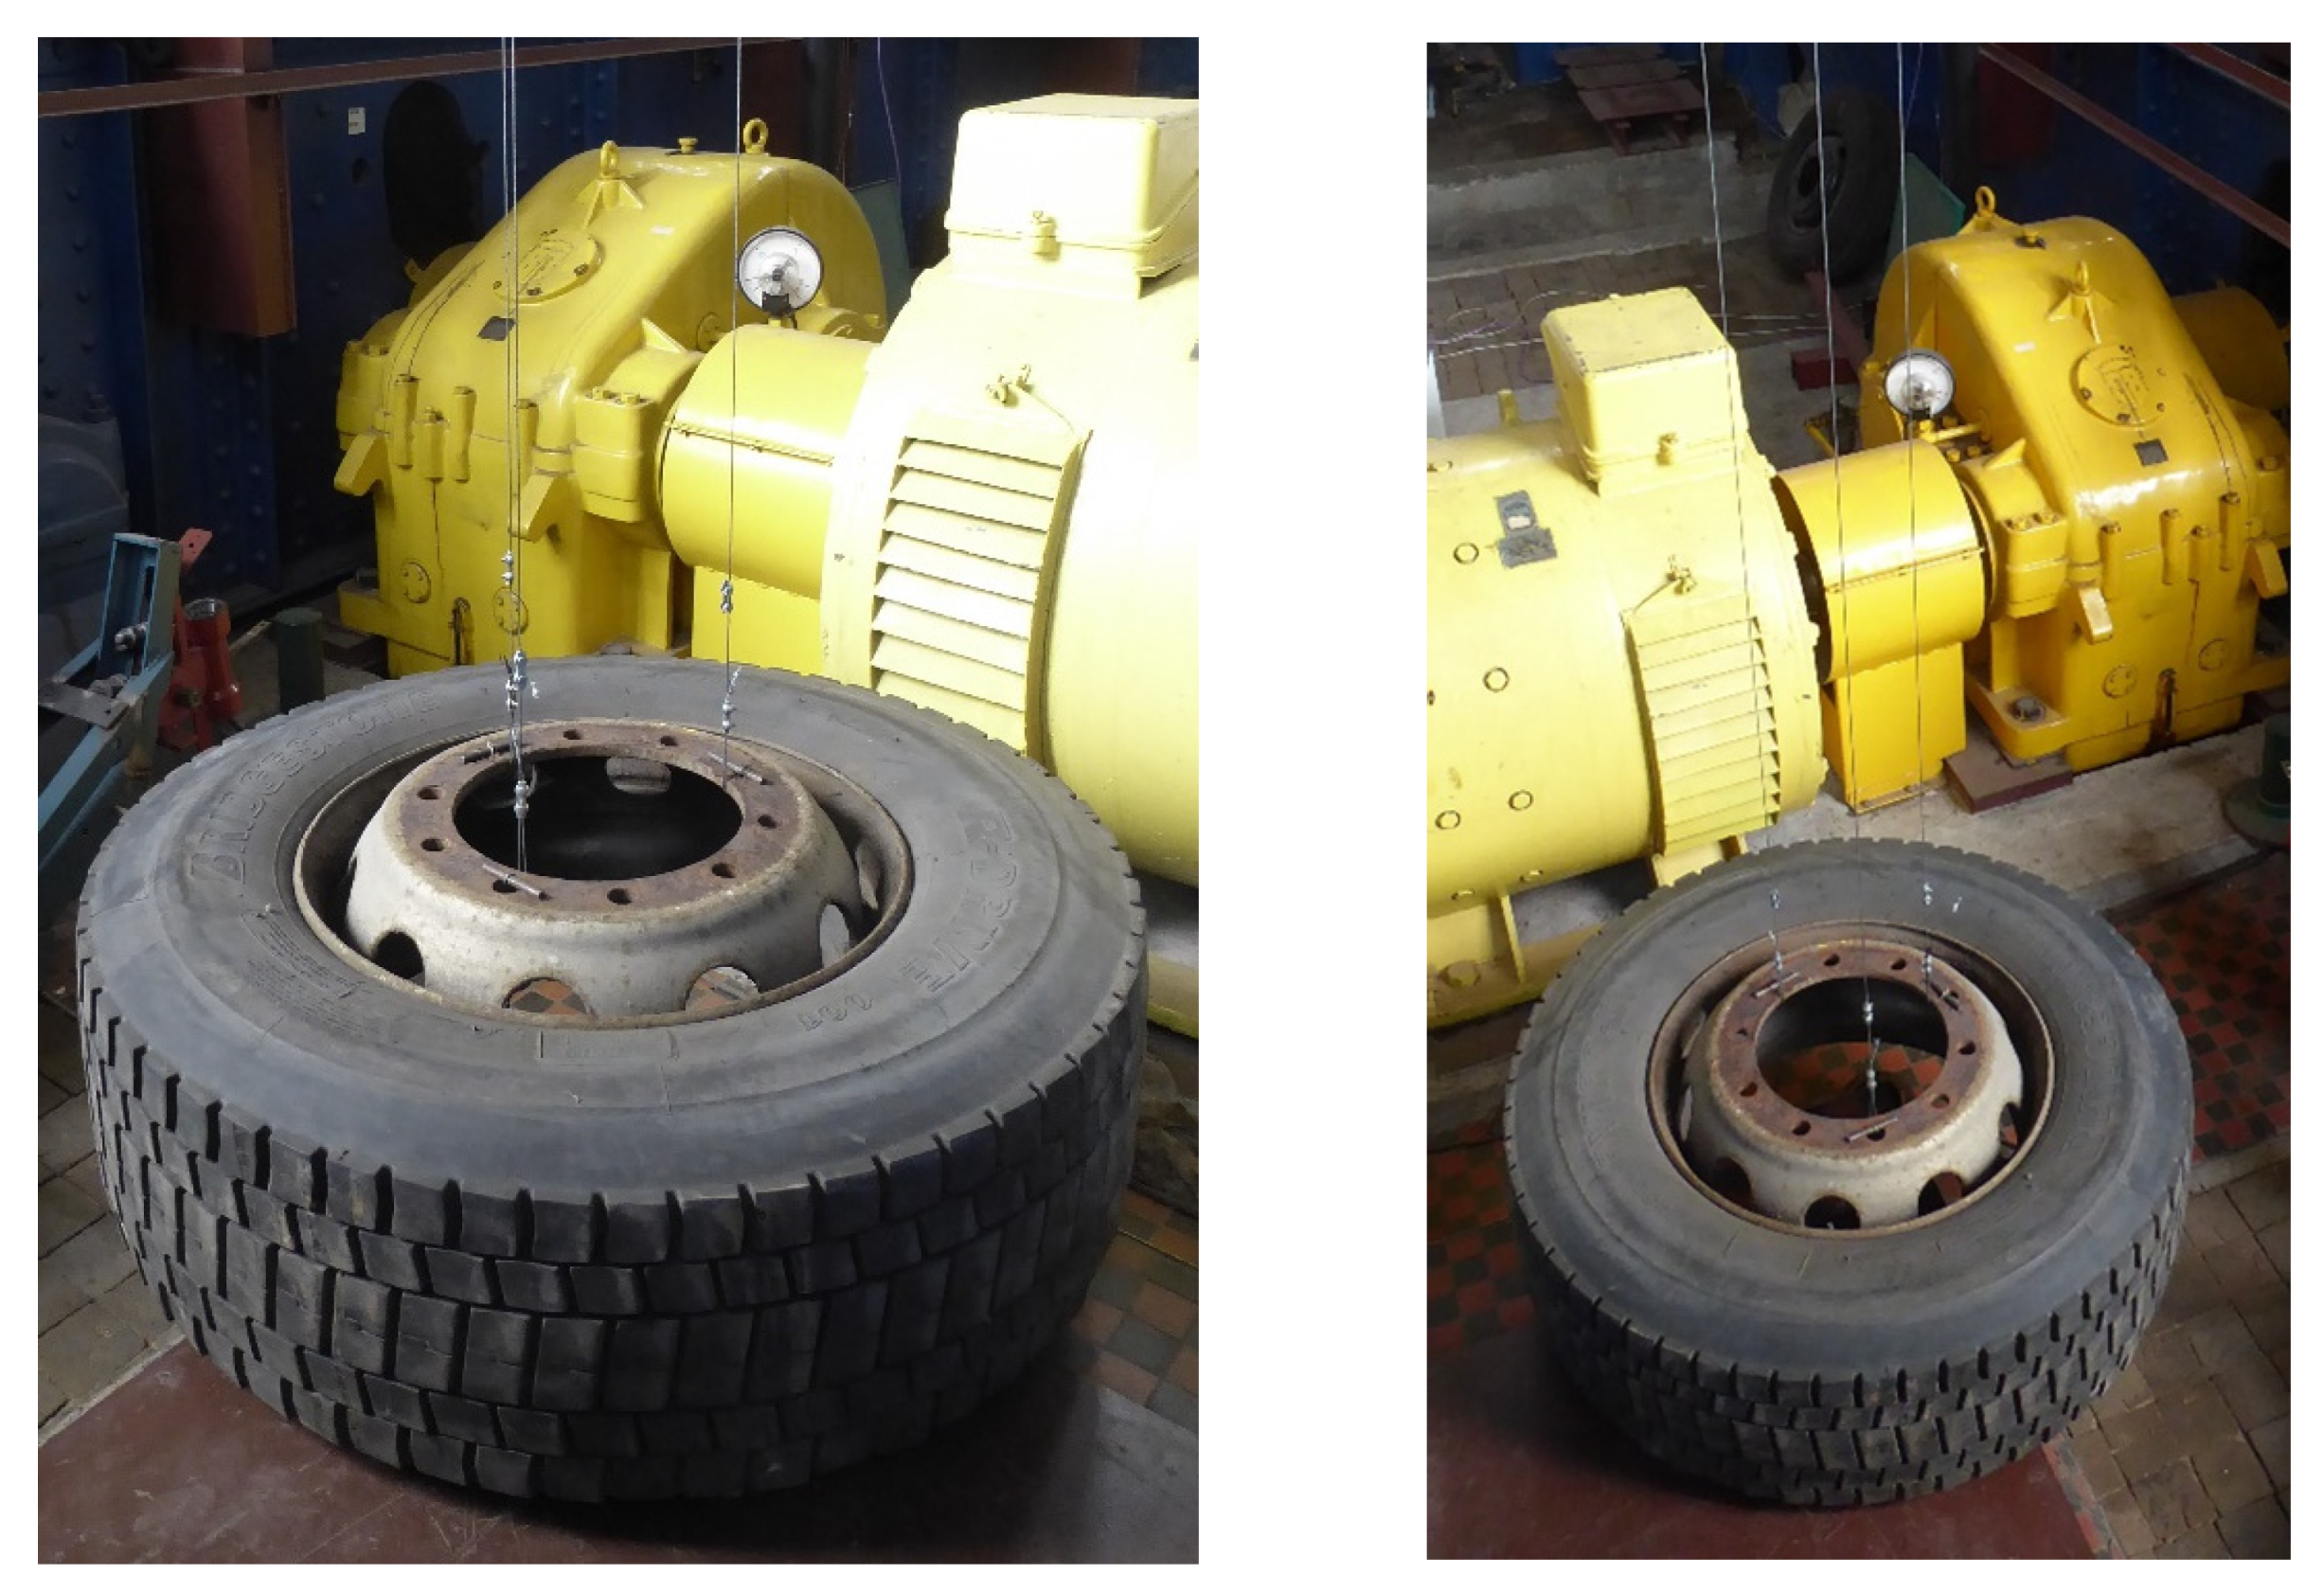
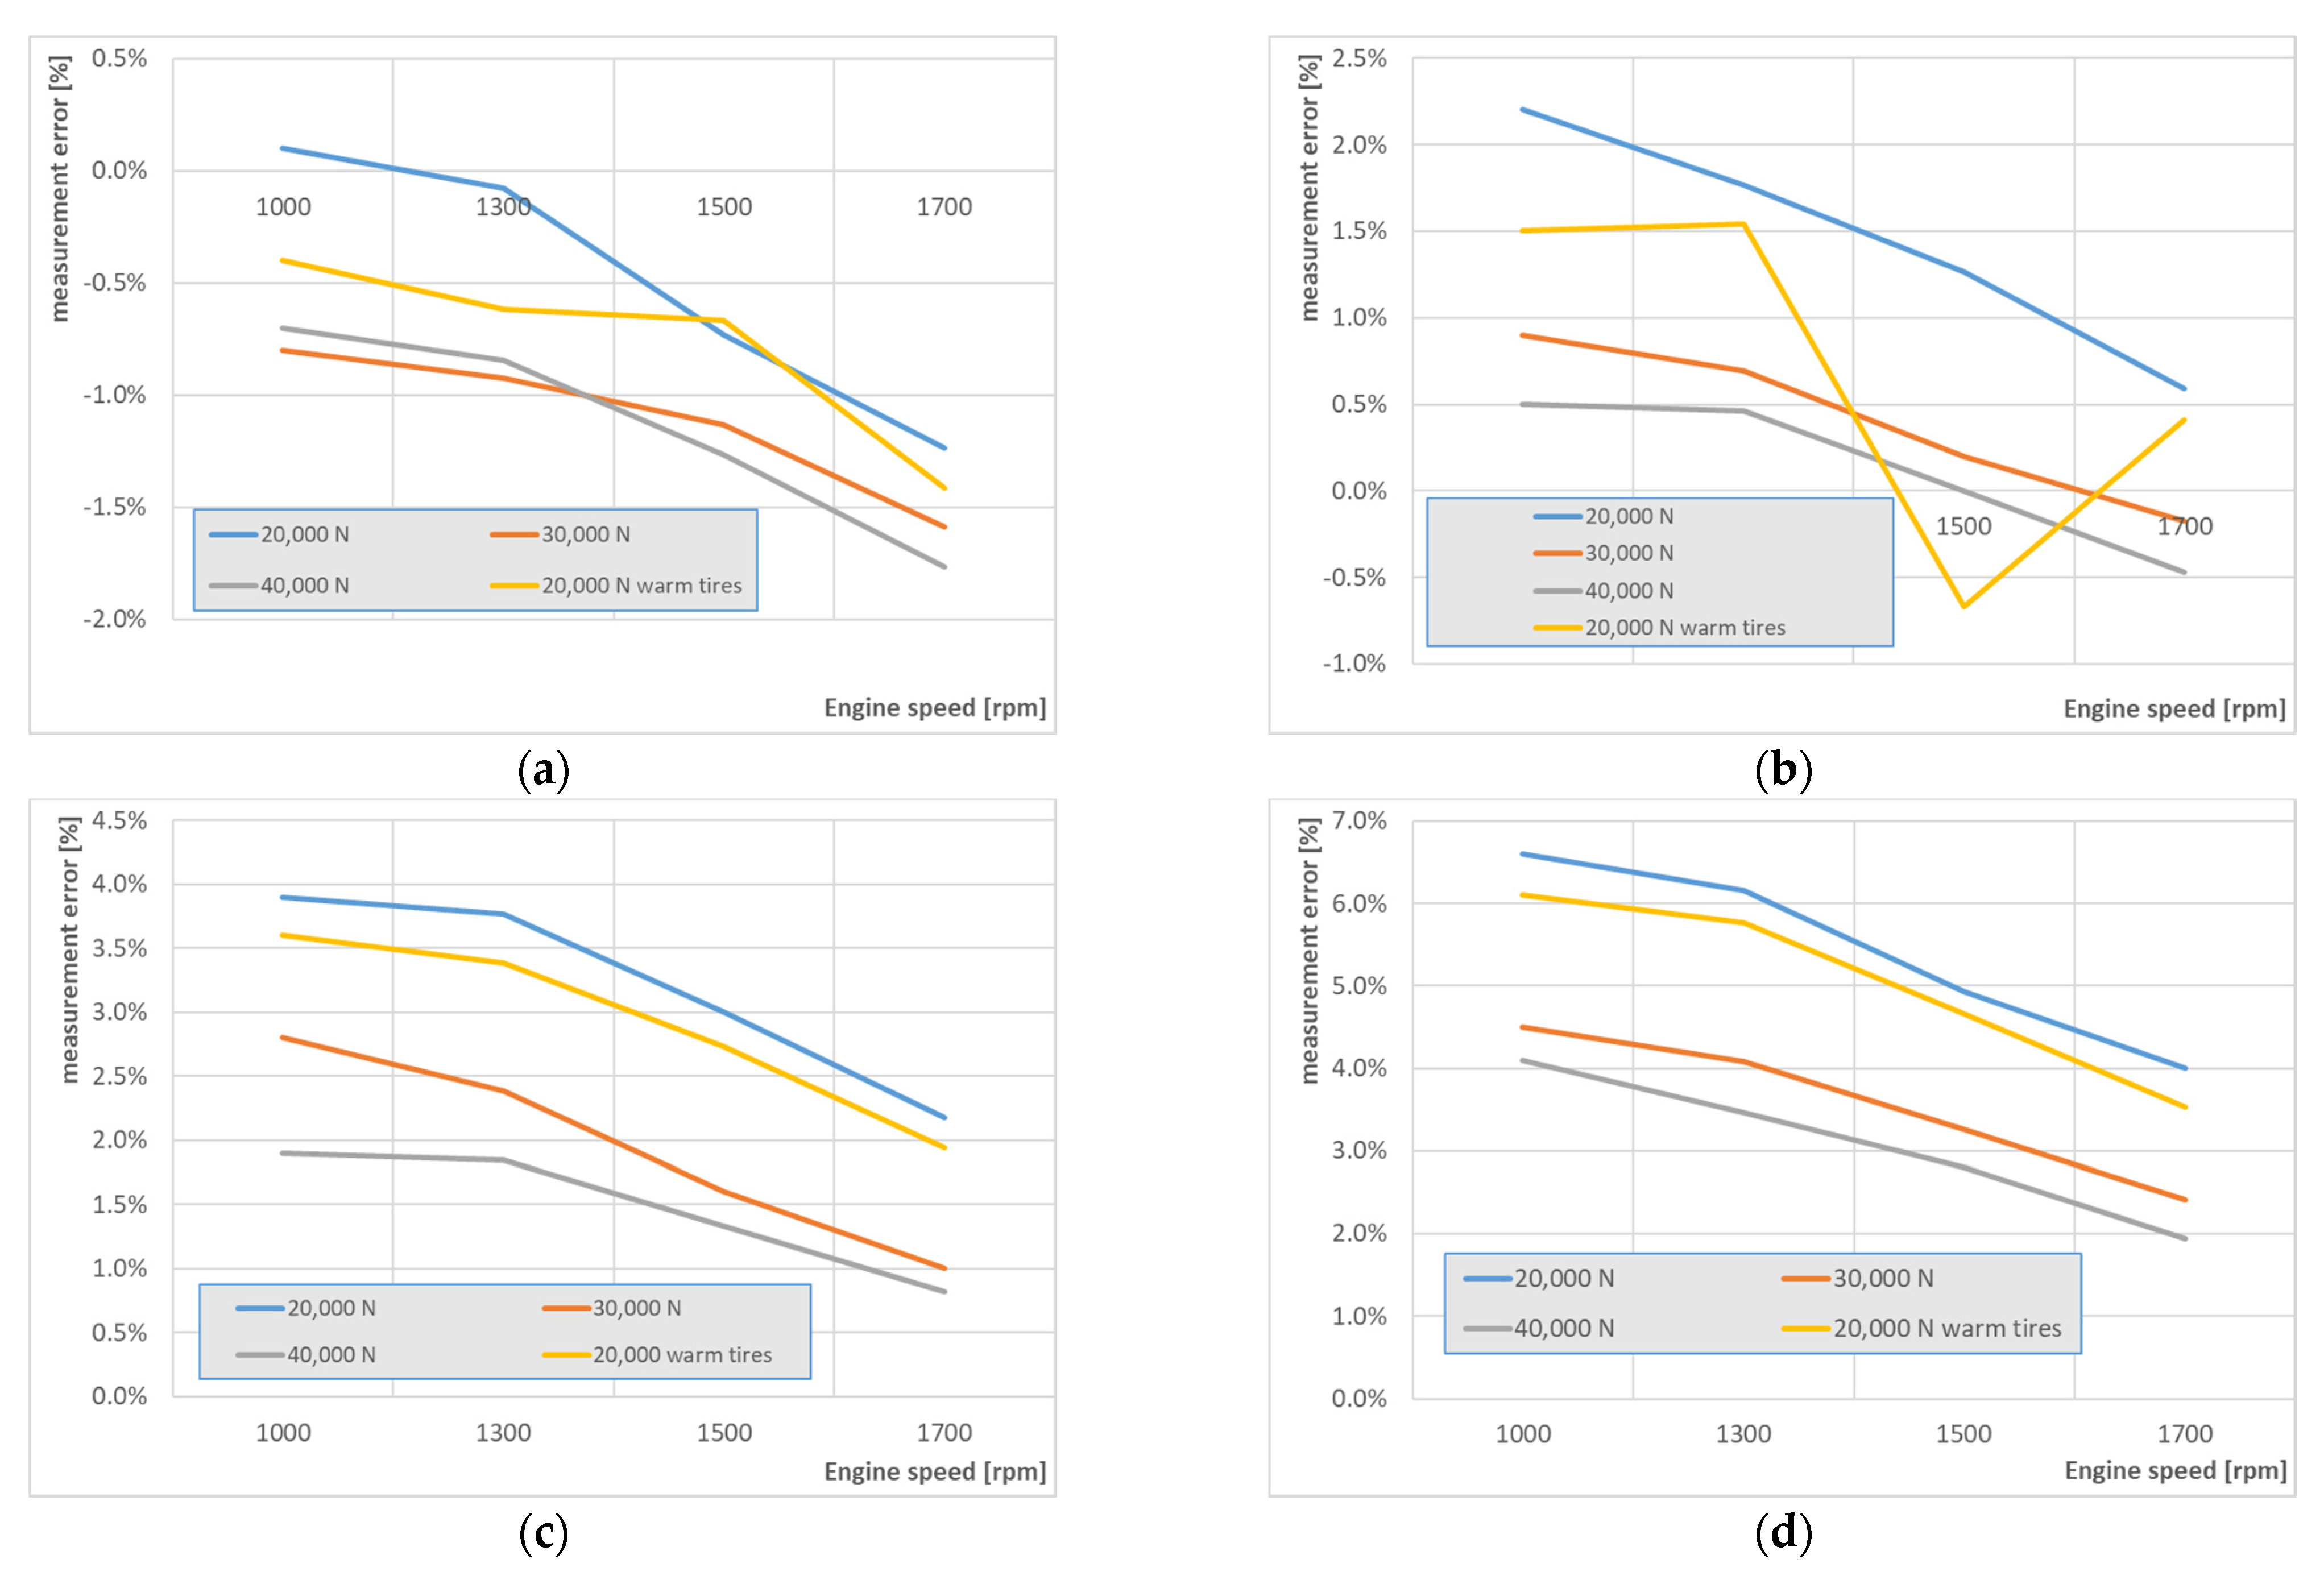
3.3. The Influence of the Slip of Tires on Rollers
- Dependence of the slip of the driving wheels on the roller due to the load of the driving axle on the rollers;
- Measurement error resulting from the above and from the influence of the engine/roller ratio settings in the dynamometer settings;
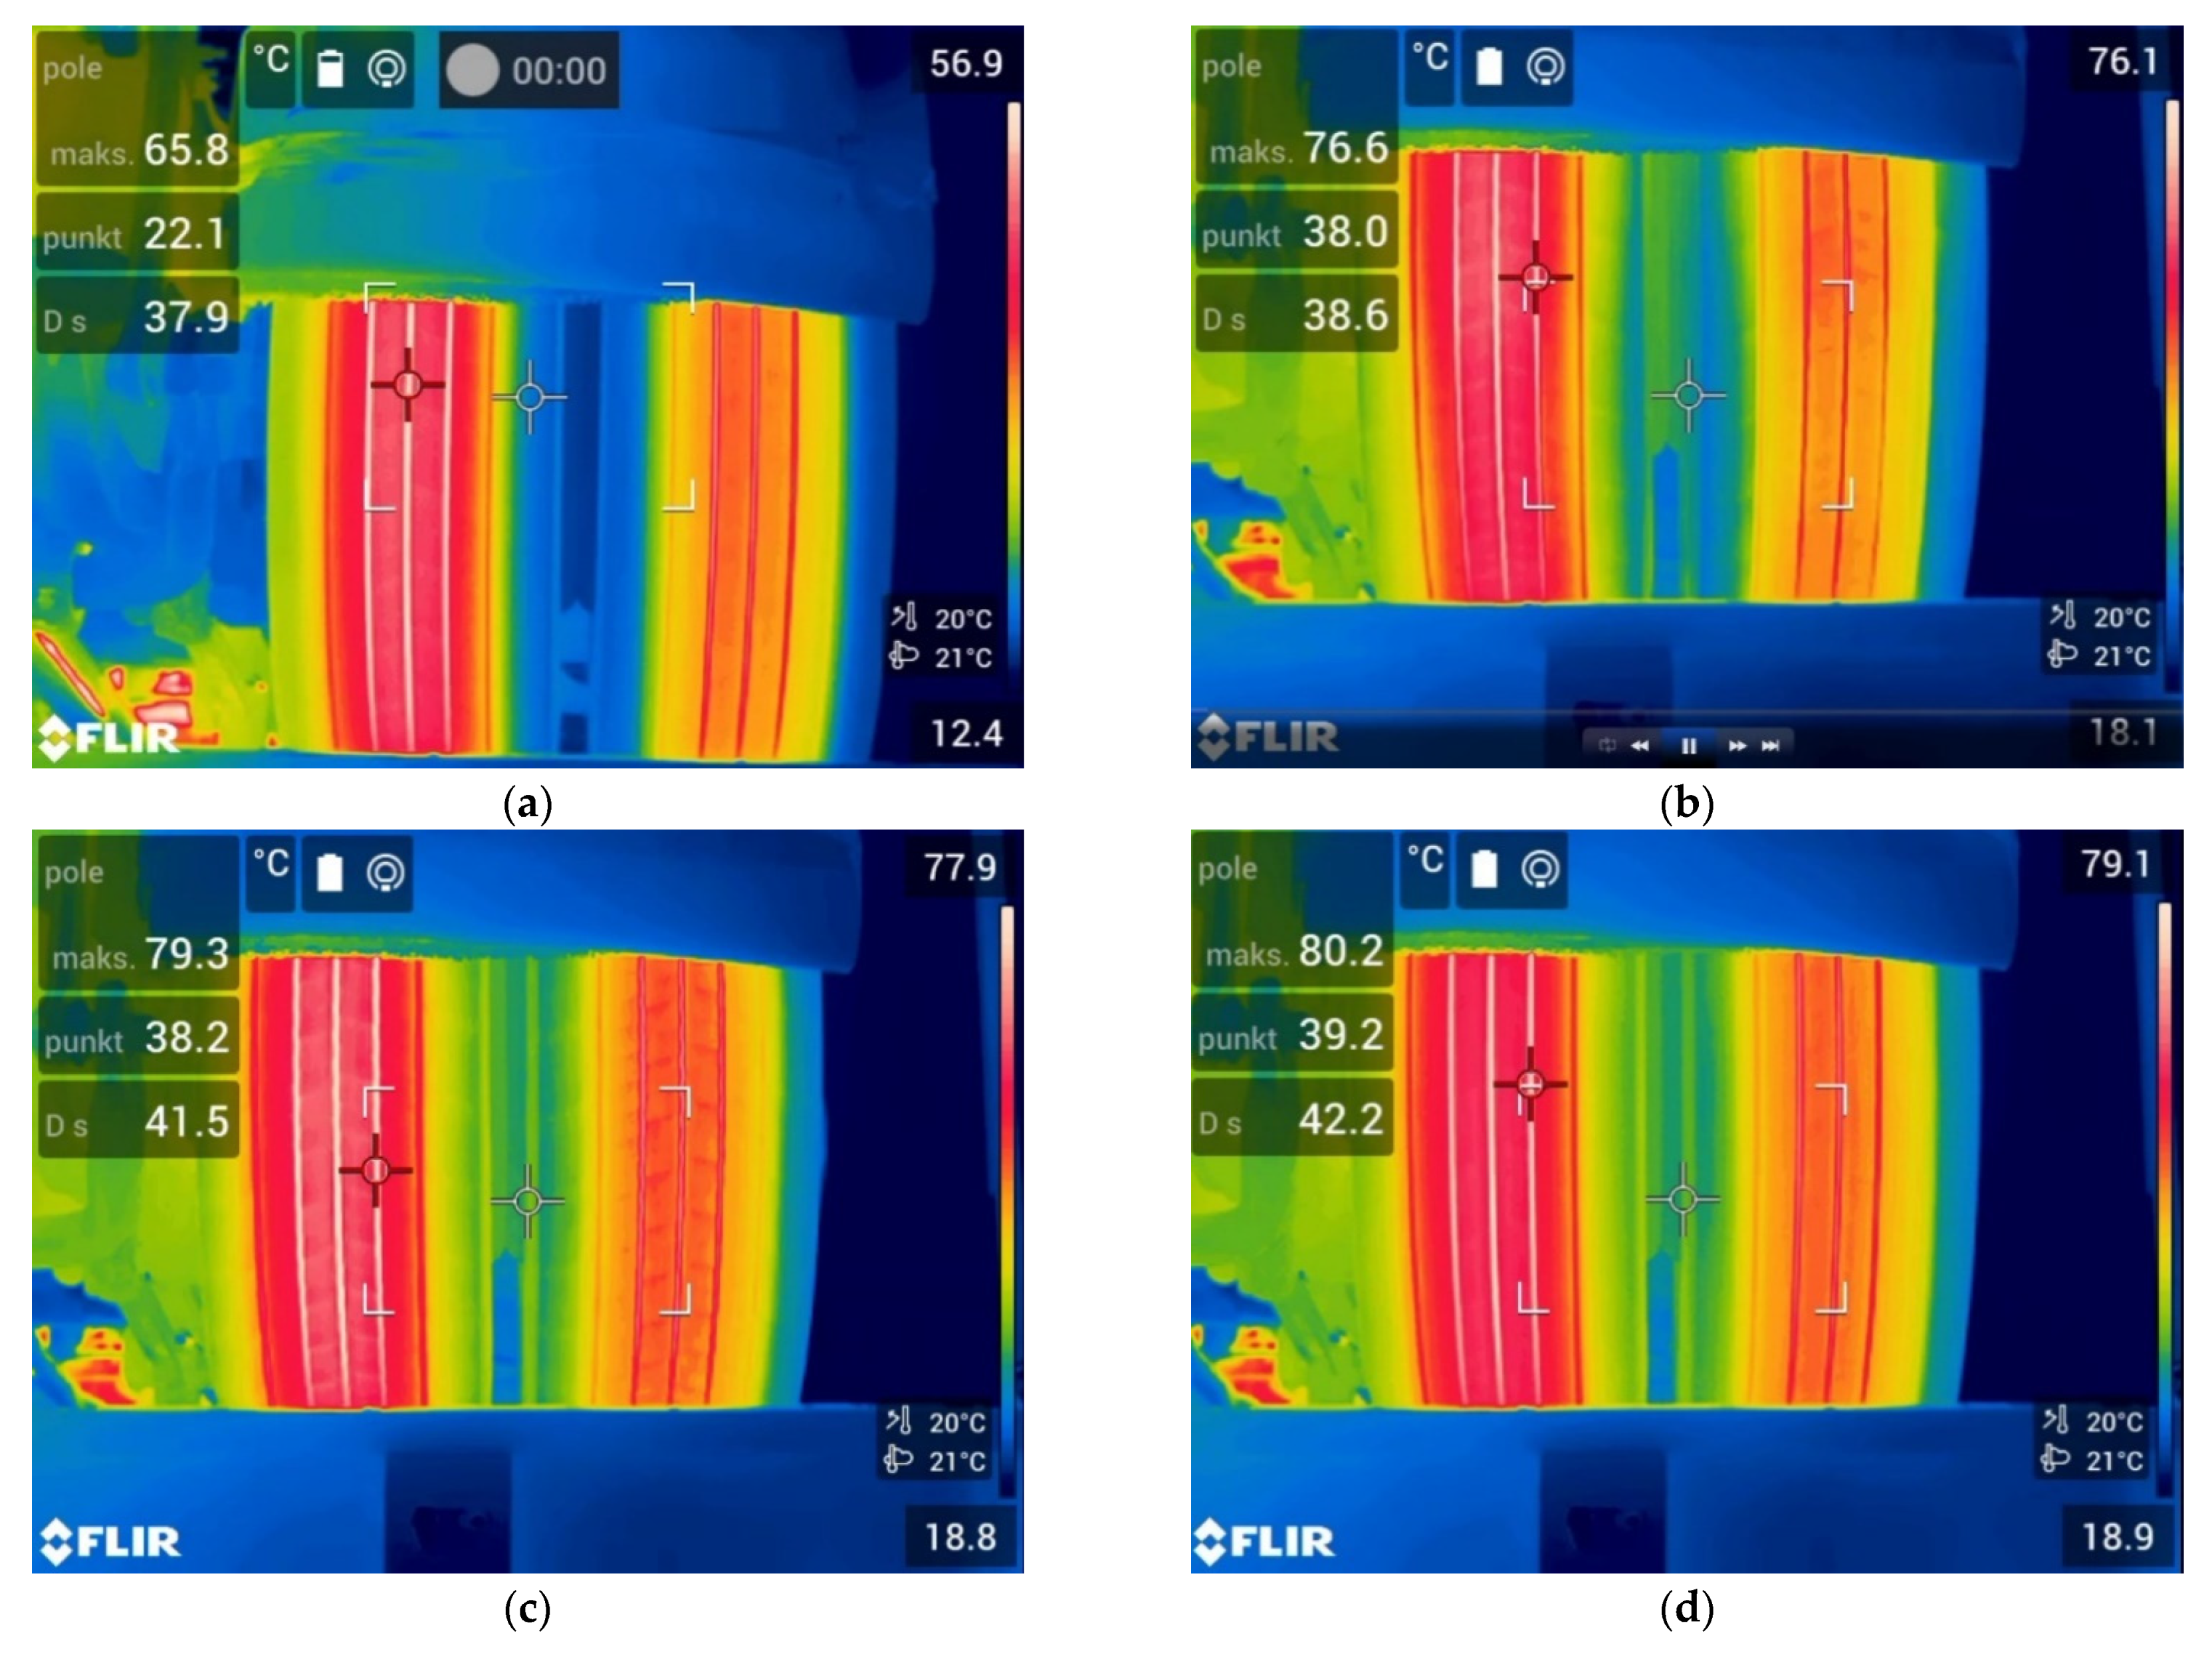
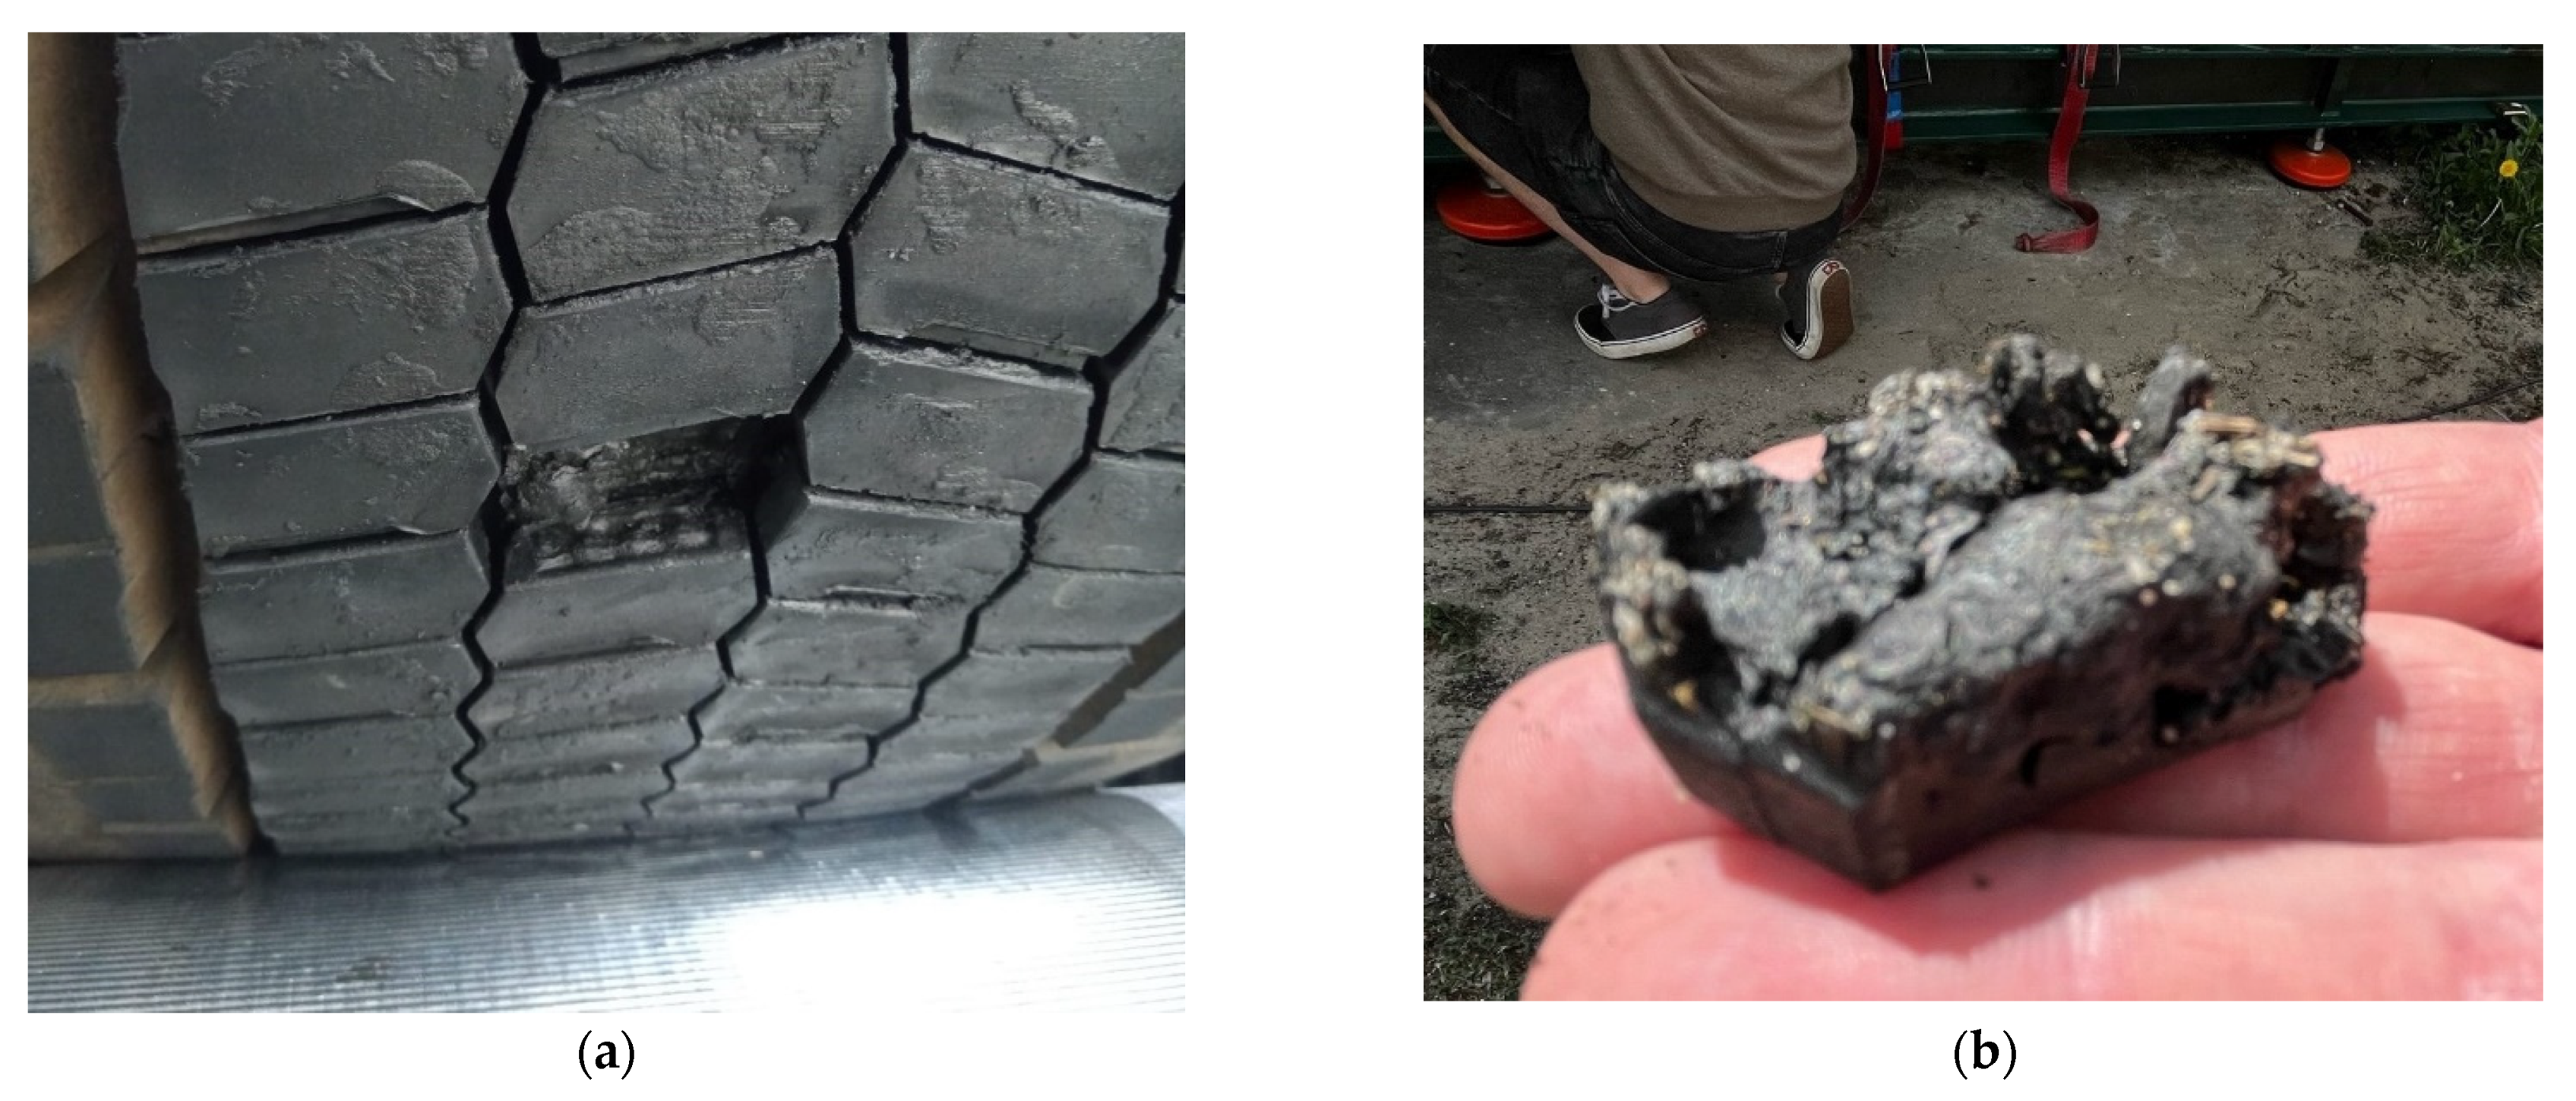
- Impact of the tires (heating up due to work on rollers, change in their dynamic radius).

| Const. Revs. * | 1000 RPM (~Max Torque) | 1300 RPM (~Eco Revs) | 1500 RPM (~Max Power) | 1700 RPM (~High Revs) | Axle Load **** | ||||||||||||
|---|---|---|---|---|---|---|---|---|---|---|---|---|---|---|---|---|---|
| Engine load [%] ** | 25 | 50 | 75 | 100 | 25 | 50 | 75 | 100 | 25 | 50 | 75 | 100 | 25 | 50 | 75 | 100 | |
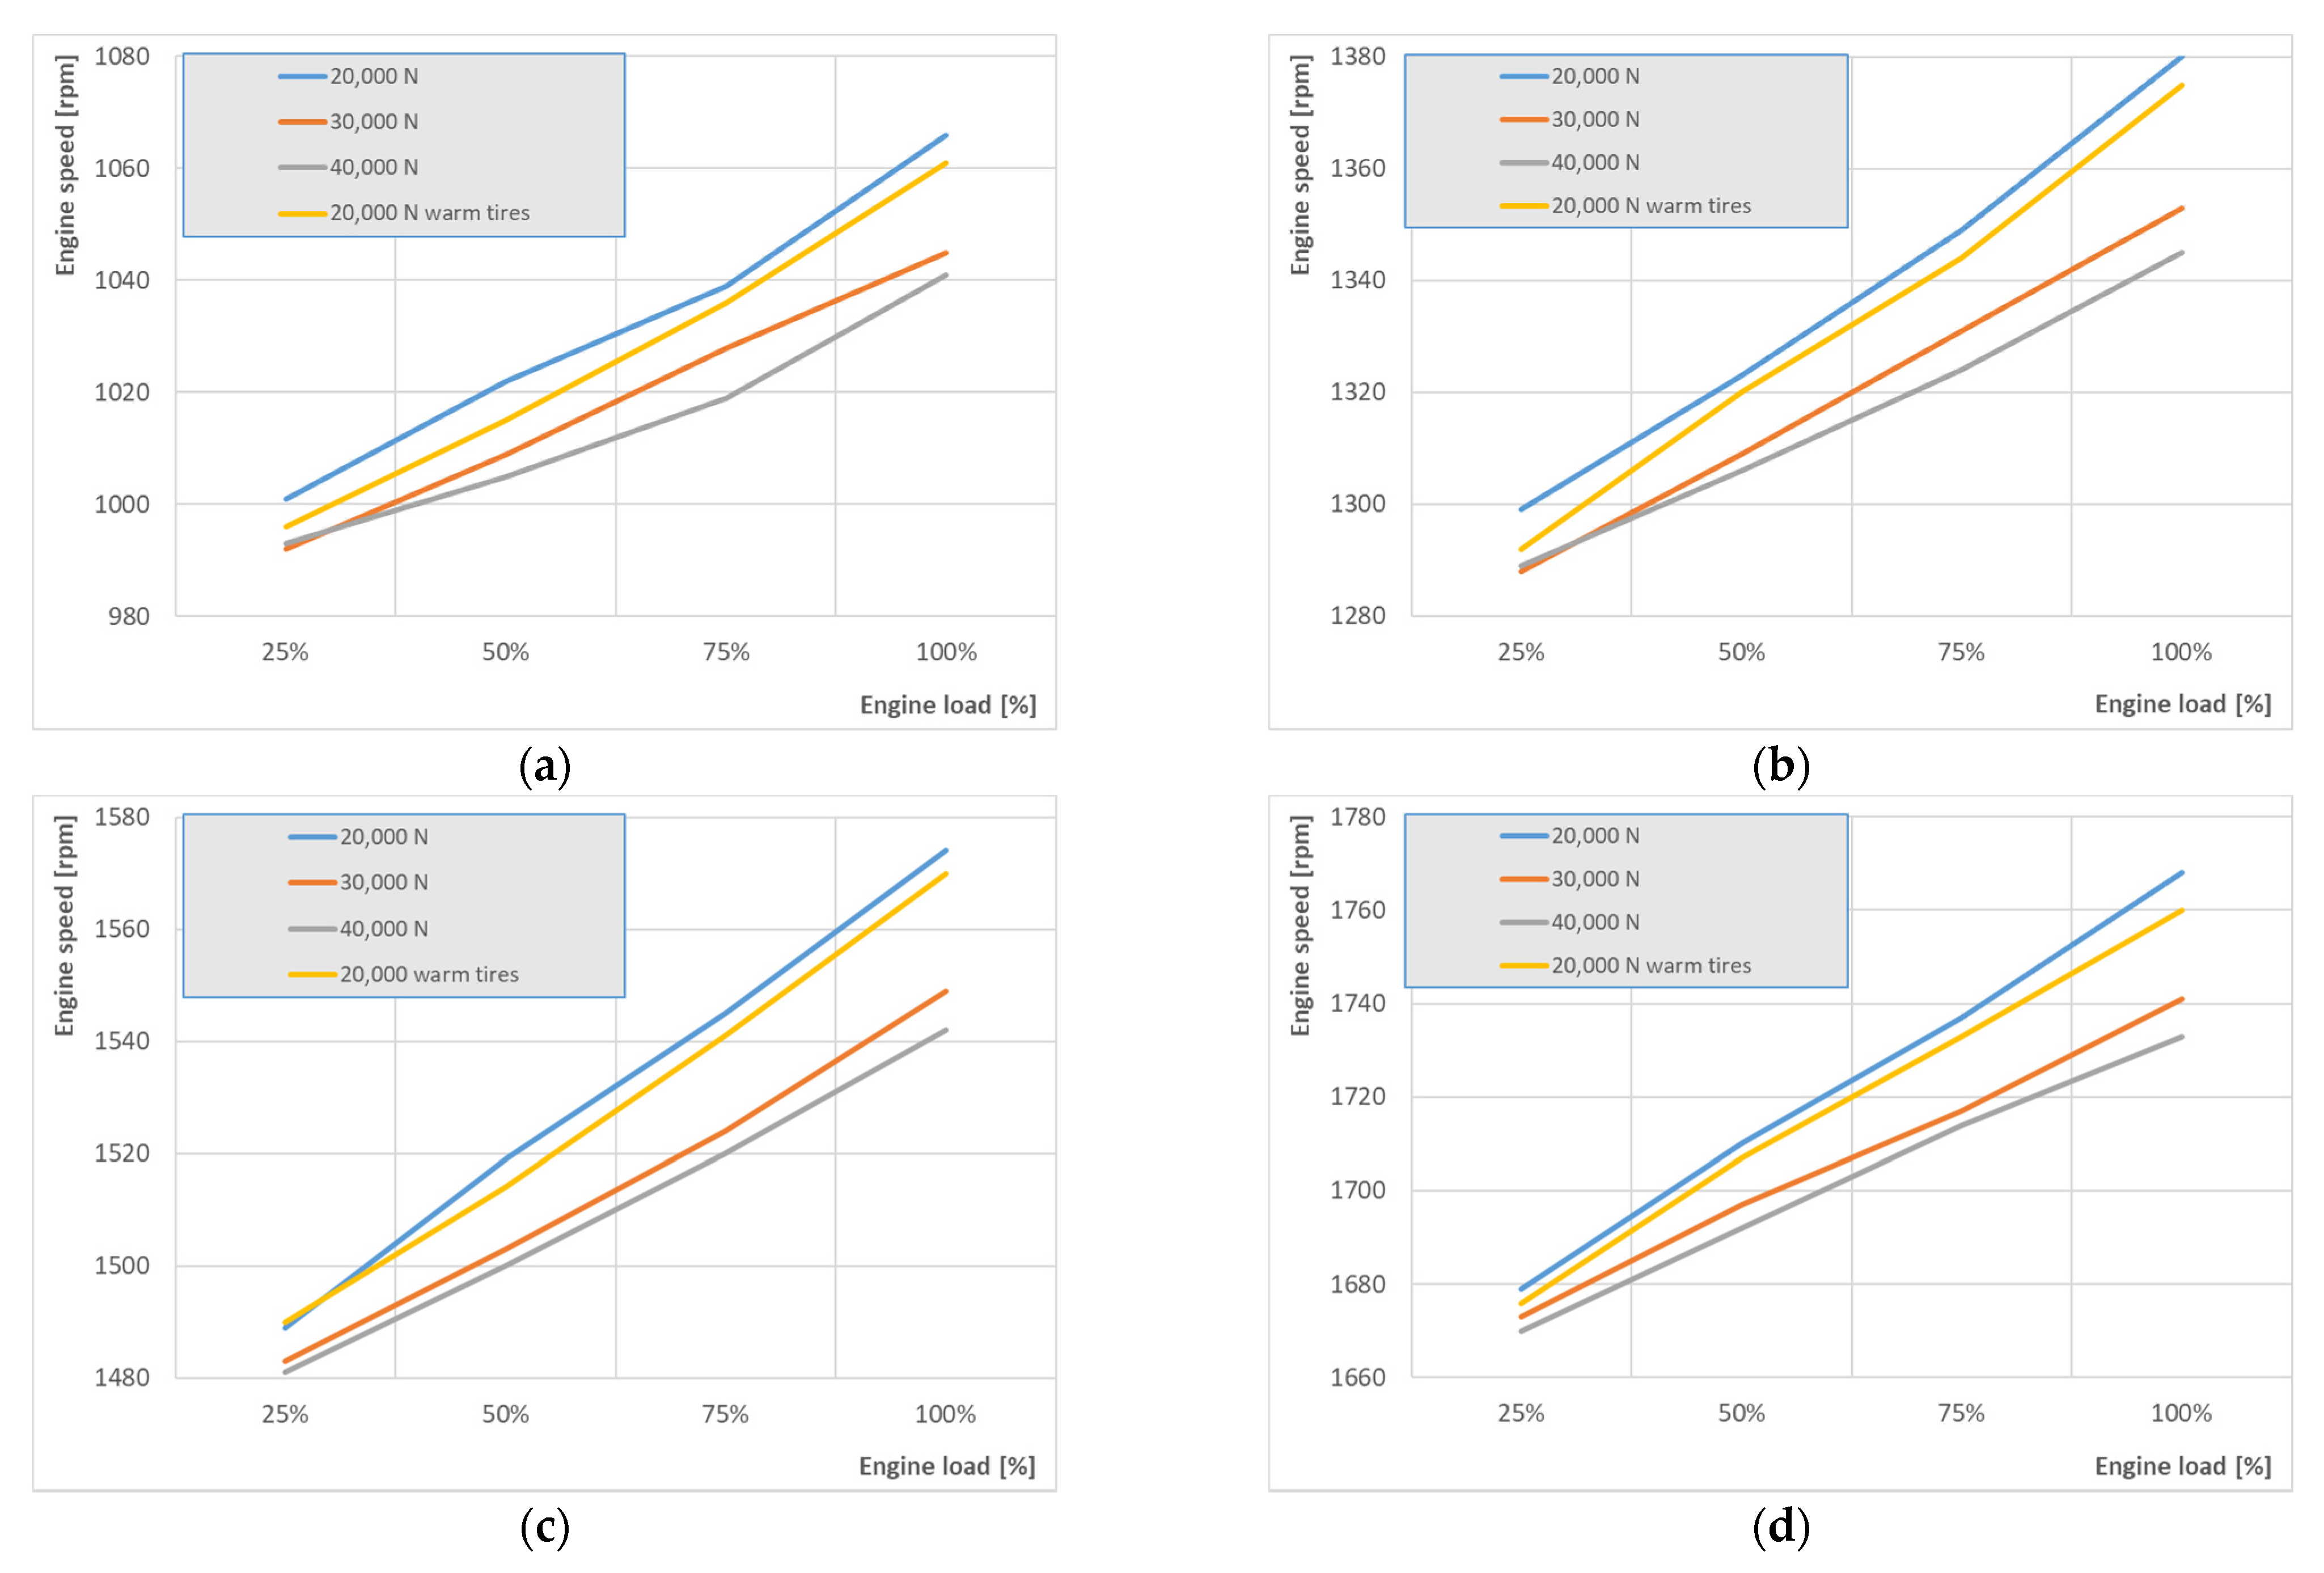
| RPM—TEXA ** | 1001 | 1022 | 1039 | 1066 | 1299 | 1323 | 1349 | 1380 | 1489 | 1519 | 1545 | 1574 | 1679 | 1710 | 1737 | 1768 | 20,000 N |
| Dyno (Nm) *** | 192 | 585 | 935 | 1310 | 180 | 540 | 886 | 1275 | 122 | 473 | 799 | 1110 | 78 | 400 | 700 | 970 | |
| RPM—TEXA ** | 992 | 1009 | 1028 | 1045 | 1288 | 1309 | 1331 | 1353 | 1483 | 1503 | 1524 | 1549 | 1673 | 1697 | 1717 | 1741 | 30,000 N |
| Dyno (Nm) *** | 192 | 560 | 917 | 1293 | 190 | 549 | 870 | 1250 | 140 | 467 | 790 | 1117 | 63 | 370 | 688 | 972 | |
| RPM—TEXA ** | 993 | 1005 | 1019 | 1041 | 1289 | 1306 | 1324 | 1345 | 1481 | 1500 | 1520 | 1542 | 1670 | 1692 | 1714 | 1733 | 40,000 N |
| Dyno (Nm) *** | 195 | 565 | 920 | 1280 | 208 | 545 | 880 | 1250 | 163 | 480 | 790 | 1125 | 74 | 389 | 700 | 965 | |
| RPM—TEXA ** | 996 | 1015 | 1036 | 1061 | 1292 | 1320 | 1344 | 1375 | 1490 | 1514 | 1541 | 1570 | 1676 | 1707 | 1733 | 1760 | 20,000 N (warm tires) ***** |
| Dyno (Nm) *** | 192 | 583 | 918 | 1315 | 214 | 559 | 908 | 1279 | 160 | 480 | 810 | 1130 | 80 | 405 | 710 | 970 | |
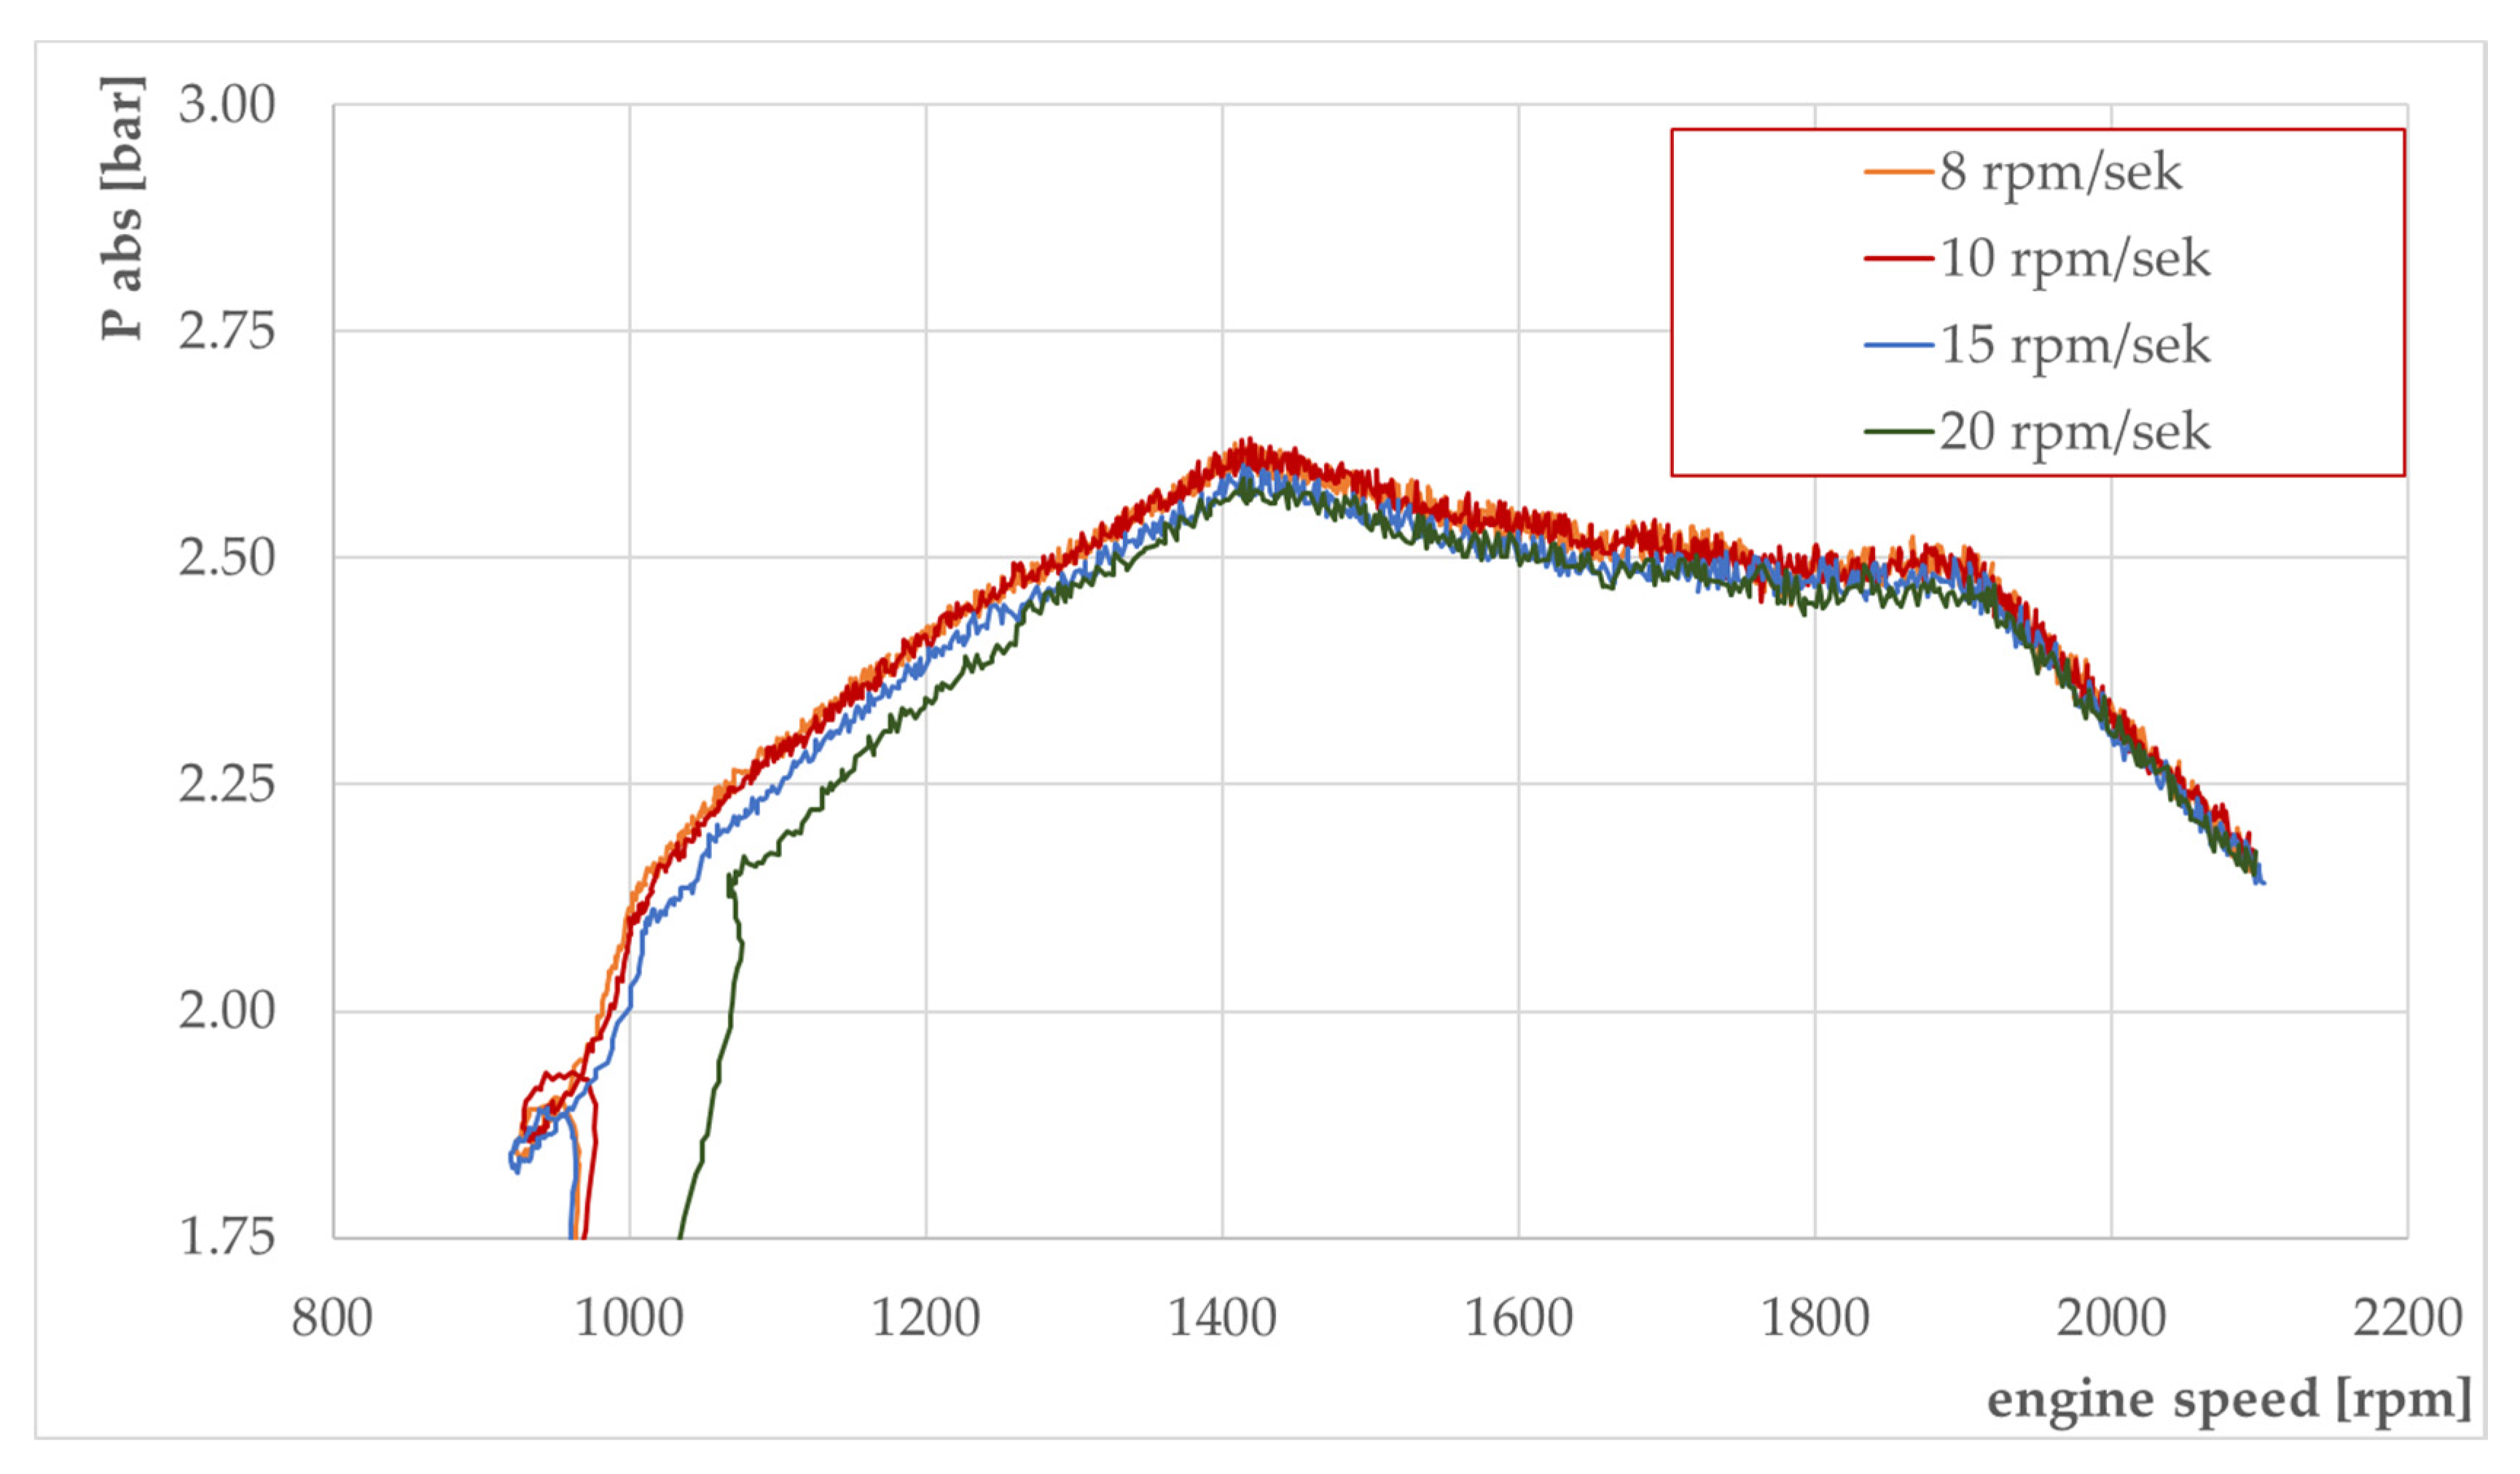
3.4. Selection of the Optimal Operating Mode of the Chassis Dynamometer
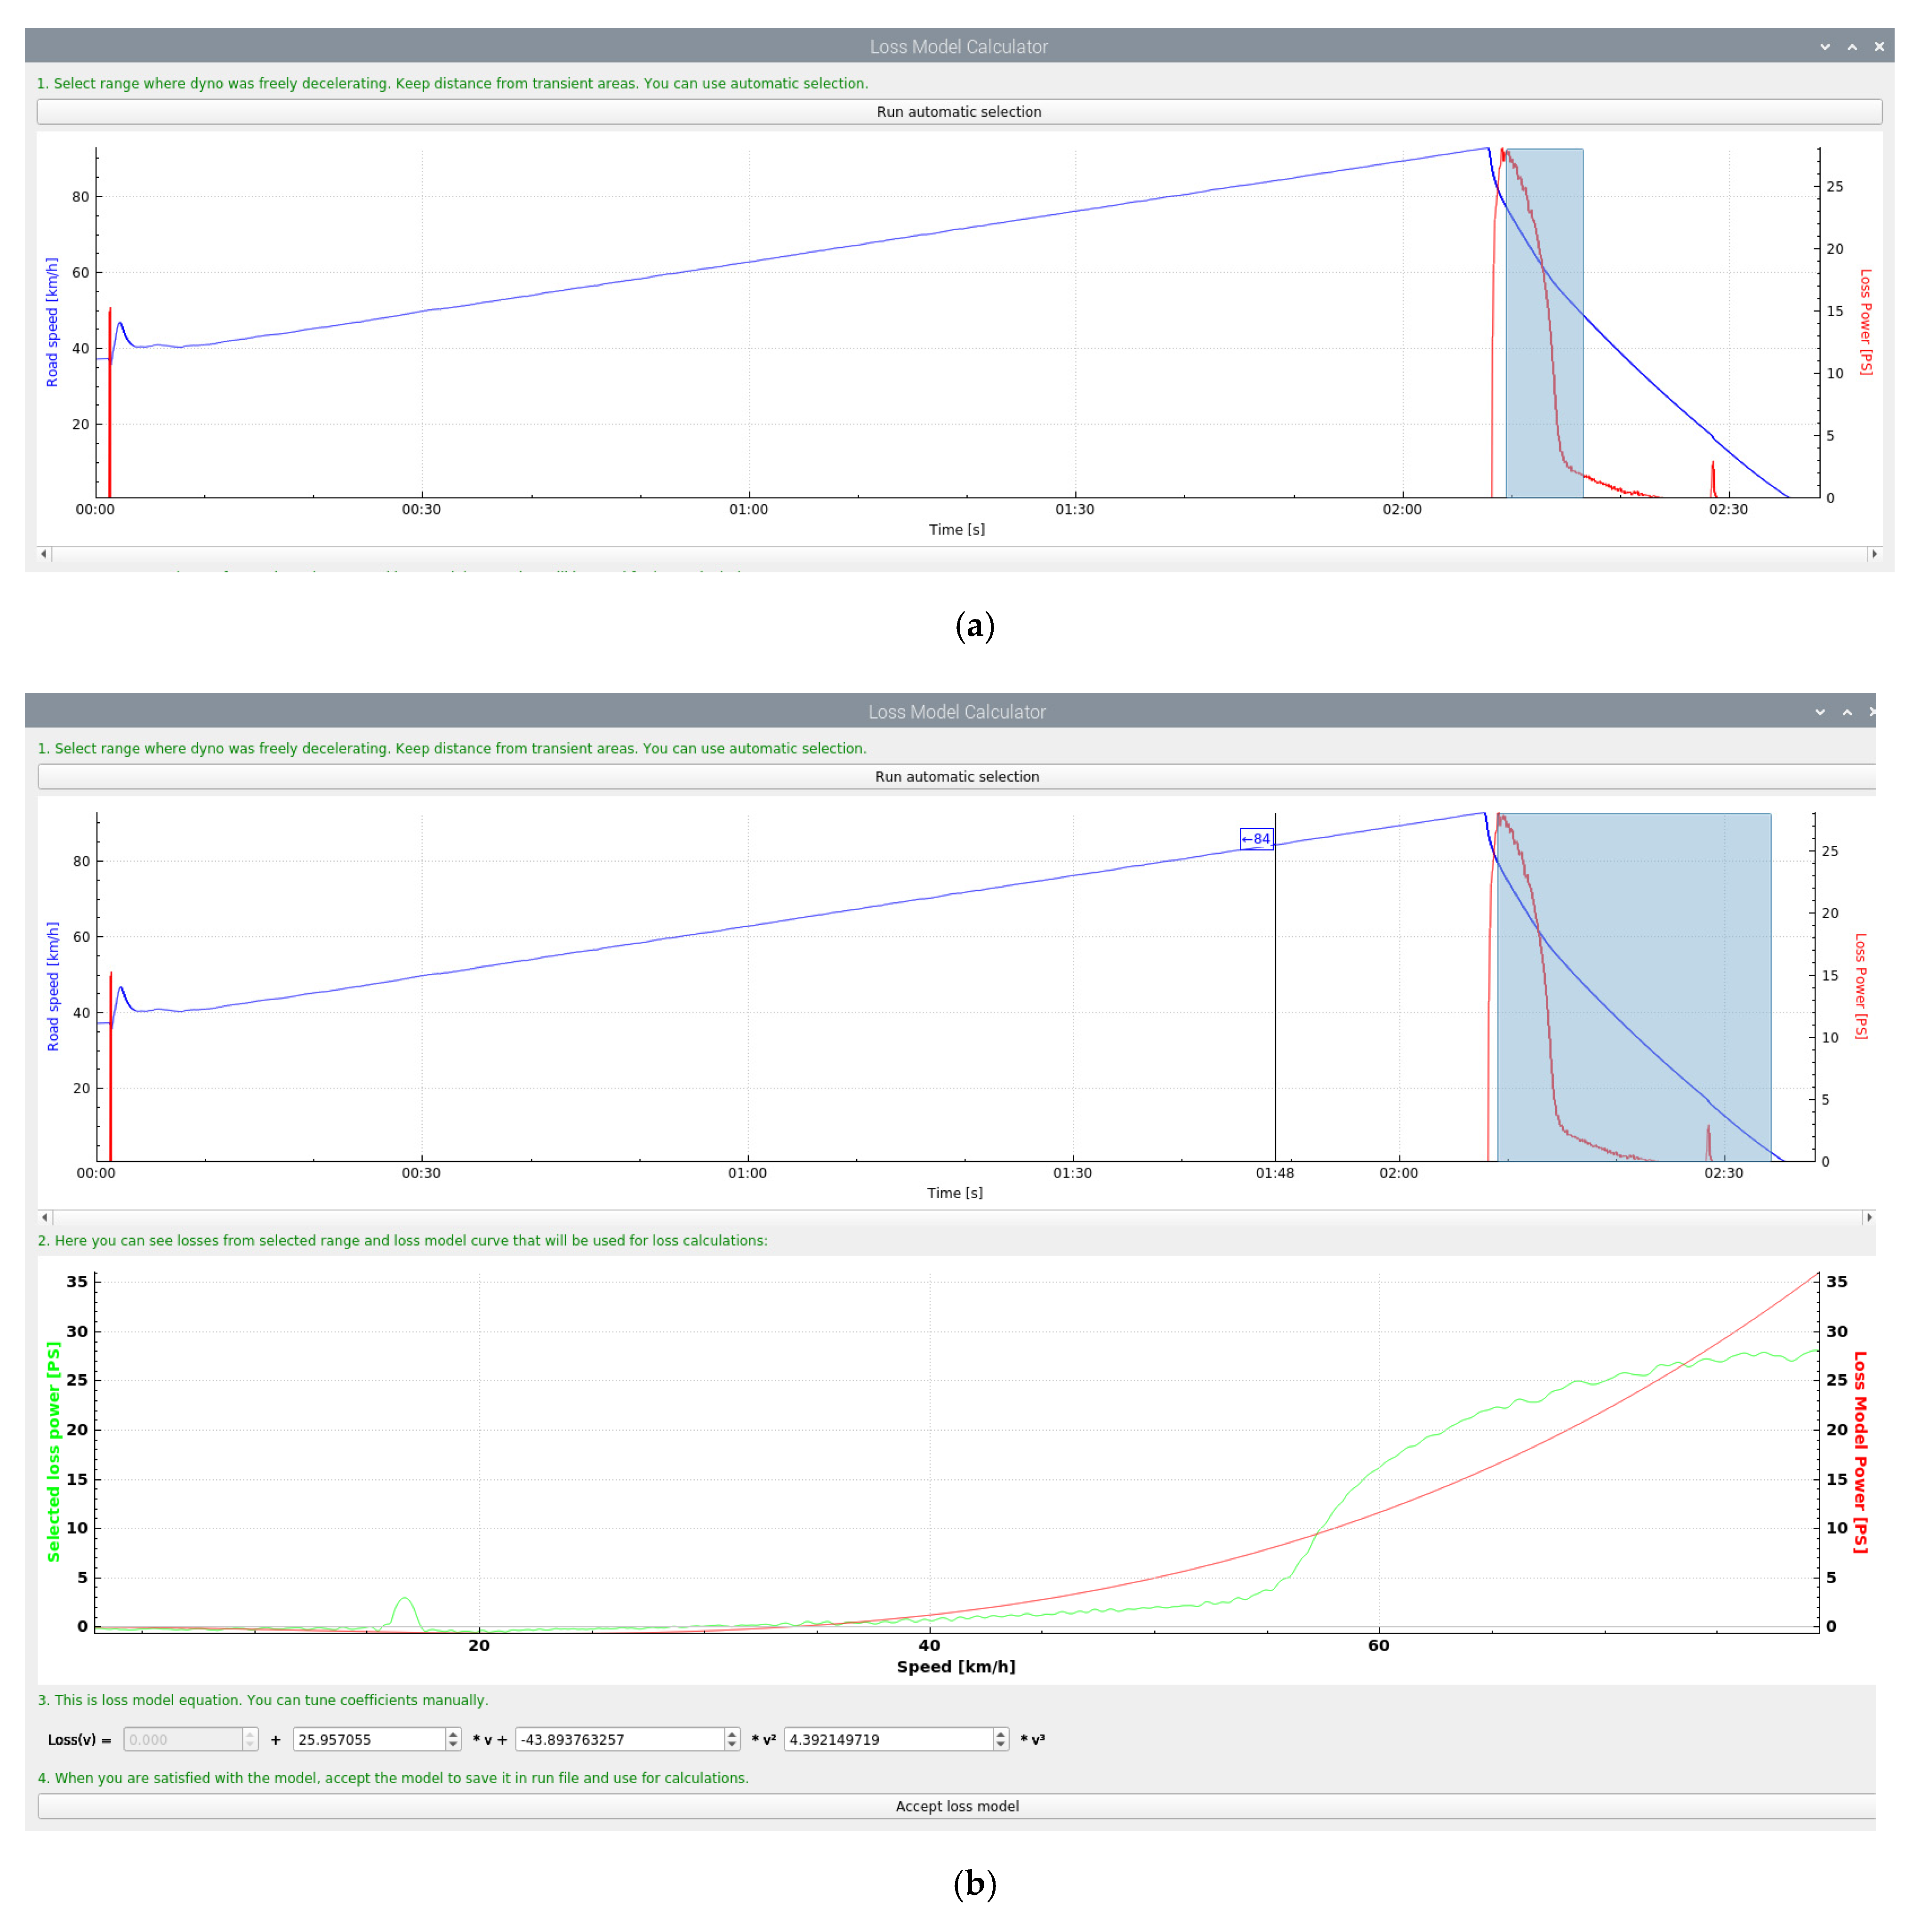
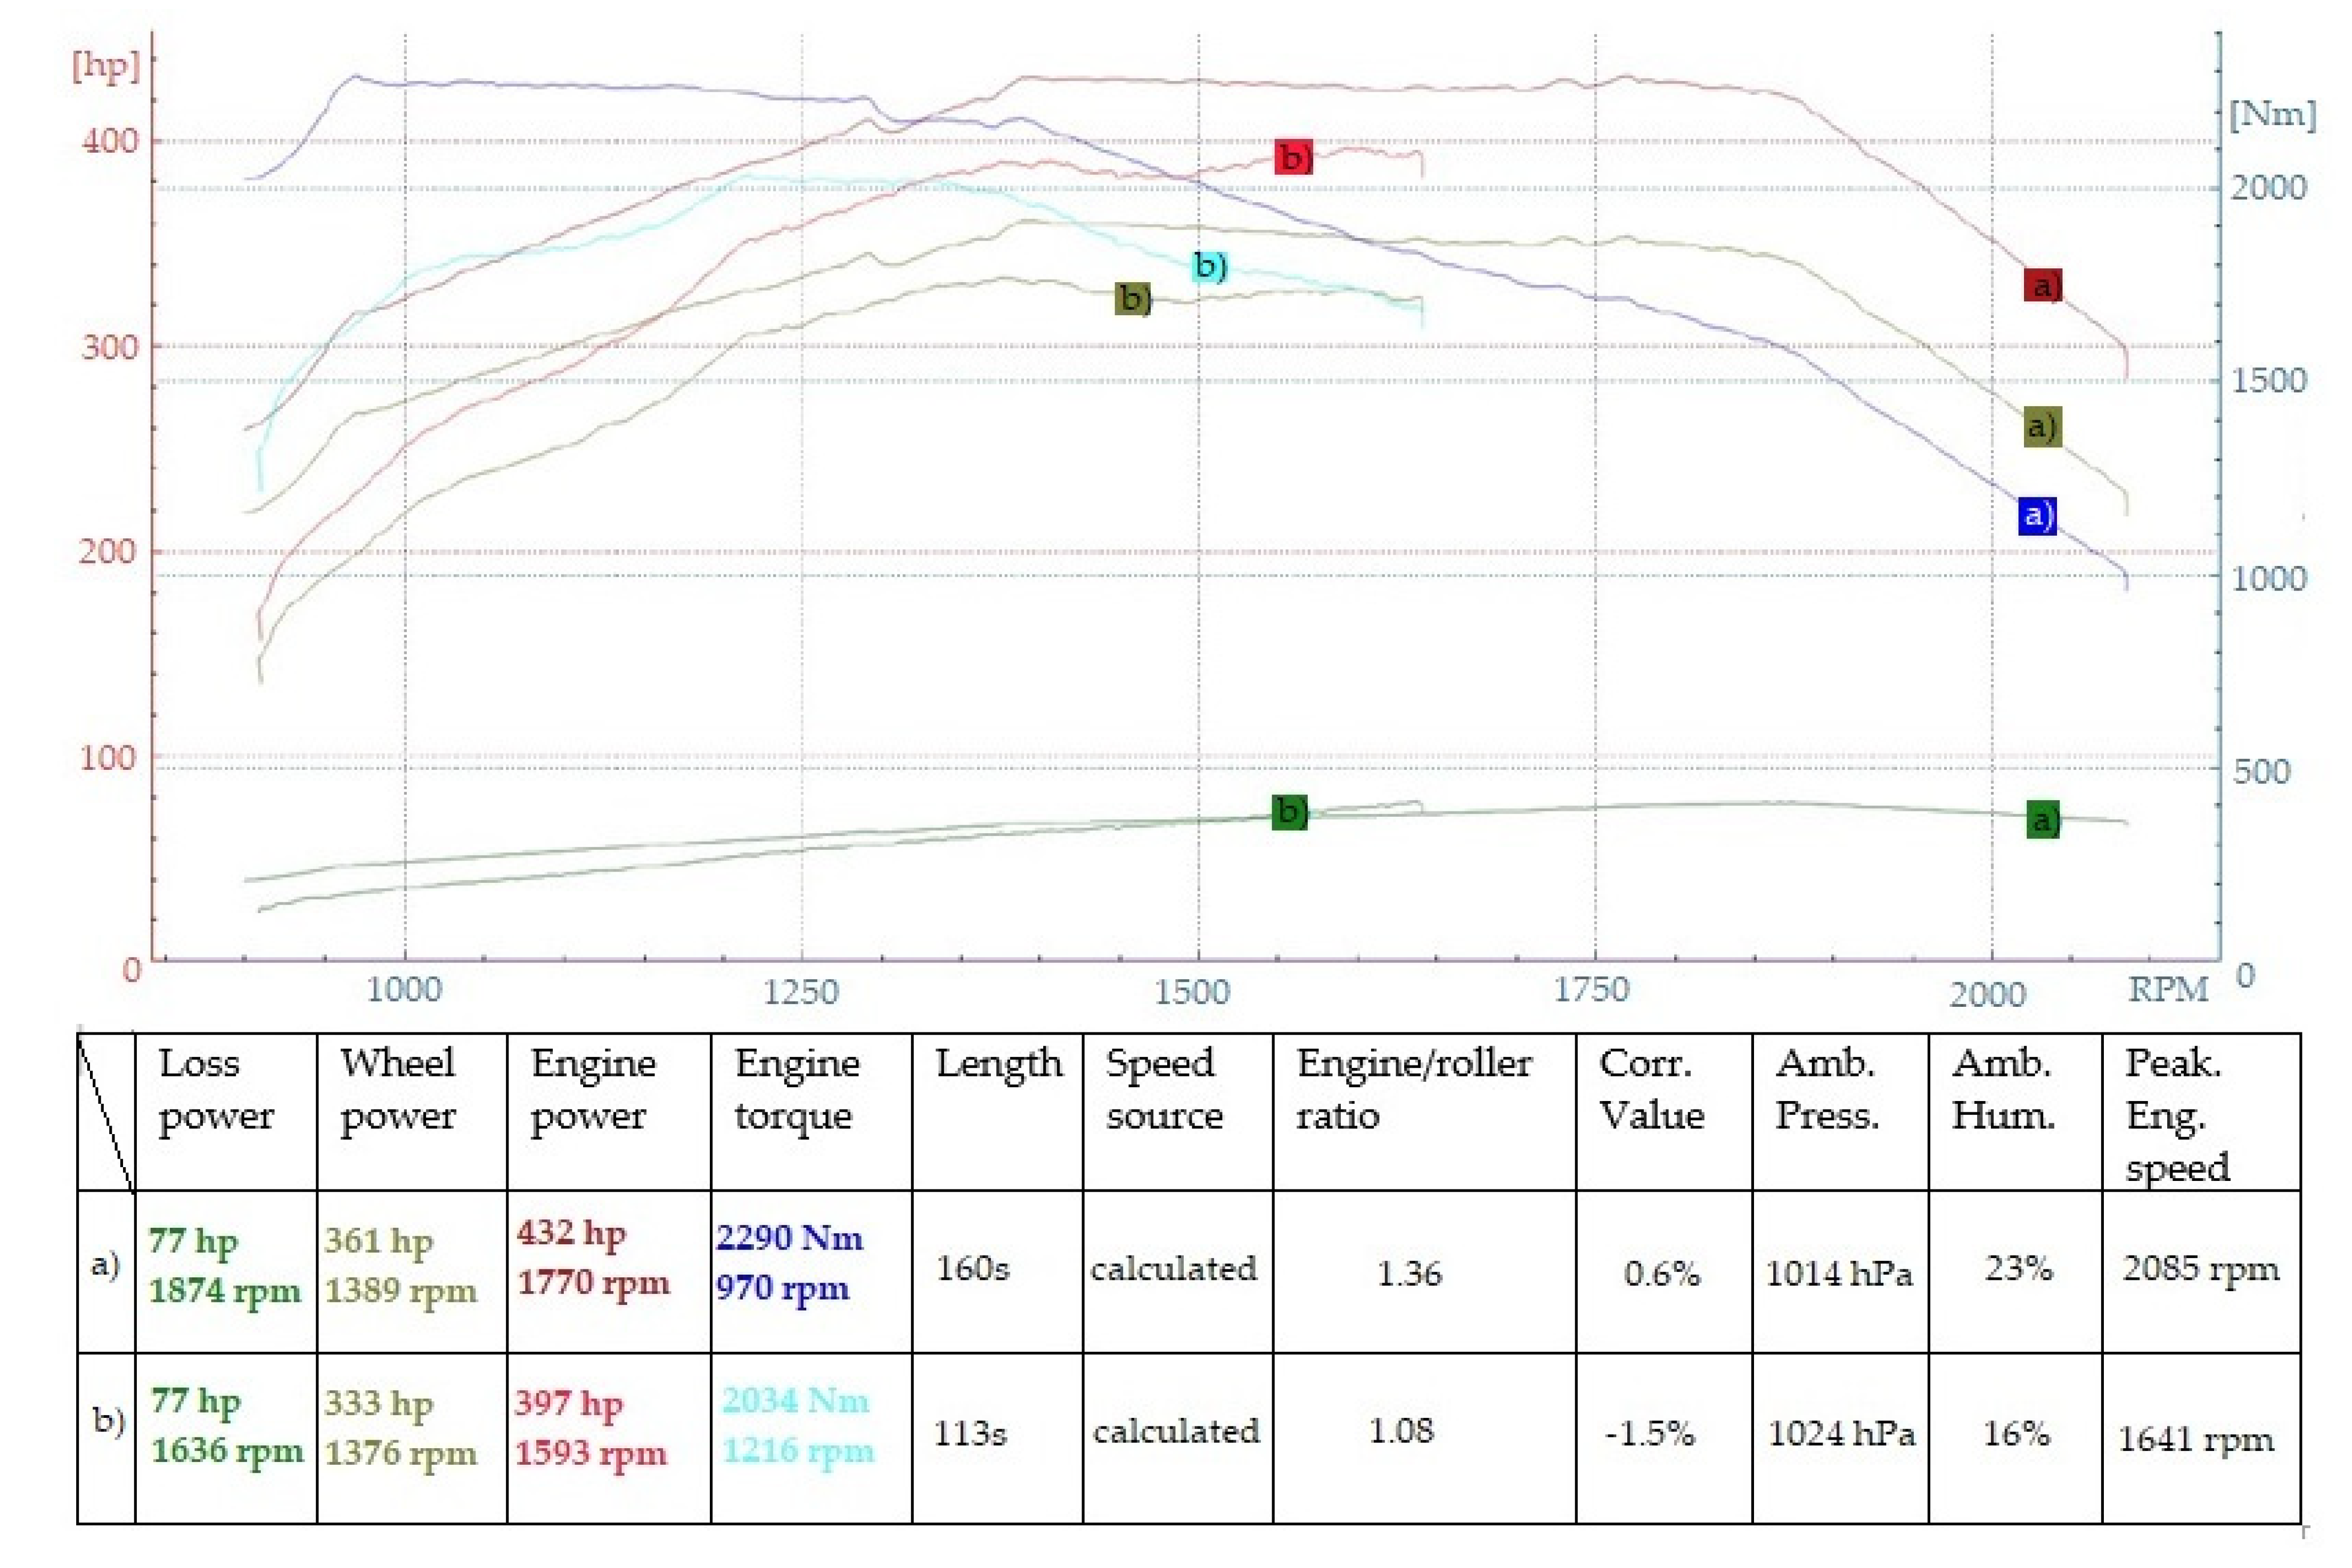
3.5. The Impact of the Correctness of the Selection of the Scope of the Analysis of Data on Losses in the Drive System and Repeatability of Tests
4. Discussion
5. Conclusions
Author Contributions
Funding
Institutional Review Board Statement
Informed Consent Statement
Data Availability Statement
Conflicts of Interest
References
- Hancock, B. Dyno Testing and Tuning (Performance How-To); S-A Design: Santa Fe, NM, USA, 31 July 2020. [Google Scholar]
- Yogeeswaran, R.; Subramaniom, S.; Senthil Krishnan, S. Establishment of Chassis Dynamometers for Commercial Vehicles; SAE International: Warrendale, PA, USA, 2019. [Google Scholar]
- Gazeo.pl. Available online: https://gazeo.pl/biznes/warsztat/Kalibracja-instalacji-LPG-z-wykorzystaniem-hamowni,artykul,6292.html (accessed on 26 May 2022).
- Dziubak, T.; Bąkała, L.; Karczewski, M.; Tomaszewski, M. Numerical research on vortex tube separator for special vehicle engine inlet air filter. Sep. Purif. Technol. 2020, 237, 116463. [Google Scholar] [CrossRef]
- 4GCS Tuning. Available online: http://gcstuning.pl/strojenie-lpg/ (accessed on 29 May 2022).
- 544 tuning. Available online: https://44tuning.pl/tuning-lpg-wieksza-moc-na-gazie-niz-benzynie-wysoko-oktanowej (accessed on 28 May 2022).
- Heywood, J.B. Internal Combustion Engine Fundamentals, 2nd ed.; McGraw-Hill Education: New York, NY, USA, 2018. [Google Scholar]
- Dąbrowski, T.; Kurczyński, D.; Łagowsk, P.; Warianek, M. The scientific analysis of the influence of petrol and LPG gas powered engines dynamic indicators on active road safety. In Proceedings of the 2018 XI International Science-Technical Conference Automotive Safety, Casta, Slovakia, 18–20 April 2018. [Google Scholar]
- Öberg, P.; Nyberg, P.; Nielsen, L. A New Chassis Dynamometer Laboratory for Vehicle Research. SAE Int. J. Passeng. Cars–Electron. Electr. Syst. 2013, 6, 152–161. [Google Scholar] [CrossRef]
- Galindo, E.; Blanco, D.; Brace, C.; Chappell, E.; Burke, R. Chassis Dynamometer Testing: Addressing the Challenges of New GlobalLegislation (WLTP and RDE); SAE International: Warrendale, PA, USA, 2017; ISBN 978-0-7680-8278-4. [Google Scholar]
- Karim, G.A. Dual-Fuel Diesel Engines; CRC Press: New York, NY, USA, 2015. [Google Scholar]
- Volvo Trucks Website. Available online: https://stpi.it.volvo.com/STPIFiles/Volvo/FactSheet/D13C460,%20EU5SCR-M_Eng_02_1144722.pdf (accessed on 30 May 2022).
- Chojnowski, J.; Karczewski, M.; Szamrej, G. The phenomenon of knocking combustion and the impact on the fuel exchange and the output parameters of the diesel engine operating in the dual-fuel mode (Diesel-CNG). In NAŠE MORE 2021; University of Dubrovnik: Dubrovnik, Croatia, 2021; pp. 55–62. [Google Scholar]
- SAE J2951 Drive Quality Evaluation for Chassis Dynamometer Testing J2951_201401 2014. Available online: https://www.sae.org/standards/content/j2951_201401/ (accessed on 16 March 2022).
- Zając, M. Układy Przeniesienia Napędu Samochodów Ciężarowych; Wydawnictwa Komunikacji i Łączności: Warsaw, Poland, 2014; pp. 277–279. [Google Scholar]
- Li, W.; Liu, Z.; Wang, Z. Experimental and theoretical analysis of the combustion process at low loads of a diesel natural gas dual-fuel engine. Energy 2016, 94, 728–741. [Google Scholar] [CrossRef]
- Xiong, X.; Tuononen, A. Rolling deformation of truck tires: Measurement and analysis using a tire sensing approach. J. Terramechanics. 2015, 61, 33–42, ISSN 0022-4898. [Google Scholar] [CrossRef]
- Anghelache, G.; Moisescu, R. The measurement of dynamic radii for passengercar tyre. IOP Conf. Ser. Mater. Sci. Eng. 2017, 252, 012014. [Google Scholar] [CrossRef]
- Technical Data—Pirelli Truck Tyres. Available online: https://www.pirelli.com/asset/index.php?idelement=20899 (accessed on 29 May 2022).
- Kuiken, K. Gas and dual-fuel engines for ship propulsion, power plants and cogeneration. In Book I: Engine Systems and Environment; PJ Onnen.: Antwerp, The Netherlands, 2016. [Google Scholar]
- Luft, S. Dwupaliwowy Silnik o Zapłonie Samoczynnym Zasilany Mieszaniną Gazów Propan-Butan (LPG) I Olejem Napędo-Wym; Monografie; Politechnika Radmska, Wydawnictwo: Radom, Poland, 2002; pp. 22–24. [Google Scholar]
- Dziubak, T. The effects of dust extraction on multi-cyclone and non-woven fabric panel filter performance in the air filters used in special vehicles. Eksploat. I Niezawodn. Maint. Reliab. 2016, 18, 348–357. [Google Scholar] [CrossRef]
- Pielecha, J. Badania Emisji Zanieczyszczeń Silników Spalinowych; WPP: Poznań, Poland, 2017; pp. 155–162. [Google Scholar]
- Bielaczyc, P.; Klimkiewicz, D.; Woodburn, J.; Szczotka, A. Exhaust Emission Testing Methods–Bosmal’s Legislative and Develop-ment Emission Testing Laboratories. Combust. Engines 2019, 178, 88–98. [Google Scholar] [CrossRef]
- Karczewski, M.; Wieczorek, M. Assessment of the Impact of Applying a Non-Factory Dual-Fuel (Diesel/Natural Gas) Installation on the Traction Properties and Emissions of Selected Exhaust Components of a Road Semi-Trailer Truck Unit. Energies 2021, 14, 8001. [Google Scholar] [CrossRef]


| Parameter | Value/Name/Type |
|---|---|
| Mode of Operation | Load Type |
| Brakes type | Frenelsa FF16—eddy current 2 × 3300 (Nm) |
| Number of measuring axle | 1 |
| Max/min wheel track | 2700/1000 (mm) |
| Rollers diameter | 320 (mm) |
| Minimum wheel diameter | 700 (mm) |
| Maximum load on the measuring axle | 15,000 (kg) |
| V-max | 200 (km/h) |
| Maximum measurement error | 1 (%) |
| Permissible ambient temperature (operation) | od−10 do +30 (°C) |
| Permissible ambient temperature (storage) | od −40 do +50 (°C) |
| Mechanical synchronization of rotational speed of dynamometer rollers | Yes |
| Parameter | Value/Name/Type |
|---|---|
| Vehicle Brand/Model/Year of Production | Volvo/FH13/2014 |
| Engine type | Turbodiesel, D13C460, EU5SCR-M |
| Engine displacement/Number of cylinders/ Cylinder diameter/Piston stroke/ Compression ratio | 12.8 L/6 cylinders/131 mm/158 mm/17.8:1 |
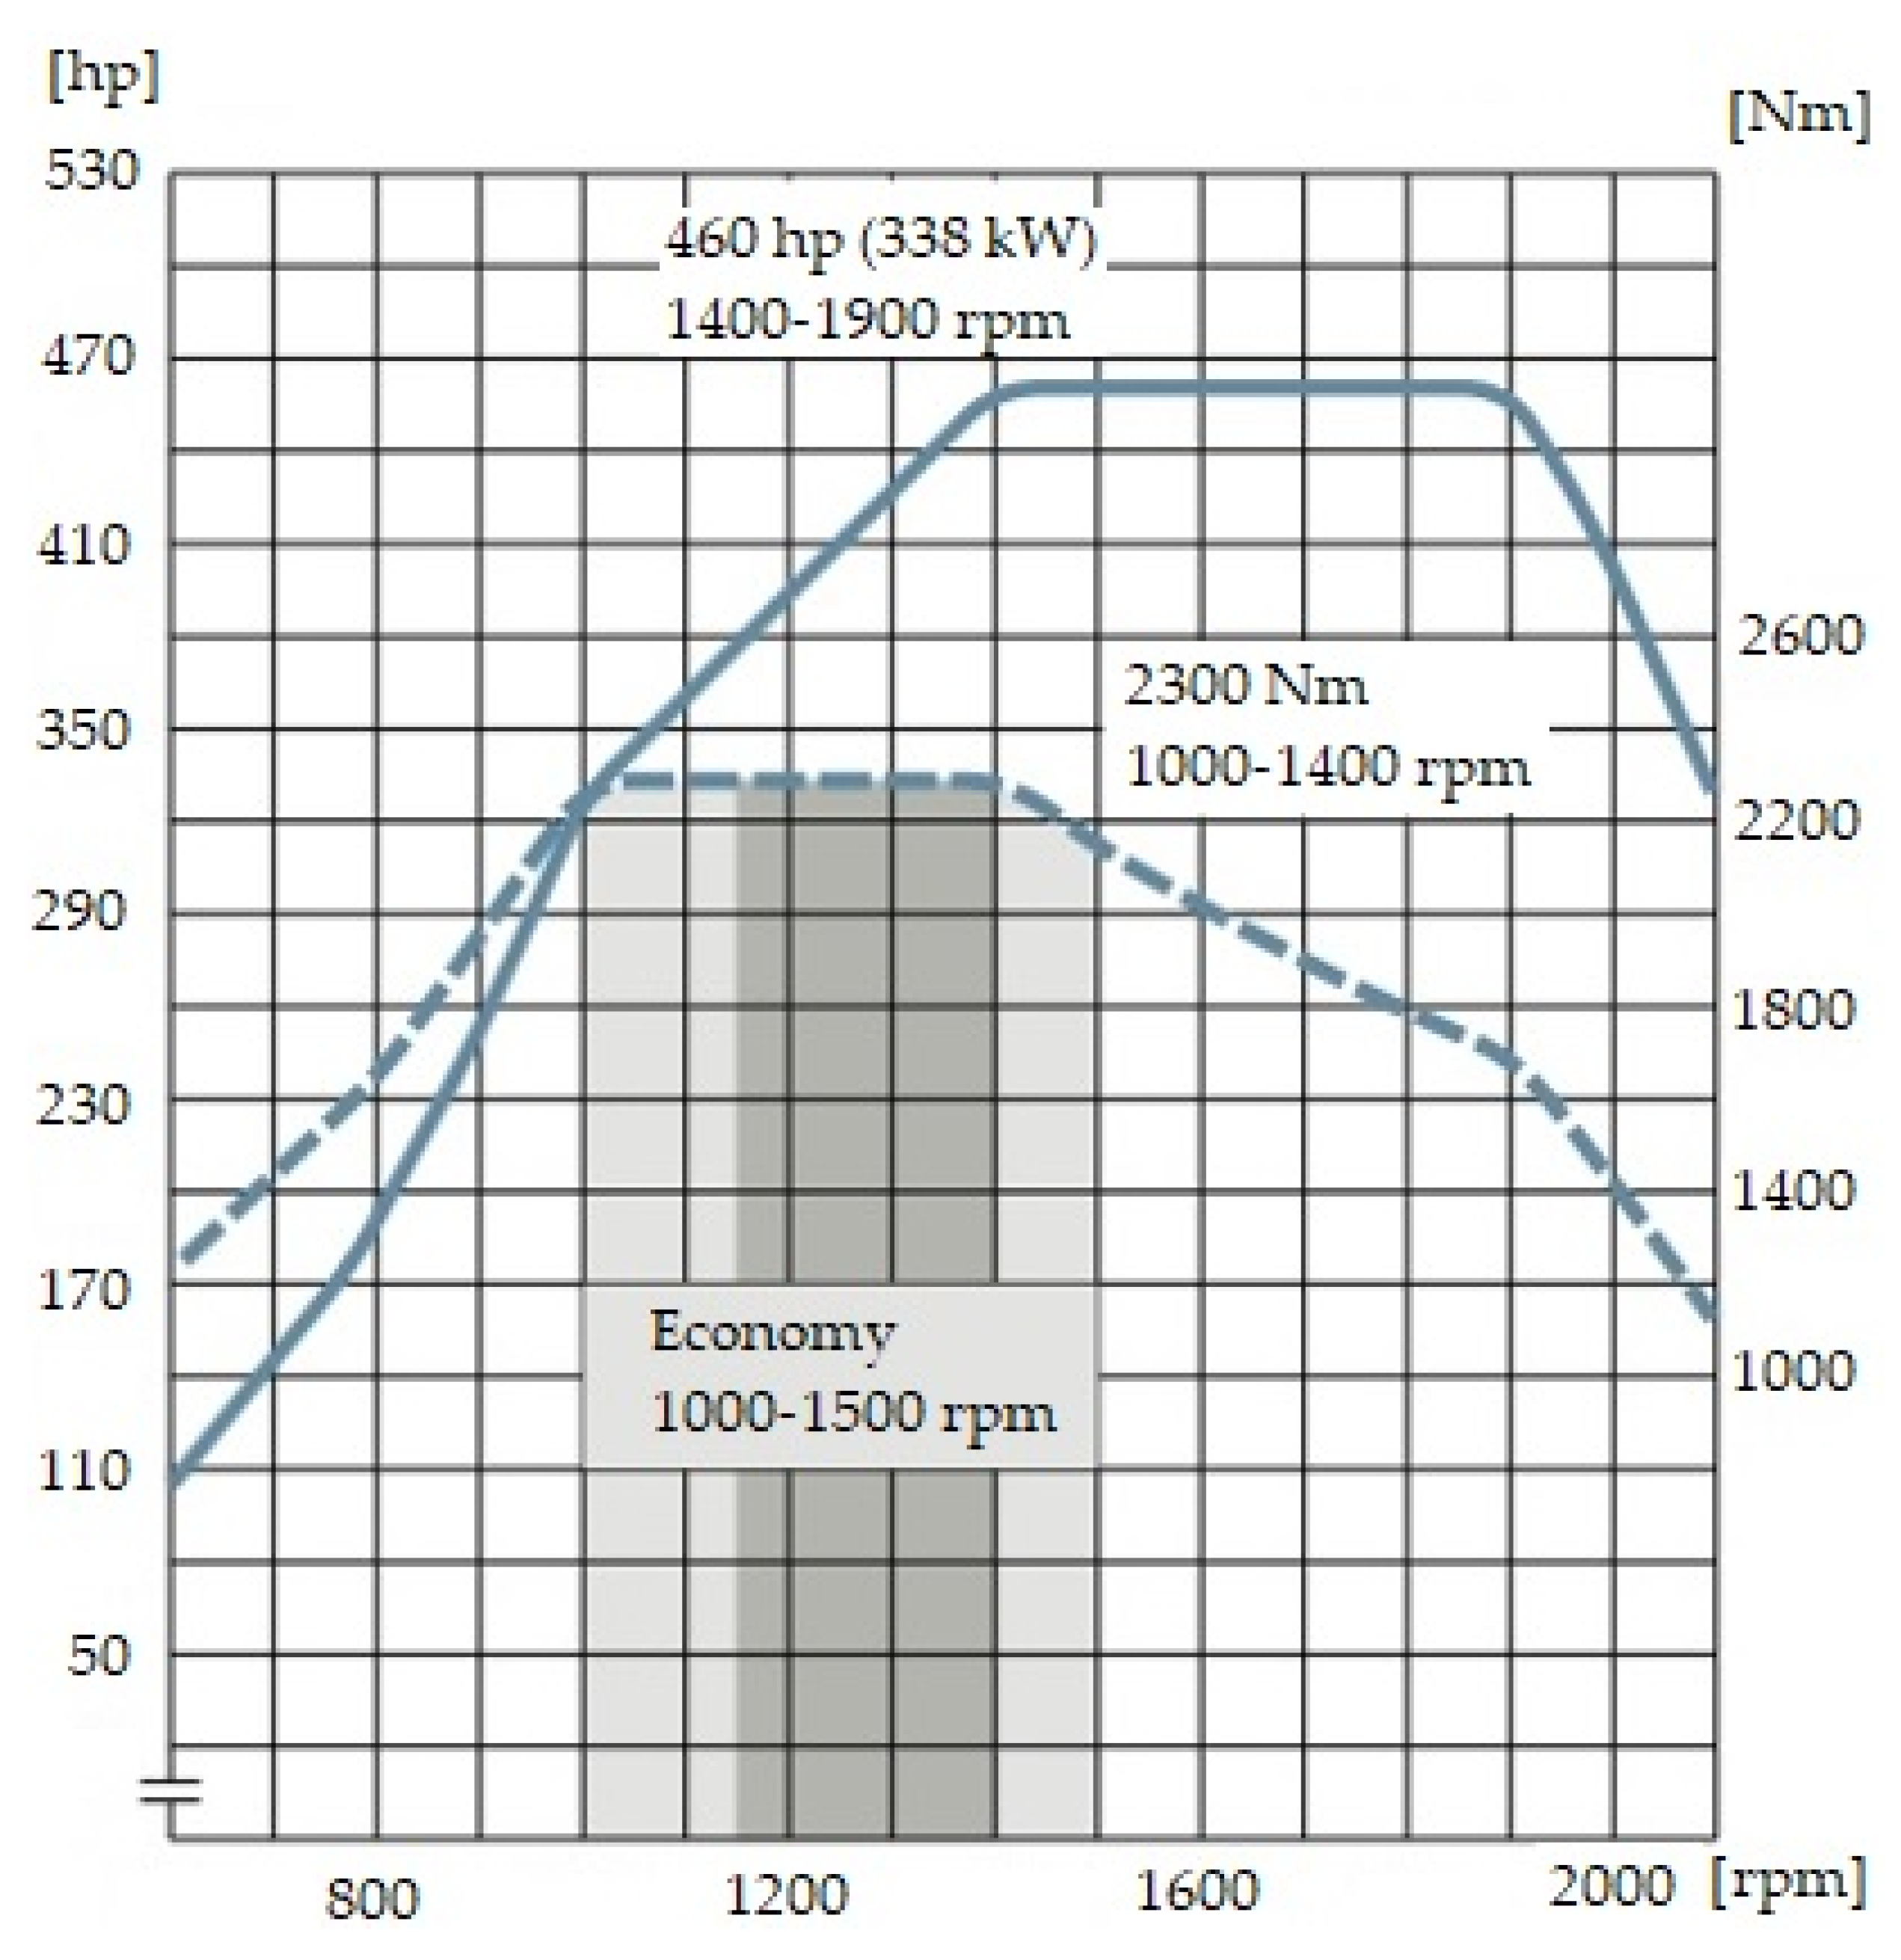
| Max power | 460 hp (338 kW) at 1400–1900 rpm |
| Max engine speed | 2100 RPM |
| Economic speed | 1000–1500 RPM |
| Optimal speed range | 1150–1400 RPM |
| Gearbox type | VTO2214B, Automatic with manual selection |
| Number of gears | 14 gears |
| Parameter | Value/Name/Type |
|---|---|
| Time [s] | Time from the Beginning of the Mileage Recording, the Basis of the Recorded Mileage |
| Engine speed [RPM] | Engine’s crank speed registered by gas supply controller |
| Instantaneous CNG consumption [kg/h] | Gas mass fed to the inlet manifold, |
| Instantaneous diesel oil consumption [kg/h] | Instant consumption of diesel oil—diesel mass fed to the cylinders |
| Diesel actual [%] | Actual instant share of diesel oil in the dose of fuel delivered to the engine |
| Diesel averaged [%] | The average periodic share of diesel oil in the fuel dose delivered to the engine |
| Diesel dose [mg] | Instantaneous dose of diesel fuel delivered to one cylinder for one work cycle |
| Gas time [ms] | Instantaneous gas injector opening time for one/particular cylinder for one work cycle |
| Calculated gas time [ms] | Instantaneous gas injector opening time for one/particular cylinder for one work cycle after taking into account the correction parameters |
| Temp. reducer [°C] | Temperature of the gas pressure reducer |
| MAP pressure [bar] | Air pressure in the intake manifold |
| Gas pressure [bar] | Gas pressure on the gas pressure reducer |
| Pressure on gas rail [bar] | Gas pressure on the injection rail |
| Lambda | Signal from the oxygen concentration sensor in the exhaust gas—lambda probe |
| System faults | Monitor of faults generated by the gas supply system |
| Parameter | Value/Name/Type |
|---|---|
| Selected Time [s] | Time from the Beginning of the Test |
| Engine/roller speed ratio | Speed transmission ratio—motor/rollers |
| Engine speed [RPM] | Calculated engine speed |
| Engine speed rotational acceleration [RPM/s] | The determined speed of the engine rotational speed change during acceleration |
| Road speed [km/h] | Calculated linear driving speed of vehicle |
| Rollers received power [hp] | The power received on each of the roller |
| Rollers inertial torque [Nm] | The moment of inertia on each of the roller |
| Rollers brakes torque [Nm] | The braking torque for each roller |
| Power on wheels [hp] | Calculated power on vehicle wheels |
| Loss power [hp] | Total power lost resulting from speed changes and load changes |
| Drivetrain inertial power [hp] | Power of inertia of the drive system |
| Engine inertial torque [Nm] | Motor moment of inertia |
| Engine inertial power [hp] | Motor inertia power |
| Engine power [hp] | Calculated engine power |
| Engine corr. power [hp] | Corrected power of the engine |
| Engine torque [Nm] | Engine torque |
| Engine corr. torque [Nm] | Corrected motor torque |
| Exhaust gas temperature [°C] | Exhaust gas temperature measured by external thermocouple |
| Ambient temperature [°C] | Ambient temperature |
| Ambient pressure [hPa] | Measured by the system of the built-in weather station of the dynamometer |
| Ambient humidity [%] | Measured by the system of the built-in weather station of the dynamometer |
| Tire size * | 315/70/R22,5 |
| Used wheels count * | 4 |
| Calculated wheel inertia ** | 16.72 kg·m2 |
| Used wheel inertia ** | 66.87 kg·m2 |
| Inertia transferred to roller ** | 0.66 kg·m2 |
Publisher’s Note: MDPI stays neutral with regard to jurisdictional claims in published maps and institutional affiliations. |
© 2022 by the authors. Licensee MDPI, Basel, Switzerland. This article is an open access article distributed under the terms and conditions of the Creative Commons Attribution (CC BY) license (https://creativecommons.org/licenses/by/4.0/).
Share and Cite
Chojnowski, J.; Karczewski, M. Influence of the Working Parameters of the Chassis Dynamometer on the Assessment of Tuning of Dual-Fuel Systems. Energies 2022, 15, 4869. https://doi.org/10.3390/en15134869
Chojnowski J, Karczewski M. Influence of the Working Parameters of the Chassis Dynamometer on the Assessment of Tuning of Dual-Fuel Systems. Energies. 2022; 15(13):4869. https://doi.org/10.3390/en15134869
Chicago/Turabian StyleChojnowski, Janusz, and Mirosław Karczewski. 2022. "Influence of the Working Parameters of the Chassis Dynamometer on the Assessment of Tuning of Dual-Fuel Systems" Energies 15, no. 13: 4869. https://doi.org/10.3390/en15134869
APA StyleChojnowski, J., & Karczewski, M. (2022). Influence of the Working Parameters of the Chassis Dynamometer on the Assessment of Tuning of Dual-Fuel Systems. Energies, 15(13), 4869. https://doi.org/10.3390/en15134869