1. Introduction
The importance of reducing CO
emissions and dependency on fossil fuels is well known [
1]. A commonly proposed way of reducing CO
emissions from vehicles is electrification. In the mining industry, haul trucks are used to transport ore and overburden in open-pit mines. These trucks are essential for the mining operation to run smoothly, but they are also the class of vehicles in the mining industry that consumes the most fuel in total by a wide margin. There are 51 large haul trucks in Sweden, 35 of which operate in the Aitik mine. Large haul trucks are here defined as trucks having more than 200-tonne payload capacity. For the whole world, the total number of active surface mining trucks with payload capacity above 90 tonnes was 52,200 trucks in 2022 [
2]. At the end of 2012, there were about 3000 mining trucks in the world with a payload capacity above 290 tonnes [
3].
The Aitik mine consumption of 35,000 m
diesel per year is dominated by the haul trucks. That corresponds to about 0.4% of the energy of all petroleum-based fuels used in Sweden [
4]. The total of 35,000 m
diesel per year would also be enough to power about 1500 city buses, which is 30% of the city buses in Sweden [
5]. City buses is here defined as buses of class I which is assumed to have a fuel consumption of 40 L/100 km.
Most large haul trucks are diesel-electric with no onboard traction battery or external power source. In a few places’ worldwide, diesel-electric haul trucks have been used in conjunction with external power from overhead trolley lines [
6,
7,
8]. This is similar to the way electric trains operate. In the mining industry, this is often referred to as trolley power. In this article, the more generic term electric road system (ERS) is used. Electric road systems (ERS) have recently received more attention for possible use on public roads [
9,
10,
11]. Such electric road systems are installed on steep uphill ramps to reduce diesel consumption and increase speed when climbing the ramps. On other parts of the drive cycle, these trucks are only powered by the diesel engine, in the same way as other diesel-electrically haul trucks.
Various hybridization concepts without ERS have also been investigated, e.g., in [
12,
13,
14,
15].
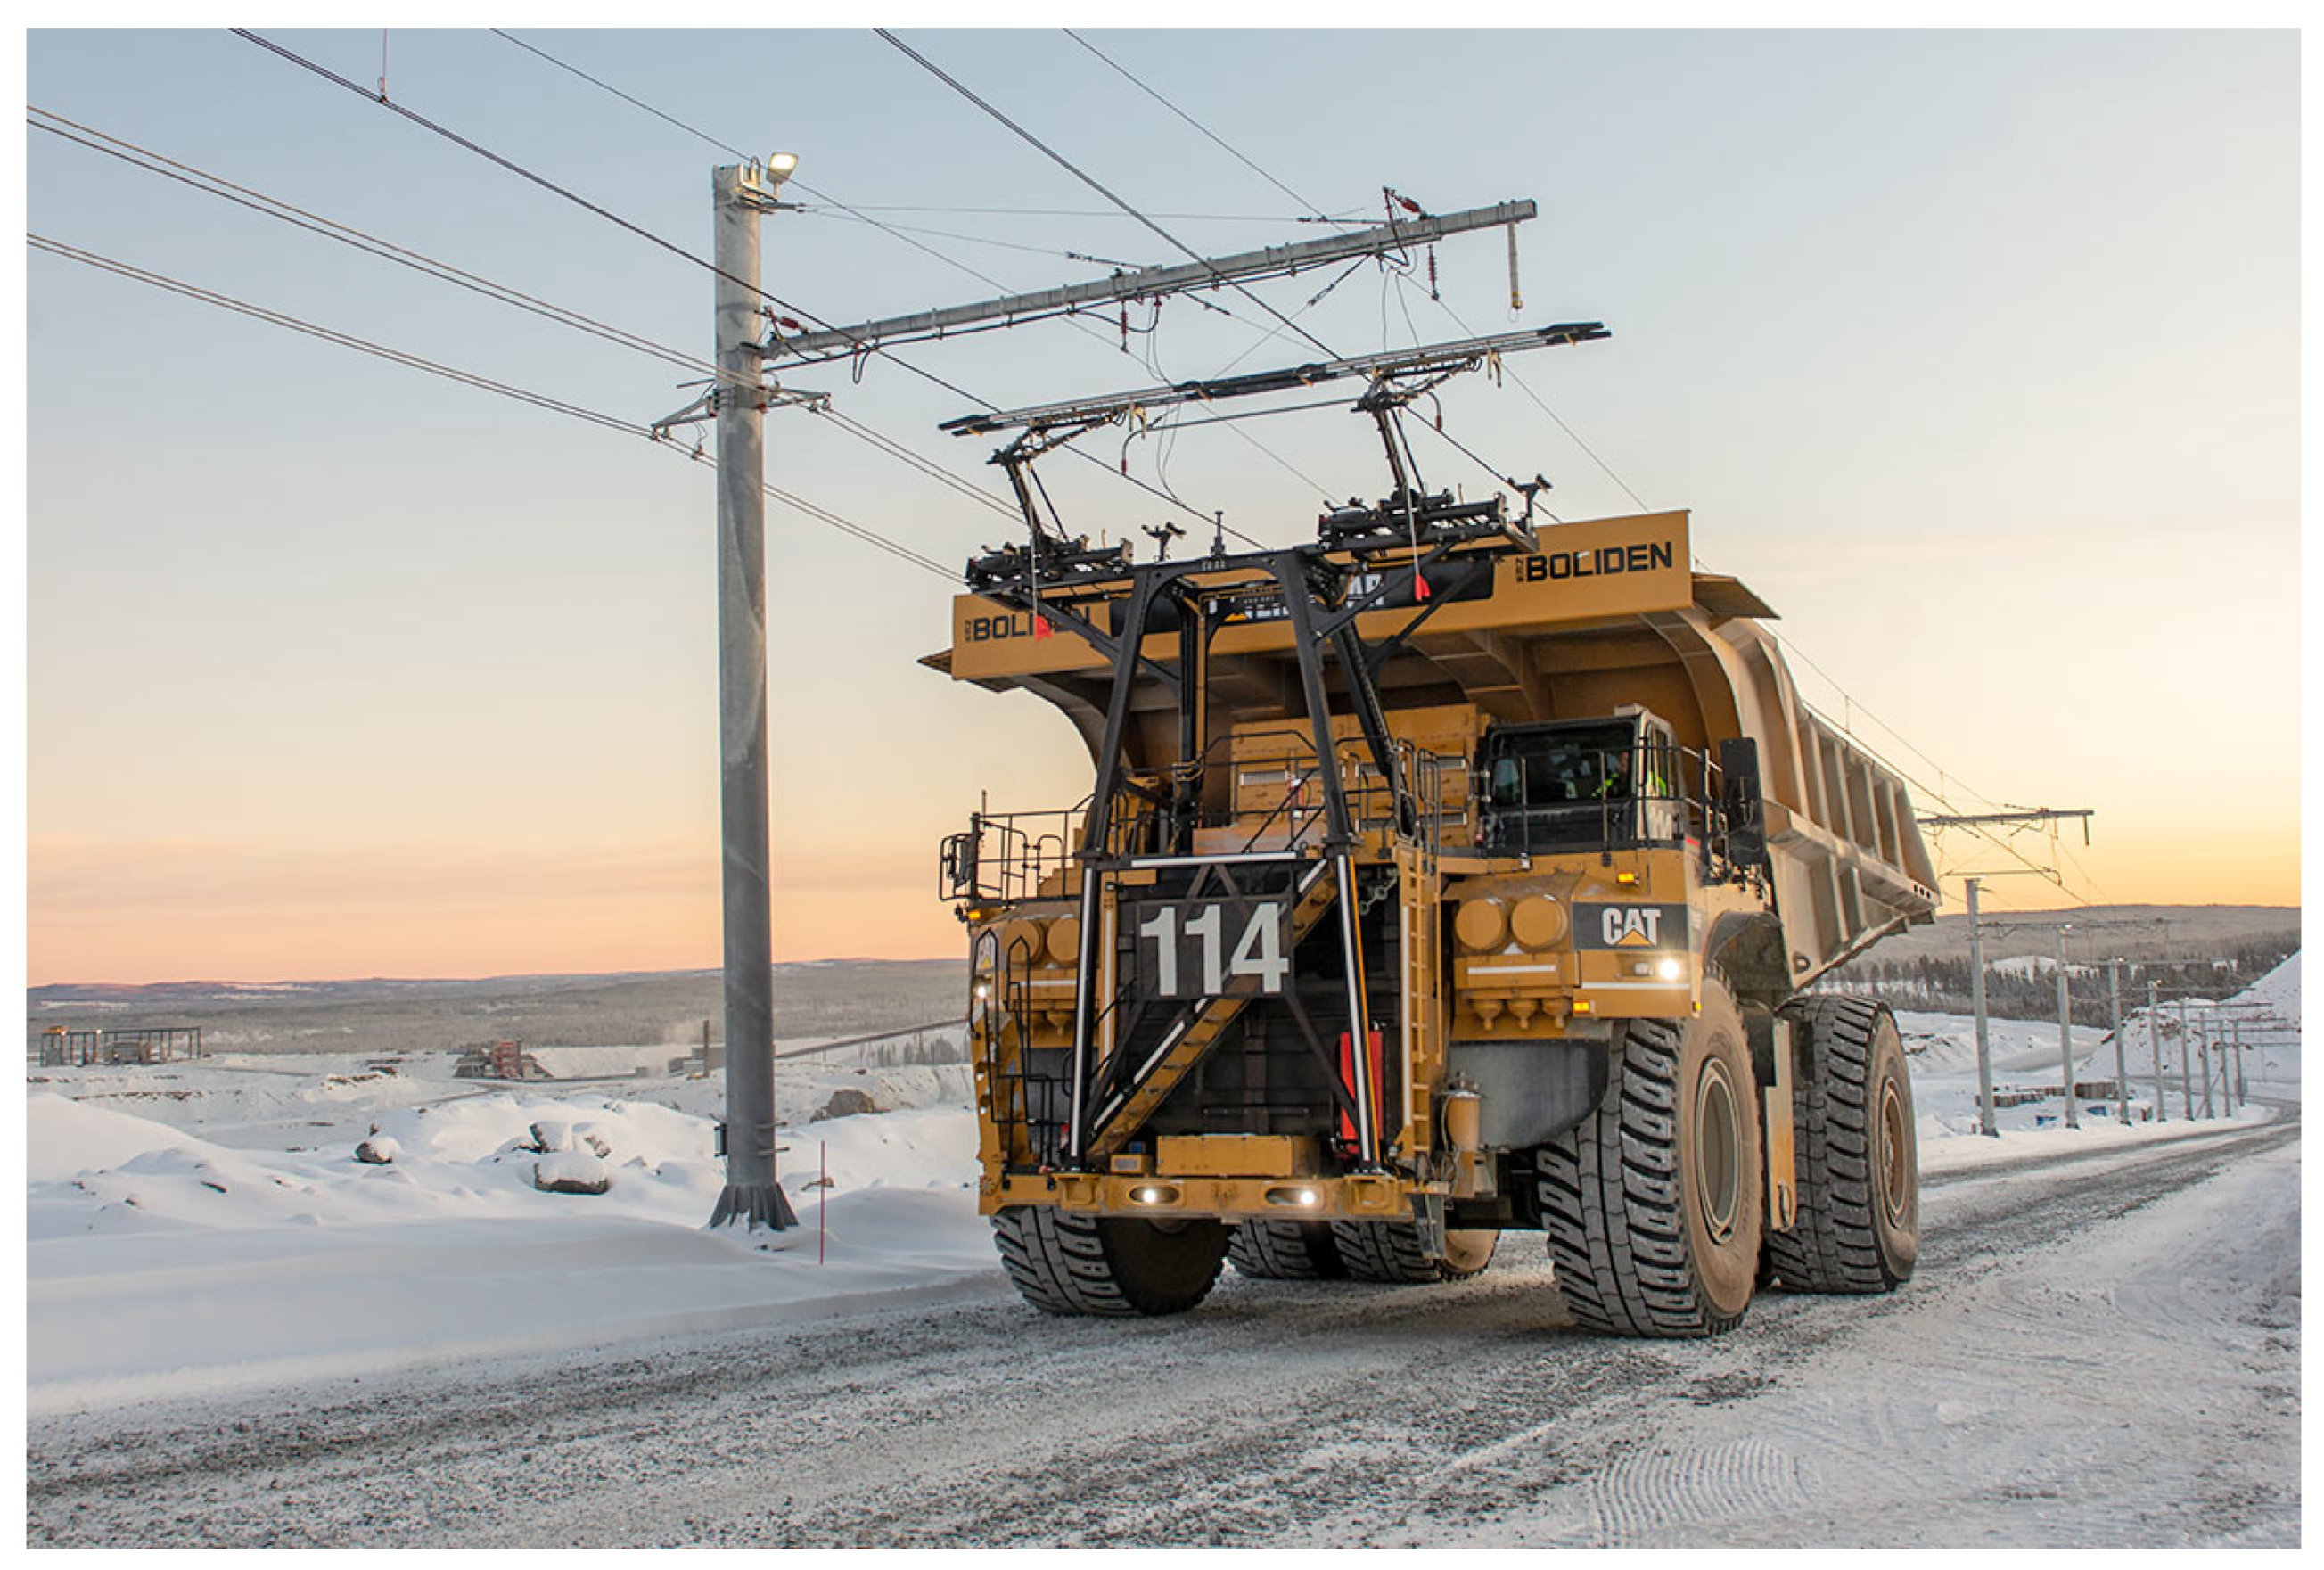
Boliden AB has tested using an electric road for mining trucks in its Aitik open pit mine and is now planning large-scale implementation of the system [
16]. One of the trucks with an ERS pickup can be seen in
Figure 1. This is the first use of electric roads for haul trucks in arctic conditions.
The rapid development of lithium-ion battery technology has made battery-electric operation of haul trucks an interesting alternative to the conventional diesel-electric operation. There have already been tests with a smaller (110 tonne loaded) battery-operated haul truck in Switzerland since 2018 [
17]. In the article “All Electric Operation of Ultra class Mining Haul Trucks” [
18], it is proposed to combine a high ERS coverage with small energy storage in the form of ultracapacitors or batteries while keeping the diesel engine. In that paper, a background of existing technology is presented together with basic feasibility calculations for the concept.
The use of onboard ultracapacitors or batteries on ERS-connected diesel-electric haul trucks to reduce peak ERS power is described in a patent from 2013 [
19].
This paper contains the result of a feasibility study on operating heavy (570 tonne) haul trucks with only power from electric roads and battery, without a diesel engine onboard. The study is based on data for a CAT 795F AC haul truck. The battery is charged from the electric road and through regenerative braking. The results from these simulations are compared to results from simulations of diesel-electric operation with and without ERS. Charging/discharging profiles for typical drive cycles in a large open-pit mine are investigated. They are important for the correct sizing of the battery and other key components. The results are promising, with a substantial reduction in estimated operating cost in the investigated case. Some uncertainties arise from battery life and economic assumptions.
Mining trucks are an extreme type of electric vehicle regarding size, which makes electrification challenging, but the high number of operating hours per year, the many vehicles that share infrastructure and the rather short drive cycles make battery-electric operation very cost-effective, especially in combination with an electric road system. Additionally, having the same owner of the vehicle and infrastructure makes it easier to switch to a new propulsion system. Analyzing the electrification of mining trucks can therefore help understand the limits of electric vehicle applications and check the validity of common assumptions on what role battery-electric vehicles can have in the future.
2. Drive Cycles
The haul truck operation at Aitik is approximated as a mix of four artificial drive cycles, which are summarized in
Table 1. The relative fraction of all the operating cycles that are represented by each drive cycle is given in the last column of
Table 1. A large fraction of the cycles is relatively short. One reason for this is that a large part of the ore is only transported to ore crushers down in the mine. The drive cycle “Short 2” will be used as the main example for illustrating the results.
The elevation profile and electric road placement of each drive cycle are shown in
Figure 2. The electric roads are placed away from the start of the drive cycle to avoid damage from blasting operations. The electric roads are shown with thick green lines. The short interruptions in the electric roads (100–200 m, shown in orange circles) are intended to represent hairpin curves where an electric road cannot be installed, and at these places, the speed is limited to a max of 15 km/h, as shown in
Figure 3. The trucks are assumed to be fully loaded in the first half of each cycle and empty the second half of the cycle. Since the truck returns on the same road, the elevation profiles are symmetric around the middle. The cycles include a 72 s pause for loading and a 36 s pause for unloading. In reality, the pauses will sometimes be longer due to, e.g., queues with other trucks. Most slopes in the elevation profiles are 8%, and the only exception is the “long” drive cycle that has some less steep slopes.
3. Simulation Model
To simulate battery-electric operation of a mining truck, a model of the vehicle and its drivetrain is needed, including parameter values. Most large mining trucks are currently diesel-electric, and therefore, a large part of the drivetrain can be exactly the same in a battery-electric version. The main difference would be that a truck with battery-electric operation would have a battery pack replacing the diesel engine and generator used in a conventional haul truck, as seen in
Figure 4. The braking resistor, which is used to absorb power from regenerative braking, can also be removed since the battery can absorb any regenerated power, except for rare cases of downhill transportation with a positive energy balance. For emergency situations, the mechanical brakes will be used, so the braking resistors should not be required for that.
The parameter values of the vehicle model have been inferred from different sources, including the specifications of current diesel-electric mining trucks, the recorded typical fuel consumption in operation and reasonable assumptions.
To verify the model, data recorded by the onboard monitoring system from diesel-electric operation of one truck for one day was used. From this recorded data, 13 driving cycles with similar elevation differences and driving distances, and without glitches in recorded data, were identified. The elevation and speed profile of these cycles can be seen in
Figure 5 and
Figure 6, respectively.
The energy consumption at the DC-bus of the real vehicle is compared with calculations based on the simulation model. One of the main uncertainties is the average rolling resistance of the tires. When the rolling resistance was set to 1.4%, the average calculated DC-bus energy consumption was 358 kWh/cycle while the measured DC-bus energy consumption was 361 kWh; this is a difference of only 1%, which is considered good enough. The measured and calculated DC-bus energy consumption during the recorded cycles can be seen in
Figure 7. A rolling resistance of 1.4% seems reasonable since 2% is a rough value often used in the industry, and it seems reasonable that it would include some margin.
The main model parameters are given in
Table 2. The diesel engine with its associated systems has a mass of about 25 tonnes. In the simulation, the battery with its associated systems is assumed to have the same mass.
The motivation for this assumption is that a typical electric vehicle battery pack has a specific energy density of about 150 kWh/kg, which corresponds to 13 tonnes for a 2000 kWh battery. The remaining 12 tonnes should be more than enough for the 6000 kW non-isolated DC-DC converter, cooling systems and extra protection of the battery in this demanding application. It is likely that the battery weight may become significantly lower in the future as batteries and system designs develop.
The mass of the pantograph needed to connect to the ERS is about 4 tonnes but has not been accounted for separately. For these reasons, the vehicle’s empty mass has been set to 250 tonnes regardless of the drivetrain option simulated.
The maximum power from the electric road was set to 8000 kW per vehicle since it was judged to be reasonable to upgrade the current system to that level based on existing pickup contact strip technology [
20] and other components. The current system delivers 4500 kW per vehicle.
4. Simulation Algorithm
The first step in the simulation is to generate the speed profile during the drive cycle. This starts with defining the speed limitations; thereafter, the speed for each simulation step is reduced to meet the limitations in driving and braking power when necessary. Once this feasible speed profile has been calculated, the power flows and energy balance in the drive train are simulated. The simulation is conducted with respect to the driven distance and not time. The step size is kept constant at 1 m.
In the case of battery-electric trucks with ERS, the speed on ERS and the ERS-power needs to be adjusted such that the battery state of charge (SOC) is the same at the end of the drive cycle as when the drive cycle starts. If the SOC increases during the simulated drive cycle, the needed ERS-power is calculated iteratively, and the power flows are updated accordingly to obtain the SoC balance over the whole driving cycle.
If the SOC decreases during the simulated drive cycle, the allowed driving speed, when connected to ERS, is reduced to increase the charging time. The new speed limit is found with a numeric root-finding algorithm, which aims for SoC balance over the whole driving cycle. The drive cycle is then re-simulated with the updated speed limit on the ERS.
This simulation algorithm is repeated for each combination of drivetrain and drive cycle.
The simulation of all combinations of the four drive cycles and three vehicle configurations runs in less than 2 s on a laptop with MATLAB R2020b and an Intel(R) Core (TM) i7-8650U CPU at 1.90 GHz.
5. Results
The simulation results for diesel operation are summarized in
Table 3, Diesel with ERS in
Table 4 and Battery with ERS in
Table 5.
In diesel operation, the average drive cycle time is 28.2 min, and the fuel consumption per cycle is 165 L. By adding ERS without a battery, the cycle time is reduced by 2.9 min, and 60 L of fuel consumption per cycle is replaced by 229 kWh electricity from the ERS. If the diesel engine is replaced by a 2000 kWh battery pack, the average cycle time is further reduced by 1.6 min, and the electricity taken from the ERS increases to 506 kWh, and no diesel fuel is used at all. On average, 353 kWh of energy flows through the battery per cycle, contributing to battery degradation. The battery cycling depth is at most 499 kWh, and the average battery cycling depth over all drive cycles is 270 kWh, which is 25% and 14% of the 2000 kWh battery capacity, respectively. This shows that the battery is mainly exposed to shallow discharging cycles, which should lead to a relatively high battery energy throughput during its service life, as shallow cycles contribute rather little to battery degradation compared to deep cycles.
As seen in
Table 1 and
Table 5, the drive cycle “Short 2” is close to the average cycle. That cycle has, therefore, been selected as an example for
Figure 8,
Figure 9 and
Figure 10, which shows the simulation results for drive cycle “Short 2” in more detail.
Figure 8 shows the driving speed with the different drive trains. Unlike the other simulation results,
Figure 8 has position along the x-axis instead of time so that the results for the different drivetrains line up. The only significant difference in speed between the drivetrains is during the uphill part of the drive cycle.
In the diesel case, the speed is limited to 13.6 km/h, for the full climb, by the maximum diesel engine generator output power of 2260 kW. When ERS is added to the diesel system, the speed increases to 26.8 km/h in the part of the climb that is equipped with the ERS since the ERS can supply 4500 kW, while the speed is unchanged during the rest of the drive cycle. In the case of the battery-electric operation with ERS (green line), the speed is purposely lower (20.4 km/h) in the part with ERS to have more time to charge energy into the battery. The speed is, however, higher on other parts of the climb since the battery can deliver much more power than the diesel engine, which more than compensates for the longer time spent on the ERS. The many speed reductions down to 15 km/h during the drive cycle are due to the speed limit in the hairpin curves, according to
Figure 3.
Figure 9 shows the power and energy flows during the drive cycle for the battery+ERS version of the powertrain. The height on the y-axis represents power, and since the x-axis represents time, the areas in the plot correspond to energy. It is interesting to note that a significant part of the energy (green area) goes directly to the motors without passing the battery. This reduces the demands on the battery and reduces charging time compared to other electric vehicle applications, where the vehicle is charged at stationary chargers rather than from ERS. For such systems, all the energy passes through the battery. In this case, the battery charging power (red area) is only 4540 kW, even when the ERS supplies 8000 kW.
The charging power of 4540 kW is equivalent to a C-rate (i.e., charge power in kW divided by battery capacity in kWh) of 2.3 for a 2000 kWh battery; this is well within the short term power-capabilities of modern Li-ion batteries. Charging the battery with all the 8000 kW from the ERS would have resulted in a C-rate of 4, which puts significant strain on the battery. The areas below the x-axis represent regenerative charging. The main reason it is not more than 109 kWh is that the vehicle drives downhill unloaded.
The state of charge (SOC) variations are very important for battery degradation. The SOC resulting from the charging/discharging pattern in
Figure 9 can be seen in
Figure 11 together with the SOC for the other drive cycles. Lithium-ion batteries are generally much better at handling high power with frequent power reversals, such as in this mining truck, than they are in handling high sustained charging power for a long time. The reason for this is that it takes time to build up degrading ion-concentration gradients and overpotentials inside the battery cells. This means that the real SOC variations are not the best predictor of some of the main aging mechanisms. Instead, the aging processes in the battery can better be predicted by a low-pass-filtered version of the charging power and state of charge, and those will show lower (dis-)charging power and SOC variations. To illustrate this,
Figure 10 also shows the SOC filtered through first-order low-pass filters with time constants of 15, 30 and 60 s, respectively. The relevant time constant depends on the specific battery type and degradation process of interest. None of these curves is an exact predictor of aging, but they provide an insight into why many short charging cycles degrade the battery slower than fewer long cycles, even if the same power is used and the same energy is cycled.
This means that it is better, from a battery point of view, to divide the ERS into sections spread out along the uphill climb than to have the same amount of ERS as one consecutive stretch. However, from an economic and practical point of view, it is in many cases easier and less costly to build long stretches of ERS with only interruptions for curves as simulated here, so the system will have to be designed having this tradeoff in mind. The SOC during all the drive cycles is shown in
Figure 11. Since the battery wear is determined by cycle numbers and cycle depths, it is important to know more about exactly how the battery is used. Therefore, the battery cycles in
Figure 11 are analyzed with the rain flow counting algorithm to find the number of SOC cycles of different depths [
21]. The results are combined with the relative frequencies in
Table 1, resulting in the yearly battery cycling pattern shown in
Figure 12.
Battery degradation is highly dependent on cycle depth. All these cycles are shallow for a 2000 kWh battery. It is likely that the deepest cycles at >450 kWh will contribute more than half of the battery cycling degradation even though they only stand for 26% of the cycled energy in the battery. This study does not include any deeper analysis of battery aging and service life, but it should be possible to reach a battery service life of at least 3 years, equivalent to a battery energy throughput of 9300 equivalent full cycles (EFC) given 6500 h of operation per year. As an example, LMO/NMC, pouch cells have been able to retain 80% capacity for 13,000 EFC at a cycle window of 10–20% SOC, 45 °C and a C-rate of 4 [
22]. This application has lower C-rates but some deeper cycles than that test, which should allow for similar cycle life for the batteries in the mining truck.
Three years of battery service life may sound low, but the energy throughput of 9300 equivalent full cycles (EFC) should be compared to the approximately 2000 EFC achieved in typical electric trucks and buses during their full service life due to deeper cycling and fewer operating hours per year.
Figure 13 shows the average energy flows in the battery-electric version of the powertrain in the mix of drive cycles according to
Table 1.
Figure 13 also shows a rough estimate of the losses in the power distribution system in the mine according to
Table 6 and
Section 6 below. We see that 45% of the energy from the electric road goes directly to the motors without passing through the battery. This is good since it leads to a low cost for the batteries, and it is possible only due to the use of ERS, which allows the trucks to be supplied with energy while they are driving.
About one-third (118 kWh) of the charging energy to the battery comes from regenerative braking, and that is high compared to road vehicles. This is due to much driving in steep downhill slopes, and it is another reason why this type of mining truck is very suitable for battery-electric drive trains.
Each drive cycle takes 519 kWh from the power grid and increases the potential energy of the payload by 187 kWh for an overall efficiency of 36%. Rolling resistance is the largest source of losses, 152 kWh/cycle in total, most of which result from the weight of the vehicle itself since the vehicle moves twice the distance of the payload. Onboard losses are 117 kWh/cycle in total and are dominated by the losses in the electric motors, including its power electronics and gears. The losses in the battery and associated power electronics are 38 kWh/cycle but are highly uncertain since it is a new system that is yet to be developed.
6. Power Distribution
This section aims to analyze roughly what additional power distribution is needed in the mine to supply a section of the ERS system and the power distribution losses related to the ERS system. The power distribution losses in the mine will depend on a lot of factors such as:
Number of trucks that use the system simultaneously.
Nominal capacity of components such as rectifier stations.
No-load losses when the system is not in use.
Other loads connected to the internal medium voltage grid.
Distance between the 130/22 kV transformer and rectifier station.
Distance at each moment between the truck and rectifier station.
Since these factors are not known, a very rough and simplified analysis will be presented assuming only one truck uses the system at a time, and no other loads are on the same cables. The mine is supplied by 130 kV from the power system, and it is assumed that the ERS system uses the same 130/22 kV transformers as the rest of the mine but has its own 22 kV cables from the transformer to the rectifier station. The assumptions are listed in
Table 6.
The losses in the 130/22 kV transformer are estimated to be 0.3%; this is a reasonable assumption for an 80 MVA transformer loaded to about 80% of nominal power. The 22 kV feeder to the rectifier station is assumed to consist of two parallel 240 mm
three-phase aluminum cables that are 5 km long. The losses in the rectifier station are estimated to be 0.8% of which 0.5% is estimated to be lost in the rectifier transformers, and the rest of the losses are in the diode rectifier. The ERS DC feed, parallel to the ERS, is assumed to have twice the cross section as it has on the present test system in the Aitik mine since the power per truck will increase from 4.5 to 8 MW/truck to accommodate battery charging. The actual trolley lines and suspension lines are made of copper and copper/silver alloy, while the current handling capacity has been increased with parallel aluminum wires. The average distance from the rectifier station to the truck is assumed to be 500 m; this includes the distance from the rectifier station to ERS and the distance along the ERS. This is about double the mean distance to the rectifier station in the currently installed system. In total, this example gives a power distribution loss of 2.63% or 13 kWh per drive cycle, as shown in
Figure 13.
The ERS has a nominal voltage of 2600 V and are floating or high-impedance-grounded with earth fault protection. The pantographs are automatically lowered when the truck is not moving. This reduces the risk of electric shocks in the event of insulation fault by preventing persons from touching the truck and ground simultaneously.
7. Economic Evaluation
In this section, the economic difference between drive trains is estimated based on the presented case and simulations.
The economic assumptions are shown in
Table 7. The maintenance cost is assumed to be included in the machine cost per hour and is assumed to be the same for all the drivetrains. Electrical drivetrains often require less maintenance than combustion engines; on the other hand, the battery-electric trucks drive faster, which may increase the need for some other maintenance.
The amount of ERS needed to fully electrify the mine is estimated to be 15 km. Due to shifting traffic patterns, some parts of the ERS will be unused at any one time. Since the roads in the mine are constantly moved, the discount period of the ERS is set to 10 years even if the technical life of the ERS should be longer. The same ERS cost and placement are assumed for the “Diesel + ERS” case as for the “Battery + ERS” case. Since the average ERS power usage would be significantly higher in the battery case, the cost would, in reality, probably be a little higher in that case. The difference is, however, too small to influence any of the conclusions. The optimal placement and amount of ERS will, in reality, also differ between the cases.
Based on these assumptions, the relative costs in
Figure 14 are calculated. Going from “Diesel” to “Diesel + ERS” reduces the total cost by 14% in this case, while the total cost is reduced by 44% when going to “Battery + ERS” under these assumptions. Note that as much as 7%-units of the cost reduction is due to the higher productivity of the battery-electric truck, achieved through a higher speed when driving uphill.
8. Discussion
These results show that battery-operated haul trucks with ERS are a promising system that can significantly lower the operating costs of haul trucks in open-pit mining, in addition to providing environmental benefits from an electric operation.
It is important to consider the tradeoff between the power from the electric road and the charging time. Higher power from the electric roads requires less installation of electric roads but is more demanding on the batteries and other components. Lower power from the electric road can be compensated for by longer electric roads or driving slower when connected to the electric road, but that decreases productivity. The tradeoffs used in this simulation seem to give good results, but it is likely that there exist even better tradeoffs. The impact on the external power system from the additional load due to the electric road system is not evaluated in this work. It is assumed that the impact on the external power system should be low since the onsite ore treatment plant already consumes significantly more electric power than will be needed for the electric road system. The average power consumption of all the trucks can be roughly estimated to about 15 MW. This estimate is based on 80 Mtonne/year transported mass, 320 tonne transported per drive cycle and 519 kWh consumed per drive cycle. This corresponds to only about 6% of the onsite transformer capacity of 240 MVA. The mine is also located in an area of Sweden with large hydropower generation; thus, the energy only needs to be transferred a rather short distance from the power plant to the mine.
8.1. Battery Discussion
The assumed battery pack cost of 400 Euro/kWh is significantly higher than the estimated cost of typical automotive traction batteries of about 200 Euro/kWh, see
Figure 9 in [
23], but the initial cost of these specialized battery packs will probably be even higher. There can also be a significant difference between the manufacturing cost of these battery packs and the price the vehicle manufacturer chooses to charge the end-user. The application is very insensitive to the battery price, as seen in
Figure 14. The “Battery + ERS” scenario would be the cheapest even if the battery cost would increase nine times.
In the analysis, a 2000 kWh battery is selected. This size is not based on a thorough optimization but rather selected to be a conservative battery size, which should have no problem handling the power and energy cycles of the mining trucks. Optimizing the battery size will be an important task, which can reduce the TCO even further. It is, however, complex since the battery size influences several costs both directly and indirectly.
Figure 15 illustrates the connection between battery size and different costs. Since no reliable battery degradation model has been identified for this application, this can only be taken as a qualitative illustration and not as numerical results. In the diagram, it can be seen that small batteries degrade disproportionally fast due to the high C-rates and deep charging cycling. Small batteries also have higher internal resistance, and therefore, have higher losses and cost of electricity. A larger battery, on the other hand, is more expensive, so the costs of battery calendar aging and capital costs will be higher. A large battery is also heavier, so the allowed payload is lower for a given total vehicle mass, which increases the costs since more drive cycles are needed. Note that the elimination of the diesel engine increases the payload, so even if a bigger battery will lead to a lower payload than a smaller one, the payload compared to a diesel truck may still be higher.
The temperature of lithium-ion batteries is important for the performance and service life of the battery. Generally, higher temperatures (35–50 °C) allow for faster charging/discharging with reasonable degradation, while lower temperatures (0–20 °C) give less degradation when the battery is in storage. It is important to find the optimal temperature to operate the batteries. Since these vehicles operate almost all the time, it should be possible to keep the batteries close to their optimal operating temperature without extra heating, even in arctic conditions. In warmer climates, refrigerative cooling may be needed, resulting in some additional energy consumption.
8.2. Comparison to Other Vehicle Types
This study illustrates that battery-electric operation can be feasible and economic even for very large vehicles. The most important factors determining the economy of a battery-electric operation are the utilization of the battery and charging infrastructure.
Compared to other vehicles, large haul trucks have a long operational life of about 25 years, with major diesel engine overhauls about every 2 years. This, combined with the high energy usage, indicates that it will likely be economic to replace the battery a number of times during the operational life of the truck if needed.
The large size of haul trucks and associated capital cost make it economic to operate them both at night and on weekends, even considering the higher driver salaries required. Such high utilization improves the economic case for electrification as compared to most other types of vehicles.
In a mine, the vehicles and infrastructure are owned and operated by the same company. The usage of each road and the driving patterns are often planned in advance for the expected life of the road. This is a vastly different investment situation than for vehicles and infrastructure for public roads, and makes the risk of an investment in ERS in a mine much lower than the risk when building ERS or stationary charging stations along normal roads.
9. Conclusions
The simulations show that, under the given assumptions, haul trucks in open-pit mines can be operated by electric batteries with an increased productivity of 16% and a reduction in cost per transported tonne of 44% compared to diesel-electric operation.
About 40% of the assumed diesel cost is due to taxation. Even if the tax on diesel were to be removed, there is still a cost reduction gained from the battery-electric operation of 29%, of which 9% units is due to higher productivity.
One of the main reasons why battery-electric operation of haul trucks seems so promising is the frequent charging opportunities, typically about four times per hour. The frequent charging opportunities give shallow charging cycles and high energy throughput of the battery over its lifetime.
The maximum sustained charging power of the battery pack is 5568 kW, and the deepest discharge cycle in the simulated drive cycles is 499 kWh. With a 2000 kWh battery pack, as assumed in this study, and only 499 kWh cycle depth, there are large margins for battery degradation, missed charging opportunities and flexible operation.
The required power- and energy-densities for this application are well within the capabilities of current lithium-ion batteries. Further investigation into the tradeoff among ERS-power, battery size, battery type, battery life, and operational flexibility is needed and can perhaps reduce costs even further.
Pure battery-electric operation of haul trucks requires a significant redesign of the onboard system, such as power steering, hydraulics, and cooling. Since haul trucks are produced in small numbers, the development cost needs to be covered by a few units. The development costs have not been estimated in this article.


