Article

Visualisation and Thermovision of Fuel Combustion Affecting Heat Release to Reduce NOx and PM Diesel Engine Emissions

by
Jerzy Cisek
1,*,
Szymon Leśniak
1,
Andrzej Borowski
1,*,
Włodzimierz Przybylski
2 and
Vitaliy Mokretskyy
2
1
Faculty of Mechanical Engineering, Cracow University of Technology, 31-155 Kraków, Poland
2
DAGAS, 05-660 Warka, Poland
*
Authors to whom correspondence should be addressed.
Energies 2022, 15(13), 4882; https://doi.org/10.3390/en15134882
Submission received: 26 May 2022 / Revised: 20 June 2022 / Accepted: 24 June 2022 / Published: 2 July 2022
(This article belongs to the Special Issue Advanced Research on Internal Combustion Engines and Engine Fuels)

Abstract

:
Research was conducted on fuels with additives that selectively affect the rate of kinetic (dQk/dα) and diffusion (dQd/dα) combustion in the diesel engine cylinder. In addition to the base fuel (DFB), DFKA fuel with an additive reducing dQk/dα, DFDA fuel with an additive increasing dQd/dα, and DFS fuel with both additives were tested. The main purpose of such dQ/dα course control in the engine cylinder was to simultaneously reduce the emissions of nitrogen oxides (NOx) and particulate matter (PM), and to increase the efficiency of the combustion process. Similar to the course of the dQ/dα, the course of the combustion temperature (Tc(α)) affects the NOx produced and the number of afterburned solid particles; the influence of the fuel additives on the functional curves was analysed. In addition to analysis of the temperature Tc(α) calculated from the indicator diagrams, Tc(α) analysis was conducted using the two-colour method, which allows the analysis of the isotherm distributions locally and temporarily. The two-colour method required prior endoscopic visualisation of the fast-changing processes inside the engine cylinder. Parameters defined by pressure, temperature, heat release rate, and visualisation and thermovision in the engine cylinder (as a function of the crank angle) allowed for an in-depth cause and effect analysis. It was determined why combustion of DFS fuel with both additives produced a synergy resulting in the simultaneous reduction in NOx and PM emissions in the exhaust gas and an increase in combustion efficiency. This publication relates to the field of Mechanical Engineering.

1. Introduction

In order to care for the natural environment, the series production of internal combustion engines (and hybrid powertrains) for passenger cars (LDV) is planned to end in the EU, the US, Japan, India, and China in 2035 [1,2,3,4,5,6,7,8,9]. Similar plans for diesel engines in vehicles with a gross vehicle weight greater than 3.5 tons (HDV) have been postponed. It is particularly important to conduct research and development that enables further reduction in emissions of the currently limited exhaust components in diesel engines, especially the most harmful ones, such as nitrogen oxides (NOx) and particulate matter (PM). Therefore, in recent years, research has been conducted around the world on the impact of new design, regulatory and post-process solutions, the task of which was to reduce the emission of limited exhaust components (including [10,11,12,13,14,15,16,17]). A similar situation applies to the influence of various unconventional fuels on the composition of exhaust gases (e.g., [18,19,20,21,22,23,24,25,26,27,28,29,30,31,32,33,34,35]). In this publication, the analysis of research on these issues is omitted because they are not directly related to the topic analysed here. Another method of reducing NOx and PM emissions in the exhaust of a diesel engine is the use of fuel additives.
The research subject was fuels with additives that selectively affect the speed of kinetic and diffusion combustion in the engine cylinder. The main purpose of controlling the course of heat release rate (dQ/dα) in the engine cylinder was to simultaneously reduce the emissions of NOx and PM. In 2021, the authors conducted engine tests for the same fuels (‘The Synergy of Two Biofuel Additives on Combustion Process to Simultaneously Reduce NOx and PM Emissions’, Energies 2021 [36]). However, there was a need to extend those tests. The research [36] reported the influence of fuels with additives on energy parameters and exhaust gas composition, with an analysis of the causes of the observed phenomena. However, the study, with an analysis of open indicator diagrams and heat release rates, did not report the influence of tested fuel additives on the course of the combustion temperature (Tc). As the Tc(α) function, similar to (dQ/dα), affects the number of NOx particles formed and afterburned PM particles, it was necessary to extend the measurements and calculations of the Tc(α) course to explain the influence of the tested additives on exhaust emissions. However, as the calculation of Tc(α) based on the measured combustion pressure pc(α) (Figure 1) is the average value in a given volume V(α), it is not sufficient information in terms of the NOx formation mechanism. In a diesel engine, combustion of a heterogeneous fuel–air mixture leads to a non-uniform temperature distribution in the volume of gas contained in the cylinder for a given angle α. A more physically correct analysis of NOx formation can determine Tc(α), which allows determination of the areas covered by the given isotherms as a function of the angle α (locally and temporarily). Optical-digital visualisation of phenomena in the engine cylinder and temperature distribution calculations from the tests (based on flame images) can meet these requirements.
Optical-digital visualisation of the flame in the engine cylinder powered by the tested fuels is the basis for calculating the distribution of isotherms (Section 3.3.1 and Section 3.3.2). It requires a certain amount of space in the engine head to mount an endoscope connected to a digital camera and an endoscope connected to a strobe light source. In the modern four-cylinder engine with a displacement volume of 1.9 dm3 used in previous tests [36], there was not enough free space to mount the measuring optics. Thus, the tests were conducted using a special one-cylinder test engine with approximately the same displacement volume that allowed endoscope installation. Use of a different engine (one-cylinder) in these tests required re-measuring with a four-cylinder engine, as the phenomena may have been different for the tested fuels (in terms of quantity and quality) due to differences in the motor design. Analysis of the influence of the tested fuels on the combustion process in two engines (one-cylinder, naturally aspirated, without EGR, with in-line injection pump, and four-cylinder, turbocharged, with EGR and high-pressure (200 MPa) fuel supply system) allowed for generalisation. The synergy effect with two fuel additives was confirmed, selectively reducing the speed of kinetic combustion and selectively increasing the speed of diffusion combustion. In both engine generations, this produces an extremely favourable, simultaneous reduction in NOx and PM emissions in the exhaust gas.

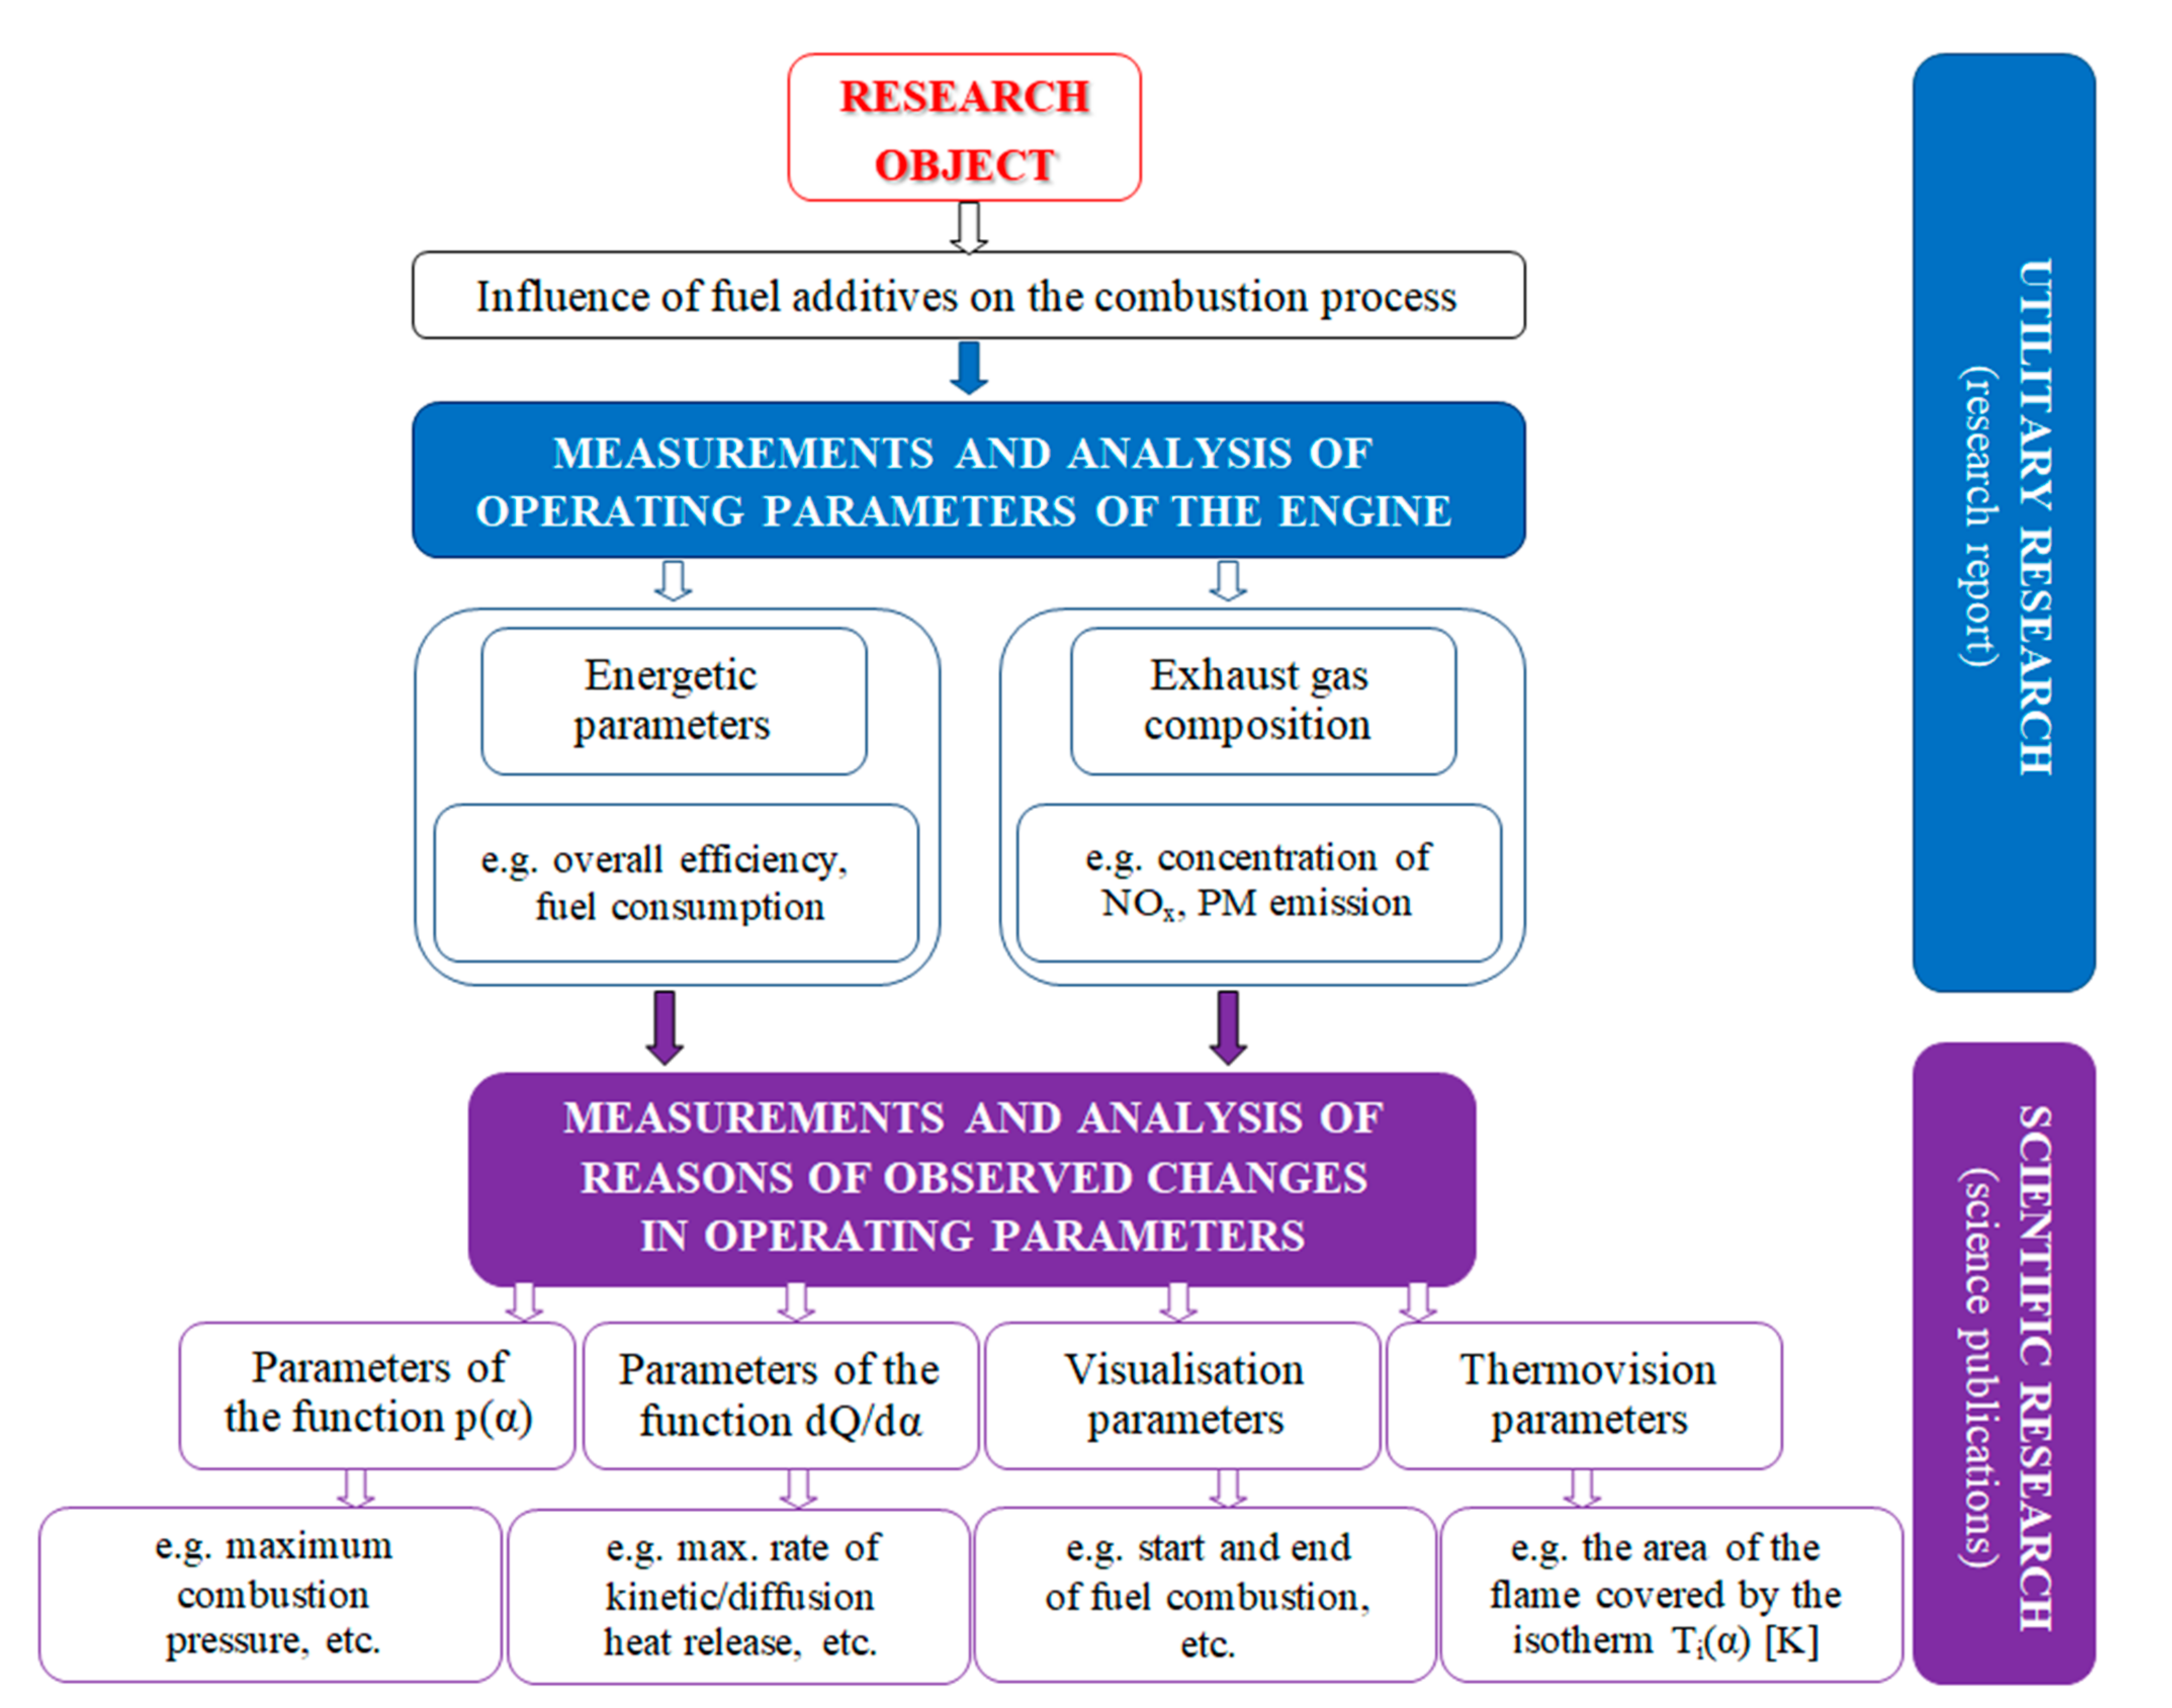
2. The Purpose and Scope of the Research

As initially mentioned in the previous chapter (Section 1), this publication intentionally and consciously extended the substantive scope of the tests carried out and presented in the publication [36] to include tests on another engine of the same fuel additives (selectively influencing the kinetic and diffusion speed of combustion) by the following items:
  • Visualisation of images, including injection, self-ignition and combustion of the tested fuels, in order to deepen the scientific (cause-and-effect) analysis of the studied phenomena,
  • Thermovision, including the distribution of isotherms in the flame of the tested fuels, also in order to deepen the scientific analysis of the studied phenomena,
  • Tests with the use of a different generation engine in order to generalise the analysis of the influence of the tested additives on a larger group of engines.
Therefore, the test results presented in this publication concern the statement of how the tested fuel additives affect the energy parameters and exhaust gas composition of a diesel engine (utilitary tests), but also extend the previous tests (with visualisation and thermovision) carried out on another diesel engine, in order to carry out both the extension of the measuring range (with a diesel engine of a different generation) and the deepening of the analysis of the research results with additional, more scientific reasons for the observed phenomena. It is presented schematically in Figure 2.

3. Research Methodology

This study differs from the previous study [36]; a substantially different internal combustion engine was used (one-cylinder engine instead of serial four-cylinder engine) to extend the previous research with digital-optical analysis of the combustion process and flame thermovision. Thus, the test methodology differed from that in the previous study [36], including the AVL VideoScope 513D measuring system (Section 3.3.1) and the internal combustion engine (Section 3.2). Following generally accepted principles (the same test object throughout), the same base fuel B10, physicochemical properties (Table 1 in the publication) [36], and fuel additives were used.

3.1. Fuel Characteristics

The following additives were added to the base fuel (DFB); the basic parameters are presented in Table 1:
  • 2-EHN—2-ethylhexyl nitrate with detergent-dispersant additives. 2-EHN was added mainly to increase the cetane number (CN) of the DFKA fuel. A concentration of 1500 ppm (v/v) of the additive increased the CN from 52.3 to 58 for the DFKA fuel.
  • Reduxco®—a liquid catalyst resulting from the reaction of acetic acid, iron, n-butanol, n-propanol, and isopropanol. The chemical composition of Reduxco complies with the Worldwide Fuel Charter, sixth edition, gasoline and diesel fuel, from 28 October 2019 [37]. Reduxco causes a reduction in fuel oxidation activation energy, which results in a selective increase in the rate of diffusion combustion, which enhances afterburning of previously formed PM in the engine cylinder [36,38,39]. DFB fuel with 1500 ppm (v/v) of Reduxco was denoted as DFDA fuel.
  • Base fuel with 1500 ppm 2-EHN and 1500 ppm Reduxco was denoted as DFS fuel.

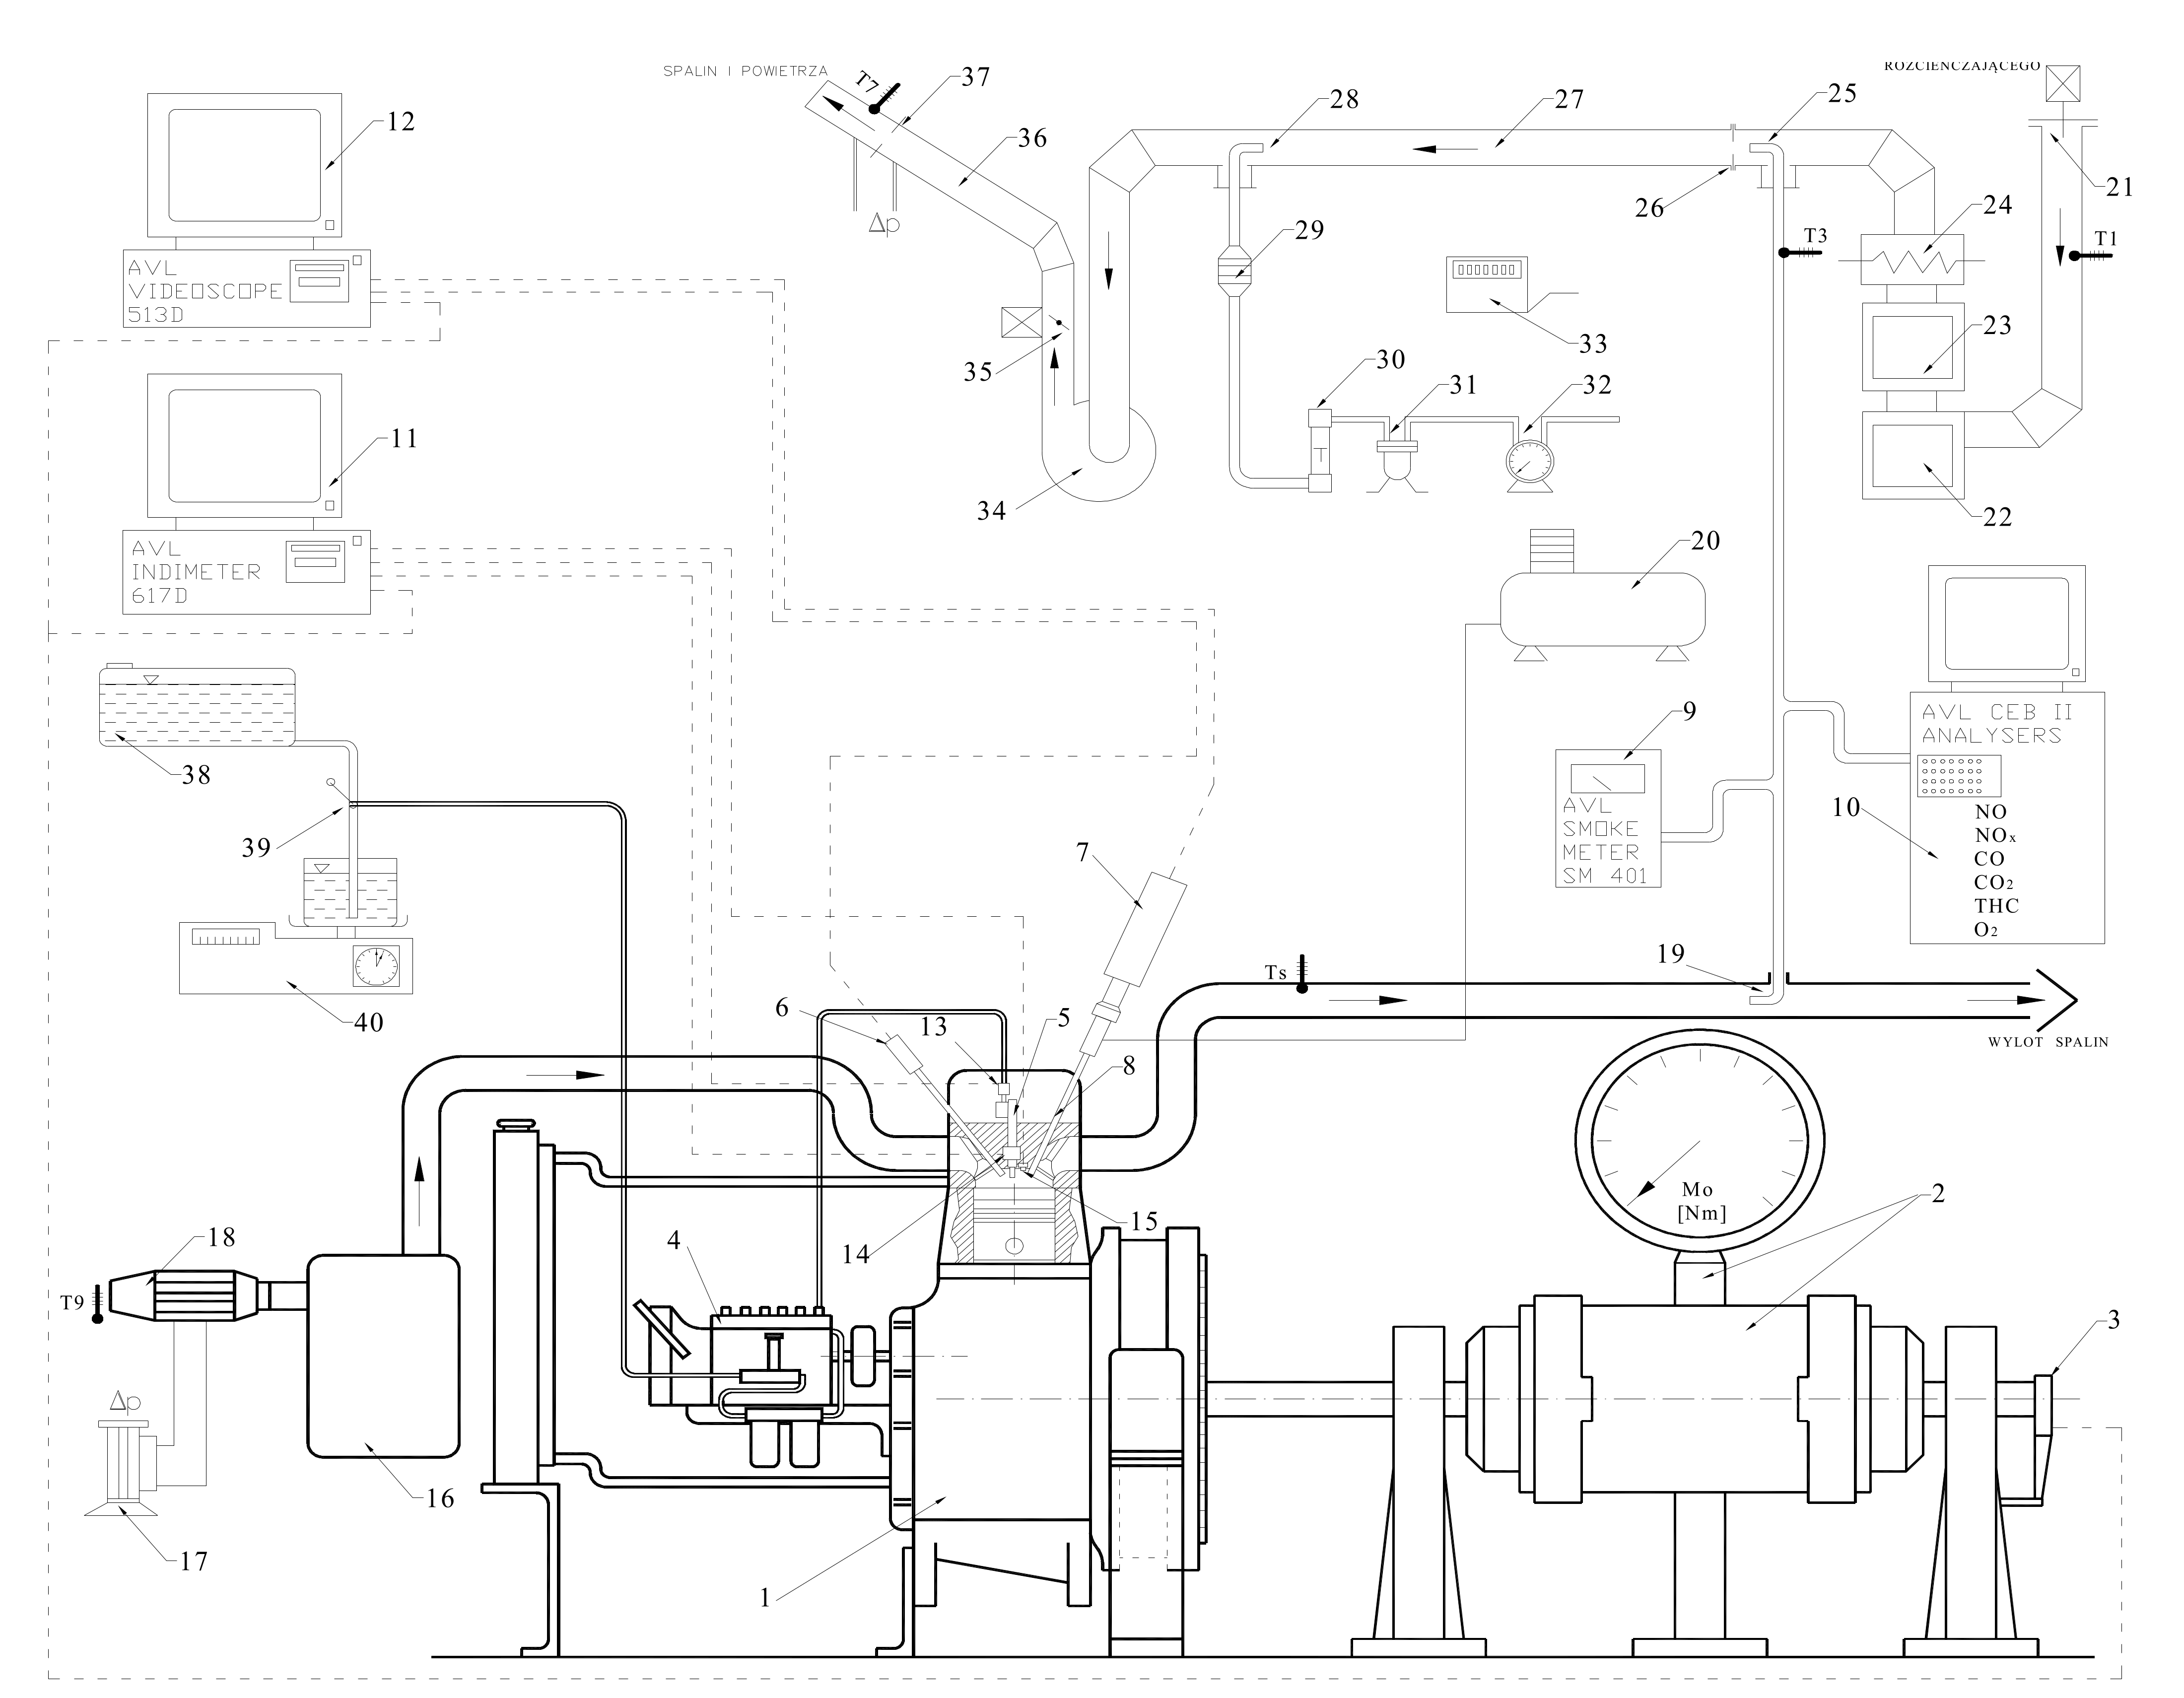
3.2. Measurement Stand

The technical specifications of the one-cylinder diesel engine are presented in Table 1. The test stand is shown in Figure 3. The numbered elements in the diagram are described in detail in the previous study [36].

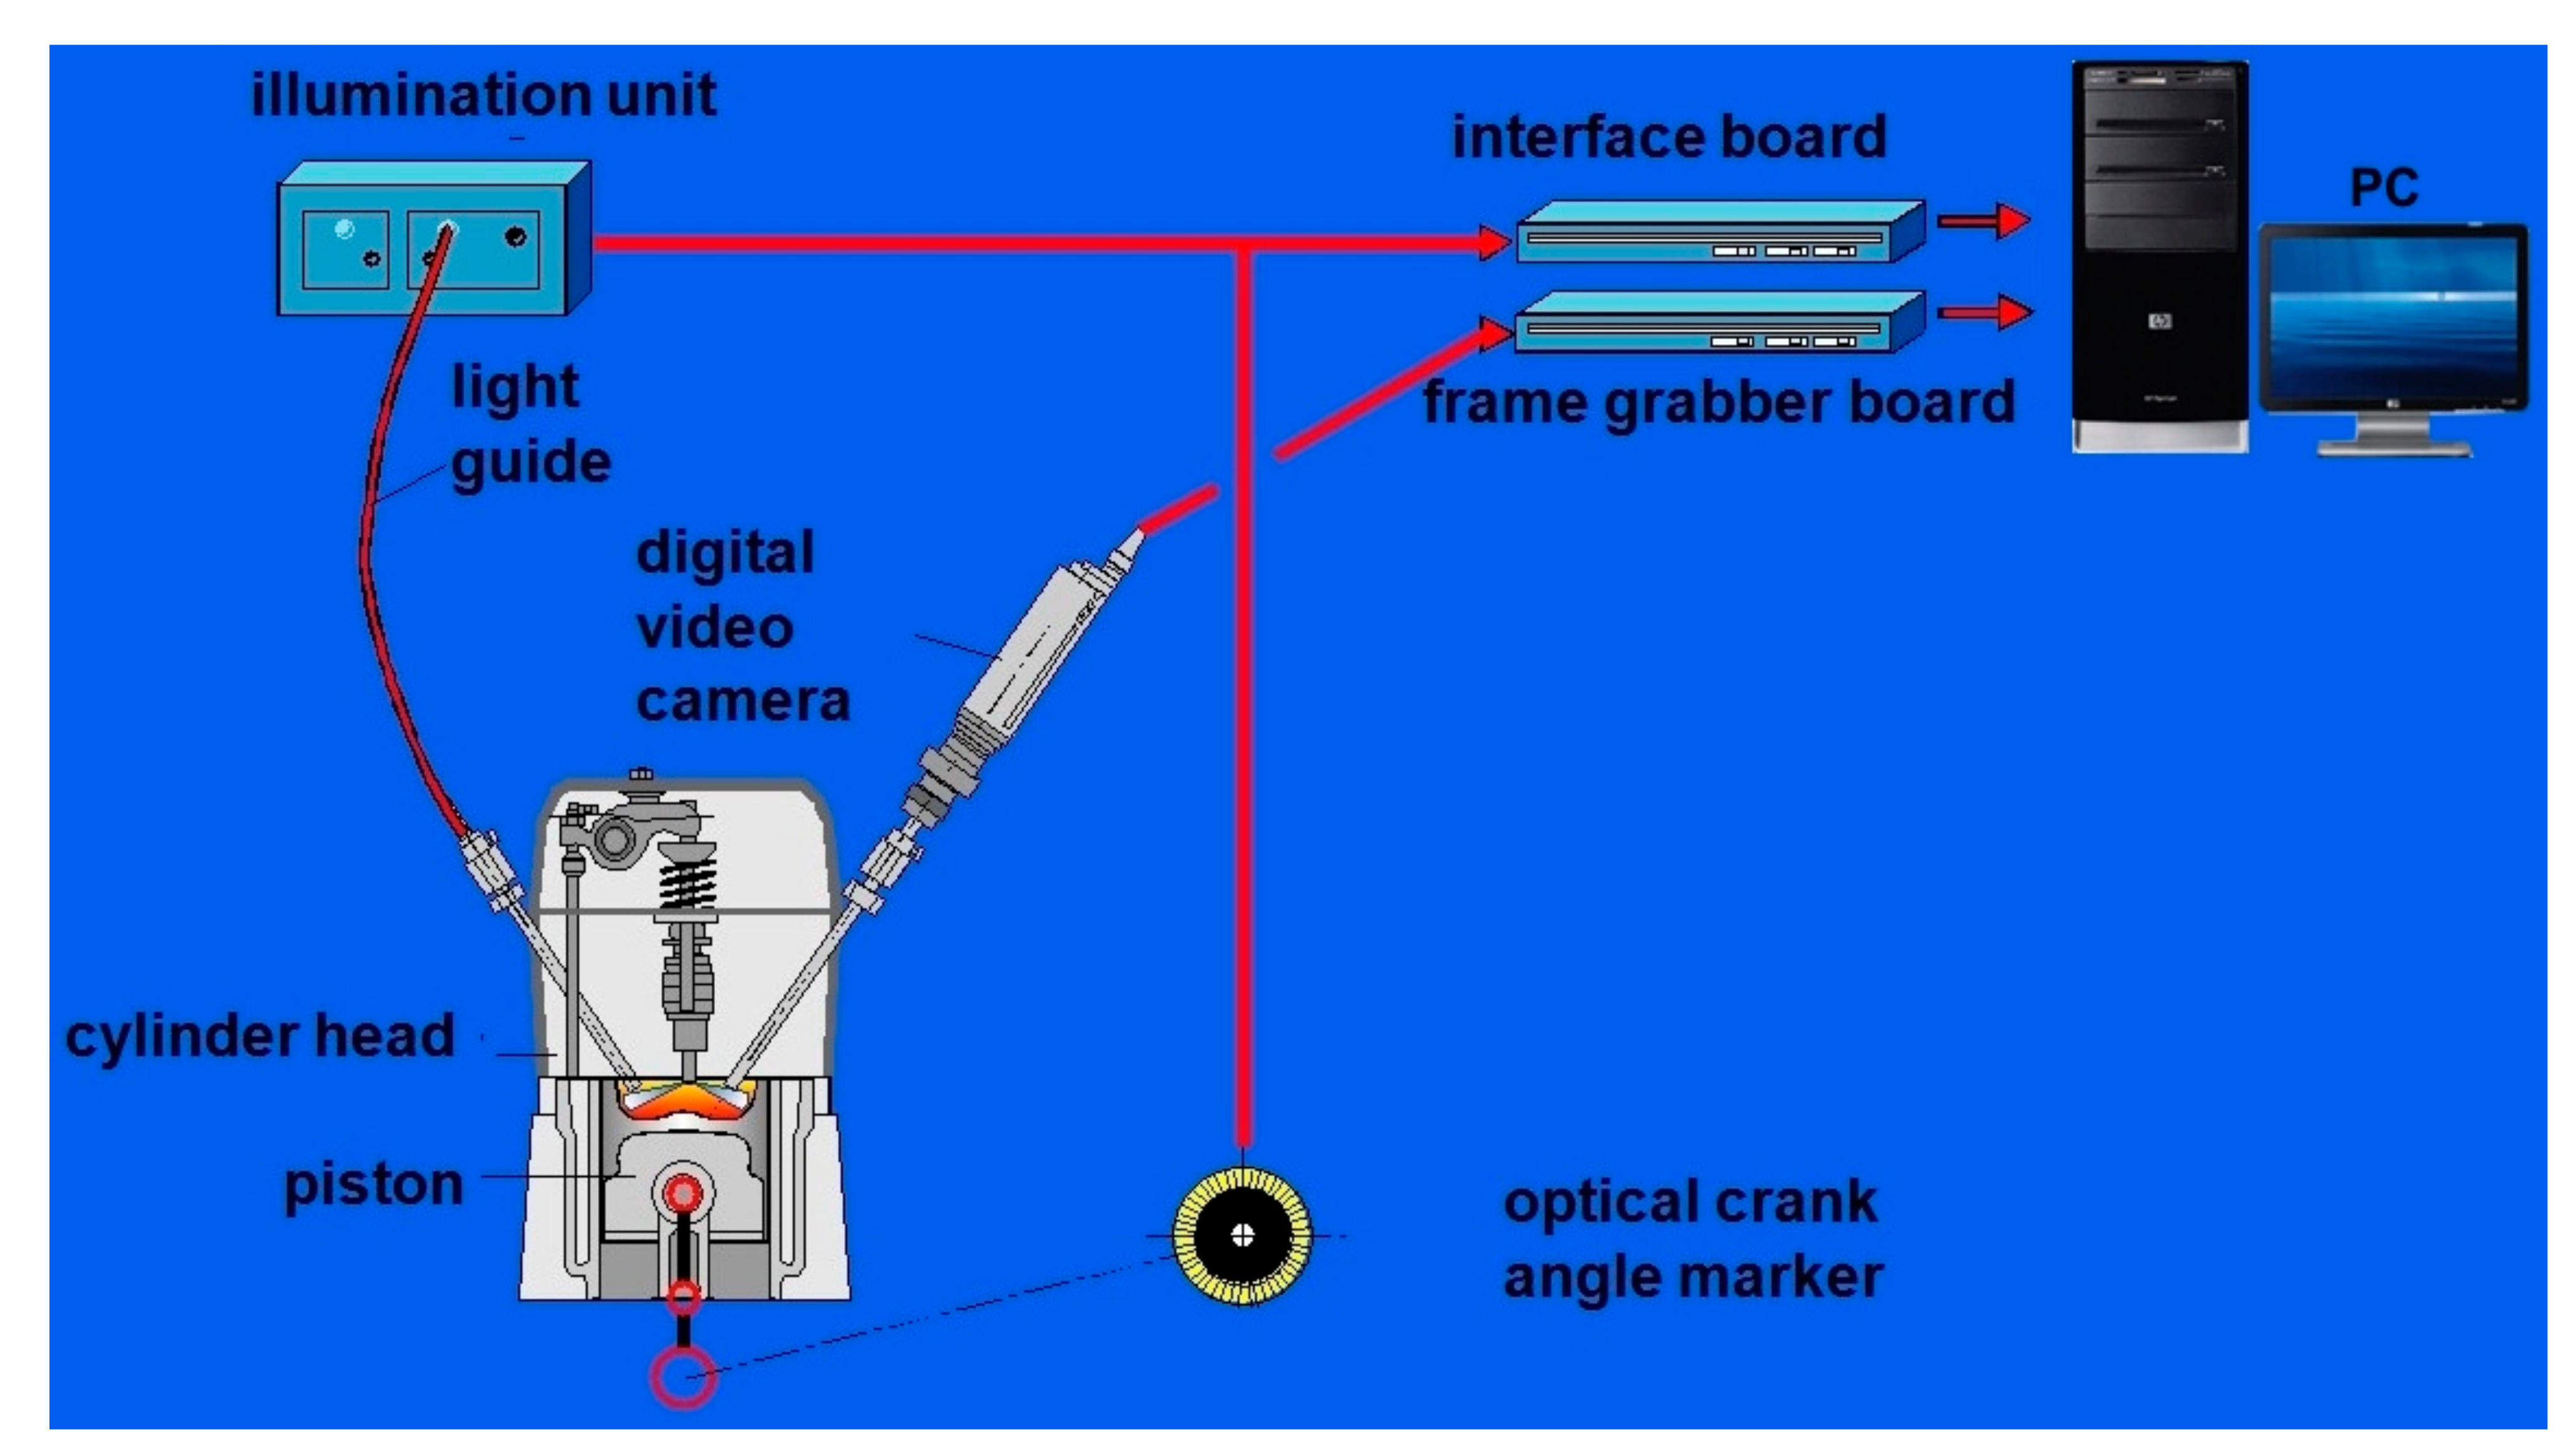
3.3. Optical Measurement of Fast-Changing Processes in Engine Cylinder

3.3.1. Visualisation of Self-Ignition and Fuel Combustion

Improving energy parameters and reducing emissions of toxic components in exhaust gases from heat engines require precise organisation of the injection, self-ignition, and fuel combustion processes. To optimise the processes in the engine cylinder, analysing changes in the basic engine output parameters is not sufficient. Visual observation of these phenomena is necessary for the direct assessment of the fuel injection process, the method of creating the fuel–air mixture, self-ignition, and combustion. There are significant problems associated with capturing images from inside the cylinder of an internal combustion engine during operation. The high temperature and pressure of the working medium affecting the optical element of the measuring apparatus, insufficient space in the head of modern motors for optical access to the cylinder interior, and the high variability of the recorded phenomena are primary concerns.
The measurement conditions for visualisation of the fuel injection course and combustion processes in a diesel engine cylinder distinguish this type of measuring apparatus from high-speed filming systems used in other scientific fields. The specificity of engine measurements requires protection of the optical elements against high temperature, minimising the probe dimensions (endoscope), optical access to the combustion chamber, and measurements performed as a function of the engine crankshaft rotation angle (not as a function of time).
Classic high-speed systems typically allow a maximum film speed of up to 4500 fps. At an engine speed of 2500 rpm, the observed phenomena can be recorded every 3° CA (distance between successive exposures). From experience, the analysis of phenomena related to the course of injection, fuel atomisation, preparation of a flammable mixture, self-ignition, and combustion with a resolution lower than 0.5° OWK does not provide sufficient information for causal interpretation.
Another drawback of using a conventional high-speed filming system in the engine cylinder is the random selection of the engine operating cycle to be analysed. It is not possible to record a representative engine work cycle for further analysis. With the natural fluctuations between successive engine cycles, the results may be based on randomly good or bad engine operation cycles, which may lead to false conclusions.
Measurements performed as a function of time are inadequate for the engine crankshaft angle of rotation because the angular velocity is a function of the crankshaft angle of rotation, also under the steady-state operating conditions of the engine. Thus, at different stages in the thermodynamic cycle, different crank angle intervals correspond to the same time interval.
Thus, digital measurement systems are advantageous for visualisation of the fuel combustion process in heat engines, archiving images as a function of the crankshaft rotation angle from different engine cycles simultaneously. These requirements are met by measuring systems specifically designed for optical-digital analysis of phenomena in the cylinder of an internal combustion engine, including the AVL VideoScope 513D shown in Figure 4.
The VideoScope 513D allows filming and analysis by the following two methods:
  • Recording images from different engine cycles for the same crankshaft rotation angle;
  • Recording images from different engine work cycles for successive crankshaft rotation angles shifted by a determined interval (the maximum sampling “resolution” is 0.1° CA).
Figure 5 shows the methods of obtaining images from the engine cylinder as a function of the crankshaft angle of rotation.
In analysing images corresponding to the same crankshaft angle (from different engine operation cycles), the test results can be statistically processed for an overview of the uniqueness of the phenomena and possible determination of an average or representative engine work cycle.
After conducting measurements for the successive engine crankshaft angles of rotation, a film can be created for visual analysis of the fuel injection and combustion processes in the diesel engine cylinder.
For both processes, it is possible to determine the temperature distribution in the engine cylinder during fuel combustion. Isotherms are calculated using the two-colour method.
Repeated recording of images in the engine cylinder with the same crankshaft angle allows for the selection of a representative engine work cycle or creation (calculation) of an averaged image, which is extremely important, given the natural fluctuations in the engine cylinder. Similarly, for the measurement of other cyclically unique processes, statistical methods allow for the analysis of the most representative or averaged measurement sample. For example, observation of the engine cylinder in successive work cycles allows analysis of the averaged or representative pressure of the working medium (as a function of the crankshaft rotation angle). The averaged pressure course is created by calculating the arithmetic mean of successive pressure measurements. An averaged image is created by averaging the intensities of the three basic colours at each point from successive measurements (red, green, and blue, RGB model). The result is an average image that was not recorded.
Analysis of such prepared data (especially with a small number of repetitions and high process uniqueness) may lead to false conclusions. Thus, a representative image (according to a specific criterion) can be selected from the recorded images with the same crankshaft angle of rotation. The criterion is usually the maximum combustion pressure or the maximum rate of combustion pressure increase (dp/dα)max. For analysis of the injection and combustion processes, the image with a flame area most similar to the statistically most frequently occurring flame area for a given crankshaft angle of rotation is used as the representative image.
Using this procedure with successive crankshaft angles of rotation allows for the creation of a sequence of representative images that provides the basis for the analysis of engine cylinder processes (Figure 6).

3.3.2. Flame Thermovision (Two-Colour Method)

In principle, any physical quantity that varies with temperature can be used to measure temperature. Different measuring methods have been developed for different measuring tasks, measuring objects, and temperature ranges. In our previous research, the temperature distribution in the gaseous medium (using an optical endoscopic technique) was determined using a two-colour computational model. Isotherm decomposition results for a flame in a diesel engine cylinder obtained using this method are shown in Figure 7.
In the two-colour method, the soot flame temperature is determined using the following two equations: the red radiation intensity Rth (T,kks) (values measured during tests) and the relative intensity of red radiation to green radiation R t h ( T , k k s ) G t h ( T , k k s ) (values obtained by calibration).
R t h T , k k s = k o p t c 1 λ min λ max 1 e k k s λ 1 λ 5 e c 2 λ T τ s λ τ R λ d λ
R t h T , k k s G t h T , k k s = k o p t λ min λ max 1 e k k s λ 1 λ 5 e c 2 λ T τ s λ τ R λ d λ λ min λ max 1 e k k s λ 1 λ 5 e c 2 λ T τ s λ τ G λ d λ
where τR and τG represent the specific filter transmittance for red light and green light, respectively.
A detailed derivation of Equations (1) and (2) was presented in our previous studies [41,42,43,44] and in other studies in the literature [45,46,47,48].
The two-colour method can only be used for analysis of isothermal distribution in soot flame (in diesel engines and engines with direct gasoline injection and charge stratification). The two-colour method does not apply to temperature distribution determination for homogeneous combustion.

4. Research Results

According to the schedule, several basic groups of engine operating parameters were tested and analysed, which are as follows:
4.
Engine energy parameters,
5.
Concentration of gaseous components of exhaust gases,
6.
Particulate emissions and exhaust smoke,
7.
Indicator chart parameters,
8.
Combustion temperature graph parameters (calculated using p(α)),
9.
Graph parameters for rate of heat release in engine cylinder,
10.
Optical image analysis parameters in engine cylinder,
11.
Flame thermovision parameters for tested fuels (for kinetic and diffusion phases of combustion).
Laboratory measurements were conducted using an experimental one-cylinder diesel engine; the technical specifications for the four tested fuels described in Section 3.1 (with additives) are presented in Section 3.2.
The tests were conducted at a constant rotational speed of 1600 rpm (rotational speed with maximum torque for this engine), with the same load for all tested fuels (To = 60 Nm, 55% To,max).
The diesel oil additives did not change the viscosity of the fuels (DFKA, DFDA, DFS) or the calorific value. Thus, the beginning of injection of the tested fuels into the engine cylinder was the same; differences in energy parameters and engine exhaust gas composition values resulted only from the influence of the tested additives on the combustion process. Cause-and-effect analysis of the oxidation process for the tested fuels was enabled by combustion temperature diagrams, the rate of heat release, the flame images, and the isotherm distribution of the flame (determined as a function of combustion time and engine crankshaft rotation angle).

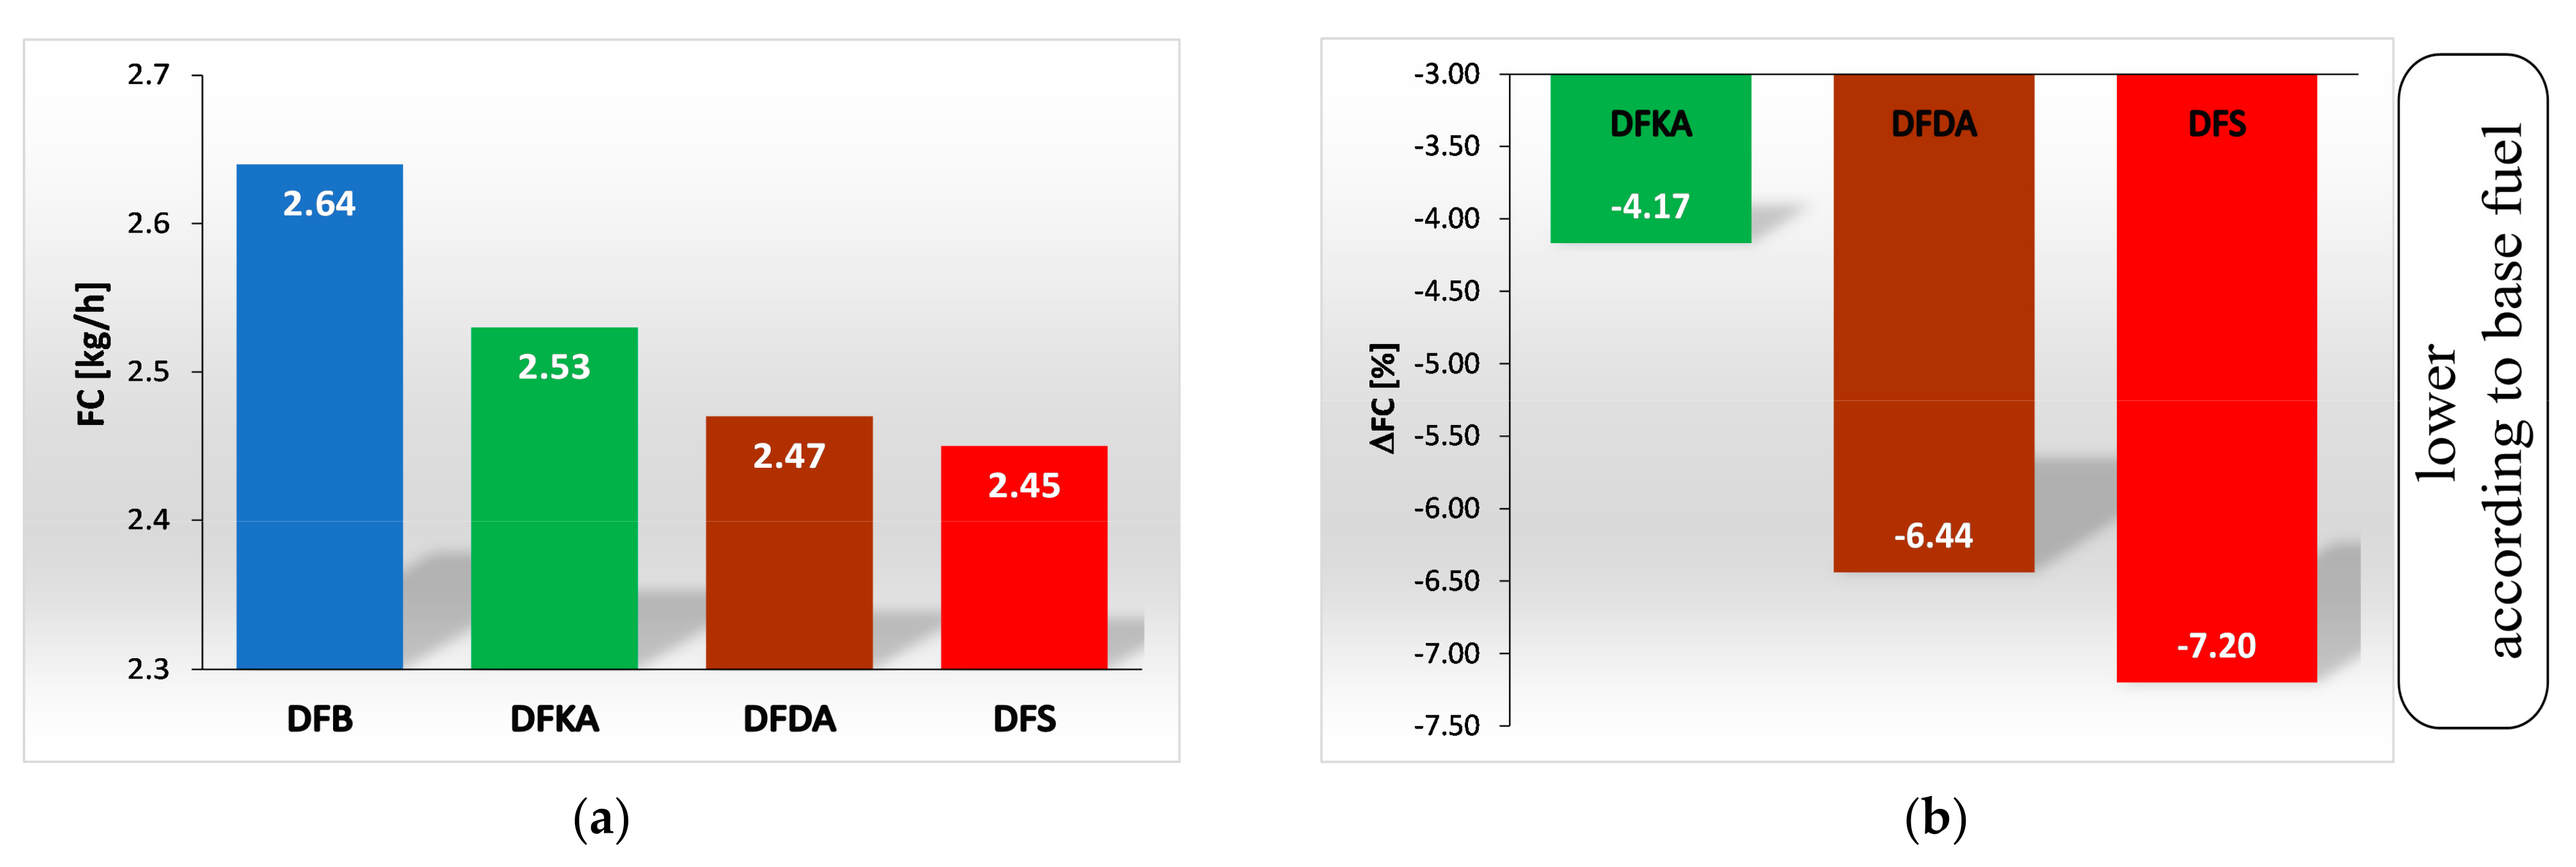
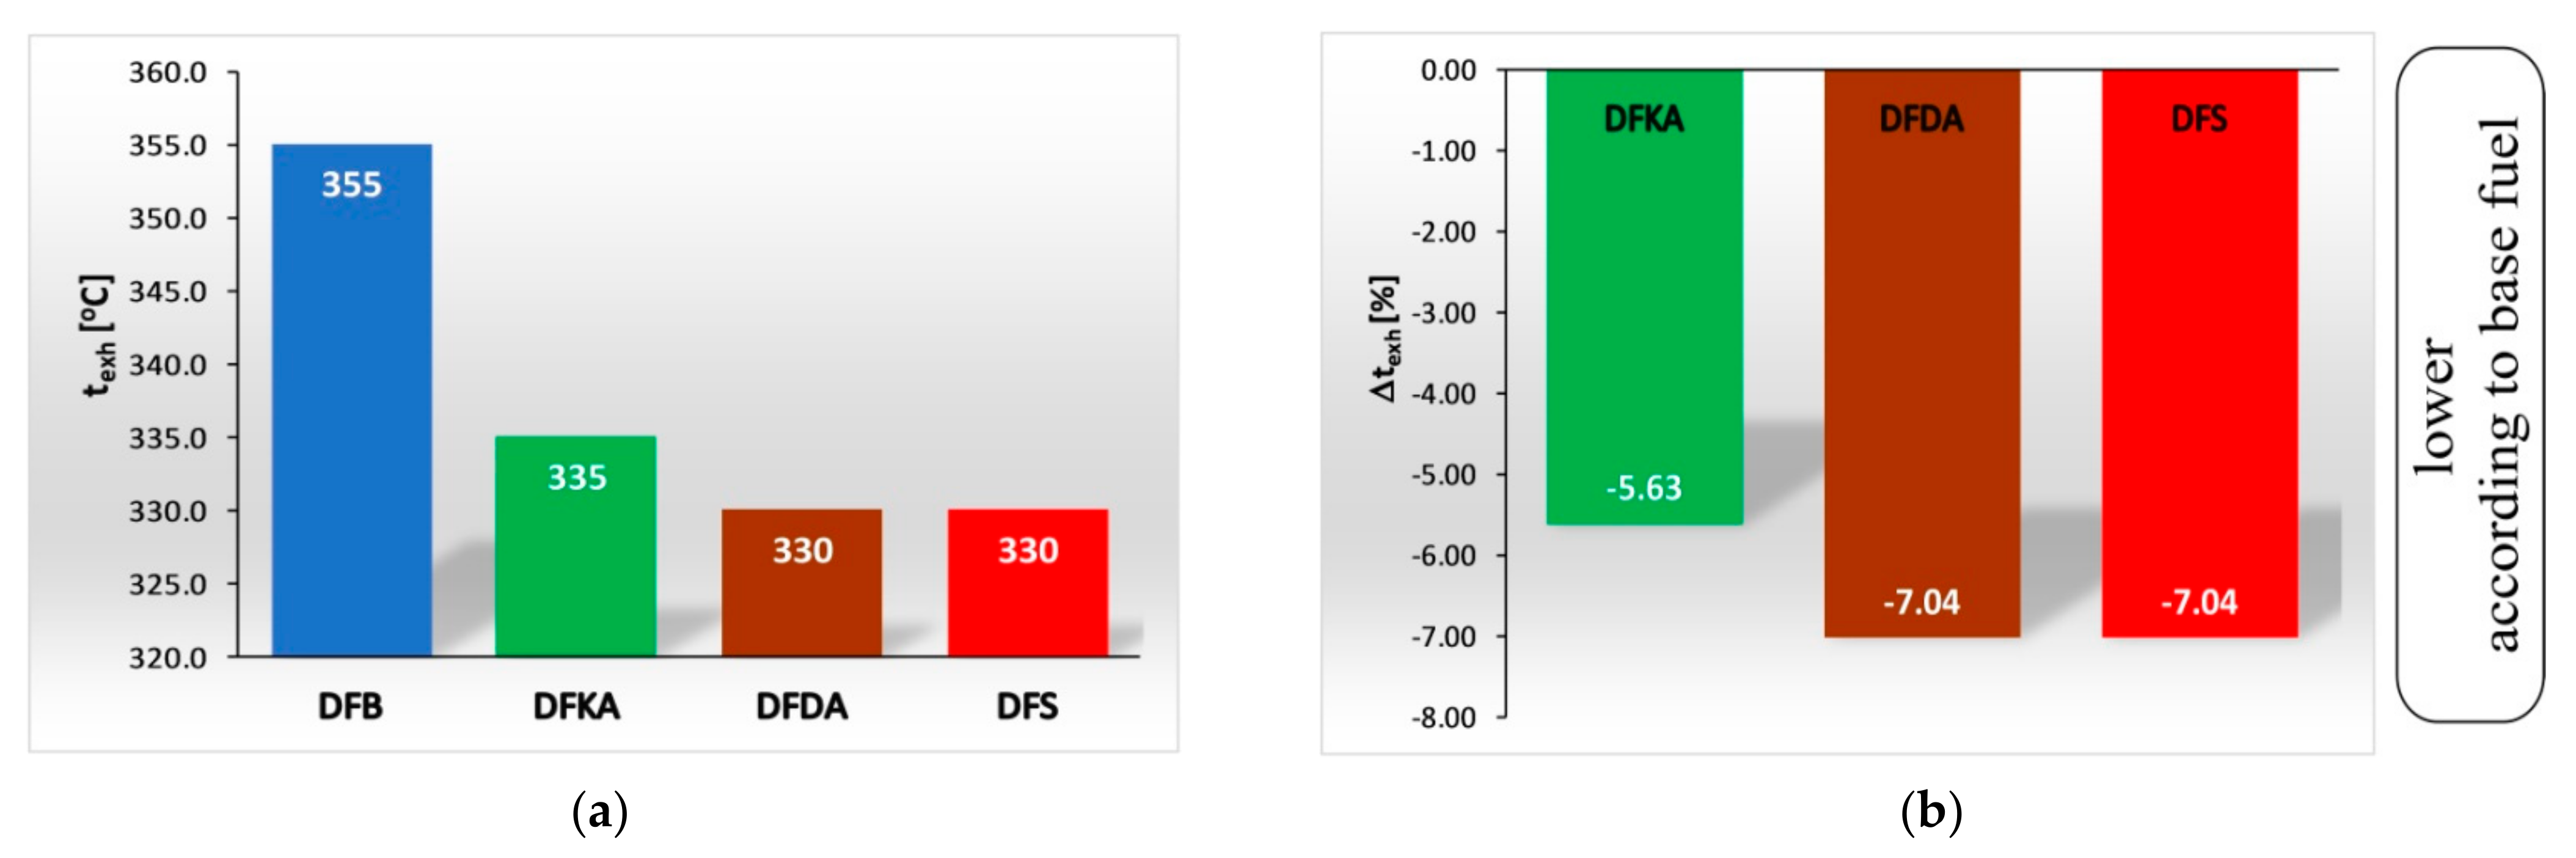
4.1. Energy Parameters

Measurements for all the tested fuels were conducted at the same rotational speed and engine load. Thus, the percentage changes in hourly fuel consumption (FC) resulting from the influence of the tested fuels on the combustion process (Figure 8) were the same as the percentage differences in the fuel consumption and overall engine efficiency values. The data in the figure show that each of the tested additives improves combustion in the engine cylinder, to a different extent for different fuels, resulting in decreased fuel consumption.
The energy parameters of the engine with use of additives were improved (relative to values for the base fuel) and were as follows:
  • Approximately 4% for DFKA fuel,
  • Approximately 6% for DFDA fuel,
  • Approximately 7% for DFS fuel.
The energetic improvement of the combustion process, resulting in increased overall engine efficiency, may result from earlier termination of the combustion process (reduced exhaust loss), confirmed by lower engine exhaust temperatures for all tested fuels than for the base fuel, as illustrated in Figure 9.
Increased engine efficiency is advantageous; earlier termination of combustion and lower exhaust gas temperature (texh) reduce the loss of energy from the exhaust gas, generally increasing the amount of energy that can be converted in the engine cylinder for work. This phenomenon reduces the amount of lost energy, which ultimately reduces CO2 emissions in the exhaust of the engine powered by DFDA and DFS fuel (compared to DFB fuel), which also has an impact on the GHG effect. One of the reasons for earlier termination of combustion (relative to the base fuel) may be a higher combustion rate or earlier fuel self-ignition. Further analysis (rate of heat release in engine cylinder) can help determine the main cause.

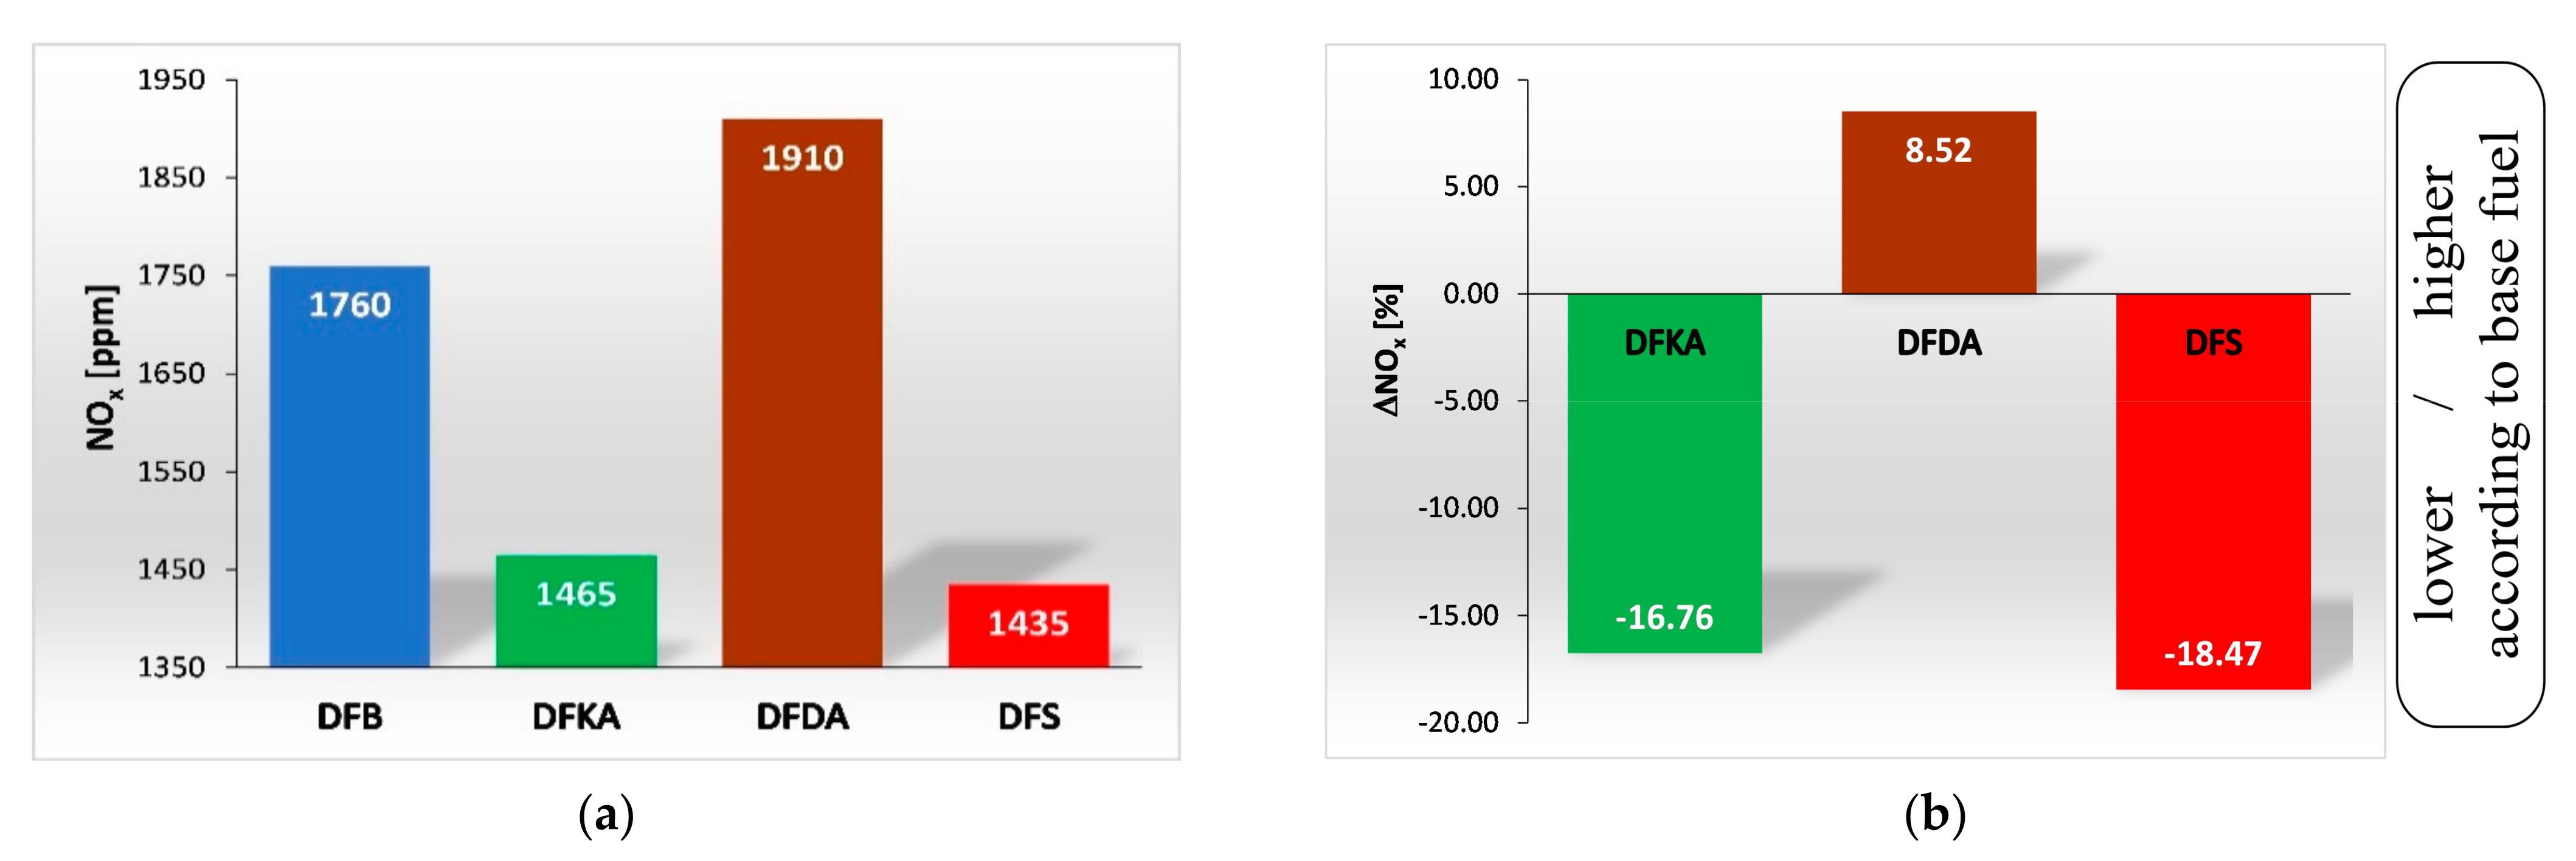
4.2. Exhaust Gas Composition

In the current reciprocating combustion engines, the exhaust gas composition is as important as the overall engine efficiency. For an engine to be produced in series, it must meet the requirements for permissible emissions of CO, HC, NOx, PM, and CO2. With combustion of lean fuel–air mixtures in diesel engines and use of oxidation catalysts with high efficiency, CO and HC emissions do not pose a significant threat in the design of compression ignition engines. However, NOx and PM emissions are a significant concern. Thus, the influence of the tested fuels (compared to the base fuel) on the NOx concentration and the emission of PM and exhaust smoke was determined.
From a chemical perspective, the combustion temperature affects the amount of NOx formed in the engine cylinder (Tc > 1000 K), the O2 availability in the N2 oxidation reaction, and the duration of the reaction [49]. For a compression ignition engine, the specificity of this process should be considered.
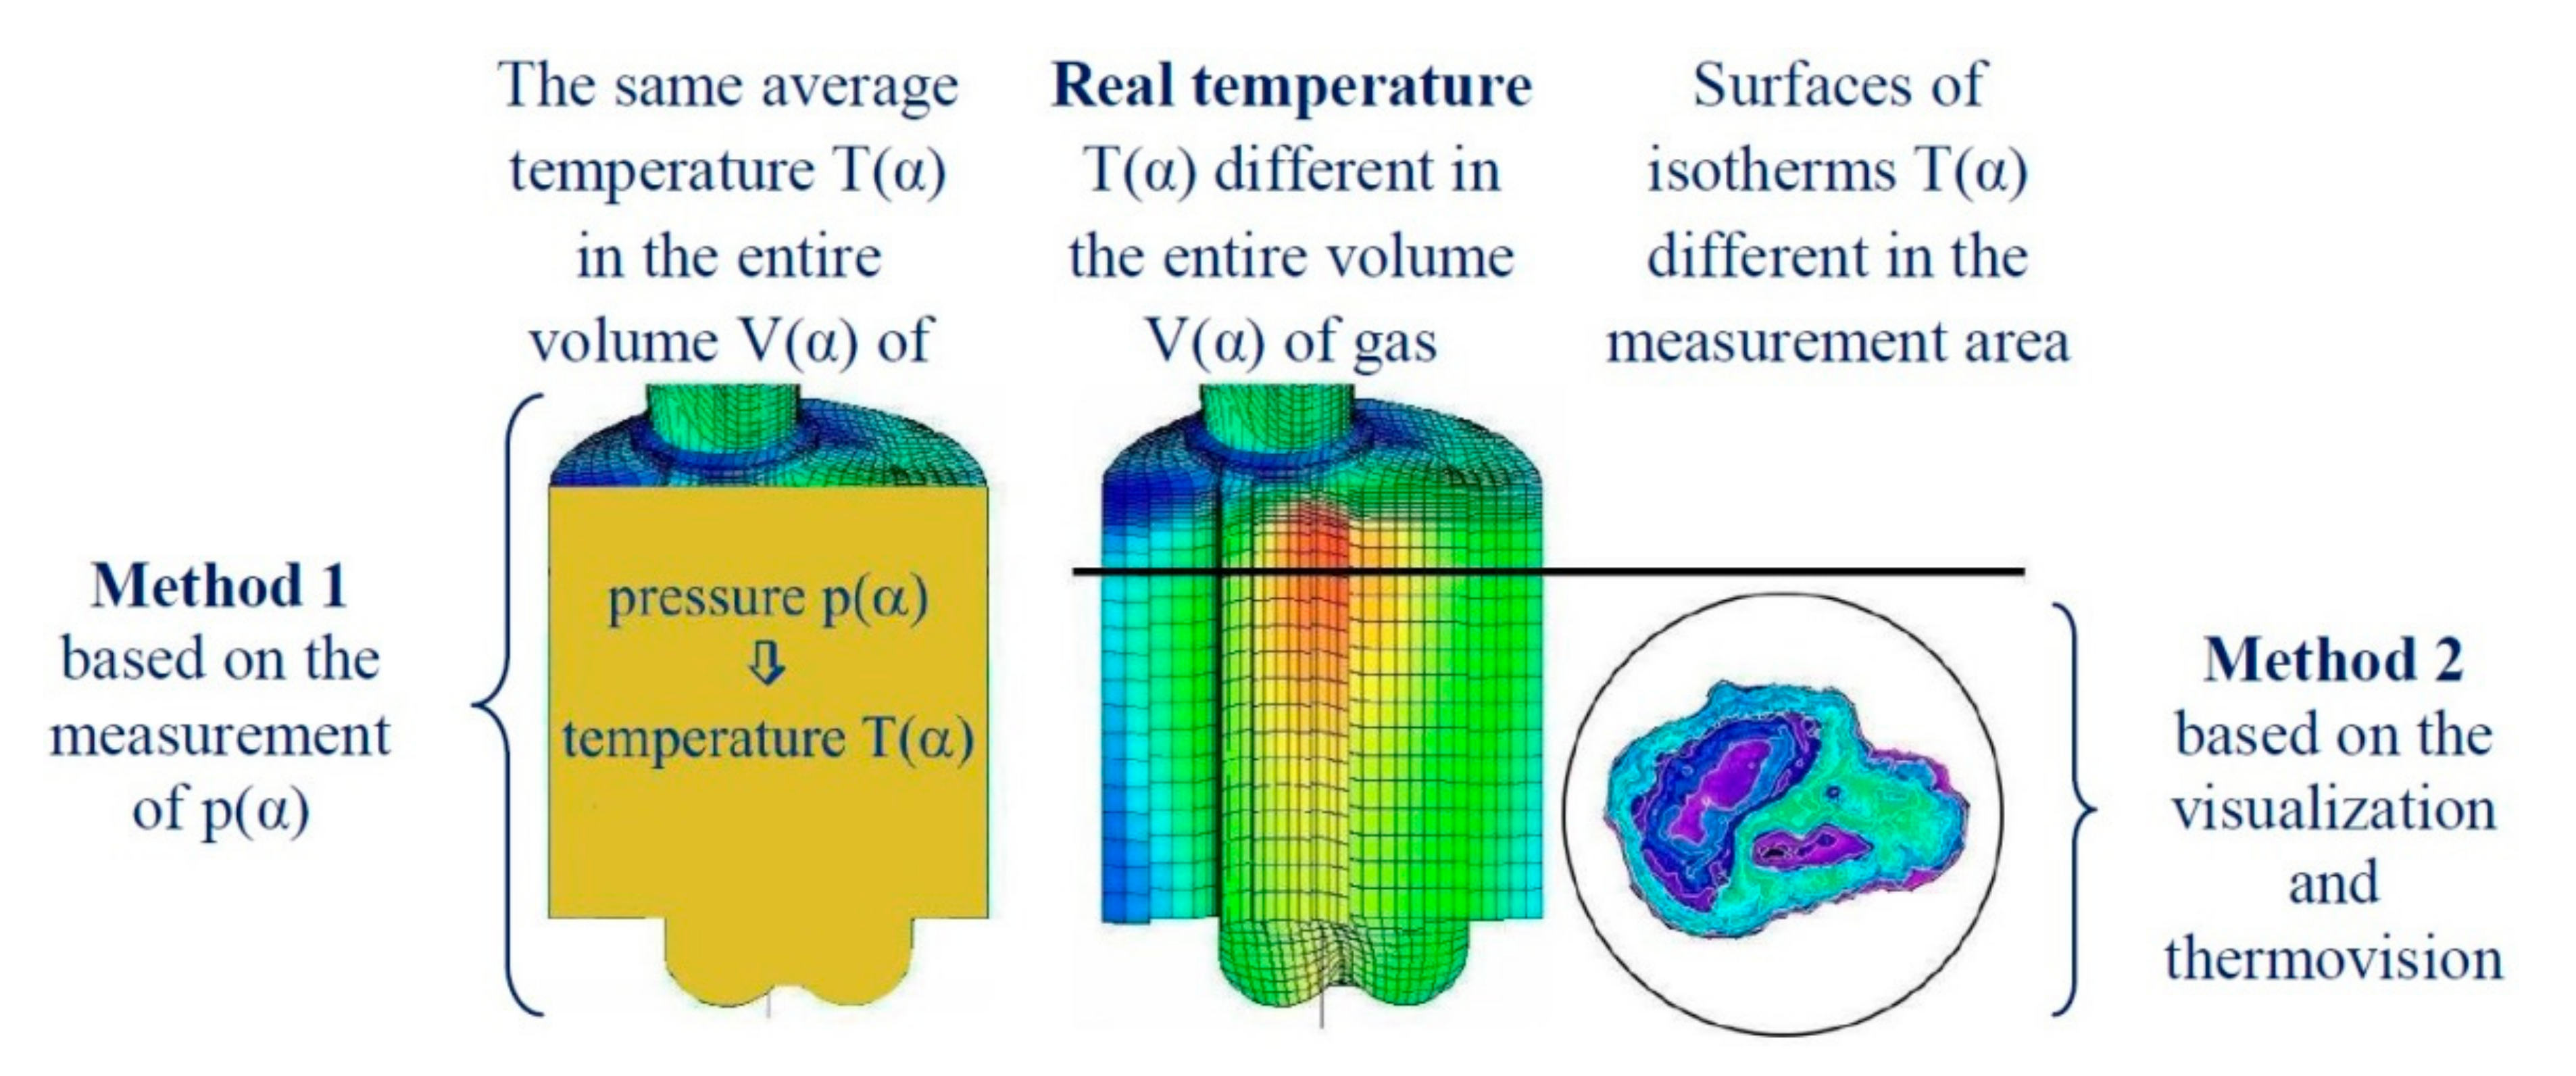
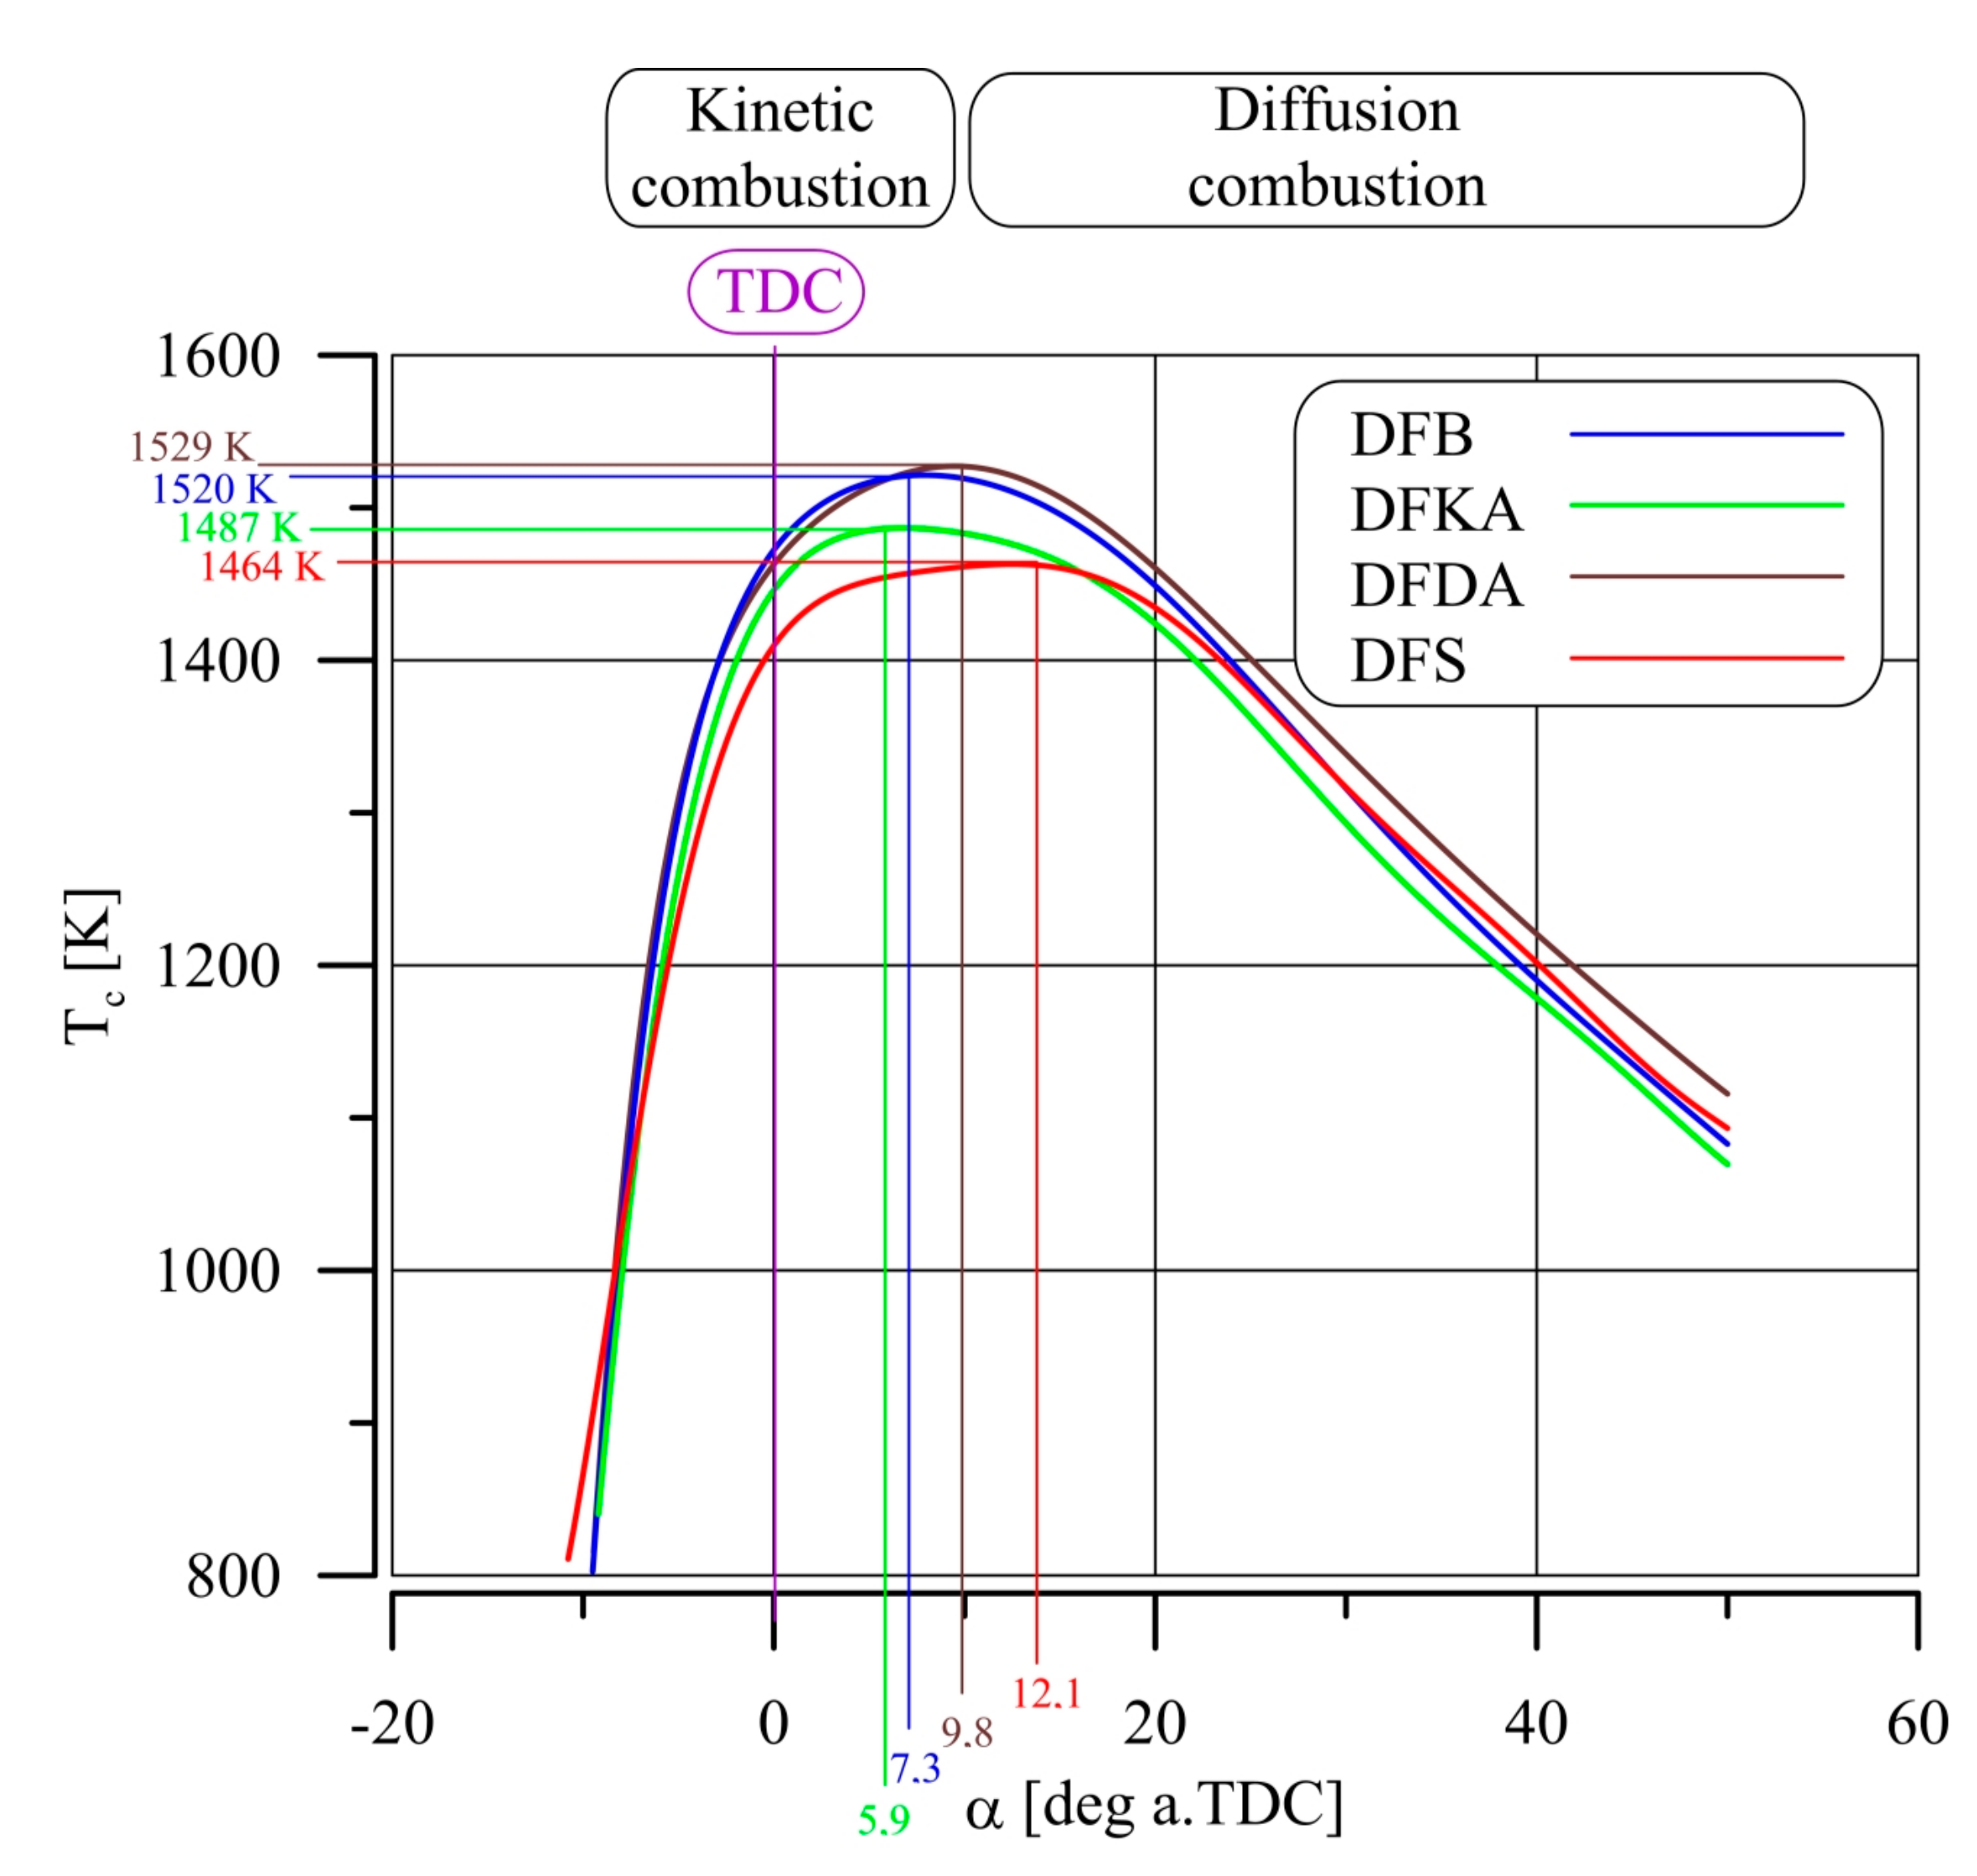
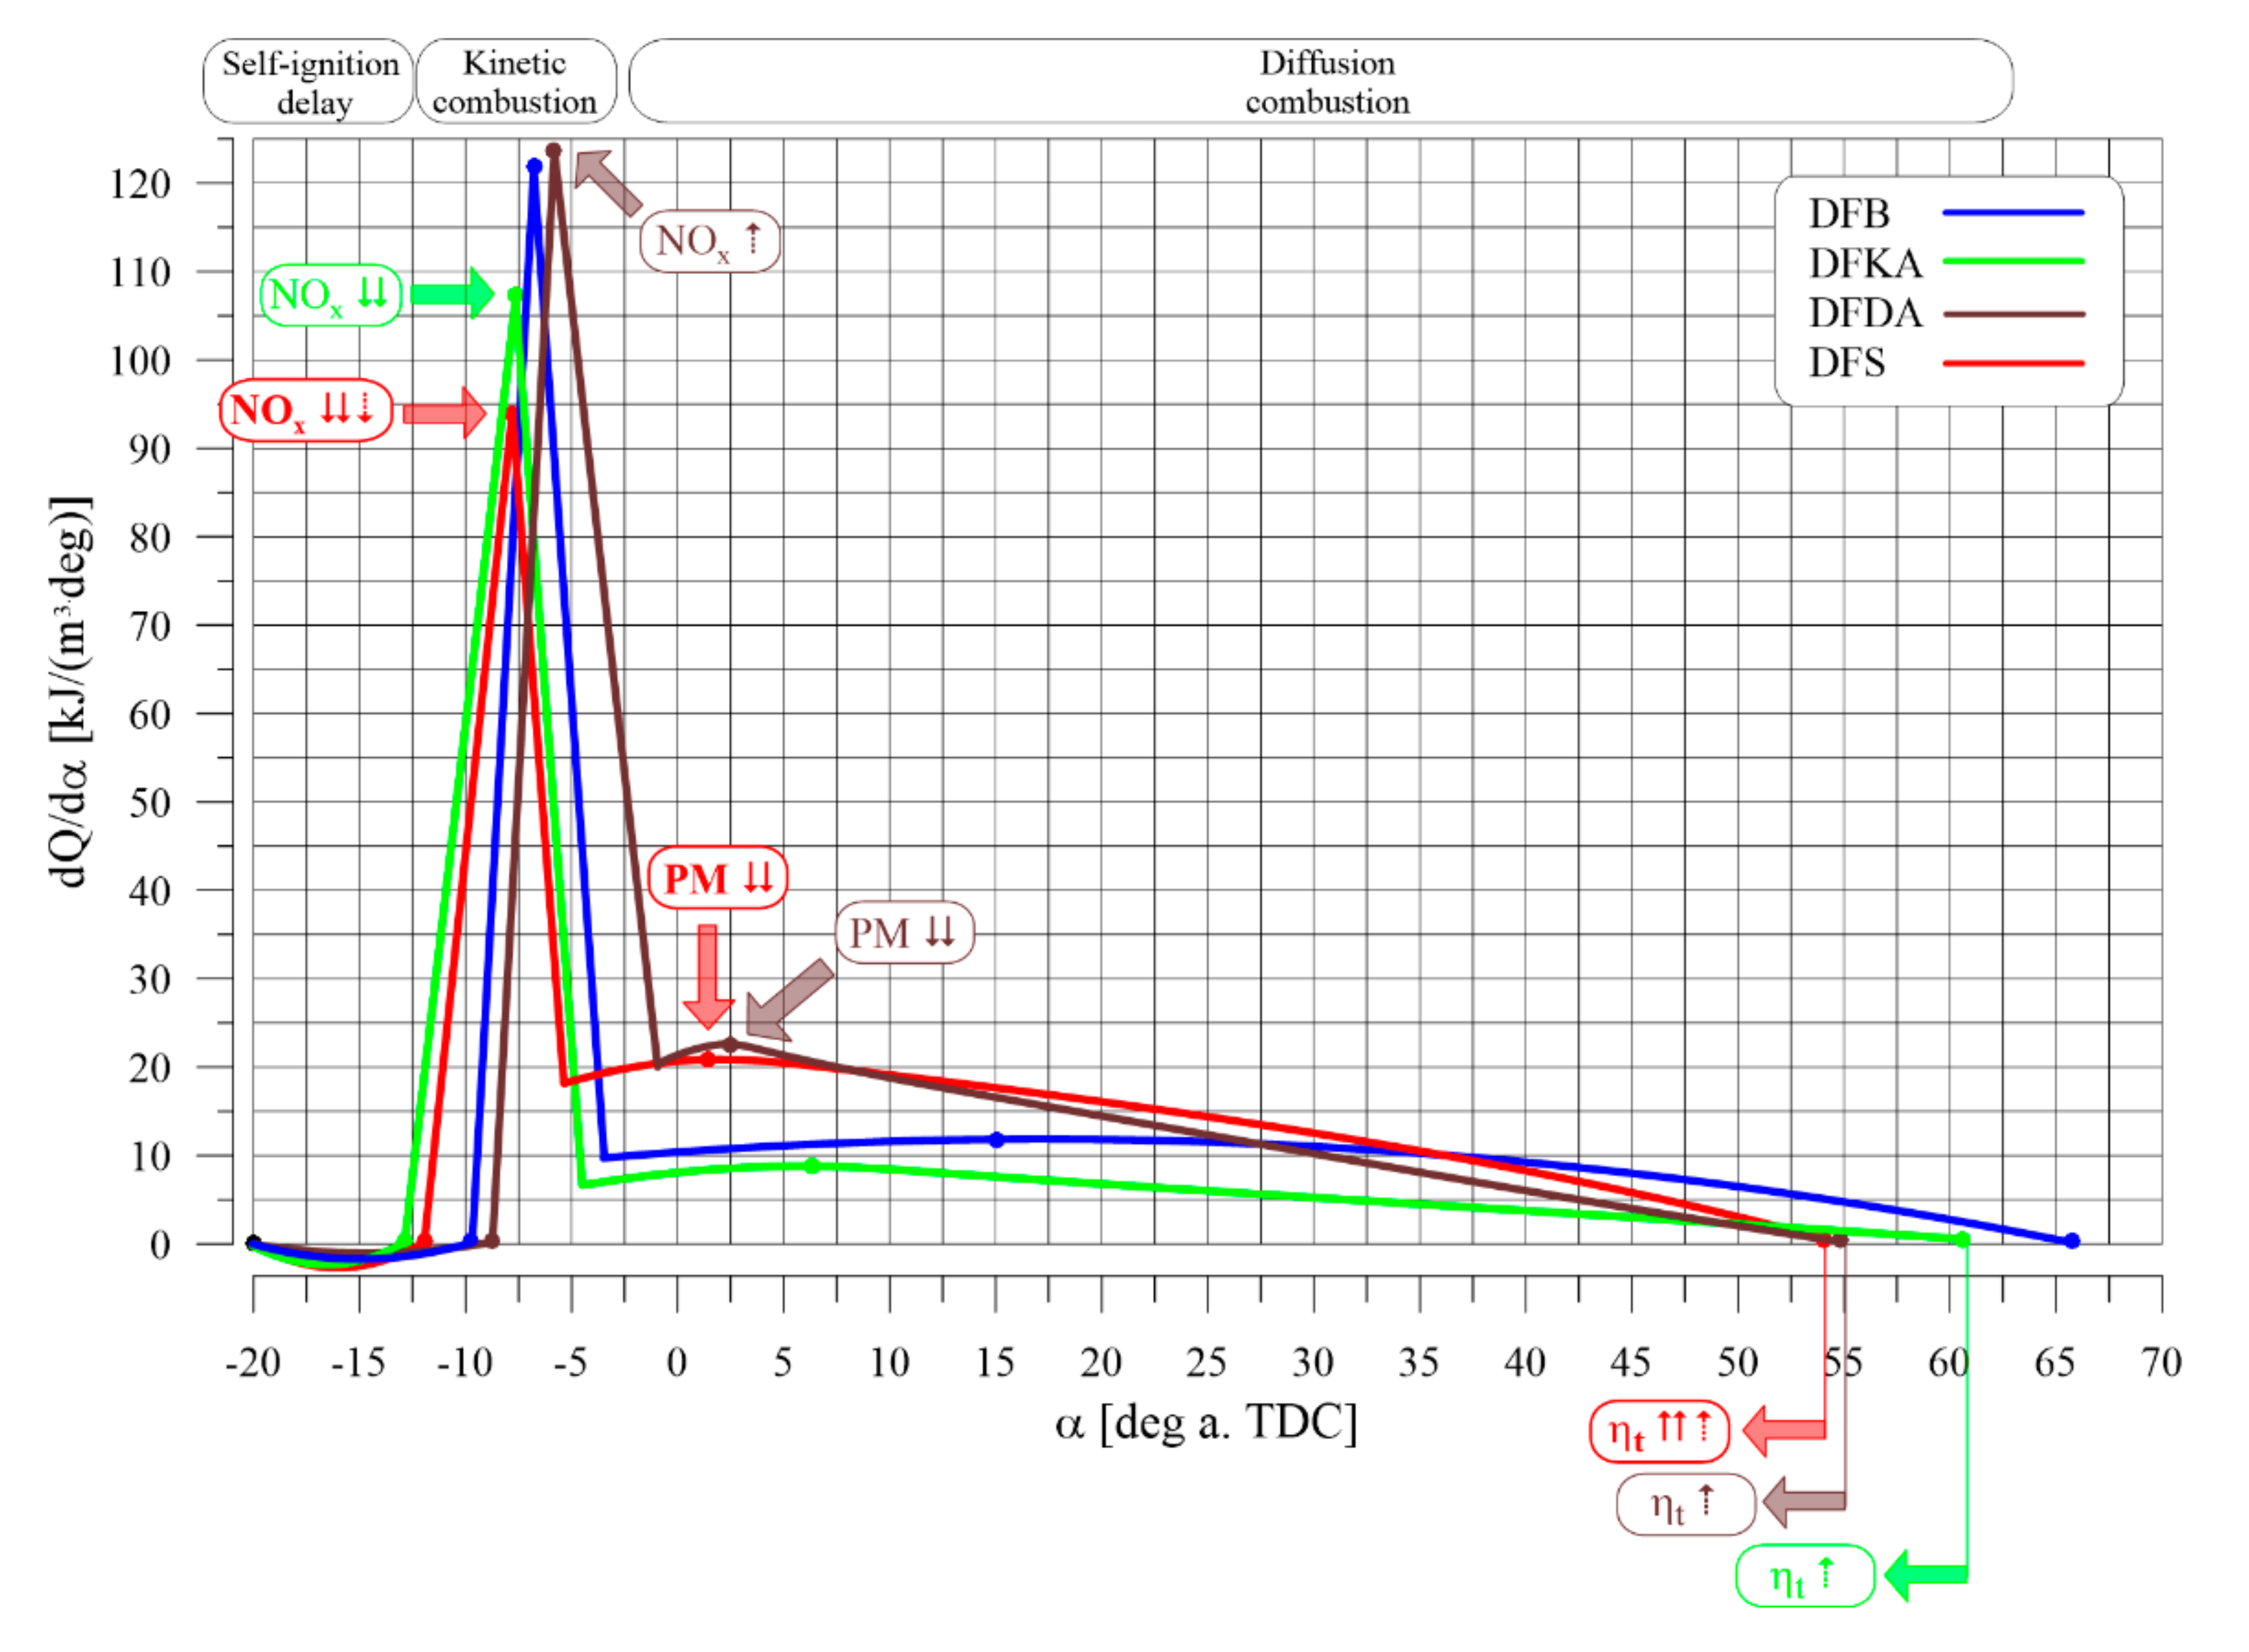
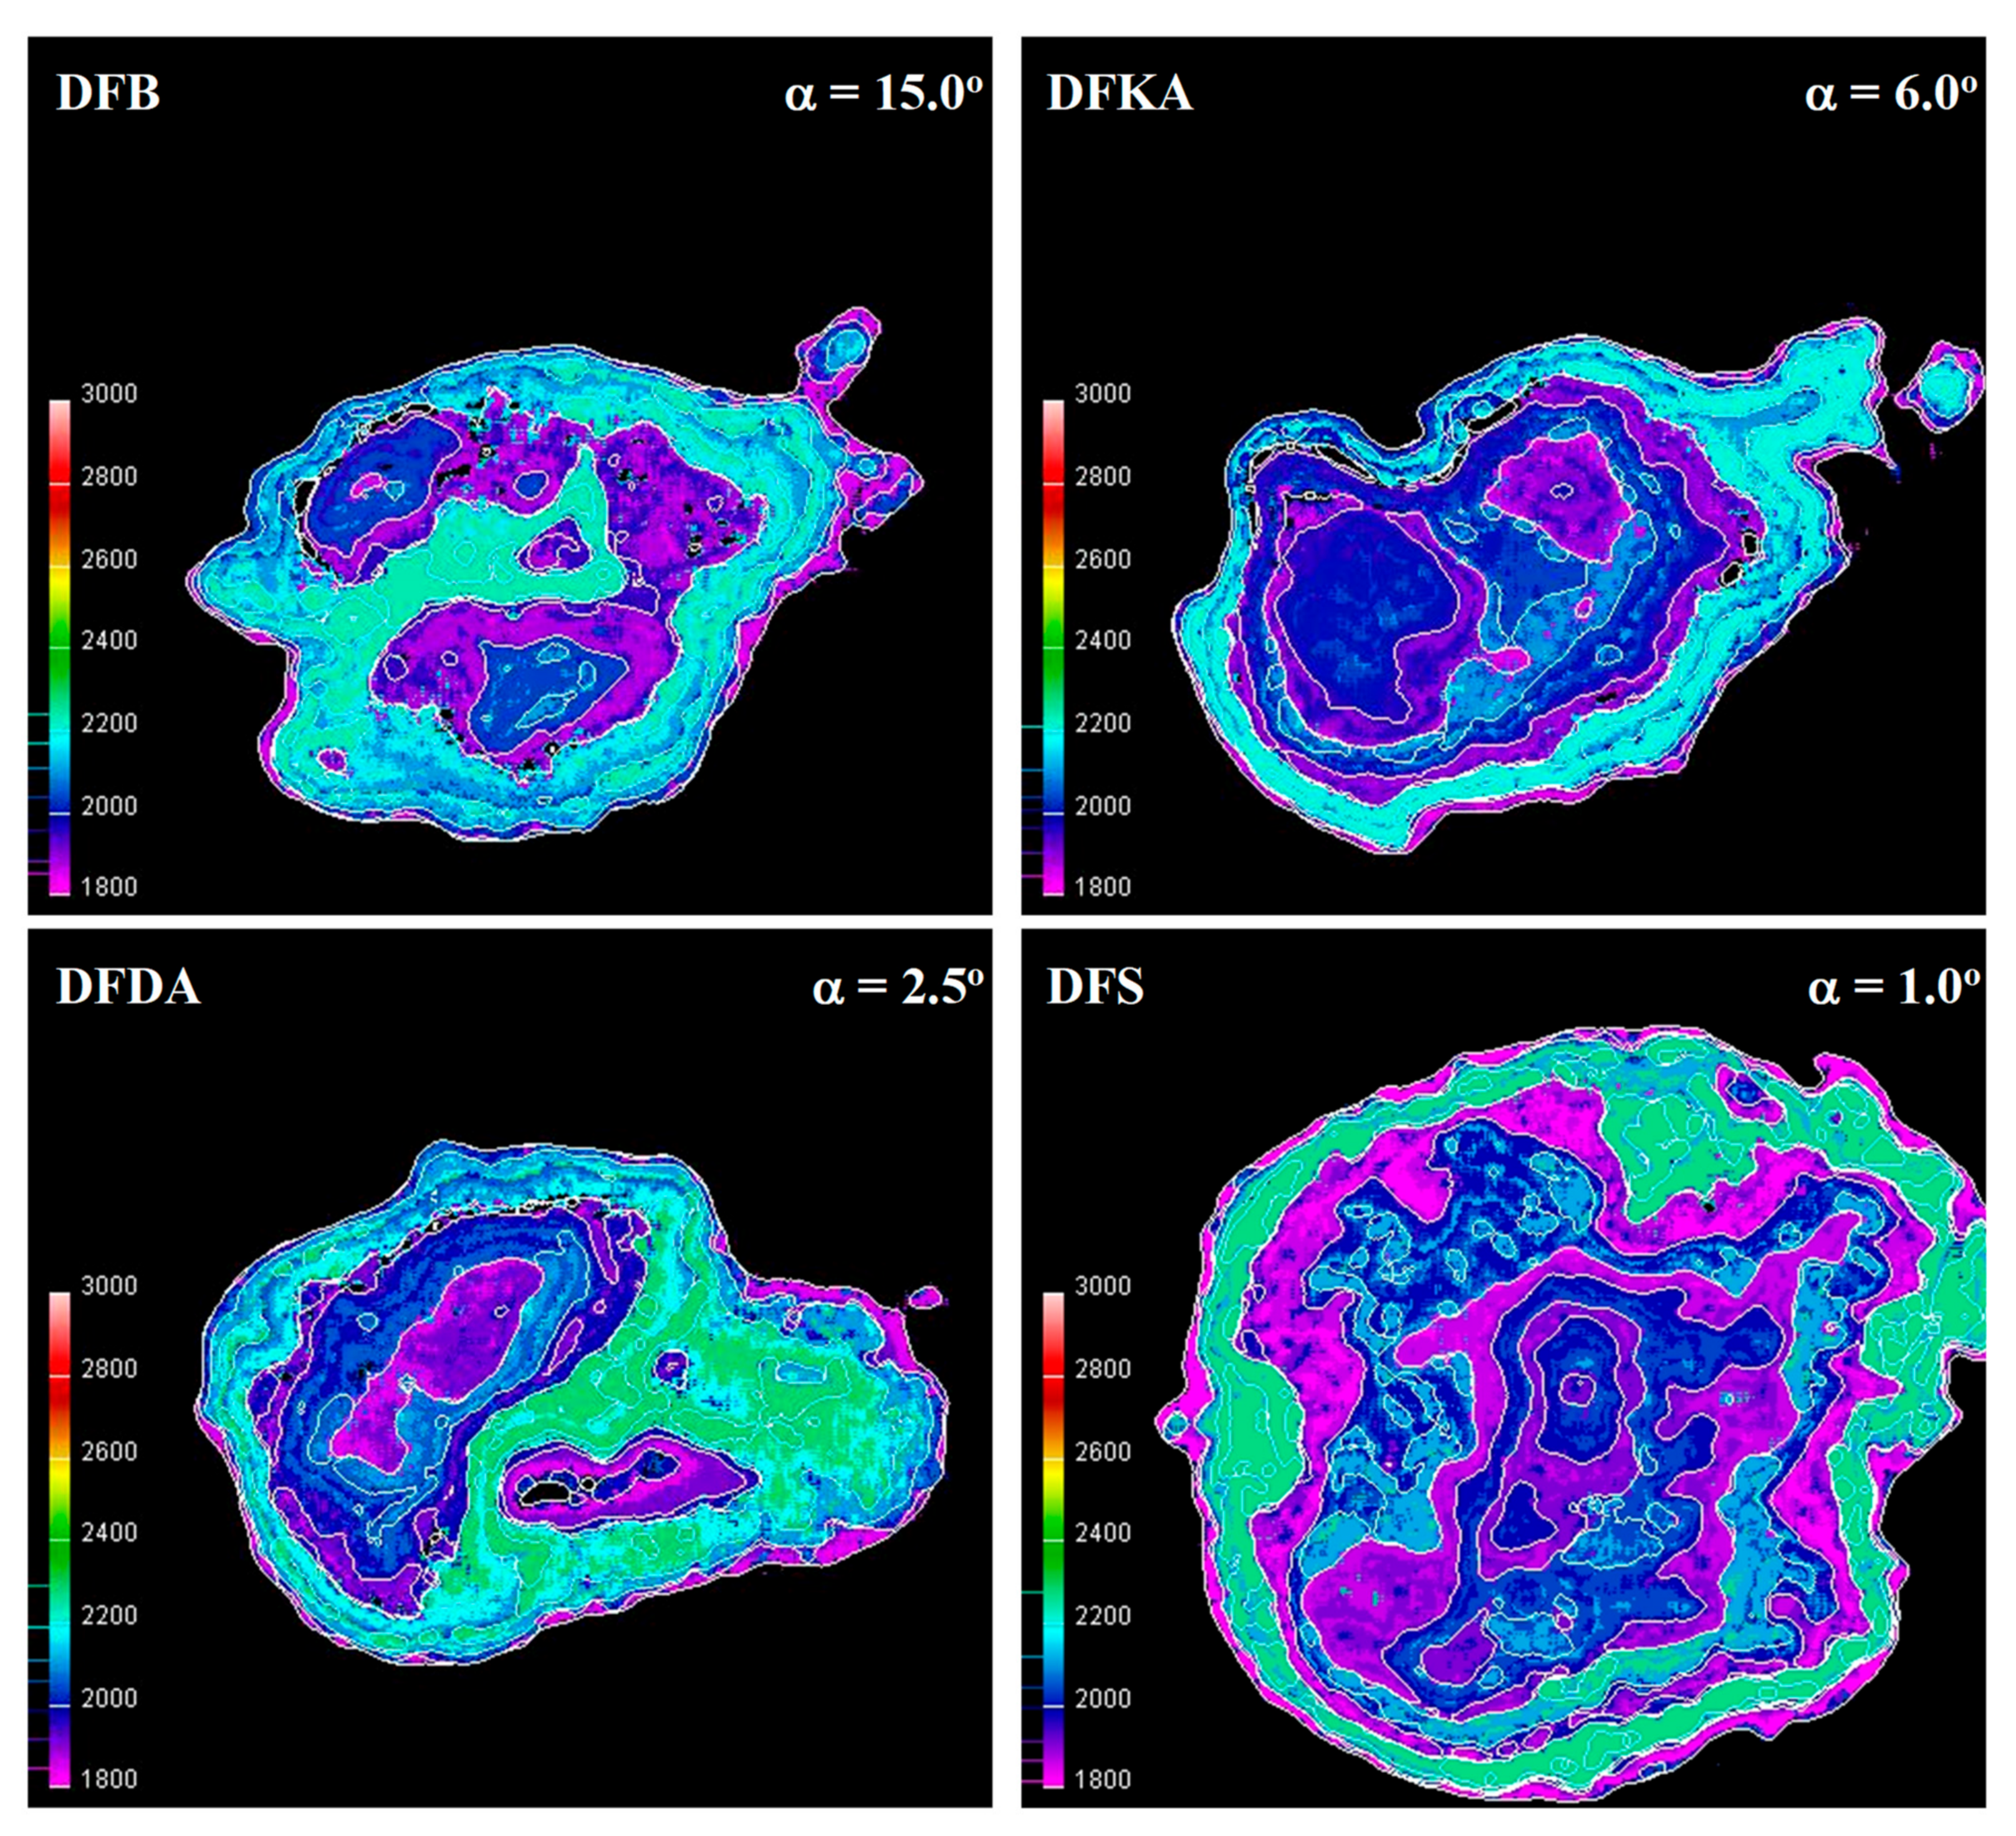
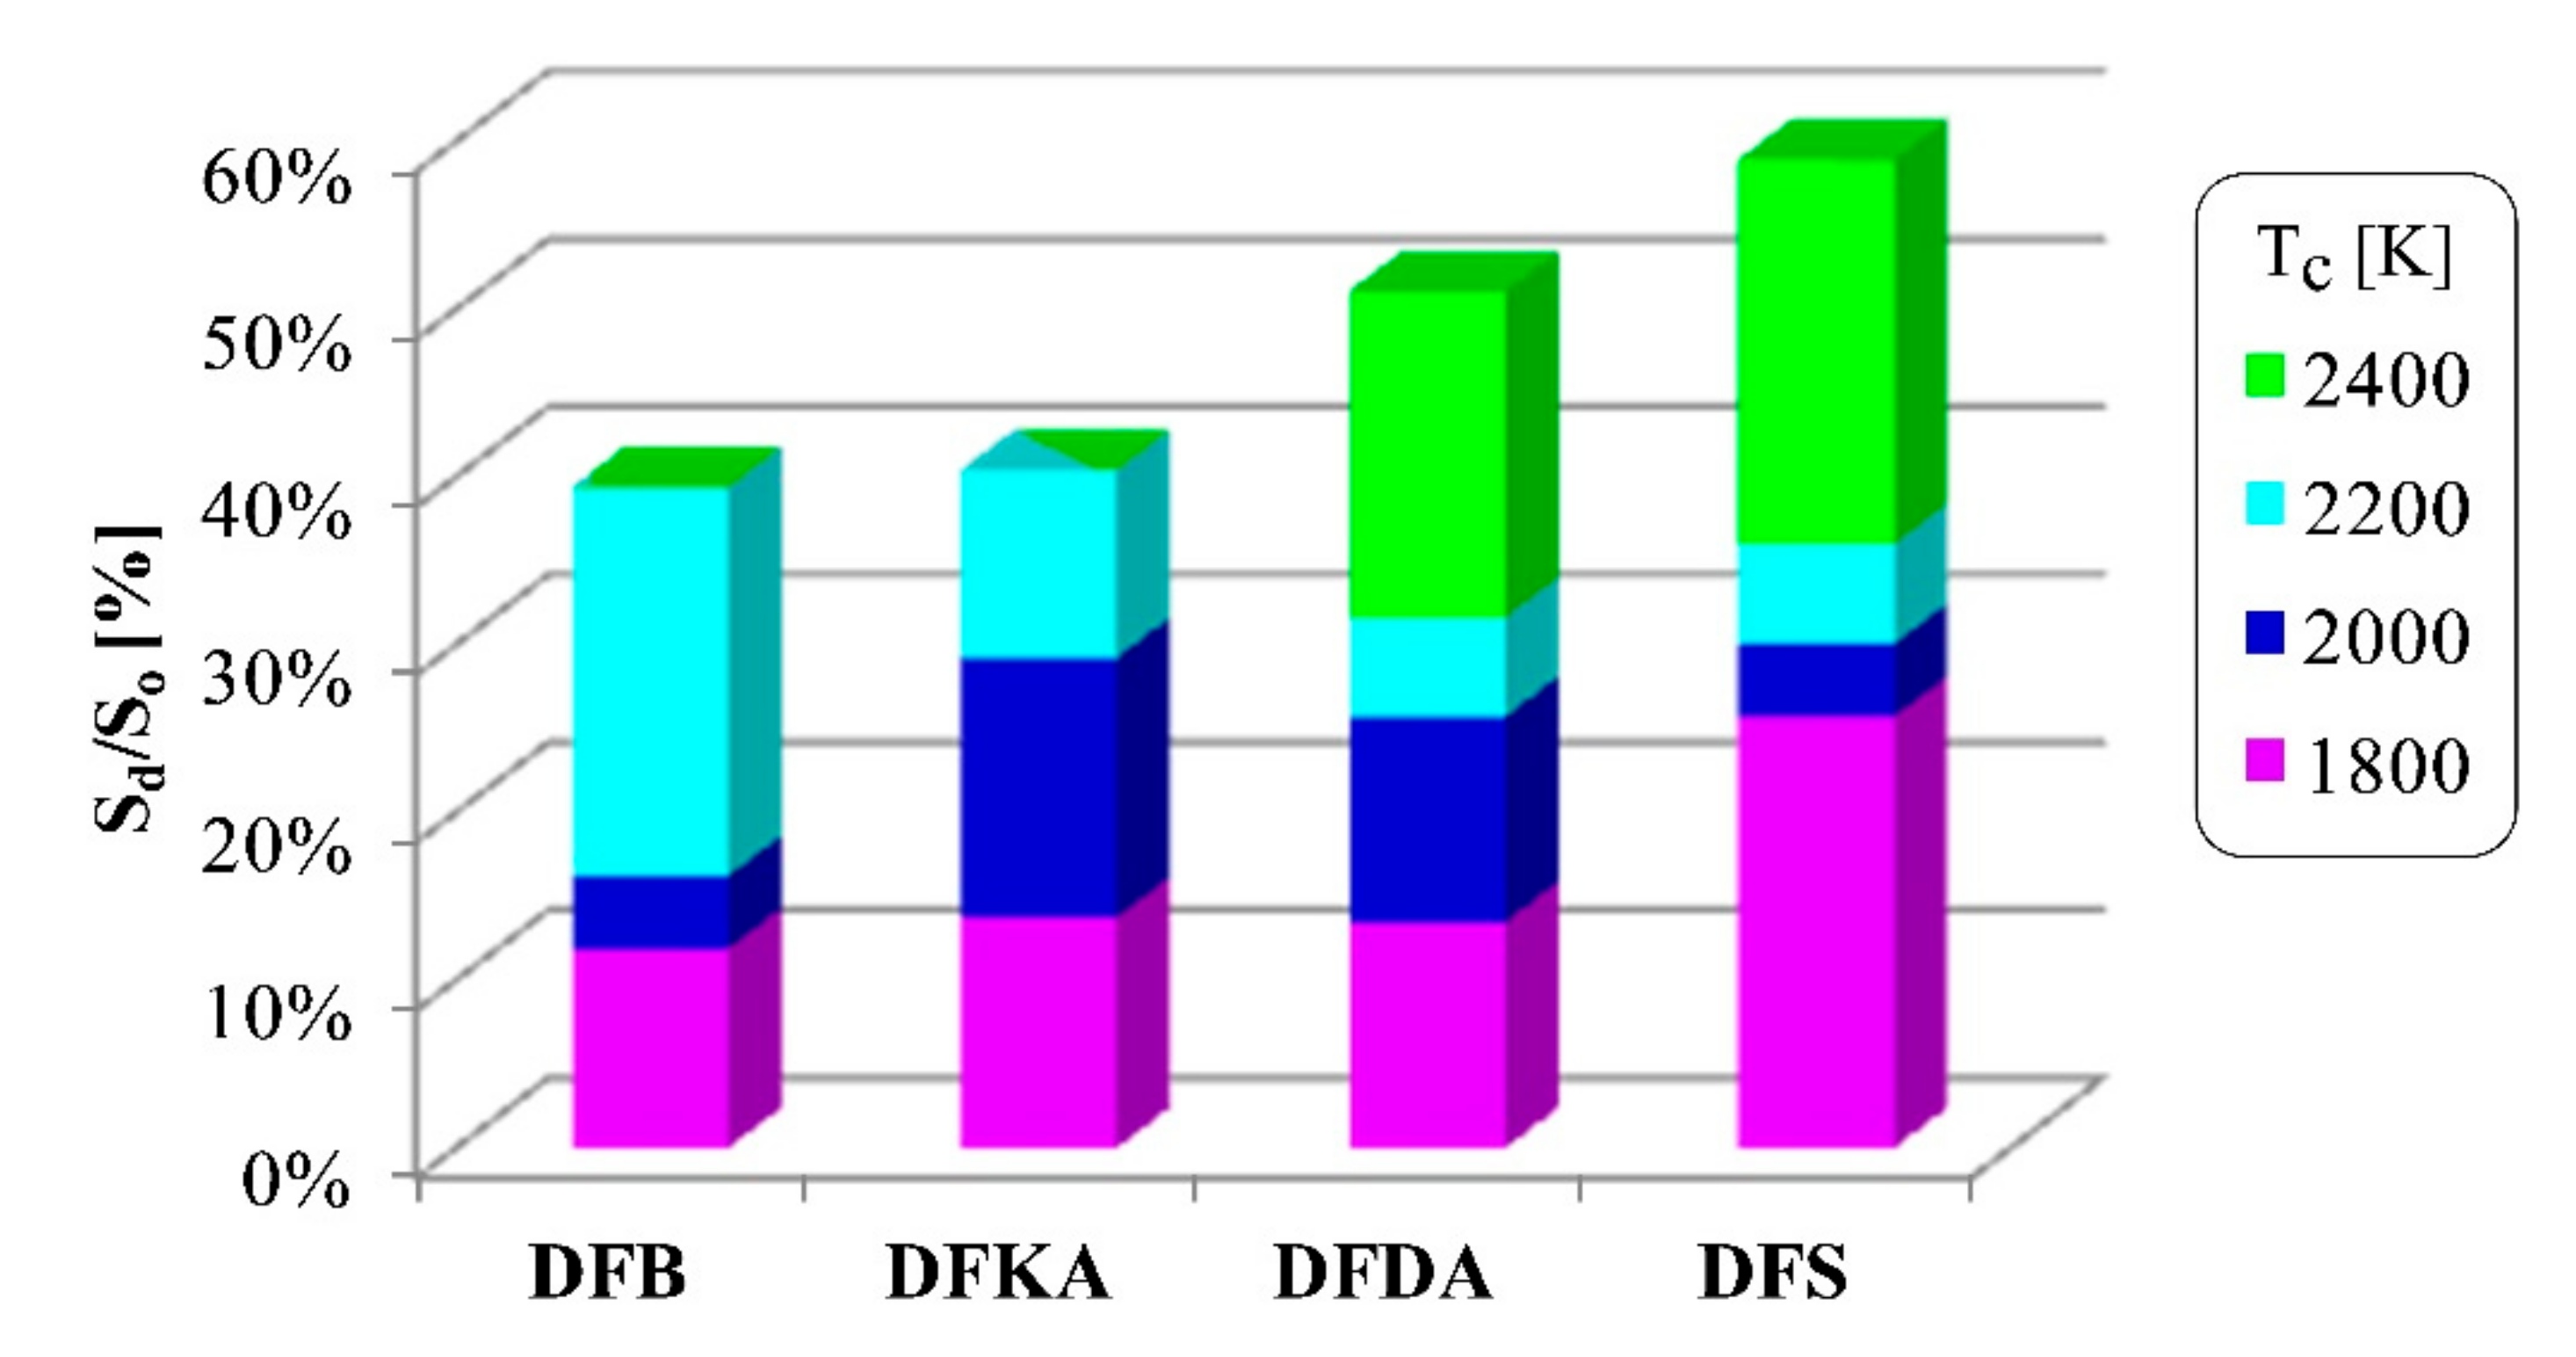
  • The combustion process involves a heterogeneous fuel–air mixture, resulting in an uneven temperature distribution in the volume of the working medium for a given engine crankshaft angle of rotation. Thus, the combustion temperature (the main cause of NOx formation) is a function of several variables (even at a single point in engine operation), including the crankshaft angle of rotation and the location in the working medium. From the perspective of NOx formation, the average combustion temperature in the volume of the working medium is as important as the size of the working medium area with high-temperature isotherms. The larger the working medium area with isotherms with temperatures above 1000 K, the more NOx is generated in the engine cylinder,
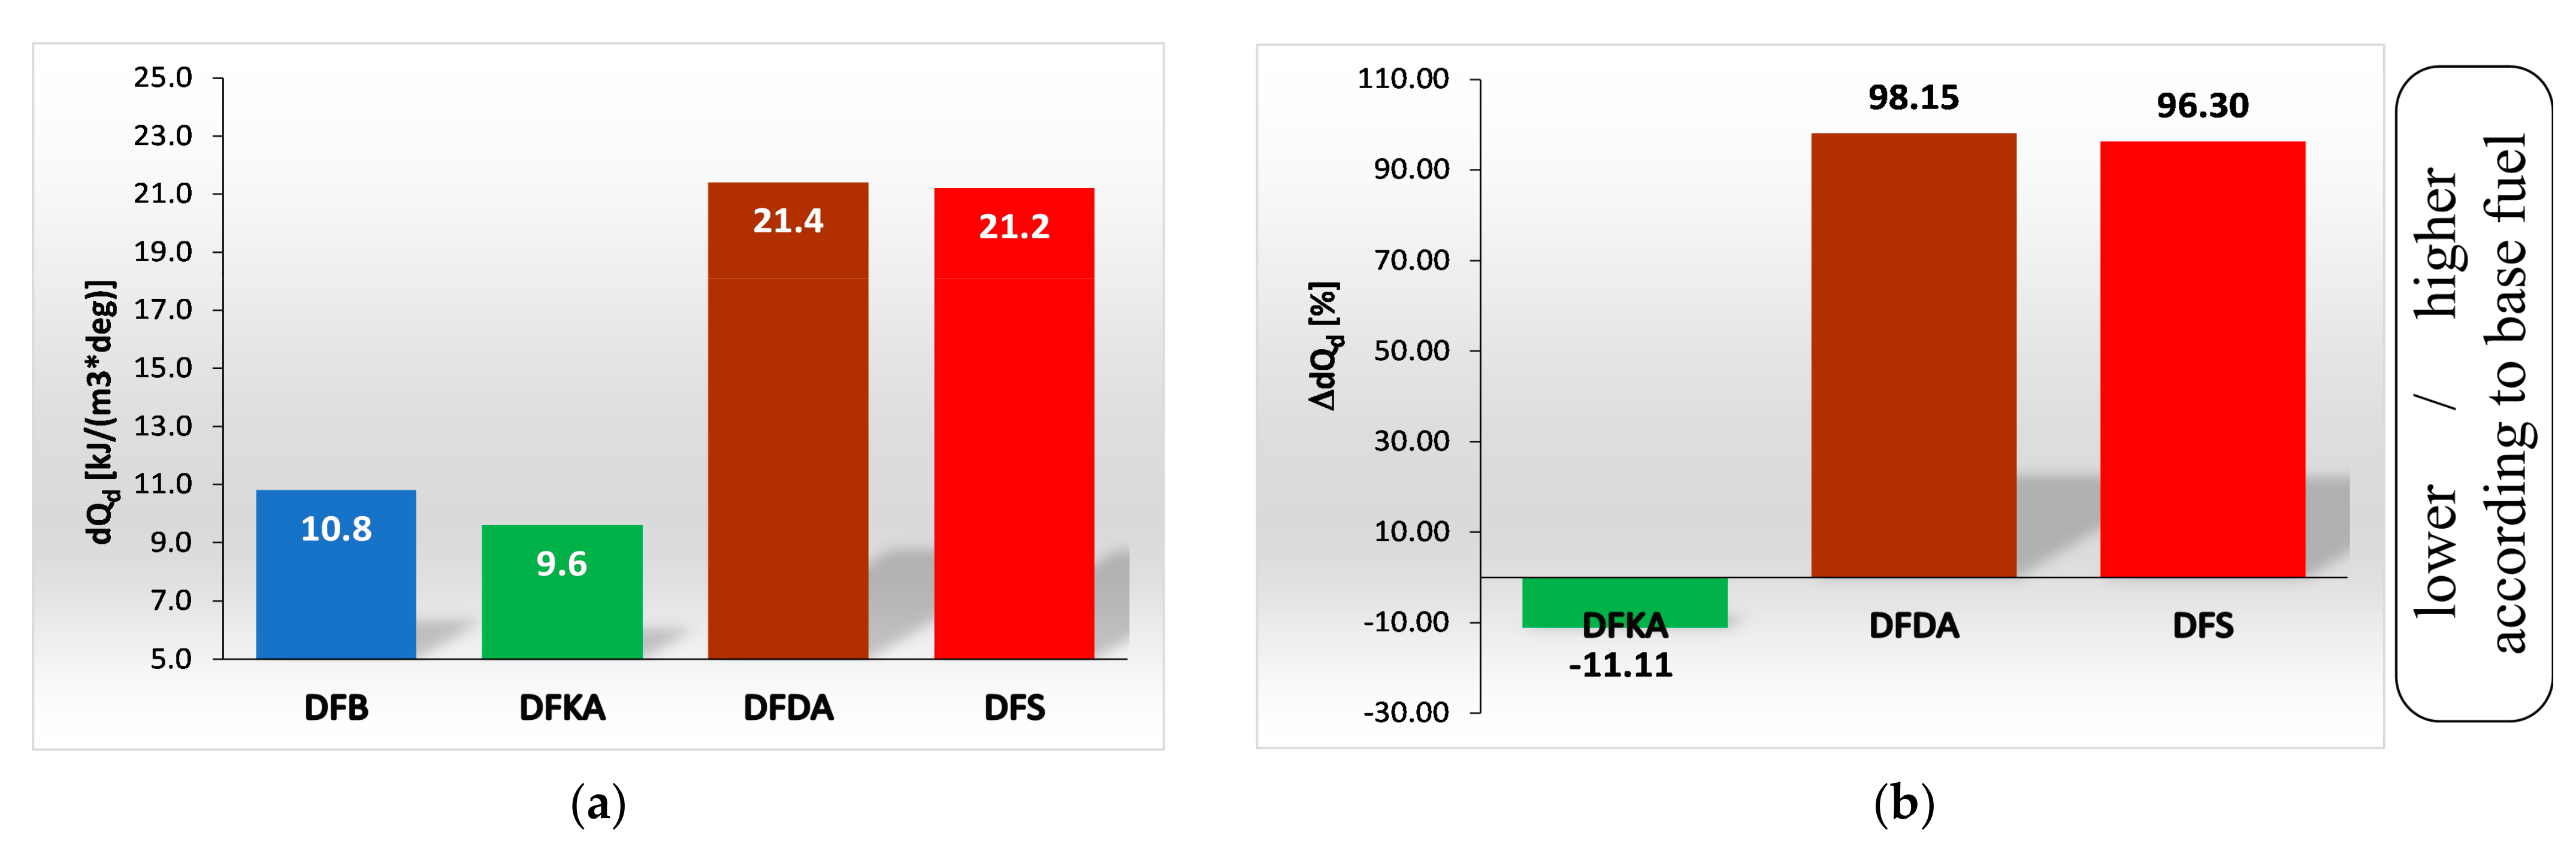
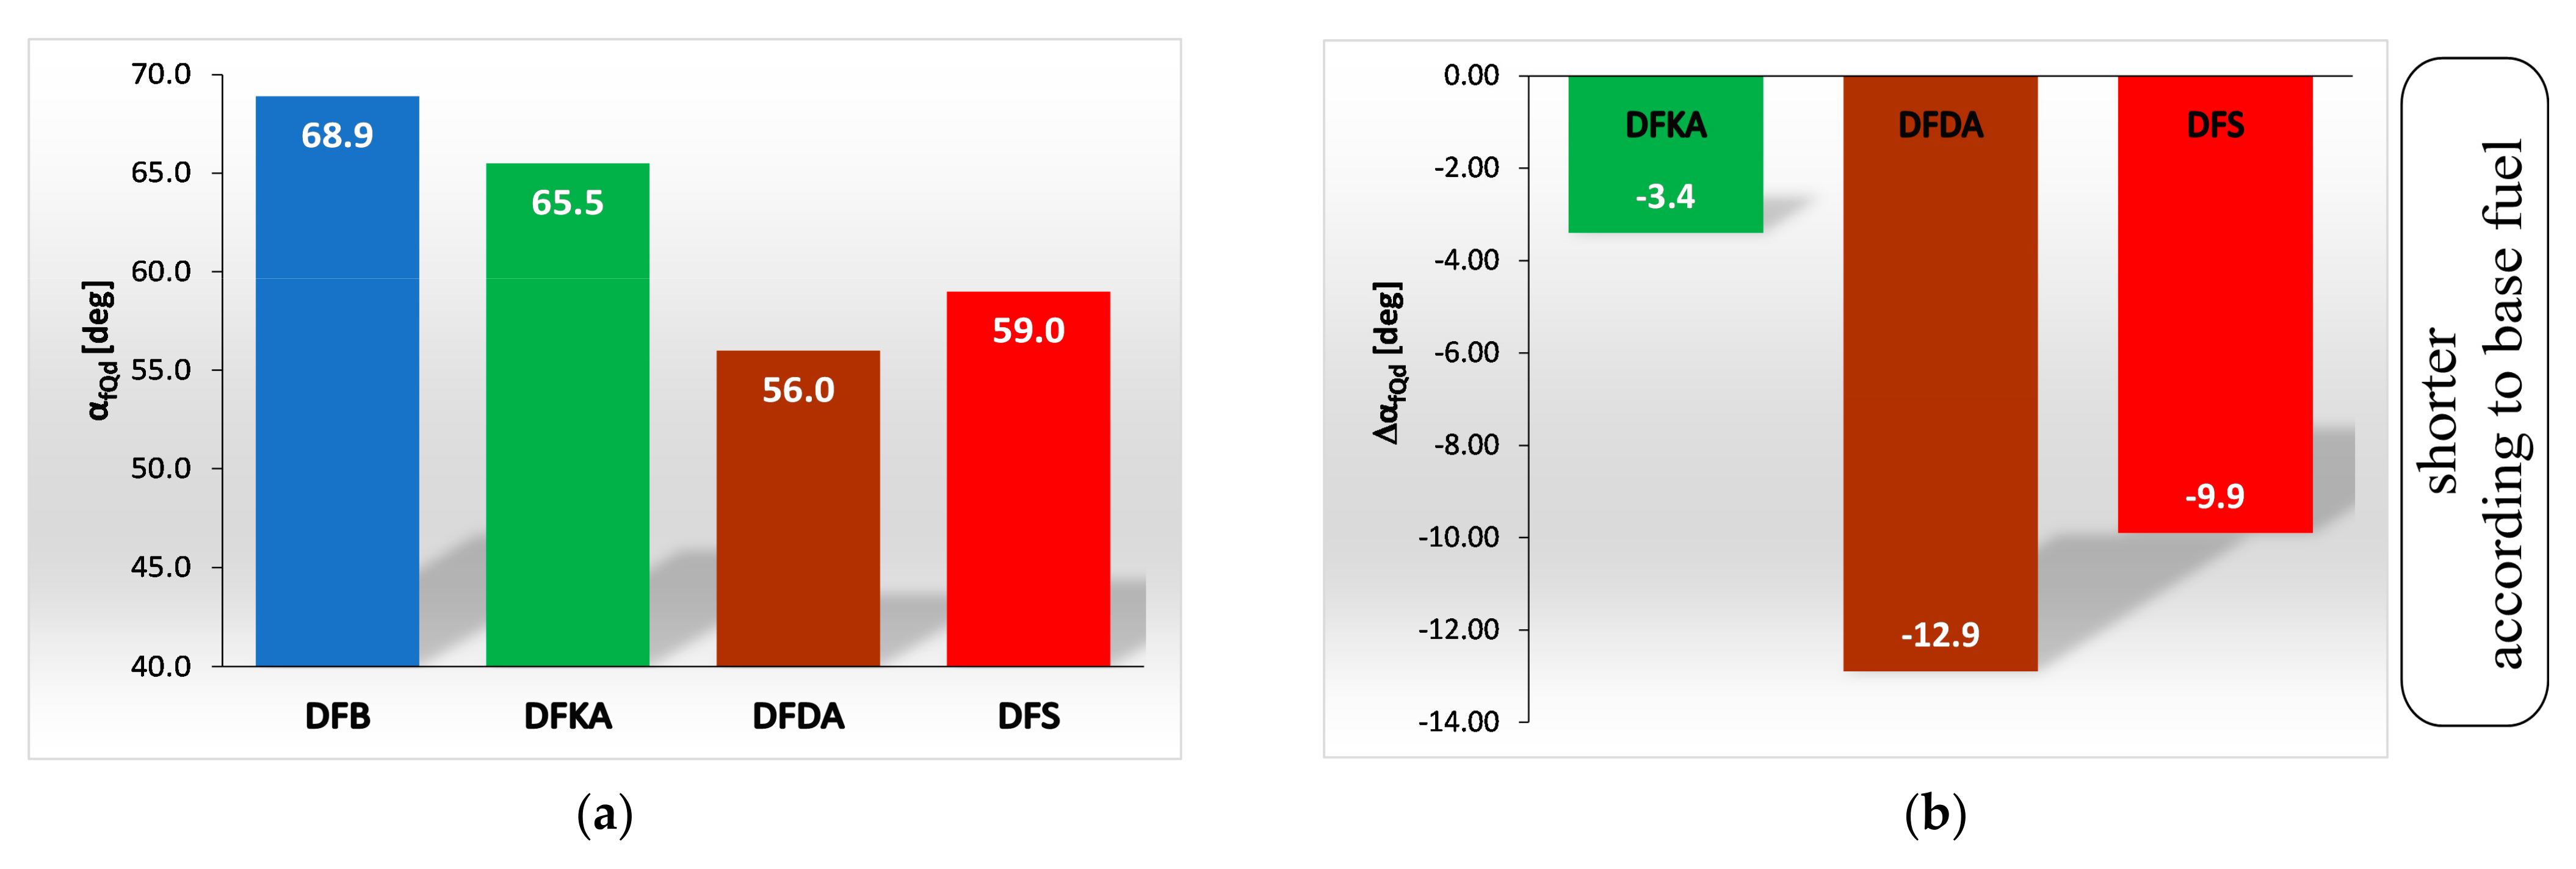
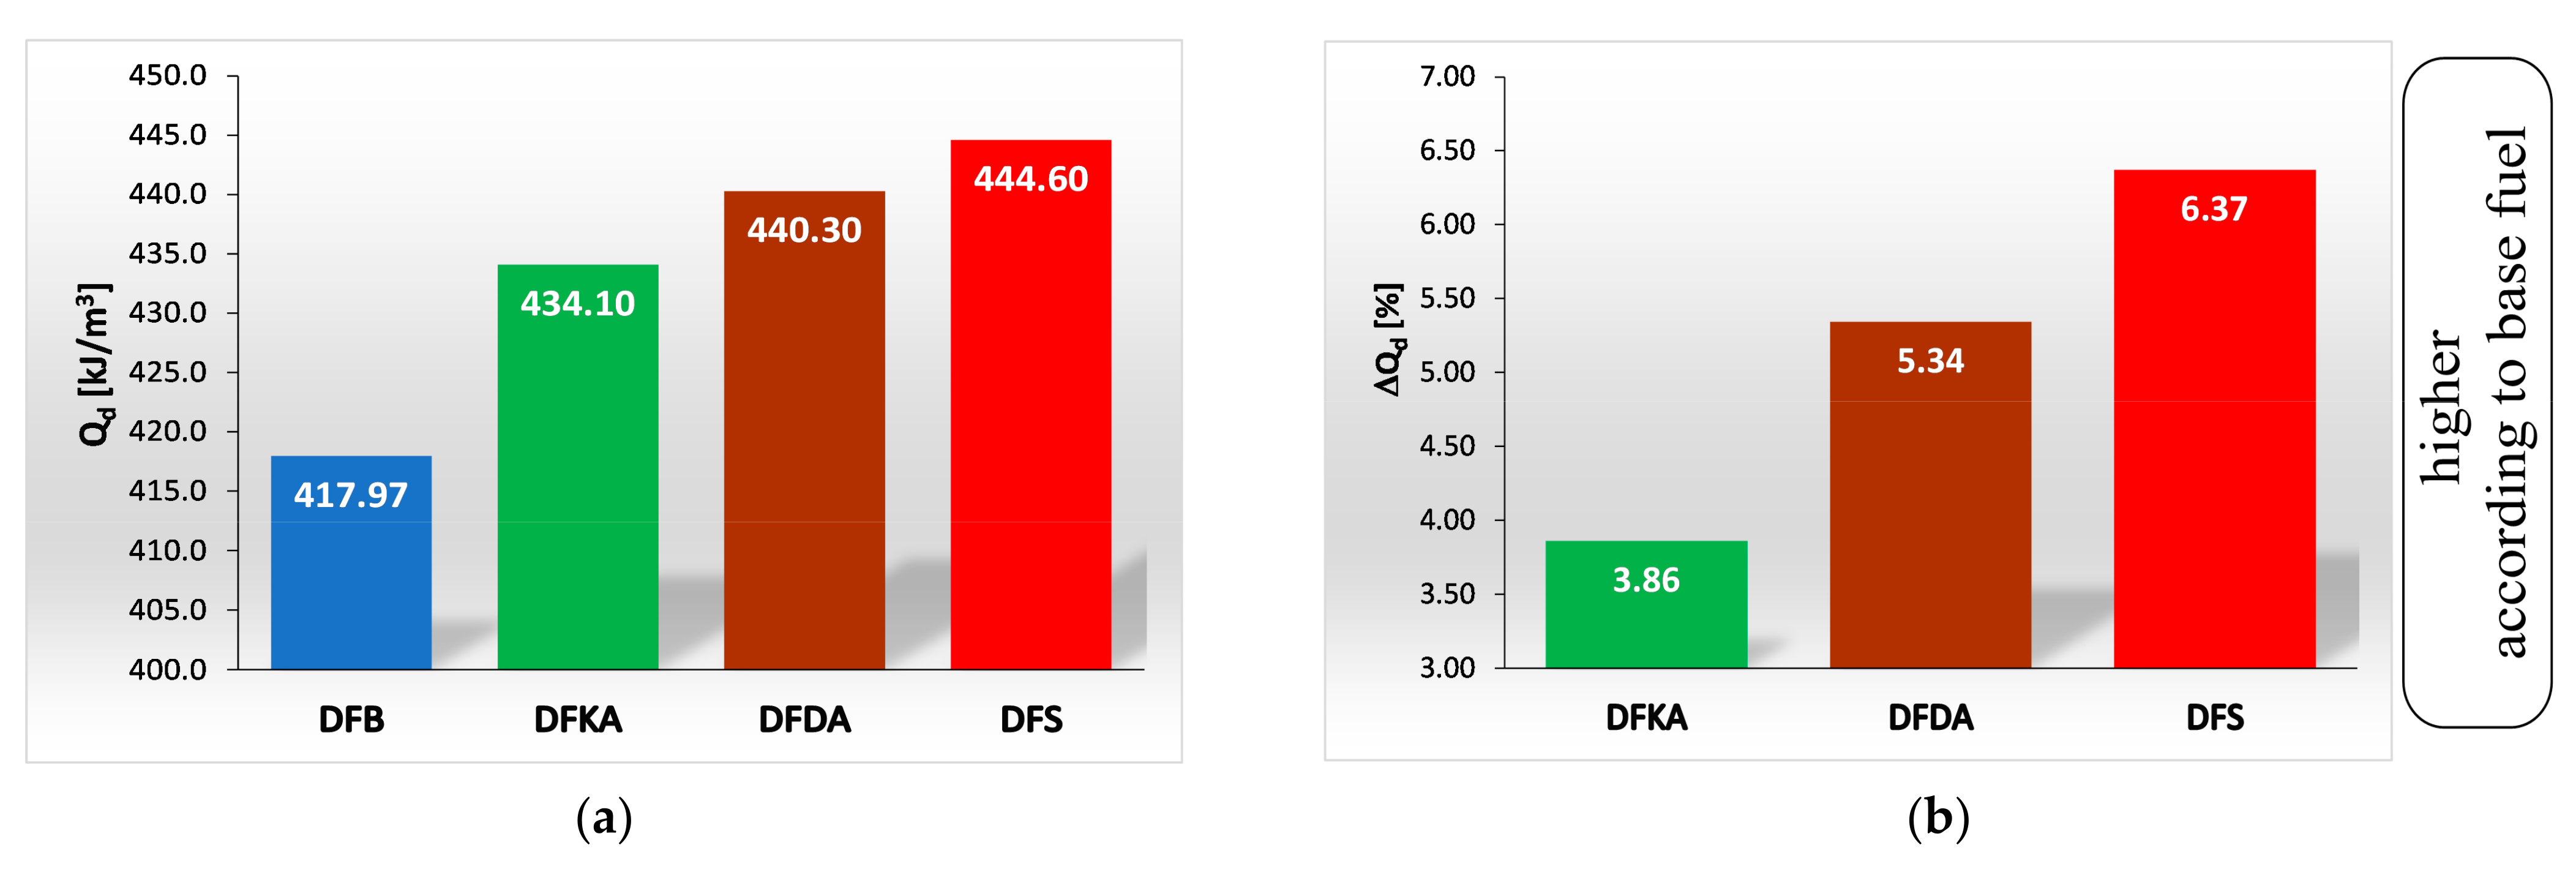
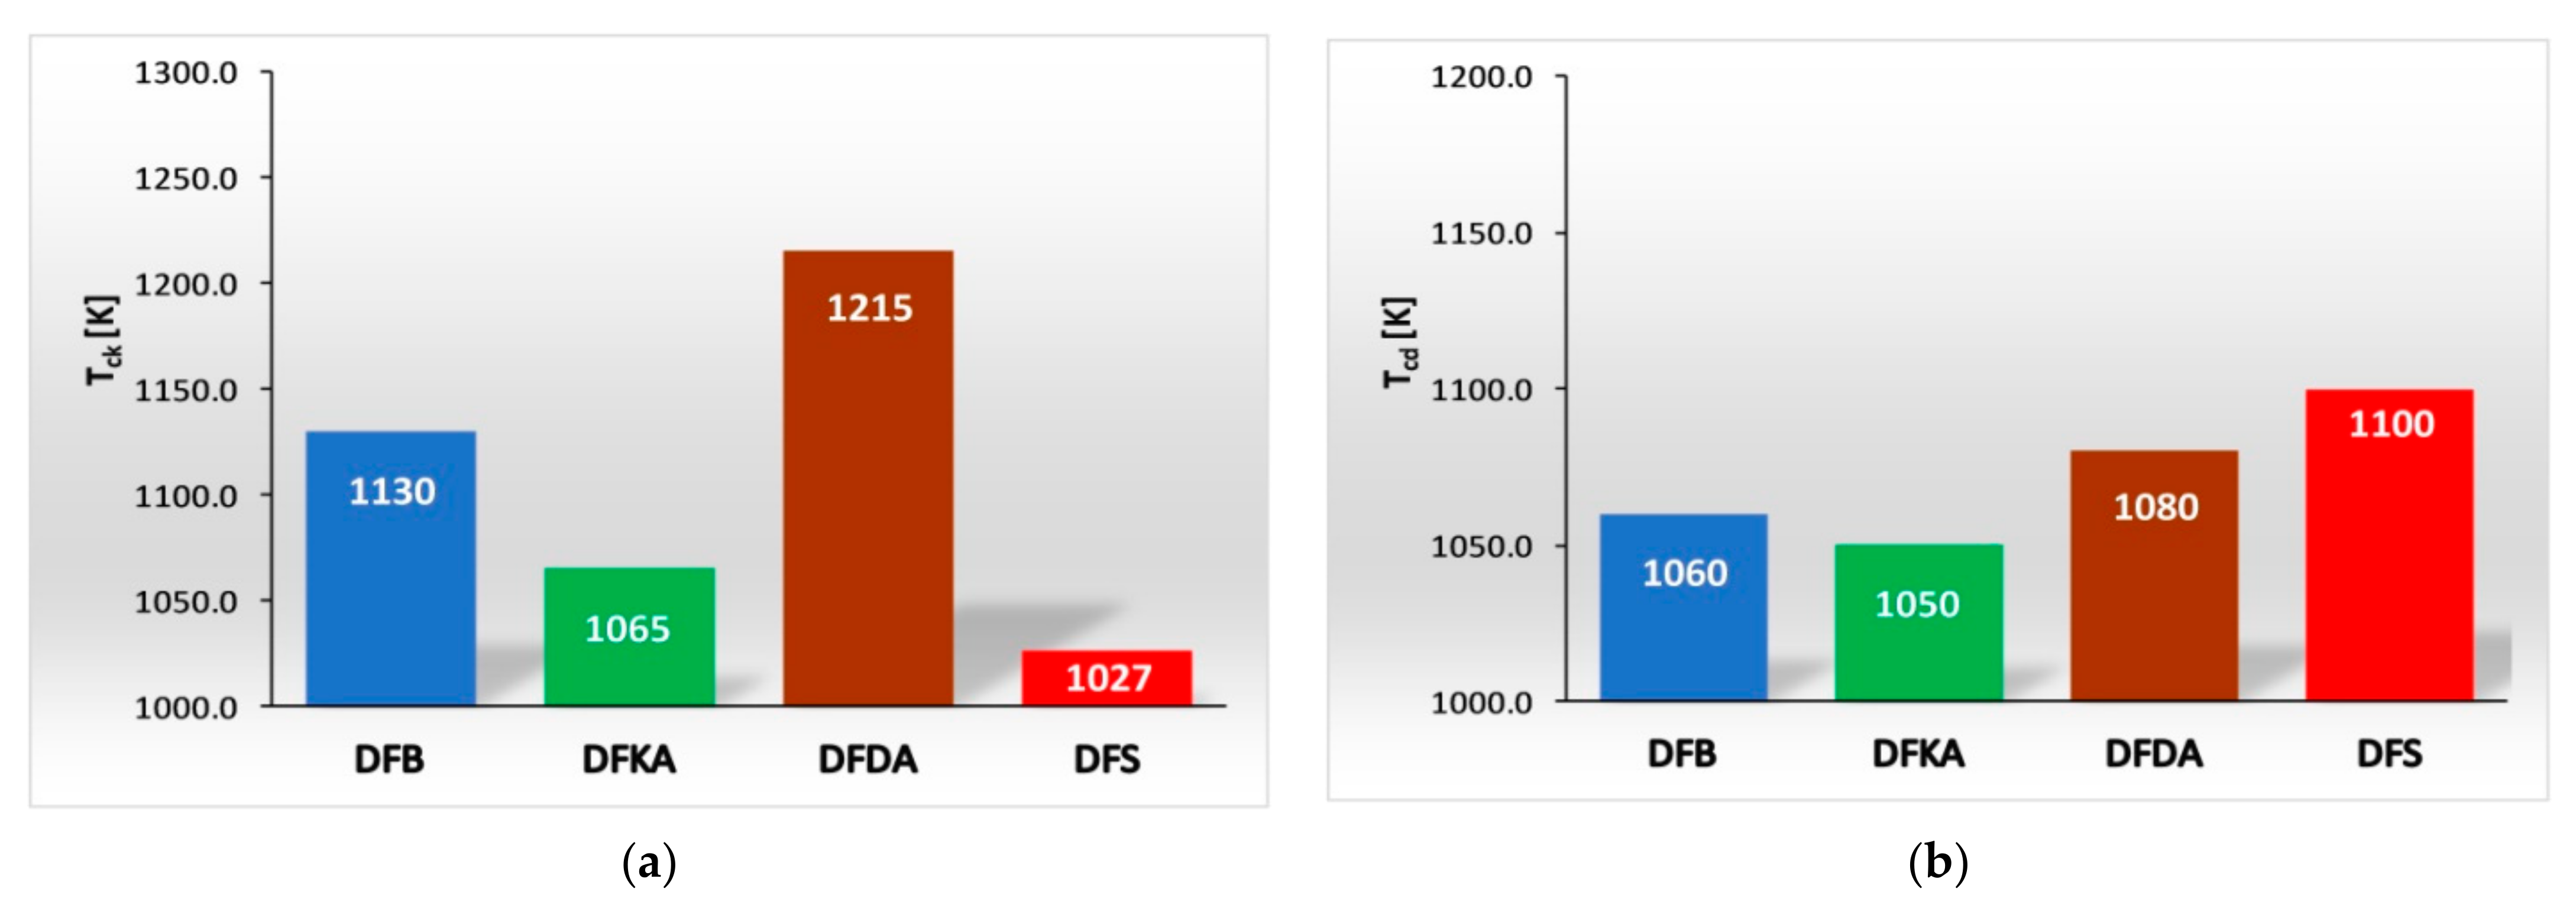
  • The combustion process in a compression ignition engine is a bimodal process; it consists of a kinetic combustion phase (auto-ignition and combustion of fuel accumulated in the combustion chamber during auto-ignition delay period τc) and a diffusion combustion phase (combustion rate is dependent on injection speed fuel, as the diffusion mixing of fuel with air at high temperature is such a fast process that it does not limit the combustion rate of the injected fuel). Thus, it is most often assumed that the maximum kinetic combustion velocity (dQk) is responsible for the NOx produced [49]. The mechanism of NOx formation indicates that the kinetic phase duration (αlQk) must also be important. The longer the kinetic combustion phase lasts, the more NOx is formed. Thus, the heat generated in the kinetic phase of combustion (Qk) is also important. In the end, the duration of high-temperature combustion and the size of the working medium area with these isotherms are significant to the amount of NOx produced (Figure 10). This is similarly true for the diffusion combustion phase. In the literature, it is most often assumed that a higher maximum rate of diffusion combustion produces a lower solid particle emission, as the high rate of heat release in this combustion phase causes afterburning of much of the previously formed solid particles. Thus, in the general balance, the exhaust emission of solid particles is lower. However, for the kinetic phase and NOx, the amount of afterburned PM also depends on the diffusion phase duration (αlQd), because together with the rate of diffusion combustion, it determines the amount of heat (Qd) released in this phase, which is related to the combustion temperature responsible for the combustion of solid particles.
The causes of NOx and PM formation in a diesel engine cylinder are presented in Figure 10.
Figure 10. Factors influencing reduction in NOx and PM emissions in exhaust gas of engine fuelled with DFS (with both tested additives).
Energies 15 04882 g010
To deepen the analysis of the influence of the tested fuel additives on the differences in the NOx and PM emission concentrations in the engine exhaust gas, all previous values are considered in the following sections.
The NOx concentration in the exhaust gas using the tested fuels at the designed engine operating points (rotational speed with maximum engine torque and 55% of maximum torque) is presented in Figure 11. The data show that 2-EHN (reducing kinetic combustion rate) in the DFKA fuel significantly reduces the NOx concentration in the exhaust gas compared to the DFB base fuel (greater than 16%). This is consistent with previous studies [36] using the VW 1.9 TDI engine; depending on the engine load, the NOx concentration in the exhaust gas was reduced by 10–20% compared to the base fuel. Similarly, for DFDA fuel with Reduxco (increasing the rate of diffusion combustion), in both cases (VW 1.9 TDI engine and SB 3.1 engine), an increase in NOx concentration was observed compared to the base fuel. Although the addition of Reduxco to the fuel produced an approximately 8% increase in NOx in the exhaust gas, the combined use of Reduxco with 2-EHN led to an even greater reduction in NOx concentration than with DFKA fuel. In our previous study [36] using the VW 1.9 TDI engine, this reduction was a result of the synergistic effect of these additives in the fuel on the course of the heat release rate, in both the kinetic and diffusion combustion phases. For DFS fuel, the NOx reduction in the exhaust gas was greater than 18%.
The influence of the tested fuels on PM emissions (determined according to applicable standards using an exhaust gas dilution tunnel) is shown in Figure 12. For PM emissions, similar effects were observed in tests using the VW 1.9 TDI engine [36] and in tests using a one-cylinder test engine. DFKA fuel produced a large reduction in NOx concentration in the exhaust gas, and the greatest PM emissions. DFDA fuel (with Reduxco, increasing the rate of diffusion combustion) produced a significant reduction in PM emissions (approximately 24%).
As a result of the synergy influencing the combustion process, only simultaneous use of 2-EHN and Reduxco produced reductions in both NOx concentration and PM emissions in the engine exhaust. This phenomenon is further explained in later sections, in relation to the course of the combustion temperature and the rate of heat release as a function of the combustion time (engine crankshaft rotation angle).

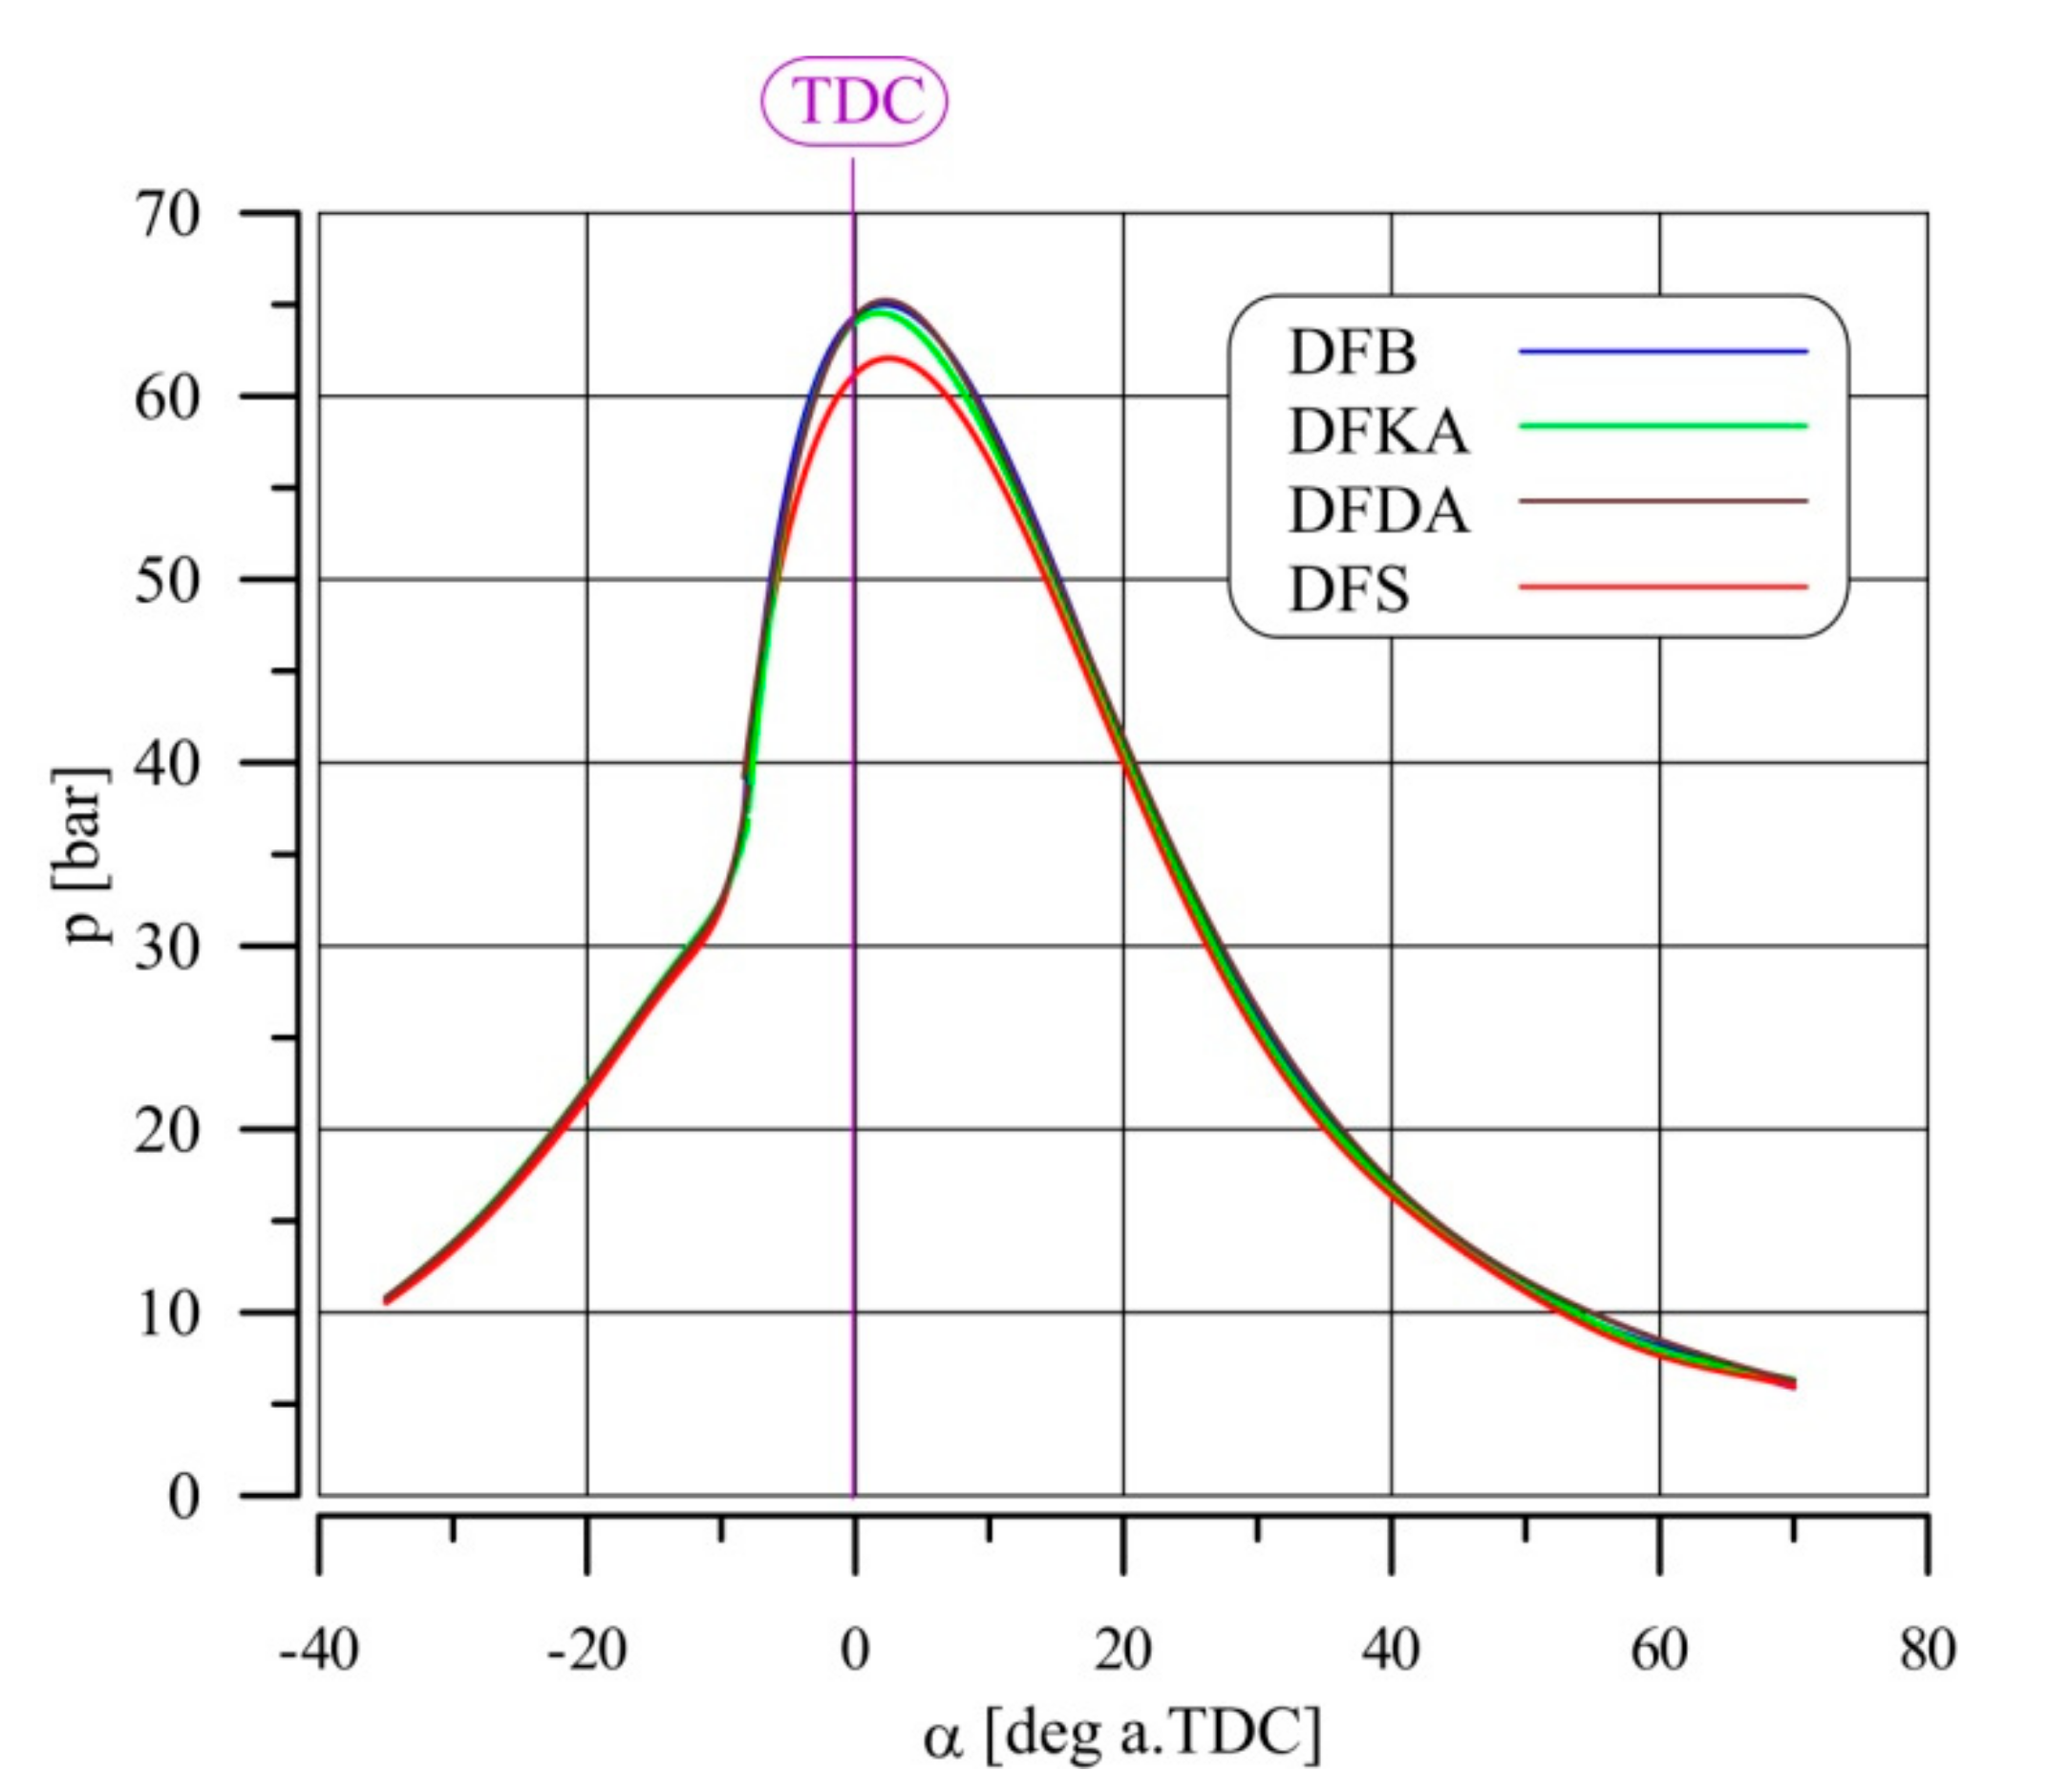
4.3. Indicator Charts

For deeper cause-and-effect analysis of the influence of the tested fuels on the combustion process, the pressure in the engine cylinder was measured as a function of the crankshaft rotation angle, as shown in Figure 13.
The measured indicator charts were used to determine the onset of self-ignition (αSC) and the self-ignition delay (τc), and were the basis for calculation of further heat release waveforms from the engine cylinder. In addition, the red box marks the parameter diagrams that showed the location of the characteristic stages of the combustion process (e.g., the onset of self-ignition), which are further used for the analysis of combustion visualisation images.
The main purpose for using the 2-EHN additive was to facilitate earlier onset of fuel self-ignition [50,51,52], which was confirmed experimentally. DFKA fuel exhibited the earliest onset of self-ignition (Figure 14).
DFDA fuel slightly delays the onset of self-ignition (αSC); DFS fuel, with both additives, exhibits significantly earlier self-ignition than the base fuel, and slightly later self-ignition than DFKA fuel.
As the beginning of injection for all tested fuels (at the engine operating point used) was the same, changes in onset of auto-ignition (αSC) were directly related to the self-ignition delay (τc). The DFKA fuel (with the earliest self-ignition) (Figure 14) exhibited the shortest self-ignition delay (Figure 15); DFDA (with Reduxco) exhibited a slightly longer self-ignition delay.
The shorter self-ignition delay for DFKA (than for the base fuel) explains the lower NOx concentration in the exhaust gas because the smallest amount of fuel accumulates in the combustion chamber of the engine in the shortest time between the start of injection and the start of fuel self-ignition. The smaller the amount of fuel subject to spontaneous combustion, the lower the dynamics of the initial (kinetic) combustion phase, leading to reduced temperature in the combustion phase associated with the formation of NOx and ultimately reducing the NOx concentration in the exhaust gas (relative to the base fuel) [53]. However, this does not explain why the DFS fuel, with a slightly higher τc value than the DFKA fuel, produces the lowest NOx concentration in the exhaust gas. The synergistic effect of both additives in the DFS fuel on the heat release rate in the kinetic phase of combustion is responsible.
Based on the measured pressure courses in the engine cylinder powered by the tested fuels (Figure 13) and the calculation model [44], the combustion temperature courses as a function of the engine crankshaft rotation angle were calculated. Figure 16 shows the kinetic and diffusion combustion phases (determined from the rate of heat release). Both fuel additives selectively affect the rate of heat release in the engine cylinder. Addition of 2-EHN greatly (favourably) reduces the combustion temperature in the kinetic phase, as shown in Figure 17a, only slightly reducing (unfavourably) the temperature in the diffusion phase (Figure 17b). This explains the low NOx concentration in the exhaust gas with DFKA fuel and the slightly higher PM emission compared to the base fuel.
Reduxco (DFDA fuel) produces an increase in combustion temperature in both the kinetic and diffusion phases, leading to a slightly higher NOx concentration in the exhaust gas and much lower PM emissions than DFB fuel. Combustion of DFKA fuel significantly reduces NOx concentration, with a slight increase in PM emissions. Combustion of DFDA fuel greatly reduces PM emissions, with a slight increase in NOx concentration. The concept, as presented in [36], was to simultaneously reduce the unfavourable effects of the fuel additives used separately by mixing them. The concept has been confirmed through the analysis of the combustion temperature course for the tested fuels. Combustion of DFS fuel (with both additives) produced the lowest combustion temperature (Tck) in the kinetic phase of all tested fuels (lowest NOx concentration), the highest combustion temperature (Tcd) in the diffusion phase, and the lowest PM emission. There was a synergy effect with both fuel additives, with regard to the output parameters of the engine (NOx and PM emissions), and more importantly, the impact of the tested fuels on the exhaust gas composition. Simultaneous use of these fuel additives, one reducing the NOx concentration (−16%) and the other increasing the NOx concentration (+8%) in the exhaust gas, produced a joint action, resulting in an even greater NOx reduction in the exhaust gas (−18%). The results were similar for PM. This phenomenon is known as hyperadditive synergism, and occurs when the use of two components (fuel additives) has an effect greater than the sum of the actions of the individual components. A more detailed explanation of the mechanism of this type of synergy is described in the next section.

4.4. Heat Release Rate

To better understand the influence of the tested fuels on the energy parameters and exhaust gas composition, the heat release rate (dQ/dα) in the engine cylinder was analysed as a function of the crankshaft angle of rotation, as shown in Figure 18. The diesel engine was without a turbocharger and without an EGR system, with an in-line injection pump (previous generation engine). The calculated dQ/dα function had a completely different course (in terms of quality) than the dQ/dα for currently produced serial diesel engines (engine VW 1.9 TDI, used in [36]). It is typical that the maximum combustion rate in the kinetic phase (dQk) is many times greater than the long-term, low-diffusion combustion rate (dQd). Regardless of whether the dQ/dα waveform is characteristic of modern or older generation engines, the same general rule still applies; reducing the dQk value leads to a reduction in NOx concentration in the exhaust gas, and increasing the dQd value reduces PM emissions in the exhaust gas. Extending the analysis of the influence of the dQ/dα course to the number of NOx particles produced in the engine cylinder, dQk is important, but the process is also influenced by other parameters characterising the kinetic combustion phase, including the presence of dQk in relation to the TDC of the piston, the total amount of heat released in this phase, and the duration of the phase. The maximum kinetic combustion rate for the tested fuels is presented graphically in Figure 19. The combustion of DFS fuel, with the lowest dQk rate, produced the lowest NOx concentration in the exhaust gas. However, for DFDA fuel (with Reduxco), with the highest NOx concentration in the exhaust gas, it is not as obvious, as the dQk value for this fuel is not as large. Of the factors influencing the number of NOx particles formed in the engine cylinder, in this case, the highest temperature in the kinetic combustion phase (Figure 17a) is of major importance. There are three reasons that the highest Tc is observed in the kinetic phase for DFDA fuel, which are as follows:
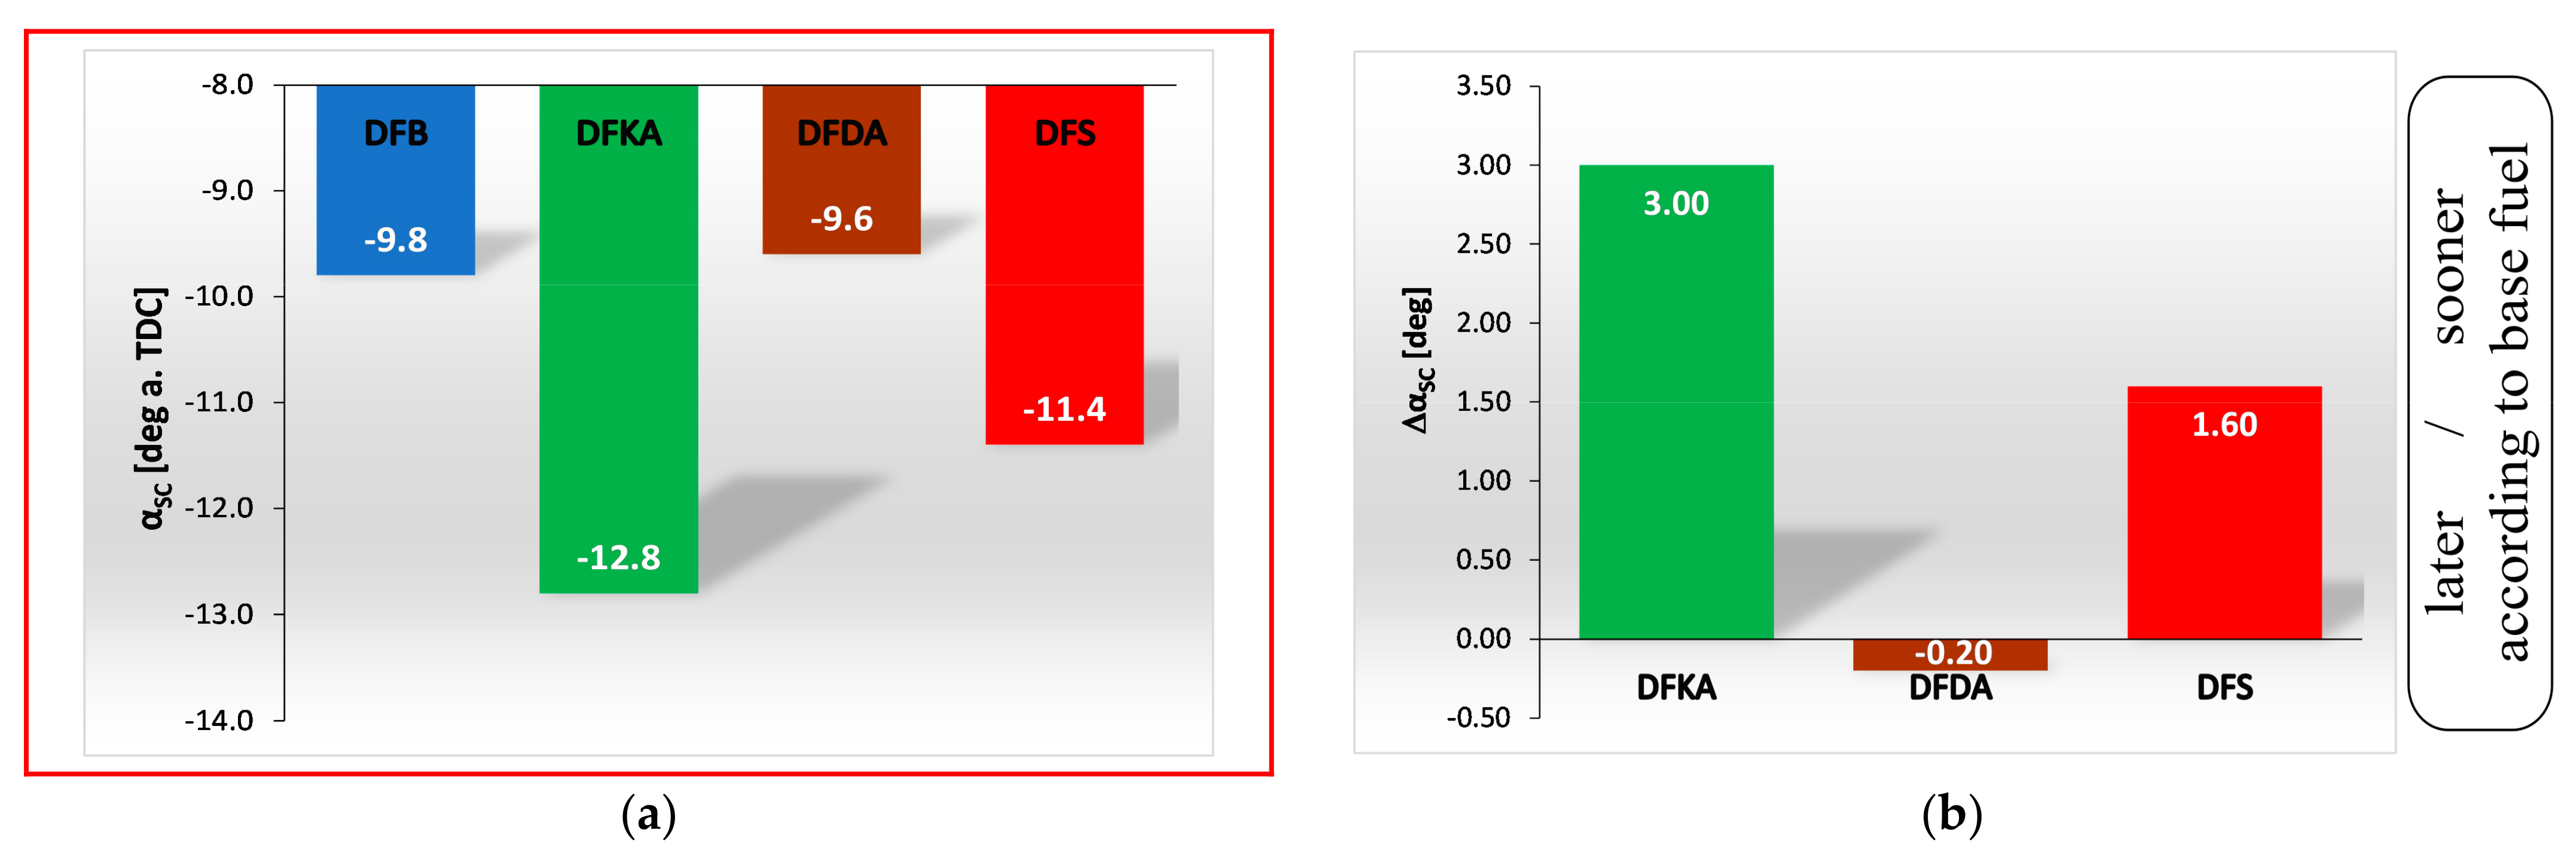
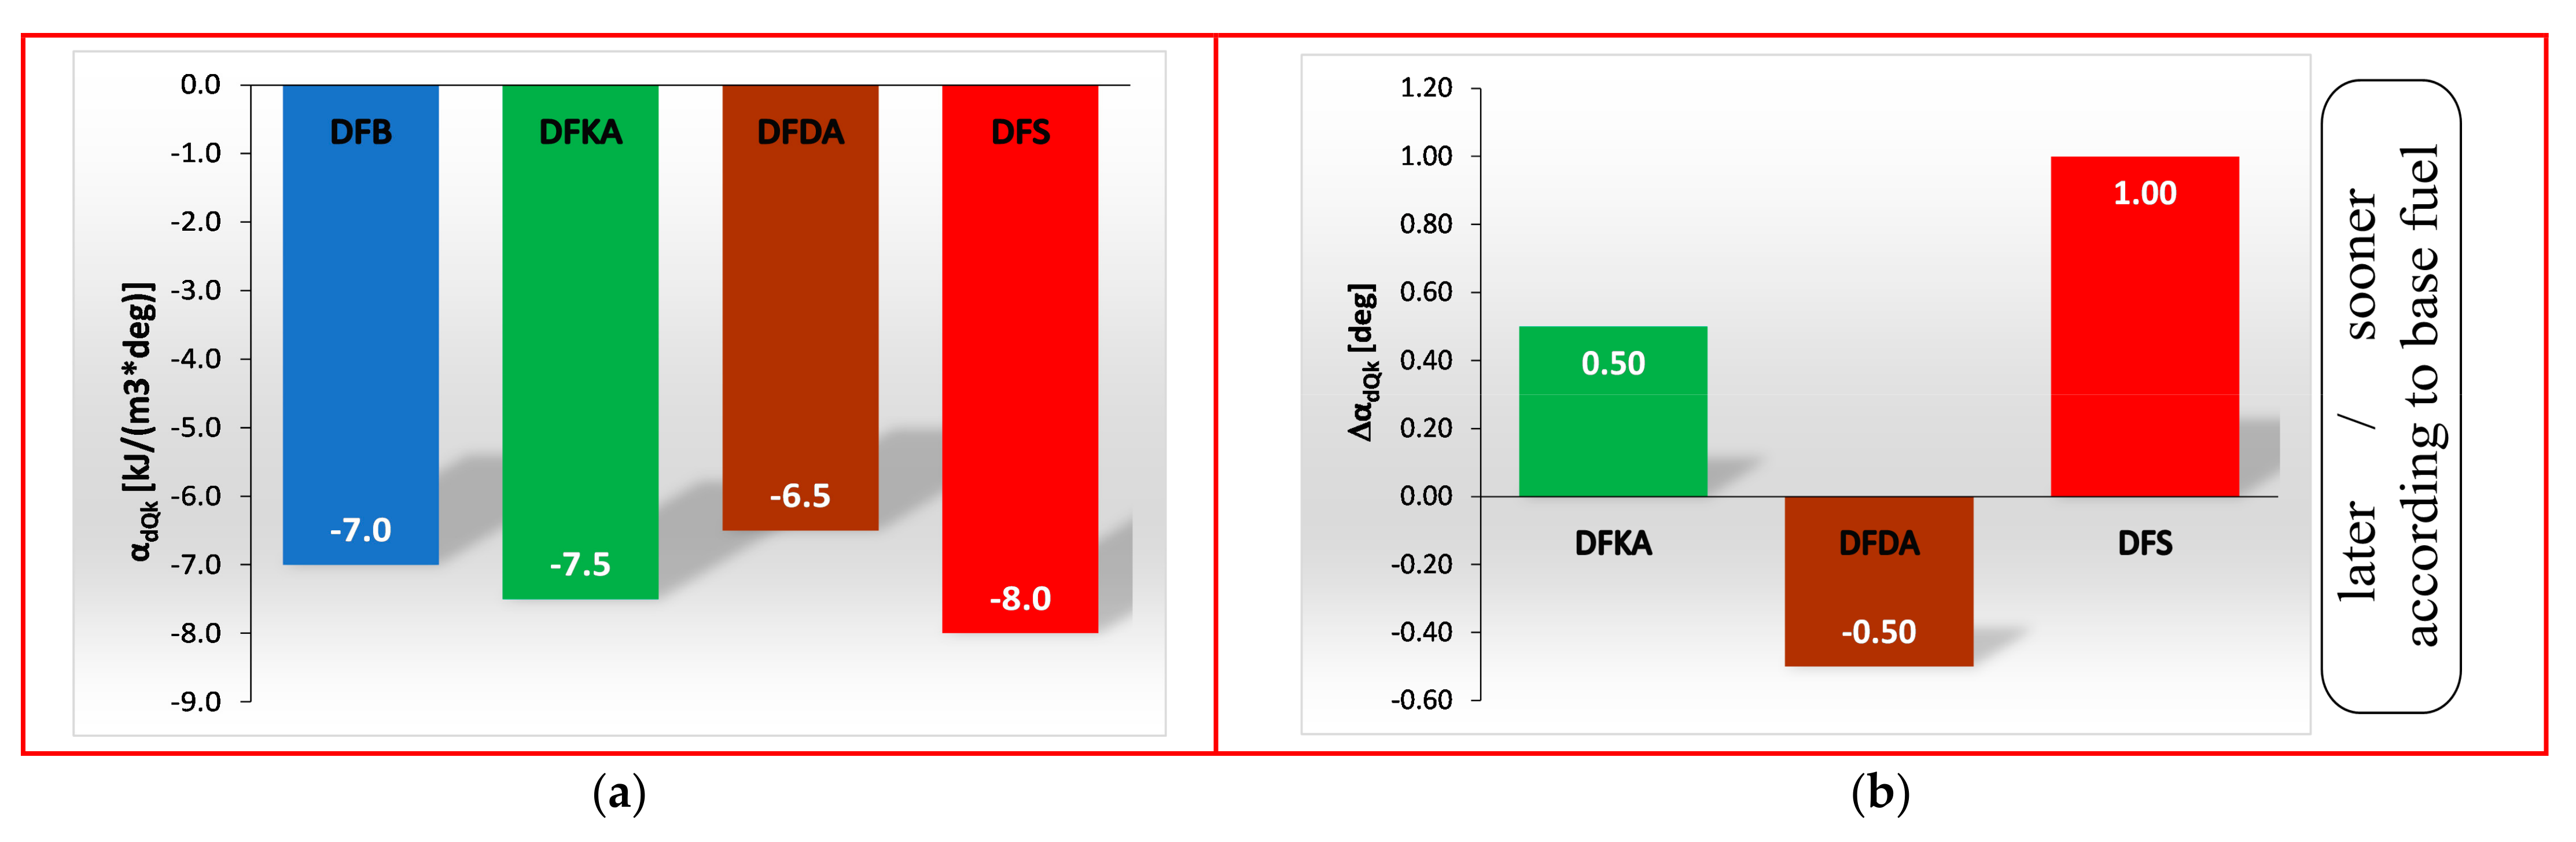
  • Occurrence of the maximum rate of kinetic combustion (αdQk) occurs the latest (closest to the piston TDC). The heat released in a small volume (mass) of the working medium produces a large increase in temperature, facilitating NOx formation (Figure 20a),
  • The heat released in the engine cylinder in the kinetic combustion phase (Qk) is the greatest for this fuel, favouring NOx formation (Figure 21),
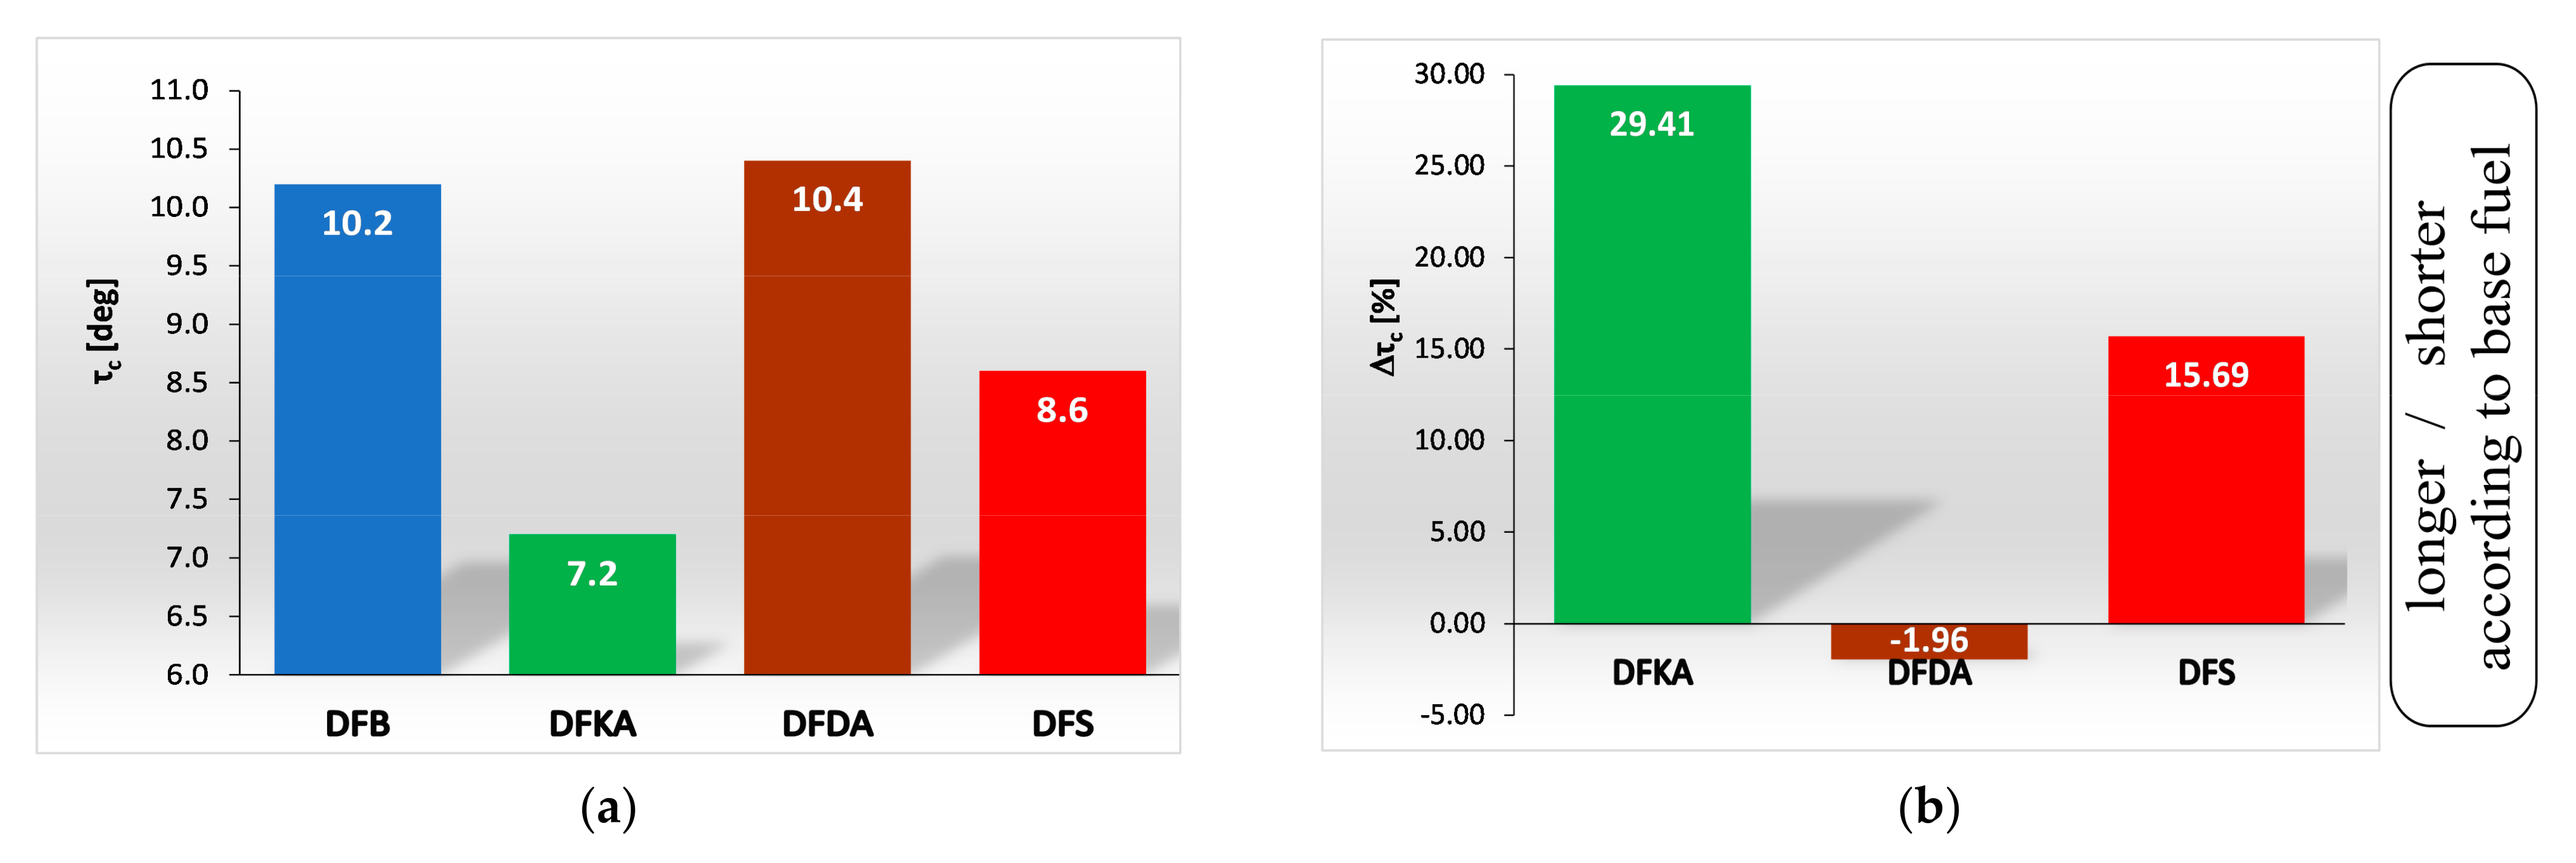
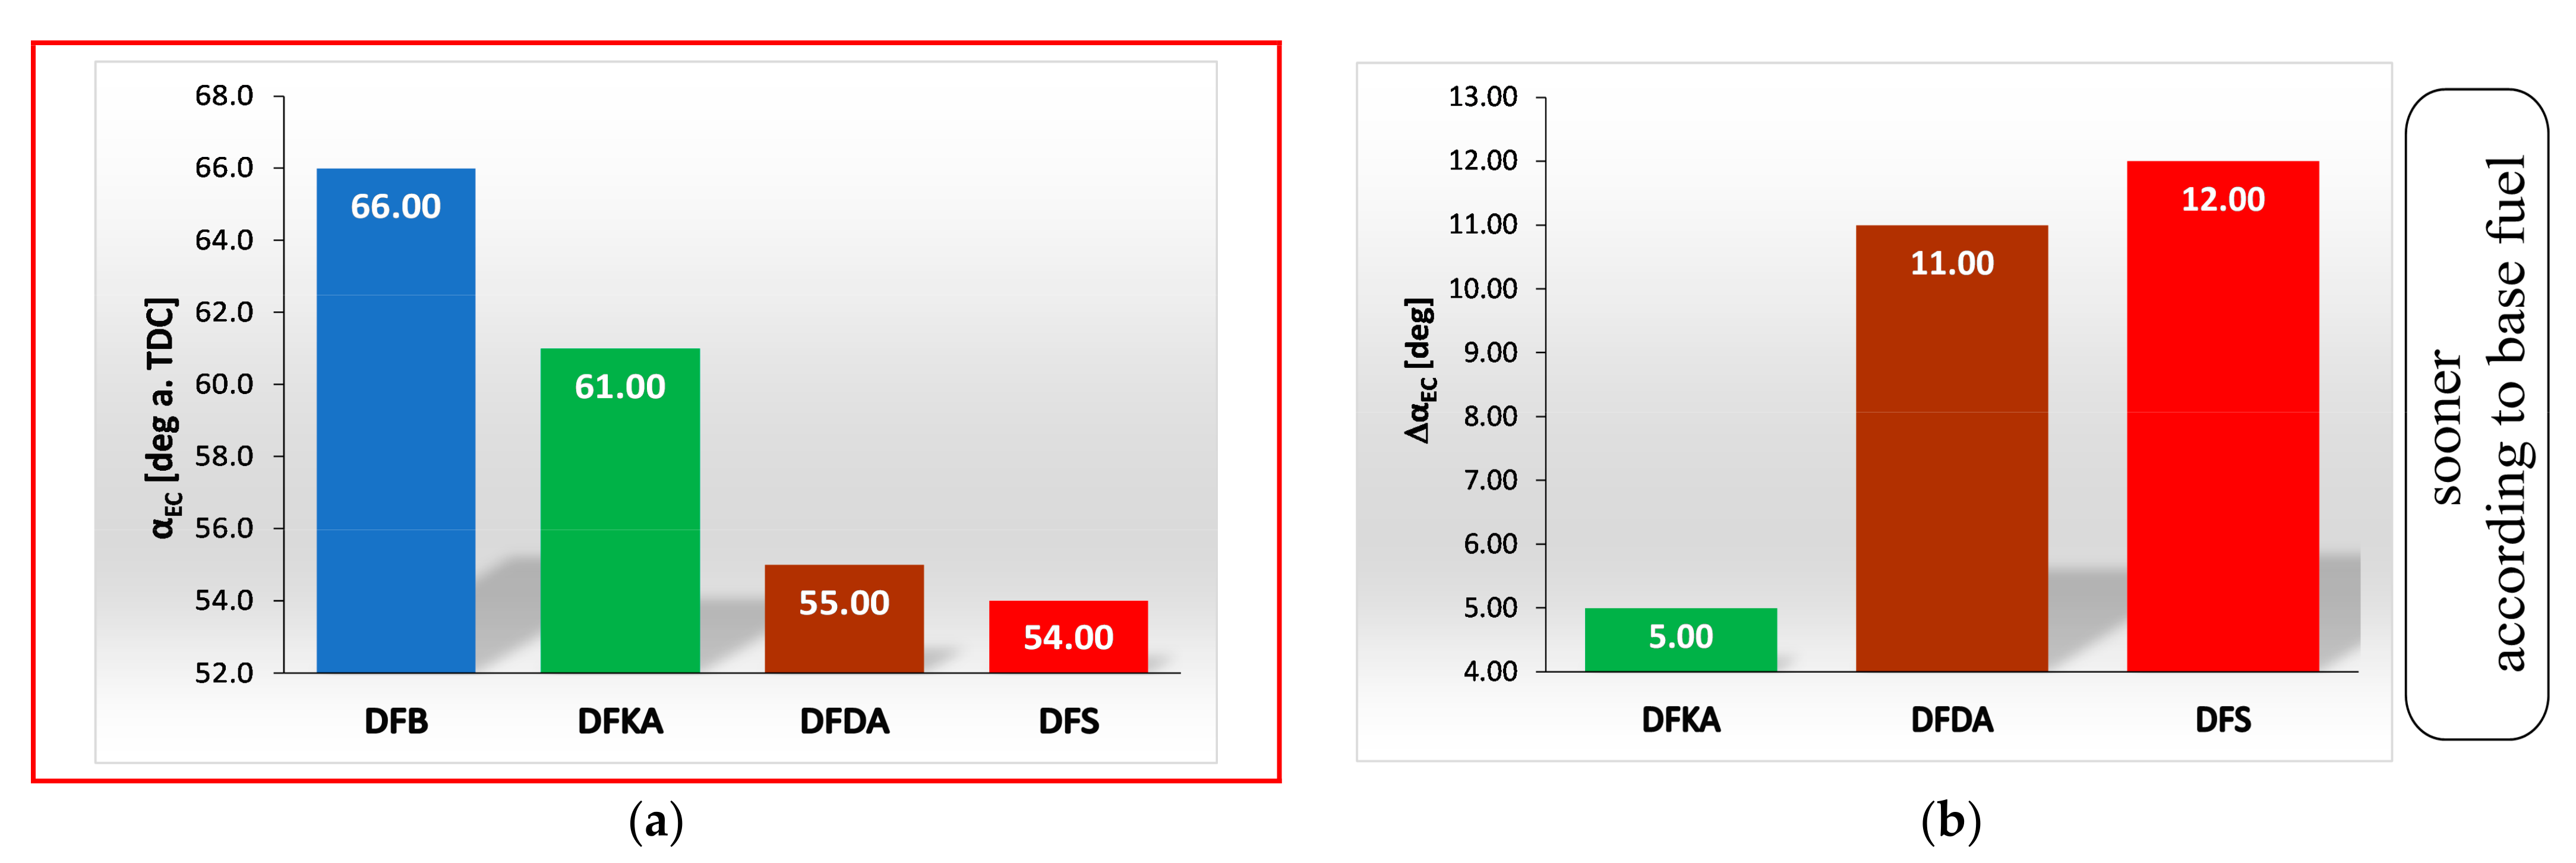
  • the duration of the kinetic phase (αfQk) for DFDA fuel is the greatest, which increases the amount of NOx produced in the engine cylinder (Figure 22).
The diffusion phase of combustion is strongly related to PM emissions in the exhaust gas and the thermal (and general) efficiency of the engine. The effect of the diffusion phase combustion rate on PM emissions is explained in Section 4.2. The effect of long-term diffusion combustion on engine efficiency is related to the end of combustion. A favourable, early end of combustion can be achieved in the following two ways: by starting the combustion process earlier (shortening the self-ignition delay τc) or by increasing the combustion rate. However, increasing the kinetic combustion rate (dQk) increases NOx emission. Moreover, with the much shorter duration of this phase (than the diffusion phase), the impact of such an effect would be negligible on the duration of the entire combustion process (αfQ). However, even a slight increase in the combustion rate (dQd) in the long-term diffusion phase results in a significant shortening of the entire process and an earlier end of combustion (αEC), reducing the exhaust loss, resulting in an increase in thermal efficiency, which leads to lower fuel consumption. The DFDA and DFS fuels are the best examples; the highest engine efficiency (lowest FC value, Figure 8) was observed with the earliest end of combustion αEC (Figure 23). The lowest exhaust gas temperature was obtained for the same fuels (Figure 9), which is also related to earlier completion of combustion. The same fuels (DFDA and DFS) exhibited the greatest maximum rate of diffusion combustion (dQd). In Figure 24, the dQd value for these fuels is twice as high as for DFB fuel (and for DFKA). This explains the much shorter duration of the diffusion combustion phase (αfQd) for these fuels (Figure 25), which results in earlier completion of combustion. DFKA fuel is also characterised by earlier completion of combustion (than DFB fuel), but not due to the maximum diffusion combustion rate (as with DFDA and DFS fuels), which is slightly less than for DFB fuel (Figure 24), due to the earlier onset of self-ignition (Figure 14), resulting from a shorter self-ignition delay (τc) (almost 30% shorter than for DFB fuel) (Figure 15). Nonetheless, the effect was the same, reduced fuel consumption with increased combustion process efficiency (reduced exhaust loss) compared to the base fuel.
The fuels with the highest combustion efficiency were determined (lowest FC values). DFDA and DFS fuels produced the lowest PM emission in the engine exhaust (Figure 12), which is closely related to the different course of the combustion process in the diffusion phase. According to Figure 10, a high dQd value during combustion of DFDA and DFS fuels (Figure 24) ensures combustion of a large amount of previously formed solid particles in the engine cylinder and a reduction in PM emission in the exhaust gas. Moreover, it is observed in Figure 26 that the combustion of these fuels produces the greatest heat in the diffusion combustion phase. In combination with the early occurrence of the maximum diffusion combustion rate αdQd (Figure 20b) for these fuels, large amounts of heat Qd are released much earlier (closer to the piston TDC) than for other fuels. Thus, combustion of DFDA and DFS fuels produces the highest combustion temperature (in the diffusion phase) (Figure 17b). In high-temperature conditions, a greater mass of soot and the remaining PM-forming deposits oxidised in the engine cylinder, reducing PM emissions in the exhaust gas. Accordingly, the lowest PM emission was confirmed in the laboratory for DFDA and DFS fuels, up to 24% (DFDA) and 28% (DFS) lower, respectively, than for the base fuel.
The data show that simultaneous use of the 2-EHN additive (which reduces NOx concentration in exhaust gas by approximately 16%) and the Reduxco additive (which increases NOx concentration in the exhaust gas by approximately 8%) reduces the NOx concentration by as much as 18%. Similarly, addition of Reduxco reduces PM emissions in the exhaust gas by approximately 24%, and addition of 2-EHN increases PM emissions by almost 2%; combined use of these additives (in DFS fuel) reduces PM emissions by almost 28%, confirming the hyperadditive synergistic effect of these fuel additives on the combustion process, which in this case results from the phase shift in the heat release rate (dQ/dα) for combustion of fuels containing these additives. Fuel molecules directly bound to the 2-EHN additive ignite much earlier than fuel molecules bound to the Reduxco additive. After self-ignition of DFS fuel, the heat of combustion of the fuel molecules with 2-EHN is reduced by the heat of vaporisation of the fuel molecules with the Reduxco additive that are not yet burning. This reduces the maximum rate and duration of kinetic combustion (dQk), the combustion temperature in this phase, and produces the smallest amount of NOx in the engine cylinder. Similar behaviour is observed in the diffusion phase of DFS fuel combustion; combustion of fuel particles with the Reduxco additive is characterised by a high diffusion combustion rate (dQd), which overlaps with the combustion of particles with the 2-EHN additive, increasing the duration (αfQd) of high-temperature diffusion combustion and the amount of heat Qd (Figure 25) generated in this phase, which increases the number of afterburned solid particles in the engine cylinder, reducing PM emissions in the engine exhaust with DFS fuel.
Thus, through synergy, a desirable simultaneous reduction in NOx and PM emissions in the exhaust gas is produced with DFS fuel (containing both additives). This phenomenon has also been confirmed (in a qualitative sense) by the authors using a modern, serial diesel engine [36].

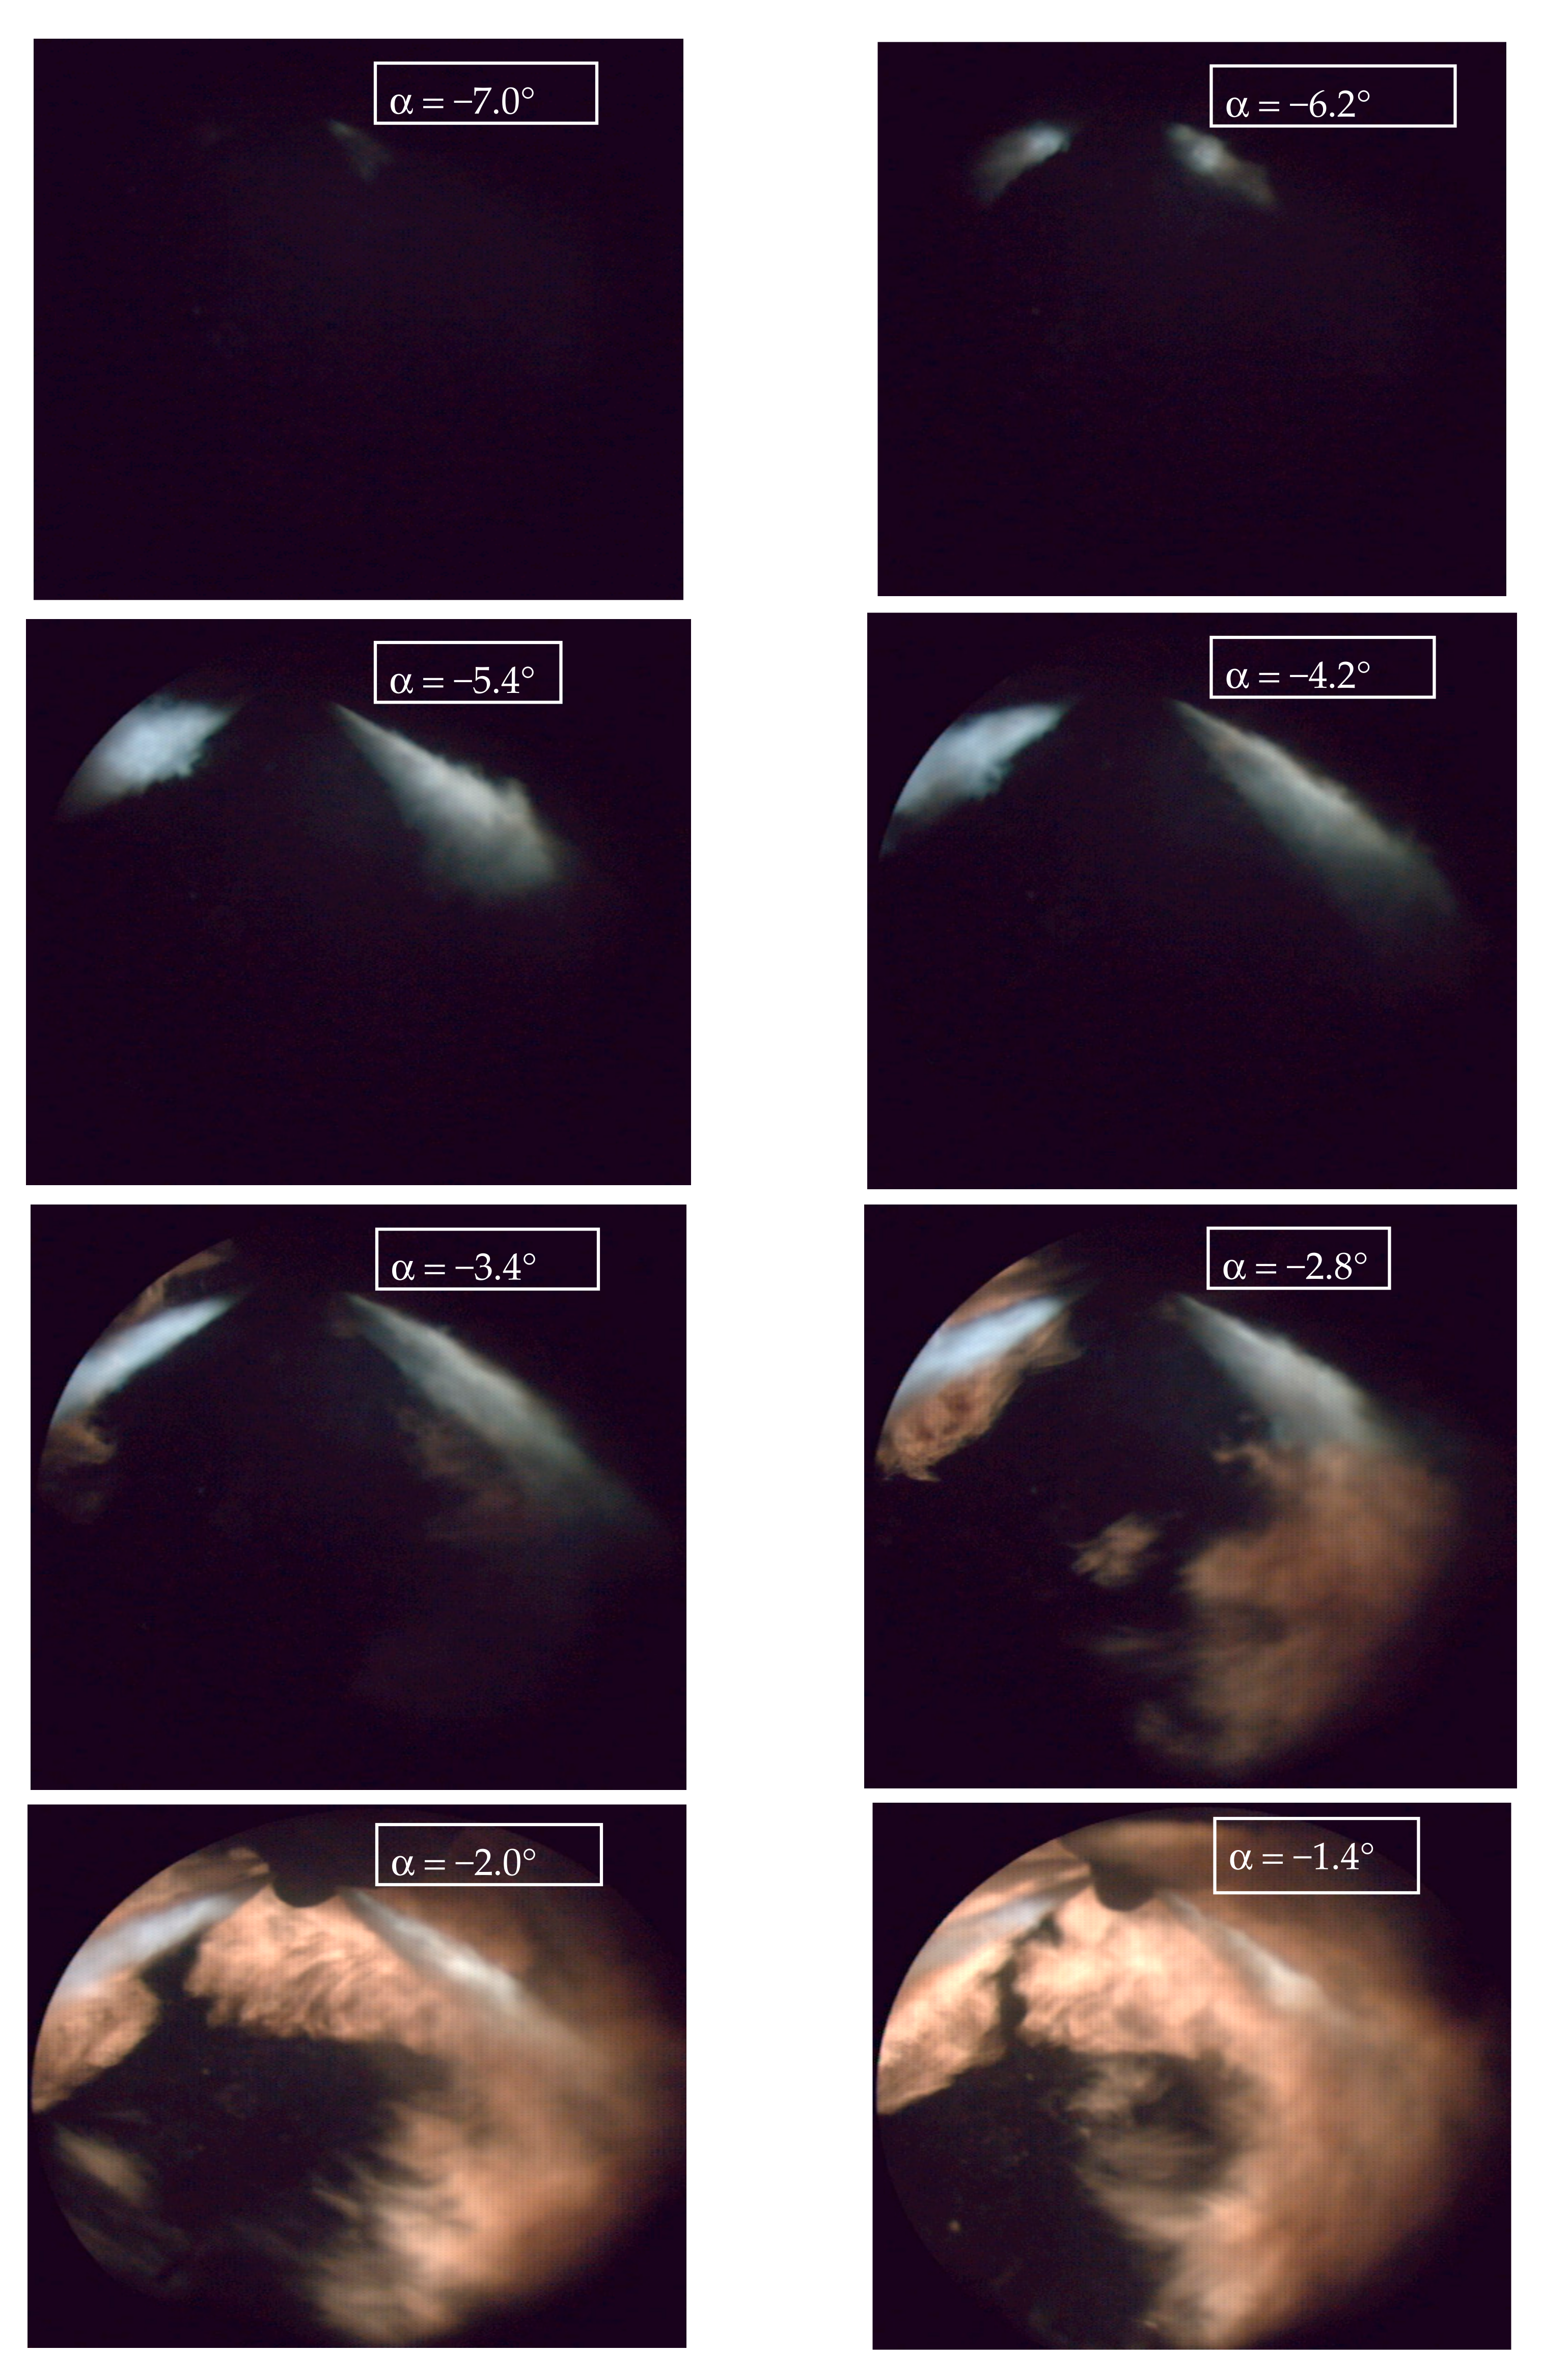
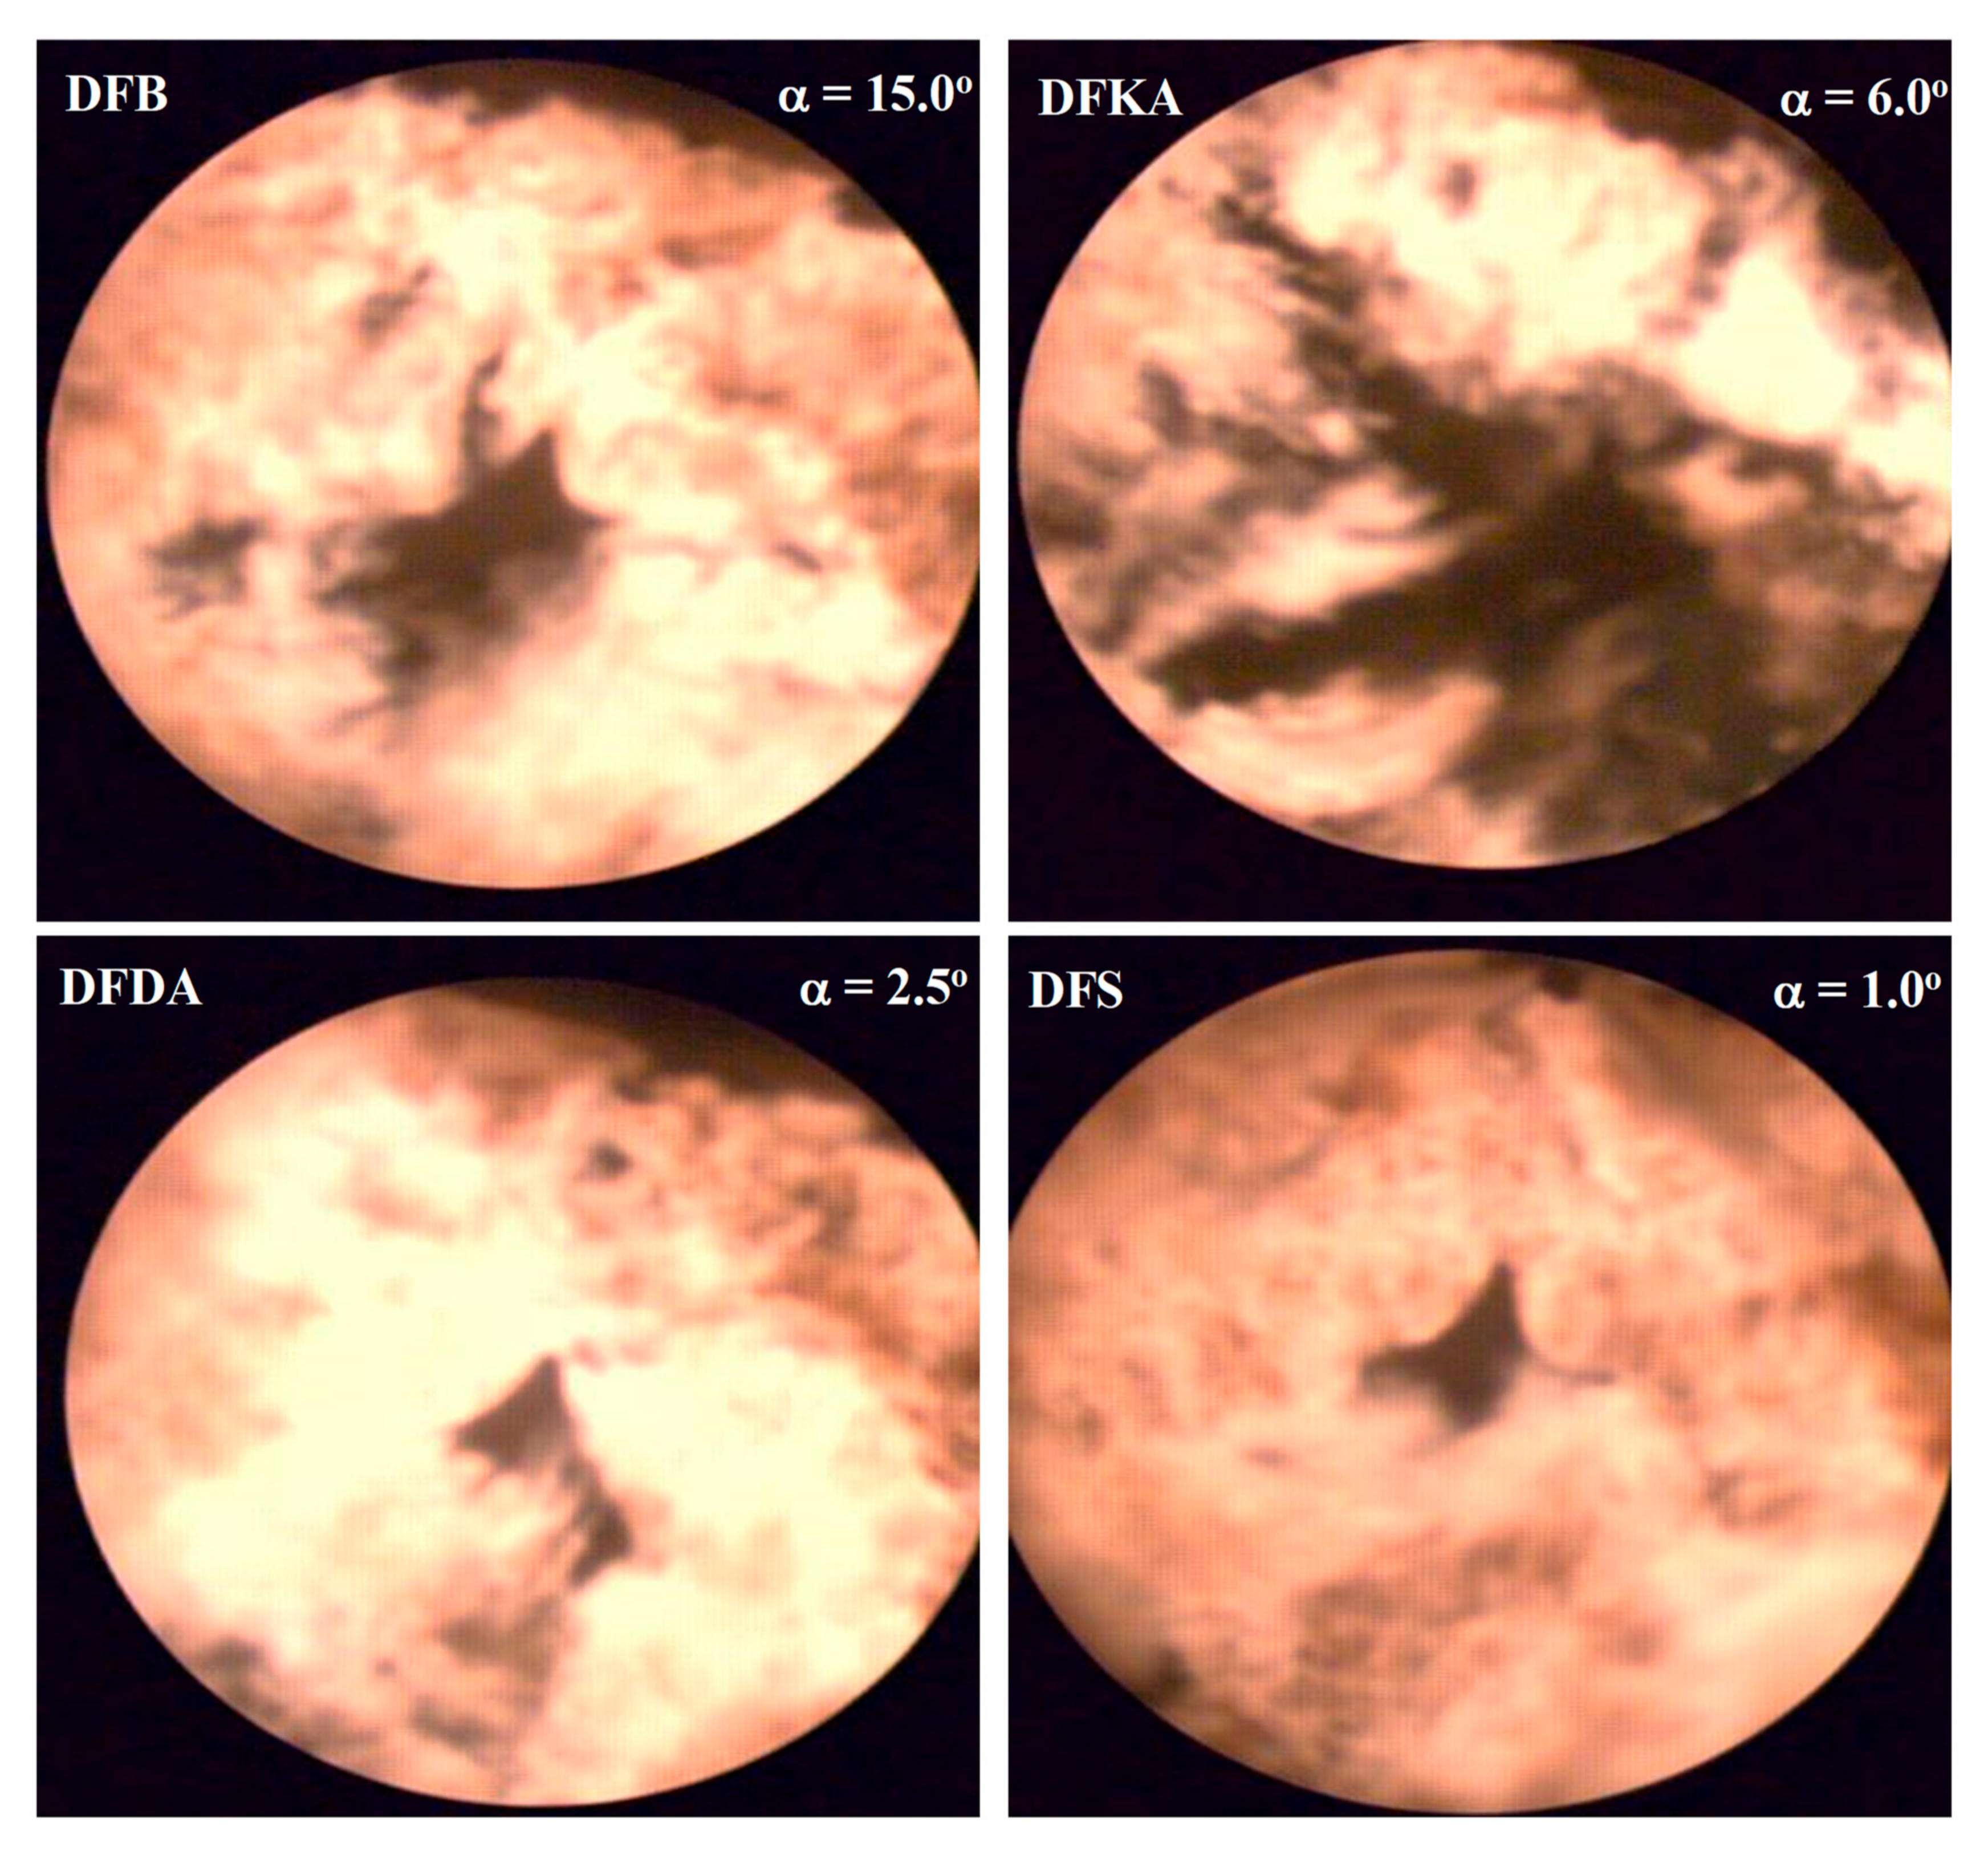
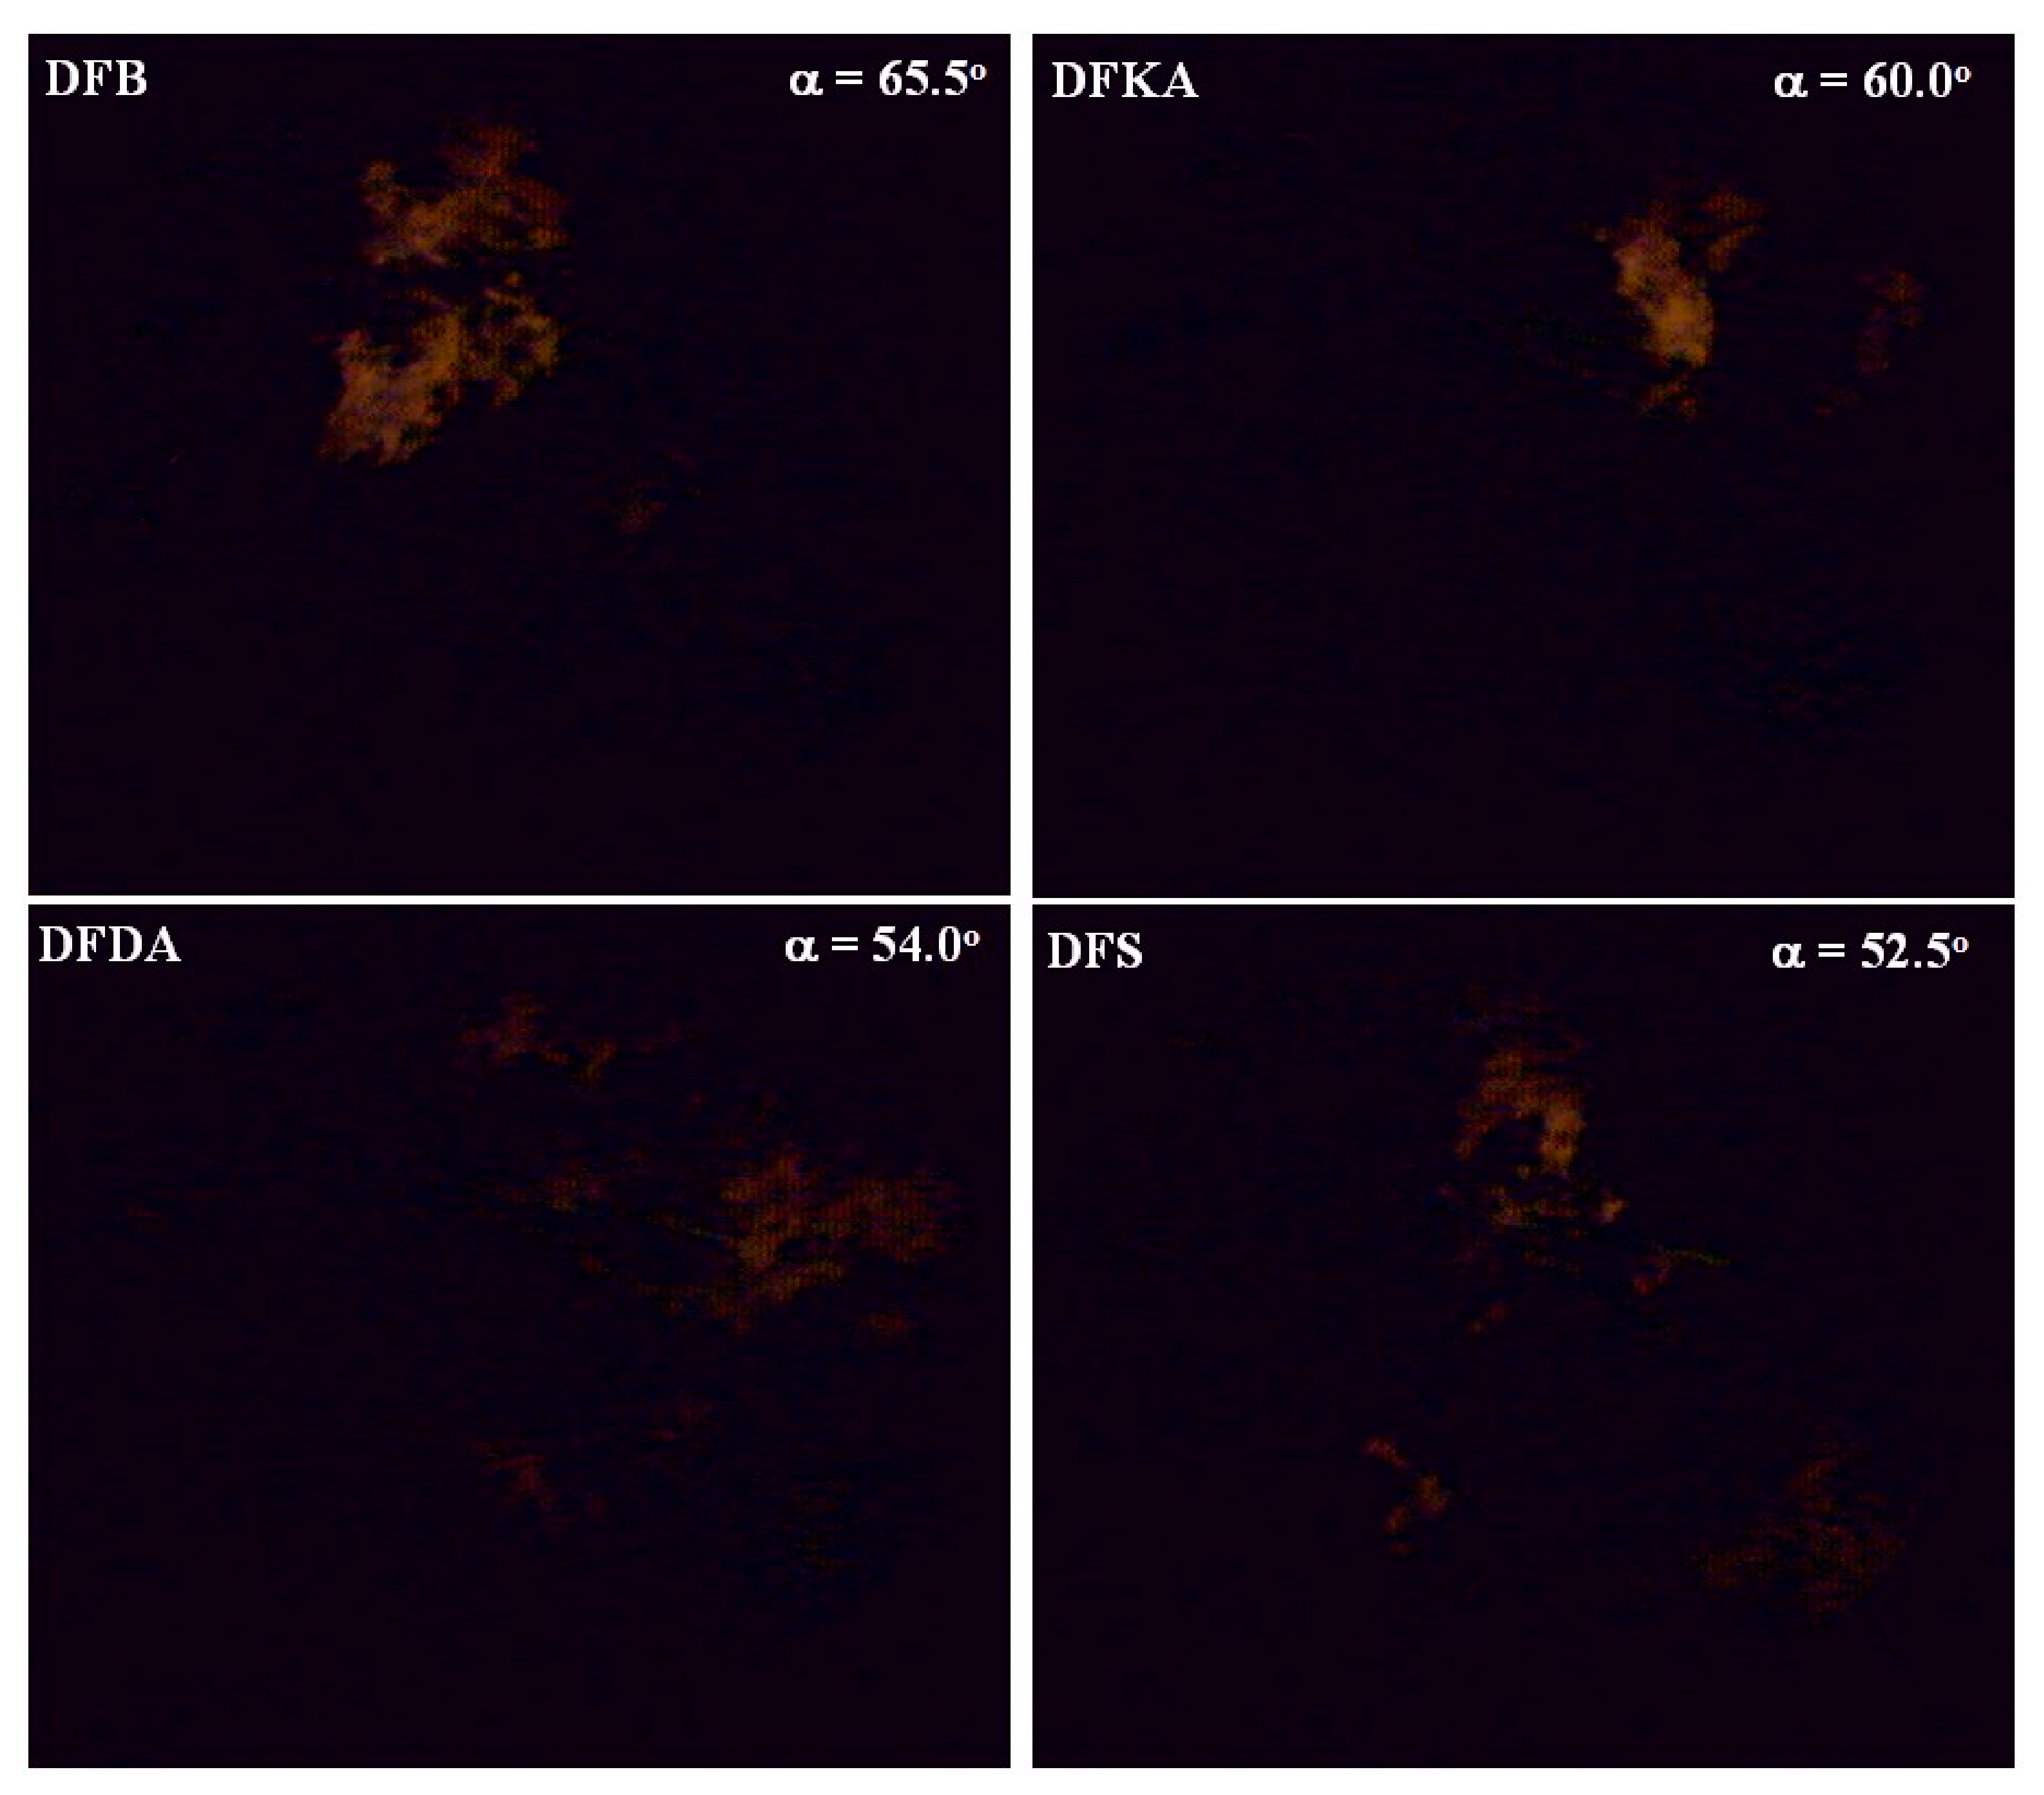
4.5. Visualisation and Thermovision of Combustion Process

The temperature as a function of the engine crankshaft angle of rotation (as a function of combustion time) was determined in the following two ways: based on the combustion pressure (p(α)) (Section 4.2), and based on endoscopically recorded images of the flame (as a function of crankshaft angle) using the two-colour method (Section 3.3.2). The combustion temperature determined as a function of the combustion time (determined by the angle α) is a particularly important parameter because it causes NOx formation (in the kinetic combustion phase) in the engine cylinder and causes afterburning of previously formed solid particles, which affects the PM emissions in the exhaust gas. Although both methods of determining the combustion temperature can determine the function T(α), their use in the cause-and-effect analysis (from the perspective of NOx and PM emissions in the exhaust gas) is significantly different; the actual combustion temperature in a compression ignition engine depends on the location in the volume of the working medium (at the same angle α), which is not considered in the temperature calculated from the indicator diagram. The distribution of isotherms in the flame (determined from digital images) allows determination of the size of working medium areas with a specific combustion temperature, but is much more difficult to implement and analyse, and requires expensive measuring equipment (AVL VideoScope 513D) and adjustment of the engine head for endoscopic measurement. For analysis of the NOx formation mechanism and afterburning of the resulting PM particles in the engine cylinder, this method seems to be more useful in testing the fuels. In addition, endoscopic visualisation of injection, self-ignition, and combustion of the tested fuels allows verification of some parameters determined by other methods (injection start, based on an indicator chart or visualisation; combustion end, based on a heat release rate graph or visualisation). Examples of such verification are presented in Figure 27, images from the engine cylinder corresponding to visual initiation of self-ignition (αSC), and in Figure 14, with αSC values determined using indicator plots presented graphically. The αSC values in both cases are similar (within the accuracy limits of both methods). Similarly (in terms of visual analysis), self-ignition occurs for all tested fuels. The first flames appear at the edges of the injected fuel streams at the fuel atomiser outlet openings, where the fuel outflow velocity is the highest and the fuel–air mixture is relatively rich. The second area of facilitated self-ignition is the envelope of the injected fuel stream, especially in the area of the stream front, where the best fuel atomisation occurs. The tested fuels differ significantly in the moment of fuel self-ignition (in terms of crankshaft angle). DFKA fuel (with 2-EHN) exhibited the earliest self-ignition due to a shorter self-ignition delay τc (Figure 15), and a great reduction in NOx concentration in the exhaust gas compared to the base fuel (Figure 11). The latest self-ignition determined from digital image analysis was observed for DFDA fuel (with Reduxco), indicating the longest self-ignition delay, and thus a slightly higher NOx concentration in the exhaust gas than with the base fuel.
Visual analysis is important, especially for the isotherm distribution in the flame calculated from images for the kinetic combustion phase (Figure 28 and Figure 29). Image analysis shows that fuel is continuously injected into the flame in the cylinder at a particular operating point of the engine (rpm and load) for each of the fuels. The area covered by the flame in the engine cylinder space is similar for the tested fuels, except the DFDA fuel, for which an area of increased flame spread dynamics is observed (Figure 28) (red ellipse in the photo). It is related to the longer self-ignition delay for this fuel; most of the fuel injected into the combustion chamber before self-ignition underwent rapid combustion in the initial phase of the oxidation process, due to its large mass. This resulted in the highest combustion temperature Tck determined from the indicator diagram (Figure 17) and the largest area (Sk) covered by the isotherm with the highest temperature at that time (1800 K) in the working medium, which occurred in the engine cylinder (Figure 30), resulting in the greatest NOx concentration in the exhaust from burning DFDA fuel. Similarly, the smallest area covered by the 1800 K isotherm for the kinetic phase of DFKA fuel combustion (Figure 29 and Figure 30) explains the low NOx concentration in the exhaust from burning this fuel. The combustion temperature (calculated from indicator diagrams) of Tck in the kinetic phase is slightly different (Figure 17) because the lowest combustion temperature at that time is produced by the DFS fuel, for which the lowest NOx concentration was actually measured in the exhaust gas from the engine. However, the difference between the Tck values for DFKA fuel and DFS fuel is small (38 K versus 1065 K for DFKA fuel and 1027 K for DFS fuel). Similarly, small differences are observed in areas covered by the 1800 K isotherm, several percent of the measurement area Sk for the DFKA fuel and approximately 10% of Sk for the DFS fuel (Figure 30). Figure 10 explains that the reduction in NOx concentration in the exhaust gas is influenced by the reduced temperature and area of the working medium at this temperature and by the duration of the kinetic combustion phase. Figure 22 shows that the DFS fuel exhibits the shortest kinetic phase (nitrogen oxidation), outweighing the slightly larger Sk area at 1800 K, and producing the lowest NOx concentration.
Both tested fuel additives (2-EHN and Reduxco) selectively affect the rate of heat release in the engine cylinder. The influence of the tested fuels on the kinetic phase of combustion has been described in connection with their influence on NOx concentration in the exhaust gas. The diffusion phase concerns (in a causal sense) PM emission in the exhaust gas. Endoscopic images of the combustion process in the diffusion phase of combustion are presented in Figure 31. Using these images, the distribution of isotherms in the diffusion flame was calculated for each of the tested fuels (Figure 32). From these figures, it is observed that the combustion process for the rotation angle crankshaft corresponding to the diffusion phase of combustion is much more intense than for those corresponding to the kinetic phase for all fuels. In the diffusion combustion phase, solid particles are formed, but in favourable conditions (specified in Figure 10); some of the particles formed in the engine cylinder are oxidised, reducing PM emissions in the exhaust gas. The favourable conditions are an increased rate of heat development in the diffusive combustion phase dQd (Figure 23), combustion temperature Tcd (Figure 17b), an increase in the area Sd of the working gas subject to high temperature (Figure 33), and extension of the time αfQd of PM oxidation (Figure 24). The availability of oxygen (locally and temporarily) in the soot oxidation zone is also important, but for the analysis of the influence on PM emissions, it is essentially the same for all tested fuels. In Figure 32, the high-temperature areas in the diffusion phase of combustion are completely different for different fuels. The smallest area of the working medium covered by high temperatures was found for the DFKA fuel, indicating that in the smallest gas zone in the engine cylinder, previously formed PM is oxidised. Thus, combustion of DFKA fuel exhibited the greatest PM emissions in the engine exhaust gas. A much larger high-temperature area (2200 K and 2400 K) was observed in the two-colour thermography for the fuel with Reduxco additive. As a result, the combustion process resulted in an almost 25% lower PM emissions (Figure 12), with an approximately 8% higher NOx concentration (Figure 11) compared to the base fuel. Simultaneous use of both fuel additives (2-EHN and Reduxco) resulted in reduced PM emissions and reduced NOx concentration in the exhaust gases because the area with high temperatures was the largest of the tested fuels (Figure 33) in the diffusion combustion phase, with the shortest exposure to high temperatures in the kinetic combustion phase. The conclusions regarding PM and NOx emissions from the analysis of combustion temperature determined from p(α) waveforms for kinetic and diffusion combustion phases coincide with the conclusions based on the values and surface areas of isotherms using the two-colour method. Thus, the combustion temperature measurements in the kinetic and diffusion combustion phases confirm and explain the synergy of the fuel additives in reducing PM and NOx emissions relative to the base fuel in the exhaust of the DFS-fuelled engine.
Images inside the engine cylinder were used to determine the end of combustion αEC, as shown in Figure 34. The αEC values determined from the last “film frames” on which the flame is still visible differ slightly from the αEC values determined from graphs of heat release rate (Figure 26a), due to differences in the onset of auto-ignition.
The end of combustion determined by visualisation also confirms (similar to the αEC determined from dQ/dα) that DFDA and DFS fuels burn the earliest in the engine cylinder, mainly as a result of the high combustion rate of these fuels in the diffusion phase, which increases the combustion efficiency by reducing the outlet loss.
The data confirm that extending the measurements previously conducted using the VW 1.9 TDI [36] engine to include tests using the SB 3.1 research engine was advisable, enabling endoscopic imaging of the combustion process and determination of the distribution isotherms in the flame for both tested fuels (two-colour method).

5. Summary and Conclusions

An analysis of the influence of the tested fuels on the combustion process in a diesel engine produced the following conclusions:
  • The 2-EHN additive (selectively reducing the kinetic combustion rate) and the Reduxco additive (selectively increasing the diffusion combustion rate) resulted in the same qualitative changes in the combustion process for the series VW 1.9 TDI engine and the SB 3.1 previous generation test engine.
  • Relative to the base fuel, hourly fuel consumption (FC) was reduced by the following amounts:
    • A total of 4% for DFKA fuel,
    • A total of 6% for DFDA fuel,
    • A total of 7% for DFS fuel.
  • Relative to the base fuel, the NOx concentration in the exhaust gas changed in the following ways:
    • A 16% reduction for DFKA fuel,
    • An 8% increase for DFDA fuel,
    • An 18% reduction for DFS fuel.
  • Relative to the base fuel, PM emission in the exhaust gas changed in the following ways:
    • A 2% increase for DFKA fuel,
    • A 24% reduction for DFDA fuel,
    • A 27% reduction for DFS fuel.
  • Joint use of the 2-EHN additive and the Reduxco additive produced a beneficial synergy effect that influenced the course of the combustion process, and reduced fuel consumption, NOx concentration, and PM emissions in the engine exhaust.
  • In the kinetic combustion phase, the fuel molecules bound to the 2-EHN ignited much earlier than the fuel molecules bound to the Reduxco. After self-ignition of DFS fuel, the heat of combustion of some of the fuel (related to 2-EHN) is reduced by the heat of vaporisation of the fuel, reducing the maximum kinetic combustion speed (dQk) and the combustion temperature, resulting in the smallest amount of NOx in the engine cylinder.
  • In the diffusion combustion phase, the combustion of fuel particles bound to the Reduxco is characterised by a high diffusion phase velocity, superimposed on the pre-existing combustion rate of particles bound to the 2-EHN, increasing the duration of high-temperature diffusion combustion and the amount of heat generated, which in turn increases the amount of afterburned solid particles in the engine cylinder. In the overall balance, the greatest reduction in PM emissions is observed in the exhaust gas of the engine powered by DFS fuel.
  • Combustion temperature measurements (Tc(α)) based on indicator charts and on visualisation and the two-colour method produce a better understanding of the synergy mechanism (both additives in the fuel) for the simultaneous reduction in NOx concentration and PM emissions in the exhaust gas.

Author Contributions

Conceptualization, J.C. and S.L.; Data curation, J.C.; Formal analysis, J.C., S.L. and A.B.; Funding acquisition, J.C., W.P. and V.M.; Investigation, J.C., S.L. and A.B.; Methodology, J.C.; Project administration, J.C.; Resources, W.P. and V.M.; Supervision, J.C. and S.L.; Validation, J.C.; Writing—original draft, J.C., S.L. and A.B.; Writing—review & editing, J.C., S.L. and A.B. All authors have read and agreed to the published version of the manuscript.

Funding

This research received no external funding.

Conflicts of Interest

The authors declare no conflict of interest.

References

  1. Hill, L. Global trends in emissions legislation. In Proceedings of the VIII PTNSS International Congress on Combustion Engines, Krakow, Poland, 17–19 June 2019. [Google Scholar]
  2. Bielaczyc, P. Global trends in vehicular emissions regulations, current “hot topics” and their impact on powertrain technology—Introduction to the subject. In Proceedings of the VIII International PTNSS Congress on Combustion Engines, Krakow, Poland, 17–19 June 2019. [Google Scholar]
  3. Joshi, A. Overview of technologies for near-zero tailpipe emissions from light- and heavy-duty vehicles. In Proceedings of the VIII PTNSS International Congress on Combustion Engines, Krakow, Poland, 17–19 June 2019. [Google Scholar]
  4. Merkisz, J. Development trends in road transport powertrains. In Proceedings of the VIII PTNSS International Congress on Combustion Engines, Krakow, Poland, 17–19 June 2019. [Google Scholar]
  5. Engeljehringer, K. LD vehicle emission challenge from legislation to testbed. In Proceedings of the VIII PTNSS International Congress on Combustion Engines, Krakow, Poland, 17–19 June 2019. [Google Scholar]
  6. Bielaczyc, P.; Woodburn, J. Global trends in vehicular emissions legislation with a special focus on further stages (EU 7/VII and China 7/VII)—Associated development of ICE/hybrid/EV powertrain technologies and testing methodologies for LD, HD and NRMM sectors. In Proceedings of the IX International PTNSS Congress on Combustion Engines, Lublin, Poland, 27–28 June 2021. [Google Scholar]
  7. Neugebauer, S. Technological scenarios for the decarbonization of road transport. “Connectivity–key to future emission and consumption reduction? Proceedings of the vehicle and powertrain”. In Proceedings of the 30th International AVL Conference “Engine & Environment”, Graz, Austria, 7–8 June 2018. [Google Scholar]
  8. Winkler, S.L.; Anderson, J.E.; Garza, L. Vehicle criteria pollutant (PM, NOx, CO, HCs) emissions: How low should we go? Npj Clim. Atmos. Sci. 2018, 1, 26. [Google Scholar] [CrossRef]
  9. Bielaczyc, P. Global development of emissions reduction strategies from light-duty vehicles. IOP Conf. Ser. Earth Environ. Sci. 2019, 214, 012139. [Google Scholar] [CrossRef]
  10. Kim, M.H.; Chung, W.I.; Chyun, I.B. Three-Dimensional Flow Characteristics and Engine Performance for the Geometry Modification of Intake Manifold in Multi-Cylinder Diesel Engine. In SAE Technical Paper 2000-05-0020, Proceedings of the Seoul 2000 FISITA World Automotive Congress, Seoul, Korea, 12–15 June 2000; SAE: Warrendale, PA, USA, 2000. [Google Scholar]
  11. Montajir, R.M.; Tsunemoto, H.; Ishitani, H.; Minami, T. Fuel Spray Behavior in A Small DI Diesel Engine: Effect of Combustion Chamber Geometry; SAE Technical Paper Series; SAE International: Warrendale, PA, USA, 2000. [Google Scholar] [CrossRef]
  12. Zeng, K.; Huang, Z.; Liu, B.; Liu, L.; Jiang, D.; Ren, Y.; Wang, J. Combustion characteristics of a direct-injection natural gas engine under various fuel injection timings. Appl. Therm. Eng. 2006, 26, 806–813. [Google Scholar] [CrossRef]
  13. Agarwal, A.K.; Srivastava, D.K.; Dhar, A.; Maurya, R.K.; Shukla, P.C.; Singh, A.P. Effect of fuel injection timing and pressure on combustion, emissions and performance characteristics of a single cylinder diesel engine. Fuel 2013, 111, 374–383. [Google Scholar] [CrossRef]
  14. Imtenan, S.; Rahman, S.A.; Masjuki, H.; Varman, M.; Kalam, M. Effect of dynamic injection pressure on performance, emission and combustion characteristics of a compression ignition engine. Renew. Sustain. Energy Rev. 2015, 52, 1205–1211. [Google Scholar] [CrossRef]
  15. Vedharaj, S.; Vallinayagam, R.; Yang, W.; Saravanan, C.; Lee, P. Optimization of combustion bowl geometry for the operation of kapok biodiesel—Diesel blends in a stationary diesel engine. Fuel 2015, 139, 561–567. [Google Scholar] [CrossRef]
  16. Millo, F.; Giacominetto, P.F.; Bernardi, M.G. Analysis of different exhaust gas recirculation architectures for passenger car Diesel engines. Appl. Energy 2012, 98, 79–91. [Google Scholar] [CrossRef]
  17. Asad, U.; Zheng, M. Exhaust gas recirculation for advanced diesel combustion cycles. Appl. Energy 2014, 123, 242–252. [Google Scholar] [CrossRef]
  18. Sayin Kul, B.; Kahraman, A. Energy and Exergy Analyses of a Diesel Engine Fuelled with Biodiesel-Diesel Blends Containing 5% Bioethanol. Entropy 2016, 18, 387. [Google Scholar] [CrossRef]
  19. Monsalve-Serrano, J.; Belgiorno, G.; Di Blasio, G.; Guzmán-Mendoza, M. 1D Simulation and Experimental Analysis on the Effects of the Injection Parameters in Methane–Diesel Dual-Fuel Combustion. Energies 2020, 13, 3734. [Google Scholar] [CrossRef]
  20. Belgiorno, G.; Dimitrakopoulos, N.; Di Blasio, G.; Beatrice, C.; Tuner, M.; Tunestal, P. Parametric Analysis of the Effect of Pilot Quantity, Combustion Phasing and EGR on Efficiencies of a Gasoline PPC Light-Duty Engine. In Proceedings of the 13th International Conference on Engines & Vehicles, Napoli, Italy, 10–14 September 2017; Volume 1, p. 1. [Google Scholar] [CrossRef]
  21. Rashedul, H.; Masjuki, H.; Kalam, M.; Ashraful, A.; Rahman, S.A.; Shahir, S. The effect of additives on properties, performance and emission of biodiesel fuelled compression ignition engine. Energy Convers. Manag. 2014, 88, 348–364. [Google Scholar] [CrossRef]
  22. Agarwal, A.K.; Das, L.M. Biodiesel Development and Characterization for Use as a Fuel in Compression Ignition Engines. J. Eng. Gas Turbines Power 2001, 123, 440–447. [Google Scholar] [CrossRef]
  23. Aldhaidhawi, M.; Chiriac, R.; Badescu, V. Ignition delay, combustion and emission characteristics of Diesel engine fueled with rapeseed biodiesel—A literature review. Renew. Sustain. Energy Rev. 2017, 73, 178–186. [Google Scholar] [CrossRef]
  24. Hwang, J.; Qi, D.; Jung, Y.; Bae, C. Effect of injection parameters on the combustion and emission characteristics in a common-rail direct injection diesel engine fueled with waste cooking oil biodiesel. Renew. Energy 2014, 63, 9–17. [Google Scholar] [CrossRef]
  25. Chadwell, C.J.; Dingle, P.J.G. Effect of Diesel and Water Co-injection with Real-Time Control on Diesel Engine Performance and Emissions; SAE Technical Paper Series; SAE International: Warrendale, PA, USA, 2008. [Google Scholar] [CrossRef]
  26. Pidol, L.; Lecointe, B.; Starck, L.; Jeuland, N. Ethanol–biodiesel–diesel fuel blends: Performances and emissions in conventional diesel and advanced low temperature combustions. Fuel 2012, 93, 329–338. [Google Scholar] [CrossRef]
  27. Bose, P.K.; Maji, D. An experimental investigation on engine performance and emissions of a single cylinder diesel engine using hydrogen as inducted fuel and diesel as injected fuel with exhaust gas recirculation. Int. J. Hydrogen Energy 2009, 34, 4847–4854. [Google Scholar] [CrossRef]
  28. Choi, C.; Reitz, R. An experimental study on the effects of oxygenated fuel blends and multiple injection strategies on DI diesel engine emissions. Fuel 1999, 78, 1303–1317. [Google Scholar] [CrossRef]
  29. Soudagar, M.E.M.; Mujtaba, M.; RezaSafaeibcd, M.; Afzale, A.; V Raju, D.; Ahmeda, W.; Banapurmath, N.; Hossainh, N.; Bashiri, S.; AnjumBadruddinjk, I.; et al. Effect of Sr@ZnO nanoparticles and Ricinus communis biodiesel-diesel fuel blends on modified CRDI diesel engine characteristics. Energy 2021, 215, 119094. [Google Scholar] [CrossRef]
  30. Gavhane, R.S.; Kate, A.M.; Pawar, A.; Safaei, M.R.; Soudagar, M.E.M.; Abbas, M.M.; Ali, H.M.; Banapurmath, N.R.; Goodarzi, M.; Badruddin, I.A.; et al. Effect of Zinc Oxide Nano-Additives and Soybean Biodiesel at Varying Loads and Compression Ratios on VCR Diesel Engine Characteristics. Symmetry 2020, 12, 1042. [Google Scholar] [CrossRef]
  31. Khan, H.; Soudagar, M.E.M.; Kumar, R.H.; Safaei, M.R.; Farooq, M.; Khidmatgar, A.; Banapurmath, N.R.; Farade, R.A.; Abbas, M.M.; Afzal, A.; et al. Effect of Nano-Graphene Oxide and n-Butanol Fuel Additives Blended with Diesel—Nigella sativa Biodiesel Fuel Emulsion on Diesel Engine Characteristics. Symmetry 2020, 12, 961. [Google Scholar] [CrossRef]
  32. Di Blasio, G.; Bonura, G.; Frusteri, F.; Beatrice, C.; Cannilla, C.; Viscardi, M. Experimental Characterization of Diesel Combustion Using Glycerol Derived Ethers Mixtures. SAE Int. J. Fuels Lubr. 2013, 6, 940–950. [Google Scholar] [CrossRef]
  33. Di Blasio, G.; Beatrice, C.; Molina, S. Effect of Port Injected Ethanol on Combustion Characteristics in a Dual-Fuel Light Duty Diesel Engine; SAE Tech. Pap. 2013-01-1692; SAE International: Warrendale, PA, USA, 2013. [Google Scholar] [CrossRef]
  34. Napolitano, P.; Guido, C.; Beatrice, C.; Di Blasio, G. “Study of the Effect of the Engine Parameters Calibration to Optimize the Use of Bio-Ethanol/RME/Diesel Blend in a Euro5 Light Duty Diesel Engine”. SAE Int. J. Fuels Lubr. 2013, 6, 263–275. [Google Scholar] [CrossRef]
  35. Di Blasio, G.; Beatrice, C.; Dijkstra, R.; Boot, M. Low Cetane Number Renewable Oxy-fuels for Premixed Combustion Concept Application: Experimental Investigation on a Light Duty Diesel Engine; SAE Tech. Pap. 2012-01-1310; SAE International: Warrendale, PA, USA, 2012. [Google Scholar] [CrossRef]
  36. Cisek, J.; Lesniak, S.; Przybylski, W. The synergy of two biofuel additives on combustion process to simultaneously reduce NOx and PM emissions. Energies 2021, 14, 2784. [Google Scholar] [CrossRef]
  37. Worldwide Fuel Charter. Gasoline and Diesel Fuel, 6th ed.; Worldwide Fuel Charter: Brussels, Belgium, 2019. [Google Scholar]
  38. Myung, C.L.; Park, S. Exhaust nanoparticle emissions from internal combustion engines: A review. Int. J. Automot. Technol. 2012, 9, 13. [Google Scholar] [CrossRef]
  39. Benajes, J.; Novella, R.; Arthozoul, S.; Kolodziej, C. Particle size distribution measurements from early to late injection timing low-temperature combustion in a heavy-duty diesel engine. SAE Int. J. Fuels Lubr. 2010, 3, 567–581. [Google Scholar] [CrossRef]
  40. AVL LIST Gmbh. AVL 513D Engine VideoScope. System Description and Examples; AVL: Graz, Australia, 2000. [Google Scholar]
  41. Cisek, J. Optical research on the fuel injection into a diesel engine for diesel fuel, RME and rape oil. J. KONES. Powertrain Transp. 2012, 19, 65–73. [Google Scholar] [CrossRef]
  42. Cisek, J. Injection and combustion of RME with water emulsions in a diesel engine. Acta Polytech. 2010, 50. [Google Scholar] [CrossRef]
  43. Cisek, J. Options for the analysis of fuel injectors function using visual digitized methods. J. Middle Eur. Constr. Des. Cars 2004, 2, 24–31. [Google Scholar]
  44. DAGAS Limited Company. Wizualizacja Spalania i Termowizja Płomienia w Badawczym Silniku z Zapłonem Samoczynnym Zasilanym Paliwem Bazowym i Trzema Paliwami z Dodatkami; Research Report, Contract No: M-04/331/2021/P; Cracow University of Technology: Cracow, Poland, 2022. [Google Scholar]
  45. Ma, B. Development of Quantitative Optical Techniques for Microgravity Combustion and Sooty Flame Characterization. Ph.D. thesis, Faculty of the Graduate School of Yale University, New Haven, CT, USA, September 2013. [Google Scholar]
  46. Levendis, Y.A.; Estrada, K.R.; Hottel, H.C. Development of multicolor pyrometers to monitor the transient response of burning carbonaceous particles. Rev. Sci. Instrum. 1992, 63, 3608–3622. [Google Scholar] [CrossRef]
  47. Matsui, Y.; Kamimoto, T.; Matsuoka, S. A Study on the Application of the Two–Color Method to the Measurement of Flame Temperature and Soot Concentration in Diesel Engines; SAE International: Warrendale, PA, USA, 1980. [Google Scholar] [CrossRef]
  48. AVL LIST Gmbh. Spectral Flame Temperature Measurement Using the Two Colour Method; AVL LIST Gmbh: Graz, Austria, 2000. [Google Scholar]
  49. Merkisz, J. Ekologiczne Problemy Silników Spalinowych; Wydawnictwo PP: Poznań, Poland, 1999; ISBN 83-7143-039-6. [Google Scholar]
  50. Bornemann, H.; Scheidt, F.; Sander, W. Thermal decomposition of 2-ethylhexyl nitrate (2-EHN). Int. J. Chem. Kinet. 2002, 34, 34–38. [Google Scholar] [CrossRef]
  51. Lu, G.B.; Yang, T.; Chen, L.P. Thermal decomposition kinetics of 2-ethylhexyl nitrate under non-isothermal and isothermal conditions. J. Therm. Anal. Calorim. 2015, 124, 471–478. [Google Scholar] [CrossRef]
  52. Almodovar, C.A.; Goldsmith, C.F. Laser schlieren study of the thermal decomposition of 2-ethylhexyl-nitrate. Proc. Combust. Inst. 2021, 38, 997–1005. [Google Scholar] [CrossRef]
  53. Cisek, J.; Lesniak, S.; Mokretskyy, V.; Przybylski, W. The Influence of Reduxco Catalyst in the Diesel Fuel on Energy Parameters, Exhaust Gas Composition and Rate of Heat Release of A Diesel Engine; SAE Technical Paper Series; SAE Technical Paper 2020-01-2061; SAE International: Warrendale, PA, USA, 2020. [Google Scholar]
Figure 1. Methods of determining combustion temperature.
Energies 15 04882 g001
Figure 2. Analysis of “utilitary” and “scientific” parameters in relation to the conducted research.
Energies 15 04882 g002
Figure 3. Diagram of test bench (detailed description of schematic element numbers can be found in the previous study [36]).
Energies 15 04882 g003
Figure 4. Test bench scheme for visualisation of fuel injection and combustion in AVL VideoScope 513D mounted to diesel engine [40].
Energies 15 04882 g004
Figure 5. Diagram of the filming process in engine cylinder using AVL VideoScope 513D system.
Energies 15 04882 g005
Figure 6. Example recording of injection and combustion processes in diesel engine cylinder for selected crankshaft angles of rotation (original footage, colour, registration every 0.1° CA, selected from recorded frames).
Energies 15 04882 g006
Figure 7. Diagram of methods used to determine combustion temperature [40].
Energies 15 04882 g007
Figure 8. (a) Hourly fuel consumption (FC) for tested fuels. (b) Percent change in hourly fuel consumption (ΔFC) for tested fuels relative to FC for DFB (base fuel).
Energies 15 04882 g008
Figure 9. (a) Exhaust gas temperature (texh) for tested fuels. (b) Percent change in exhaust gas temperature (Δtexh) for tested fuels relative to texh for DFB (base fuel).
Energies 15 04882 g009
Figure 11. (a) Concentration of NOx in exhaust gas for tested fuels. (b) Percent change in concentration of NOx (ΔNOx) for tested fuels relative to NOx for DFB (base fuel).
Energies 15 04882 g011
Figure 12. (a) PM emissions with engine exhaust for tested fuels. (b) Percent change in PM emissions (ΔPM) for tested fuels relative to DFB (base fuel).
Energies 15 04882 g012
Figure 13. Pressure waveforms in engine cylinder powered by tested fuels.
Energies 15 04882 g013
Figure 14. (a) Start of fuel self-ignition (αSC) for tested fuels. (b) Percent change in start of fuel self-ignition (ΔαSC) for tested fuels relative to αSC for DFB.
Energies 15 04882 g014
Figure 15. (a) Self-ignition delay (τc) for tested fuels. (b) Percent change in self-ignition delay (Δτc) for tested fuels relative to τc for base fuel.
Energies 15 04882 g015
Figure 16. Course of combustion temperature, determined from indicator charts for tested fuels.
Energies 15 04882 g016
Figure 17. (a). Combustion temperature (Tck) in kinetic combustion phase for tested fuels. (b) Combustion temperature (Tcd) in diffusion combustion phase for tested fuels.
Energies 15 04882 g017
Figure 18. Heat release rate (dQ/dα) in SB 3.1 engine cylinder for four tested fuels.
Energies 15 04882 g018
Figure 19. (a) Maximum kinetic combustion rate (dQk) for tested fuels. (b) Percent change in maximum rate of kinetic combustion (ΔdQk) for tested fuels relative to dQk for DFB (base fuel).
Energies 15 04882 g019
Figure 20. (a) Maximum rate of kinetic combustion (αdQk) for tested fuels. (b) Maximum rate of diffusion combustion (αdQd) for tested fuels.
Energies 15 04882 g020
Figure 21. (a) Heat of kinetic phase (Qk) for tested fuels. (b) Percent change in heat of kinetic phase (ΔQk) for tested fuels relative to Qk for DFB (base fuel).
Energies 15 04882 g021
Figure 22. (a) Duration of kinetic phase (αfQk) for tested fuels. (b) Percent change (ΔαfQk) for tested fuels relative to αfQk for DFB (base fuel).
Energies 15 04882 g022
Figure 23. (a) End of combustion (αEC) for tested fuels. (b) Percent change in end of combustion ΔαEC for tested fuels relative to (αEC) for DFB (base fuel).
Energies 15 04882 g023
Figure 24. (a) Maximum rate of diffusion combustion (dQd) for tested fuels. (b) Percent change in maximum rate of diffusion combustion (ΔdQd) for tested fuels relative to dQd for DFB (base fuel).
Energies 15 04882 g024
Figure 25. (a) Duration of diffusion phase (αfQd) for tested fuels. (b) Percent change (ΔαfQd) for tested fuels relative to αfQd for DFB (base fuel).
Energies 15 04882 g025
Figure 26. (a) Heat of diffusion phase (Qd) for tested fuels. (b) Percent change in heat of diffusion phase (ΔQd) for tested fuels relative to Qd for DFB (base fuel).
Energies 15 04882 g026
Figure 27. Image from inside engine cylinder for crankshaft angle of rotation corresponding to the beginning of fuel self-ignition αSC in combustion of tested fuels.
Energies 15 04882 g027
Figure 28. Image inside engine cylinder for crankshaft angle of rotation corresponding to maximum rate of kinetic combustion αdQk_max.
Energies 15 04882 g028
Figure 29. Distribution of isotherms in flame in engine cylinder for crankshaft angle of rotation corresponding to maximum rate of kinetic combustion αdQk_max.
Energies 15 04882 g029
Figure 30. Surface area Sk of flame in kinetic combustion phase covered by isotherms with specific temperatures (relative to measuring surface area So) for tested fuels.
Energies 15 04882 g030
Figure 31. Image inside engine cylinder for crankshaft angle of rotation corresponding to maximum speed of diffusion combustion αdQd_max.
Energies 15 04882 g031
Figure 32. Distribution of isotherms in flame in engine cylinder (over 1800 K) for crankshaft rotation angle corresponding to maximum speed of diffusion combustion αdQd_max.
Energies 15 04882 g032
Figure 33. Surface area Sd of flame in diffusion phase of combustion covered by isotherms with specific temperatures (in relation to the measurement surface area So) for tested fuels.
Energies 15 04882 g033
Figure 34. Image inside engine cylinder for crankshaft angle of rotation corresponding to visual end of combustion for tested fuels αEC.
Energies 15 04882 g034
Table 1. Technical specifications of engine.
Type of EngineSB 3.1 (One-Cylinder Research Engine)
Primary Unit: SW 680 (Leyland)
combustion systemdirect fuel injection to open combustion chamber in piston
displacement1.85 dm3
number of cylinders1
cylinder diameter127 mm
piston stroke146 mm
compression ratio15.75
rated power Ne23 kW
nominal rotational speed2200 rpm
maximum torque Momax110 Nm
rotation speed nMomax1600 rpm
direction of crankshaft rotationleft
lubricationcirculating, pressurised
Cooling liquid, forced
geometric start of fuel injection27° CA before TDC
static injector opening pressure17 MPa
injection pumppiston, type P56-01A
regulatortype R 14V-20-110/12M
injectortype W1B-01
sprayer4-hole, φ = 0.35 mm
Publisher’s Note: MDPI stays neutral with regard to jurisdictional claims in published maps and institutional affiliations.

