1. Introduction
The most widely used cooking fuels worldwide are liquid petroleum gas (LPG), natural gas and electricity, and biogas, as well as solar and alcohol cookers, which are considered clean fuels and technologies [
1]. However, LPG and natural gas, being fossil fuels, emit large amounts of greenhouse gases (GHG) and pollutants into the environment, and electricity could also directly generate these impacts on the environment depending on the fuel mix of the electric fleet. Thus, although LPG and natural gas could be called “modern” fuels, they are by no means “clean” fuels. According to [
1], in 2019, 66% of the population had access to such fuels and technologies, while 2.6 billion people continue to cook with traditional biomass such as wood, charcoal, crop residues, dung and other traditional fuels such as coal and kerosene. Thus, by 2019, traditional biomass consumption was estimated at 24.6 EJ, representing 6.5% of the world’s final energy consumption [
2].
Traditional biomass—the mix of firewood, crop residues and dung—is the second most used fuel in low- and middle-income countries, being responsible for 34% of total consumption, after gaseous fuels—LPG, natural gas and biogas—at 51%. However, in rural areas, 57% of the population uses traditional biomass [
1]. Of the total population using traditional biomass for cooking, 35% live in Sub-Saharan Africa, 31% is in Central and South Asia, and 28% in East and Southeast Asia, with the countries of India, China and Nigeria having the most significant number of users [
1]. In each of the regions mentioned above, the type of traditional biomass used varies, although firewood use occurs in all rural and poor households. India’s most important energy sources are firewood, crop residues, and dung [
3,
4]. In China, the most common energy sources are firewood and coal [
5], and in countries such as Nigeria and Indonesia, they are firewood and kerosene [
6,
7]. In some rural areas of Latin America, almost 100% of the rural population use firewood, especially in countries such as Bolivia and Nicaragua. In Panama, it is seen in 55% of the rural population, in Costa Rica 25% [
8], in Peru 40% [
9], and in Guatemala 54% [
2]. In Mexico, according to reference [
10], 11% of the national population consumes firewood and charcoal, although it has proven difficult to determine specific levels of firewood consumption in Mexican households.
Firewood is a significant energy source because it is accessible and affordable [
11]. However, the current traditional use of firewood presents several significant challenges to long-term sustainability. For example, demand for firewood for cooking and heating accounts for the burning of 55% of wood harvested globally. Such levels create pressure on both the global and regional environment and results, according to Bailis et al. and Dagnachew et al. [
12,
13], in adverse impacts on the Earth’s surface, resulting in deforestation and soil erosion.
Another issue of concern that is associated with the traditional use of firewood is the high level of pollutants such as carbon monoxide (CO), methane (CH
4), nonmethane hydrocarbons (NMHCS), nitrous oxide (N
2O), nitrogen oxide (NOx), particulate matter (PM), black carbon (BC) or elemental carbon (EC), organic carbon (OC) and organic matter (OM) [
14,
15,
16] and others such as levoglucosan [
17,
18,
19]. All these pollutants are associated with the combustion of this solid biofuel (SBF) in traditional means, i.e., conventional firewood stoves or three-stone fires (TSF) [
11,
17,
20]. According to the WHO, PM emissions are one of the most critical environmental challenges in households, as pollutant concentrations exceed air quality guidelines [
21]. Concentrations of PM
2.5 in 24 h households using wood for cooking range from 387–3100 µg m
−3 [
22,
23,
24], well above the average of 25 µg m
−3 established by the WHO air quality standards.
Regarding their impact on human health, exposure to the pollutants mentioned above may result in a higher risk of respiratory illness—including respiratory infection, lung cancer, and asthma—and cardiovascular ailments [
16,
25,
26]. Furthermore, evidence has been reported of impacts on other health problems such as nutritional deficiency, eye irritation and infections, premature infant deaths [
14], impairment of female fertility [
27] and impaired cognitive functioning in elders [
28]. According to the WHO, an estimated 3.8 million annual deaths were caused by air pollution in households that utilize SBF in some fashion—mainly firewood—for cooking purposes [
29]. In such cases, it is women and children who are most adversely affected, given that they have greater exposure to traditional firewood stoves [
14,
27,
30,
31].
Furthermore, emissions of carbon dioxide (CO
2), CH
4, N
2O and aerosol particles into the atmosphere may result in concentrated levels of GHG, and result in adverse climate change [
15,
32,
33]. What also needs to be considered in this regard are the emissions of BC. It is these BC emissions that are the second leading cause of global warming, i.e., after CO
2 [
34].
In addition to the different kinds of negative impacts on the environment and human well-being that have previously been discussed, energy poverty is a characteristic of the vast majority of households dependent on traditional biomass. It constitutes a challenge to global energy systems [
35]. Relief from energy poverty is one of the Sustainable Development Goals (SDGs), i.e., the seventh such goal, identified as affordable and clean energy, to be attained by 2030 [
36].
Some new fuel options and clean cooking technologies have been proposed to take advantage of modern forms of bioenergy that are derived from sustainable biomass, whose emissions do not produce GHGs, and whose use significantly reduces emissions of PM and criteria pollutants. Such forms of bioenergy include biogas from anaerobic digestion or fermentation of organic residues, fuel alcohols such as methanol and ethanol from cellulosic and biomass feedstocks, pellets and briquettes from sawdust, straw, forest, and crop residues [
37] as well as other chemical and biochemical methods to optimize biomass utilization [
38,
39], such as biogas stoves, stoves using alcohols [
37], and gasifying stoves [
40]. Furthermore, there are electric clean cooking technologies using distributed electricity in mini-grids and photovoltaics such as induction stoves [
37,
41]. However, firewood is still widely used due to its easy accessibility [
41]. Its collection, either for distribution or consumption, is generally free and presents co-benefits in the socio-ecological systems in the areas where it is collected [
42,
43,
44].
Energy resilience has been associated with the dimensions of sustainability. It is defined as the ability of an energy system to respond to and recover from external disturbances caused by shocks in economic, social, environmental, and institutional terms to move from learning to adapting to change [
45,
46,
47,
48]. Reference [
45] includes three main components: energy access, renewable energy, and energy efficiency. Energy resilience has positive effects on environmental sustainability, GHG and climate change mitigation [
48,
49,
50] and biodiversity protection [
50]. In the case of fuelwood, although the consumption of this type of SBF with inefficient devices has the negative effects mentioned above, most firewood users perceive it as the energy source that could lead to improving energy resilience if efficient devices are used, because it provides more reliable energy for households where electricity or gas supply is limited or unavailable [
51], as is the case in rural populations, as well as in small island countries that depend on fossil fuel imports [
49].
Therefore, it is necessary to develop policies that increase the sustainability of firewood consumption in order to reduce the negative impacts on the environment and human health, increase resilience, and mitigate the impacts of climate change.
According to reference [
52], these policies should intersect with various sectors involving forestry codes, energy laws and land tenure laws. Countries such as Tasmania and Chile have enacted policies to encourage the development of new markets for sustainably produced firewood [
52,
53,
54,
55]. Among these policies is a labeling system to differentiate legally and sustainably traded firewood in the market, certification programs for firewood production, and improvements in the production process that help to reduce the overexploitation of forests, increase the combustion efficiency of firewood, and improve air quality standards. Other measures in this regard include the imposition of certification standards for the regulation of sustainable forests and firewood certification that indicates that it is sold dry and obtained from sustainably managed forests and sustainably managed native forests.
Among the mitigation policies aimed at improving air quality and curbing the health impacts of firewood consumption are programs to change traditional firewood stoves to efficient stoves [
15,
41,
52,
56] and subsidy schemes [
16]. References [
15,
22,
25,
57,
58,
59] have concluded that improved biomass cookstoves reduce pollutant emissions and users’ adverse health effects. However, the challenges of an adequate adoption of efficient cookstoves by most of the firewood user population should be considered [
22,
44,
60].
In Mexico, it is difficult to determine the consumption and final use of firewood, due to the highly diverse nature of the conduct, customs, and socioeconomic structure of the population. However, it has been estimated that the use of firewood for cooking is widely practiced within the country [
61]. In this regard, the National Energy Balance (NEB) [
62] indicated that, in 2019, firewood was responsible for 26% of final energy consumption in Mexico’s residential sector. According to the most recent available data for the year 2018, there were an estimated 4,533,122 Mexican households and 18 million persons used firewood [
63]. However, there remains the challenge of a lack of the kind of detailed, accurate, and high-quality information that could represent and explain the patterns of consumption of firewood at the national level.
There have been few studies on the consumption of firewood for cooking [
64,
65]; thus, the patterns and problems involved in such consumption in Mexico remain unexplained. Only recently has the first national survey been conducted regarding energy consumption in Mexican households. It is the National Survey on the Consumption of Energy Sources in Private Housing Units (known by its Spanish acronym of ENCEVI, 2018) [
66] conducted at the national level by the Mexican National Institute for Statistics and Geography (known by its Mexican acronym as INEGI). This survey includes specific questions regarding the use of firewood in Mexican households.
Concerning the information on cooking as the final use in Mexican households, results of the ENCEVI published in a report by INEGI [
10] are described collectively for each of Mexico’s climate regions (CR). Furthermore, the percent distribution of households by type of fuel used for cooking is reported, with results showing 11% use total firewood or charcoal—noting that the ENCEVI results report does not distinguish between the two SBF. In addition, this report does not break down and specify results to allow for an accurate analysis regarding the dynamics of their consumption, especially of firewood for cooking as a final use in Mexican households.
The present article seeks to contribute to research on fuelwood use by specifying the socioeconomic and climatic region patterns involved in fuelwood consumption as well as the impacts of fuelwood consumption on other relevant parameters, answering the following questions: (1) What are the fuelwood consumption patterns of rural and peri-urban households according to the climatic regions where they are located and the socioeconomic level to which they belong? (2) What is the impact of fuelwood consumption on climate change, gender and health aspects, and energy poverty?
This study contributes to the generation of knowledge to determine actions toward achieving SDG 7, “Affordable and clean energy”, and specifically target 7.1, i.e., ensure universal access to affordable, reliable, and modern energy services-, which concerns access to clean cooking fuels and technologies. It will also contribute to SDG 3 “Health and well-being”, specifically target 3.9, i.e., reduction of the mortality rate attributed to household air pollution, and to SDG 5 “Gender equality”, specifically target 5.4, i.e., recognition of unpaid domestic work through (public services) and infrastructure.
The consumption of firewood for cooking is presented herein that takes into account the number of users and households utilizing firewood, the size of the population that pays for the firewood that it uses, the expenses for acquiring firewood per household, and by climate region (CR). This paper has focused specifically on population centers of fewer than 15,000 inhabitants, and on the low (L) and moderately low (ML) socioeconomic levels (SL) of the Mexican population.
This study is structured as follows:
Section 2 presents a literature review on the current situation of fuelwood consumption in Mexico.
Section 3 describes the methodology used to obtain the number of users and households disaggregating fuelwood consumption and purchase expenditure by climatic region and socioeconomic level.
Section 4 presents the socioeconomic and climatic patterns of fuelwood consumption. It continues with results on the implications of fuelwood consumption for the environment, health, gender, and energy poverty. Finally,
Section 5 presents the main universal findings, limitations of this study, and future research to improve knowledge on fuelwood consumption.
2. Current State of Knowledge Regarding the Use of Firewood for Cooking in Rural and Peri-Urban Mexico
Efforts have been undertaken in Mexico to quantify the consumption of firewood in the residential sector [
64,
67,
68,
69]. Unfortunately, the estimates of firewood consumption yielded by such efforts were obtained on the basis of limited statistical samples of individual families or local cases via academic studies, case studies, or surveys limited to particular states, e.g., Yucatán, Oaxaca, Michoacán. These studies reported national levels of annual per capita firewood consumption in Mexico of between 7.9 to 15.8 GJ. The studies further indicate that consumers either gather firewood for personal use or purchase it at local markets that sell firewood, which has been harvested in commercial or non-commercial forest areas, abandoned agricultural parcels, or in arid brush-covered regions.
Regional studies have also been conducted in the states of Yucatán and Chiapas [
30,
70,
71]. In the eastern and metropolitan areas of Yucatán, Reference [
71] reported that 42% of dwellings used firewood as an alternative to LPG, with an annual per capita firewood consumption of 12 GJ. Conversely, Reference [
70] reported that, in Chiapas, annual per capita firewood consumption ranged between 6.9 and 12.1 GJ, and that those using the resource spent an average of one hour gathering it. In addition, working in Chiapas–but in two different communities—Reference [
30] reported that between 22% and 32% of households were exclusive firewood users (EFU), and that between 67% and 74% were mixed users of firewood (MU), and for LPG, this latter group consumed a household annual average of 21.1 GJ of firewood.
Similarly, other studies have focused on the analysis of other aspects of the consumption of firewood, such as the cost of acquiring this SBF. García-Frapolli et al. [
72] reported a firewood price of 8.97 USD per GJ (at the 2017 exchange rate) in local markets of the Purépecha region of northwestern Michoacán, while Troncoso et al. [
73] reported that, in Chiapas, households spent between 97.2 and 391.2 USD per year on firewood (at the 2017 exchange rate), where 73% of users purchased all or some of their firewood.
Efforts to obtain trustworthy estimates of firewood consumption from governmental sources have also been limited. For example, data published by Mexico’s Department of Energy (knows by its Spanish acronym of SENER) were based upon studies involving samples in a number of different regions of the country, which were then extrapolated to the nation’s households as a whole [
62]. INEGI has, for its part, developed instruments that can be used to obtain information regarding the number of households utilizing firewood for cooking. Only recently have such tools improved enough to allow for the gathering of more detailed information, a development that we now explain in detail.
The Census of Population and Housing (CPH), conducted every ten years, is the Mexican government’s oldest tool for capturing information, through INEGI, regarding the use of SBF for cooking in households. Beginning in 1960 [
74], information such as household firewood and charcoal use was gathered without distinction between these two SBF. Later, beginning in the year 1996, the National Survey of Household Income and Expenses (ENIGH) [
75] began to make a distinction between firewood and charcoal, but without providing any additional details. Still later, in the National Survey of Household Expenses (ENGASTO) for the years 2012 and 2013 [
76] and the National Survey of Household (ENH) for 2014 [
77], information regarding cases in which a firewood or charcoal stove utilized a chimney was incorporated into the surveys. In the last ENH, to date, conducted in 2017, the Home and the Environment Module (MOHOMA) was added. This module includes a section designed to capture information about energy used for cooking, and indicates, in those cases reporting use of firewood, whether the household does or does not have an improved biomass cookstove, how firewood is obtained, time spent on collecting it, and in cases where it is purchased, how much was spent on the firewood [
78].
Finally, The ENCEVI [
66], a survey designed to obtain information on energy consumption in housing units, was conducted in 2018. This survey was the first to provide more detailed information about the consumption of firewood (see
Section 3.1 below for a full description of the ENCEVI). Unfortunately, this information has not yet been analyzed sufficiently to allow us to draw conclusions regarding socioeconomic patterns, or their implications for climate change, gender, or health or for energy poverty resulting from the use of firewood in Mexican households.
One of the first studies conducted for the purpose of estimating more accurately the consumption of firewood in Mexico was reported by Reference [
79]. These authors utilized a bottom-up approach, and a methodology previously proposed by Reference [
68] in which, on the basis of information from the CPH for the period 1960–1990, the total number of firewood users was obtained, and these users were classified as either EFU or MU. Proceeding in this manner, Reference [
79] estimated that, by the year 2000, one-fourth of Mexican households were using firewood to cook and that 18.7 million persons were EFU and 8.5 million were MU, with this latter group utilizing firewood in combination with LPG.
Subsequent studies that have explored the use of firewood for cooking in the residential sector in Mexico [
64,
65] have utilized the upgraded methodology of Reference [
79], while continuing to use the annual per capita firewood consumption estimates of 7.9 to 15.8 GJ reported by References [
68,
69] in order to extrapolate for the nation as a whole the data reported in ENIGH surveys or in the CPH for persons in the residential sector who use firewood for cooking.
Table S1 of the supplementary material depicts the main assumptions and results that have been reported in this regard.
Much of the information reported until now has made it possible to conduct prospective studies regarding the use of firewood in Mexico as a whole [
80,
81,
82]. These studies have set forth varied assumptions for the purpose of projecting consumption of firewood for cooking.
Table S2 of the Supplementary Material presents the main assumptions of these studies.
Conversely, some studies have addressed efficiency issues and GHG emissions and PM emissions resulting from the burning of firewood in TSF, which is the most widely used method in Mexico of using firewood for cooking purposes [
57,
83,
84]. Johnson et al. [
83] reported the following emissions data in grams of compound per kg of firewood burned in TSF: CO
2—418; CO—35; CH
4—4.8; TNMHC—3.2; PM—8.8; OC—4.4.
Another variable that has been analyzed, albeit with lesser emphasis, is the renewability of firewood. Renewability reflects the percentage of firewood obtained and utilized in a sustainable manner, meaning that its CO
2 emissions are neutral [
64,
82]. Using WISDOM methodology, Ghilardi et al. [
64] calculated that 4% of total consumption of firewood during the year 2000 was non-renewable in nature; see
Table S1. In other words, 4% of the firewood collected and burned exceeded the growth rate of biomass sources that contribute to net CO
2 emissions. A more recent study [
85] utilizing the same methodology, but counting only standing biomass that could potentially be used as firewood, depending on the type of vegetation cover, reported 34% of non-renewable biomass, which is a much higher proportion; see
Table S2. The figures reported in these previous studies thus call into question the assumption that emissions from burning firewood in Mexico are neutral.
Firewood users in Mexico have not been the subject of an analysis of energy poverty [
86,
87].This is despite the fact that 18 million Mexicans who are classified as “poor” consume firewood [
63]. Historically, firewood has been widely used in the households of impoverished Mexicans. Despite this fact, a good deal remains unknown regarding the use of firewood in Mexico’s residential sector.
Although methodologies used to estimate firewood consumption have improved over time, there has not been a commensurate improvement in the sources of raw data regarding use since the above-cited studies were published. There is thus a pressing need to generate raw data regarding the residential use of firewood in Mexico. Such data must in turn be properly broken down and subjected to high-quality statistical analysis. Only in this way will information be produced that can aid in developing social development policies, and that can be of service in confronting the challenges of energy poverty among a forgotten segment of Mexico’s population.
3. Materials and Methods
During the first half of 2018, INEGI conducted The National Survey on the Consumption of Energy Sources in Private Housing Units (ENCEVI, 2018) [
66]. This is the first survey whose objective was to obtain and convey information regarding final energy consumption in the Mexican residential sector, and it asked respondents about the different types of fuels and devices employed in electrical and thermal energy consumption.
To date, the ENCEVI 2018 is the primary source of information on firewood for cooking in Mexico, and this article is the first to utilize the survey’s results for the purpose of scientific research. In addition, the four years since the publication of this survey have seen no essential changes in the subject. This is because firewood is a traditional source of energy that is mainly consumed in the rural and peri-urban sectors, where firewood consumption patterns are changing slowly.
3.1. Structure of the ENCEVI-INEGI Survey
ENCEVI breaks down final energy consumption into six different categories: heating, cooling, water-heating, lighting, cooking, and home appliances. Within the category of cooking, information is captured regarding the kinds of primary and secondary fuels used to cook food, mass units of consumption, and expenditures on fuel. The fuels identified by ENCEVI include the following: LPG, natural gas, electricity, charcoal, and firewood. The type of stove used in employing these fuels is also indicated.
The ENCEVI survey collected information from 32,047 private housing units in Mexico. This represents the largest sample size in a study of energy use in private households and covers diverse CR and urban and rural population centers, while also representing different socioeconomic level. CR for the sample were grouped into three categories according to climate: extreme heat (EH), mild (MI), and tropical (TR). As regards size of population centers where data were collected, these were broken down into the following groups: villages with a population under 2500, towns with a population ranging between 2500 and 14,999, and town/cities with between 15,000 and 99,999 inhabitants. Finally, a “highly urban” category comprising centers with a population of 100,000 or greater was also included. A total of four SL were included: low, moderately low, moderately high, and high. These four SL represent the sociodemographic characteristics of the dwellings, their physical characteristics, and the equipment used there. All told, 34 different indicators were utilized to encompass these characteristics; see
Table S3. For the purpose of determining both the current situation and the problems involved in using firewood for cooking in Mexican households by using the ENCEVI information, the present methodology is set forth in the following section.
3.2. Methodology for the Statistical Analysis of the 2018 ENCEVI and ENIGH Survey
The methodology consisted of three stages. During the first and second stages, information reported in the 2018 ENCEVI for the category of cooking foods was analyzed in order to determine per capita and per household consumption of firewood, number of users and number of households, and the percent of women who use firewood for cooking food, including heating and reheating of food. In addition, the segment of the population that does not spend money on the firewood it consumes was identified, as was the segment that does pay for that resource. In the case of the latter group, the amount of expenditure was determined. During the third stage of this methodology, information from the 2018 ENIGH was analyzed in order to determine household income in those households that pay for firewood. In addition, the percentage of this income that was spent on firewood was determined, as was the percentage of households headed by women. In order to represent the rural and peri-urban population of Mexico, the present analysis included dwellings situated in towns and villages comprising fewer than 15,000 inhabitants, and that fall within the “Low” and “Moderately Low” socioeconomic levels of Mexico. All three of the nation’s climate regions were represented in our study.
The first stage of the study is represented in
Figure 1 and began with the identification of variables contributing information on the number of households consuming firewood for food, and the qualitative characteristics related to this consumption. These variables can be classified into two categories:
primary fuel and
secondary fuel. Then, those variables allowing for the calculation of firewood consumption in energy terms were identified: number of users and households, percentage of women using firewood, number of users and households that pay or do not pay for firewood, and amount spent on acquiring the resource. This information was broken down by CR, size of population center, and SL. For these purposes, the following databases of the ENCEVI were utilized: “DWELLING”, “HOUSEHOLD” and “ENCEVI”. While for its purposes, ENCEVI differentiated between the Spanish equivalents of the terms “dwellings” and “households” (
viviendas and
hogares, respectively), the present study utilizes the two terms interchangeably as referring to both the housing structure and the persons living within said structure. These databases were all considered under the rubric of “dwelling identifier” of the variable “folio”.
In order to properly characterize consumption of firewood for cooking purposes in households in Mexico, the “DWELLING” database was consulted specifically as regards the following variables: climate region, size of population center, socioeconomic level, and expansion factor. In the “HOUSEHOLD” database, the following variables were identified and consulted: number of persons in household and total number of women. The variables expansion factor and number of persons in household were used to estimate the number of firewood users and the number of households, while the variable total number of women was used to estimate the number of women in the population center.
In the ENCEVI database, the following variables were identified and utilized:
primary cooking fuel and
secondary cooking fuel. In addition, the following response combinations were selected:
firewood-none,
firewood-gas cylinder, and
gas cylinder-firewood. Also utilized were the variables
period of consumption and
quantity of fuel consumed, expressed in kg. In order to calculate annual per capita firewood consumption, a calorific value for firewood of 14.48 MJ kg
−1 was utilized [
88]. For the variable
fuel expenditure, the annual expenses for firewood per household were calculated, with the monetary values obtained in Mexican pesos converted to USD at the exchange rate for the reference year 2017. Finally, data were grouped according to the variables
climate region,
size of population center, and
socioeconomic level. The process of selecting and grouping data is depicted in
Figure 1.
The second stage of the methodology is presented in
Figure 2 and consists of a statistical analysis of annual per capita consumption of firewood and annual expenditure for acquiring firewood in those households where firewood is paid for.
Information was grouped by types of users identified. (i) EFU—those who identified firewood as their “primary fuel” and who responded “none” to the inquiry as to their secondary fuel source. MU were those were divided into two groups. (ii) MPU—mixed users who identified “firewood” as their primary fuel source, and “cylinder gas” as their secondary fuel source; and (iii) MSU—mixed users who identified “firewood” as their secondary fuel source, and “cylinder gas” as their primary fuel source.
Histograms were created for each of the datasets in order to determine distribution and representativeness of the data, and to enable a graphic review of normality of the data. Afterward, discordancy tests were conducted using UDASys 3.2 software [
89] in order to eliminate discordant outliers. The discordancy test was applied at 95% confidence level—0.05 significance level.
Following these tests, descriptive statistics were obtained, i.e., mean, and standard deviation of per capita firewood consumption and per household and annual expenditure on firewood per household was determined. Afterward, the numbers of households in which firewood was and was not paid for were also calculated.
During the third stage, household income in those households using firewood was estimated in order to determine the percentage of household income spent on firewood in those households that pay for the resource, and to determine the percentage of households headed by a woman. A statistical analysis was conducted using information from the ENIGH [
90], which provided information for the first half of 2018 regarding amount, structure, and distribution of household income, and the allocation of household expenditures for both durable and non-durable goods.
Figure 3 depicts the methodology utilized to determine household income in the households of firewood users, and to enable a comparison between said income and expenditure on firewood.
The following databases of the ENIGH were utilized to determine household income: “DWELLINGS”, which indicates characteristics, number of residents, and location of each dwelling; and “HOUSEHOLD CONCENTRATION”, which provides a concentrated summary of each household as regards income and expenses that are recorded on a quarterly basis.
In the “DWELLINGS” database, firewood users were identified as those who reported “firewood” as their fuel of choice to prepare or heat their meals, and only such dwellings were selected. This database does not allow for visualization per type of user, i.e., EFU or MU. For this reason, all firewood users are grouped together within this section of the analysis.
In the “CONCENTRATED HOUSEHOLD” database, current household income was identified via the indicator reporting quarterly household income in Mexican pesos for the year 2018, and sex of head of household was determined from information in the survey.
Both of these databases were cross-referenced with the key indicator “dwelling identifier” of the variable “folio”. After completing this cross-referencing, data were extracted for those dwellings having reported firewood use in accordance with the ENCEVI classification. To determine CR, information was grouped as regards information for dwellings in Mexican states representing all three of the nation’s climate regions, through the variable “geographical location”.
Afterward, data regarding current annualized income per household for each dataset were subjected to discordancy test using UDASys software (version 3.2) developed in Morelos, Mexico by [
89], with a confidence level of 95%—0.05 significance level. Annual average income and standard deviation were obtained in USD at the 2017 exchange rate for normalized data. Minimum salary for these purposes was set at 4.71 USD, in accordance with the Mexican National Commission of Minimum Salaries [
91] in order to review equivalence of annual income per household with reference to minimum salaries.
Finally, average annual income per household, calculated from the ENIGH, was compared to annual expenditure on firewood per household, as calculated in ENCEVI, and a percentage of income spent on firewood for energy was determined. Due to the fact that in the analysis of the ENIGH, the annual average income per household did not allow for a differentiation between EFU and MU, the same average annual income was used to compare annual average expense for all three categories of users examined in the present study, i.e., EFU, MPU, and MSU.
4. Results and Discussion
The universe of households surveyed in the ENECVI provided information regarding type of primary and secondary fuel used for cooking in 28,953 households by 107,239 persons surveyed. This is a statistical sample that is representative of behavior as regards energy consumption for cooking of the total of 33,162,148 households and 122,840,331 inhabitants of the Mexican nation as a whole [
66].
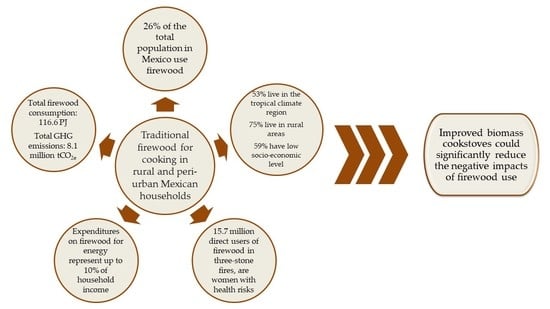
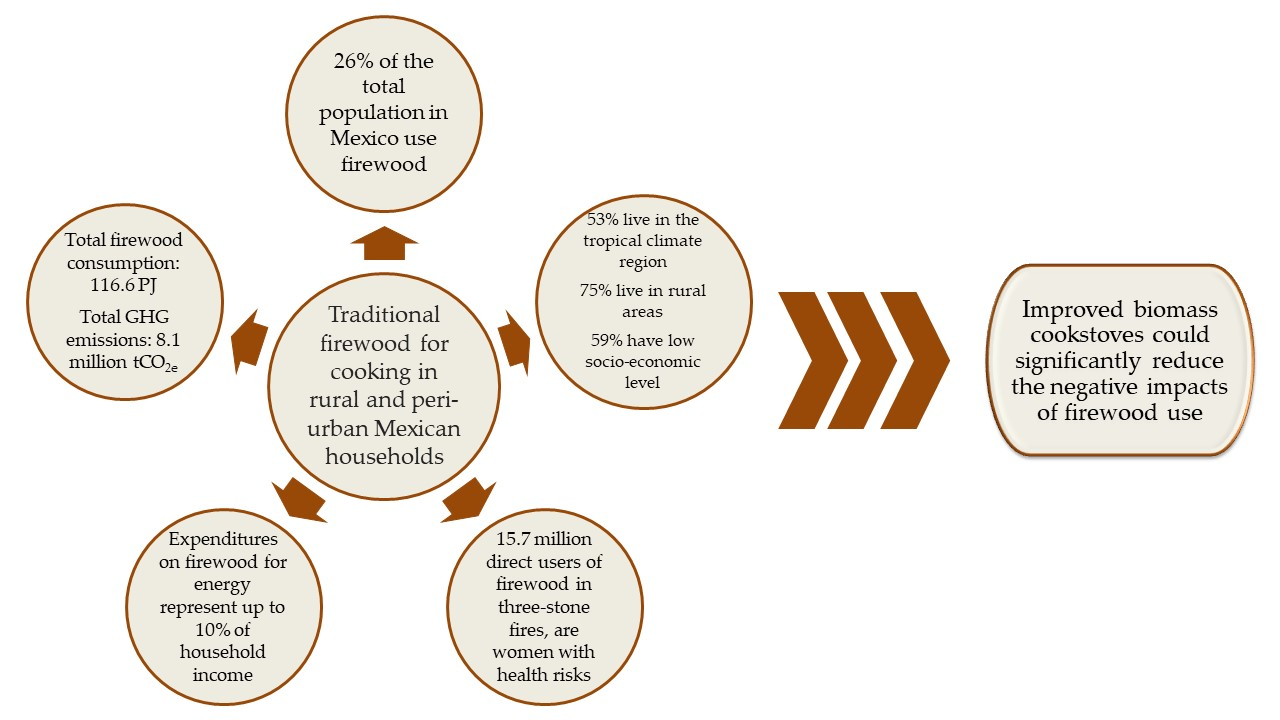
Figure 4 depicts the ENCEVI survey results and shows that LPG, natural gas and electricity constitute the group of most used fuels—72% of the households—with 26% of households surveyed reporting exclusive or mixed use of firewood, and only 2% of households reporting use of charcoal. Based on these data, it is estimated that, in Mexico as a whole, 31,336,070 inhabitants are living in 7,383,037 households that use firewood for cooking and heating food. This total number of users represents more than double the percentage reported by INEGI [
10], which reported that 11% of the Mexican population used firewood and charcoal. Furthermore, the ENCEVI results indicate that there are 13.3 million users more than the 18 million estimated in Reference [
63] for the year 2018, based on data from the National Health and Nutrition Survey. These differences arise because these other studies only report the responses of the primary fuel used for cooking without collecting more detailed information on the consumption of firewood. Thus, these other studies simply do not reflect the importance of firewood consumption by mixed users.
Figure 4 depicts the four groups of firewood users identified in the present article: (i) EFU; (ii) MPU; (ii) MSU; and (iv) MU, who use firewood in combination with charcoal. The results show that, of the total number of firewood users, 30.2% are EFU (9,456,387 persons in 2,180,203 households) and that 69.8% are MU (21,879,683 persons in 5,220,225 households). This same higher proportion of MU relative to EFU was observed in Chiapas by Troncoso et al. [
30], where between 22% and 32% of households were EFU, and between 67% and 74% were MU—the latter group using firewood in combination with LPG.
Of the total number of MU, MPU accounted for 17.6% (5,502,037 persons and 1,305,582 households) and MSU 51.2% (16,502,355 persons and 3,845,353 households), with the remaining 1% (325,291 persons and 69,290 households) being MU that used firewood in combination with charcoal. Because this last group constitutes such a small proportion of the total, it was excluded from consideration in this study.
4.1. Consumption Patterns of Exclusive and Mixed Firewood Users
Among all firewood users, TFS was the device for cooking and heating food that was preferred by the vast majority, with the improved biomass cookstove being the choice of a small minority. In the case of MU, devices using LPG were identified by the ENCEVI as follows: electric lighting stove, manual lighting stove, pilot-lighting stove, and gas grill.
As regards socioeconomic level, our results indicated that moderate low socioeconomic level (SL-ML) and low socioeconomic level (SL-L) accounted for 98% of firewood users. Users within these two SL classifications had a strong presence in all four population categories that were included in the ENCEVI (i.e., less than 2500; 2500 to 14,999; 15,000 to 99,999; and 100,000+). However, given that 82% of the population that consumes firewood in one of the aforementioned modalities is concentrated in population centers of fewer than 15,000 inhabitants in all three of Mexico’s CR, it is fitting that SL-L and SL-ML are represented at such high levels in the present study. In the following section, results are presented by type of user, by climate region, and by ML and L socioeconomic level for populations of fewer than 15,000 inhabitants. These results are broken down by number of users and annual firewood consumption and by paying and non-paying users of firewood.
4.1.1. Exclusive Users of Firewood (EFU)
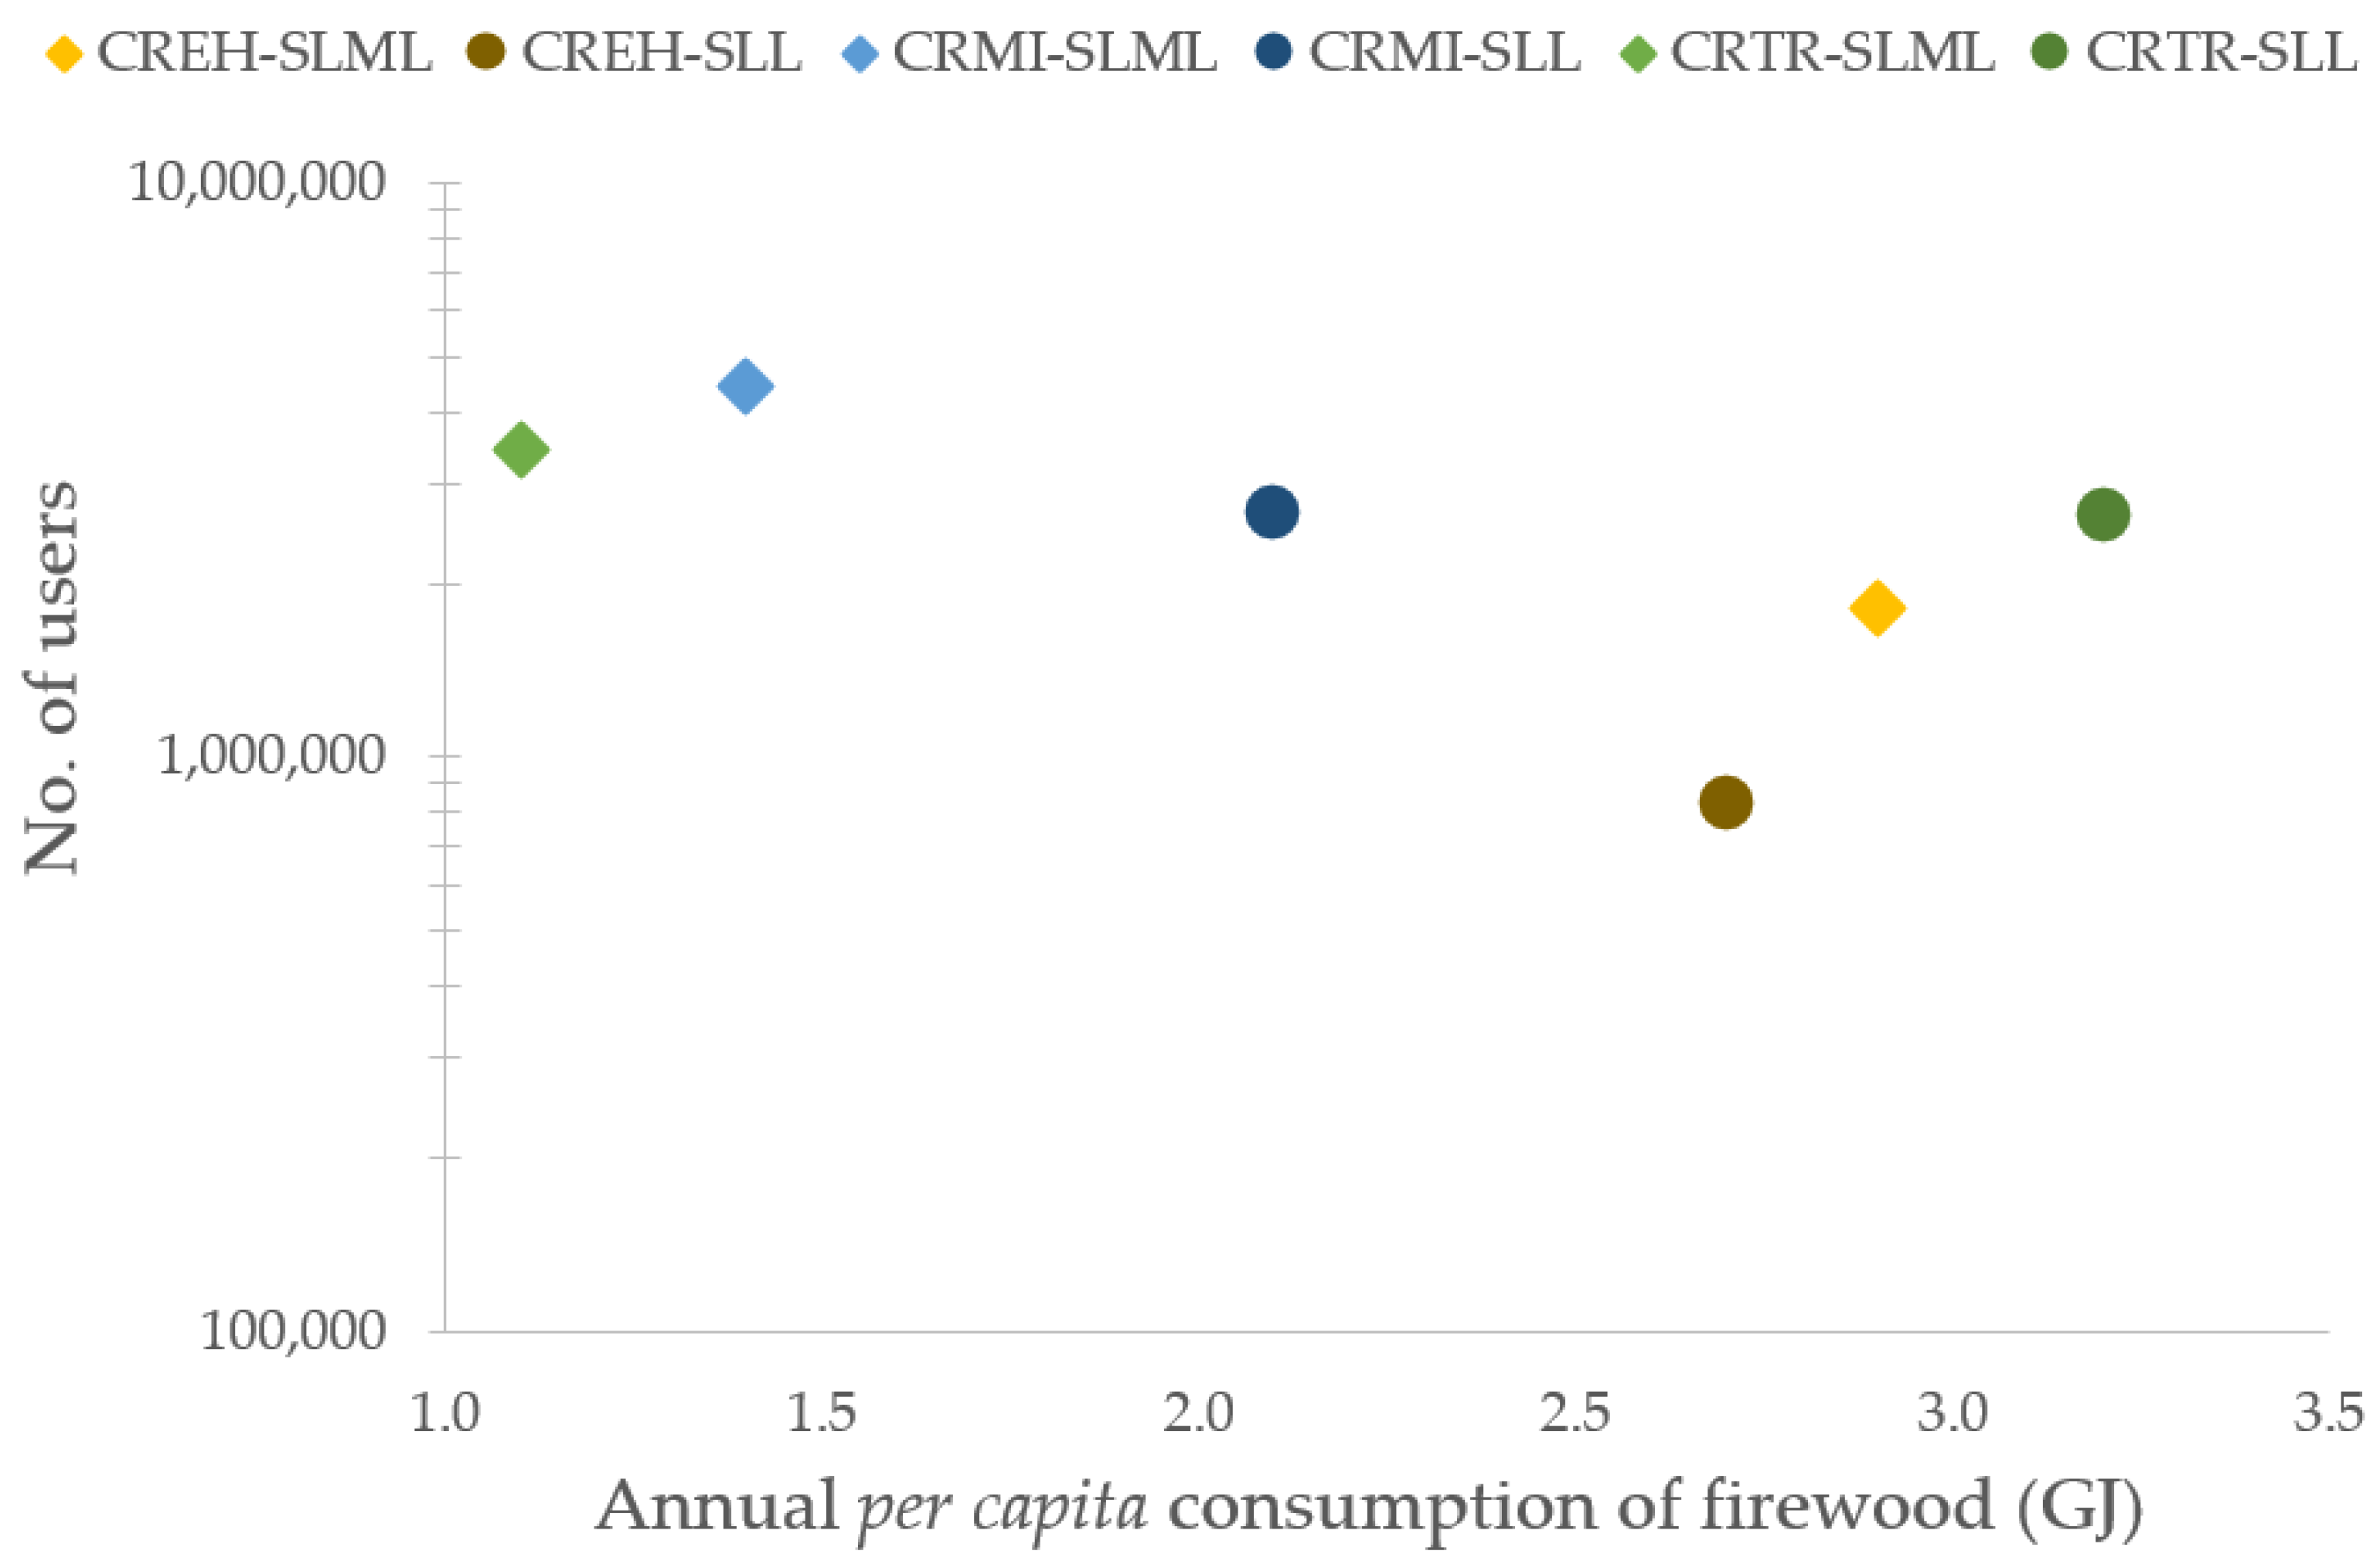
As previously mentioned, EFU account for 9,456,387 persons and 2,180,203 households. A total of 98.6% of these users consume firewood in TFS, and, in terms of climate region, are located mainly in mild climate region (CR-MI) and tropical climate region (CR-TR). Only 1.4% of EFU use an improved biomass cookstove or firewood heater, and this group lives primarily in extreme heat climate region (CR-EH).
Figure 5 depicts annual per capita firewood use by EFU among those classified socioeconomically as SL-L, regardless of the CR they live in. This group consumes between 22% and 43% more firewood than SL-ML users. Within the SL-L group, those living in CR-TR have a per capita annual consumption greater than 8.0 ± 6.7 GJ, followed by CR-EH, which has a per capita annual consumption of 7.2 ± 5.3 GJ and CR-MI (6.9 ± 5.9 GJ).
The firewood use indicated by CR in the SL-ML socioeconomic group shows a pattern diametrically opposite that of EFU in SL-L. Specifically, the SL-ML group shows a higher per capita annual consumption in CR-MI (5.4 ± 5.2 GJ), followed by CR-EH (4.9 ± 4.0 GJ) and then CR-TR (4.6 ± 4.0 GJ).
In their study, Ghilardi et al. [
64] reported the following annual levels of firewood consumption for cooking for Mexico as a whole, by climate region: CR-EH—7.9 ± 2.1 GJ; CR-MI—15.8 ± 3.7 GJ; and CR-TR—10.6 ± 2.7 GJ. These levels of firewood consumption are substantially greater than those found in the present study. In the case of CR-EH, the results in the study of Reference [
64] were 38% greater in SL-ML; 55% greater in SL-L; in the case of CR-MI, 72% greater in SL-ML; 56% greater in SL-L; and in the case of CR-TR, 56% greater in SL-ML and 24% greater in SL-L. Thus, the present article provides a more accurate picture of firewood consumption in Mexican housing units.
As regards the number of users, the majority of EFU (88%) are in SL-L, with the majority of this SL-L group of EFU located in CR-TR (accounting for 5,952,432 users and 1,323,253 households), followed by CR-MI (accounting for 2,141,248 users and 478,403 households), and CR-EH (235,547 users and 73,110 households).
The SL-ML group accounts for only 12% of EFU but displays the same climatic patterns as the SL-L group, with a higher representation (537,827 users representing 140,413 households) in CR-TR, followed by CR-MI (493,534 users and 115,259 households), and CR-EH (125,411 users and 40,108 households). Thus, among EFU, the majority of users and households are located in CR-TR, followed by CR-MI. This pattern was found in both SL-L and SL-ML.
In terms of annual consumption of firewood by household,
Table 1 shows 52% and 44% higher use in SL-L than SL-ML for CR-TR and CR-MI respectively. Conversely, for CR-EH, firewood consumption levels were similar in both SL. Thus, total annual consumption of firewood for households is estimated at 64.9 PJ, with households within the category of SL-L in all CR, indicating annual levels of consumption that are substantially higher than those for SL-ML. In sum, annual total consumption of firewood in SL-L households is 12 times higher than consumption in SL-ML households. This is a result of a combination of the high levels of firewood consumption per household, and the fact that the number of households within the SL-L group is seven times higher than in the SL-ML group, with the majority of households in the CR-TR region (61% of the total).
Table 1 also shows that in most EFU households, firewood is not paid for and therefore is likely gathered by users themselves for later consumption. In SL-L, the percentage of non-paying households is 82%, 67% and 76% for CR-EH, CR-MI, and CR-TR, respectively. Except for CR-MI, these percentages are greater than those for SL-ML households that do not pay for their firewood (the corresponding SL-ML values being 70%, 77% and 37% for CR-EH, CR-MI and CR-TR, respectively). However, in CR-TR, the percentage for SL-ML is substantially lower. Based upon these data, it is estimated that 1,554,930 non-paying households consume 43.4 PJ annually, representing 73% of total firewood consumed. Most of these households are in SL-L of CR-TR, which consumes 68.4% of all firewood obtained by non-paying users. Non-payment for firewood within CR-TR may be related to the abundance of bioenergy resource within that particular climate region.
Between 18% and 33% of households pay for firewood, with the exception of CR-TR of SL-ML, which has 63% of paying users. This latter percentage is close to the 73% of paying users reported for the state of Chiapas, which falls in CR-TR by Reference [
73]. This might mean that in Mexico’s tropical region, markets have developed for household firewood that have not yet been identified and studied.
It is estimated that UFE who pay for their firewood represent 615,616 households and an annual firewood consumption of 16.2 PJ for all households, which in turn represents 27% of total annual firewood consumption.
Table 2 depicts the expenditures for firewood in these households.
Annual expenditure for firewood per household is, in general, greater in SL-L than in SL-ML. The highest level of expenditure is reported for CR-EH of SL-L, at a level that is 25% higher than reported for SL-ML. For CR-MI, the corresponding increase is 50% in SL-L, while in CR-TR, the value is similar in both SL, and represents the lowest value. The results that we obtained also revealed that SL-L households spend more money per year to acquire firewood than SL-ML households. This difference is due to the fact that annual firewood reported in the present study for all SL falls within the range of values reported by Reference [
73] for the state of Chiapas, where expenditures between 97.2 and 391.2 USD per household were reported.
Based on the data obtained in this study, it is estimated that annual expenditure for firewood across all SL and CR is 110.85 million USD (MUSD). The fact that SL-L represents 81% of the total is due to the fact that this socioeconomic group: (1) has the greatest number of users and households and (2) consumes the largest quantities of firewood across Mexico’s three CR.
The distribution of dataset for EFU displayed positive asymmetries in which the greatest degree of dispersion was observed among the highest values. For this reason, the standard deviations for the means of per capita and per-household firewood, as well the annual per-household expenditure for firewood, display high values that indicate a high degree of variability among the groups analyzed. This distribution can be seen in the results for MPU and MSU; see
Section 4.1.2 and
Section 4.1.3. Nonetheless, the mean is still a representative of the average of firewood consumption and of the annual expenditure for firewood by these users.
Results of the analysis of information yielded by the ENIGH show that for households in SL-L and SL-ML that use firewood for cooking, the majority of users fall into Mexico’s two lowest deciles, i.e., deciles 1 and 2. These deciles correspond to annual salaries ranging from 2251.49 ± 852.03 to 2613.61 ± 826.47 USD, depending on CR and SL. This range in turn translates into the equivalent of 1.3 to 1.5 minimum salaries for the year 2018.
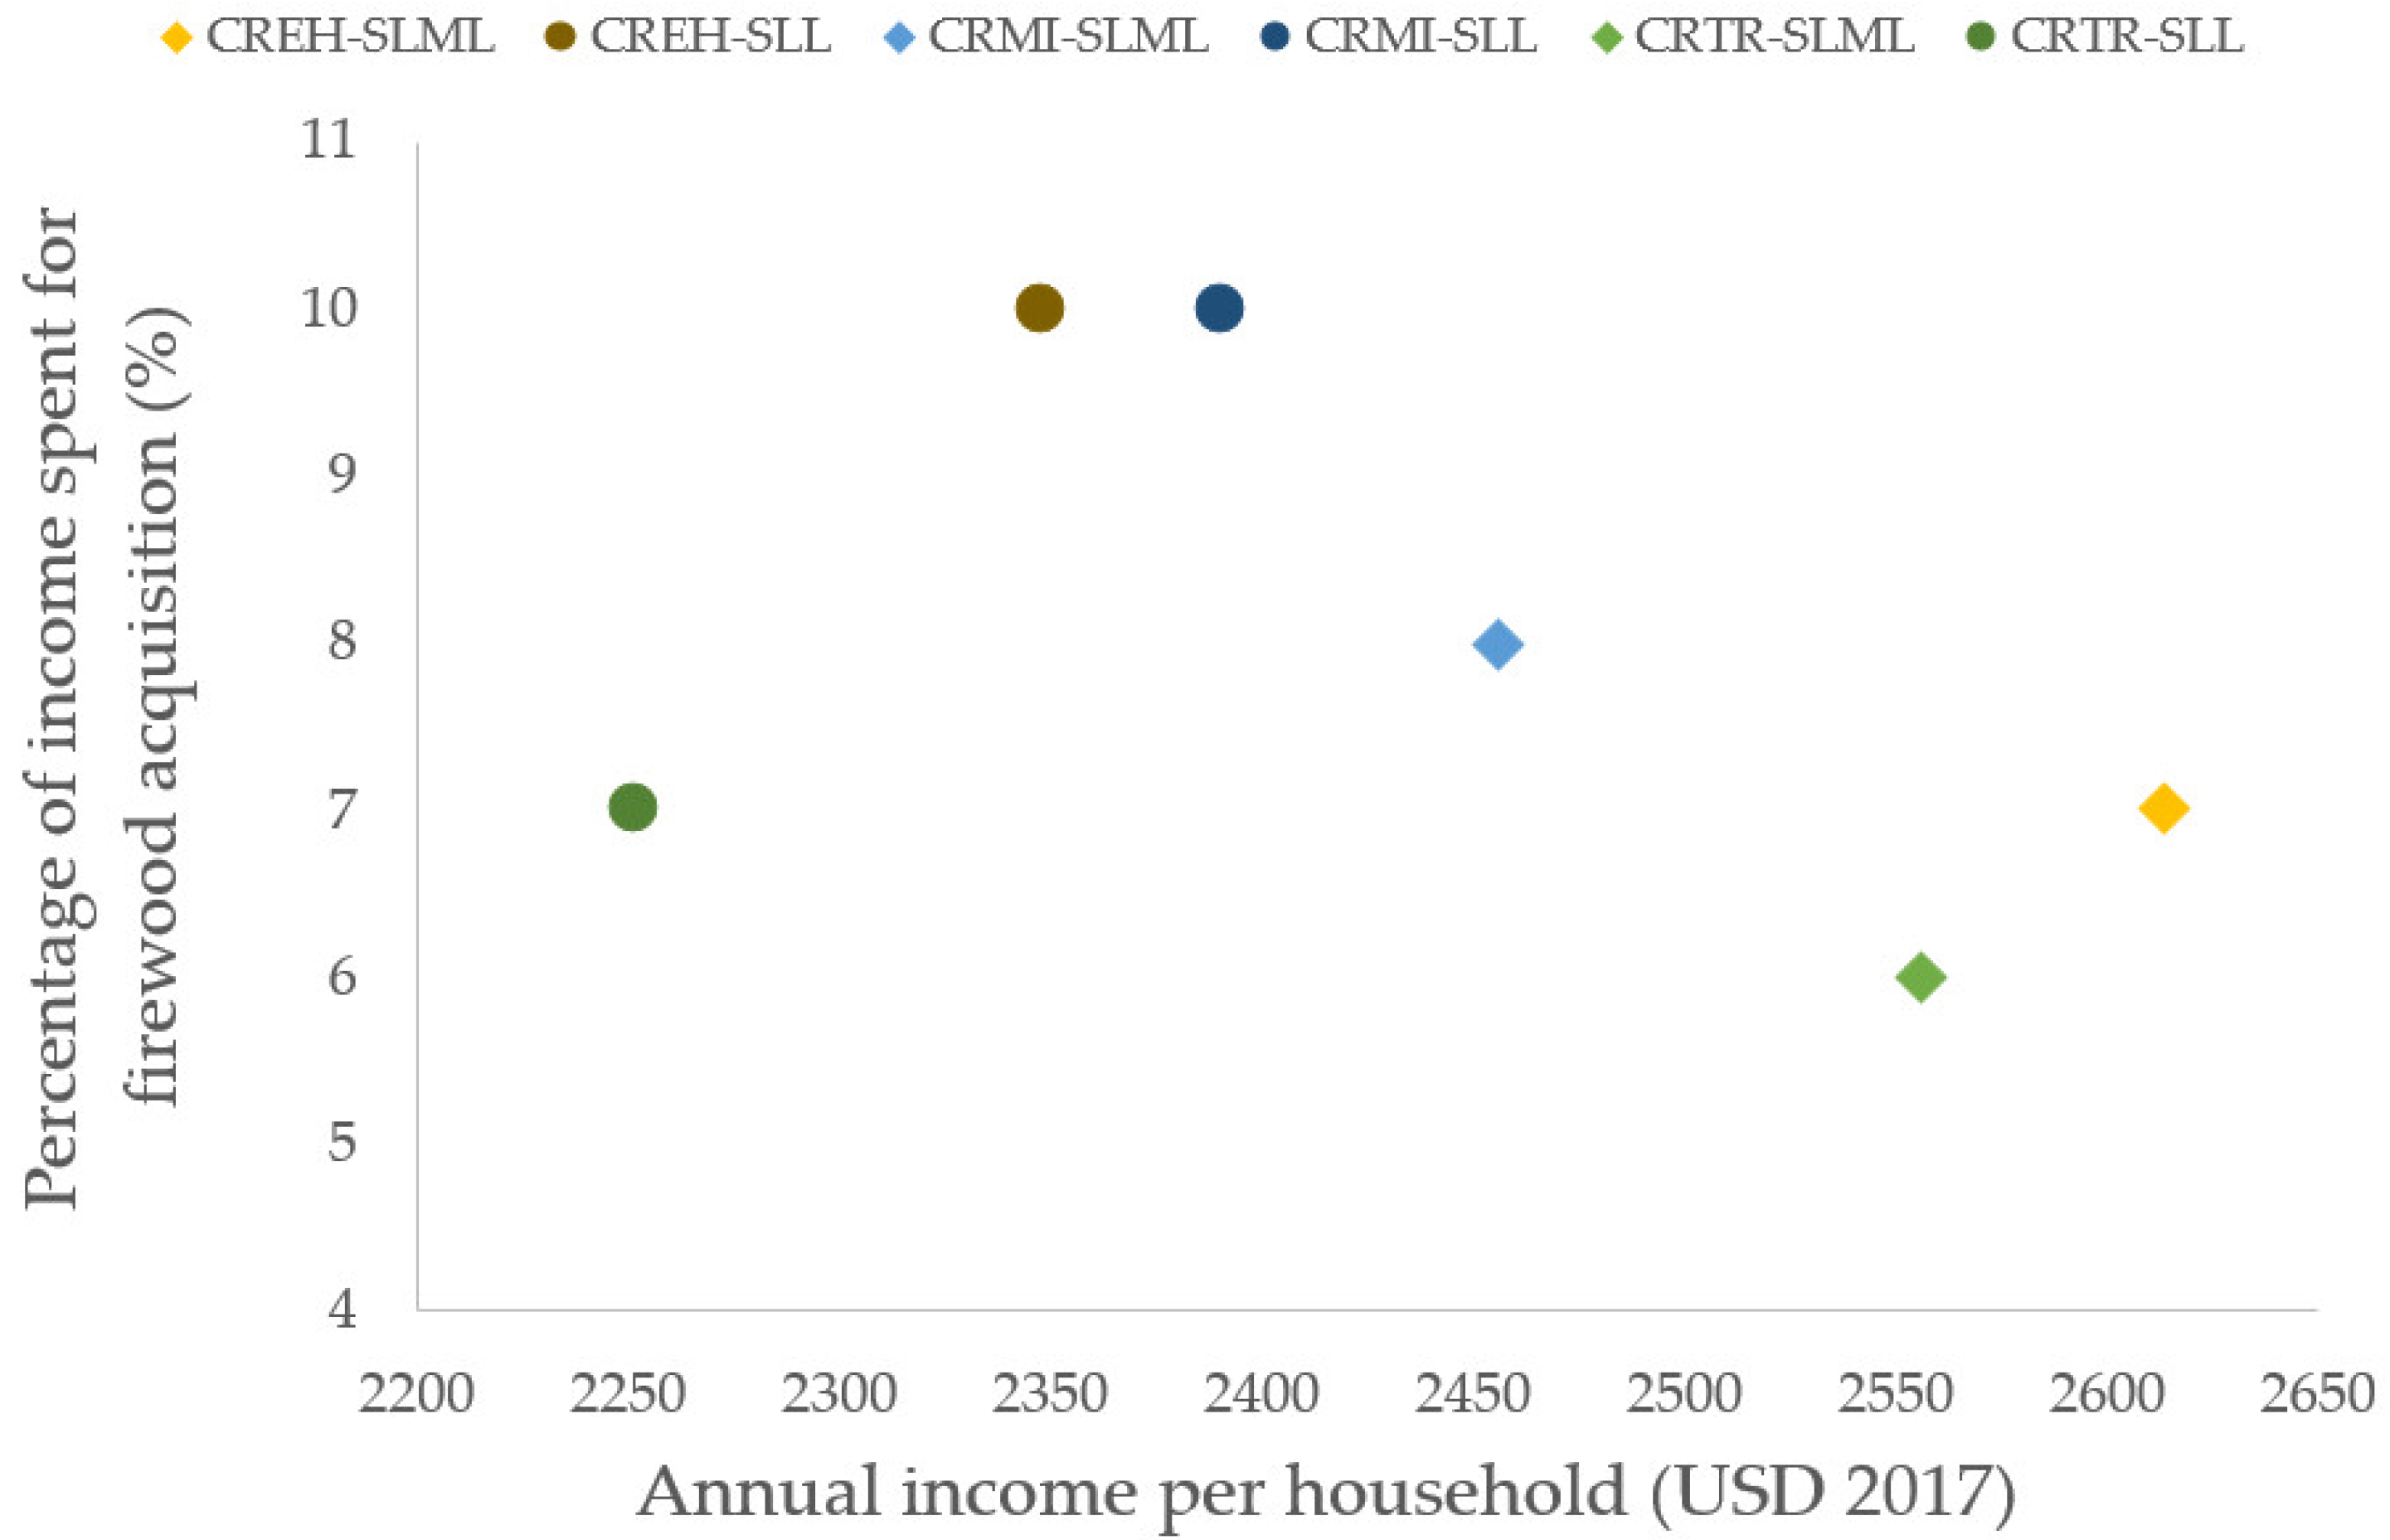
Figure 6 depicts the annual average income of those households reporting use of firewood, annual expenditures of EFU households that pay for firewood, and the percentage of annual income that said expenditures represent. It is evident that, in general terms, these households spend a significant proportion of their income to satisfy their energy needs for cooking and heating food: between 6% and 10%.
Figure 6 also shows that households in CR-MI and CR-EH within SL-L allocate a higher proportion of their income (10%) for the acquisition of firewood than SL-ML households in CR-MI and CR-EH (8% and 7%, respectively). Conversely, households in CR-TR allocate 7% of household income for firewood in SL-L and 6% in SL-ML. The reason for this is that annual expenditure on firewood is greater and annual income is lower in the households of SL-L.
4.1.2. Mixed Users of Firewood Who Utilize Firewood as Their Primary Fuel Source (MPU)
MPU use firewood in combination with LPG, with firewood constituting their primary fuel source.
Figure 7 shows that consumption by MPU is at levels similar to those for EFU in both SL-L and SL-ML for CR-TR and CR-MI. The MPU with the highest levels of consumption are located in CR-TR and CR-MI of SL-L. In CR-TR, per capita annual consumption of firewood is 7.2 ± 6.8 GJ, while in CR-MI, it is slightly less (7.0 ± 6.6 GJ), with CR-EH reporting the lowest levels of consumption (5.4 ± 5.1 GJ).
As regards per capita annual consumption of firewood, users in SL-ML show similar usage levels across CR, and generally lower levels than among users in SL-L. In CR-MI and CR-TR of socioeconomic level ML, consumption is between 20% and 40% less than among users in SL-L, while consumption among users in CR-EH is slightly greater than in SL-ML. Thus, consumption in SL-ML for users in CR-EH is 5.8 ± 4.1 GJ, followed by CR-MI, with a per capita annual consumption of 5.3 ± 5.1 GJ, and for CR-TR, with a value of 4.4 ± 4.2 GJ.
The results show an average per capita annual consumption of firewood among MPU similar to the levels reported in this article for EFU. In contrast to the data reported by Reference [
64] for MU, which implied consumption that was 50% less than that of EFU, our results show a degree of consumption among MPU nowhere near 50% less than that of EFU, and that varies according to SL and CR. Thus, for MPU in SL-L, the reduction in firewood consumption as compared to EFU is 10% and 25% in CR-TR and CR-EH, respectively, while for the CR-MI, there is an increase of 1%. Among users in SL-ML, there is a reduction in firewood consumption as compared to EFU of 4% and 2% in CR-TR and CR-MI, respectively, while in CR-EH, there is an increase in usage of 18%.
As regards number of users, the majority of MPU are in SL-L (68%), and the distribution pattern by CR and SL of these users is similar to that of EFU. It is in SL-L and CR-TR that we find the largest number of MPU (2,601,155 users representing 603,398 households), followed by CR-MI (941,576 users and 221,294 households) and finally CR-EH (188,500 users and 50,295 households).
Users in SL-ML display the same distribution pattern per CR as those in SL-L, with CR-TR having the largest concentration of SL-ML users (891,157 users representing 222,812 households), followed by CR-MI (720,532 users in 168,810 households) and CR-EH (152,753 users and 36,167 households). As is the case for EFU, the majority of users and households are in CR-TR, followed by CR-MI, which for both SL-L and SL-ML, is home to the largest levels of consumption of firewood per household; see
Table 3. Within CR-TR, firewood consumption per household is 36% higher in socioeconomic level SL-L than in SL-ML. Within CR-MI, firewood consumption is 29% greater in SL-L than is SL-ML. However, in climate region CR-EH, similarly high levels of firewood consumption per household were found in both SL-L and SL-ML.
Based on these figures, for Mexico as a whole, total annual consumption of firewood in MPU households is estimated at 29 PJ.
Table 3 shows that households in SL-L across all three CR have annual consumption levels greater than those of SL-ML. To summarize, annual total consumption of firewood in households in SL-L is up to three times greater than in SL-ML. This is due not only to annual firewood consumption per household being generally greater in SL-L, but also to the fact that the total number of households where firewood is consumed in SL-L across all CR is more than double that of SL-ML. As is the case among EFU, the majority of these households are in CR-TR, especially in the case of SL-L, responsible for 41% of the total.
Among MPU as well, there is a large percentage of households that does not pay for the firewood that they consume, similar to what is found among EFU, and within the SL-L, this proportion is somewhat greater than in SL-ML (78%, 68%, and 66% for CR-EH, CR-MI, and CR-TR respectively). Within SL-ML, the proportion of non-payers is 61% in CR-EH and 62% in CR-MI and CR-TR. Thus, the percentage of households that pay for firewood falls within the interval of 22% to 39%.
It can be seen in
Table 3 that 813,590 households that do not pay for firewood consume 19.1 PJ annually and represent 66% of the total firewood consumed by these MPU. This represents more than twice the number of households that report expenses for obtaining firewood. The non-paying households are concentrated in SL-L, which represents more than double the number of households in the SL-ML group that do not pay for firewood. From this, it can be inferred that there are 438,891 households that represent 35% of all households of MPU that pay for firewood, which represents an annual firewood consumption of 9.9 PJ.
As regards the annual expenses of households to acquire firewood,
Table 4 shows that these are represented to a slightly greater degree in SL-ML, expect for in CR-MI where this expense is relatively greater in SL-L than in SL-ML. For both of these SL, annual expenses for firewood are higher in CR-EH, where exceptionally, expenses are 20% greater in SL-ML than in SL-L, and 42% and 58% greater than in CR-TR and CR-MI, respectively. Total annual expenses of MPU households to acquire firewood, across all SL and all CR, are estimated at 65.79 MUSD. This is 41% less than expenses of EFU who pay for their firewood. In
Table 4, it can be seen that SL-L contributes 61% of this total. Especially in CR-TR, which is home to the greatest number of users and households, expenses are similar to those for EFU.
As regards the percentage of annual income that MPU households allocate to acquiring firewood,
Figure 8 shows that some of these households, as is the case with EFU, expend significant proportions of their household income to satisfy their energy needs with firewood for cooking and heating food between 5% and 11%.
In terms of CR, the proportion of income that MPU allocate for firewood is slightly lower in CR-MI and CR-TR than the corresponding figures for EFU. In terms of SL, proportion of income allocated by MPU for firewood is greater in SL-L than in SL-ML, as is the case for EFU. Within SL-L, in dwellings in CR-MI, the proportion allocated for firewood is 7% of household income, while in CR-TR, it is 6%. Within SL-ML, the corresponding percentages for CR-MI and CR-TR are 6% and 5%, respectively.
In CR-EH, the proportion of income spent on firewood is, within SL-L, the same for MPU as for EFU (10%). However, in SL-ML, there is a marked difference between percentage of income spent on firewood between EFU and MPU (7% and 11%, respectively).
4.1.3. Mixed Users of Firewood Who Utilize Firewood as a Secondary Fuel Source (MSU)
MSU use firewood as a secondary fuel source in combination with LPG.
Figure 9 shows that these users have an annual per capita consumption of firewood between 40% and 75% less than that of either EFU or MPU. In MSU households within SL-L, annual per capita consumption of firewood ranges from 3.2 ± 2.3 GJ in CR-TR to 2.1 ± 1.9 GJ in CR-MI. Within SL-ML, the annual per capita consumption is generally lower than that in SL-L in the climate regions CR-MI and CR-TR (65% and 33% less respectively). However, in CR-EH, the SL-ML group has an annual per capita consumption of 2.9 ± 2.2 GJ, which is similar to that of SL-L (2.7 ± 2.1).
Annual consumption of firewood among MSU seems to be in line with the reduced levels of usage reported by Reference [
64], who estimated that MSU usage was 50% less than usage among EFU. Our own results suggest an even greater difference: between 41% and 76% less usage by MSU as compared to EFU.
As regards the number of MSU, in contrast to EFU and MPU, the majority of MSU are in SL-ML (61% of the total). MSU are most heavily represented in CR-MI (4,406,185 users representing 1,010,794 households) followed by CR-TR (3,401,799 users in 823,179 households) and finally CR-EH (1,823,036 users in 441,775 households).
Conversely, 39% of MSU are in the socioeconomic category of SL-L. Climate regions CR-MI and CR-TR have similar numbers of MSU (2,659,752 and 2,642,188) and households (603,402 and 683,102), respectively. In CR-EH, however, these numbers fall dramatically for both number of users (830,188) and households (207,558). Thus, the highest numbers of MSU are in the climate region CR-MI and socioeconomic level SL-ML. This is in contrast to EFU and MPU, who have greater representation in CR-TR and SL-L.
As is the case for both EFU and MPU, annual consumption of firewood for MSU is generally higher in both SL-L and SL-ML; see
Table 5. MSU consumption is 54% greater in CR-TR and 35% greater in RC-MI for SL-L as compared to SL-ML. For CR-EH, conversely, MSU consumption levels are similar between the two socioeconomic levels. Thus, annual total consumption of firewood in MSU households is estimated at 28 PJ, a level similar to that found for MPU, representing a total of 2,543,167 households. For MSU, annual total consumption in households is similar between SL-L and SL-ML, in contrast to EFU and MPU, where annual total consumption for SL-L is greater than for SL-ML in both cases.
As is the case for EFU and MPU, with the exception of households in SL-ML in CR-TR of EFU, the majority of MSU households (62–85%) do not pay for the firewood that they consume. In terms of socioeconomic level, SL-L has higher percentages of households that do not pay for firewood: 83%, 72%, and 65% for CR-EH, CR-MI and CR-TR, respectively. In the case of SL-ML, the percentages, while lower, are still high: 69%, 67% and 62% for CR-EH, CR-MI, and CR-TR, respectively. Therefore, the percentage of households reporting expenses for acquiring firewood is significant, falling within the interval of 17-35% for SL-L and 31–38% for SL-ML. Thus, of the total MPU consumption of firewood, 18.9 PJ represents households that do not pay for the firewood they consume (68%) and 9 PJ represents households that do pay for firewood, with the majority of these households being in CR-MI and SL-ML.
As is the case for both EFU and MPU, with regard to annual firewood expense for the socioeconomic levels included in this study (see
Table 6) by CR, expense levels are greater in CR-EH and less in CR-TR, but generally less among MSU.
As regards total annual expenses of MSU households on firewood, the estimate across all SL and CR is 110.33 MUSD. This total is similar to that for EFU, and 60% greater than that for MPU, thus corresponding to the relative numbers of each kind of user in general (52% MSU, 30% EFU, and 18% MPU), as well as to the annual consumption of firewood per household in the SL and CR for each type of paying user; see
Table 2,
Table 4 and
Table 6.
The MSU in CR-MI and CR-TR collectively represent 82% of the total expenses of MSU as a whole. Households in the socioeconomic category SL-ML account for 60% of the total expenses, while CR-MI is the climate region where there is the highest level of annual expenses for firewood (28% of the total). This is because the majority of households using firewood in CR-MI fall into the MSU group of users. A different pattern was observed among EFU and MPU, where highest expenditure was observed by SL-L in climate region CR-TR, where the largest number of households was concentrated. Among EFU falling within the SL-L socioeconomic level, 63% of households were in CR-TR, while among MPU, 47% of households in CR-TR were in SL-L.
Figure 10 shows that, for MSU households in general, the proportion of income spent on firewood is similar and significant (from 3% to 5%) across the different socioeconomic levels and climate regions, but less than the percentages for EFU and MPU (6–10% and 5–11% respectively). In all cases, there is a reduction in the percentage of income allocated to firewood acquisition. Among MSU, percentage of income spent on firewood is 28–63% less than among MPU and 43–50% less than among EFU.
4.1.4. General Results
On the basis of the data obtained in this study, for Mexico as a whole in the year 2018, the total number of households using firewood in SL-L and SL-ML was 7,243,132, representing a total of 30,690,820 persons. This number represents 98% of total firewood users and is distributed across all three of Mexico’s climate regions. This study categorized and explored three different kinds of use: (i) EFU, which accounted for 30% of dwellings; (ii) MPU, comprising 18%; and (iii) MSU, representing 52%. The majority of EFU and MPU are in SL-L of CR-TR, and the majority of MSU are in SL-ML of CR-MI. Of all Mexican households using firewood, 59% are in SL-L, and 75% are in population centers comprising 2500 or fewer inhabitants.
Total consumption of firewood for cooking and heating food is estimated at 116.6 PJ. Leaving out of consideration the use of firewood for space heating, this figure represents 52% of the firewood consumption reported in the National Energy Balance for the year 2018 for the residential sector: 249.08 PJ [
92]. Of all user types, EFU consume the most firewood (59.6 PJ, accounting for 51.1%), followed by MPU (29 PJ; 24.9%). For both EFU and MPU, the highest levels of firewood use are found among SL-L in the CR-TR. MSU account for a significant proportion of firewood consumption (28 PJ; 24%), a level nearly that of MPU, and represent 51% of all firewood users. MSU users are for the most part found among socioeconomic level SL-ML in climate region CR-MI.
It is estimated that the 2,292,215 households (31.6% of all firewood users) that pay for firewood account for a consumption of 35.2 PJ, representing a total estimated expenditure of 286.96 MUSD. On the basis of our results, it is estimated that the average cost per GJ of firewood is 12.6 USD in CR-EH; 9.23 USD in CR-MI; and 5.6 USD in CR-TR. It can thus be observed that 68.4% of firewood users—representing a consumption of 81.4 PJ—acquire firewood mainly by gathering it.
4.2. GHG Emissions Resulting from Firewood Use
Combustion of firewood contributes to climate change through CO
2 emissions that are not neutral when firewood consumption does not occur in a sustainable manner and through emissions of CH
4, N
2O and aerosol particles into the atmosphere [
15,
32,
33].
As regards estimates of GHG resulting from the use of firewood, it is important to consider the non-renewable nature of firewood, specifically the proportion of firewood obtained in a non-renewable manner, in other words, the amount of firewood obtained from biomass sources that exceeds the growth potential of those sources [
93]. For Mexico, the non-renewability factors reported in the literature range from 4% to 39%.
The average non-renewably consumed biomass that has most recently been reported for Mexico is 34% [
85]. This is the figure used in the present study for the purposes of estimating GHG emissions resulting from the consumption of firewood. Specifically, the following emission factors reported by Johnson et al. [
83] are used: CO
2—105.8 tCO
2e TJ
−1 and CH
4—34 tCO
2e TJ
−1. These total GHG emissions are shown in
Table 7.
Total GHG emissions for all firewood users was 8.17 million tons of carbon dioxide equivalent (MtCO2e). Contributions by type of user were in the same proportions as for firewood consumption. EFU had the highest levels of emissions, contributing 4.18 MtCO2e. This resulted from the fact that EFU consumed the most firewood. MPU and MSU had similar emission levels (2.03 MtCO2e and 1.96 MtCO2e, respectively). This is due to the fact that firewood consumption in these two groups was approximately 50% less than that among EFU.
Of the total GHG emissions among EFU and MPU, the majority were generated from the socioeconomic level SL-L (93% and 75%, respectively), especially in climate region CR-TR, which was responsible for 69% of EFU emissions and 53% of MPU emissions.
Among MSU, levels of GHG emissions were similar to those for SL-L and SL-ML (53% and 47% respectively). In SL-L, the highest contribution to emissions came from the climate region CR-TR (29%), while in SL-ML, the highest contribution was from CR-MI (accounting for 19% of total emissions in each SL for this classification of user).
As the authors in Reference [
94] have pointed out, in instances where firewood is consumed in a non-sustainable manner, in addition to the consequences of GHG, there may also be adverse impacts resulting from land cover changes, deforestation, and soil degradation. It is therefore of utmost importance to identify the specific non-renewability factor for each climate region in order to be able to determine the extent of non-renewable firewood extraction.
4.3. Implications of Firewood Use for Gender and Health
Combustion of firewood in TSF consumed by a total of 7,243,132 households in socioeconomic levels SL-L and SL-ML resulted in emissions of not only GHG, but also of those pollutants identified by References [
14,
15,
16], including CO, NMHCS, N
2O, NOx, PM, EC, OC and OM. Thus, all firewood users were exposed to these contaminants, and therefore were—and are—at high risk of contracting respiratory illness and of having other health problems, in accordance with WHO warnings [
21,
29].
Firewood use for cooking and eating foods is an activity conducted for the most part by women—a fact that can be inferred from the finding that women usually handle cooking duties in households [
30,
73]. However, no quantified information is available on the health effects resulting from this differential level of exposure, nor of the distribution of said effects in Mexico’s population.
Schilmann et al. [
95] reported that women in the northwest region of the Mexican state of Michoacán spend an average of 3.4 h per day cooking, utilizing TSF. Their resulting exposure to PM
2.5 particles thus falls in the range of 89–105 µg m
−3 per 24 h. In another study, Estévez-García et al. [
58] reported that women in the Mexican state of San Luis Potosí spent an average of 4-5 h per day cooking, resulting in exposure to PM
2.5 particles of 146.3 µg m
−3 per 24 h when utilizing TSF, and 140.2 µ gm
−3 per 24 h when using TSF in combination with an LPG stove. In both above studies, levels of exposure to PM
2.5 particles were greater than the acceptable air quality standards established by the WHO (10–35 µg m
−3, and greater than those established by Mexico in regulation NOM-025-SSA1-2014 (45 µg m
−3 per 24 h).
The present article estimated that 50% of all firewood users throughout the nation of Mexico are women. This translates into a total of 15,701,101 women (4,727,615 EFU; 2,792,732 MPU, and 8,180,754 MSU). These women were exposed to air pollutants in their own homes. In addition, the ENIGH data for socioeconomic level and climate region indicated that women are heads of household in between 21% and 29% of households. This is a circumstance that increases the economic vulnerability of families when adverse health effects are suffered by these women. Unfortunately, the gender-specific effects of firewood use in Mexico have not yet been adequately explored by researchers.
4.4. Implications of Energy Poverty on Firewood Users
Che et al. [
35] have defined energy poverty as a lack of access in households to energy levels that are sufficient and affordable enough to live and thrive by. An approach to the measurement of energy poverty proposed in a volume edited by García Ochoa and Graizbord [
86] contends that those households that lack modern energy resources sufficient to satisfy their energy needs suffer energy poverty. In the case of cooking, this would be LPG. The International Energy Agency has, for its part, determined that households that are highly dependent on traditional fuel materials such as firewood are energy dependent [
96]. Conversely, Boardman [
97] classifies those households unable to meet their energy needs with 10% their household income as suffering energy poverty.
In accordance with the three aforementioned methods of measuring energy poverty, and the results reported in the present study, it can be deduced that 7,243,132 Mexican households that utilize firewood are energy impoverished, given their high levels of firewood consumption. This applies to both EFU and to MU that use LPG. It is evident that neither of these two categories cover all their energy needs with modern means of energy provision: both use firewood to cover such needs to a greater or lesser extent.
According to Boardman’s definition [
97], EFU experience energy poverty because they report firewood expenses that represent between 6% and 10% of their annual income and thus approach the 10% threshold suggested by this author. This calculation does not take into account their electricity consumption. The percentage of household income spent on firewood consumption for cooking and heating food among MPU is 5–11%—a figure that does not consider use of either LPG or electricity. Such expenditures place MPU within the category of energy poverty. Finally, the percentage of annual salary spent on firewood acquisition by MSU to supplement their needs for cooking and heating food is, while less than that of the other two groups, still significant, falling within the range of 3–5%. This is especially true since these figures do not consider expenditures on either LPG, the primary fuel utilized by this group, or electricity. It can thus be concluded that MSU are either also experiencing energy poverty or are near the energy poverty threshold.
According to the seventh SDG to be attained by 2030, “Access to Affordable, Reliable, Sustainable and Modern Energy for All” [
36], greater efforts need to be made to find clean, efficient, and affordable alternatives in order to accelerate the transition to an energy system that is affordable, trustworthy, and sustainable. This goal is to be accomplished by prioritizing high-yield energy practices and by adopting non-polluting energy technologies and infrastructure. For these reasons, it is imperative to address the problems arising in households as a result of energy poverty that have been identified in the present study. This will make it possible to achieve the goals of not only SDG 7 but also SDG 3 (“Health and well-being”) and SDG 5 (“Gender equality”).


